The Abundance of Fungi, Bacteria and Denitrification Genes during Insect Outbreaks in Scots Pine Forests
by
 , and
, and
Maren Marine Grüning
1,*, 
Lukas Beule
2,
Stephanie Meyer
3,
Petr Karlovsky
2 and
Anne I.-M.-Arnold
1 1
Institute of Soil Science of Temperate and Boreal Ecosystems, Department of Forest Sciences and Forest Ecology, University of Goettingen, 37077 Goettingen, Germany
2
Molecular Phytopathology and Mycotoxin Research, Faculty of Agricultural Sciences, University of Goettingen, 37077 Goettingen, Germany
3
Section of Animal Nutrition and Animal Health, Organic Agricultural Science, University Kassel, 37213 Witzenhausen, Germany
*
Author to whom correspondence should be addressed.
Forests 2018, 9(8), 497; https://doi.org/10.3390/f9080497
Submission received: 20 June 2018
/
Revised: 30 July 2018
/
Accepted: 9 August 2018
/
Published: 14 August 2018
(This article belongs to the Section Forest Ecology and Management)
Abstract
:Outbreaks of defoliating insects may affect microbial populations in forests and thereby mass balances and ecosystem functioning. Here, we investigated the microbial dynamics in Scots pine (Pinus sylvestris L.) forests during outbreaks of the nun moth (Lymantria monacha L.) and the pine-tree lappet (Dendrolimus pini L.). We used real-time PCR (polymerase chain reaction) to quantify genes that characterize bacterial and fungal abundance and the denitrification processes (nirK, nirS, nosZ clades I and II) in different forest compartments and we analyzed the C and N content of pine needles, insect feces, larvae, vegetation layers, organic layers, and mineral soil horizons. The infestation of the nun moth increased the bacterial abundance on pine needles, in the vegetation layer, and in the upper organic layer, while fungal populations were increased in the vegetation layer and upper organic layer during both outbreaks. In soil, the abundance of nirK increased after insect defoliation, while the C/N ratios decreased. nosZ clades I and II showed variable responses in different soil layers and to different defoliating insects. Our results illustrate changes in the microbial populations in pine forests that were infested by defoliating insects and changes in the chemical soil properties that foster these populations, indicating a genetic potential for increased soil N2O emissions during the defoliation peak of insect outbreak events.
Keywords:
insect outbreak; Scots pine forest; soil; phyllosphere; bacterial 16S; fungal 18S; nirK; nirS; nosZ; real-time PCR1. Introduction
Organic input into the soil increases with outbreaks of tree-canopy defoliating insects, through insect feces, cadavers, litter and other plant material [1,2,3]. This results in high amounts of labile C and extractable N [4,5,6], which can increase mineralization rates [7,8]. Because soil microorganisms can respond quickly to natural disturbances [9], increased soil microbial respiration rates are commonly observed following the input of organic material during forest pest outbreaks [4,10]. Despite this phenomenon, little is known about the changes in the abundance of decomposer microbes during such biotic disturbances.
Fungal and bacterial populations in forest soils may respond differentially to organic inputs depending on the substrate composition (amount of labile C and N) and soil properties (prior C and N statuses) [11,12,13]. While bacterial growth decreases following N fertilization or N deposition owing to C limitation (e.g., References [14,15]), the input of labile C compounds increases bacterial and fungal populations [6,16]. For example, oak (Quercus robur L.) defoliation by the gypsy moth (Lymantria dispar L.) led to increased populations of fungi and N2-fixing bacteria in soil [17]. Increased populations of culturable fungi and Actinobacteria were found in pine forests (Pinus sylvestris L.) defoliated by the pine beauty moth (Panolis flammea D. et S.) and the pine-tree lappet (Dendrolimus pini L.) [6]. In contrast, a bark beetle (Ips typographus L.) induced tree dieback in a spruce (Picea abies L.) forest led to a decrease in the fungal biomass while the bacterial biomass was either unaffected or increased [18,19]. Overall, the effects of the organic input derived by phytophagous insects affecting fungal and bacterial gene abundance are poorly understood. However, bacteria are known to arrange a rapid turnover of easily decomposable compounds derived from litter, while fungi dominate a turnover of more complex organic compounds [20,21]. In acidic soils of pine forests, denitrification is expected to be an important driver for N turnover as nitrification rates in these “non-nitrifying” ecosystems are often negligibly low [6,22] and the nitrate reduction potential and nitrogen loss via denitrification are shown to be increased in these soils [23]. Given that the intensity and dispersal of insect outbreaks might increase as a result of climate change, alterations of nutrient availability and microbial communities caused by outbreaks gain importance in forest protection and C and N modeling [24].
In this study, we quantified the fungal, bacterial, and denitrification genes in different compartments of Scots pine forests (vegetation layer, organic layer, mineral soil, litter feces, dead larvae, and needles) suffering from insect outbreaks. We analyzed the abundance of fungal (18S) and bacterial (16S) rRNA genes, as well as genes related to denitrification in Scots pine forests infested by the nun moth (Lymantria monacha L.) and the pine-tree lappet using real-time PCR (qPCR, quantitative polymerase chain reaction). The functional genes involved in the NO2-reduction were the Cu-nitrite reductase (nirK), the cd1-nitrite reductase (nirS) and the nitrous oxide reductase (nosZ clade I and II).
We expected that abundance of bacteria and fungi during moments of high feces and needle litter input will increase. We further expected that not only the higher total organic input but also the different chemical and physical composition of insect feces compared to needle litter will lead to a shift in the abundance of denitrifying microorganisms. Due to the insect secretions and detritus on the needle surface, we assumed that the phyllosphere bacteria and fungi would be positively affected by phytophagous insects.
2. Materials and Methods
2.1. Study Site
In 2014, a 65-years old Scots pine forest (52°8′38″ N, 13°45′14″ E, 42 m a.s.l. (above sea level)) in the second year of an outbreak of the nun moth (80% defoliated canopy) was investigated. In 2015, we investigated a 92-years old Scots pine forest (52°17′42″ N, 12°19′32″ E, 47 m a.s.l.) within the first year of infestation by the pine-tree lappet (50% defoliated canopy). In each year, an adjacent non-infested site served as a control site (2014: 52°9′29″ N, 13°36′47″ E, 35 m a.s.l.; 2015: 52°17′19″ N, 12°20′46″ E, 50 m a.s.l.). All the investigated forests were located in the federal state of Brandenburg, Germany. The detailed site and soil properties were described earlier [25,26]. The soil types at the study sites in both years were classified as podzols (Food and Agriculture Organization of the United Nations (FAO) classification) derived from glacial and aeolian medium sand deposits. The pH range, as well as the C/N ratio, were measured at every sampling date for each soil layer in both years (Figure 1 and Table A1). In a pre-survey, the ammonia-oxidizing bacteria and archaea amoA gene copy numbers determined by qPCR were below the detection limit at both study sites (Table A2 and Table A3). The annual mean temperature was 10.8 °C and 10.6 °C and the total average annual precipitation was 474 mm and 496 mm (DWD: German Federal Meteorological Service (DWD) and Climate Data Center (CDC), Weather Station Lindenberg (Station ID: 3015), 16.02.2017) at the sites in 2014 and 2015, respectively.
2.2. Sampling
Sampling in both years was conducted before the outbreak in late March (‘spring’), during the main defoliation in late May 2014 and June 2015 (‘main defoliation’) and after the outbreak in September (‘autumn’). Three plots of 300–350 m2 were established on the infested and non-infested site, respectively. Approximately 200 g of material from the moss vegetation including the incorporated fresh litter (vegetation layer = VL), the organic layers (litter organic = Ol, fibric organic = Of and humic organic = Oh) as well as the mineral soil horizon (humic mineral = Ah), were sampled at four randomly chosen sampling points per plot, dried at 40 °C for 24 h and ground.
Approximately 100 g of mixed needle samples were obtained from five individual branches of the south exposed lower tree crown (~11 m) of three individual trees per plot. Litter, larval feces, and larval cadavers at the infested site were collected in three nylon nets with a varying net size of 6–10 m2. The needle litter, feces, and dead larvae were sampled after no longer than 48 h from the nets, subsequently separated, frozen on dry ice for preservation and transportation and freeze-dried for 72 h.
2.3. DNA Extraction
The DNA was extracted as described previously (cf. Reference [26]). Briefly, the DNA from 50 mg of finely ground soil, needle, feces, and litter was extracted following a CTAB protocol with two chloroform/isoamylalcohol steps with an intermediate phenol purification [27] and subsequent polyethylene glycol precipitation [28]. The DNA quality and quantity were checked on 0.8% (w/v) agarose gels stained with ethidium bromide. The inhibitory effects on PCR performance were eliminated by diluting the samples with a ratio of 1:100 in ddH2O. The samples were stored at −20 °C until use.
2.4. Standard Curves
The nirK standard originated from environmental clones, nirS from Pseudomonas fluorescens (strain C7R12), nosZI from Bradyrhizobium japonicum (strain USDA 110), nosZII from Gemmatimonas aurantiaca (strain T-27), and bacterial 16S rRNA from Pseudomonas aeruginosa (strain Pa01). The standards were provided by D. Bru, French National Institute for Agricultural Research, Dijon, France. All target genes were cloned in plasmid pGEM-T (Promega, Mannheim, Germany) and multiplied in Escherichia coli JM109 grown in an LB medium [26] with ampicillin (50 µg/mL). For plasmid linearization, the restriction enzyme SalI was used. Following digestion, the cultures were streaked on agar plates with LB and ampicillin (5 mg/mL) and incubated at 37 °C overnight. Single colonies were transferred to a 3 mL LB medium with ampicillin (5 mg/mL) and incubated at 37 °C overnight under continuous rotation. The plasmid DNA was extracted using the alkaline lysis method [27]. For fungal 18S rRNA genes, the genomic DNA of Verticillium longisporum 43—provided by A. von Tiedemann, University of Goettingen, Germany—dissolved in 25 µL TE was used as a standard. The standard curves for qPCR were obtained with seven serial dilutions in 0.5× TE buffer with 1:3 ratio. The PCR conditions were optimized for each primer pair to achieve optimal amplification (Table A2).
2.5. Real-time PCR
Primers, primer sequences, and the expected amplicon lengths are listed in Table A3. Amplification of target genes was conducted in a CFX 384 Thermocycler (Biorad, Rüdigheim, Germany) in 384 well microplates using SYBR Green (Invitrogen, Karlsruhe, Germany) for detection in a total reaction volume of 4 µL. The reactions contained 3 µL of mastermix (10 mM Tris-HCl, 10 mM KCl, 0.1%, pH 8.3 at 25 °C), 100 µM of each dNTP (Bioline, Luckenwalde, Germany), varying final concentrations of MgCl2, varying primer concentrations (Table A2), 0.1× SYBR Green, 1 mg/mL bovine serum albumin, 0.03 u hot start Taq DNA polymerase (New England Biolabs, Beverly, MA, USA), and 1 µL of template DNA or ddH2O for negative controls. The annealing and extension time and temperature for each primer pair are listed in Table A2. Following amplification, the samples were heated to 95 °C for 60 s and cooled to 55 °C for 60 s followed by a temperature increase from 55 °C to 95 °C by 0.5 °C per cycle with continuous fluorescence measurement to obtain specific melting curves of the PCR products. PCR products exhibiting melting curves that differed from the ones of the standards were checked on 1.7% (w/v) agarose gels.
2.6. Soil, Feces, Needle and Dead Larvaea Chemical Analyses
The soil pH was measured in dH2O (with a ratio of 1:10 for the organic layers and 1:2.5 for the Ah) with samples dried at 60 °C for 48 h. For the total C and N concentration analysis, soil, feces, needle litter, and dead larvae were dried at 105 °C for 24 h and finely ground prior to analysis in a total organic carbon (TOC) analyzer multi C/N (Analytik Jena, Jena, Germany).
2.7. Statistical Analyses
The qPCR data were tested for distribution of normality and homogeneity of variances by applying the Shapiro-Wilk test and the Levene’s test, respectively. For C/N data, the Fligner-Killeen test of homogeneity of variances was used followed by Student’s t-test to test for differences between the infested and non-infested site. The statistical analyses of soil, needle, litter, feces, and larval cadaver data were performed by employing the ‘FSA’ package version 0.8.16 [29]. The Kruskal-Wallis test, with subsequent post-hoc test (Dunn’s test) and Benjamini-Hochberg corrected p-values for multiple pairwise comparisons, was used to detect differences between the infested and non-infested sites, soil layers, and years. All statistical analyses were executed in R, version 3.3.3 [30].
3. Results
3.1. Fungal 18S and Bacterial 16S rRNA Gene Abundance in Soil
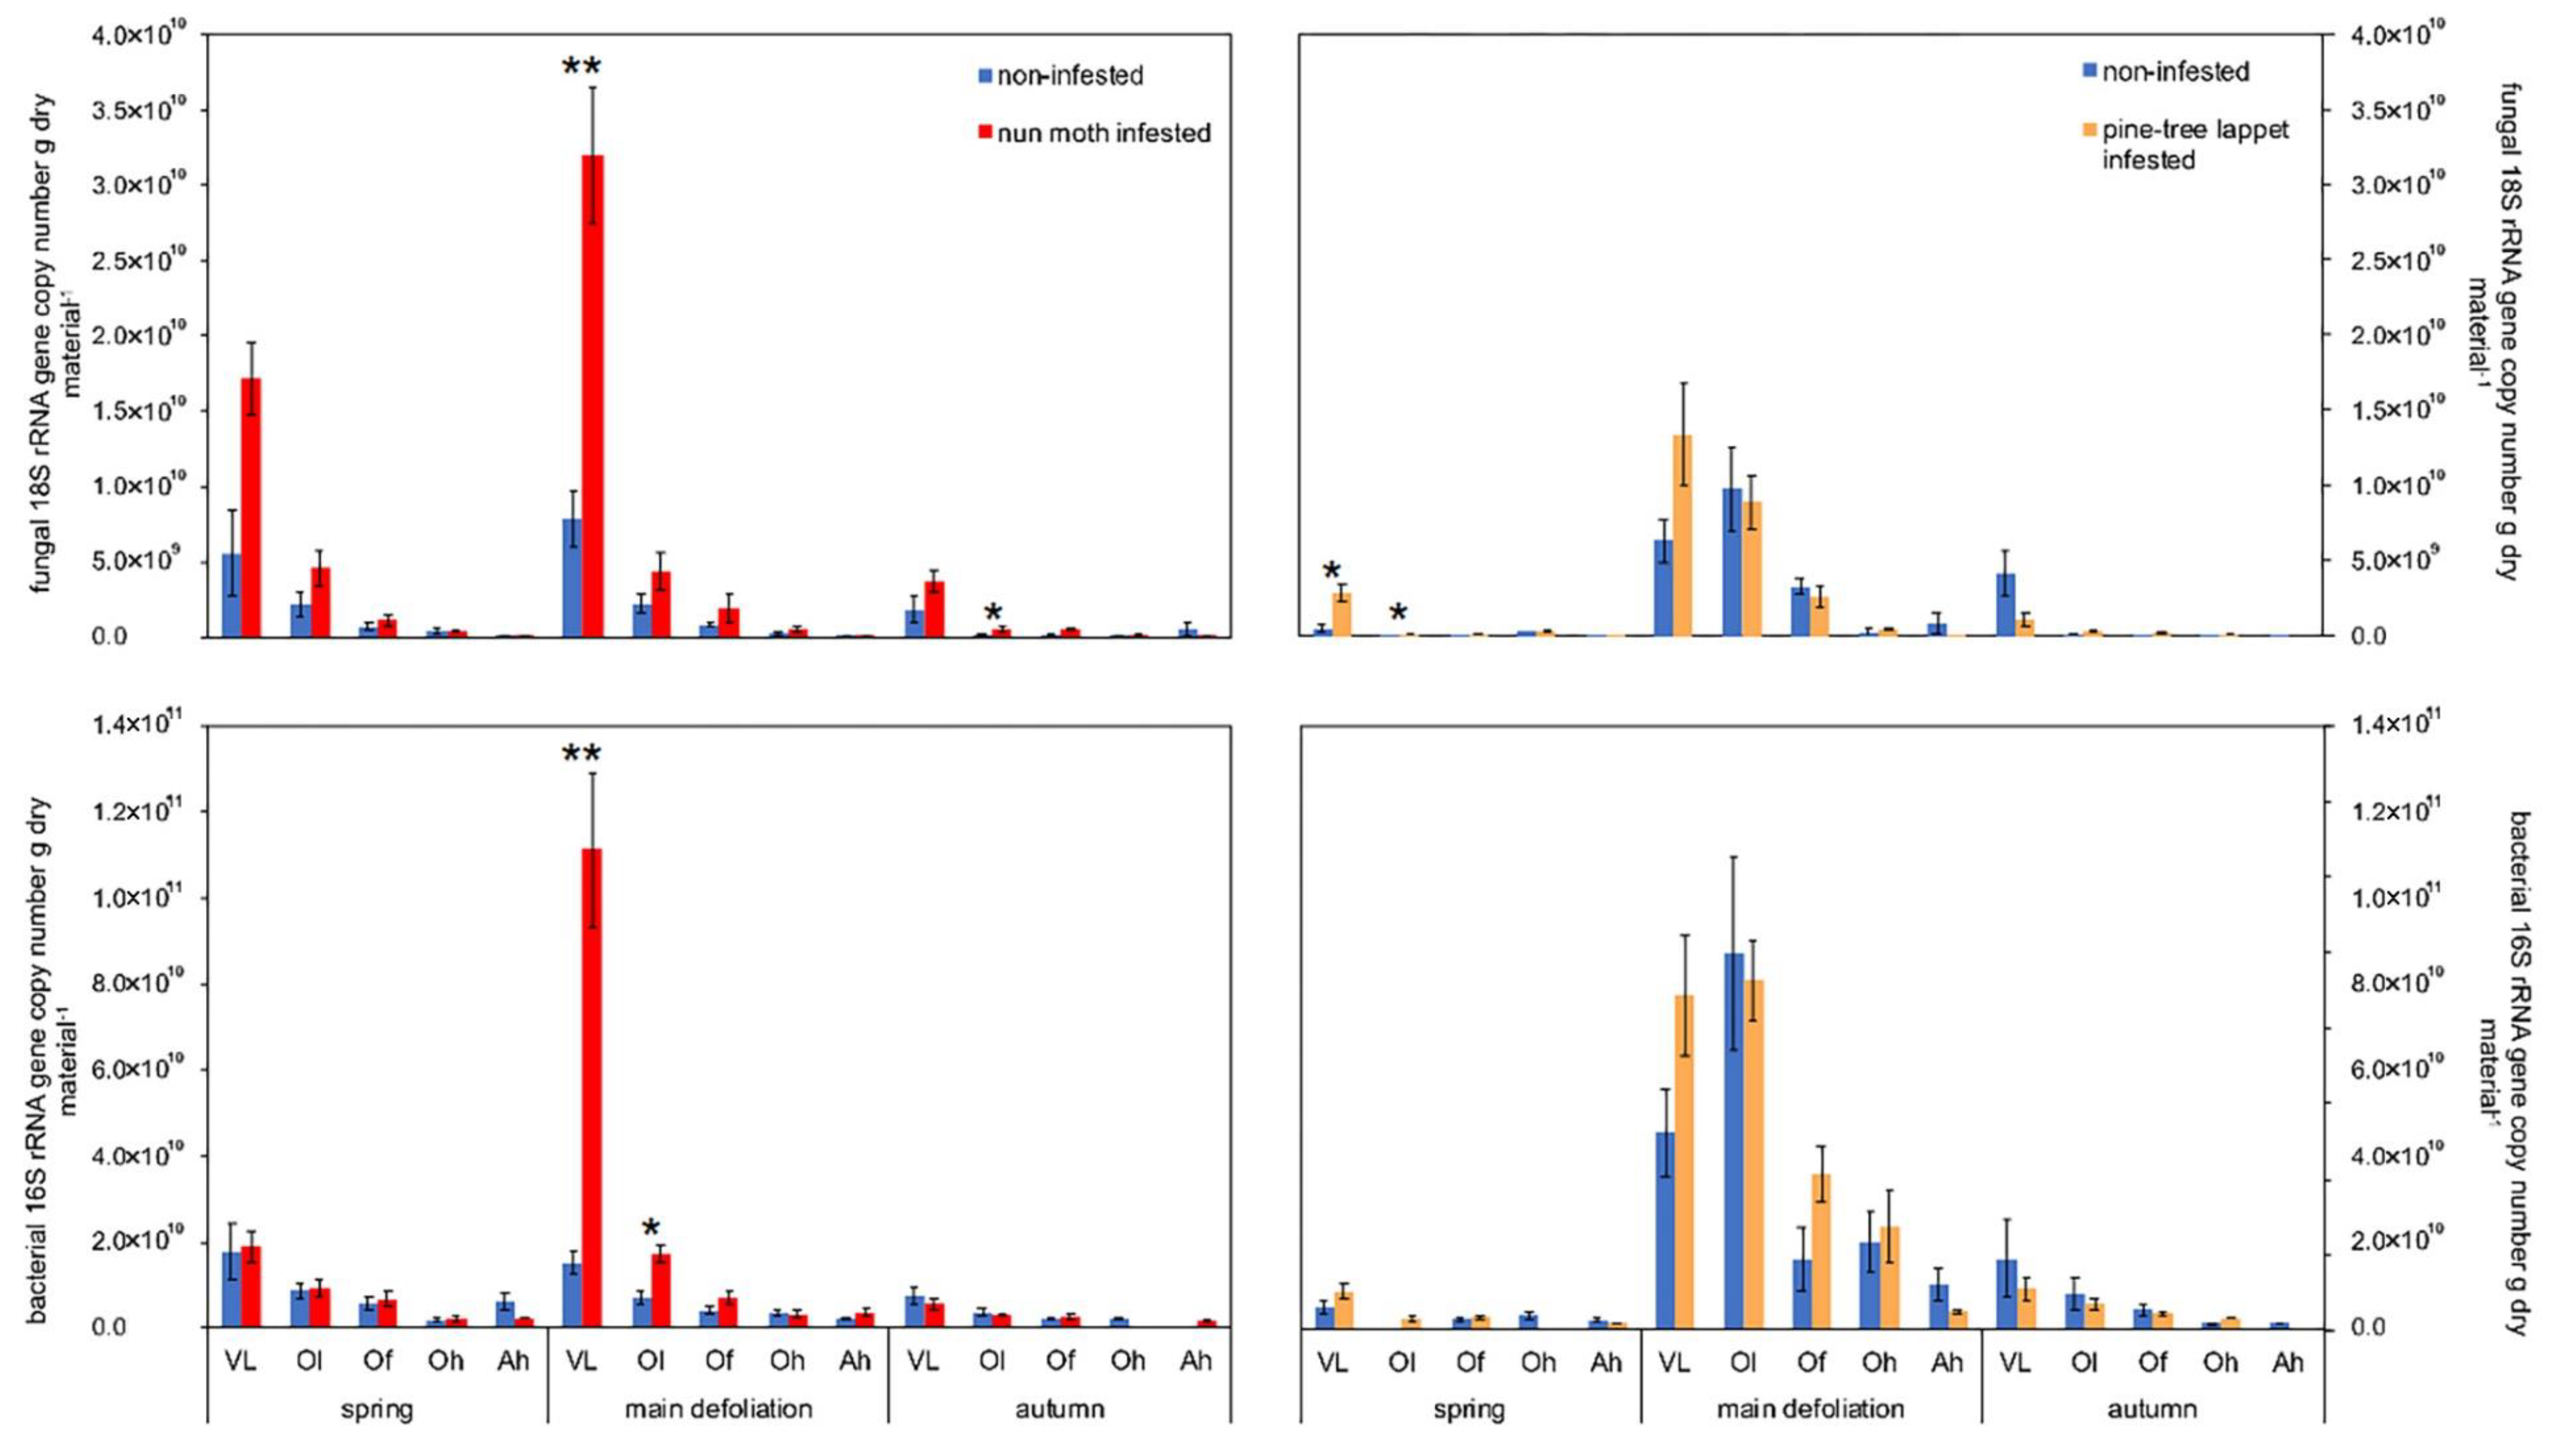
Detectable target genes in the percentage of all samples and positive sample sizes during both outbreaks are listed in Table A4 and Table A5. During the nun moth main defoliation, the fungal 18S rRNA gene abundance in the VL layer was four times higher compared to the non-infested site and the bacterial 16S rRNA was seven times higher (p ≤ 0.004) and two times higher in the Ol layer (p = 0.010) (Figure 2). During the pine-tree lappet main defoliation, the 18S and 16S rRNA gene abundances showed a similar trend, but the variability was high and did not differ significantly between infested and non-infested sites. In autumn, during the nun moth outbreak, the same trend was detectable in the Ol layer (p = 0.025). In spring, during the pine-tree lappet outbreak, the 18S rRNA gene abundance was 5 times higher in the VL layer (p = 0.010) and in the Ol layer (p = 0.025) of the infested site compared to the non-infested site. No differences in the 18S/16S rRNA gene copy ratio in any layer for either outbreak were observed.
3.2. Denitrification Gene Abundance in Soil—nirK, nirS, nosZI, nosZII
The abundances of the denitrification genes in the soil are summarized in Table 1. During the nun moth’s main defoliation, the VL and the Ol layers of the infested site exhibited ten and five times the gene copy numbers of nirK compared to the non-infested site, respectively (p = 0.006 and p = 0.016, respectively) while the nosZII abundance in the Of layer was lower at the infested site compared to the non-infested site (p = 0.047). No differences were found for nosZI during the nun moth defoliation.
During the pine-tree lappet defoliation, the nosZI abundance was higher in the Ah during the main defoliation, the Of during autumn, and the nosZII gene abundance in the VL was higher in the main defoliation, respectively, at the infested site (p = 0.034, p = 0.049 and p = 0.180). In contrast, during the pine-tree lappet defoliation, the nirK abundance in the Ol during the main defoliation and nosZII abundance the VL in spring was lower at the infested site (p = 0.006 and p = 0.021).
No differences were detectable for nirS between the infested and non-infested sites for both the pest insects at any sampling date. Overall, the mean nirK gene abundance was four and five times higher than the nirS gene abundance during the nun moth and the pine-tree lappet outbreak, respectively.
3.3. Soil Chemical Properties
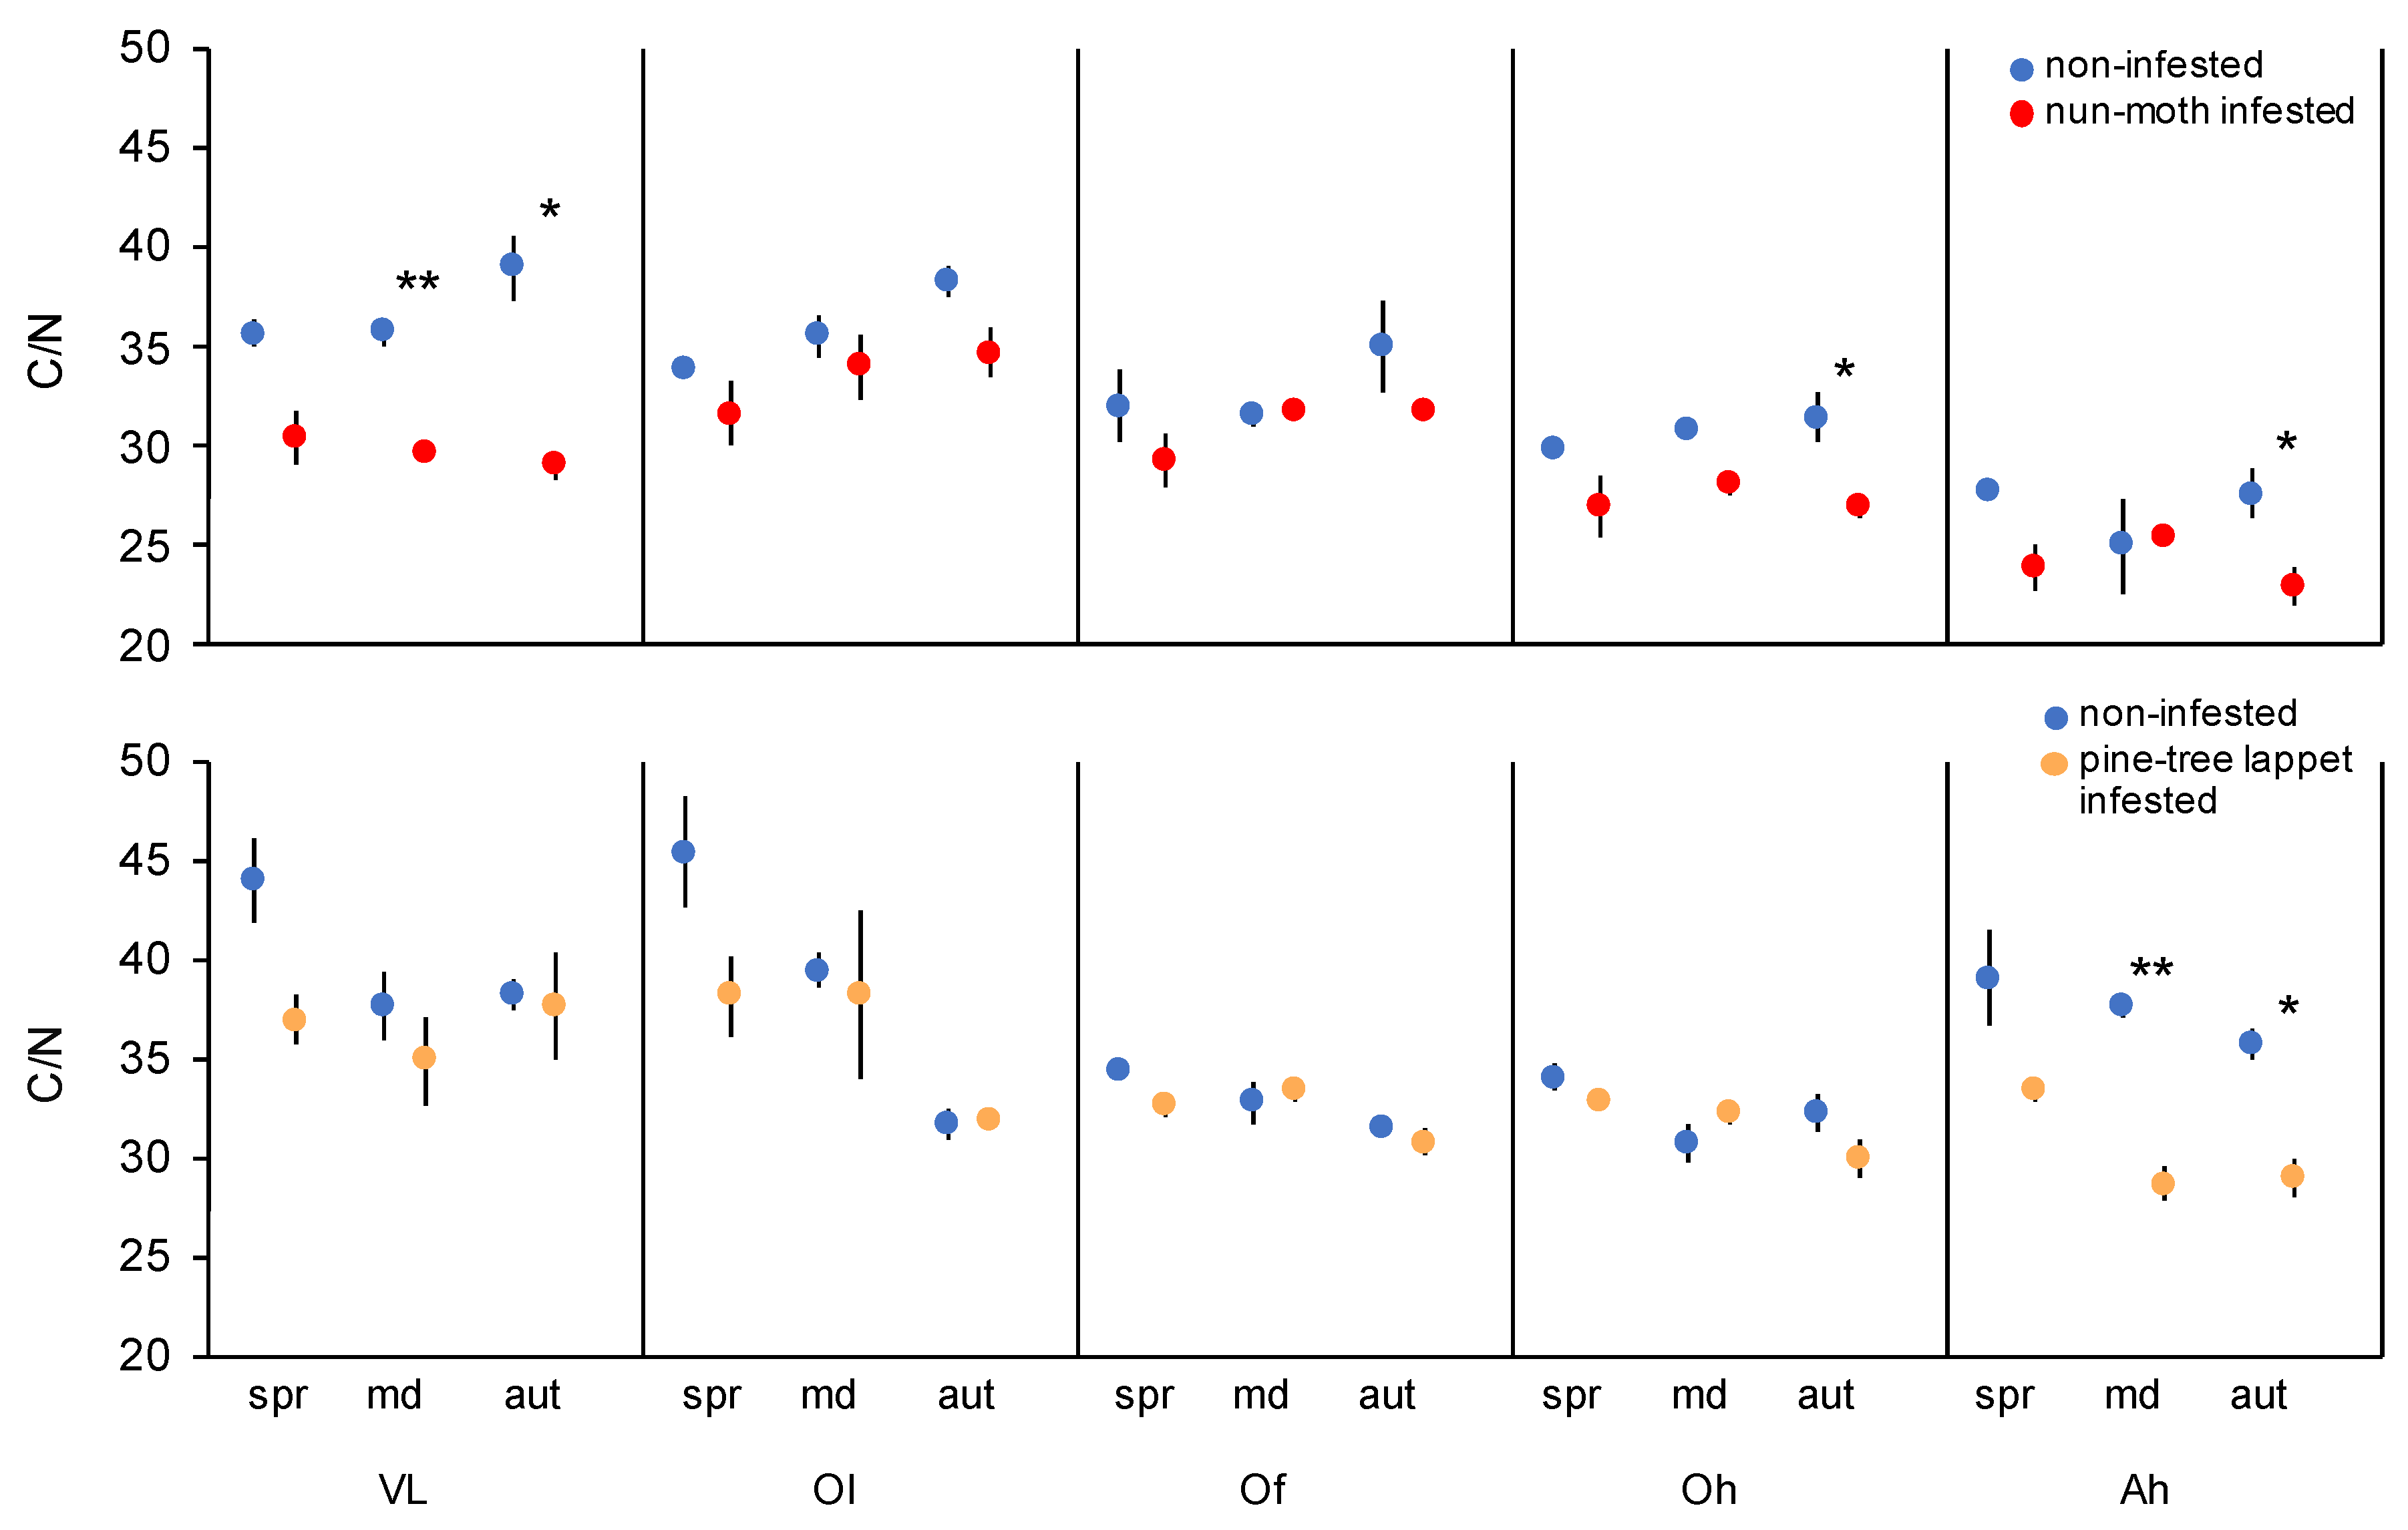
The C/N ratio of the mineral soil (Ah) decreased at both infested sites (p = 0.049 and p < 0.001), while the C/N ratio in the VL and Oh decreased only during the nun moth defoliation (p < 0.001 for both, Figure 1). The soil pH did not differ between the infested and non-infested sites but decreased from the top to mineral soil layers (Table A5).
3.4. C and N in Dead Larvae, Feces and Needle Litter
The C and N contents of dead larvae were similar for nun moth and pine-tree lappet with 57.3% and 62.1% N and 9.3% and 9.0% N, respectively. The needle litter derived from the nun moth contained 59.6% C and 1.6% N. Contents of 61.0% C and 0.9% N were obtained for the needle litter of the pine-tree lappet. Feces of the nun moth contained 58.3% of C and 0.8% of N; the feces of the pine-tree lappet are 60.6% for C and 0.8% for N.
3.5. Fungal 18S rRNA and Bacterial 16S rRNA Gene Abundance in Needles
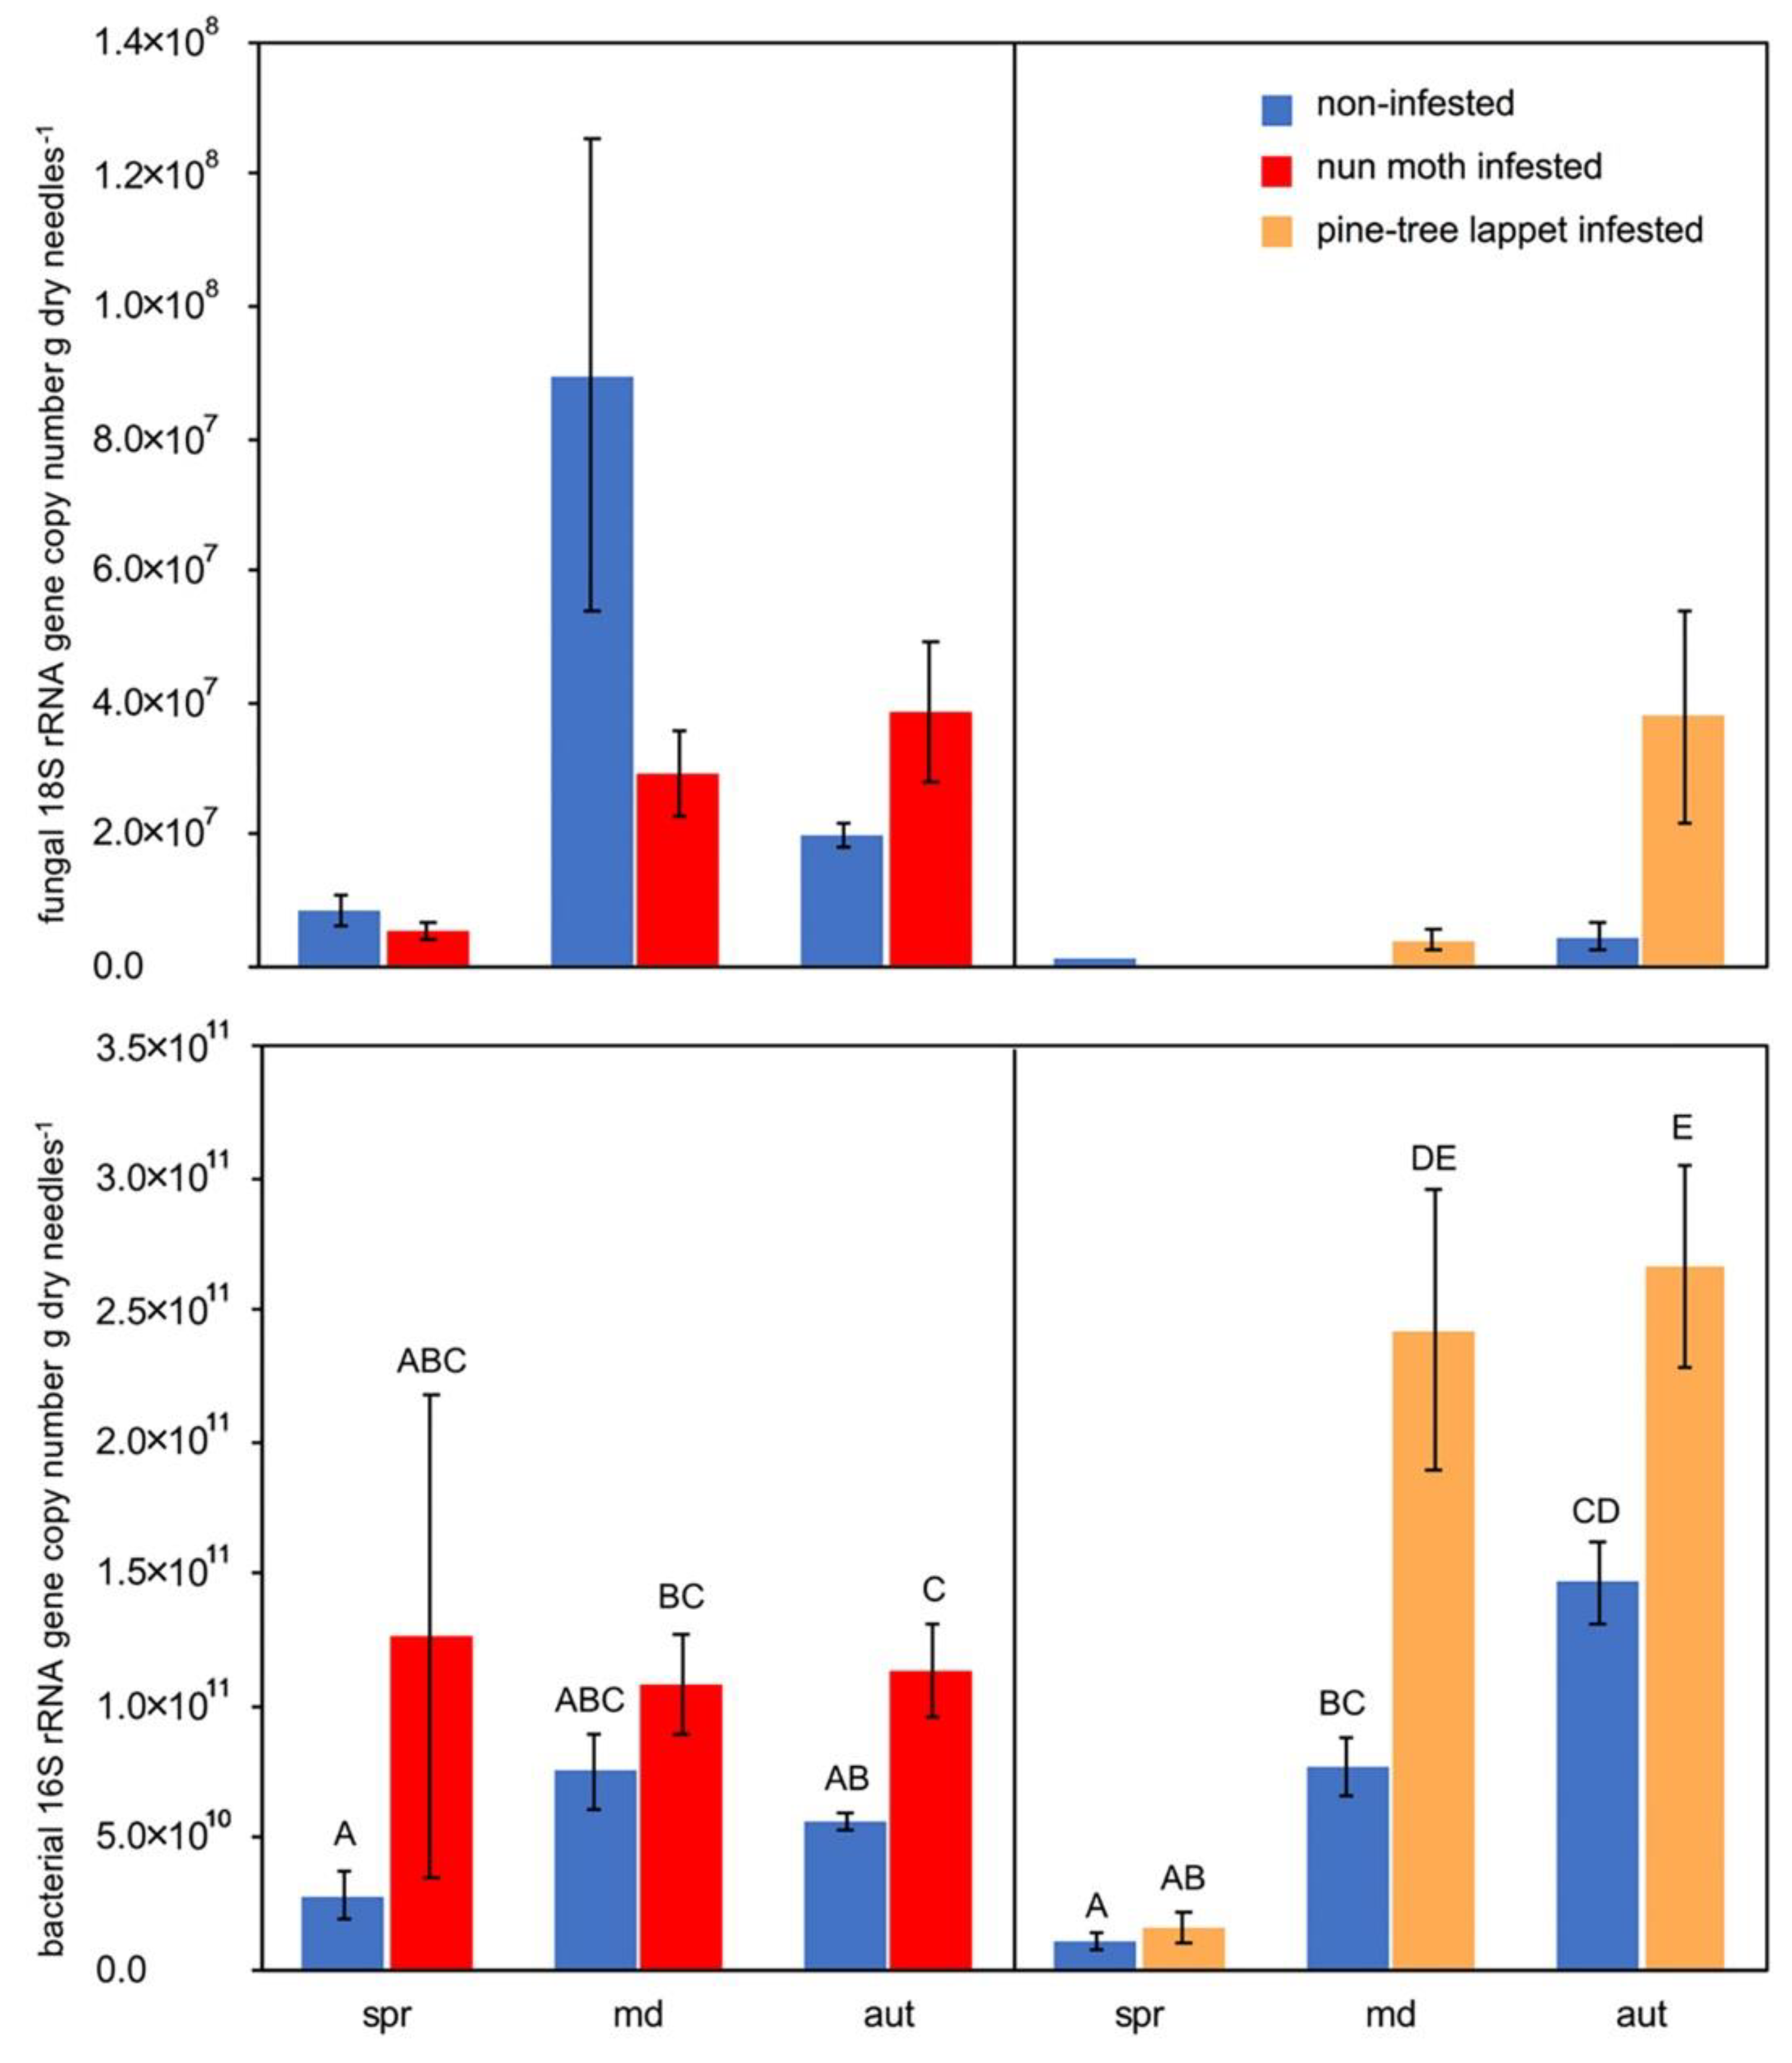
Bacterial 16S rRNA genes in infested needles were higher during the nun moth outbreak in autumn, as well as during the pine-tree lappet outbreak at the main defoliation and in autumn compared to non-infested needles (p ≤ 0.010) (Figure 3). No difference in the 18S rRNA gene abundance between the infested and non-infested site nor between the two pests was detectable.
3.6. The Abundance of Fungal 18S and Bacterial 16S rRNA Genes in Feces, Needle Litter, and Larvae
The fungal 18S rRNA gene abundance at the nun moth infested site was higher for all three sample types (p ≤ 0.050) and the bacterial 16S rRNA gene abundance was higher for feces, and litter (p ≤ 0.050) compared to the pine-tree lappet infested site (Table 2). Larvae cadavers generally showed higher bacterial 16S rRNA gene abundance than litter, while the pine-tree lappet cadavers additionally had a higher bacterial 16S rRNA gene abundance than the feces of the corresponding year (p < 0.010 for all).
4. Discussion
The analysis of bacterial and fungal gene abundances showed that the infestation of pine forests by herbivorous insects can stimulate bacterial populations in pine needles, the vegetation layer, and the upper organic layer, while fungal populations increased in the vegetation layer and upper organic layer. The nirK gene abundance in the soil increases with down-scaled C/N ratios that may stimulate the decomposition of organic matter. Our results show the enhancement of both fungal and bacterial rRNA gene abundance in infested forests and suggest increased rates of nutrient cycling and accelerated soil respiration in the course of pest outbreaks.
4.1. The Soil Fungal and Bacterial Population Size Responds to Insect Derived Litter
Fungi and bacteria are known to respond fast to increasing organic input [11,31]. During nun moth outbreaks in pine forests, the N input via throughfall was 24% higher and 300% higher via feces and needle litter on defoliated sites during the vegetation period [25]. Thus, the observed increase in the microbial population size during insect outbreaks was likely to be triggered by the defoliation events and the associated high organic inputs on the infested sites.
The increased quantity and quality of the organic inputs during insect outbreaks are important parameters affecting soil microbial communities [6]. The response of the microbial populations to additional N supply may depend on the form of N and the current soil N status, moisture status, organic C content, and pH [20,32,33]. For example, the bacterial community structure shifts in a bark beetle (Scolytidae spp.) infested forest site have been shown to correlate with soil the NH4+ concentrations and C/N ratio [34]. At our study sites, high amounts of dissolved organic C and N in throughfall, needle litter, larval cadavers, and particularly feces were introduced to the soil (cf. Reference [25]). Feces have a physiochemically easy biodegradable structure and most of the N in the feces is soluble and labile, thereby giving an impulse to the microbial growth and decomposition processes in the organic layer [4,5,20,35]. This may account for the increased bacterial community size during main defoliation. However, the N input can lead to a cascade of soil chemical reactions on which fungi and bacteria are distinctly adapted and differ in their reaction time [36]. Additionally, it has been observed that only moderate to high amounts of organic input lead to changes in soil microbial population growth [37]. The lower defoliation intensity of the pine-tree lappet (50%) compared to the nun moth outbreak (80%) may, therefore, explain the differences in the bacterial and fungal population sizes in our study. The limitation of the bacterial increase to the main defoliation sampling date implies a certain regenerative capacity of microbial populations. However, to see if our observations are accompanied by functional community changes, different methods (e.g., DNA-based amplicon sequencing) are necessary.
4.2. Insect Outbreaks Lower the Soil C/N Ratio
The vertical transport of C and N derived from insect feces in soils during insect outbreaks is accelerated by the high water solubility of most of these compounds [5,38]. Even though the changes of fungal and bacterial population sizes were limited to the VL and Ol layers during the nun moth outbreak, alterations of the C/N were still detected in the Ah layer at the main defoliation and autumn. Our observed vertical differences in the C and N contents agree with a study of lodgepole pine (Pinus contorta Dougl. ex Loud.) forest infested with bark beetles (Scolytidae spp.) [34,39]. Therein, the biogeochemical response to the outbreak was most prominent in the mineral soil and dependent on the percentage of dead trees [34,39]. Even though the trees at our study site were not killed by the outbreaks, the higher intensity of the nun moth outbreak compared to the pine-tree lappet outbreak can be one explanation for the observed differences between the sites. A decreased C/N in soil was previously observed in a nutrient release experiment of insect feces under laboratory conditions [5] and during Operophtera brumata L. and Erannis defoliaria L. outbreaks in the organic layers of an oak forest [40]. The lower C/N in fresh needle biomass which enters the soil surface in contrast to the senescent needles may also contribute to the decreased C/N during outbreaks [41]. In contrast to the observed short-term changes in soil microbial population size, the soil C and N contents in mineral soil appear to be spatially and temporally more sensitive to insect outbreaks.
4.3. The Varying Effects on Denitrification Genes
N additions in various forms have previously been shown to change N cycling-related gene abundance in soils [15,42]. However, the response of the denitrification genes remains controversial since denitrification is determined by many interacting environmental and soil biological factors [33,42]. While nirK was positively affected by defoliation of the nun moth, no effect on the nirS gene abundance was detected in our study. In contrast, N fertilization in Chinese fir (Cunninghamia lanceolata L.) forests showed negative effects on the nirS and nirK gene abundances [15]. Long-term N deposition in a Norway spruce (Picea abies L.) forest showed no effect on the nirK gene abundance, while nosZ abundance was positively affected [43]. In our study, the nosZI and nosZII gene abundances were either positively affected, negatively affected, or not affected by pest infestation. Thus, it appears that it might be difficult to directly compare the abundances of denitrification genes among the study sites, and this may be related to the great importance of the form of N and the site conditions prior to insect outbreaks (cf. References [14,33]).
Our findings are consistent with the assumption that denitrifying microorganisms do not show coherent responses to environmental changes [44,45]. For example, nirK proved to be more responsive to changes such as land use practices [46], vegetation cover [47], and water source quality [48], compared to nirS. Furthermore, nirK has a higher sensitivity towards nutrient additions than nirS [23,49]. Further, it appears that there may be a certain resilience of the denitrifying community to environmental changes. Additionally, their ability to recover fast following disturbances [43,50,51] might account for the non-existing (nirS) and inconsistent (both nosZ clades) changes between the infested and non-infested sites.
Moreover, the active part of the microbial biomass often accounts for only a fractional amount of the total microbial biomass [52]. Conventional DNA-based methods allow the assessment of the potential activity of genes by quantification, but are unable to differentiate between DNA derived from active, dormant or dead microorganisms [34]. Abundance and activity patterns of denitrifying microorganisms often do not respond congruently to environmental changes [50]. Even within DNA-based methods, the differences in DNA extraction methods, DNA yield, the choice of primer sets, as well as qPCR efficiencies, limit the transferability of the results to other studied ecosystems [53]. Nevertheless, both nir genes are known to correlate with soil net N2O fluxes [33,54,55,56]. nirS-possessing organisms usually are comprised of nosZ genes which enable complete denitrification, while nirK organisms mostly lack nosZ [57]. This implies that soil N2O emissions are predominantly determined by nirK-, rather than by nirS-type microorganisms. Thus, the nirS/nirK ratio may be negatively correlated with the soil N2O sink capacity [58,59]. Therefore, the increased nirK gene abundance in combination with the consistent or decreased amounts of nirS and nosZ genes can be seen as a predictor of enhanced potential for N2O emissions from infested forest sites. However, to date, there is no long-term field study on the effects of insect outbreaks on N2O emissions from forest soils to assess the impact of biotic disturbance on the emissions from denitrification.
4.4. Litter, Feces and Larval Cadavers as Habitat for Microorganisms and N Source
The higher N concentrations in the needle litter during the nun moth outbreak compared to the pine-tree lappet outbreak that we have found may have contributed to the increased fluxes of microorganisms from the phyllosphere to the forest floor (cf. References [59,60]). The relatively high N content on the nun moth infested litter may originate from the prolonged infestation, while the pine-tree lappet site was still in the first year of mass infestation during the sampling. High needle litter, feces, and larval cadaver inputs during insect outbreaks into the soil may serve as an additional source for N and may comprise large amounts of microorganisms which, in turn, have been shown to affect soil microbial population size [6].
4.5. Insect Outbreaks Increase Phyllosphere Bacteria Colonization
The recovered bacterial 16S and fungal 18S rRNA genes from the needle samples included both epiphytic and endophytic bacteria and fungi [61]. Bacteria numerically dominated over fungi in the phyllosphere at all sites and dates in our study. Further, we mainly found increased bacterial 16S (but not fungal 18S) rRNA gene abundance in needles from the infested site during insect outbreaks at the main defoliation until autumn. These findings are in accordance with previous studies [62]. The phyllosphere bacteria have comparatively rapid turnover rates and are influenced by both environmental conditions (e.g., temperature, UV exposure, moisture conditions) and tree characteristics and metabolism (e.g., resource availability, leaf cuticle properties, leaf age) [63,64]. Thus, seasonal increments may be triggered by increasing leaf age and changing environmental conditions throughout the vegetation period.
Defoliation caused by insect outbreaks can increase the production of nutritional substances in foliage and thereby improve the habitat conditions for microorganisms [64]. The leaching of substances from the destructed needle parts, as well as substances in insect saliva, can act as growth promoters of phyllospheric microorganisms [61,65]. For example, the infection with different powdery mildews (Erysiphaceae spp.) has been shown to stimulate the bacterial phyllosphere population of the Japanese spindle tree (Euonymus japonicus T.) [66]. Eastern hemlock (Tsuga canadensis L.) infested with Hemlock woolly adelgid (Adelges tsugae A.) showed an increased abundance of epiphytic microorganisms [1]. Bacteria can have parasitic, commensal and mutualistic interactions with trees [61]. Therefore, further studies on the function of the increased phyllosphere bacteria induced by insect outbreaks are needed to understand the interactions with their host and their environment.
5. Conclusions
Outbreaks of the nun moth and the pine-tree lappet in Scots pine forests foster bacterial and fungal populations differentially during the growing season, as well as in various forest compartments. Changes in microbial populations were of short duration and predominantly occurred in the vegetation layer and upper organic layer. The increase of the nirK gene abundance during the main defoliation of the nun moth in combination with the decreased C/N ratios in the soil suggests that alterations of the soil denitrifying populations are present, however, the duration and magnitude of these alterations remains largely unknown. Future studies may enlighten us on whether the observed increase in the genetic potential for soil N2O emissions during pest outbreaks yields in increased soil N2O emissions.
Author Contributions
Conceptualization and Supervision: A.I.-M.-A., P.K.; Investigation: M.M.G., L.B., S.M.; Formal analysis and Visualization: M.M.G.; Writing-Original Draft Preparation: M.M.G., L.B.; Writing-Review & Editing P.K. and A.I.-M.-A.
Funding
This study was funded by the Germany Research Foundation (DFG) (DFG Project No. ME 3861/2-1).
Acknowledgments
We would like to thank Annett Reinhardt, Carsten Beyer and Franziska Germeshausen for their support during the field work and Carsten Thies for helpful comments on the manuscript. We acknowledge support by the German Research Foundation and the Open Access Publication Funds of the Goettingen University.
Conflicts of Interest
The authors declare no conflict of interest.
Appendix A

Table A1.
Mean [± standard error] of pH (soil:H2O ratio 1:10 for the organic layers and 1:2.5 for the Ah) values of the vegetation layer, organic layer and the mineral soil of nun moth (Lymantria monacha L.) and pine tree lappet (Dendrolimus pini L.) infested and non-infested Scots pine (Pinus sylvestris L.) forest sites. VL = vegetation layer, Ol = litter organic, Of = fibric organic, Oh = humic organic, Ah = humic mineral.
| Site | VL | Ol | Of | Oh | Ah |
|---|---|---|---|---|---|
| non-infested | 4.33 ± 0.10 | 3.91 ± 0.07 | 3.51 ± 0.07 | 3.33 ± 0.05 | 3.42 ± 0.06 |
| nun moth infested | 4.57 ± 0.10 | 4.29 ± 0.07 | 3.94 ± 0.08 | 3.57 ± 0.06 | 3.57 ± 0.07 |
| non-infested | 4.27 ± 0.10 | 3.97 ± 0.06 | 3.61 ± 0.05 | 3.34 ± 0.05 | 3.47 ± 0.06 |
| pine-tree lappet infested | 4.21 ± 0.09 | 4.04 ± 0.04 | 3.74 ± 0.07 | 3.42 ± 0.04 | 3.58 ± 0.07 |
Table A2.
QPCR conditions for the different target genes; BamoA standards were generated from genomic DNA of Nitrosomonas europeae (strain DSM 28437), Aamoa standards were generated from environmental clones.
Table A2.
QPCR conditions for the different target genes; BamoA standards were generated from genomic DNA of Nitrosomonas europeae (strain DSM 28437), Aamoa standards were generated from environmental clones.
| Target Gene | Final MgCl2 Concentration (mM) | Primer Concentration (µM) | Initial Denaturation | Denaturation | Annealing | Extension |
| nirK | 2.5 | 0.5 | 95 °C, 120 s | 94 °C, 20 s | 63 °C–1 °C/cycle for 6 cycles, 58 °C for 35 cycles 30 s | 68 °C, 30 s |
| nirS | 2.1 | 0.5 | 95 °C, 120 s | 94 °C, 20 s | 63 °C–1 °C/cycle for 6 cycles, 58 °C for 35 cycles 30 s | 68 °C, 30 s |
| nosZI | 2.1 | 1 | 95 °C, 120 s | 94 °C, 20 s | 65 °C–1 °C/cycle for 6 cycles, 60 °C for 35 cycles 30 s | 68 °C, 25 s |
| Target Gene | Final MgCl2 Concentration (mM) | Primer Concentration (µM) | 1 cycle | 35 cycles | ||
| Initial Denaturation | Denaturation | Annealing | Extension | |||
| BamoA | 2.0 | 0.3 | 95 °C, 120 s | 94 °C, 20 s | 62 °C, 30 s | 68 °C, 35 s |
| AamoA | 30 | 0.3 | 95 °C, 120 s | 94 °C, 20 s | 61 °C, 30 s | 68 °C, 45 s |
| nosZII | 2.5 | 2.7 | 95 °C, 120 s | 94 °C, 20 s | 60 °C, 30 s | 68 °C, 45 s |
| 18S | 2.6 | 0.3 | 95 °C, 120 s | 94 °C, 20 s | 59 °C, 30 s | 68 °C, 25 s |
| 16S | 2.5 | 0.3 | 95 °C, 120 s | 94 °C, 20 s | 63 °C, 30 s | 68 °C, 25 s |
Table A3.
Target genes, oligonucleotide primers and amplicon size.
| Target Gene | Primer Name | Primer Sequence (5′–3′) | Amplicon Size (bp) | Reference |
|---|---|---|---|---|
| bacterial ammonia monooxygenase α subunit (BamoA) | amoA-1F | GGGGTTTCTACTGGTGGT | 491 | Rotthauwe et al. (1997) [67] |
| amoA-2R | CCCCTCKGSAAAGCCTTCTTC | |||
| archaeal ammonia monooxygenase α subunit (AamoA) | CrenamoA23f | ATGGTCTGGCTWAGACG | 628 | Tourna et al. (2008) [68] |
| CrenamoA616r | GCCATACABCKRTANGTCCA | |||
| Cu-nitrite reductase catalytic subunit (nirK) | nirK876F | ATYGGCGGVAYGGCGA | 165 | Henry et al. (2004) [69] |
| nirK1040R | GCCTCGATCAGRTTRTGGTT | |||
| Cd1-nitrite reductase catalytic subunit (nirS) | cd3aF | GTSAACGTSAAGGARACSGG | 410 | Michotey et al. (2000) [70], Throbäck et al. (2004) [71] |
| R3cd | GASTTCGGRTGSGTCTTGA | |||
| nitrous oxide reductase catalytic subunit (nosZI) | NosZ2F | CGCRACGGCAASAAGGTSMSSGT | 267 | Henry et al. (2006) [72] |
| NosZ2R | CAKRTGCAKSGCRTGGCAGAA | |||
| nitrous oxide reductase catalytic subunit (nosZII) | 1153 nosZ 8F | CTIGGICCIYTKCAYAC | 698 | Jones et al. (2013) [73] |
| 1888 nosZ 29R | GCIGARCARAAITCBGTR | |||
| fungal 18S rRNA (18S) | FR1 | AICCATTCAATCGGTAIT | 350 | Vainio & Hantula (2000) [74] |
| FF390 | CGATAACGAACGAGACCT | |||
| bacterial 16S rRNA (16S) | 341F | CCTACGGGAGGCAGCAG | 194 | López-Gutiérrez et al. (2004) [75] |
| 534R | ATTACCGCGGCTGCTGGCA |
Table A4.
Detectable target genes in % of all samples during the outbreak of the nun moth (Lymantria monacha L.) and pine tree lappet (Dendrolimus pini L.).
Table A4.
Detectable target genes in % of all samples during the outbreak of the nun moth (Lymantria monacha L.) and pine tree lappet (Dendrolimus pini L.).
| Target Gene | Soil | Needle | Litter | Feces | Cadaver | |||||
|---|---|---|---|---|---|---|---|---|---|---|
| Nun Moth | Pine-Tree Lappet | Nun Moth | Pine-Tree Lappet | Nun Moth | Pine-Tree Lappet | Nun Moth | Pine-Tree Lappet | Nun Moth | Pine-Tree Lappet | |
| 18S | 87.8% | 76.7% | 79.2% | 22.9% | 100% | 100% | 100% | 100% | 100% | 100% |
| 16S | 65.6% | 65.0% | 93.8% | 89.6% | 100% | 100% | 100% | 100% | 33% | 100% |
| nirK | 59.4% | 57.2% | NA | NA | NA | NA | NA | NA | NA | NA |
| nirS | 13.9% | 19.4% | NA | NA | NA | NA | NA | NA | NA | NA |
| nosZI | 32.8% | 35.6% | NA | NA | NA | NA | NA | NA | NA | NA |
| nosZII | 72.2% | 63.9% | NA | NA | NA | NA | NA | NA | NA | NA |
Total sample number soil: n = 180, needle n = 48, litter, needle, feces: n = 3, NA = data not available.
Table A5.
Samples above the detection limit for fungal 18S and bacterial 16S rRNA gene abundance, nirK, nirS, nosZI and nosZII for the different soil horizons and sampling dates in nun moth (Lymantria monacha L.) and pine tree lappet (Dendrolimus pini L.) infested and non-infested Scots pine (Pinus sylvestris L.) forest sites.
| Target Gene | VL | Ol | Of | Oh | Ah | ||||||||||||||||||||||||||
|---|---|---|---|---|---|---|---|---|---|---|---|---|---|---|---|---|---|---|---|---|---|---|---|---|---|---|---|---|---|---|---|
| spr | md | aut | spr | md | aut | spr | md | aut | spr | md | aut | spr | md | aut | |||||||||||||||||
| inf | non-inf | inf | non-inf | inf | non-inf | inf | non-inf | inf | non-inf | inf | non-inf | inf | non-inf | inf | non-inf | inf | non-inf | inf | non-inf | inf | non-inf | inf | non-inf | inf | non-inf | inf | non-inf | inf | non-inf | ||
| Nun Moth Outbreak | 18S a | 5 | 5 | 6 | 6 | 6 | 6 | 6 | 6 | 6 | 6 | 6 | 6 | 5 | 5 | 6 | 6 | 6 | 6 | 5 | 4 | 6 | 6 | 4 | 3 | 5 | 6 | 5 | 5 | 2 | 3 |
| 16S b | 6 | 5 | 6 | 6 | 6 | 5 | 6 | 5 | 6 | 6 | 3 | 5 | 6 | 4 | 5 | 6 | 4 | 2 | 2 | 3 | 5 | 4 | 0 | 3 | 1 | 2 | 2 | 2 | 2 | 0 | |
| nosZI | 2 | 4 | 2 | 3 | 0 | 1 | 1 | 3 | 3 | 1 | 2 | 2 | 2 | 1 | 2 | 2 | 2 | 2 | 3 | 3 | 1 | 2 | 0 | 1 | 2 | 2 | 2 | 3 | 2 | 3 | |
| nosZII | 6 | 5 | 6 | 6 | 6 | 5 | 6 | 6 | 6 | 6 | 6 | 4 | 5 | 5 | 5 | 5 | 5 | 5 | 5 | 3 | 6 | 6 | 2 | 3 | 0 | 0 | 1 | 2 | 2 | 2 | |
| nirK | 6 | 5 | 6 | 5 | 6 | 5 | 6 | 4 | 6 | 6 | 3 | 5 | 6 | 4 | 5 | 6 | 4 | 2 | 2 | 2 | 4 | 3 | 0 | 2 | 1 | 0 | 2 | 1 | 0 | 0 | |
| nirS | 6 | 1 | 5 | 3 | 2 | 0 | 4 | 0 | 3 | 0 | 0 | 0 | 0 | 0 | 0 | 1 | 0 | 0 | 0 | 0 | 0 | 0 | 0 | 0 | 0 | 0 | 0 | 0 | 0 | 0 | |
| Pine-Tree Lappet Outbreak | 18S a | 6 | 6 | 6 | 6 | 6 | 6 | 6 | 6 | 6 | 6 | 6 | 6 | 6 | 6 | 6 | 6 | 6 | 5 | 2 | 0 | 6 | 6 | 3 | 1 | 1 | 0 | 6 | 5 | 0 | 1 |
| 16S b | 6 | 6 | 6 | 6 | 6 | 6 | 5 | 0 | 6 | 6 | 5 | 6 | 3 | 4 | 5 | 4 | 3 | 4 | 0 | 3 | 5 | 6 | 1 | 2 | 1 | 2 | 5 | 4 | 0 | 1 | |
| nosZI | 4 | 1 | 2 | 2 | 4 | 2 | 2 | 1 | 2 | 0 | 2 | 2 | 2 | 4 | 2 | 4 | 3 | 3 | 1 | 3 | 4 | 2 | 3 | 2 | 1 | 0 | 3 | 3 | 0 | 0 | |
| nosZII | 4 | 4 | 6 | 5 | 3 | 5 | 4 | 5 | 5 | 5 | 6 | 6 | 6 | 4 | 6 | 6 | 4 | 4 | 3 | 2 | 5 | 6 | 2 | 1 | 0 | 2 | 1 | 4 | 0 | 1 | |
| nirK | 5 | 6 | 6 | 6 | 6 | 5 | 4 | 0 | 6 | 5 | 5 | 6 | 3 | 4 | 5 | 4 | 3 | 2 | 0 | 2 | 5 | 6 | 1 | 2 | 1 | 0 | 1 | 3 | 0 | 1 | |
| nirS | 0 | 0 | 5 | 4 | 0 | 0 | 2 | 4 | 0 | 4 | 0 | 0 | 0 | 0 | 6 | 5 | 0 | 0 | 0 | 0 | 2 | 3 | 0 | 0 | 0 | 0 | 0 | 0 | 0 | 0 | |
VL = vegetation layer, Ol = litter organic, Of = fibric organic, Oh = humic organic, Ah = humic mineral, spr = spring, md = main defoliation, aut = autumn. a = fungal 18S rRNA genes, b = bacterial 16S rRNA genes.
Table A6.
Needle samples above the detection limit for fungal 18S and bacterial 16S rRNA gene abundance for the sampling dates in nun moth (Lymantria monacha L.) and pine tree lappet (Dendrolimus pini L.) infested and non-infested Scots pine (Pinus sylvestris L.) forest sites.
Table A6.
Needle samples above the detection limit for fungal 18S and bacterial 16S rRNA gene abundance for the sampling dates in nun moth (Lymantria monacha L.) and pine tree lappet (Dendrolimus pini L.) infested and non-infested Scots pine (Pinus sylvestris L.) forest sites.
| Target Gene | Nun Moth Outbreak | Pine-Tree Lappet Outbreak | ||||||||||
|---|---|---|---|---|---|---|---|---|---|---|---|---|
| Spring | Main Defoliation | Autumn | Spring | Main Defoliation | Autumn | |||||||
| Infested | Non-infested | Infested | Non-infested | Infested | Non-infested | Infested | Non-infested | Infested | Non-infested | Infested | Non-infested | |
| fungal 18S rRNA | 6 | 4 | 8 | 5 | 7 | 8 | 0 | 1 | 2 | 0 | 6 | 2 |
| bacterial 16S rRNA | 8 | 6 | 8 | 7 | 8 | 8 | 5 | 6 | 8 | 8 | 8 | 8 |
References
- Stadler, B.; Müller, T.; Orwig, D.A.; Cobb, R. Hemlock woolly adelgid in New England forests: Canopy impacts transforming ecosystem processes and landscapes. Ecosystems 2005, 8, 233–247. [Google Scholar] [CrossRef]
- Müller, T.; Strobel, K.; Ulrich, A. Microorganisms in the phyllosphere of temperate forest ecosystems in a changing environment. In Microbial Ecology of Aerial Plant Surfaces; Bailey, M.J., Lilley, A.K., Timms-Wilson, T.M., Spencer-Phillips, P.T.N., Eds.; CAB International: Wallingford, UK, 2006; p. 51. [Google Scholar]
- Le Mellec, A.; Michalzik, B. Impact of a pine lappet (Dendrolimus pini) mass outbreak on C and N fluxes to the forest floor and soil microbial properties in a Scots pine forest in Germany. Can. J. For. Res. 2008, 38, 1829–1841. [Google Scholar] [CrossRef]
- Lovett, G.M.; Ruesink, A.E. Carbon and nitrogen mineralization from decomposing gypsy moth frass. Oecologia 1995, 104, 133–138. [Google Scholar] [CrossRef] [PubMed]
- Zimmer, M.; Topp, W. The role of coprophagy in nutrient release from feces of phytophagous insects. Soil Biol. Biochem. 2002, 34, 1093–1099. [Google Scholar] [CrossRef]
- Stremińska, M.A.; Błaszczyk, M.; Kolk, A. Microbial abundance and some of their physiological activities in soil organic horizon of pine forest affected by insect herbivory. Pol. J. Environ. Stud. 2006, 15, 905–914. [Google Scholar]
- Ritchie, M.; Tilman, D.; Knops, J. Herbivore effects on plant and nitrogen dynamics in oak savanna. Ecology 1998, 79, 165–177. [Google Scholar] [CrossRef]
- Chapman, S.; Hart, S.; Cobb, N.; Whitham, T.; Koch, G. Insect herbivory increases litter quality and decomposition: An extension of the acceleration hypothesis. Ecology 2003, 84, 2867–2876. [Google Scholar] [CrossRef]
- Pal, S.; Panwar, P.; Bhardwaj, D.R. Soil quality under forest compared to other land uses in acid soil of North Western Himalaya, India. Ann. For. Res. 2012, 56, 187–198. [Google Scholar]
- Reynolds, B.C.; Hunter, M.D. Responses of soil respiration, soil nutrients, and litter decomposition to inputs from canopy herbivores. Soil Biol. Biochem. 2001, 33, 1641–1652. [Google Scholar] [CrossRef]
- Strickland, M.S.; Rousk, J. Considering fungal:bacterial dominance in soils—Methods, controls, and ecosystem implications. Soil Biol. Biochem. 2010, 41, 1385–1395. [Google Scholar] [CrossRef]
- Weber, C.F.; Vilgalys, R.; Kuske, C.R. Changes in fungal community composition in response to elevated atmospheric CO2 and nitrogen fertilization varies with soil horizon. Front. Microbiol. 2013, 4, 1–14. [Google Scholar] [CrossRef] [PubMed]
- Jagadamma, S.; Mayes, M.A.; Steinweg, J.M.; Schaeffer, S.M. Substrate quality alters the microbial mineralization of added substrate and soil organic carbon. Biogeosciences 2014, 11, 4665–4678. [Google Scholar] [CrossRef] [Green Version]
- Demoling, F.; Nilsson, L.O.; Bååth, E. Bacterial and fungal response to nitrogen fertilization in three coniferous forest soils. Soil Biol. Biochem. 2008, 40, 370–379. [Google Scholar] [CrossRef]
- Tang, Y.; Zhang, X.; Li, D.; Wang, H.; Chen, F.; Fu, X.; Fang, X.; Sun, X.; Yu, G. Impacts of nitrogen and phosphorus additions on the abundance and community structure of ammonia oxidizers and denitrifying bacteria in Chinese fir plantations. Soil Biol. Biochem. 2016, 103, 284–293. [Google Scholar] [CrossRef]
- De Graaff, M.-A.; Classen, A.T.; Castro, H.F.; Schadt, C.W. Labile soil carbon inputs mediate the soil microbial community composition and plant residue decomposition rates. New Phytol. 2010, 188, 1055–1064. [Google Scholar] [CrossRef] [PubMed] [Green Version]
- Oneț, A.; Teușdea, A.; Boja, N.; Domuta, C.; Oneț, C. Effects of common oak (Quercus robur L.) defoliation on the soil properties of an oak forest in Western Plain of Romania. Ann. For. Res. 2016, 59, 33–47. [Google Scholar] [CrossRef]
- Štursová, M.; Šnajdr, J.; Cajthaml, T.; Bárta, J.; Šantrůčková, H.; Baldrian, P. When the forest dies: The response of forest soil fungi to a bark beetle-induced tree dieback. ISME J. 2014, 8, 1920–1931. [Google Scholar] [CrossRef] [PubMed]
- Ferrenberg, S.; Knelman, J.E.; Jones, J.M.; Beals, S.C.; Bowman, W.D.; Nemergut, D.R. Soil bacterial community structure remains stable over a 5-year chronosequence of insect-induced tree mortality. Front. Microbiol. 2014, 5, 681. [Google Scholar] [CrossRef] [PubMed]
- Poll, C.; Marhan, S.; Ingwersen, J.; Kandeler, E. Dynamics of litter carbon turnover and microbial abundance in a rye detritusphere. Soil Biol. Biochem. 2008, 40, 1306–1321. [Google Scholar] [CrossRef]
- Wardle, D.A.; Bonner, K.I.; Barker, G.M. Linkages between plant litter decomposition, litter quality, and vegetation responses to herbivores. Funct. Ecol. 2002, 16, 585–595. [Google Scholar] [CrossRef] [Green Version]
- Martikainen, P.J. Nitrification in two coniferous forest soils after different fertilization treatments. Soil Biol. Biochem. 1984, 16, 577–582. [Google Scholar] [CrossRef]
- Bárta, J.; Melichová, T.; Vanӗk, D.; Picek, T.; Šantrůčková, H. Effect of pH and dissolved organic matter on the abundance of nirK and nirS denitrifiers in spruce forest soil. Biogeochemistry 2010, 101, 123–132. [Google Scholar] [CrossRef]
- Dale, V.H.; Joyce, L.A.; McNulty, S.; Neilson, R.P.; Ayres, M.P.; Flannigan, M.D.; Hanson, P.J.; Irland, L.C.; Lugo, A.E.; Peterson, C.J.; et al. Climate change and forest disturbances. Bioscience 2001, 51, 723–734. [Google Scholar] [CrossRef]
- Grüning, M.M.; Simon, J.; Rennenberg, H.; I-M-Arnold, A. Defoliating insect mass outbreak affects soil N fluxes and tree N nutrition in Scots pine forests. Front. Plant Sci. 2017, 8, 954. [Google Scholar] [CrossRef] [PubMed]
- Beule, L.; Grüning, M.M.; Karlovsky, P.; I-M-Arnold, A. Changes of Scots pine phyllosphere and soil fungal communities during outbreaks of defoliating insects. Forests 2017, 8, 316. [Google Scholar] [CrossRef]
- Sambrook, J.; Fritsch, E.F.; Maniatis, T. Molecular Cloning: A Laboratory Manual, 2nd ed.; Cold Spring Harbor Laboratory Press: New York, NY, USA, 1989. [Google Scholar]
- Brandfass, C.; Karlovsky, P. Upscaled CTAB-based DNA extraction and real-time PCR assays for Fusarium culmorum and F. graminearum DNA in plant material with reduced sampling error. Int. J. Mol. Sci. 2008, 9, 2306–2321. [Google Scholar] [CrossRef] [PubMed]
- Ogle, D.H. FSA: Fisheries Stock Analysis. R. Package Version 0.8.16. Available online: https://github.com/droglenc/FSA (accessed on 10 May 2018).
- R Core Team. R: A Language and Environment for Statistical Computing. R Foundation for Statistical Computing. Available online: https://www.r-project.org (accessed on 10 May 2018).
- De Vries, F.T.; Hoffland, E.; van Eekeren, N.; Brussaard, L.; Bloem, J. Fungal/bacteria ratios in grasslands with contrasting nitrogen management. Soil Biol. Biochem. 2006, 38, 2092–2103. [Google Scholar] [CrossRef]
- Rousk, J.; Brookes, P.C.; Bååth, E. Contrasting soil pH effects on fungal and bacterial growth Suggest functional redundancy in carbon mineralization. Appl. Environ. Microbiol. 2009, 75, 1589–1596. [Google Scholar] [CrossRef] [PubMed]
- Levy-Booth, D.J.; Prescott, C.E.; Grayston, S.J. Microbial functional genes involved in nitrogen fixation, nitrification and denitrification in forest ecosystems. Soil Biol. Biochem. 2014, 75, 11–25. [Google Scholar] [CrossRef]
- Mikkelson, K.M.; Brouillard, B.M.; Bokman, C.M.; Sharp, J.O. Ecosystem resilience and limitations revealed by soil bacterial community dynamics in a bark beetle-impacted forest. mBio 2017, 8, e01305-17. [Google Scholar] [CrossRef] [PubMed]
- Güsewell, S.; Gessner, M.O. N:P ratios influence litter decomposition and colonization by fungi and bacteria in microcosms. Funct. Ecol. 2009, 23, 211–219. [Google Scholar] [CrossRef]
- Berg, M.P.; Kniese, J.P.; Verhoef, H.A. Dynamics and stratification of bacteria and fungi in the organic layers of a scots pine forest soil. Biol. Fertil. Soils 1998, 26, 313–322. [Google Scholar] [CrossRef]
- Hillstrom, M.; Meehan, T.D.; Kelly, K.; Lindroth, R.L. Soil carbon and nitrogen mineralization following deposition of insect frass and greenfall from forests under elevated CO2 and O3. Plant Soil 2010, 336, 75–85. [Google Scholar] [CrossRef]
- Le Mellec, A.; Habermann, M.; Michalzik, B. Canopy herbivory altering C to N ratios and soil input patterns of different organic matter fractions in a Scots pine forest. Plant Soil 2009, 325, 255–262. [Google Scholar] [CrossRef]
- Brouillard, B.M.; Mikkelson, K.M.; Bokman, C.M.; Berryman, E.M.; Sharp, J.O. Extent of localized tree mortality influences soil biogeochemical response in a beetle-infested coniferous forest. Soil Biol. Biochem. 2017, 114, 309–318. [Google Scholar] [CrossRef]
- I-M-Arnold, A.; Grüning, M.; Simon, J.; Reinhardt, A.B.; Lamersdorf, N.; Thies, C. Forest defoliator pests alter carbon and nitrogen cycles. R. Soc. Open Sci. 2016, 3, 160361. [Google Scholar] [CrossRef] [PubMed] [Green Version]
- Kopáček, J.; Cudlín, P.; Svoboda, M.; Chmelíková, E.; Kaňa, J.; Picek, T. Composition of Norway spruce litter and foliage in atmospherically acidified and nitrogen-saturated Bohemian Forest stands, Czech Republic. Boreal Environ. Res. 2010, 15, 413–426. [Google Scholar]
- Barnard, R.; Leadley, P.W.; Hungate, B.A. Global change, nitrification, and denitrification: A review. Glob. Biogeochem. Cycles 2005, 19, 1–13. [Google Scholar] [CrossRef]
- Kandeler, E.; Brune, T.; Enowashu, E.; Doerr, N.; Guggenberger, G.; Lamersdorf, N.P.; Philippot, L. Response of total and nitrate-dissimilating bacteria to reduced N deposition in a spruce forest soil profile. FEMS Microbiol. Ecol. 2009, 67, 444–454. [Google Scholar] [CrossRef] [PubMed] [Green Version]
- Boyle, S.A.; Rich, J.J.; Bottomley, P.J.; Cromack, K.; Myrold, D.D. Reciprocal transfer effects on denitrifying community composition and activity at forest and meadow sites in the Cascade Mountains of Oregon. Soil Biol. Biochem. 2006, 38, 870–878. [Google Scholar] [CrossRef]
- Philippot, L.; Čuhel, J.; Saby, N.P.A.; Chèneby, D.; Chroňáková, A.; Bru, D.; Arrouays, D.; Martin-Laurent, F.; Šimek, M. Mapping field-scale spatial patterns of size and activity of the denitrifier community. Environ. Microbiol. 2009, 11, 1518–1526. [Google Scholar] [CrossRef] [PubMed]
- Dandie, C.E.; Wertz, S.; Leclair, C.L.; Goyer, C.; Burton, D.L.; Patten, C.L.; Zebarth, B.J.; Trevors, J.T. Abundance, diversity and functional gene expression of denitrifier communities in adjacent riparian and agricultural zones. FEMS Microbiol. Ecol. 2011, 77, 69–82. [Google Scholar] [CrossRef] [PubMed] [Green Version]
- Smith, J.M.; Ogram, A. Genetic and functional variation in denitrifier populations along a short-term restoration chronosequence. Appl. Environ. Microbiol. 2008, 74, 5615–5620. [Google Scholar] [CrossRef] [PubMed]
- Zhou, Z.F.; Zheng, Y.M.; Shen, J.P.; Zhang, L.M.; He, J.Z. Response of denitrification genes nirS, nirK, and nosZ to irrigation water quality in a Chinese agricultural soil. Environ. Sci. Pollut. Res. 2011, 18, 1644–1652. [Google Scholar] [CrossRef] [PubMed]
- Kandeler, E.; Demoling, K.; Deiglmayr, K.; Tscherko, D.; Bru, D.; Philippot, L. Abundance of narG, nirS, nirK, and nosZ genes of denitrifying bacteria during primary successions of a glacier foreland. Appl. Environ. Microbiol. 2006, 72, 5957–5962. [Google Scholar] [CrossRef] [PubMed]
- Gschwendtner, S.; Tejedor, J.; Bimueller, C.; Dannenmann, M.; Knabner, I.K.; Schloter, M. Climate change induces shifts in abundance and activity pattern of bacteria and archaea catalyzing major transformation steps in nitrogen turnover in a soil from a mid-European beech forest. PLoS ONE 2014, 9, e114278. [Google Scholar] [CrossRef] [PubMed]
- Kennedy, N.M.; Robertson, S.J.; Green, D.S.; Scholefield, S.R.; Arocena, J.M.; Tackaberry, L.E.; Massicotte, H.B.; Egger, K.N. Site properties have a stronger influence than fire severity on ectomycorrhizal fungi and associated N-cycling bacteria in regenerating post-beetle-killed lodgepole pine forests. Folia Microbiol. 2015, 60, 399–410. [Google Scholar] [CrossRef] [PubMed]
- Nannipieri, P.; Ascher, J.; Ceccherini, M.T.; Landi, L.; Pietramellara, G.; Renella, G. Microbial diversity and soil functions. Eur. J. Soil Sci. 2003, 54, 655–670. [Google Scholar] [CrossRef] [Green Version]
- Smith, C.J.; Osborn, A.M. Advantages and limitations of quantitative PCR (Q-PCR)-based approaches in microbial ecology. FEMS Microbiol. Ecol. 2009, 67, 6–20. [Google Scholar] [CrossRef] [PubMed] [Green Version]
- Morales, S.E.; Cosart, T.; Holben, W.E. Bacterial gene abundances as indicators of greenhouse gas emission in soils. ISME J. 2010, 4, 799–808. [Google Scholar] [CrossRef] [PubMed] [Green Version]
- Rasche, F.; Knapp, D.; Kaiser, C.; Koranda, M.; Kitzler, B.; Zechmeister-Boltenstern, S.; Richter, A.; Sessitsch, A. Seasonality and resource availability control bacterial and archaeal communities in soils of a temperate beech forest. ISME J. 2011, 5, 389–402. [Google Scholar] [CrossRef] [PubMed]
- Wu, X.; Liu, H.; Fu, B.; Wang, Q.; Xu, M.; Wang, H.; Yang, F.; Liu, G. Effects of land-use change and fertilization on N2O and NO fluxes, the abundance of nitrifying and denitrifying microbial communities in a hilly red soil region of southern China. Appl. Soil Ecol. 2017, 120, 111–120. [Google Scholar] [CrossRef]
- Graf, D.R.H.; Jones, C.M.; Hallin, S. Intergenomic comparisons highlight modularity of the denitrification pathway and underpin the importance of community structure for N2O emissions. PLoS ONE. 2014, 9, e114118. [Google Scholar] [CrossRef] [PubMed]
- Jones, C.M.; Spor, A.; Brennan, F.P.; Breuil, M.; Bru, D.; Lemanceau, P.; Griffiths, B.; Hallin, S.; Philippot, L. Recently identified microbial guild mediates soil N2O sink capacity. Nat. Clim. Chang. 2014, 4, 801–805. [Google Scholar] [CrossRef]
- Stadler, B.; Michalzik, B. Effects of phytophagous insects on microorganisms and throughfall chemistry in forest ecosystems: Herbivores as switches for nutrient dynamics in the canopy. Basic Appl. Ecol. 2000, 1, 109–116. [Google Scholar] [CrossRef]
- Müller, T.; Müller, M.; Behrendt, U.; Stadler, B. Diversity of culturable phyllosphere bacteria on beech and oak: The effects of lepidopterous larvae. Microbiol. Res. 2003, 158, 291–297. [Google Scholar] [CrossRef] [PubMed]
- Vorholt, J.A. Microbial life in the phyllosphere. Nat. Rev. Microbiol. 2012, 10, 828–840. [Google Scholar] [CrossRef] [PubMed]
- Lindow, S.E.; Brandl, M.T. Microbiology of the Phyllosphere. Appl. Environ. Microbiol. 2003, 69, 1875–1883. [Google Scholar] [CrossRef] [PubMed] [Green Version]
- Redford, A.J.; Fierer, N. Bacterial Succession on the Leaf Surface: A Novel System for Studying Successional Dynamics. Microb. Ecol. 2009, 58, 189–198. [Google Scholar] [CrossRef] [PubMed]
- Strauss, S.Y.; Rudgers, J.A.; Lau, J.A.; Irwin, R.E. Direct and ecological costs of resistance to herbivory. Trends Ecol. Evol. 2002, 17, 278–285. [Google Scholar] [CrossRef]
- Steinbauer, M.J.; Taylor, G.S.; Madden, J.L. Comparison of damage to Eucalyptus caused by Amorbus obscuricornis and Gelonus tasmanicus. Entomol. Exp. Appl. 1997, 82, 175–180. [Google Scholar] [CrossRef]
- Suda, W.; Nagasaki, A.; Shishido, M. Powdery mildew-infection changes bacterial community composition in the phyllosphere. Microbes Environ. 2009, 24, 217–223. [Google Scholar] [CrossRef] [PubMed]
- Rotthauwe, J.-H.; Witzel, K.-P.; Liesack, W. The ammonia monooxygenase structural gene amoA as a functional marker: Molecular fine-scale analysis of natural ammonia-oxidizing populations. Appl. Environ. Microbiol. 1997, 63, 4704–4712. [Google Scholar] [PubMed]
- Tourna, M.; Freitag, T.E.; Nicol, G.W.; Prosser, J.I. Growth, activity and temperature responses of ammonia-oxidizing archaea and bacteria in soil microcosms. Environ. Microbiol. 2008, 10, 1357–1364. [Google Scholar] [CrossRef] [PubMed]
- Henry, S.; Baudoin, E.; López-Gutiérrez, J.C.; Martin-Laurent, F.; Brauman, A.; Philippot, L. Quantification of denitrifying bacteria in soils by nirK gene targeted real-time PCR. J. Microbiol. Methods 2004, 59, 327–335. [Google Scholar] [CrossRef] [PubMed]
- Michotey, V.; Méjean, V.; Bonin, P. Comparison of methods for quantification of cytochrome cd1-denitrifying bacteria in environmental marine samples. Appl. Environ. Microbiol. 2000, 66, 1564–1571. [Google Scholar] [CrossRef] [PubMed]
- Throbäck, I.N.; Enwall, K.; Jarvis, Å.; Hallin, S. Reassessing PCR primers targeting nirS, nirK and nosZ genes for community surveys of denitrifying bacteria with DGGE. FEMS Microbiol. Ecol. 2004, 401–417. [Google Scholar] [CrossRef] [PubMed]
- Henry, S.; Bru, D.; Stres, B.; Hallet, S.; Philippot, L. Quantitative Detection of the nosZ gene, encoding nitrous oxide reductase, and comparison of the abundances of 16S rRNA, narG, nirK, and nosZ genes in soils. Appl. Environ. Microbiol. 2006, 72, 5181–5189. [Google Scholar] [CrossRef] [PubMed]
- Jones, C.M.; Graf, D.R.H.; Bru, D.; Philippot, L.; Hallin, S. The unaccounted yet abundant nitrous oxide-reducing microbial community: A potential nitrous oxide sink. ISME J. 2013, 7, 417–426. [Google Scholar] [CrossRef] [PubMed]
- Vainio, E.J.; Hantula, J. Direct analysis of wood-inhabiting fungi using denaturing gradient gel electrophoresis of amplified ribosomal DNA. Mycol. Res. 2000, 104, 927–936. [Google Scholar] [CrossRef]
- López-Gutiérrez, J.; Henry, S.; Hallet, S.; Martin-Laurent, F.; Catroux, G.; Philippot, L. Quantification of a novel group of nitrate-reducing bacteria in the environment by real-time PCR. J. Microbiol. Methods 2004, 399–407. [Google Scholar] [CrossRef] [PubMed]
Figure 1.
The mean ± standard error of the C/N of the vegetation layers, organic layers, and the mineral soil of the nun moth (Lymantria monacha L.) and pine tree lappet (Dendrolimus pini L.) infested and non-infested Scots pine (Pinus sylvestris L.) forest site. VL = vegetation layer, Ol = litter organic, Of = fibric organic, Oh = humic organic, Ah = humic mineral, spr = spring, md = main defoliation, aut = autumn, n = 9, the asterisks indicate significant differences between the infested and non-infested sites at same date and layer based on pairwise Student’s t-test, ** p < 0.010, * p < 0.050.

Figure 2.
The mean fungal 18S rRNA and bacterial 16S rRNA gene copy numbers per gram of dry soil/plant material of the vegetation layers, organic layers, and the mineral soils of the nun moth (Lymantria monacha L.) and pine-tree lappet (Dendrolimus pini L.) infested and non-infested Scots pine (Pinus sylvestris L.) forest sites. VL = vegetation layer, Ol = litter organic, Of = fibric organic, Oh = humic organic, Ah = humic mineral. The error bars represent the standard error of the mean with varying sample sizes (see Table A5); an asterisk indicates significant differences between the infested and non-infested site on the same sampling date and layer based on the Kruskal-Wallis test, ** p < 0.010, * p < 0.050).

Figure 3.
The mean fungal 18S rRNA and bacterial 16S rRNA gene copy numbers per gram of dry needles of the nun moth (Lymantria monacha L.) and pine tree lappet (Dendrolimus pini L.) infested and non-infested Scots pine (Pinus sylvestris L.) forest site (the error bars represent standard error of the mean, spr = spring, md = main defoliation, aut = autumn. Varying sample sizes, see Table A6, different letters indicate statistically significant differences between the infested and non-infested needles based on the Kruskal-Wallis test with the subsequent Dunn’s test, p < 0.050). For fungal 18S rRNA, no statistical differences were found between the infested and non-infested needles.

Table 1.
The mean ± standard error of the nirK, nirS and nosZI and nosZII gene copy numbers per of gram dry material of the vegetation layer, organic layer, and the mineral soil of the nun moth (Lymantria monacha L.) and pine-tree lappet (Dendrolimus pini L.) infested and non-infested Scots pine (Pinus sylvestris L.) forest sites. VL = vegetation layer, Ol = litter organic, Of = fibric organic, Oh = humic organic, Ah = humic mineral. (varying sample size, see Table A5, n.d. = not detectable.); the asterisks indicate significant differences between infested and non-infested sites at the same date and layer based on a pairwise Kruskal-Wallis test, ** p < 0.010, * p < 0.050).
| Target Gene | Site | Nun Moth Infested | Pine-Tree Lappet Infested | ||||||||
|---|---|---|---|---|---|---|---|---|---|---|---|
| VL | Ol | Of | Oh | Ah | VL | Ol | Of | Oh | Ah | ||
| nirK | non-infested | 2.04 × 10⁸ | 1.36 × 10⁸ | 6.95 × 10⁷ | 4.09 × 10⁷ | 3.87 × 10⁷ | 5.58 × 10⁸ | 1.89 × 10⁹ | 4.32 × 10⁸ | 3.61 × 10⁸ | 4.17 × 10⁷ |
| ± 1.07 × 10⁸ | ± 5.32 × 10⁷ | ± 2.15 × 10⁷ | ± 1.43 × 10⁷ | - | ± 3.17 × 10⁸ | ± 5.91 × 10⁸ | ± 1.89 × 10⁸ | ± 1.42 × 10⁸ | ± 2.06 × 10⁷ | ||
| infested | 1.53 × 10⁹ ** | 4.73 × 10⁸ * | 1.64 × 10⁸ | 2.84 × 10⁸ | 1.40 × 10⁸ | 8.52 × 10⁸ | 1.39 × 10⁹ * | 3.70 × 10⁸ | 1.47 × 10⁸ | 1.96 × 10⁸ | |
| ± 2.16 × 10⁸ | ± 2.20 × 10⁸ | ± 5.95 × 10⁷ | ± 1.90 × 10⁸ | ± 2.51 × 10⁷ | ± 1.81 × 10⁸ | ± 8.25 × 10⁸ | ± 1.19 × 10⁸ | ± 1.01 × 10⁸ | ± 1.28 × 10⁸ | ||
| nirS | non-infested | 9.93 × 10⁷ | n.d. | 8.37 × 10⁷ | n.d. | n.d. | 1.66 × 10⁸ | 1.50 × 10⁸ | 1.22 × 10⁸ | 8.42 × 10⁷ | n.d. |
| ± 3.66 × 10⁷ | - | - | - | - | - | ± 4.36 × 10⁵ | ± 1.29 × 10⁷ | ± 7.29 × 10⁶ | - | ||
| infested | 1.06 × 10⁸ | 7.47 × 10⁷ | n.d. | n.d. | n.d. | 1.66 × 10⁸ | 2.25 × 10⁸ | 8.25 × 10⁷ | 6.59 × 10⁷ | 6.05 × 10⁷ | |
| ± 1.73 × 10⁷ | ± 1.24 × 10⁷ | - | - | - | - | ± 3.68 × 10⁷ | ± 6.75 × 10⁶ | ± 2.84 × 10⁷ | - | ||
| nosZI | non-infested | 8.53 × 10⁵ | 3.83 × 10⁵ | 2.16 × 10⁵ | 2.43 × 10⁵ | 5.33 × 10⁵ | 3.59 × 10⁶ | 8.58 × 10⁵ | 1.40 × 10⁶ | 9.74 × 10⁵ | 1.59 × 10⁵ |
| ± 4.92 × 10⁵ | ± 9.62 × 10⁴ | ± 2.39 × 10⁴ | ± 3.73 × 10⁴ | ± 2.88 × 10⁵ | ± 3.22 × 10⁶ | ± 4.49 × 10⁴ | ± 5.13 × 10⁵ | ± 2.43 × 10⁵ | ± 4.06 × 10⁴ | ||
| infested | 8.02 × 10⁵ | 6.05 × 10⁵ | 5.44 × 10⁵ | 4.73 × 10⁵ | 4.60 × 10⁵ | 1.87 × 10⁶ | 3.21 × 10⁵ | 1.29 × 10⁶ | 6.04 × 10⁵ | 5.89 × 10⁵ * | |
| ± 1.32 × 10⁶ | ± 7.86 × 10⁴ | ± 2.04 × 10⁵ | ± 1.01 × 10⁵ | ± 2.06 × 10⁵ | ± 1.31 × 10⁵ | ± 9.76 × 10⁴ | ± 5.55 × 10⁵ | ± 1.97 × 10⁵ | ± 1.48 × 10⁵ | ||
| nosZII | non-infested | 2.53 × 10⁷ | 2.38 × 10⁷ | 9.37 × 10⁶ | 4.17 × 10⁶ | 2.62 × 10⁶ | 1.96 × 10⁸ | 4.75 × 10⁷ | 3.62 × 10⁷ | 1.51 × 10⁶ | 4.45 × 10⁸ |
| ± 1.68 × 10⁷ | ± 1.04 × 10⁷ | ± 3.79 × 10⁶ | ± 2.69 × 10⁶ | ± 1.70 × 10⁶ | ± 8.85 × 10⁷ | ± 1.97 × 10⁷ | ± 2.47 × 10⁷ | ± 6.85 × 10⁵ | ± 5.77 × 10⁸ | ||
| infested | 3.26 × 10⁷ | 1.93 × 10⁷ | 1.13 × 10⁷ | 6.58 × 10⁶ | 1.32 × 10⁶ | 2.32 × 10⁸ | 3.75 × 10⁸ | 7.97 × 10⁶ | 2.94 × 10⁶ | 2.04 × 10⁵ | |
| ± 1.88 × 10⁷ | ± 9.95 × 10⁶ | ± 5.96 × 10⁶ | ± 3.22 × 10⁶ | ± 8.69 × 10⁵ | ± 1.99 × 10⁸ | ± 3.05 × 10⁸ | ± 4.40 × 10⁶ | ± 1.89 × 10⁶ | - | ||
Table 2.
The mean ± standard error of the fungal 18S rRNA and the bacterial 16S rRNA gene copy number per gram of dry material of the organic input (litter, insect feces and larval cadavers) of the nun moth (Lymantria monacha L.) and pine tree lappet (Dendrolimus pini L.) infested Scots pine (Pinus sylvestris L.) forest sites.
| Type of Organic Input | Fungal 18S rRNA Gene Abundance | Bacterial 16S rRNA Gene Abundance | ||
|---|---|---|---|---|
| Nun Moth | Pine-Tree Lappet | Nun Moth | Pine-Tree Lappet | |
| Litter | 4.15 × 10⁹ * | 1.42 × 10⁸ | 2.88 × 10¹¹ * | 4.13 × 10¹⁰ |
| ± 1.56 × 10⁹ | ± 7.95 × 10⁶ | ± 1.22 × 10¹⁰ | ± 6.14 × 10⁹ | |
| Feces | 5.36 × 10⁹ * | 1.58 × 10⁹ | 3.04 × 10¹¹ * | 1.57 × 10¹¹ |
| ± 4.38 × 10⁸ | ± 4.92 × 10⁸ | ± 2.96 × 10¹⁰ | ± 3.46 × 10¹⁰ | |
| Cadaver | 1.44 × 10¹⁰ * | 1.66 × 10⁹ | 1.23 × 10¹² ♦ | 7.34 × 10¹¹ |
| ± 4.74 × 10⁹ | ± 8.37 × 10⁷ | - | ± 5.77 × 10⁹ | |
Samples were collected after no longer than 48 h (n = 3, ♦n = 1, asterisks indicate significant differences between the nun moth and pine-tree lappet infested site based on the Kruskal-Wallis test, * p < 0.050).
© 2018 by the authors. Licensee MDPI, Basel, Switzerland. This article is an open access article distributed under the terms and conditions of the Creative Commons Attribution (CC BY) license (http://creativecommons.org/licenses/by/4.0/).
Share and Cite
MDPI and ACS Style
Grüning, M.M.; Beule, L.; Meyer, S.; Karlovsky, P.; I.-M.-Arnold, A. The Abundance of Fungi, Bacteria and Denitrification Genes during Insect Outbreaks in Scots Pine Forests. Forests 2018, 9, 497. https://doi.org/10.3390/f9080497
AMA Style
Grüning MM, Beule L, Meyer S, Karlovsky P, I.-M.-Arnold A. The Abundance of Fungi, Bacteria and Denitrification Genes during Insect Outbreaks in Scots Pine Forests. Forests. 2018; 9(8):497. https://doi.org/10.3390/f9080497
Chicago/Turabian StyleGrüning, Maren Marine, Lukas Beule, Stephanie Meyer, Petr Karlovsky, and Anne I.-M.-Arnold. 2018. "The Abundance of Fungi, Bacteria and Denitrification Genes during Insect Outbreaks in Scots Pine Forests" Forests 9, no. 8: 497. https://doi.org/10.3390/f9080497
Note that from the first issue of 2016, this journal uses article numbers instead of page numbers. See further details here.