
Prediction of Potential Distribution Patterns of Three Larix Species on Qinghai-Tibet Plateau under Future Climate Scenarios


Research Center for Engineering Ecology and Nonlinear Science, North China Electric Power University, Beijing 102206, China
*
Author to whom correspondence should be addressed.
Forests 2023, 14(5), 1058; https://doi.org/10.3390/f14051058
Submission received: 18 April 2023
/
Revised: 14 May 2023
/
Accepted: 18 May 2023
/
Published: 21 May 2023
(This article belongs to the Section Forest Meteorology and Climate Change)
Abstract
:How climate change affects the plants on the Qinghai-Tibet Plateau (QTP) has become a hot research topic in recent years. It was widely recognized that Larix. are sensitive to climate change, while the corresponding research of Larix. on the QTP has been rare. Using the maximum entropy (MaxEnt) model, we predicted the potential distribution patterns of Larix potaninii Batalin, Larix griffithii and Larix speciosa on the QTP in this study under different future climate scenarios. The results demonstrated that the area of suitable habitat for Larix potaninii Batalin (Larix griffithii) presented a loss (gain) trend, while that for Larix speciosa remained unchanged on the whole. The centroids of their suitable habits all migrated to the high-altitude and high-latitude areas, suggesting the three species may take the same survival strategy in response to climate change. Annual Precipitation was the most significant environmental factor influencing the distribution pattern of Larix potaninii Batalin, while Temperature Annual Range was the most significant for Larix griffithii and Larix speciosa. The overlapping potential suitable area for the three Larix species was the maximum under the 2041–2060 SSP126 future climate scenarios and decreased with the increasing emission concentration, suggesting that the niches of these species may step towards separation. This study suggested the survival strategies of the Larix species in response to climate change and the findings may provide a reliable basis for conserving the endangered Larix species under different future climate scenarios.
1. Introduction
The Qinghai-Tibet Plateau (QTP) is the plateau with the highest altitude and the most complex landform on the earth. It is one of the key areas for the global climate and water cycle and is known as the Asian water tower; climate change on the QTP makes significant impacts on the surrounding areas and even the global climate system [1,2]. Moreover, climate change on the QTP not only induces soil changes and renders the degeneration of forest vegetation [3], but also enhances the drought vulnerability of the QTP ecological system and influences pattern changes in plant species distribution [4,5]. Although the temperature increment induced by climate change may increase the suitable habitat area of some species [6], for some plant species in special habits it will also reduce the suitable distribution area and may even push the species to the verge of extinction [7,8]. Studies have indicated that species sensitive to climate change often migrate to high-altitude and high-latitude areas under future climate change [9,10,11,12].
Larch forests are one of the most extensively distributed coniferous forests in the cold temperate zone [13] and are the key water and soil conservation forests for the ecological barrier protection on the QTP and in the upper reaches of the Yangtze River [14]. Currently, studies concerning Pinaceae on QTP mainly concentrate on Picea and Abies, while research on Larix is relatively rare. Generally, the Pinaceae species are sensitive to climate change, and temperature and precipitation are the important environmental variables which can affect the distribution of the Pinaceae species [15,16]. For instance, if the future climate shows dry warming with increasing temperature, the geographical distribution pattern of Abies squamata will be obviously changed [17]. Larix species are the traditional research species in dendroclimatology and have been widely recognized to be sensitive to climate change [18]. For example, under the future climate background, a temperature increase will stimulate the radial growth of Larix mastersiana [19]; Larix potaninii Batalin in the QTP area is the most sensitive to climate factors in comparison to Picea likiangensis var. rubescens and Abies squamata [20].
As one of the species distribution models (SDMs), the maximum entropy (MaxEnt) model has been widely applied in the simulation and prediction of potentially suitable distribution areas, distribution patterns, and responses to climate change for various species owing to its advantages including short run time, low sample size requirement, high simulation precision, and good prediction performance [21,22,23]. The MaxEnt model often applies bioclimate variables that represent the characteristics of regional temperature and precipitation to predict potential distribution patterns [5]. As found, bioclimate changes including the interannual and seasonal variation of temperature and precipitation can exhibit a large influence on the plant species distribution patterns on the QTP, due to the great susceptibility of vegetation in this area to climate change [1,16]. In this study, the bioclimate factors in the WorldClim v2.1 database were employed to simulate and predict the species suitable distribution areas under different future climate scenarios, aiming to reveal the responding mechanism of the species geographical distribution pattern to climate. The precision of the MaxEnt model in predicting species spatial distribution is not significantly affected by the sample size [24]. It performed excellently in terms of its simulation performance, either in the suitability research on Larix gmelinii among the 182 current distribution points or in a study on species suitable distribution areas of Picea smithiana (Pinaceae: Picea) at the extremely low sample size (n = 28) among the current distribution points, further demonstrating that the MaxEnt model well predicted the distribution patterns of rare species [15,25]. Xiao et al. [26] employed the MaxEnt and genetic algorithm for rule-set production (GARP) models to predict the suitable distribution area of Procambarus clarkii, finding that the prediction results by MaxEnt were more accurate. Zhang et al. [10] also employed the AHP-GIS and MaxEnt models to compare the prediction results regarding the potential distribution patterns of Arabica coffee, discovering that the MaxEnt model outperformed the AHP-GIS model. The above findings confirm that, under the condition of limited distribution point data, the MaxEnt model can achieve better prediction results and higher accuracy than other models and be more suitable for predicting the potential geographical distribution of species [27].
By predicting the potential geographical distribution of QTP plants under the background of climate change based on the MaxEnt model, different results can be obtained [28]. Picea smithiana, an endemic species of the Himalayas, has the potential for continuous expansion concerning its population quantity and distribution on the QTP. By calculating the contribution of every bioclimate variable to the prediction probability, it is discovered that elevation is the variable with the highest contribution [15]. In the study on the Larix species in the QTP area, the species distribution and genetic diversity are discovered to be affected by altitude [29]. Based on the study on Juniperus tibetica Komarov on QTP, annual precipitation is the most important environmental factor influencing its distribution [30]. Furthermore, factors including annual precipitation, elevation, mean temperature of driest quarter, topsoil pH (H2O), and topsoil sand fraction greatly affect the potential distribution patterns of the endangered species of orchids on QTP [31]. As for the prediction of the potential distribution patterns of multiple species, relevant research is conducive to further revealing the correlation of the ecological niches among congeners [31,32,33]. Moreover, comparing the differences in the potential distribution patterns of multiple species under different climatic scenarios can improve the knowledge of the response of QTP vegetation to climate change.
Using the existing species data and environmental data, this study aimed to predict the potential distribution patterns of three major Larix species in the QTP area, including Larix potaninii Batalin, Larix griffithii, and Larix speciosa, under current and future climate scenarios, based on the MaxEnt model. Larix potaninii Batalin, Larix griffithii, and Larix speciosa are chosen for the following reasons. First, the three Larix species are the most widely distributed among the Larix species on QTP, which are highly representative. Second, Larix potaninii Batalin and Larix griffithii are the endangered species on the Red List of the International Union for Conservation of Nature (IUCN) [34], and Larix speciosa is endemic to China. Furthermore, climate change has a huge impact on these three Larix species [29]. The present study mainly addresses the following questions: (1) predicting the geographical distribution area and changes of three Larix species in the QTP area under various future climate scenarios, and clarifying the migration trend of suitable distribution habitats of three Larix species; (2) analyzing the major environmental factors affecting the current distribution of suitable distribution areas and exploring the environmental anomaly areas during the process of climate change; and (3) discussing the responses of the common suitable distribution area of three Larix species on the QTP to climate change. Through this research, reliable results may be obtained for illustrating the responding mechanism for the major Larix species in the QTP area during the climate change period.
2. Materials and Methods
2.1. Collection of Data
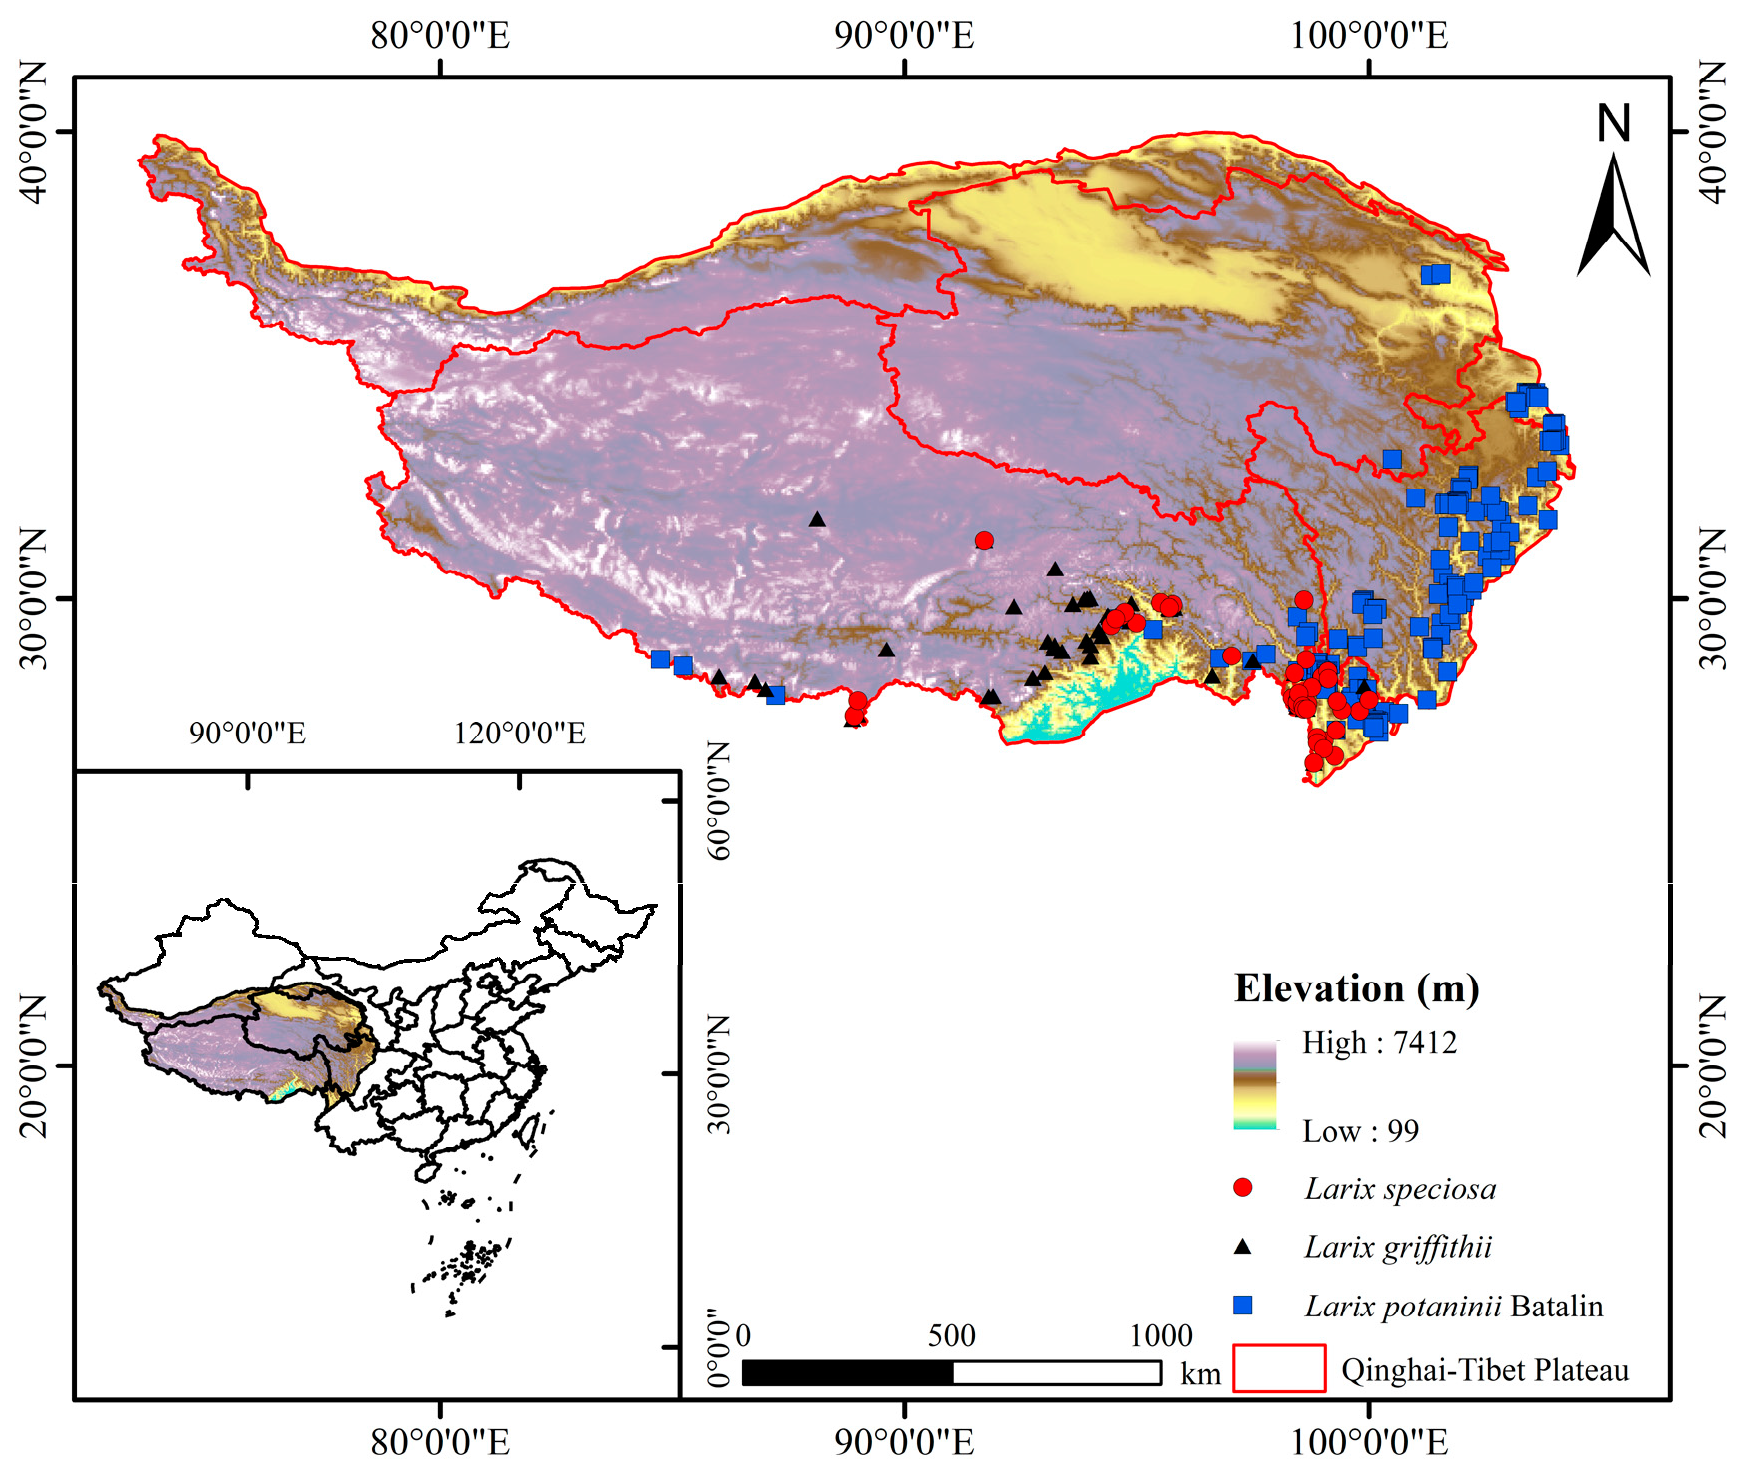
The natural distribution point data of Larix potaninii Batalin, Larix griffithii, and Larix speciosa used in this study were derived from the Atlas of Vegetation in China (1:1,000,000) published by the Geographical Publishing House, the Global Biodiversity Information Network Database (GBIF: https://www.gbif.org (accessed on 8 September 2022)) and the China Digital Herbarium (CVH: https://www.cvh.ac.cn (accessed on 24 September 2022)). Firstly, data without accurate locations in the GBIF database were deleted, and then the longitude and latitude were obtained based on the species geographical location. Second, the invalid, duplicated, and cultured data were eliminated using the ArcGIS 10.8 SDM tool. A buffer area of 5 km × 5 km (2.5′) meshes was set. Only one distribution point was preserved in each mesh. Finally, data from 154 Larix potaninii Batalin effective distribution points, 52 Larix griffithii effective distribution points, and 39 Larix speciosa effective distribution points were obtained, as displayed in Figure 1. Data of the current distribution points were saved in CSV format.
The current and future climate data (including 19 bioclimate variables in every scenario) and the altitude data were downloaded from WorldClim 2.1version (https://worldclim.org/data/index.html/ (accessed on 2 October 2022)), with the spatial resolution of 2.5’. The WorldClim 2.1 version of climate data employs data from 9000–60,000 meteorological stations and summarizes the monthly (minimum, maximum, and average) temperatures, precipitation, solar radiation, wind speed, water vapor pressure, and total precipitation during 1970–2000. It also provided future data under multiple climate scenarios to predict the potential distribution patterns based on the current data. Both the temperature and precipitation data of the WorldClim 2.1 are of extremely high reliability. The future climate prediction data of CMIP6 were adopted for predicting the future distributions of Larix potaninii Batalin, Larix griffithii and Larix speciosa. Ncube et al. [35] suggested that, when using fewer models, multiple distinct future climate patterns could be selected to avoid possible uncertainties and errors. Meinshausen et al. [36] considered the shared socioeconomic paths (SSPs) included five major SSPs (SSP119, SSP126, SSP245, SSP370 and SSP585). Therefore, in order to reduce the uncertainty and error, we selected the bioclimate variables representing three greenhouse gas concentration paths (low, moderate and high: SSP126, SSP370 and SSP585 separately) under the future climate patterns during 2041–2060 and 2081–2100.
The provincial boundary data were provided by the Data Center for Resources and Environmental Sciences of the Chinese Academy of Sciences (http://www.resdc.cn/ (accessed on 8 October 2022)) and the QTP boundary data were extracted from the National QTP Scientific Data Center (http://www.data.tpdc.ac.cn/ (accessed on 8 October 2022)). Soil data adopted soil factors with the resolution of 2.5′ from the World Soil Database (http://www.iiasa.ac.at/web/home/research/researchPrograms/water/HWSD.html (accessed on 8 October 2022)).
In the literature, the SDMs used to predict potential distribution patterns, including MaxEnt, Bioclim, random forest, GARP, and ensemble models, were extensively employed [37]. Among these models, MaxEnt, random forest, and ensemble models often demonstrate good performance in prediction. Further, the models of MaxEnt and random forest are the most widely applied and often show consistent prediction performances in many situations, while the ensemble model is still far less used, relatively [38]. Moreover, even under the conditions of limited distribution point data, the MaxEnt model can achieve better prediction results and achieve high accuracy in predicting potential geographical distribution of plant species. With the above comparison and considering the SDMs models that are familiar to the authors, we selected the MaxEnt model to perform prediction research on the three Larix species on the Qinghai-Tibet Plateau. In ArcGIS 10.8, the QTP boundary data were used as the range mask to obtain the corresponding tif data, which were later transformed with the format transformation tool into the asc format data required by the MaxEnt software. In this study, a total of 36 environmental factors (including 19 bioclimate factors, 3 topography factors, and 14 soil factors) were selected to simulate and predict the potential geographical distributions of Larix potaninii Batalin, Larix griffithii and Larix speciosa.
2.2. Selection of Main Environmental Variables
When processing sample points, we set the buffer area of 5 km × 5 km (2.5’) meshes, and one distribution point was preserved in each mesh to avoid overfitting. In addition, to avoid overfitting the final simulation results caused by strong correlations among various environmental factors, this study performed a screening analysis on the used 36 environmental factors. At first, the 36 environmental factors were imported into the MaxEnt model for simulation. Then, factors with a percentage contribution rate of >1.0% were screened, and the corresponding environmental variables were obtained. Afterwards, species were subjected to re-sampling from the corresponding layer using ArcGIS 10.8, and environmental variables were extracted for correlation analysis (Figure S1). If there were two or more factors with the absolute value of correlation ≥0.8 among the screened environmental variables, only the factor with the highest contribution rate was selected [14,26,39]. Finally, the selected climate variables, landform variables, and soil variables were employed to construct the model for predicting species potential distribution (Table 1).
2.3. Accuracy of the Model and Trend of Suitable Areas Changes
The distribution point data in CSV format and environmental factor data in ASC format were imported into the MaxEnt software (version 3.4.4) and confirmed by the Jackknife method, and the response curve was constructed. Seventy-five percent of the distribution point data were randomly selected as the training set to construct the model, while the remaining twenty-five percent were used as the test set for verification. The data output format was Logistic, and the process was run 10 times repeatedly. Based on the area under the receiver operating characteristic (ROC) curve (AUC) values, the result accuracy was evaluated [40]. The range of the AUC value is 0–1, and a greater value indicates a better model prediction result; an AUC value of 0.9–1.0 represents the perfect predicted value [41]. Based on the natural breaks (Jenks) method in the resorting tool of ArcGIS software, the resultant data in ASC format outputted by the MaxEnt software were processed to divide the non-suitable, lowly suitable, moderately suitable, and highly suitable habitats for Larix potaninii Batalin, Larix griffithii and Larix speciosa [11,31,32,42]. The areas of the divided areas were calculated using ArcGIS 10.8 software based on the method proposed by Zayneb Soilhi et al. [43].
The suitable habitat is deemed as the unit of space with a species existence probability value ≥ MTSPS (Maximum Test Sensitivity Plus Specificity threshold), while the non-suitable habitat is a unit of space with a species existence probability value < MTSI [30,42]. Using the grid processing tool in ArcGIS (10.8 ESRI, Redlands, CA, USA), the changes in spatial patterns of suitable distribution areas of Larix potaninii Batalin, Larix griffithii, and Larix speciosa under the future climate background were investigated. Three change types of suitable habitats were defined, namely, gain, loss, and unchanged areas. Based on the current suitable habitats, the changes in the future suitable habitats were calculated. The changes of spatial pattern of potentially suitable habitat under the future climate scenarios were defined below; the change from suitable habitat to unsuitable habitat was expressed as a loss, while the change from unsuitable habitat to suitable habitat was expressed as a gain, and the rest was deemed as unchanged area. The ArcGIS software was used to calculate the variation trend of suitable habitats and geometric center of centroids in different periods and under different SSPs, and the changes of centroid coordinates in suitable habitats were also compared [44,45,46].
2.4. Analysis of Multivariate Environmental Similarity Surface (MESS)
Under different future climate change scenarios, the degree of climate anomaly in suitable habitats can be analyzed by multivariate environmental similarity surface (MESS), with the maximum similarity (S) between future climate conditions and current climate conditions being 100 [11,47]. In general, S < 0 indicates climate anomaly in the area; the value of at least one environmental factor is not within the reference range, which is referred to as the climate anomaly point, and a greater negative value represents the greater climate anomaly degree. By contrast, when S > 0, the greater value suggests a more normal climate. When S = 100, it indicates that the climate environment is completely consistent with the reference layer and the climate is normal [48], and the variable may be a key factor of the geographical migration of species. The above manipulations were completed in the density tools Novel tool of the MaxEnt. jar file.
3. Results
3.1. Accuracy of the Model and the Current Distribution of Species
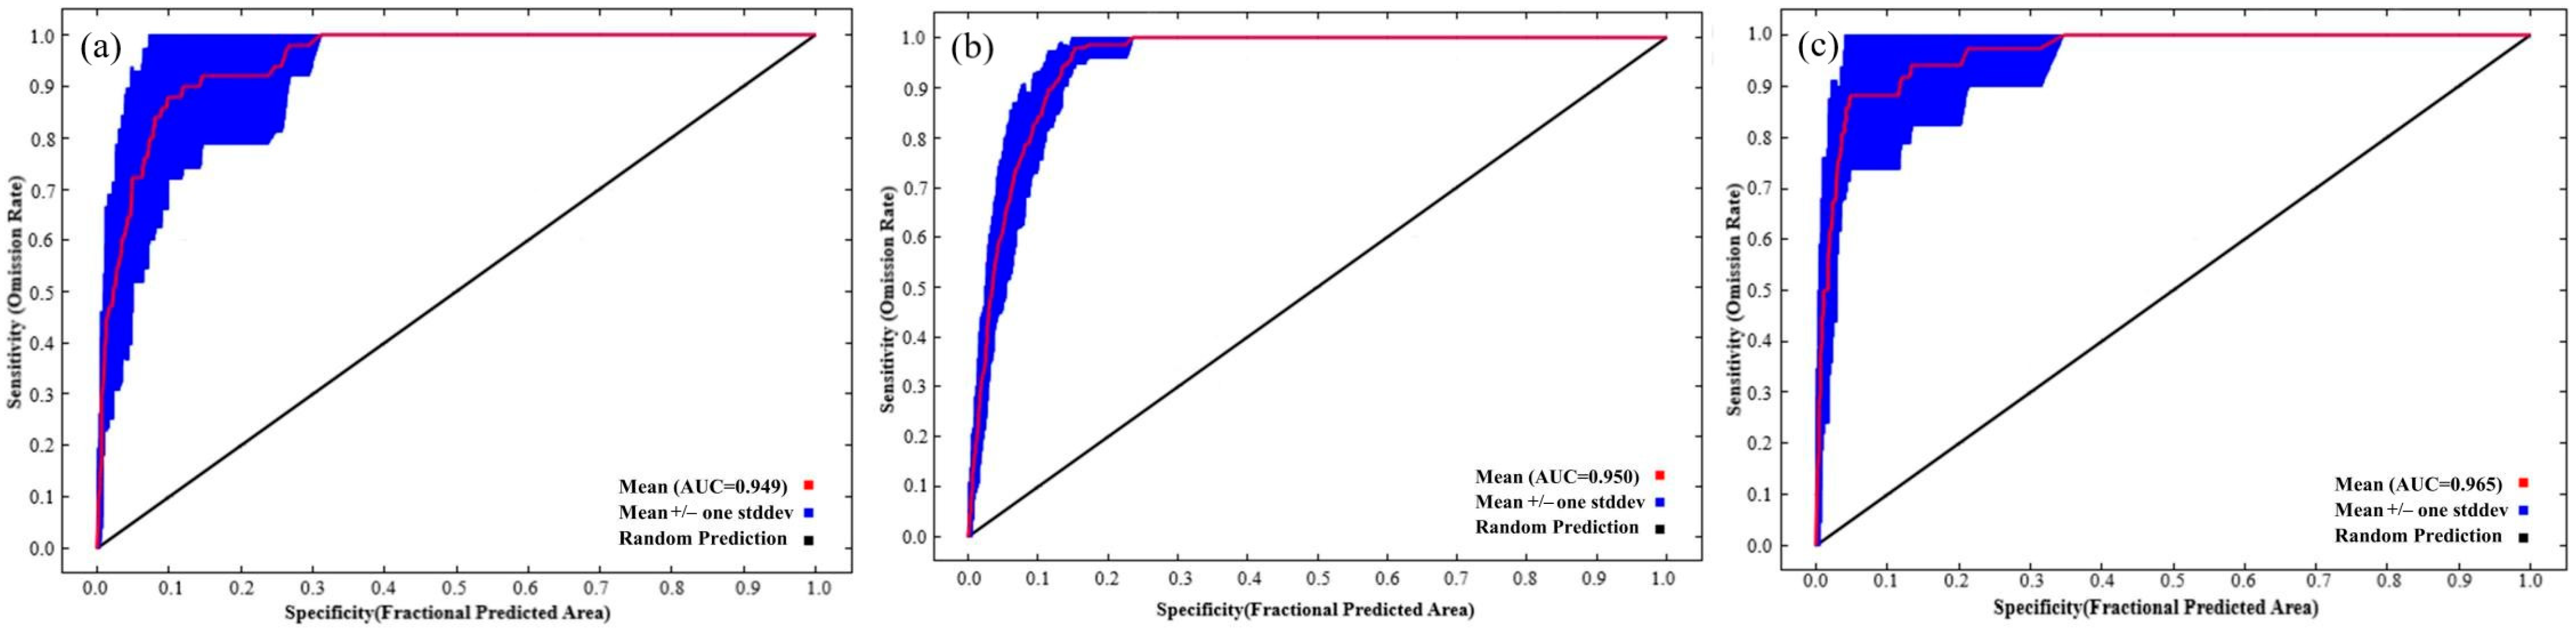
The AUCs obtained after a ten-fold cross-validation based on MaxEnt were used to confirm the model accuracy. Therefore, under the current climate pattern, the average AUC training values obtained by the 10-fold simulations of suitable habitat distribution models for Larix potaninii Batalin, Larix griffithii, and Larix speciosa were 0.962 ± 0.011, 0.966 ± 0.021 and 0.977 ± 0.020 respectively, while the average AUC test values were 0.949 ± 0.012, 0.950 ± 0.041 and 0.965 ± 0.028, respectively (Figure 2). These results suggested that the MaxEnt model achieved excellent simulation performance, which could accurately and stably predict the suitable habitats of Larix potaninii Batalin, Larix griffithii and Larix speciosa.
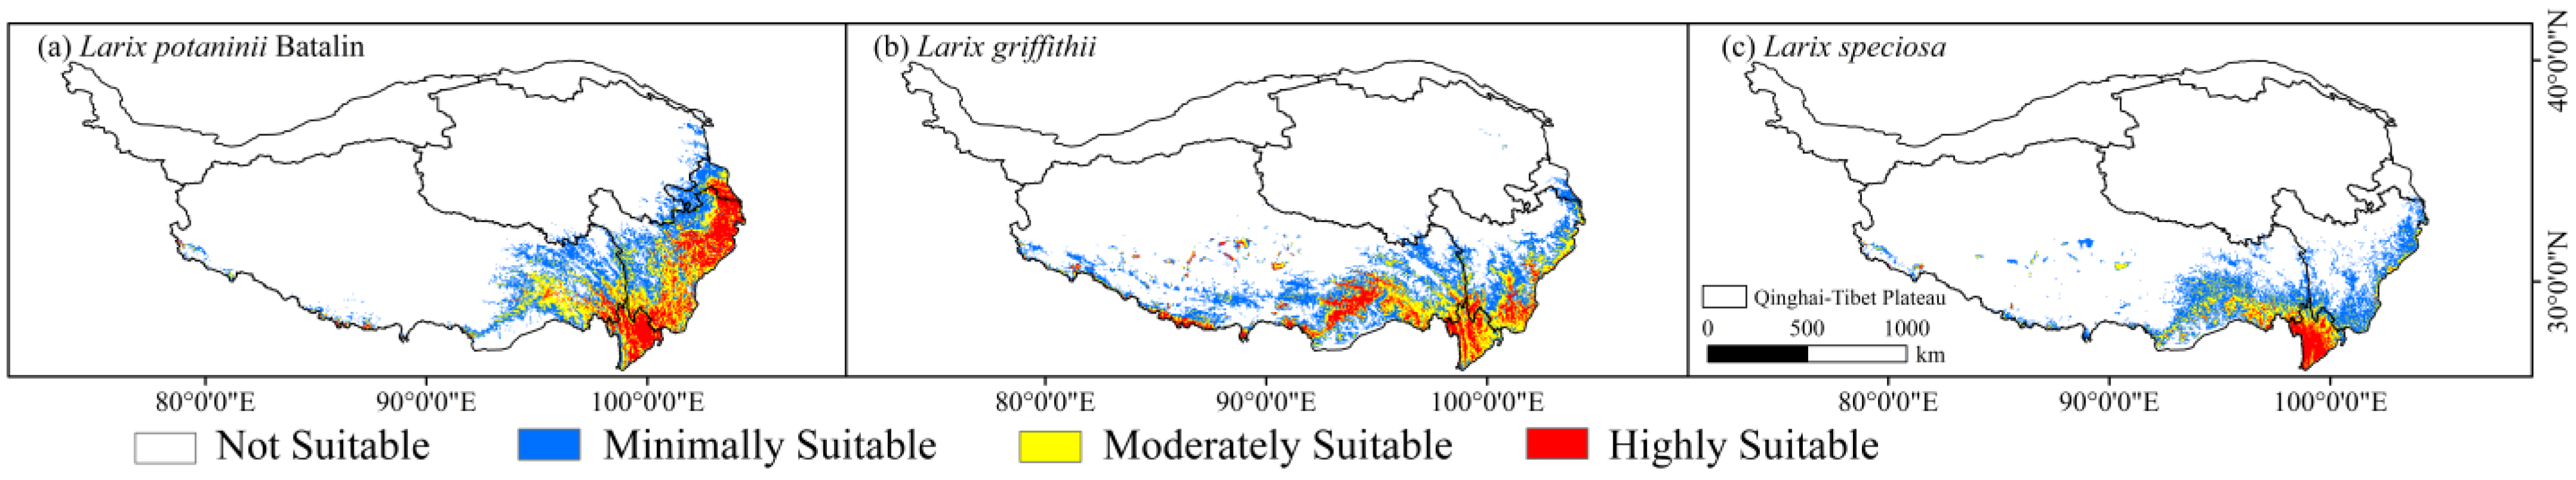
We utilized the natural breaks (Jenks) method as the criteria for categorizing suitability (Table 2). According to the suitable habitat division obtained by the MaxEnt model (Figure 3), the suitable areas of Larix potaninii Batalin were mainly distributed in the southeastern QTP, namely, Sichuan, Yunnan, Gansu, and southeast of Tibet, with sparse distribution in Qinghai, and the cover area was approximately 42.16 × 10⁴ km2 (about 16.39% of QTP). The highly suitable areas were mainly concentrated in the Yunnan, Sichuan, and southeast of Gansu, with a sparse distribution in the southeast of Tibet, and the area was 10.50 × 10⁴ km2 (4.08% of QTP). The suitable areas of Larix griffithii were mainly located in the south of QTP, including Yunnan, Tibet, Sichuan and southeast of Gansu, with a sparse distribution in Qinghai, and the total area was 41.51 × 10⁴ km2 (16.14% of QTP). The highly suitable areas concentrated in Yunnan, Sichuan and the south of Tibet, with the cover area of 7.43 × 10⁴ km2 (2.89% of QTP). Meanwhile, the suitable areas of the Larix speciosea were mainly distributed in Yunnan, Sichuan and southeast of Tibet, with a sparse distribution in southeast Gansu, and the total area was 25.07 × 10⁴ km2 (9.75% of QTP). The highly suitable areas were mainly focused in Yunnan and Tibet, with a sparse distribution in Sichuan, and the cover area was 2.86 × 10⁴ km2 (1.11% of QTP) (Table 3).
3.2. Relationship between Current Potential Distribution and Major Environmental Variables
To determine the important environmental variables of Larix potaninii Batalin (154 effective distribution points), Larix griffithii (52 effective distribution points) and Larix speciosa (39 effective distribution points), the Jackknife method was utilized to test the average contribution rate of each parameter. Based on our results, the most important variables affecting Larix potaninii Batalin distribution were Annual Precipitation (65.3%) among the precipitation variables, Min Temperature of Coldest Month (9.3%) among the temperature variables, Topsoil Sodicity (ESP) (5.5%) and Subsoil Reference Bulk Density (2.3%) among the soil variables, whereas Elevation (2.0%) among the landform variable. Apparently, Temperature Annual Range (73.1%) made the greatest contribution to Larix griffithii, followed by Topsoil Gravel Content (4.7%) and Precipitation of Driest Quarter (3.3%). Meanwhile, the most important variable influencing Larix speciosa distribution was Temperature Annual Range (45.6%), followed by Precipitation of Driest Month (29.0%) and Topsoil Sodicity (ESP) (5.6%). In addition, the cumulative contribution rate of these parameters to each species reached 90% and even higher.
To intuitively illuminate the influence of each factor on the geographical distribution pattern of species suitable habitat, the MaxEnt model provides the response curve between environmental factors and distribution probability (Figure S2). When the distribution probability was greater than MTSPS, the values of environmental factors were suitable for plant growth [42]. Therefore, the environmental factors suitable for species distribution were classified using MTSPS as the threshold, aiming to obtain the optimal range of each species, as listed in Table 1. Consistent with the contributions from environmental factors to the Larix potaninii Batalin distribution, the Min Temperature of Coldest Month was −18.77–5.60 °C, Annual Precipitation was 574.30–1701.40 °C, Elevation was <4587 m, Topsoil Sodicity (ESP) was −0.02–2.87%, and the Subsoil Reference Bulk Density was ≤1.64 or ≥1.67 kg/dm3. Precipitation of Driest Quarter exhibited strong linearity with the habitat distribution of Larix griffithii, and Temperature Annual Range was 20.25–30.59 °C, Precipitation of Driest Quarter was ≥6.48 mm, and Topsoil Gravel Content was <8.43% or >17.95. Based on the contribution to Larix speciosa distribution, Temperature Annual Range was 20.12– 28.29 °C, Precipitation of Driest Month was >5.48 mm, and Topsoil Sodicity (ESP) was 0.12–2.30%.
3.3. Future Changes in Potentially Suitable Areas
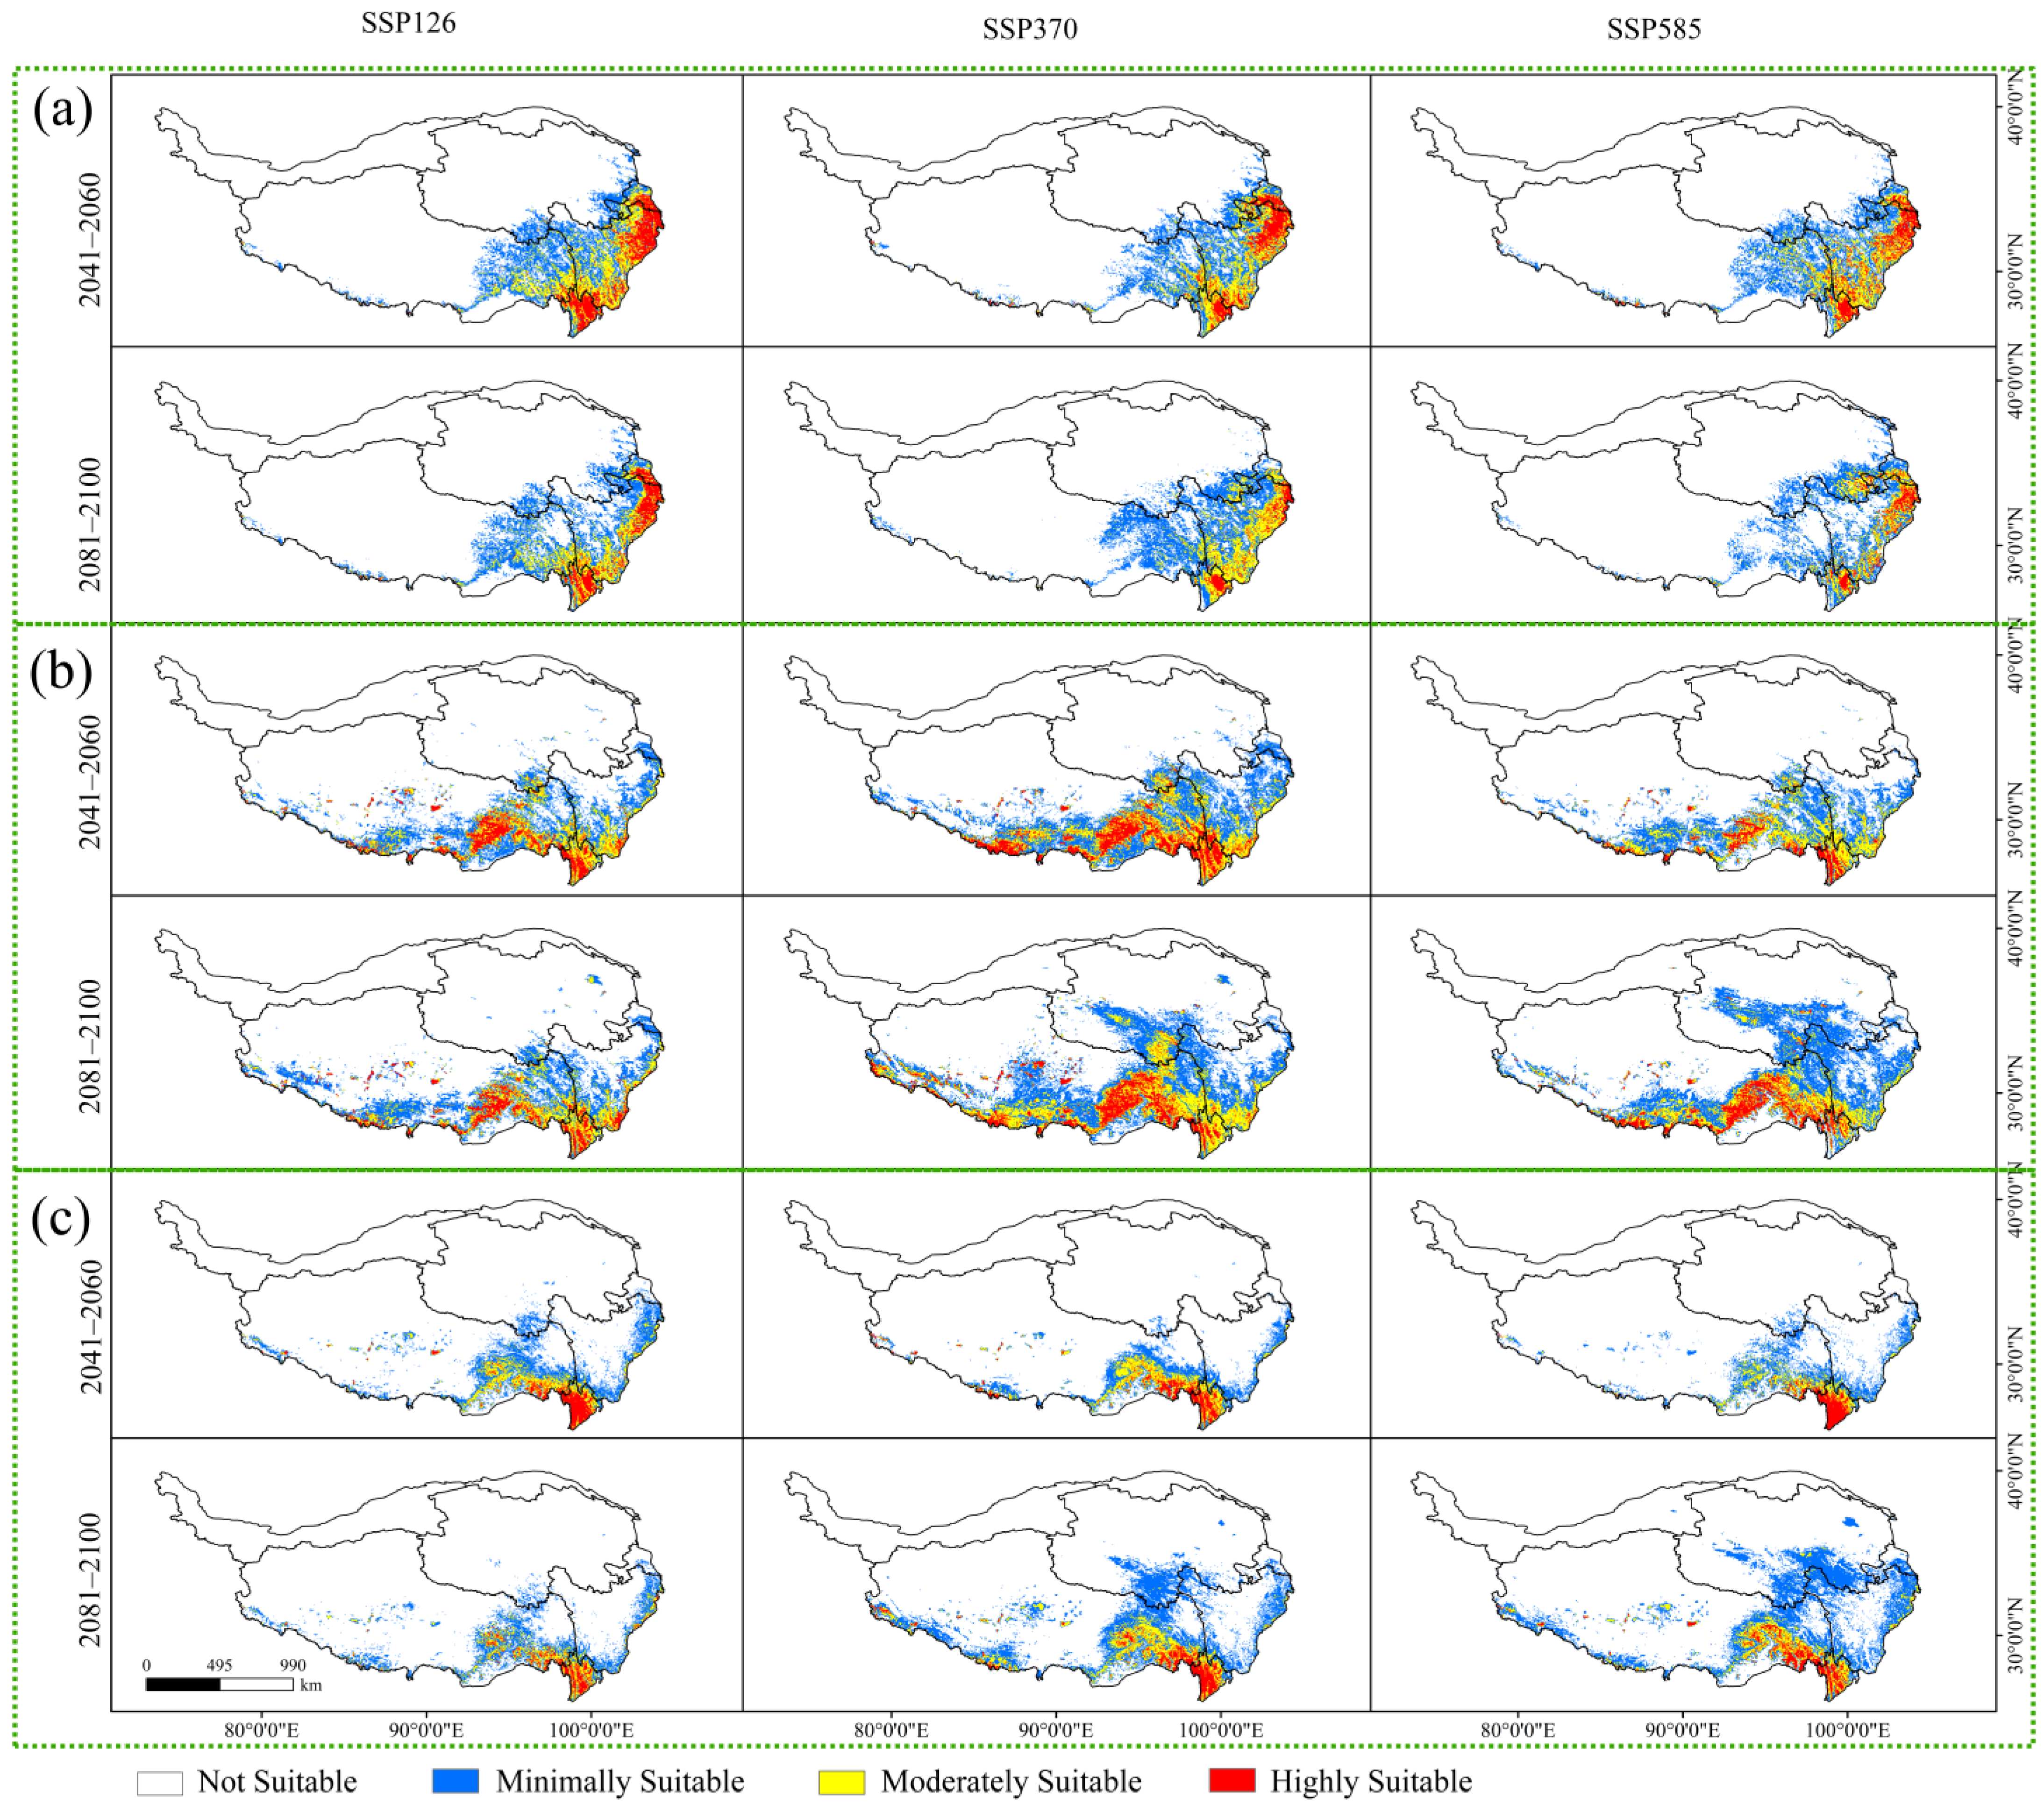
Three SSPs were adopted for the model construction and prediction under the future climate scenarios, and the results (Figure 4) were compared with the current climate scenarios, aiming to determine the changes in spatial distributions (Figure 5).
Table 4 lists the suitable areas and the proportion of the three Larix on the QTP under different climate scenarios. Under the 2081–2100 SSP126 climate scenario, the suitable area of Larix potaninii Batalin is 47.51 × 10⁴ km2 (accounting for 18.47% of the QTP), and the distribution range increases compared with that of Qinghai Province. The suitable area of Larix griffithii is 78.76 × 10⁴ km2 (30.62% of QTP), and the distribution range increases significantly on the whole, especially in Tibet and Qinghai Province. under the SSP370 scenario from 2081 to 2100, the suitable area of Larix speciosa is about 51.23 × 10⁴ km2, accounting for 19.92% of the QTP. At this time, the distribution range increases significantly compared with that of the eastern and southern parts of Tibet and Qinghai Province under the SSP585 scenario.
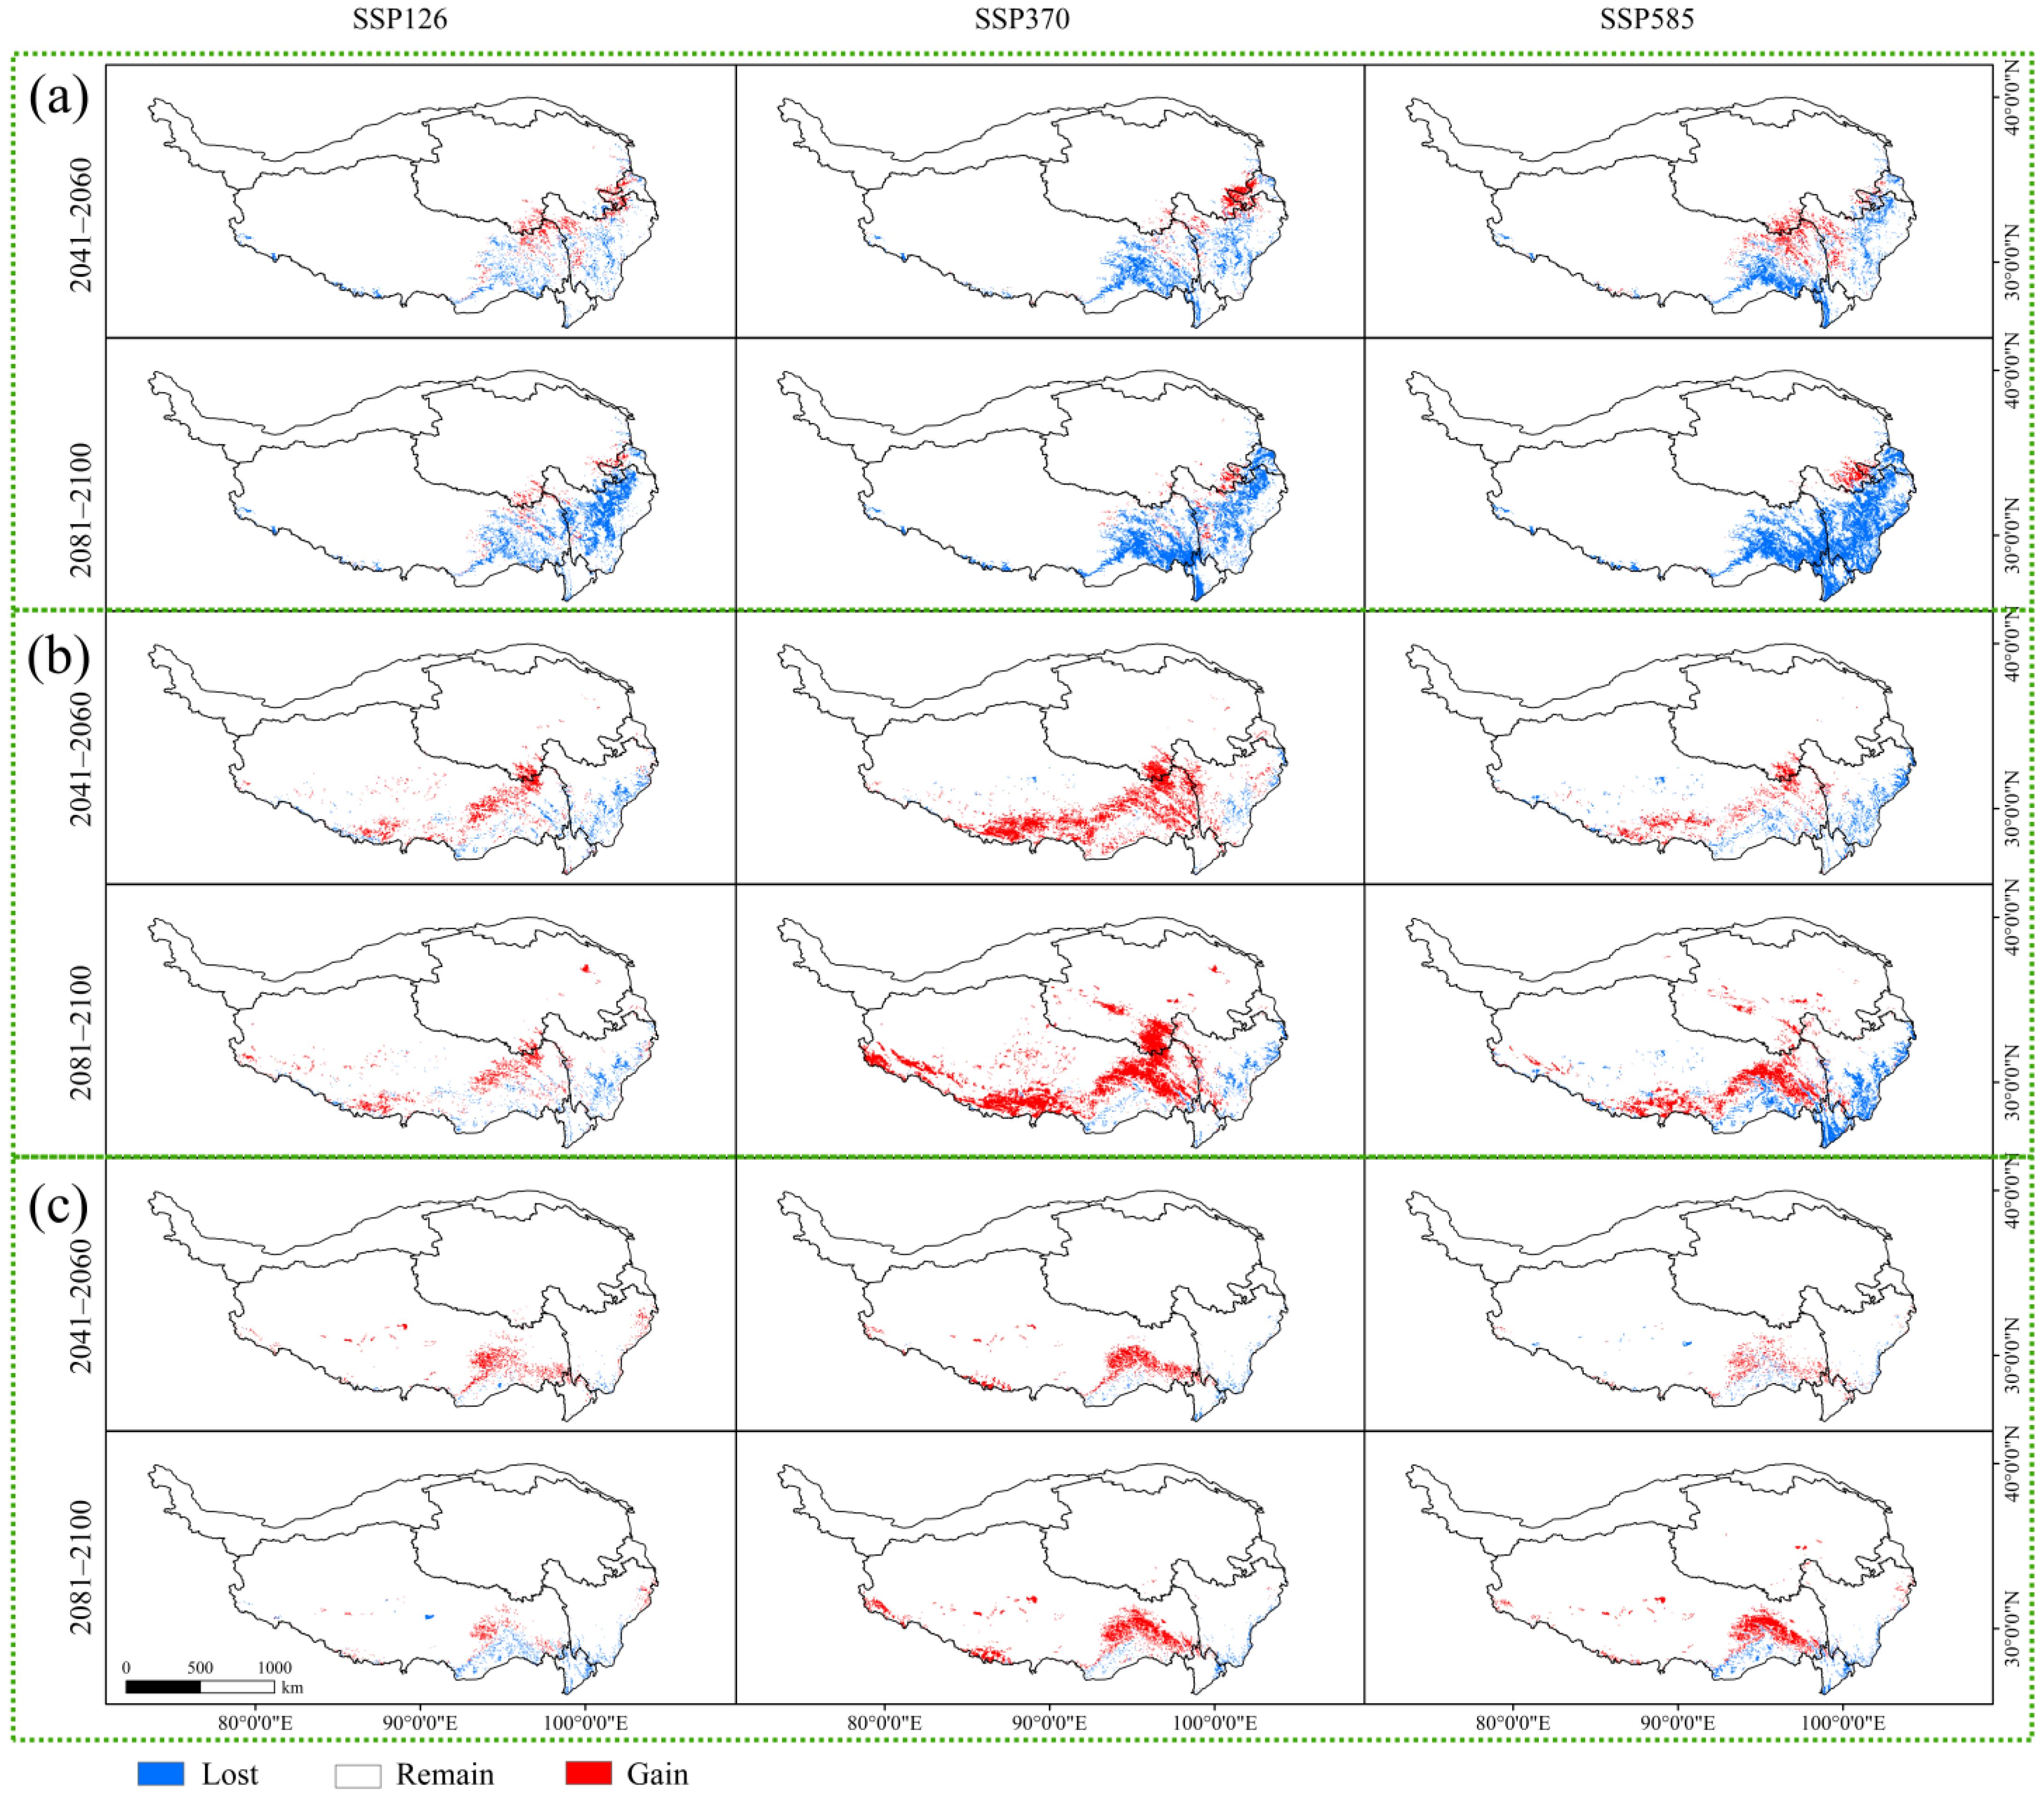
As displayed in Table 5, the suitable habitat area for Larix potaninii Batalin showed a loss trend, and for Larix griffithii exhibited a gain trend except for the 2041–2060 SSP585 scenario. The suitable habitat area for the Larix speciosa was not significantly changed, with that under the 2081–2100 SSP126 scenario displaying a mild loss trend, and that under the other future climate scenarios presenting a mild gain trend. To the end of the 21st century, the suitable area for Larix potaninii Batalin will show the greatest change, which will be reduced by 24.66 × 10⁴ km2 (9.59% of QTP) under the 2081–2100 SSP585 scenario, while the suitable area for Larix griffithii will show the most increase, which will increase by 22.25 × 10⁴ km2 (8.65% of QTP) under the 2081–2100 SSP370 scenario.
3.4. Changes in the Geometric Center of Suitable Areas under Future Climate Changes
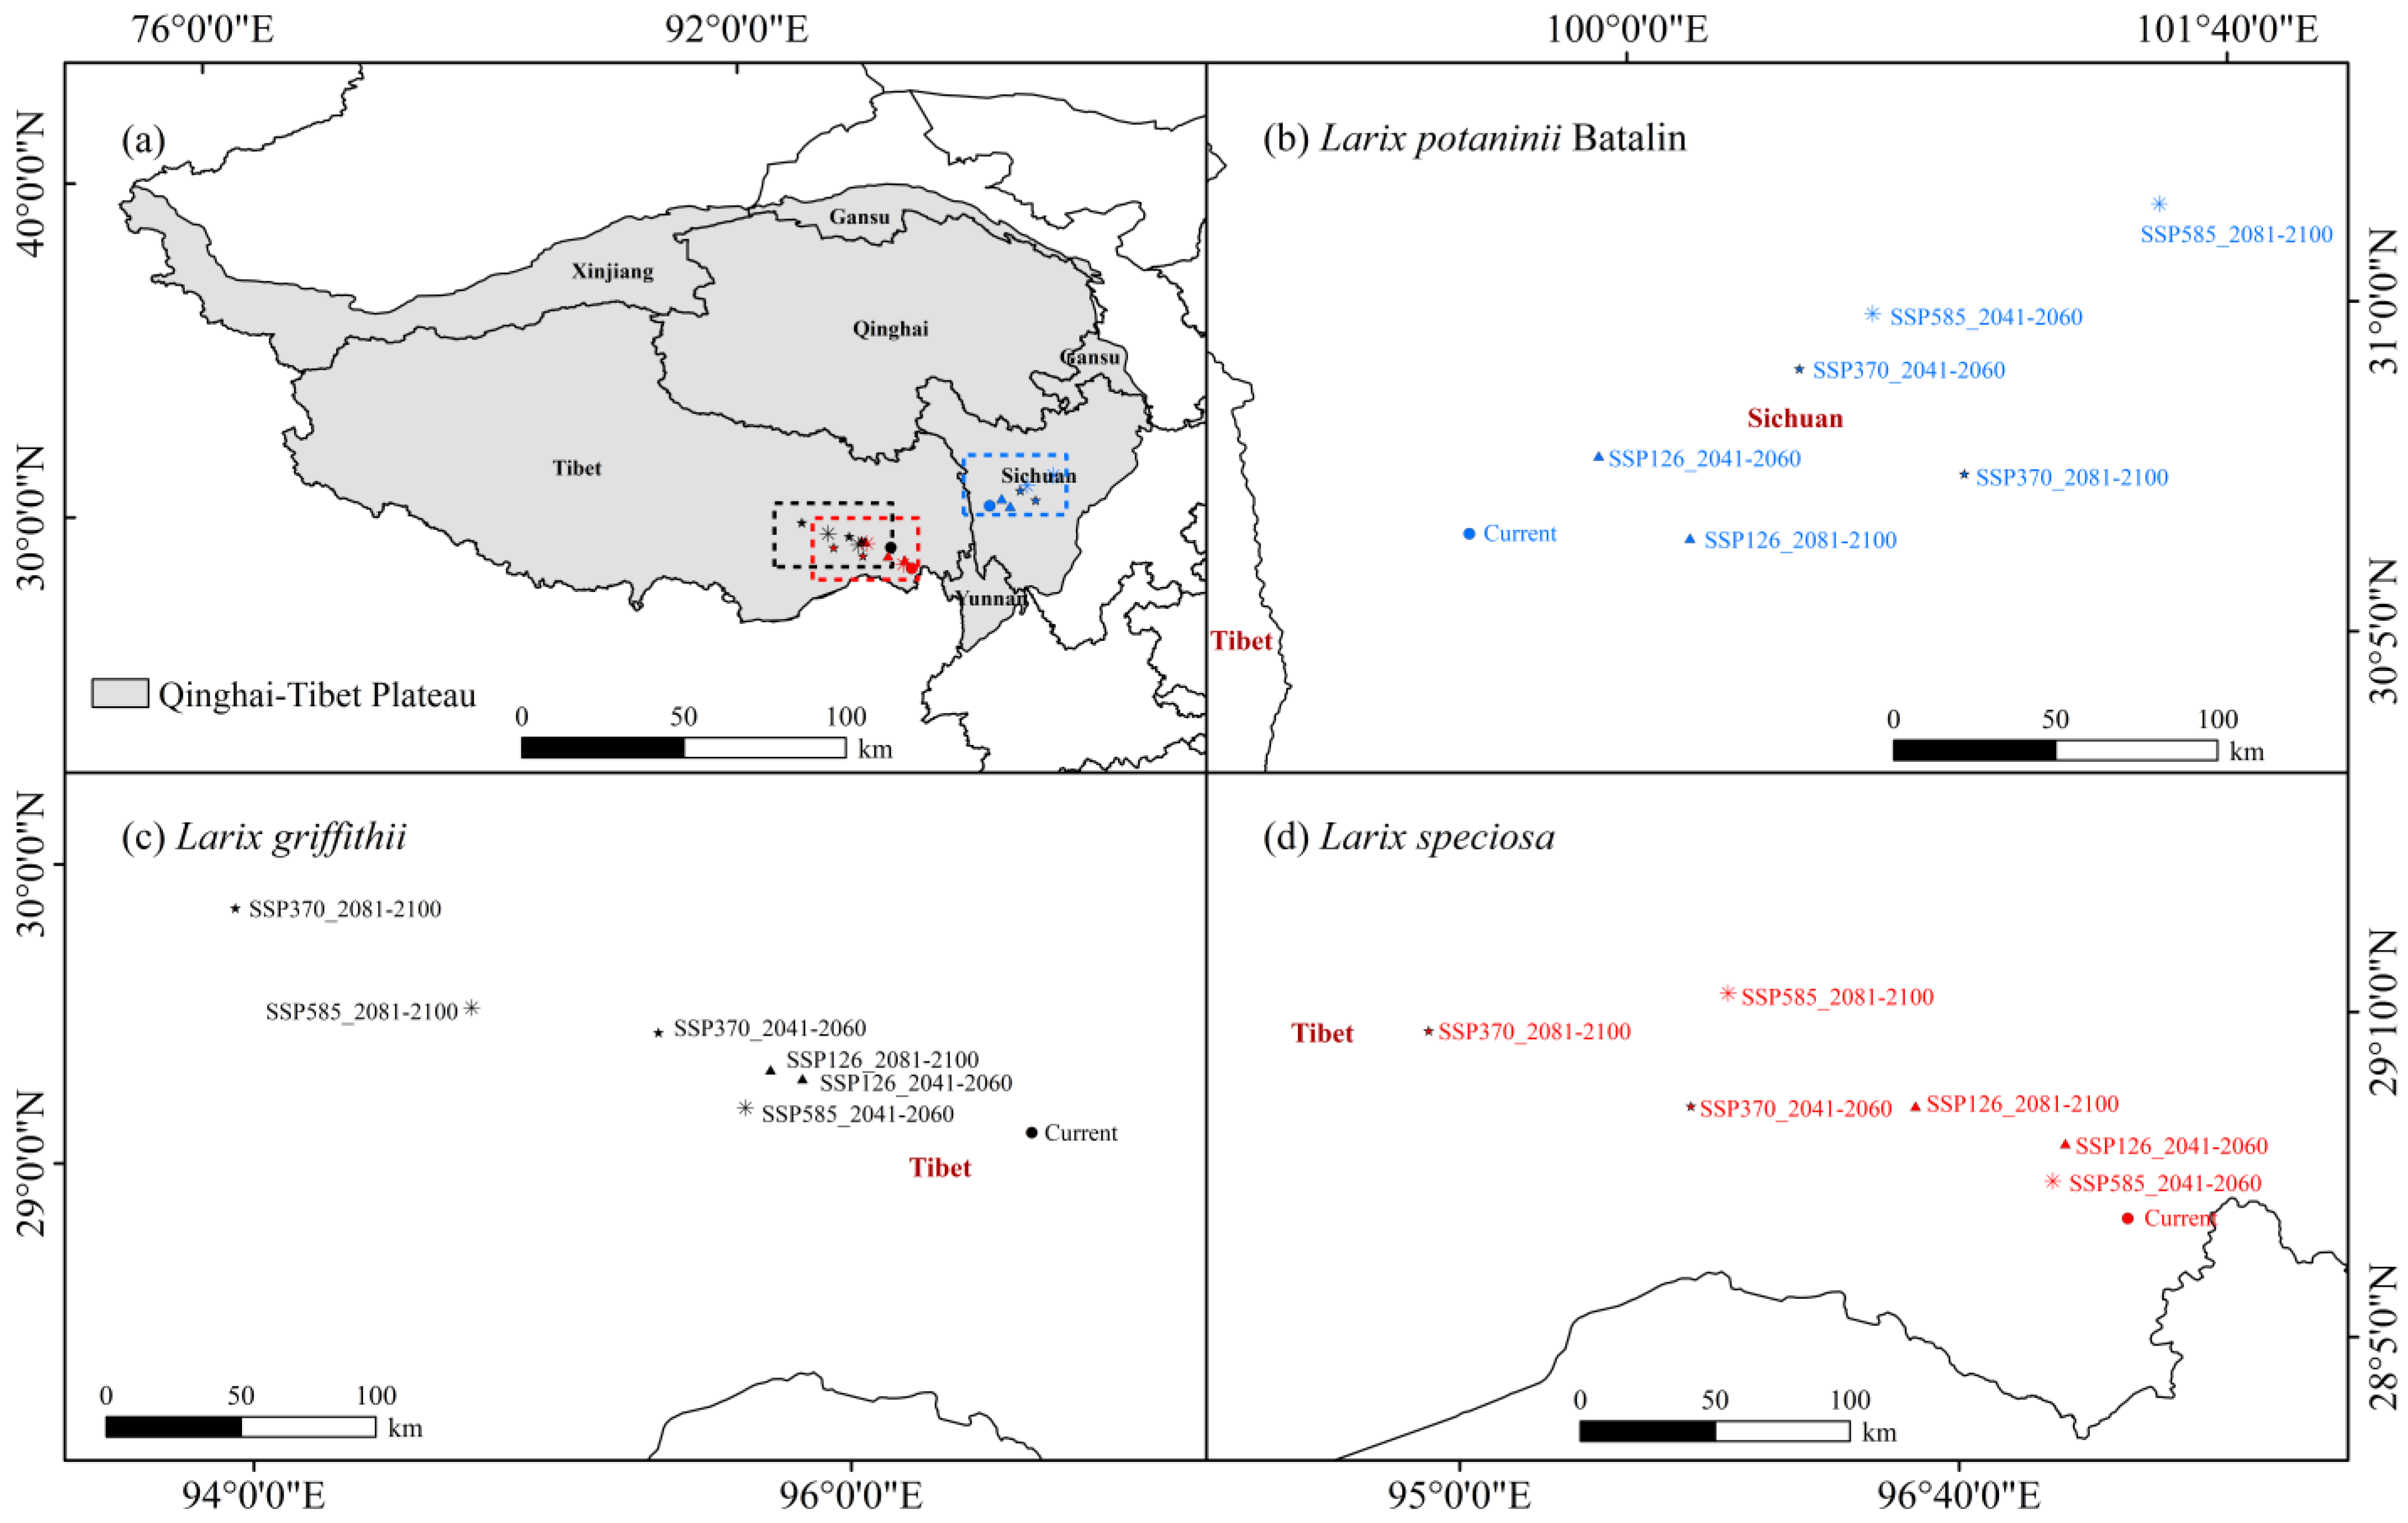
Using the ArcGIS 10.8 software, the grid geometric centers of Larix potaninii Batalin, Larix griffithii, and Larix speciosa were calculated to represent the changes of overall spatial patterns of the potentially suitable habitats in the current and future different periods and under different climate scenarios (Figure 6). The centroid of the currently suitable climate habitat for Larix potaninii Batalin (99.56° E, 30.35° N) was in the northwest of Sichuan. Under the SSP126 and SSP370 future scenarios, the centroid of suitable habit first migrated towards the northeast, and then towards the southwest. Under the three future scenarios, the centroid of suitable climate habitat will migrate to the northeast direction on the whole. The most significant trend is observed under the SSP585 future scenario, and the centroid will migrate to (101.48° E, 31.27° N) at the end of the 21st century. The centroids of the currently suitable climate habitats for Larix griffithii and Larix speciosa were (96.60° E, 29.10° N) and (97.23° E, 28.48° N), both located in the east of Tibet. Under the three future climate scenarios, the centroids of suitable climate habitats will migrate towards the northeast direction, and the most obvious trend can be observed under the SSP370 scenario, with the centroids migrating to (93.94° E, 29.85° N) and (94.90° E, 29.10° N) at the end of the 21st century.
3.5. Multivariate Environmental Similarity Surface (MESS) Variable Analysis of Distribution under Future Climate Changes
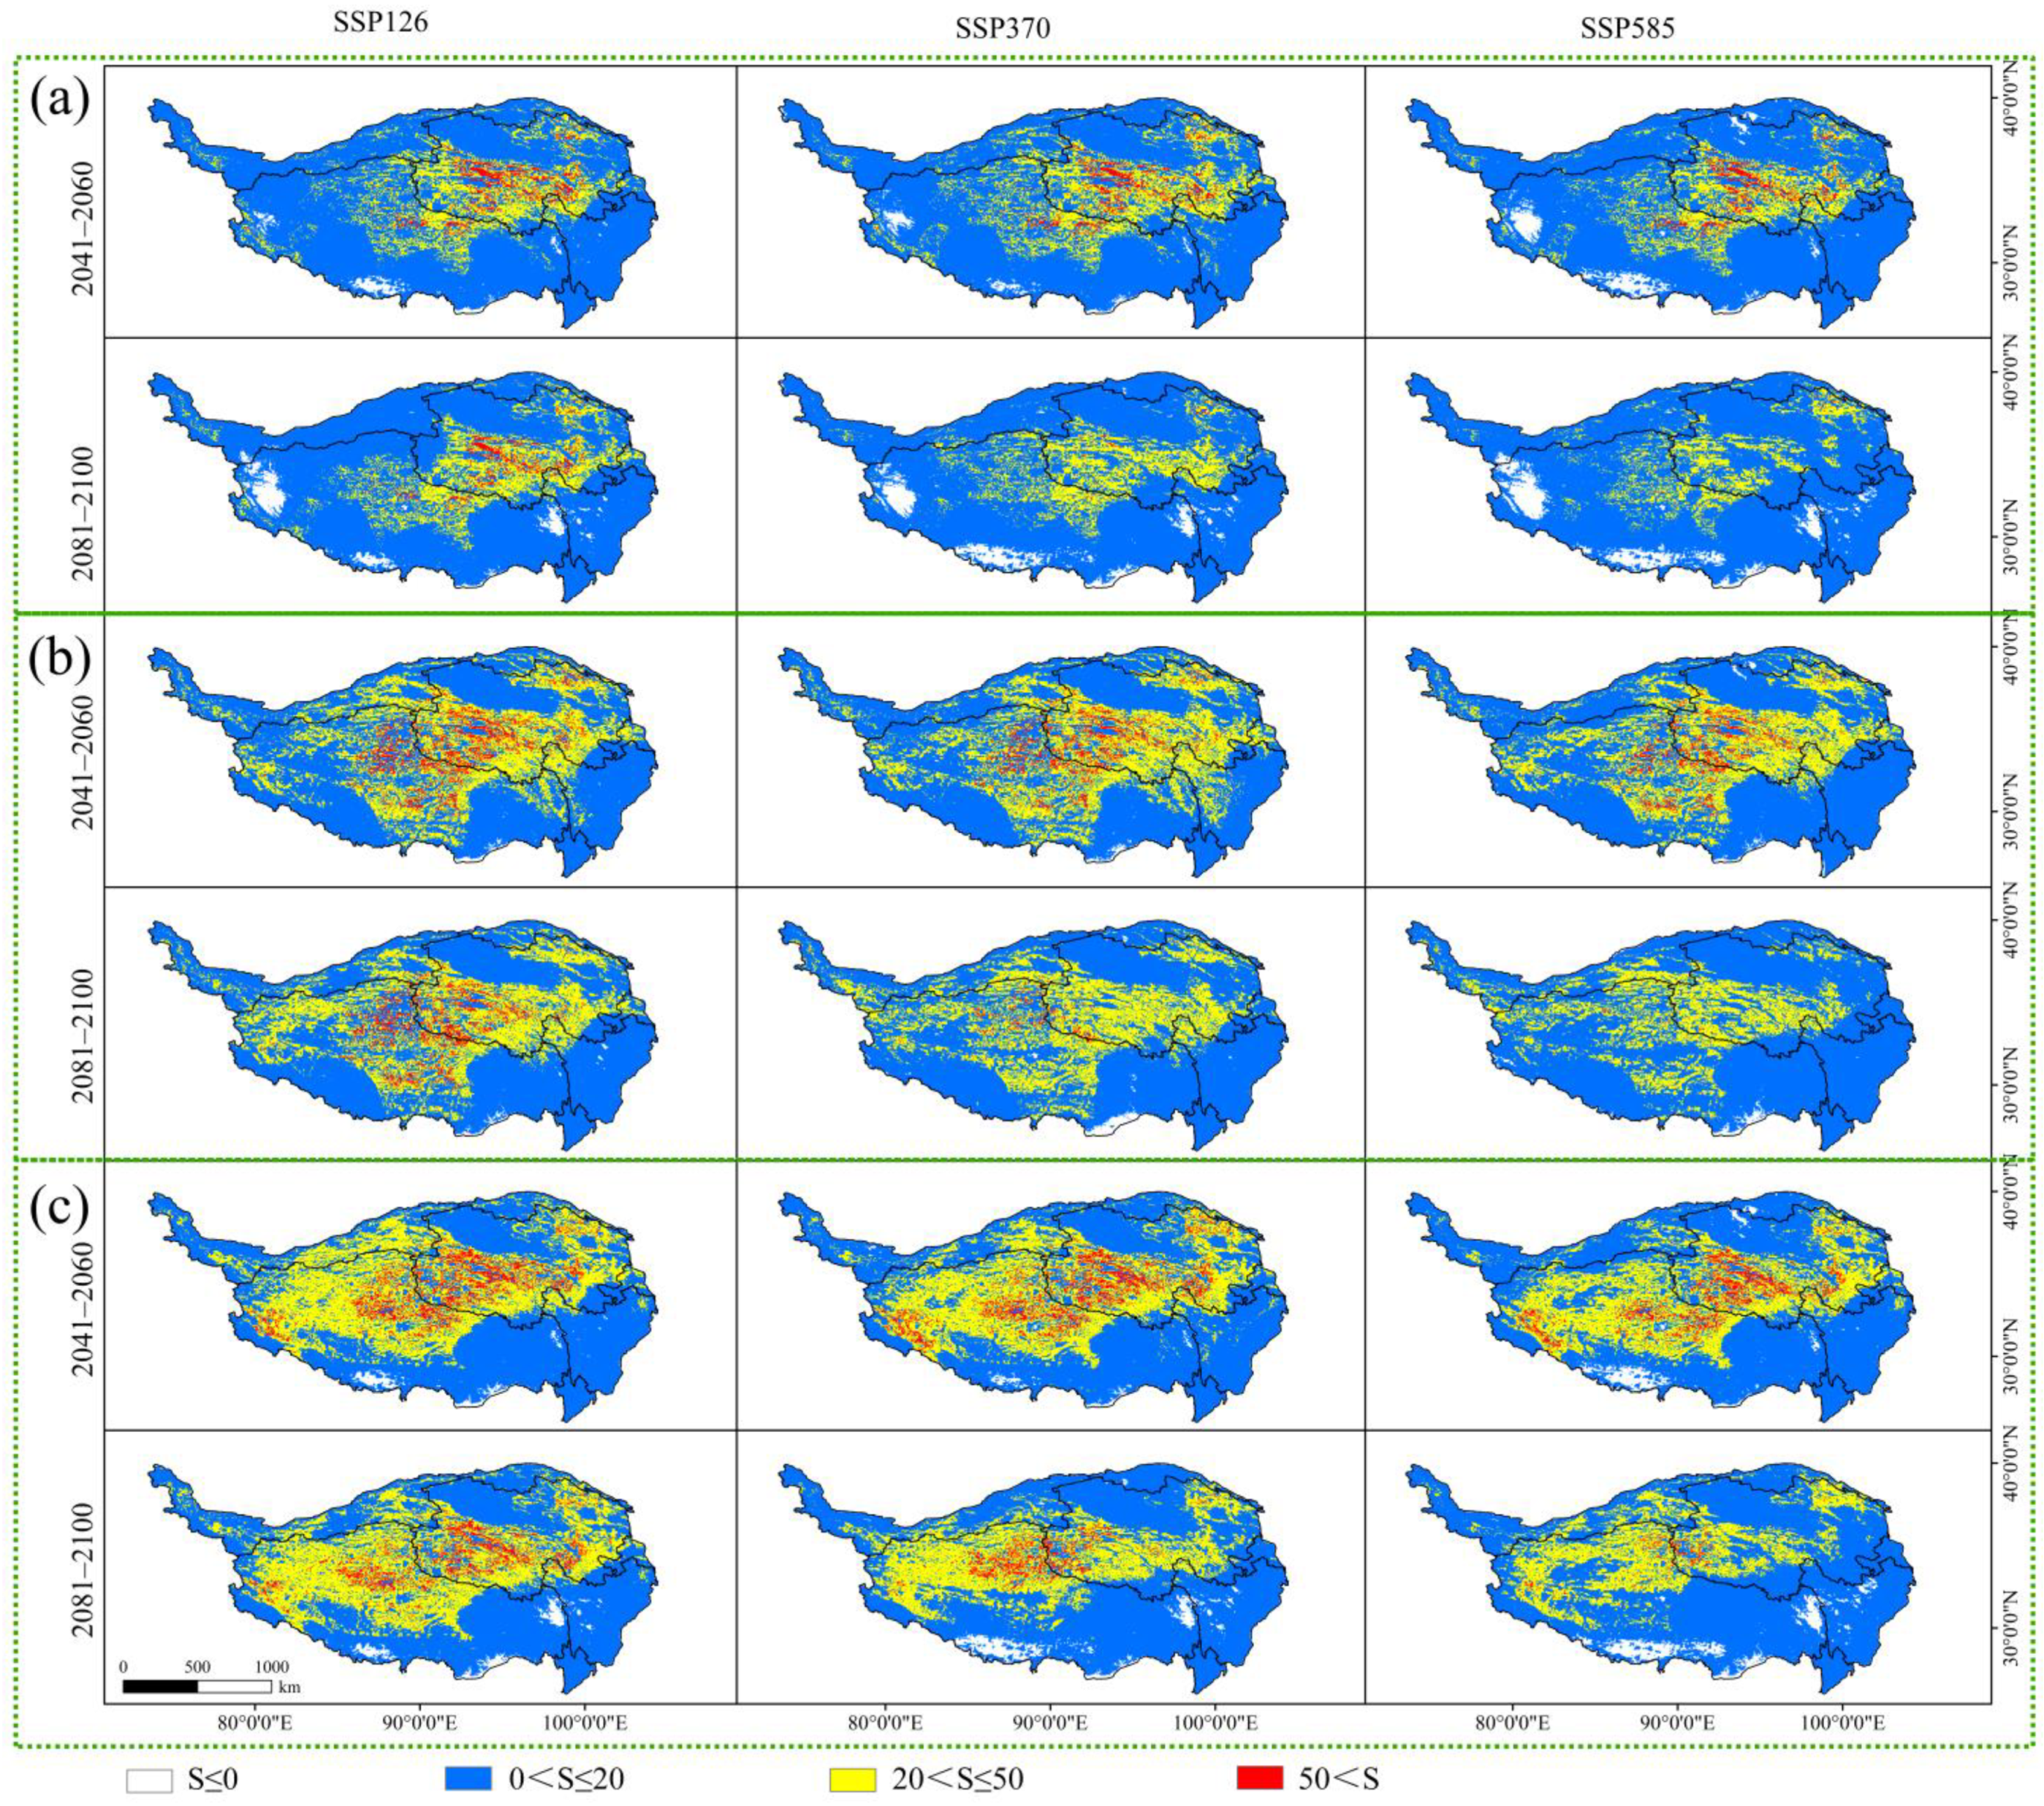
At the end of the 21st century, the average values of MESS for Larix potaninii Batalin under the three future potential climate scenarios (SSP126, SSP370 and SSP585) were 16.39, 14.06 and 11.11, respectively, while those for Larix speciosa were 17.16, 13.97 and 11.94 respectively. The three species exhibited the highest average MESS values and lowest climate anomaly degrees under the SSP126 future climate scenario, whereas the lowest average MESS values and highest climate anomaly degrees under the SSP585 future climate scenario. In different periods and under different future climate scenarios, the MESS of modern distribution points of Larix potaninii Batalin, Larix griffithii, and Larix speciosa is displayed in Figure 7. Clearly, the major abnormal habitats are mainly concentrated in the west, south and east of Tibet, with sparse distribution in Sichuan as well.
This study indicated that under the future potential climate scenarios, the total climate anomaly areas of Larix potaninii Batalin, Larix griffithii and Larix speciosa (S < 0) presented a gain trend with time (Table 6). Under the 2081–2100 SSP585 climate scenario, the greatest climate anomaly area can be observed, apparently greater than those under the other future climate scenarios. However, under the different future climate scenarios, the southeast of QTP, which is the main suitable habitat, is mostly located in the area with an extremely low climate anomaly degree.
3.6. Changes in Distribution Patterns of Overlapping Suitable Areas for Three Main Larix Species on QTP
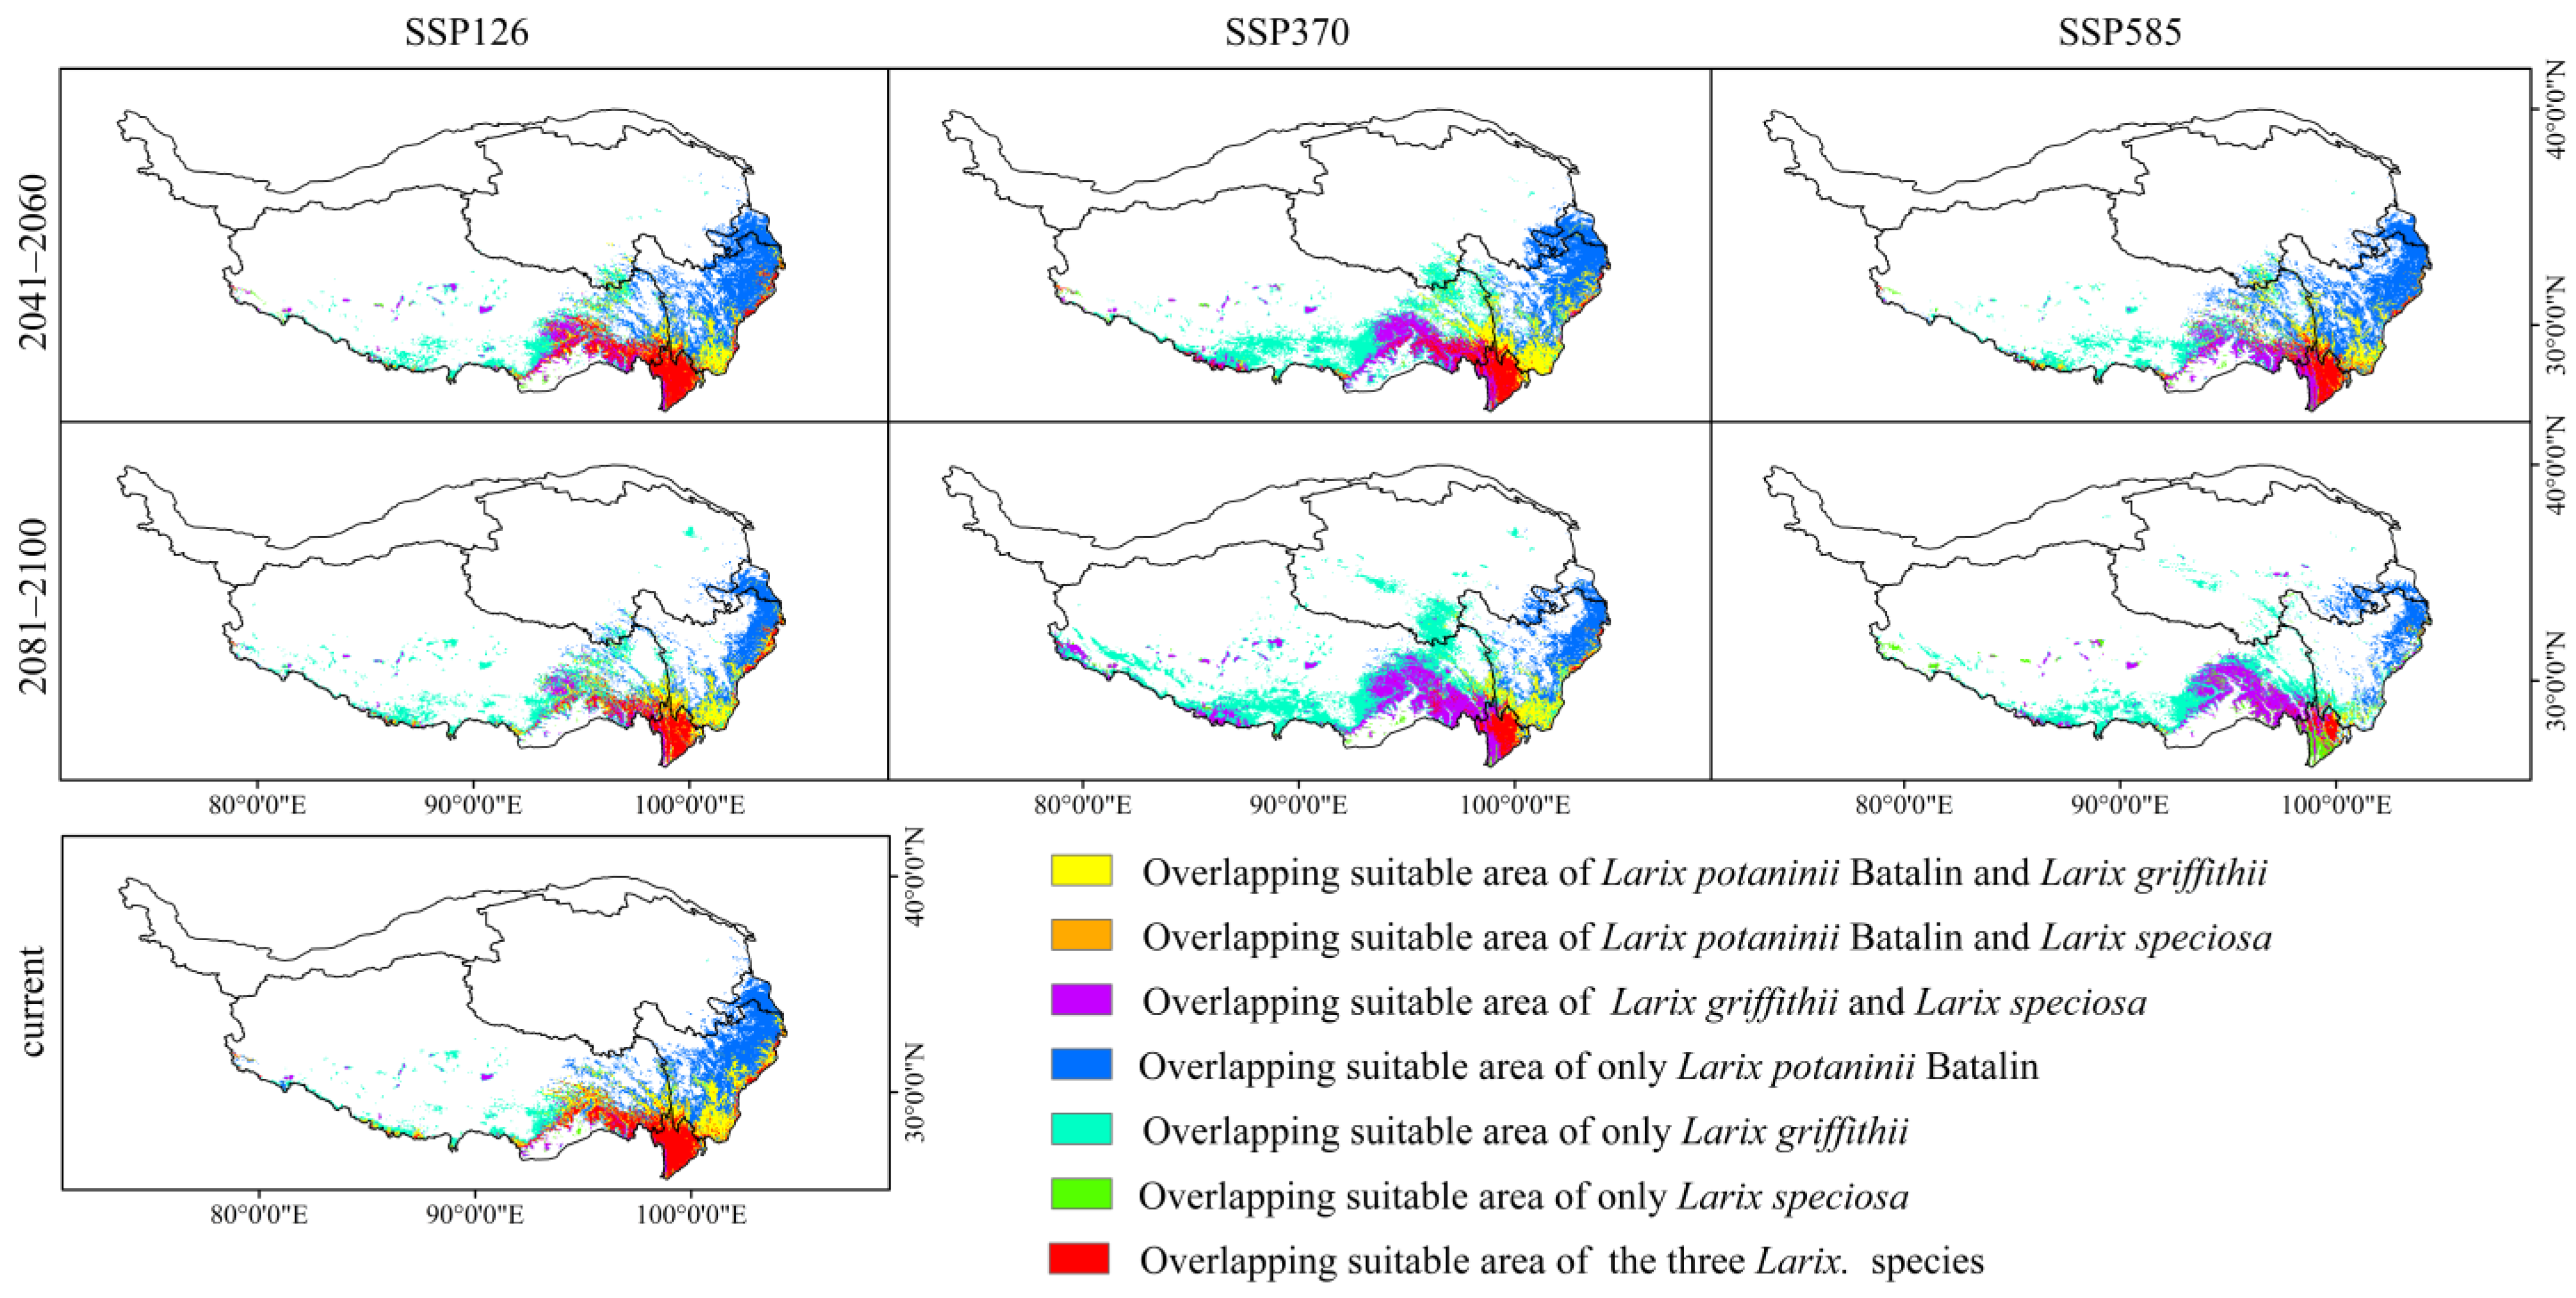
Under the current climate scenarios, the overlapping suitable area of Larix potaninii Batalin, Larix griffithii, and Larix speciosa was 70,050 km2 (2.72% of QTP), mainly distributed in the southeast of the QTP (Figure 8). The overlapping potential suitable area of the three Larix species reduced with the increase in emission concentration in the same period under different climate scenarios. Under the same climate scenario, the overlapping potential suitable area decreased as time went by. In this study, the overlapping potential suitable area of the three Larix species will be the smallest under the 2081–2100 SSP585 scenario, which is approximately 2.83 × 10⁴ km2 (1.10% of QTP), while in 2041–2060, the overlapping potential suitable area of the three Larix species will be the greatest under the SSP126 scenario, which is around 7.01 × 10⁴ km2 (2.72% of QTP). Under the moderate emission path SSP370, the overlapping potential suitable area of the three Larix species will be approximately 7.19 × 10⁴ km2 (2.80% of QTP) during 2041–2060, while it is 4.83 × 10⁴ km2 (1.88% of QTP) during 2081–2100. Under the 2041– 2060 SSP585 scenario, the overlapping potential suitable area of three Larix species will be 5.22 × 10⁴ km2 (2.03% of QTP). To the end of the 21st century, the overlapping potential suitable area of the three Larix species will be 4.02 × 10⁴ km2 (1.56% of QTP) under the SSP126 scenario.
4. Discussion
4.1. Main Environment Variables Affecting the Suitable Areas
Cupressaceae and Pinaceae plants in the QTP area are extremely sensitive to climate change; particularly, Larix species have the most sensitive response to climate factors [20,31]. The less precipitation from October of the last year to March of that year may suppress the growth of Larix potaninii Batalin, while the average minimum temperature will stimulate the growth of Larix potaninii Batalin [20]. Temperature, especially the maximum temperature, is the major meteorological factor which can restrict the growth of Larix griffithii, and precipitation from March to May and in August will significantly influence the growth of Larix griffithii [49]. The growth of Larix speciosa is mainly, significantly, and positively correlated with the average temperature from August to September [50]. This study adopted correlation analysis and the Jackknife test to determine the key environmental factors affecting the distributions of Larix potaninii Batalin, Larix griffithii, and Larix speciosa [24,51]. The average AUC test values of the MaxEnt model were 0.9495, 0.9491 and 0.9651, respectively, suggesting that this method was reliable for the evaluation of ecological suitability of three Larix species.
The three Larix species exhibited responses to the environmental factors in varying degrees. Based on our prediction results, Annual Precipitation and Min Temperature of Coldest Month made the greatest contributions to Larix potaninii Batalin, and the pooled contribution rate of these two temperature factors was 74.6%. Similarly, environmental factors with greater impact on the Larix griffithii distribution mainly included Temperature Annual Range and Mean Temperature of Driest Quarter. In addition, Temperature Annual Range and Precipitation of Driest Month were the major environmental factors affecting the prediction of Larix speciosa distribution. The results are consistent with previous research results on different Larix. plants at the small scale, and the results are greatly susceptible to temperature and precipitation [52,53]. The altitude ELE was also an important factor influencing Larix potaninii Batalin growth. Temperature and precipitation in a high-altitude area may decrease, which is not beneficial for Larix potaninii Batalin growth. Therefore, for Larix potaninii Batalin, the most suitable altitude should be lower than 4587 m, and such a result is reliable. Altitude and climate factors affect soil nutrients and their utilization rate to a certain degree. As a result, Topsoil Sodicity (ESP) and Subsoil Reference Bulk Density partially affected the prediction of distributions of three Larix species. The above findings conform to previous research results, that is to say, bioclimate factors, landform factors and soil factors affect the species distribution in the QTP area by varying degrees [54,55].
Based on the average MESS values, the future climate under the 2081– 2100 SSP585 scenario will be abnormal, while the degree of climate anomaly under the SSP126 future climate scenario will be the lowest. However, the distribution of Larix potaninii Batalin, Larix griffithii, and Larix speciosa was dominant in the QTP area of S > 0. The QTP area is mostly associated with high altitude, high-landform heterogeneity and special soil properties, which is comparatively suitable for the survival of Larix potaninii Batalin, Larix griffithii, and Larix speciosa. MESS analysis suggested that, compared with the current climate conditions, the future climate anomaly area is enlarging, and the habitat suitability will decrease generally, further demonstrating that the distribution of Larix potaninii Batalin, Larix griffithii, and Larix speciosa is strongly susceptible to climate change.
4.2. Change of the Distribution Areas under Future Climate Changes
Previous research suggested that the greatest distribution area of Larix. in China is in the western Sichuan-northeastern Yunnan-southeastern Tibet area. Our result is highly consistent with the suitable habitat distribution area of Larix potaninii Batalin, Larix griffithii, and Larix speciosa in the previous study [13]. The suitable habitat areas show obvious radial distribution. The highly suitable areas of Larix potaninii Batalin and Larix griffithii are mainly concentrated in the south and east of the QTP, where the environmental conditions of the river basin and high-altitude mountain area were extremely suitable for their growth [21,30], while the highly suitable area of Larix speciosa was mostly distributed in the river basin in the southeast of the QTP [30,52].
In this study, the potential geographical distribution patterns of Larix potaninii Batalin, Larix griffithii, and Larix speciosa under three different future climate scenarios (SSP126, SSP370 and SSP585) during two periods of 2041–2060 and 2081–2100 were predicted. Under the background of global climate warming [39,56], the growth of partial plants in the QTP area is suppressed, and their habitat is shrinking [7,8]. Our results indicated that the suitable habitat area of Larix potaninii Batalin will present a loss trend. To the end of this century, the suitable habitat area of Larix potaninii Batalin will be the greatest, which will lower by 24.66 × 10⁴ km2 under the SSP585 future climate scenario, while the gain area will be only 1.39 × 10⁴ km2, lower than the lost area, and the lost area will be mainly located in the south of Tibet. The south of Tibet will change from the currently suitable area to an unsuitable area, suggesting that under the future climate change scenarios, some areas in China will be unsuitable for Larix potaninii Batalin distribution. Under the 2081–2100 SSP585 scenario, the temperature will increase with the increasing emission concentrations and the range of suitable habitat will further decrease. Some research has generated similar prediction results; for instance, under the SSP585 scenario, the lost area of Pteroceltis tatarinowii is far greater than the gain area [9,57]. Apparently, the suitable area for Larix griffithii exhibits the greatest increase. Under the 2081–2100 SSP370 scenario, the gain area is 22.25 × 10⁴ km2, while the lost area is 2.71 × 10⁴ km2, with apparently greater gain area than the lost area. The gain area of the suitable habitat mainly concentrates in Tibet and the east and south of Qinghai. Given the future climate scenarios, it can be considered that the moderate emission path SSP370 is more suitable for Larix griffithii growth. Some research indicates that, under the SSP370 future climate scenario, the suitable area of Picea purpurea is the maximum [58]. Nevertheless, the habitat area of Larix speciosa is not significantly changed, consistent with the results obtained by Teng et al. on Abies and Abies forrestii based on the MaxEnt model [14].
Under the background of future global warming, plants will migrate to high-latitude and high-altitude areas [59]. Under the SSP126 and SSP370 future scenarios, the centroid of a suitable area for Larix potaninii Batalin will first migrate in a northeastern direction and then in a southwestern direction. Under the three future climate scenarios, the centroid of the suitable climate habitat exhibits a trend of migrating in a northeastern direction on the whole, with the SSP585 future climate scenario presenting the most significant trend. Wang et al. [60] considered that the northward migration of larch trees might be caused by climate warming. Under the three future climate scenarios, the centroids of suitable habitats for Larix griffithii and Larix speciosa exhibit a migration trend in the northwestern direction. Climate warming may induce a wet climate in high-latitude areas and a more arid climate in moderate-latitude areas [61,62]. Therefore, the suitable habitat of Picea purpurea extends to the high-altitude area in the northwestern direction, while the suitable habitat in the south of Tibet decreases partially, consistent with the above-mentioned results [58]. According to our results, the simultaneous migration of Larix potaninii Batalin, Larix griffithii, and Larix speciosa to the high-latitude area is one of the key survival strategies of these species in response to climate change. The findings are highly consistent with previous research results [63,64,65,66]. If the climate continues to warm, the precipitation will decrease gradually [46]. The centroid of a suitable area may migrate to high-latitude and high-altitude areas in a northwestern or northeastern direction, in response to climate change.
Under the future climate scenarios, the predictions of overlapping suitable habitat distributions of the three Larix species in the QTP area suggest that climate change will affect their spatial distribution patterns. With the aggravation in greenhouse gas emission concentrations in the future and with the passage of time, such influences will become increasingly stronger. The possible reason is that, in response to the increasing trend of temperature, the future Larix growth may be encountered with more heat stresses, and thus the plants are more sensitive to climate changes [67]. A mild temperature increment will increase the vapor pressure deficit to aggravate the plant transpiration, while the severe insufficiency of precipitation may suppress the growth and even induce the death of the three Larix species in the QTP area [68].
4.3. Implications
Larix potaninii Batalin, Larix griffithii, and Larix speciosa are the three high-altitude Larix species extensively distributed on the QTP, which represent the typical deciduous coniferous forest population characteristics on the QTP, and their centroids will migrate northward, suggesting that the timberline patterns of larch forests on the QTP will change [13]. Special attention should be focused on the overlapping suitable areas of these three Larix species and the area with a reduced future suitable habitat. Larix potaninii Batalin and Larix speciosa, the drought-tolerant plants, prefer a sunny environment and possess a very small overlapping distribution area, possibly due to the existence of some kind of competitive relationship, to a certain extent [50,69]. In addition, the forest ecological system on the QTP should be improved through the reasonably planning of the protection zone and optimizing the deciduous—coniferous forest species distribution pattern in the QTP area [69]. Our results are of important theoretical and practical significance for predicting the deciduous—coniferous forest species distribution pattern changes under the climate change background. This study predicted the loss and gain of a suitable area for the endangered Larix species, which can provide a reliable foundation to conserve them [70].
Furthermore, our research indicates that, under the global warming background, the overlapping distribution area of three Larix species presents a loss trend. Due to the great diversity of herbaceous plants in the larch forest, the overlapping suitable habitat area of three Larix species decreases, suggesting that the diversity of plant population species will decrease and that the species diversity of the larch forest on the QTP is vulnerable to climate change [34]. Moreover, our research results implied the increase in greenhouse gas concentration may contribute to the niche separation of these species [71,72].
5. Conclusions
To conclude, this study utilized the MaxEnt model to explore the potential geographical distribution patterns of Larix potaninii Batalin, Larix griffithii, and Larix speciosa under future climate scenarios and the major environmental factors affecting their distributions. According to our results, temperature and precipitation were the major environmental factors influencing the potential geographical distribution changes of the three Larix species, especially Annual Precipitation for the Larix potaninii Batalin distribution, and Temperature Annual Range for the Larix griffithii and Larix speciosa distribution. Under the future climate scenarios, the suitable habitat area of Larix potaninii Batalin is predicted to decrease by 11.86–24.66 × 10⁴ km2, and that of Larix griffithii is predicted to increase by 4.77–22.25 × 10⁴ km2, while that of Larix speciosa remains largely unchanged. The gain and lost areas of their suitable habitats are the sensitive areas susceptible to climate change. In order to adapt to future global climate warming, the potential suitable habitat areas of these three Larix species will migrate to the high-altitude and high-latitude areas. With the increasing temperature, the overlapping area of the suitable habitats of these three Larix species will decrease with the increasing future greenhouse gas emission concentration. Moreover, this study implied the influence of climate change on the timberline change of the deciduous—coniferous forest as well as suggested that the niches of these species may step towards separation in the future on the QTP. Furthermore, the precise prediction of the species distribution area is of great significance for protecting endangered Larix. species under different future climate scenarios and for the ecological barrier protection on the QTP and in the upper reaches of the Yangtze River.
Supplementary Materials
The following supporting information can be downloaded at: https://www.mdpi.com/article/10.3390/f14051058/s1, Figure S1. Correlation of 19 climate factors, 3 topography factors and 14 soil factors, Figure S2. Response curves of probability of presence for Larix potaninii Batalin, Larix griffithii and Larix speciosa.
Author Contributions
Conceptualization, X.A. and T.H.; methodology, X.A., J.Y. and B.Z.; software, X.A.; writing—original draft preparation, T.H. and X.A.; writing—review and editing, X.A., J.Y. and B.Z.; visualization, X.A.; supervision, T.H. and H.Z.; funding acquisition, H.Z.; data curation, J.Y. and B.Z.; project administration, H.Z. All authors have read and agreed to the published version of the manuscript.
Funding
This research was funded by the National Science and Technology Major Project for Water Pollution Control and Treatment (No. 2017ZX07101002), and the Fundamental Research Funds for the Central Universities (No. 2020MS041).
Data Availability Statement
All data are reported in this manuscript.
Conflicts of Interest
The authors declare no conflict of interest.
References
- Yang, Y.X.; Hu, Z.Y.; Lu, F.Q.; Cai, Y.; Yu, H.P.; Guo, R.X.; Fu, C.W.; Fan, W.W.; Wu, D. Progress of Recent 60 Years’ Climate Change and Its Environmental Impacts on the Qinghai-Xizang Plateau. Plateau Meteorol. 2022, 41, 1–10. [Google Scholar]
- Li, Y.M.; Wu, D.; Wang, T.; Chen, L.; Zhang, C.B.; Guo, S.L. Late Holocene temperature and precipitation variations in an alpine region of the northeastern Tibetan Plateau and their response to global climate change. Palaeogeogr. Palaeoclimatol. Palaeoecol. 2023, 615, 111442. [Google Scholar] [CrossRef]
- Chang, Y.P.; Ding, Y.J.; Zhang, S.Q.; Qin, J.; Zhao, Q.D. Variations and drivers of evapotranspiration in the Tibetan Plateau during 1982–2015. J. Hydrol. Reg. Stud. 2023, 47, 101366. [Google Scholar] [CrossRef]
- Shen, L.L.; Deng, H.Y.; Zhang, G.L.; Ma, A.Q.; Mo, X.Y. Effect of Climate Change on the Potentially Suitable Distribution Pattern of Castanopsis hystrix Miq. in China. Plants 2023, 12, 12040717. [Google Scholar] [CrossRef]
- Liao, J.F.; Yang, C.Q.; Shao, Q.; Sun, Q.; Han, Y.L. Construction of an ecological model of Sambucus javanica blume in China under different climate scenarios based on maxent model. Plant Ecol. 2023, 224, 221–237. [Google Scholar] [CrossRef]
- Zhang, H.; Song, J.Y.; Zhao, H.X.; Li, M.; Han, W.H. Predicting the Distribution of the Invasive Species Leptocybe invasa: Combining MaxEnt and Geodetector Models. Insects 2021, 12, 92. [Google Scholar] [CrossRef]
- Rong, Z.L.; Zhao, C.Y.; Liu, J.J.; Gao, Y.F.; Zang, F.; Guo, Z.X.; Mao, Y.H.; Wang, L. Modeling the Effect of Climate Change on the Potential Distribution of Qinghai Spruce (Picea crassifolia Kom.) in Qilian Mountains. Forests 2019, 10, 62. [Google Scholar] [CrossRef]
- Bao, W.K.; Gao, Q.Z.; Wang, J.S.; Shen, M.G.; Zhang, Y.J.; Zhang, X.Z.; Zhang, Y.L.; Ouyang, H.; Sun, H.; Wang, G.X.; et al. Ecological change on the Tibetan Plateau. Chin. Sci. Bull. 2015, 60, 3048–3056. [Google Scholar] [CrossRef]
- Yang, J.; Jiang, P.; Huang, Y.; Yang, Y.; Wang, R.; Yang, Y. Potential geographic distribution of relict plant Pteroceltis tatarinowii in China under climate change scenarios. PLoS ONE 2022, 17, e0266133. [Google Scholar] [CrossRef]
- Zhang, S.; Liu, X.G.; Li, R.M.; Wang, X.L.; Cheng, J.H.; Yang, Q.L.; Kong, H. AHP-GIS and MaxEnt for delineation of potential distribution of Arabica coffee plantation under future climate in Yunnan, China. Ecol. Indic. 2021, 132, 108339. [Google Scholar] [CrossRef]
- Zhao, G.H.; Cui, X.Y.; Sun, J.J.; Li, T.T.; Wang, Q.; Ye, X.Z.; Fan, B.G. Analysis of the distribution pattern of Chinese Ziziphus jujuba under climate change based on optimized biomod2 and MaxEnt models. Ecol. Indic. 2021, 132, 108256. [Google Scholar] [CrossRef]
- Xie, C.P.; Tian, E.L.; Jim, C.Y.; Liu, D.W.; Hu, Z.K. Effects of climate-change scenarios on the distribution patterns of Castanea henryi. Ecol. Evol. 2022, 12, e9597. [Google Scholar] [CrossRef]
- Liu, Z.L.; Fang, J.Y.; Piao, S.L. Geographical distribution of species genera Abies, Picea and Larix in China. Acta Geogr. Sin. 2002, 57, 577–586. [Google Scholar]
- Teng, J.; Li, H.; Lu, S.F.; Yin, X.J.; Li, G.; Chen, Z.; Wamg, Y. Responses of Cold-Temperate Coniferous Forest to Climate Change in Southwestern China. J. Northwest For. Univ. 2023, 38, 33–44. [Google Scholar]
- Zhang, J.P.; Zhang, Y.L.; Liu, L.S.; Nie, Y. Predicting potential distribution of Tibetan spruce (Picea smithiana) in Qomolangma (Mount Everest) National Nature Preserve using maximum entropy niche-based model. Chin. Geogr. Sci. 2011, 21, 417–426. [Google Scholar] [CrossRef]
- Moukrim, S.; Lahssini, S.; Rhazi, M.; Menzou, K.; El Madihi, M.; Rifai, N.; Bouziani, Y.; Azedou, A.; Boukhris, I.; Rhazi, L. Climate Change impact on potential distribution of an endemic species Abies marocana Trabut. Ekologia 2022, 41, 329–339. [Google Scholar] [CrossRef]
- Peng, Z.T.; Guo, M.M.; Zhang, Y.D.; Gu, F.X.; Shao, H.; Liu, S.R. Effects of abrupt warming on Picea likiangensis var. balfouriana and Abies squamata growth at tree line in Dafu, Sichuan, China. Acta Ecol. Sin. 2021, 41, 8202–8211. [Google Scholar]
- Sun, Y.; Wang, L.L.; Chen, J.; Duan, J.P.; Shao, X.M.; Chen, K.L. Growth characteristics and response to climate change of Larix Miller tree-ring in China. Sci. China Earth Sci. 2010, 53, 871–879. [Google Scholar] [CrossRef]
- Pang, X.; Zhang, M.; Shi, S.L.; Li, J.J.; Peng, P.H. Radial growth response of Larix mastersiana to climate warming in the last 60 years. Chin. J. Appl. Environ. Biol. 2021, 27, 568–576. [Google Scholar]
- Zhang, M.; Shi, S.L.; Shi, C.M.; Bai, H.; Li, Z.S.; Peng, P.H. Radial growth responses of four typical coniferous species to climatic factors in the Western Sichuan Plateau, China. Chin. J. Ecol. 2021, 40, 1947–1957. [Google Scholar]
- Phillips, S.J.; Anderson, R.P.; Schapire, R.E. Maximum entropy modeling of species geographic distributions. Ecol. Model. 2006, 190, 231–259. [Google Scholar] [CrossRef]
- Ali, F.; Khan, N.; Khan, A.M.; Ali, K.; Abbas, F. Species distribution modelling of Monotheca buxifolia (Falc.) A. DC.: Present distribution and impacts of potential climate change. Heliyon 2023, 9, e13417. [Google Scholar] [CrossRef] [PubMed]
- Cong, M.Y.; Xu, Y.Y.; Tang, L.Y.; Yang, W.J.; Jian, M.F. Predicting the dynamic distribution of Sphagnum bogs in China under climate change since the last interglacial period. PLoS ONE 2020, 15, e02309692020. [Google Scholar] [CrossRef]
- Chen, X.M.; Lei, Y.C.; Zhang, X.Q.; Jia, H.Y. Effects of Sample Sizes on Accuracy and Stability of Maximum Entropy Model in Predicting Species Distribution. Scient. Silv. Sinic. 2012, 48, 53–59. [Google Scholar]
- Chen, C.; Zhang, X.J.; Wan, J.Z.; Gao, F.F.; Yuan, S.S.; Sun, T.T.; Ni, Z.D.; Yu, J.H. Predicting the distribution of plant associations under climate change: A case study on Larix gmelinii in China. Ecol Evol. 2022, 12, e93742022. [Google Scholar] [CrossRef] [PubMed]
- Xiao, Q.; Zhang, M.T.; Wu, Y.; Ding, H.; Lei, J.C.; Zhu, S.L.; Zhang, Z.H.; Chen, L. Prediction of potential distribution of the invasive species Procambarus clarkii in China based on ecological niche models. Chin. J. Appl. Ecol. 2020, 31, 309–318. [Google Scholar]
- Fang, Y.W.; Liu, L.L.; Guo, K.; Chen, X.F.; Gu, J.F. Prediction of geographical distribution of Meloidogyne mali in China based on MaxEnt model. Plant Quar. 2020, 34, 68–73. [Google Scholar]
- Cao, X.P.; Wang, J.R.; Lu, S.S.; Zhang, X.W. Simulation of the potential distribution patterns of Picea crassifolia in climate change scenarios based on the maximum entropy (Maxent) model. Acta Ecol. Sin. 2019, 39, 5232–5240. [Google Scholar]
- Guo, Q.Q.; Li, H.E.; Zheng, W.L.; Pan, J.W.; Lu, J.; Li, J.R.; Zheng, Y. Analysis of genetic diversity and prediction of Larix species distribution in the Qinghai–Tibet Plateau, China. J. For. Res. 2022, 34, 705–715. [Google Scholar] [CrossRef]
- Zhang, H.Y.; Zhao, B.J.; Huang, T.S.; Chen, H.; Yue, J.J.; Tian, Y.L. Responses of the Distribution Pattern of the Suitable Habitat of Juniperus tibetica Komarov to Climate Change on the Qinghai-Tibet Plateau. Forests 2023, 14, 434. [Google Scholar] [CrossRef]
- Hu, H.; Wei, Y.; Wang, W.; Suonan, J.; Wang, S.; Chen, Z.; Guan, J.; Deng, Y. Richness and distribution of endangered orchid species under different climate scenarios on the Qinghai-Tibetan Plateau. Front. Plant Sci. 2022, 13, 948189. [Google Scholar] [CrossRef]
- He, P.; Li, J.Y.; Li, Y.F.; Xu, N.; Gao, Y.; Guo, L.F.; Huo, T.T.; Peng, C.; Meng, F.Y. Habitat protection and planning for three Ephedra using the MaxEnt and Marxan models. Ecol. Indic. 2021, 133, 108399. [Google Scholar] [CrossRef]
- Zhao, Z.Y.; Xiao, N.W.; Liu, G.H.; Li, J.S. Prediction of the potential geographical distribution of five species of Scutiger in the south of Hengduan Mountains Biodiversity Conservation Priority Zone. Acta Ecol. Sin. 2022, 42, 2636–2647. [Google Scholar]
- Qiu, D.Y.; Yang, J.; Feng, L.; Ni, D.W.; Huang, C.X.; Li, Z.H. Complete plastid genome of Larix potaninii var. macrocarpa, an endangered conifer endemic to China. Conserv. Genet. Resour. 2018, 10, 187–189. [Google Scholar] [CrossRef]
- Ncube, B.; Shekede, M.D.; Gwitira, I.; Dube, T. Spatial modelling the effects of climate change on the distribution of Lantana camara in Southern Zimbabwe. Appl. Geogr. 2020, 117, 102172. [Google Scholar] [CrossRef]
- Meinshausen, M.; Nicholls, Z.R.J.; Lewis, J.; Gidden, M.J.; Vogel, E.; Freund, M.; Beyerle, U.; Gessner, C.; Nauels, A.; Bauer, N.; et al. The shared socio-economic pathway (SSP) greenhouse gas concentrations and their extensions to 2500. Geosci. Model Dev. 2020, 13, 3571–3605. [Google Scholar] [CrossRef]
- Liu, X.T.; Yuan, Q.; Ni, J. Research advances in modelling plant species distribution in China. Chin. J. Plant Ecol. 2019, 43, 273–283. [Google Scholar] [CrossRef]
- Zhang, L.M.; Luo, P.; Pang, L.F.; Tang, X.M. Predicting Potential Distribution of Pinus koraiensis in Northeast China by MaxEnt Model and Random Forest. J. Northeast For. Univ. 2020, 48, 60–66. [Google Scholar]
- Rana, S.K.; Rana, H.K.; Luo, D.; Sun, H. Estimating climate-induced ‘Nowhere to go’ range shifts of the Himalayan Incarvillea Juss. using multi-model median ensemble species distribution models. Ecol. Indic. 2021, 121, 107127. [Google Scholar] [CrossRef]
- Fourcade, Y.; Engler, J.O.; Rodder, D.; Secondi, J. Mapping species distributions with MAXENT using a geographically biased sample of presence data: A performance assessment of methods for correcting sampling bias. PLoS ONE 2014, 9, e971222014. [Google Scholar] [CrossRef]
- Duan, J.Q.; Zhou, G.S. Climatic Suitability of Double Rice Planting Regions in China. Sci. Agric. Sin. 2012, 45, 218–227. [Google Scholar]
- Peterson, A.T.; Cohoon, K.P. Sensitivity of distributional prediction algorithms to geographic data completeness. Ecol. Model 1999, 117, 159–164. [Google Scholar] [CrossRef]
- Soilhi, Z.; Sayari, N.; Benalouache, N.; Mekki, M. Predicting current and future distributions of Mentha pulegium L. in Tunisia under climate change conditions, using the MaxEnt model. Ecol. Inform. 2022, 68, 101533. [Google Scholar] [CrossRef]
- Zhang, K.; Yao, L.; Meng, J.; Tao, J. Maxent modeling for predicting the potential geographical distribution of two peony species under climate change. Sci. Total Environ. 2018, 634, 1326–1334. [Google Scholar] [CrossRef]
- Brown, J.L.; Anderson, B. SDMtoolbox: A python-based GIS toolkit for landscape genetic, biogeographic and species distribution model analyses. Methods Ecol. Evol. 2014, 5, 694–700. [Google Scholar] [CrossRef]
- Shi, X.D.; Yin, Q.; Sang, Z.Y.; Zhu, Z.L.; Jia, Z.K.; Ma, L.Y. Prediction of potentially suitable areas for the introduction of Magnolia wufengensis under climate change. Ecol. Indic. 2021, 127, 107762. [Google Scholar] [CrossRef]
- Zhao, H.X.; Zhang, H.Y.; Xu, C.G. Study on Taiwania cryptomerioides under climate change: MaxEnt modeling for predicting the potential geographical distribution. Glob. Ecol. Conserv. 2020, 24, e013132020. [Google Scholar] [CrossRef]
- Elith, J.; Kearney, M.; Phillips, S. The art of modelling range-shifting species. Methods Ecol. Evol. 2010, 1, 330–342. [Google Scholar] [CrossRef]
- Yu, D.S.; Lu, J.; Zhang, M.; Zhang, X.S. Response of Radial Growth of Larix griffithii to Temperature and Precipitation Fluctuation in Tibet Shergyla Mountain. For. Res. 2023, 36, 91–99. [Google Scholar]
- Deng, G.F.; Li, M.Q.; Hao, Z.X.; Shao, X.M. Responses to Climate Change of Maximum Latewood Density from Larix speciosa Cheng et Law and Abies delavayi Franch. in the Northwest of Yunnan Province, China. Forests 2022, 13, 720. [Google Scholar] [CrossRef]
- Fourcade, Y.; Besnard, A.G.; Secondi, J. Paintings predict the distribution of species, or the challenge of selecting environmental predictors and evaluation statistics. Glob. Ecol. Biogeogr. 2018, 27, 245–256. [Google Scholar] [CrossRef]
- Zhang, Y.; Yin, D.C.; Sun, M.; Wang, H.; Tian, K.; Xiao, D.R.; Zhang, W.G. Variations of Climate-Growth Response of Major Conifers at Upper Distributional Limits in Shika Snow Mountain, Northwestern Yunnan Plateau, China. Forests 2017, 8, 377. [Google Scholar] [CrossRef]
- Zhang, Y.; Cao, R.J.; Yin, J.; Tian, K.; Xiao, D.R.; Zhang, W.G.; Yin, D.C. Radial growth response of major conifers to climate change on Haba Snow Mountain, Southwestern China. Dendrochronologia 2020, 60, 125682. [Google Scholar] [CrossRef]
- Abolmaali, S.M.R.; Tarkesh, M.; Bashari, H. MaxEnt modeling for predicting suitable habitats and identifying the effects of climate change on a threatened species, Daphne mucronata, in central Iran. Ecol. Inf. 2018, 43, 116–123. [Google Scholar] [CrossRef]
- Fu, G.Q.; Xu, X.Y.; Ma, J.P.; Xu, M.S.; Liu, J.; Ding, A.Q. Responses of Haloxylon ammodendron potential geographical distribution to the hydrothermal conditions under MaxEnt model. Pratacult. Sci. 2016, 33, 2173–2179. [Google Scholar]
- Lamsal, P.; Kumar, L.; Aryal, A.; Atreya, K. Invasive alien plant species dynamics in the Himalayan region under climate change. Ambio 2018, 47, 697–710. [Google Scholar] [CrossRef]
- Li, J.; Fan, G.; He, Y. Predicting the current and future distribution of three Coptis herbs in China under climate change conditions, using the MaxEnt model and chemical analysis. Sci. Total Environ. 2020, 698, 134141. [Google Scholar] [CrossRef] [PubMed]
- Liu, T.; Cao, J.H.; Gao, B.Q. Research of Potential Geographical Distribution of Picea purpurea Based on GlS and MaxEnt under Different Climate Conditions. Acta Botan. Boreal Occident Sin. 2022, 42, 481–491. [Google Scholar]
- Parmesan, C.; Yohe, G. A globally coherent fingerprint of climate change impacts across natural systems. Nature 2003, 421, 37–42. [Google Scholar] [CrossRef] [PubMed]
- Wang, Y.F.; Case, B.; Lu, X.M.; Ellison, A.M.; Peñuelas, J.; Zhu, H.F.; Liang, E.Y.; Camarero, J.J. Fire facilitates warming-induced upward shifts of alpine treelines by altering interspecific interactions. Trees 2019, 33, 1051–1061. [Google Scholar] [CrossRef]
- Fan, X.; Pan, J.W.; He, S.T. Prediction of the Potential Distribution of Rosa roxburghii under the Background of Climate Change Based on MaxEnt Model. Acta Bot. Boreal Occident. Sin. 2021, 41, 159–167. [Google Scholar]
- Zhao, Z.C.; Luo, Y.; Jiang, Y.; Xu, Y. Assessment and Predicition of Precipitation and Droughts/Floods Change over the World and in China. Sci. Technol. Rev. 2008, 6, 28–33. [Google Scholar]
- Liao, Z.; Zhang, L.; Nobis, M.P.; Wu, X.; Pan, K.; Wang, K.; Dakhil, M.A.; Du, M.; Xiong, Q.; Pandey, B.; et al. Climate change jointly with migration ability affect future range shifts of dominant fir species in Southwest China. Divers. Distrib. 2019, 26, 352–367. [Google Scholar] [CrossRef]
- Pham, Y.; Reardon-Smith, K.; Mushtaq, S.; Cockfield, G. The impact of climate change and variability on coffee production: A systematic review. Clim. Chang. 2019, 156, 609–630. [Google Scholar] [CrossRef]
- Zhang, C.; Yang, D.; Liang, Z.; Liu, J.; Yan, K.; Zhu, Y.; Yang, S. Climatic factors control the geospatial distribution of active ingredients in Salvia miltiorrhiza Bunge in China. Sci. Rep. 2019, 9, 904. [Google Scholar] [CrossRef]
- Zu, K.; Wang, Z.; Zhu, X.; Lenoir, J.; Shrestha, N.; Lyu, T.; Luo, A.; Li, Y.; Ji, C.; Peng, S.; et al. Upward shift and elevational range contractions of subtropical mountain plants in response to climate change. Sci. Total Environ. 2021, 783, 146896. [Google Scholar] [CrossRef]
- Sijar, B.; Man, K.D.; Prakash, C.A.; Raju, C.; Binod, D. Climate Variability and Associated Response of Larix griffithii in Kanchenjunga Conservation Area of Nepal. Appl. Ecol. Environ. Sci. 2018, 6, 23–30. [Google Scholar]
- Will, R.E.; Wilson, S.M.; Zou, C.B.; Hennessey, T.C. Increased vapor pressure deficit due to higher temperature leads to greater transpiration and faster mortality during drought for tree seedlings common to the forest-grassland ecotone. New Phytol. 2013, 200, 366–374. [Google Scholar] [CrossRef] [PubMed]
- Cui, J.; Qin, J.; Sun, H. Population Spatial Dynamics of Larix potaninii in Alpine Treeline Ecotone in the Eastern Margin of the Tibetan Plateau, China. Forests 2017, 8, 356. [Google Scholar] [CrossRef]
- Shen, Y.F.; Tu, Z.H.; Zhang, Y.L.; Zhong, W.P.; Xia, H.; Hao, Z.Y.; Zhang, C.G.; Li, H.G. Predicting the impact of climate change on the distribution of two relict Liriodendron species by coupling the MaxEnt model and actual physiological indicators in relation to stress tolerance. J. Environ. Manag. 2022, 322, 116024. [Google Scholar] [CrossRef]
- Paim, F.; Pozzan, V.K.; Chapman, C.A.; Paglia, A.P.; de Queiroz, H.L. Tree community structure reflects niche segregation of three parapatric squirrel monkey species (Saimiri spp.). Primates 2018, 59, 395–404. [Google Scholar] [CrossRef] [PubMed]
- Tsafack, N.; Wang, X.P.; Xie, Y.Z.; Fattorini, S. Niche overlap and species co-occurrence patterns in carabid communities of the northern Chinese steppes. ZooKeys 2021, 1044, 929–949. [Google Scholar] [CrossRef] [PubMed]
Figure 1.
Distribution records of Larix potaninii Batalin, Larix griffithii and Larix speciosa on QTP.
Figure 1.
Distribution records of Larix potaninii Batalin, Larix griffithii and Larix speciosa on QTP.

Figure 2.
AUC training values for the three Larix species, (a) for Larix potaninii Batalin, (b) for Larix griffithii, and (c) for Larix speciosa.
Figure 2.
AUC training values for the three Larix species, (a) for Larix potaninii Batalin, (b) for Larix griffithii, and (c) for Larix speciosa.

Figure 3.
Current potential distribution patterns for the three Larix species, (a) for Larix potaninii Batalin, (b) for Larix griffithii and (c) for Larix speciosa.
Figure 3.
Current potential distribution patterns for the three Larix species, (a) for Larix potaninii Batalin, (b) for Larix griffithii and (c) for Larix speciosa.

Figure 4.
Potentially suitable habitat of the three Larix species under different climatic scenarios. (a) Potentially suitable habitat of Larix potaninii Batalin; (b) Potentially suitable habitat of Larix griffithii; (c) Potentially suitable habitat of Larix speciosa.
Figure 4.
Potentially suitable habitat of the three Larix species under different climatic scenarios. (a) Potentially suitable habitat of Larix potaninii Batalin; (b) Potentially suitable habitat of Larix griffithii; (c) Potentially suitable habitat of Larix speciosa.

Figure 5.
Potentially suitable habitat changes of the three Larix species under different climatic scenarios. (a) Potentially suitable habitat changes of Larix potaninii Batalin; (b) Potentially suitable habitat changes of Larix griffithii; (c) Potentially suitable habitat changes of Larix speciosa.

Figure 6.
Changes in the distribution core for the three Larix species under different climatic scenarios, (a) for the three Larix. on QTP, (b) for Larix potaninii Batalin, (c) for Larix griffithii, and (d) for Larix speciosa.
Figure 6.
Changes in the distribution core for the three Larix species under different climatic scenarios, (a) for the three Larix. on QTP, (b) for Larix potaninii Batalin, (c) for Larix griffithii, and (d) for Larix speciosa.

Figure 7.
The multivariate environmental similarity surface (MESS) analysis of the three Larix species under different future climate scenarios. (a) MESS analysis of Larix potaninii Batalin; (b) MESS analysis of Larix griffithii; (c) MESS analysis of Larix speciosa.
Figure 7.
The multivariate environmental similarity surface (MESS) analysis of the three Larix species under different future climate scenarios. (a) MESS analysis of Larix potaninii Batalin; (b) MESS analysis of Larix griffithii; (c) MESS analysis of Larix speciosa.

Figure 8.
Changes in distribution patterns of overlapping suitable areas for the three Larix species under different climatic scenarios.
Figure 8.
Changes in distribution patterns of overlapping suitable areas for the three Larix species under different climatic scenarios.


Table 1.
Information of the main environmental variables used in the MaxEnt model for Larix potaninii Batalin, Larix griffithii and Larix speciosa.
Table 1.
Information of the main environmental variables used in the MaxEnt model for Larix potaninii Batalin, Larix griffithii and Larix speciosa.
| Category | Variable | Description | Unit | Percent Contribution | ||
|---|---|---|---|---|---|---|
| Larix potaninii Batalin | Larix griffithii | Larix speciosa | ||||
| Climate | BIO2 | Mean Diurnal Range | °C | 3.6 | 0.9 | - |
| BIO3 | Isothermality | % | 0.9 | - | 1.6 | |
| BIO6 | Min Temperature of Coldest Month | °C | 9.3 | - | - | |
| BIO7 | Temperature Annual Range | °C | 2.5 | 73.1 | 45.6 | |
| BIO8 | Mean Temperature of Wettest Quarter | °C | - | 0.2 | - | |
| BIO9 | Mean Temperature of Driest Quarter | °C | - | 8.4 | - | |
| BIO11 | Mean Temperature of Coldest Quarter | °C | - | - | 4.9 | |
| BIO12 | Annual Precipitation | °C | 65.3 | 1.5 | - | |
| BIO13 | Precipitation of Wettest Month | mm | - | - | 6.7 | |
| BIO14 | Precipitation of Driest Month | mm | - | - | 29 | |
| BIO15 | Precipitation Seasonality | mm | 2.7 | - | - | |
| BIO17 | Precipitation of Driest Quarter | mm | - | 3.3 | - | |
| Topography | ASP | Aspect | degree | 1.3 | - | - |
| ELE | Elevation | m | 2 | - | - | |
| SLO | Slope | degree | - | 1.5 | 3.2 | |
| Soil | T_GRAVEL | Topsoil Gravel Content | % | 1.4 | 4.7 | - |
| T_SAND | Topsoil Sand Fraction | % | 0.1 | - | - | |
| T_SILT | Topsoil silt fraction | % | 1.4 | 0.3 | - | |
| T_CLAY | Topsoil Clay Fraction | % | 0.2 | 0.1 | - | |
| T_REF_BULK_DENSITY | Topsoil Reference Bulk Density | kg/dm3 | 0.3 | - | - | |
| T_PH_H2O | Topsoil pH (H2O) | −log(H+) | 0.5 | - | 0.1 | |
| T_ESP | Topsoil Sodicity (ESP) | % | 5.5 | 2.7 | 5.6 | |
| S_GRAVEL | Subsoil Gravel Content | % | 0.8 | - | - | |
| S_CLAY | Subsoil Clay Fraction | % | - | - | 3.3 | |
| S_REF_BULK_DENSITY | Subsoil Reference Bulk Density | kg/dm3 | 2.3 | 3.4 | - | |
Table 2.
The criteria for categorizing suitability value of current suitable habitats for Larix potaninii Batalin, Larix griffithii and Larix speciosa under different climate scenarios.
Table 2.
The criteria for categorizing suitability value of current suitable habitats for Larix potaninii Batalin, Larix griffithii and Larix speciosa under different climate scenarios.
| Species | Suitable Level | Current | 2041–2060 | 2081–2100 | ||||
|---|---|---|---|---|---|---|---|---|
| SSP126 | SSP370 | SSP585 | SSP126 | SSP370 | SSP585 | |||
| Larix potaninii Batalin | Minimally Suitable | 0.081 | 0.066 | 0.061 | 0.067 | 0.060 | 0.046 | 0.035 |
| Moderately Suitable | 0.265 | 0.213 | 0.207 | 0.218 | 0.198 | 0.162 | 0.120 | |
| Highly Suitable | 0.484 | 0.397 | 0.400 | 0.407 | 0.393 | 0.341 | 0.243 | |
| Larix griffithii | Minimally Suitable | 0.082 | 0.079 | 0.088 | 0.082 | 0.082 | 0.088 | 0.068 |
| Moderately Suitable | 0.271 | 0.259 | 0.280 | 0.262 | 0.272 | 0.284 | 0.221 | |
| Highly Suitable | 0.498 | 0.498 | 0.521 | 0.521 | 0.499 | 0.541 | 0.443 | |
| Larix speciosa | Minimally Suitable | 0.067 | 0.073 | 0.078 | 0.082 | 0.059 | 0.062 | 0.054 |
| Moderately Suitable | 0.242 | 0.254 | 0.264 | 0.295 | 0.206 | 0.236 | 0.216 | |
| Highly Suitable | 0.510 | 0.535 | 0.512 | 0.629 | 0.435 | 0.517 | 0.4899 | |
Table 3.
Area (×104 km2) and proportion (%) of current suitable habitats for Larix potaninii Batalin, Larix griffithii and Larix speciosa.
Table 3.
Area (×104 km2) and proportion (%) of current suitable habitats for Larix potaninii Batalin, Larix griffithii and Larix speciosa.
| Suitable Level | Larix potaninii Batalin | Larix griffithii | Larix speciosa | |||
|---|---|---|---|---|---|---|
| Area | Proportion | Area | Proportion | Area | Proportion | |
| Highly Suitable | 10.50 | 4.08 | 7.43 | 2.89 | 2.86 | 1.11 |
| Moderately Suitable | 13.72 | 5.33 | 12.89 | 5.01 | 5.98 | 2.33 |
| Minimally Suitable | 17.94 | 6.98 | 21.19 | 8.24 | 16.23 | 6.31 |
| Suitable | 42.16 | 16.39 | 41.51 | 16.14 | 25.07 | 9.75 |
| Not Suitable | 215.08 | 83.61 | 215.73 | 83.86 | 232.17 | 90.25 |
Table 4.
Area (×104 km2) and proportion (%) of future suitable habitats for Larix potaninii Batalin, Larix griffithii and Larix speciosa under different climate scenarios.
Table 4.
Area (×104 km2) and proportion (%) of future suitable habitats for Larix potaninii Batalin, Larix griffithii and Larix speciosa under different climate scenarios.
| Species | Years | Climate Scenario | Highly Suitable | Moderately Suitable | Marginally Suitable | Suitable | Not Suitable | |||||
|---|---|---|---|---|---|---|---|---|---|---|---|---|
| Area | Proportion | Area | Proportion | Area | Proportion | Area | Proportion | Area | Proportion | |||
| Larix potaninii Batalin | 2041–2060 | SSP126 | 9.12 | 3.55 | 15.27 | 5.94 | 23.11 | 8.98 | 47.51 | 18.47 | 209.73 | 81.53 |
| SSP370 | 7.36 | 2.86 | 13.78 | 5.36 | 21.85 | 8.49 | 42.99 | 16.71 | 214.25 | 83.29 | ||
| SSP585 | 6.91 | 2.69 | 13.70 | 5.33 | 23.72 | 9.22 | 44.34 | 17.24 | 212.90 | 82.76 | ||
| 2081–2100 | SSP126 | 6.34 | 2.46 | 11.53 | 4.48 | 23.38 | 9.09 | 41.25 | 16.04 | 215.99 | 83.96 | |
| SSP370 | 3.23 | 1.26 | 13.16 | 5.12 | 28.18 | 10.95 | 44.57 | 17.33 | 212.67 | 82.67 | ||
| SSP585 | 3.82 | 1.48 | 9.27 | 3.60 | 23.29 | 9.05 | 36.39 | 14.15 | 220.85 | 85.85 | ||
| Larix griffithii | 2041–2060 | SSP126 | 8.21 | 3.19 | 14.86 | 5.78 | 25.57 | 9.94 | 48.64 | 18.91 | 208.60 | 81.09 |
| SSP370 | 13.07 | 5.08 | 19.69 | 7.65 | 31.72 | 12.33 | 64.49 | 25.07 | 192.75 | 74.93 | ||
| SSP585 | 5.18 | 2.01 | 15.37 | 5.97 | 25.58 | 9.94 | 46.13 | 17.93 | 211.11 | 82.07 | ||
| 2081–2100 | SSP126 | 7.78 | 3.02 | 14.24 | 5.54 | 27.40 | 10.65 | 49.42 | 19.21 | 207.82 | 80.79 | |
| SSP370 | 12.45 | 4.84 | 24.79 | 9.64 | 41.52 | 16.14 | 78.76 | 30.62 | 178.48 | 69.38 | ||
| SSP585 | 9.77 | 3.80 | 17.40 | 6.76 | 42.94 | 16.69 | 70.11 | 27.25 | 187.13 | 72.75 | ||
| Larix speciosa | 2041–2060 | SSP126 | 3.94 | 1.53 | 7.56 | 2.94 | 18.45 | 7.17 | 29.95 | 11.64 | 227.29 | 88.36 |
| SSP370 | 4.03 | 1.57 | 7.68 | 2.99 | 13.28 | 5.16 | 24.98 | 9.71 | 232.26 | 90.29 | ||
| SSP585 | 3.10 | 1.21 | 5.34 | 2.08 | 15.08 | 5.86 | 23.52 | 9.14 | 233.72 | 90.86 | ||
| 2081–2100 | SSP126 | 2.99 | 1.16 | 6.54 | 2.54 | 16.62 | 6.46 | 26.15 | 10.17 | 231.09 | 89.83 | |
| SSP370 | 4.93 | 1.92 | 9.98 | 3.88 | 32.18 | 12.51 | 47.09 | 18.31 | 210.15 | 81.69 | ||
| SSP585 | 4.64 | 1.80 | 8.83 | 3.43 | 37.76 | 14.68 | 51.23 | 19.92 | 206.01 | 80.08 | ||
Table 5.
Changes of potential distribution area (×104 km2) and proportion (%) of Larix potaninii Batalin, Larix griffithii and Larix speciosa under different climate scenarios.
Table 5.
Changes of potential distribution area (×104 km2) and proportion (%) of Larix potaninii Batalin, Larix griffithii and Larix speciosa under different climate scenarios.
| Species | Years | Climate Scenario | Lost | Remain | Gain | Distribution Change Trend | |||
|---|---|---|---|---|---|---|---|---|---|
| Area | Proportion | Area | Proportion | Area | Proportion | ||||
| Larix potaninii Batalin | 2041–2060 | SSP126 | 4.71 | 1.83 | 249.23 | 96.89 | 3.30 | 1.28 | Contraction |
| SSP370 | 9.18 | 3.57 | 245.13 | 95.29 | 2.93 | 1.14 | Contraction | ||
| SSP585 | 8.84 | 3.44 | 244.38 | 95.00 | 4.02 | 1.56 | Contraction | ||
| 2081–2100 | SSP126 | 11.86 | 4.61 | 243.76 | 94.76 | 1.62 | 0.63 | Contraction | |
| SSP370 | 17.05 | 6.63 | 238.67 | 92.78 | 1.51 | 0.59 | Contraction | ||
| SSP585 | 24.66 | 9.59 | 231.18 | 89.87 | 1.39 | 0.54 | Contraction | ||
| Larix griffithii | 2041–2060 | SSP126 | 3.33 | 1.29 | 248.62 | 96.65 | 5.29 | 2.06 | Expansion |
| SSP370 | 1.13 | 0.44 | 240.94 | 93.66 | 15.16 | 5.90 | Expansion | ||
| SSP585 | 4.85 | 1.89 | 247.66 | 96.27 | 4.72 | 1.84 | Contraction | ||
| 2081–2100 | SSP126 | 2.76 | 1.07 | 249.71 | 97.07 | 4.77 | 1.86 | Expansion | |
| SSP370 | 2.71 | 1.05 | 232.28 | 90.30 | 22.25 | 8.65 | Expansion | ||
| SSP585 | 8.66 | 3.36 | 237.92 | 92.49 | 10.66 | 4.15 | Expansion | ||
| Larix speciosa | 2041–2060 | SSP126 | 0.42 | 0.16 | 253.16 | 98.42 | 3.66 | 1.42 | Expansion |
| SSP370 | 0.86 | 0.33 | 251.80 | 97.89 | 4.58 | 1.78 | Expansion | ||
| SSP585 | 1.03 | 0.40 | 253.81 | 98.67 | 2.39 | 0.93 | Expansion | ||
| 2081–2100 | SSP126 | 2.37 | 0.92 | 253.39 | 98.51 | 1.47 | 0.57 | Contraction | |
| SSP370 | 1.08 | 0.42 | 249.35 | 96.93 | 6.81 | 2.65 | Expansion | ||
| SSP585 | 2.15 | 0.83 | 249.62 | 97.04 | 5.47 | 2.13 | Expansion | ||
Table 6.
The area (×104 km2) and proportion (%) of multivariate environmental similarity surface (MESS) of Larix potaninii Batalin, Larix griffithii and Larix speciosa under different climate scenarios.
Table 6.
The area (×104 km2) and proportion (%) of multivariate environmental similarity surface (MESS) of Larix potaninii Batalin, Larix griffithii and Larix speciosa under different climate scenarios.
| Species | Climate Scenarios | 2041–2060 | 2081–2100 | ||||||
|---|---|---|---|---|---|---|---|---|---|
| S ≤ 0 | S > 0 | S ≤ 0 | S > 0 | ||||||
| Area | Proportion | Area | Proportion | Area | Proportion | Area | Proportion | ||
| Larix potaninii Batalin | SSP126 | 3.47 | 1.35 | 253.77 | 98.65 | 8.71 | 3.39 | 248.53 | 96.61 |
| SSP370 | 3.34 | 1.30 | 253.90 | 98.70 | 11.90 | 4.63 | 245.34 | 95.37 | |
| SSP585 | 8.77 | 3.41 | 248.47 | 96.59 | 15.10 | 5.87 | 242.14 | 94.13 | |
| Larix griffithii | SSP126 | 0.73 | 0.28 | 256.51 | 99.72 | 0.83 | 0.32 | 256.41 | 99.68 |
| SSP370 | 0.76 | 0.30 | 256.48 | 99.70 | 2.30 | 0.89 | 254.94 | 99.11 | |
| SSP585 | 1.14 | 0.44 | 256.10 | 99.56 | 1.85 | 0.72 | 255.39 | 99.28 | |
| Larix speciosa | SSP126 | 2.96 | 1.15 | 254.28 | 98.85 | 4.37 | 1.70 | 252.87 | 98.30 |
| SSP370 | 1.77 | 0.69 | 255.47 | 99.31 | 7.63 | 2.97 | 249.61 | 97.03 | |
| SSP585 | 5.27 | 2.05 | 251.97 | 97.95 | 9.80 | 3.81 | 247.44 | 96.19 | |
Disclaimer/Publisher’s Note: The statements, opinions and data contained in all publications are solely those of the individual author(s) and contributor(s) and not of MDPI and/or the editor(s). MDPI and/or the editor(s) disclaim responsibility for any injury to people or property resulting from any ideas, methods, instructions or products referred to in the content. |
© 2023 by the authors. Licensee MDPI, Basel, Switzerland. This article is an open access article distributed under the terms and conditions of the Creative Commons Attribution (CC BY) license (https://creativecommons.org/licenses/by/4.0/).
Share and Cite
MDPI and ACS Style
An, X.; Huang, T.; Zhang, H.; Yue, J.; Zhao, B. Prediction of Potential Distribution Patterns of Three Larix Species on Qinghai-Tibet Plateau under Future Climate Scenarios. Forests 2023, 14, 1058. https://doi.org/10.3390/f14051058
AMA Style
An X, Huang T, Zhang H, Yue J, Zhao B. Prediction of Potential Distribution Patterns of Three Larix Species on Qinghai-Tibet Plateau under Future Climate Scenarios. Forests. 2023; 14(5):1058. https://doi.org/10.3390/f14051058
Chicago/Turabian StyleAn, Xiu, Tousheng Huang, Huayong Zhang, Junjie Yue, and Bingjian Zhao. 2023. "Prediction of Potential Distribution Patterns of Three Larix Species on Qinghai-Tibet Plateau under Future Climate Scenarios" Forests 14, no. 5: 1058. https://doi.org/10.3390/f14051058
Note that from the first issue of 2016, this journal uses article numbers instead of page numbers. See further details here.