
Economic Ripple Effects Analysis of Cross-Laminated Timber Manufacturing in Japan


1
United Graduate School of Agricultural Science, Tokyo University of Agriculture and Technology, 3-5-8 Saiwai-cho, Fuchu, Tokyo 183-8509, Japan
2
Faculty of Science and Engineering, Toyo University, 2100 Kujirai, Kawagoe, Saitama 350-8585, Japan
3
Jeffrey Sachs Center on Sustainable Development, Sunway University, No. 5, Jalan University, Bandar Sunway, Subang Jaya 47500, Malaysia
4
Institute of Agriculture, Tokyo University of Agriculture and Technology, 3-5-8 Saiwai-cho, Fuchu, Tokyo 183-8509, Japan
*
Author to whom correspondence should be addressed.
Forests 2023, 14(3), 492; https://doi.org/10.3390/f14030492
Submission received: 11 January 2023
/
Revised: 16 February 2023
/
Accepted: 21 February 2023
/
Published: 1 March 2023
(This article belongs to the Section Wood Science and Forest Products)
Abstract
:Japan has been actively promoting the various uses of timber to efficiently utilize its plantation forests and contribute to its climate commitments. Cross-laminated timber (CLT), owing to its unique structural characteristics and environmental advantages, has received widespread attention in Japan. Being a high-value-added timber, CLT’s value chain involves various industries, including forestry, timber processing, transportation, construction, and civil engineering. However, the economic impact associated with the increasing production and use of CLT is ambiguous. Targeting CLT manufacturers in Japan, this study evaluated the economic ripple effects of CLT through an input–output analysis, which is a method that is used to evaluate the independent association between different economic sectors and industries. An extended input–output table was established according to the survey of revenue and expenditure data of the largest CLT manufacturers in Japan in 2020. The result was compared with the glued-laminated timber (GLT) scenario at the same final demand value. The results showed that activities not elsewhere classified, timber, logs, road freight transport (except self-transport), and wholesale trade were the top five sectors that had the largest economic impact on CLT manufacturing. Our research has implications for policies and programs to promote the revival of forestry and sustainable development of the timber industry in Japan.

1. Introduction
Cross-laminated timber (CLT) is a relatively new structural material in Japan, although it was developed in the Alpine region of Europe in the early 1990s [1,2]. Over the past 25 years, it has received extensive attention in the global wood industry owing to its unique cross-laminated structure and environmental advantages. Currently, CLT has manufacturing lines in Europe, North America, Oceania, Asia, and South Africa [3,4,5]. According to the Annual Market Review of Forest Products 2020–2021, the global CLT production capacity was estimated at 2.8 million m3 in 2020, of which 48% was in Europe, 43% was in North America, 6% was in Oceania, and 3% was in Asia, with actual production likely to exceed 2 million m3 in 2020. The production capacity of CLT continues to expand rapidly and is expected to reach 4 million m3 by 2025 [6].
In recent years, Japan has observed a recovering trend in wood demand. Meanwhile, the domestic wood supply has increased as plantation forests have reached a suitable age for harvesting [7]. As a result, the self-sufficiency ratio for wood has grown for 10 consecutive years, reaching 41.8% in 2020 [8]. New products and technologies are being developed for new purposes, creating a new market for domestic wood products. Interest in CLT for civil engineering, non-residential construction, and mid-to-high-rise buildings is growing steadily [7,9]. The cross-laminated structure improves the products’ dimensional stability, strength, and rigidity [10]. Compared with steel and concrete, CLT does not require a curing period, which shortens construction and reduces construction costs. Furthermore, the foundation work can be simplified due to the reduced weight of the building (approximately 1/6–1/4 of that of concrete) [11,12].
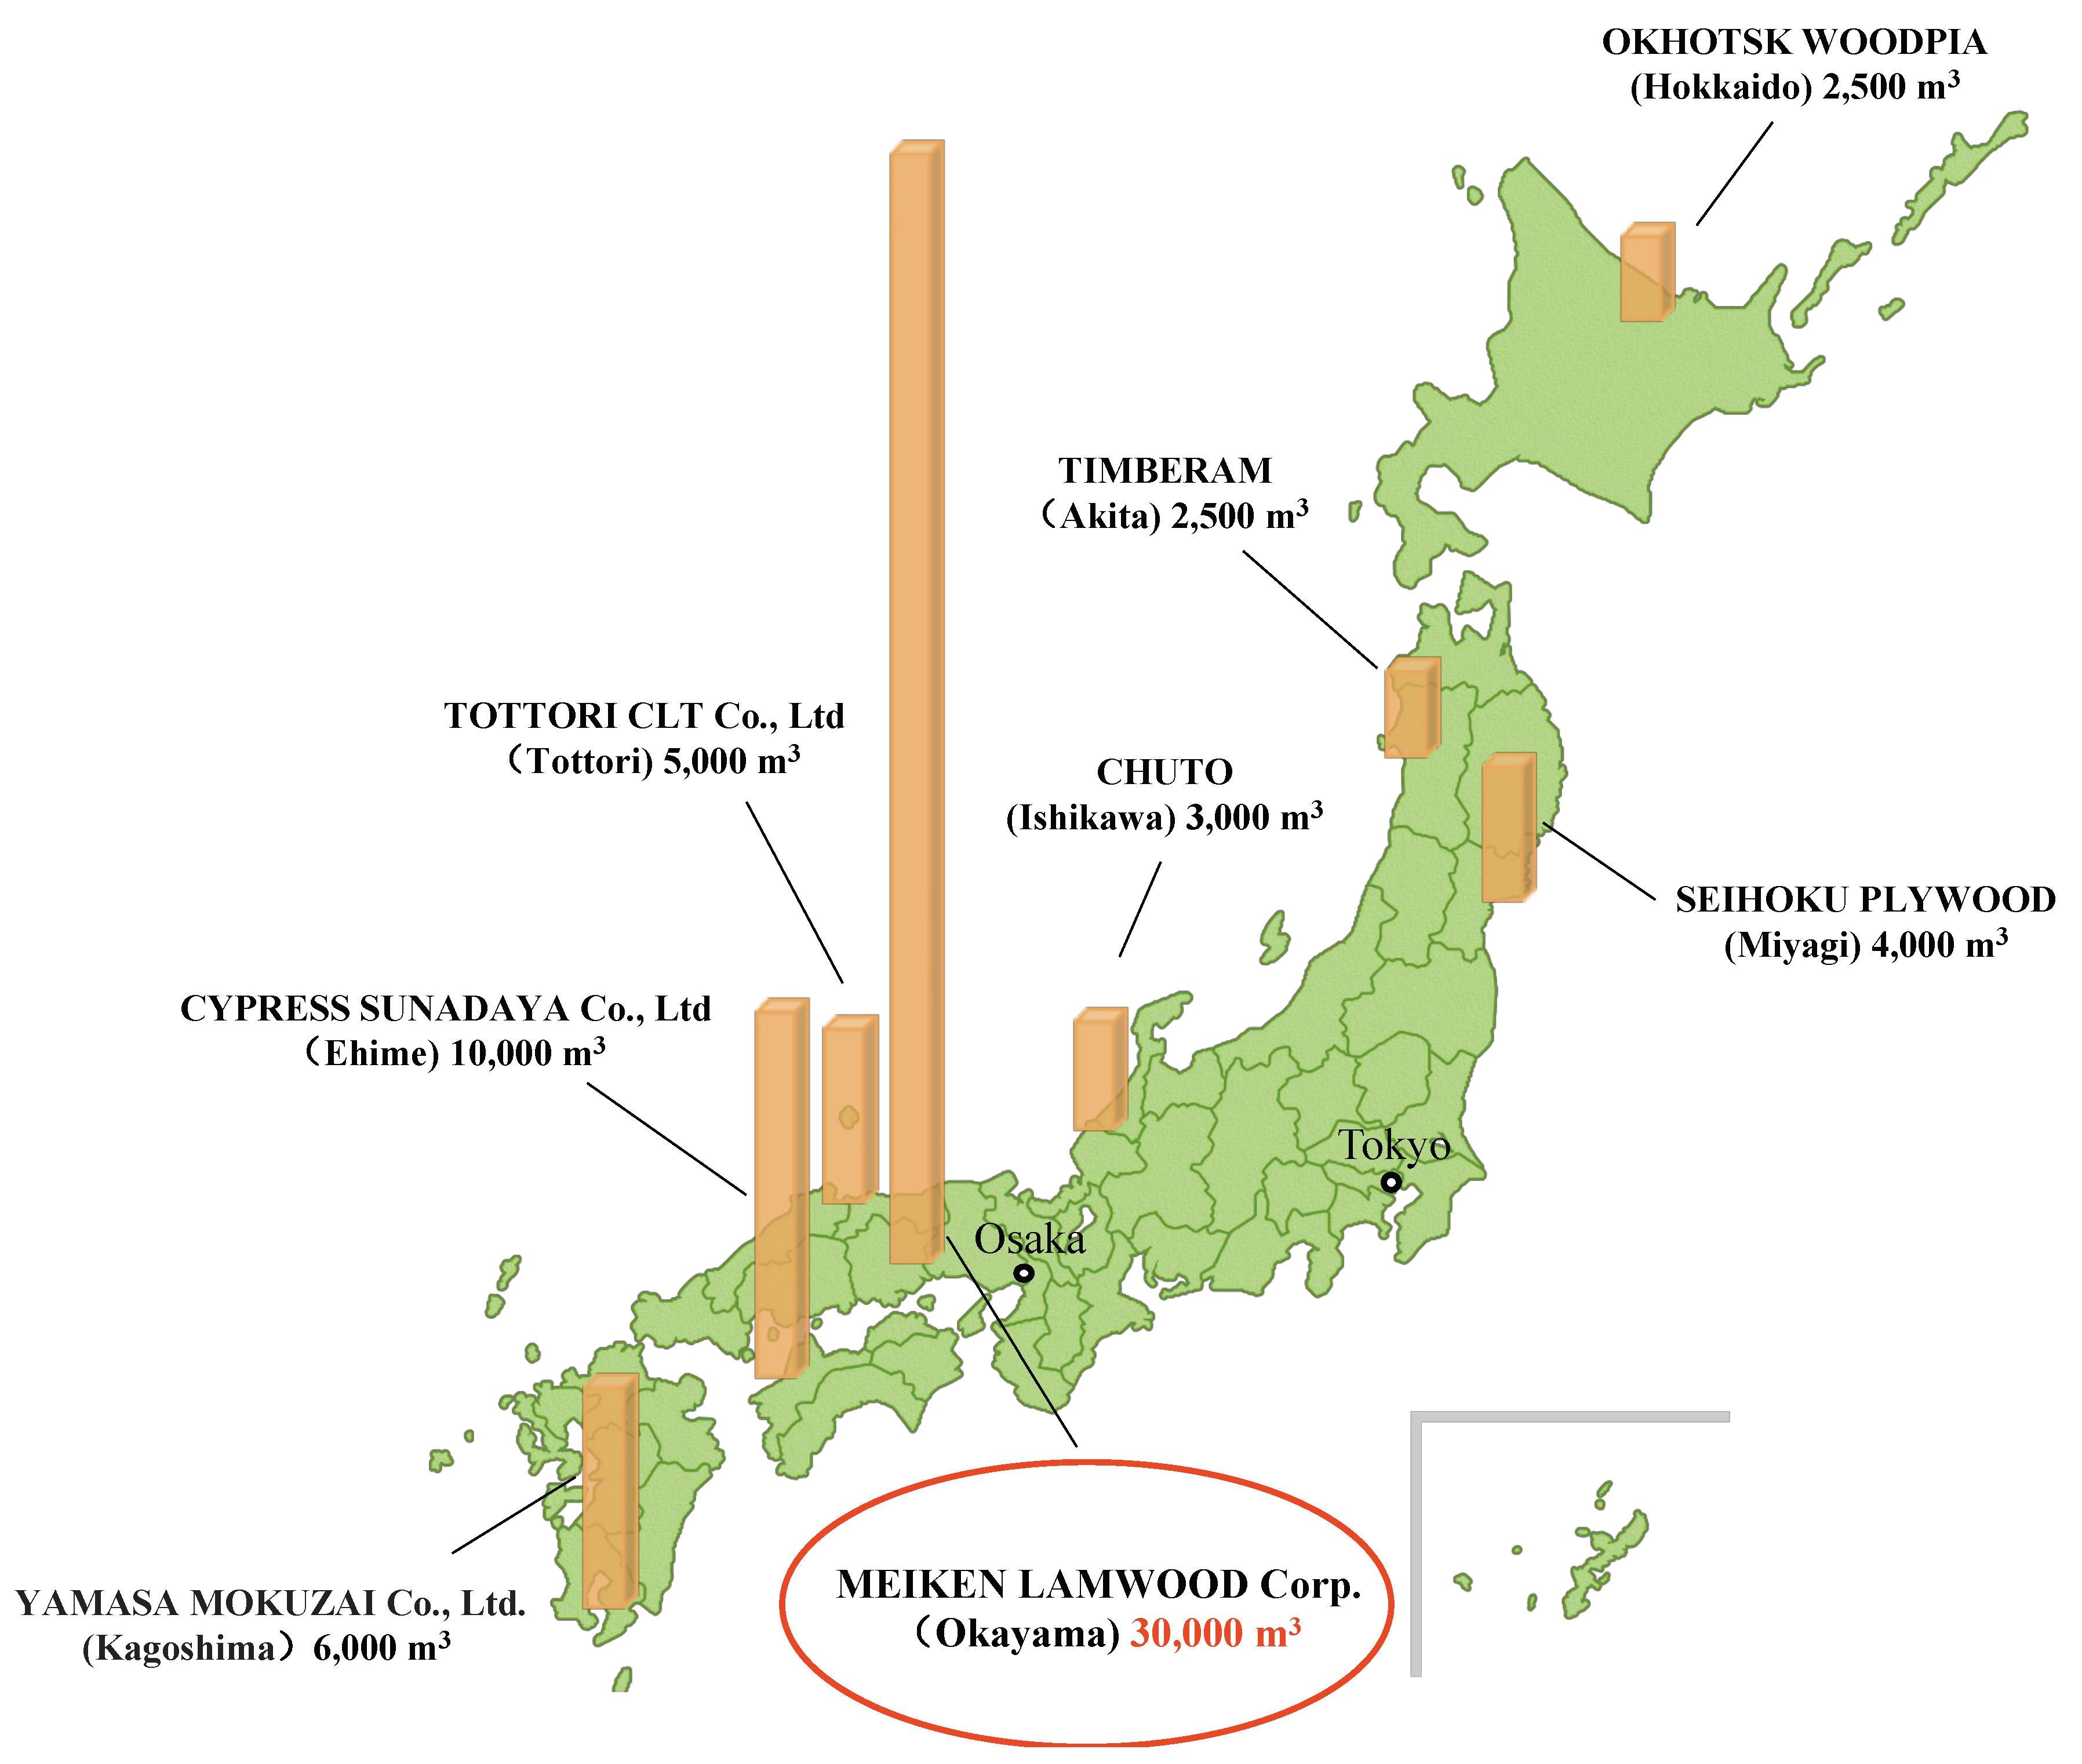
To promote the use of CLT, the Japan Forestry Agency and the Ministry of Land, Infrastructure, Transport, and Tourism jointly prepared the “Roadmap for the Diffusion of CLT” to promote the use of CLT in 2014. The roadmap includes the development of standard strength and general design methods, the intention to lower the price of CLT to 70,000–80,000 JPY/m3 (USD 609–696 when JPY 100 is set at the average exchange rate of USD 0.87 in 2020–2022, all of the below are at this rate), and establishing a production system capable of producing approximately 500,000 m3 annually by 2024 [9]. Consequently, CLT production has increased. In July 2022, there were eight CLT manufacturers certified by Japanese Agricultural Standards with an annual manufacturing capacity of 63,000 m3 (8 h of operation). These factories were in various places in Japan, including Kagoshima, Ehime, Okayama, Tottori, Ishikawa, Miyagi, Akita prefectures, and Hokkaido (Figure 1). Meiken Lamwood Corp. in Okayama Prefecture had the largest annual production capacity at 30,000 m3 [13]. Out of eight CLT factories, seven are certified according to the Programme for the Endorsement of Forest Certification (PEFC) (only the Tottori CLT manufacturer is not certified by the PEFC). The research report by Komata [14] on the construction and verification of utilizing models for the expansion of domestic CLT speculated that the demand for CLT may rise to 256,000 m3 in 2024, exceeding 300,000 m3/year in 2026 and 400,000 m3/year in 2031.
CLT manufacturing involves many industries, such as forestry, wood processing, transportation, civil engineering, and construction, as CLT is considered a high-value-added structural material [15,16]. There are many techno-economic studies on the North American and European markets for CLT production at different scales. It is generally acknowledged that the scale of production has the greatest impact on the selling price of CLT, which is regarded as a major market barrier [17,18,19]. CLT is a potential alternative material to concrete and steel; therefore, its economics is commonly compared with concrete and steel [6,20,21]. In Japan, where the CLT industry is gradually expanding, knowledge regarding the economics of CLT manufacturing is still lacking. Iwase et al. [22] and Hassan et al. [11] analyzed the economic cost of CLT for small bridge repairs and floors, respectively, and found it to be higher than concrete. In contrast, Huzita et al. [12] found that the local economic benefits of using CLT in bridge repairs were greater than those of using reinforced concrete. Scouse et al. [23] quantitatively assessed the greater economic impact of a 12-story construction in Oregon using mass timber designs, such as CLT, over traditional concrete frame construction. Most studies on CLT’s economics mainly focused on completed construction and civil engineering projects. There is a lack of analysis of the economic ripple effects of CLT manufacturing.
This study quantitatively assessed the economic ripple effects of CLT manufacturing by investigating the annual revenue expenditures and employment of CLT manufacturers in Japan. Hence, the basic input–output table was further developed into an extended input–output table to add a new CLT manufacturing sector. In the basic input–output table for Japan in 2015 [24], the CLT manufacturing sector was included in the “plywood, glued-laminated timber (GLT)” category [25]. Almost all CLT products are applied in construction structures such as walls, floors, and roofs in Japan, while GLT is mainly applied in construction structures such as beams, columns, and components. The average price of CLT is currently at 150,000 JPY/m3 (1305 USD/m3), while the price of GLT varies from 60,000 to 140,000 JPY/m3 (522–1218 USD/m3) [26,27]. The extended input–output table quantifies the economic impact of CLT manufacturing on each industrial sector. In addition, a scenario was established to study the differences in the economic ripple effects of CLT and GLT. Our results provide insights into the potential entrants to the CLT manufacturing industry and enterprises in its broad supply chain and offer suggestions for CLT-related policy decisions.
2. Methods
2.1. Target CLT Manufacturer
A survey was conducted with Meiken Lamwood Corp., the largest CLT manufacturing company in Japan, from October 2021 to March 2022. Meiken Lamwood Corp. is in Maniwa city, Okayama prefecture, and is engaged in three businesses: production of laminated timber and CLT, design and construction of wooden buildings, and biomass power generation. It is currently the largest manufacturer of CLT in Japan, with an annual production capacity of 30,000 m3 and produces CLT up to 270 mm × 3000 mm × 12,000 mm in size [28]. Based on several interviews and visits, we obtained numerical data on the revenue expenditure, the number of employees, raw material sources, and site photos for CLT manufacturing in 2020. The data on revenue expenditure and the number of employees were utilized in calculating the economic ripple effects.
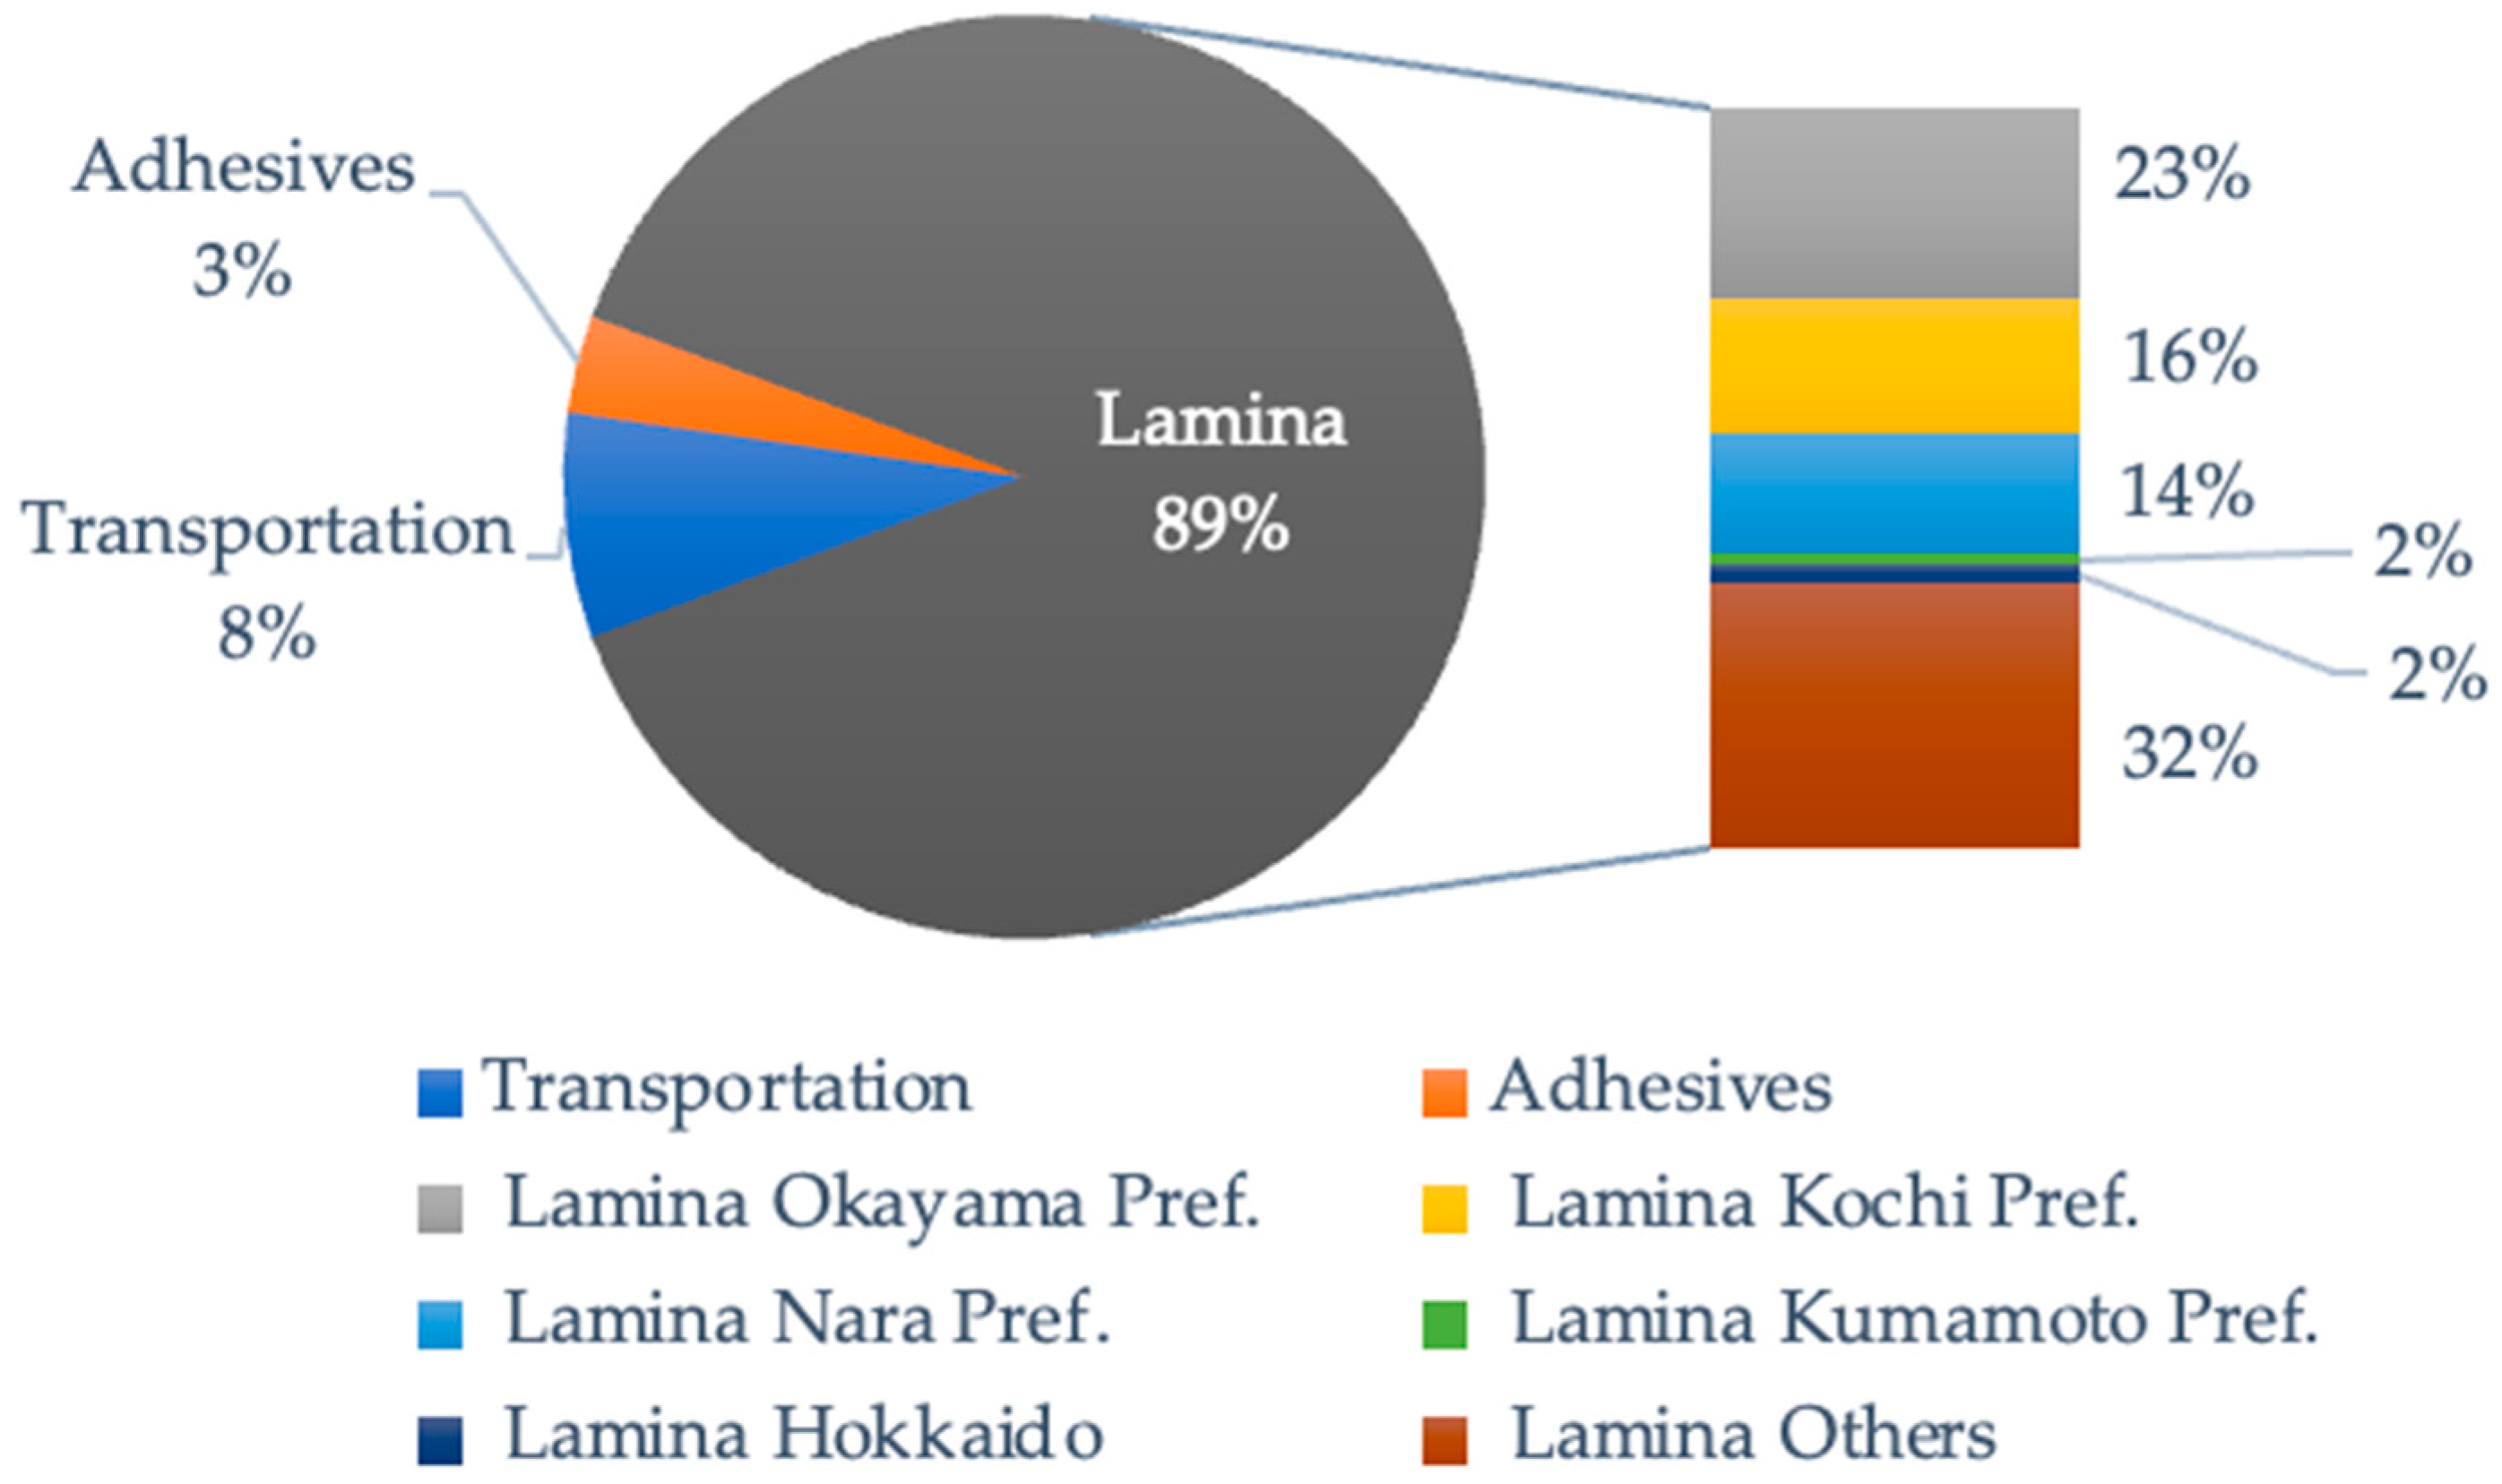
Figure 2 shows the raw material costs associated with CLT manufacturing and the composition of the origin. The cost mainly consisted of the lamina, adhesives, and transportation, accounting for 89%, 3%, and 8%, respectively. The lamina was the most important item in the cost structure. All laminas were made of Japanese domestic wood, including Japanese cedar, Hinoki cypress, Japanese larch, and Sakhalin fir. Considering the transportation cost, the laminates mainly came from Okayama, Kochi, and Nara, accounting for 23%, 16%, and 14% of the total raw material cost, respectively, with small portions from Kumamoto prefectures (2%) and Hokkaido (2%).
2.2. Evaluated Scopes and Processes
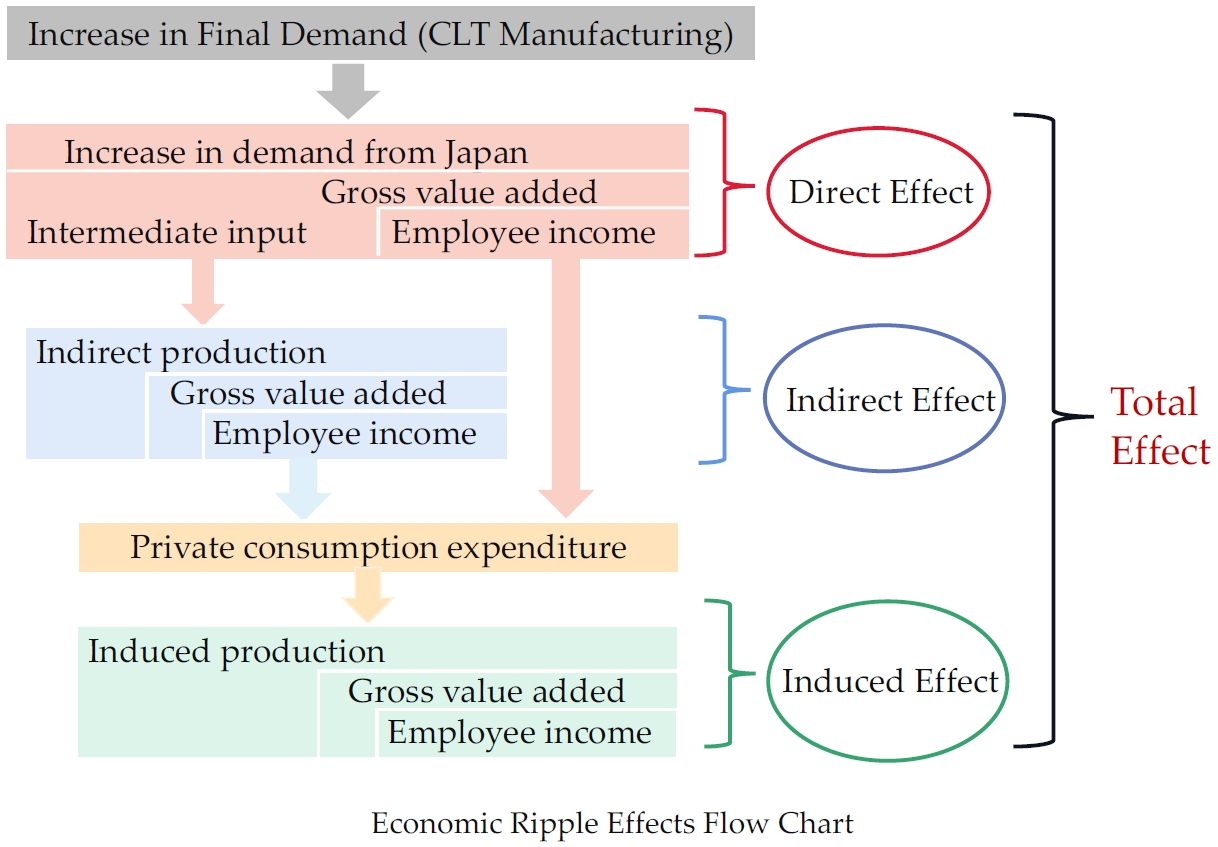
The economic ripple effect is a result of new final demand impacting production activities in its own or other industries. It can be assessed using an input–output table in terms of the induced production value, gross value added, employee income, and size of employment. The scope of the assessment included direct, indirect, induced, and total ripple effects, with indirect and induced effects collectively referred to as indirect ripple effects. These terms are defined as follows:
- Production value induced: the value of production generated by each industry to meet the final demand of an industry.
- Gross value added induced: the value newly generated by production activities and is part of production value induced.
- Employee income induced: the value of cash or in-kind income paid to employees and belongs to gross value added induced.
- Size of employment induced: the number of employees generated by each industry when the final demand is generated in an industry.
- Direct effect: increase in production in each industry generated by final demand.
- Indirect effect: the value of production generated by the direct effect.
- Induced effect: the value of production generated by the new consumption associated with the employees’ income generated by the direct and indirect effects.
- Ripple effect multiplier: the ratio of dividing the total ripple effect by the final demand increase.
The process of using input–output tables to assess the economic ripple effects was as follows. First, an extended input–output table was constructed by adding a new CLT manufacturing sector from the current input–output table. The revenue and expenditure data obtained by surveying CLT manufacturers were applied to the matrix of the created CLT manufacturing sector. The expenditure (costs) for manufacturing CLT was considered as an increase in the final demand. Then, based on this extended input–output table, an input coefficient table and an inverse matrix coefficient table were created, and the direct, indirect, induced, and total ripple effects were calculated.
2.3. New Sector
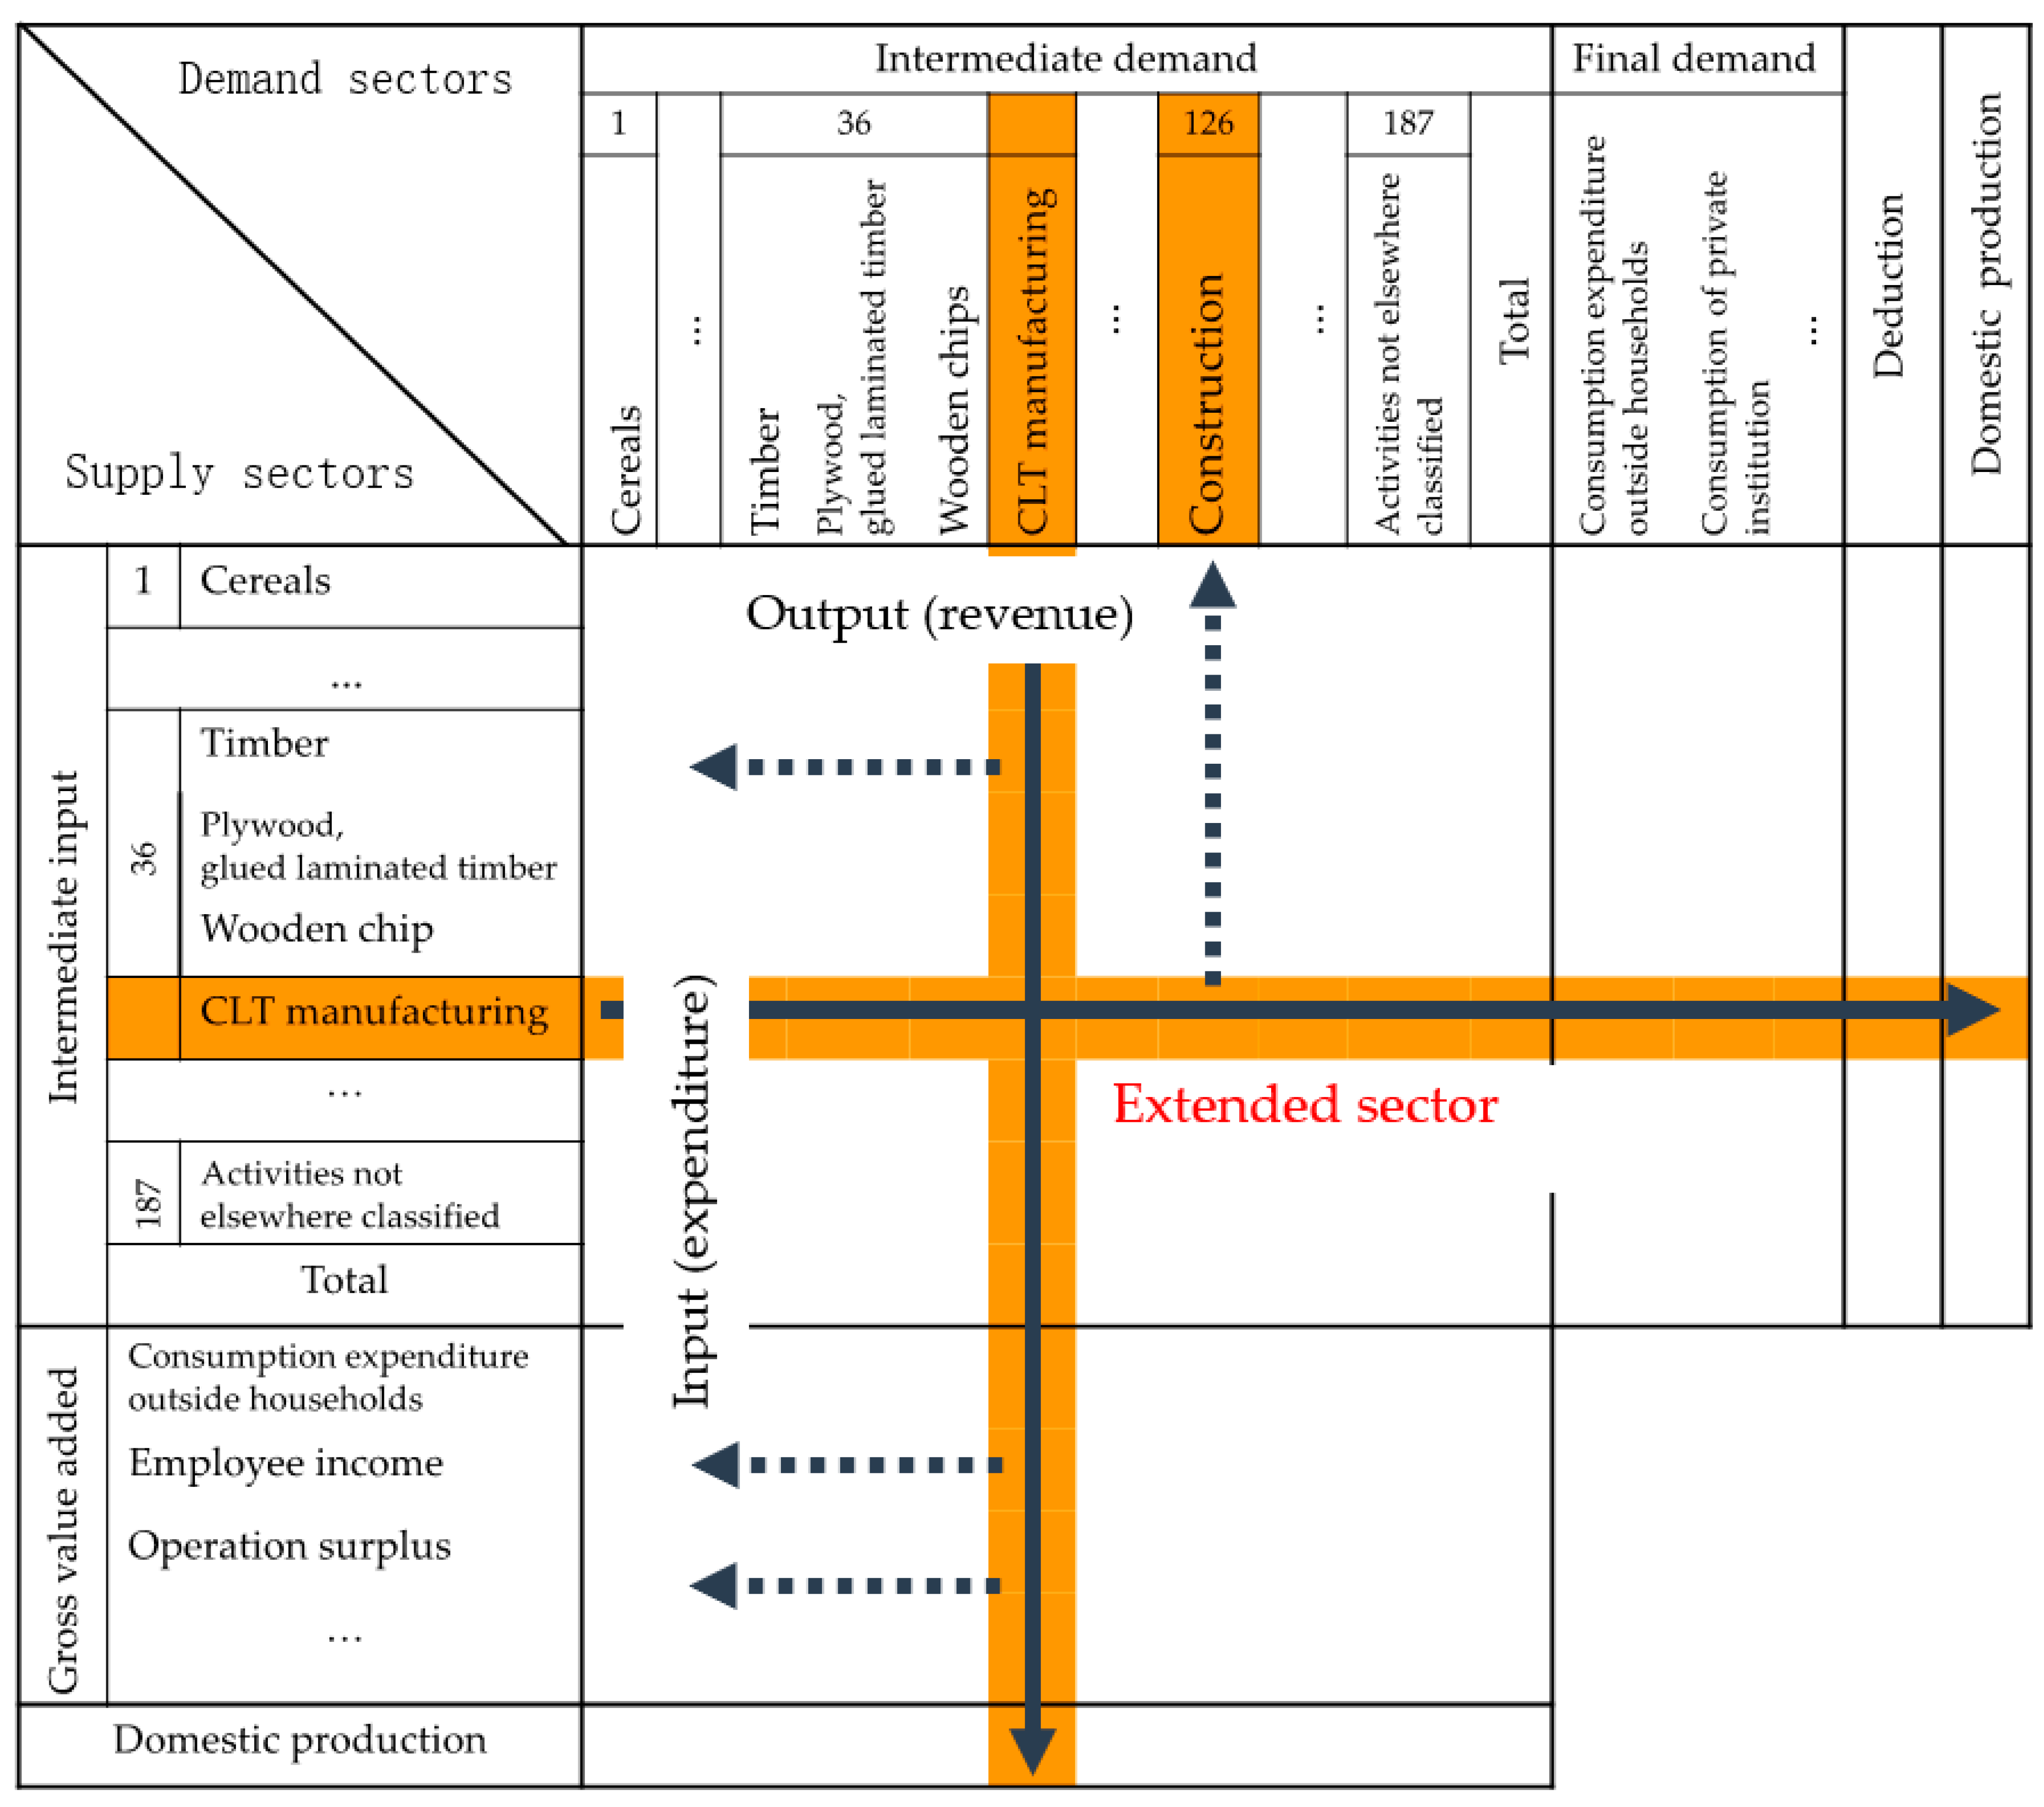
To calculate the economic ripple effects, the updated input–output table for Japan “2015 Input-output Table for Japan (187 sectors)” was used [24]. CLT manufacturing belongs to the “plywood GLT (later referred to as the GLT sector)” category in the current input–output table [25]. However, the share of non-CLT in the plywood GLT sector is quite large in the current input–output table. Even if the high-value-added properties of CLT cause the CLT manufacturing sector to generate a large economic ripple effect, it is not sufficiently reflected in the current input–output tables. Therefore, quantitatively, it is difficult to assess the true economic ripple effect of CLT manufacturing. In this study, an extended input–output table was constructed by adding a new CLT manufacturing sector to calculate the economic ripple effects (Figure 3). The solid lines in Table 1 indicate the direction of inputs and outputs in the CLT sector, and the dashed lines indicate the approximate flow of funds for the actual expenditures and revenues from manufacturing CLT. In addition, to compare the economic ripple effects of CLT in the extended input–output table, a scenario was set up to calculate the economic ripple effects of the GLT sector in the current input–output table with the same amount of increase in the final demand.
2.4. Revenue and Expenditure Data of CLT Manufacturing
To create the new sector, we obtained revenue and expenditure data on materials, labor, and manufacturing expenses from the survey of the CLT manufacturer. The average price of CLT was 150,000 JPY/m3 (1305 USD/m3) [26]. CLT was used as the final product for construction in this study. Therefore, according to the “Explanatory Report of 2015 Japan Input-output Tables” [25], we classified the revenue data for manufacturing CLTs into the construction sectors, including residential construction and non-residential construction, and the expenditure data into the corresponding sectors. Table 1 shows the expenditures involved in manufacturing CLT and the corresponding sectors.
2.5. Creating the Basic Transaction Table
Revenue and expenditure data reflect the purchaser’s prices, including trade margins and domestic freight, while the used input–output tables reflect the producer’s prices. Thus, we calculated the trade margin ratios and domestic freight ratios using the input–output tables, output tables (integrated sub-categories) [31] to exclude trade margins, and domestic freight to unify the input–output tables. The trade margins included wholesale and retail, and domestic freight included railway, road freight, coastal, harbor, air, consigned freight forwarding, and storage facility service. The producer’s prices data were distributed to each sector manufacturing CLT. Excluded trade margins and domestic freight were distributed to the commercial and transportation sectors manufacturing CLT. However, CLT’s manufacturing activities belonged to the plywood GLT sector in the current input–output tables. Thus, the inputs (expenditures) and outputs (revenues) for the new CLT manufacturing sector were excluded from the current plywood GLT sectors to construct an extended input–output table (basic transaction table).
2.6. Creating the Input Coefficient Table
“Input coefficients” indicate the inputs of raw materials and fuels required to produce one unit of production per sector and represent the scale of raw materials and fuels used [32]. The input coefficients were calculated as follows:
where i denotes the row sector number, j denotes the column sector number, the subscript denotes the input of sector i to sector j for producing one unit of product, denotes the input of sector i to sector j, and denotes the domestic output in sector j. The table of input coefficients (matrix A) was built according to the extended input–output table.
2.7. Creating the Inverse Matrix Coefficient Table
“Inverse matrix coefficient table” indicates the expected eventual domestic production per sector when the final demand for one unit is produced for a specific sector [32]. In this study, we created an inverse matrix coefficient table (matrix B) of competitive import types based on the input coefficient table, reflecting some of the economic impacts flows abroad. The inverse matrix coefficients were calculated as follows:
where denotes the unit matrix, denotes the diagonal matrix with zeros as non-diagonal elements and the import coefficients as diagonal elements, and is the input coefficient matrix.
2.8. Setting the Domestic Self-Sufficiency Ratio
This study’s timber used for manufacturing CLT was harvested, purchased, and processed domestically. Therefore, the domestic self-sufficiency ratios for the logs, timber sectors, and new CLT manufacturing sector were set to 100% (import coefficient at 0). The self-sufficiency ratio of Japan was 70% for the logs sector and 63% for the timber sector (import coefficients of 0.3 and 0.37, respectively). The domestic self-sufficiency ratio of other sectors was determined according to the import coefficient table in 2015 [33].
2.9. Economic Ripple Effects
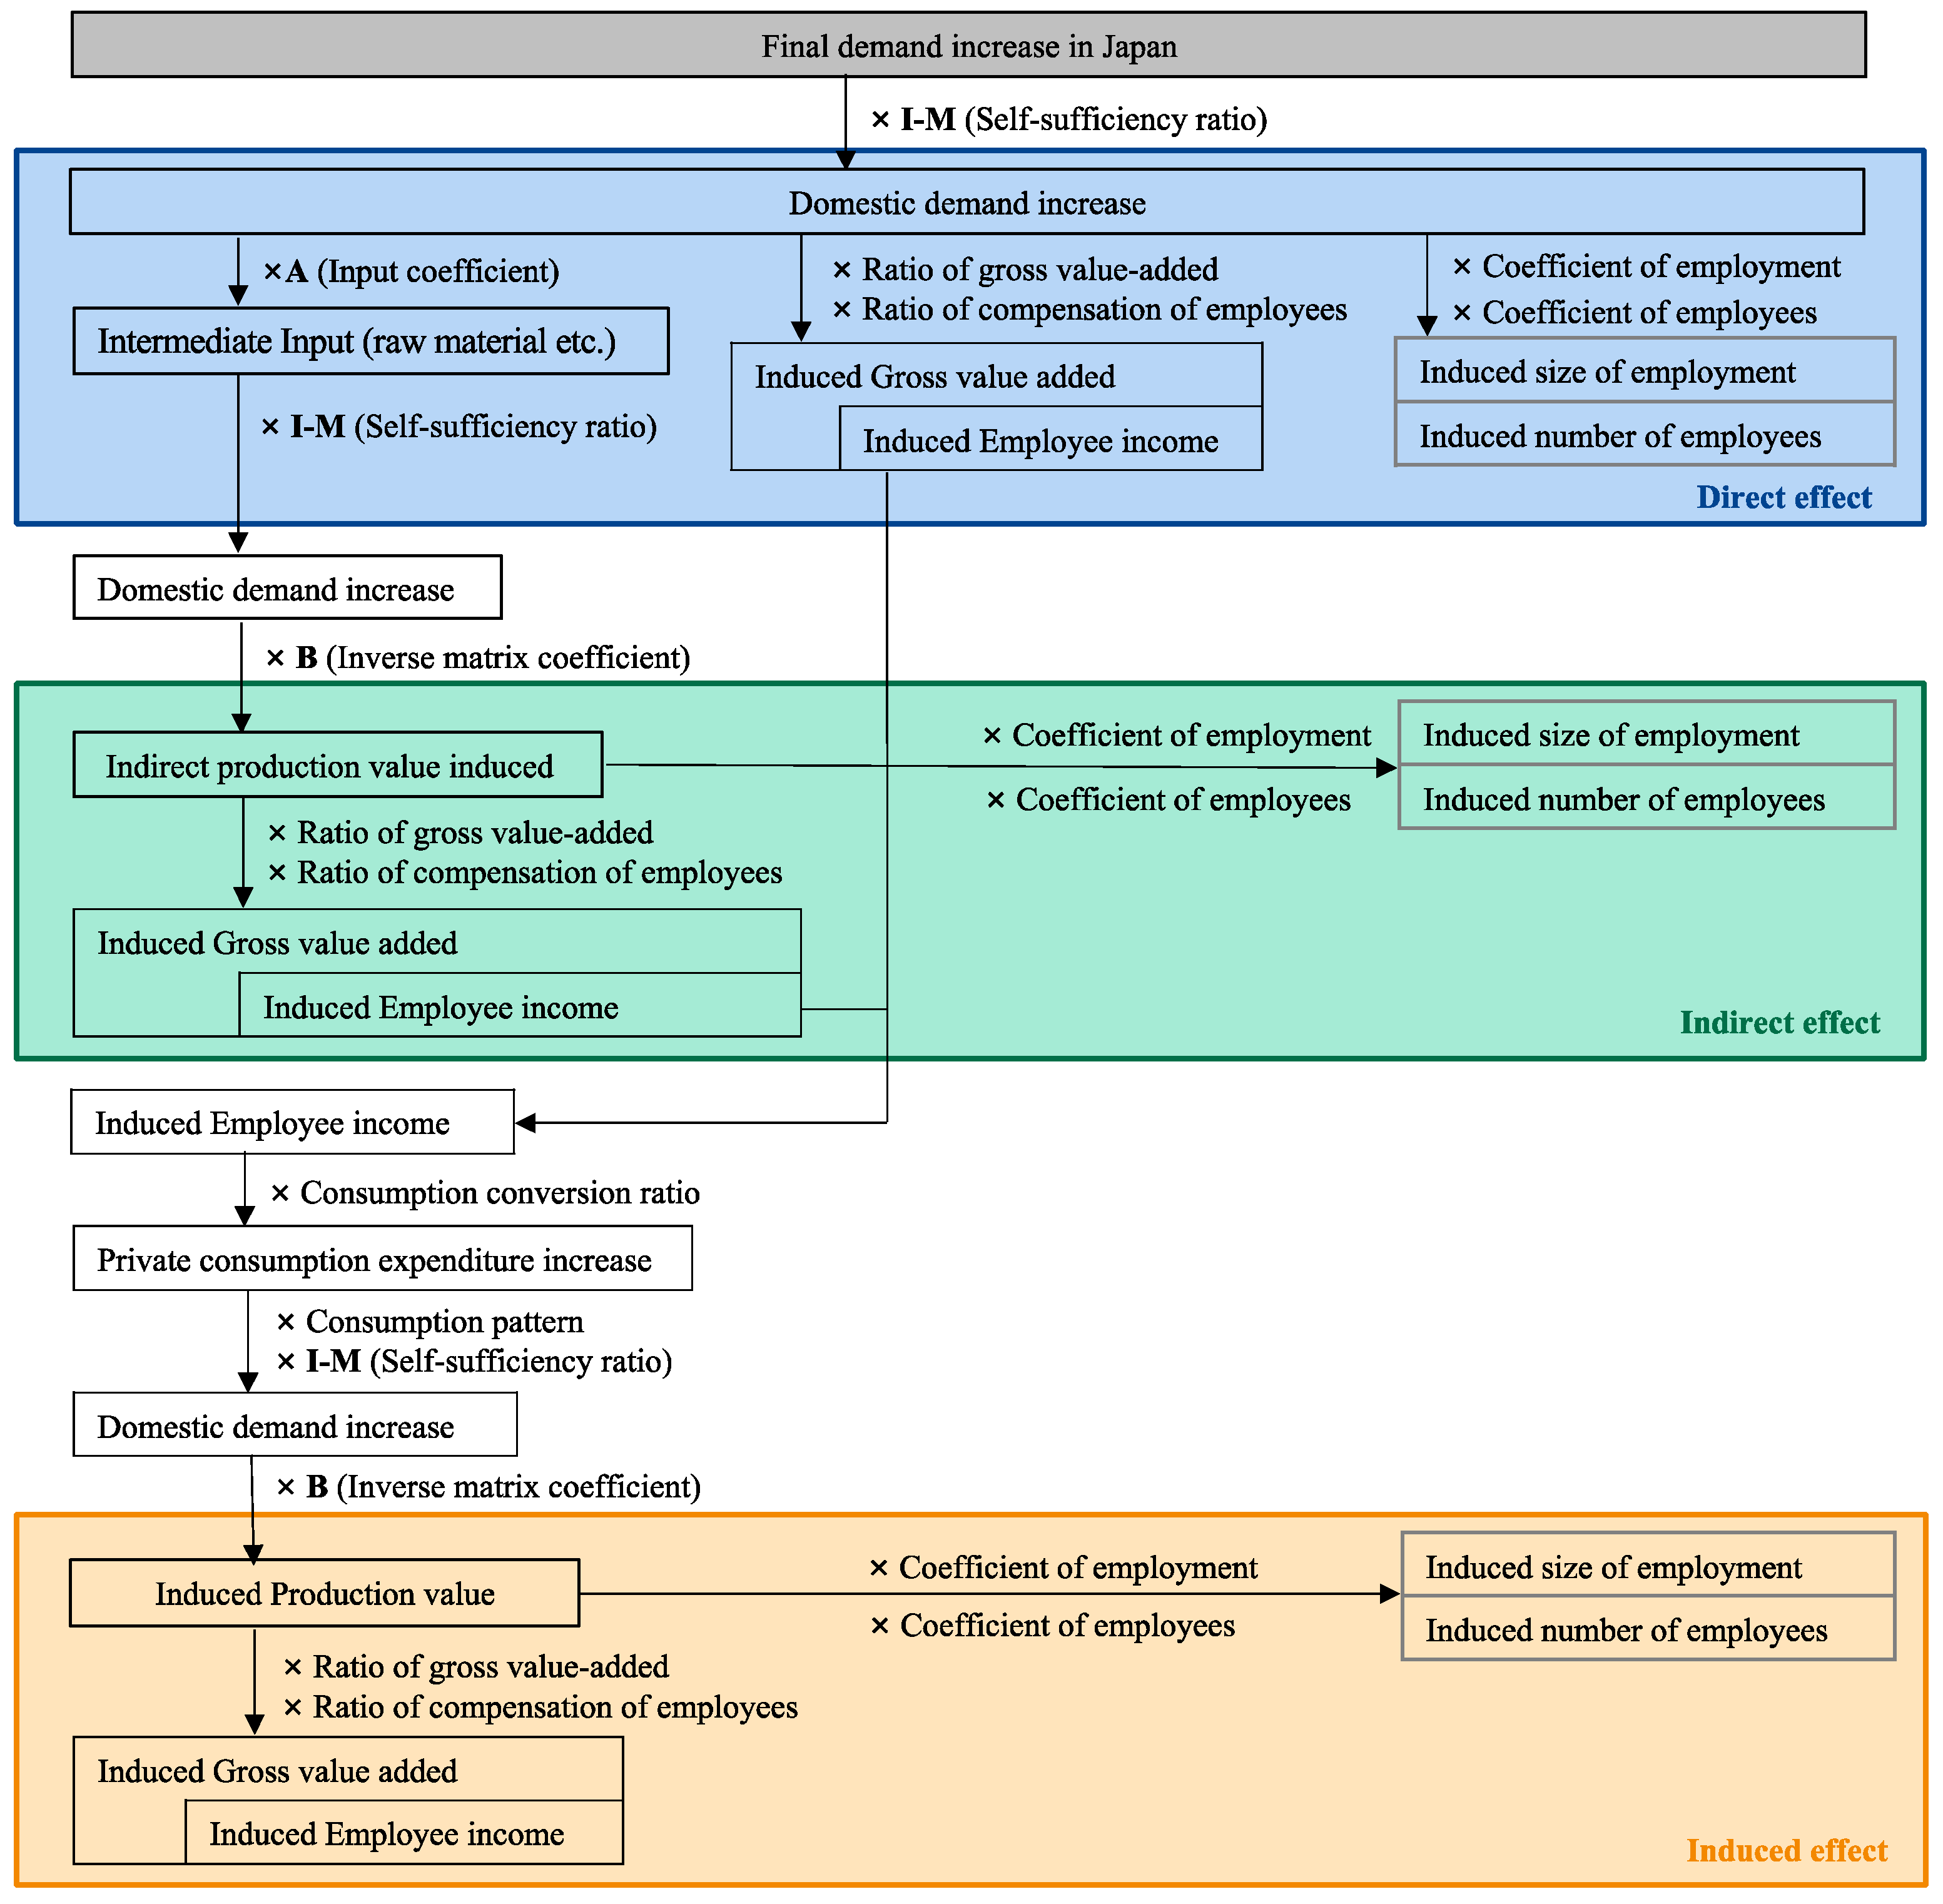
The economic ripple effect calculation flowchart is shown in Figure 4, which includes production and employment ripple effects. The manufacturing expenditures of CLT were regarded as an increase in final demand, and then a quantified economic ripple effect calculation was performed.
The gross value-added ratio was calculated by dividing the gross value added of sectors by the corresponding value of domestic production. The compensation ratio of employees was calculated by dividing employees’ income per sector by the corresponding value of domestic production. The consumption conversion ratio was calculated by dividing consumption expenditure by the real income. As there was a difference in the ratio of consumption conversion each year, a 3-year moving average was used to calculate the ratio of consumption conversion [34]. The consumption pattern was calculated by dividing the household consumption expenditure per sector by the total household consumption expenditure. The employment coefficient was calculated by dividing the total number of employments in each sector by the corresponding value of domestic production. The total number of employments includes individual employers, family employees, paid directors, and employees. The employee coefficient was calculated by dividing the number of paid directors and employees in each sector by the corresponding value of domestic production [35].
The size of the induced employment for the direct effect was calculated by increasing the domestic final demand multiplied by the employment coefficient. The size of the induced employment for the indirect effect was calculated by the indirect production value induced per sector multiplied by the corresponding employment coefficient. The size of the induced employment for the induced effect was calculated by the induced production value per sector multiplied by the corresponding employment coefficient. The size of the induced employment for the total effect was the cumulative size of induced employment of the direct, indirect, and induced effects.
3. Results
3.1. Economic Ripple Effects of CLT Manufacturing and the GLT Sectors
The economic ripple effects of the CLT manufacturing sector and the GLT sector are shown in Table 2 and Table 3, respectively. As an intermediate sector, the CLT manufacturing sector has both an input part (expenditure) and an output part (revenue), and the JPY 923,868,000 (USD 8,037,652) obtained by balancing the input and output was considered as the increase in final demand for CLT manufacturing. The total production value induced was JPY 2,304,651,000 (USD 20,050,464), the total gross value added induced was JPY 1,022,193,000 (USD 8,893,079), and the total employee income induced was JPY 375,392,000. The production ripple effect multiplier was 2.49, indicating that the production ripple effect in the CLT manufacturing sector was 2.49 times the increase in the final demand. According to the survey of 33 employees as a direct effect of employment creation, the employment induced by direct, indirect, induced, and total effects were 33.00, 63.82, 19.51, and 116.34 persons, respectively, and the indirect effect of employment induced increased significantly. The top five sectors with employment induced were timber, silviculture, road freight transport (expect self-transport), logs, and miscellaneous business services (Table 4). The employment ripple effect multiplier was 3.53, which indicated that the employment ripple effect in the CLT manufacturing sector was 3.53 times greater than the direct employees. The employees induced by direct, indirect, induced, and total effects were 33.00, 47.07, 15.87, and 95.94 people, respectively. The top five sectors with employees induced were timber, road freight transport (expect self-transport), logs, miscellaneous business services, and wholesale trade (Table 4). The results showed that forestry and timber-related industries dominated the induced employment sector.
To compare the economic ripple effects of the CLT manufacturing and GLT sectors, we assumed the same increase in the final demand and the number of employments. The JPY 923,868,000 (USD 8,037,652) and 33 people were also considered to be the increase in the final demand and the number of employments in the GLT sector. The total production value induced was JPY 1,249,899,000 (USD 10,874,121), the total gross value added induced was JPY 543,387,000, and the total employee income induced was JPY 194,524,000 (USD 1,692,359). The production ripple effect multiplier was 1.35, which indicated that the production ripple effect in the GLT sector was 1.35 times the increase in the final demand. The employment induced by direct, indirect, induced, and total effects was 33.00, 35.86, 10.10, and 78.96 people, respectively. The top five sectors with induced employment were silviculture, logs, wholesale trade, road freight transport (expect self-transport), and timber (Table 5). The employment ripple effect multiplier was 2.39. The employees induced by direct, indirect, induced, and total effects were 33.00, 23.77, 8.33, and 65.10 people, respectively. The top five sectors with induced employees were logs, wholesale trade, road freight transport (expect self-transport), miscellaneous business services, and retail trade (Table 5).
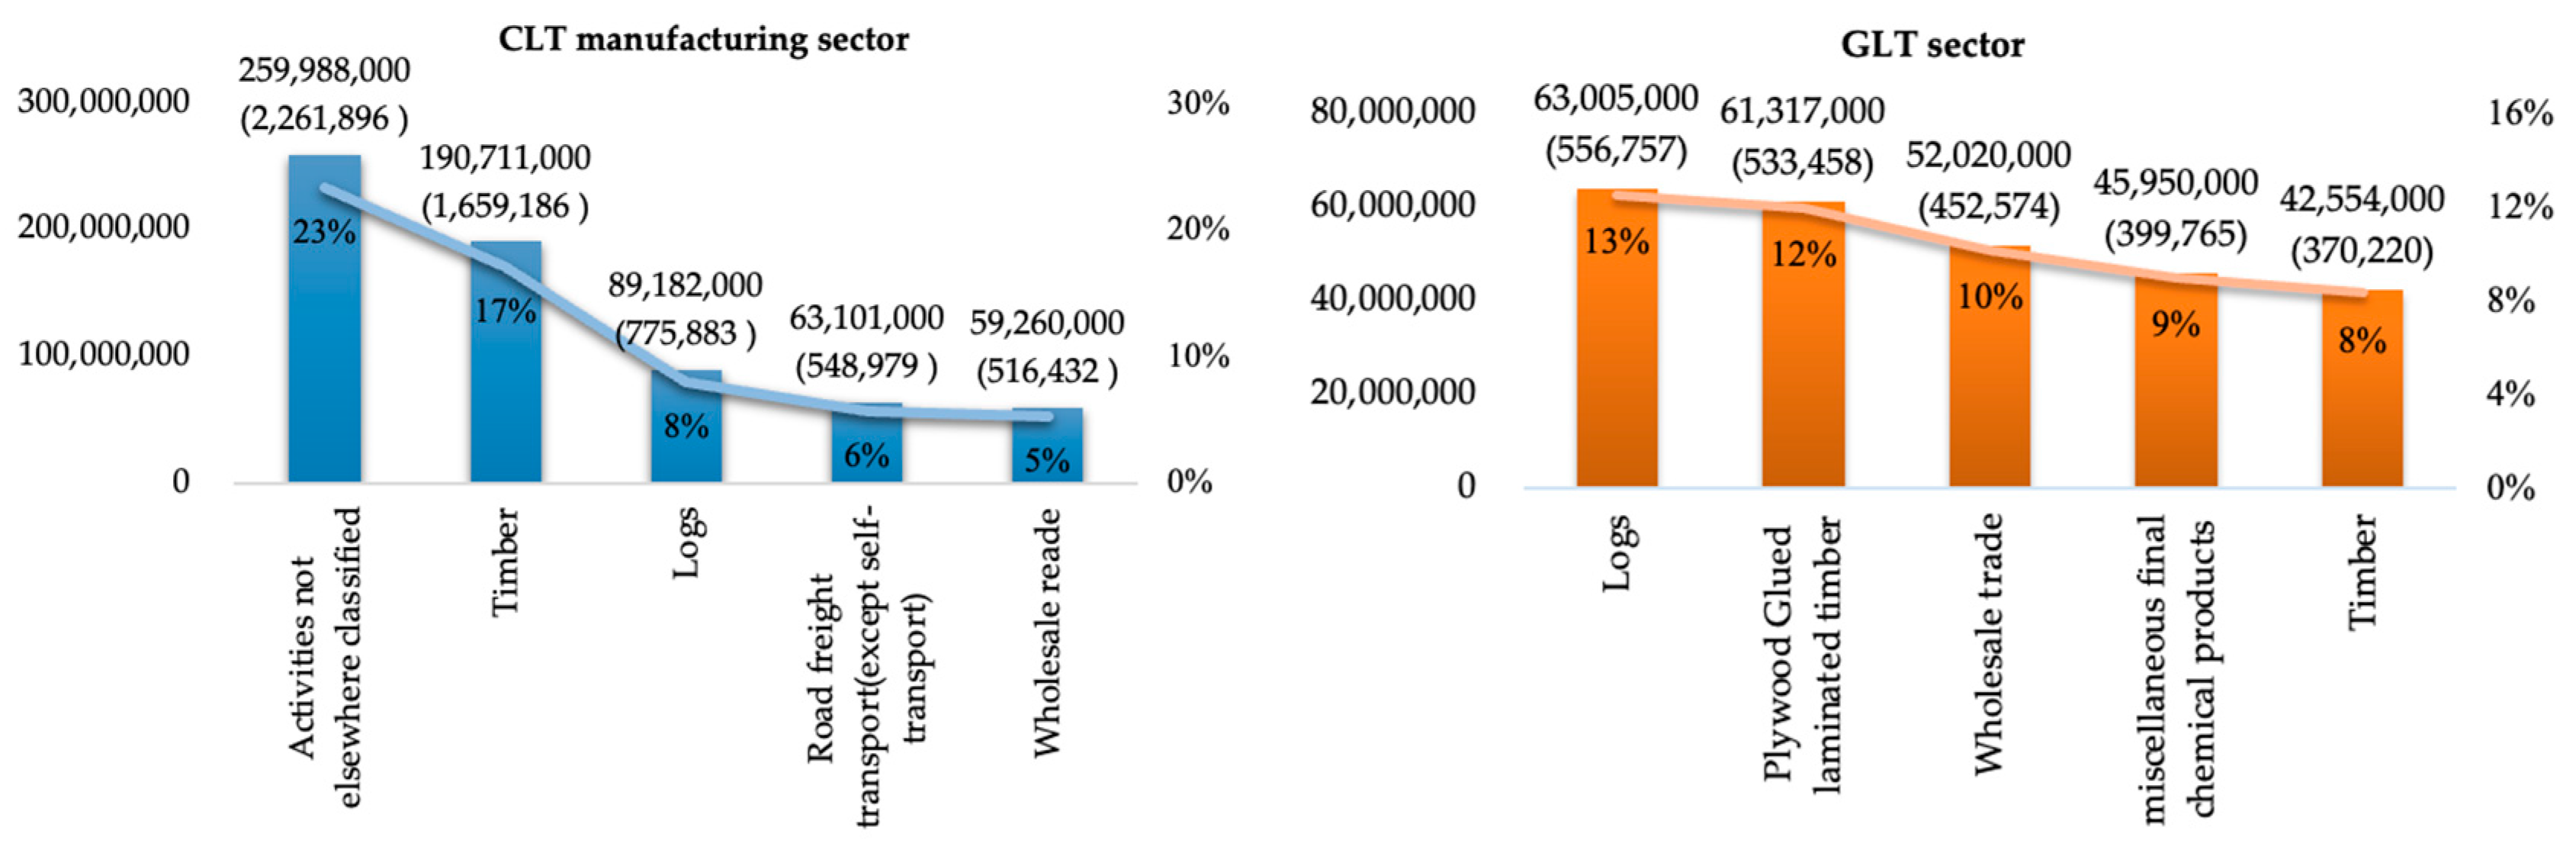
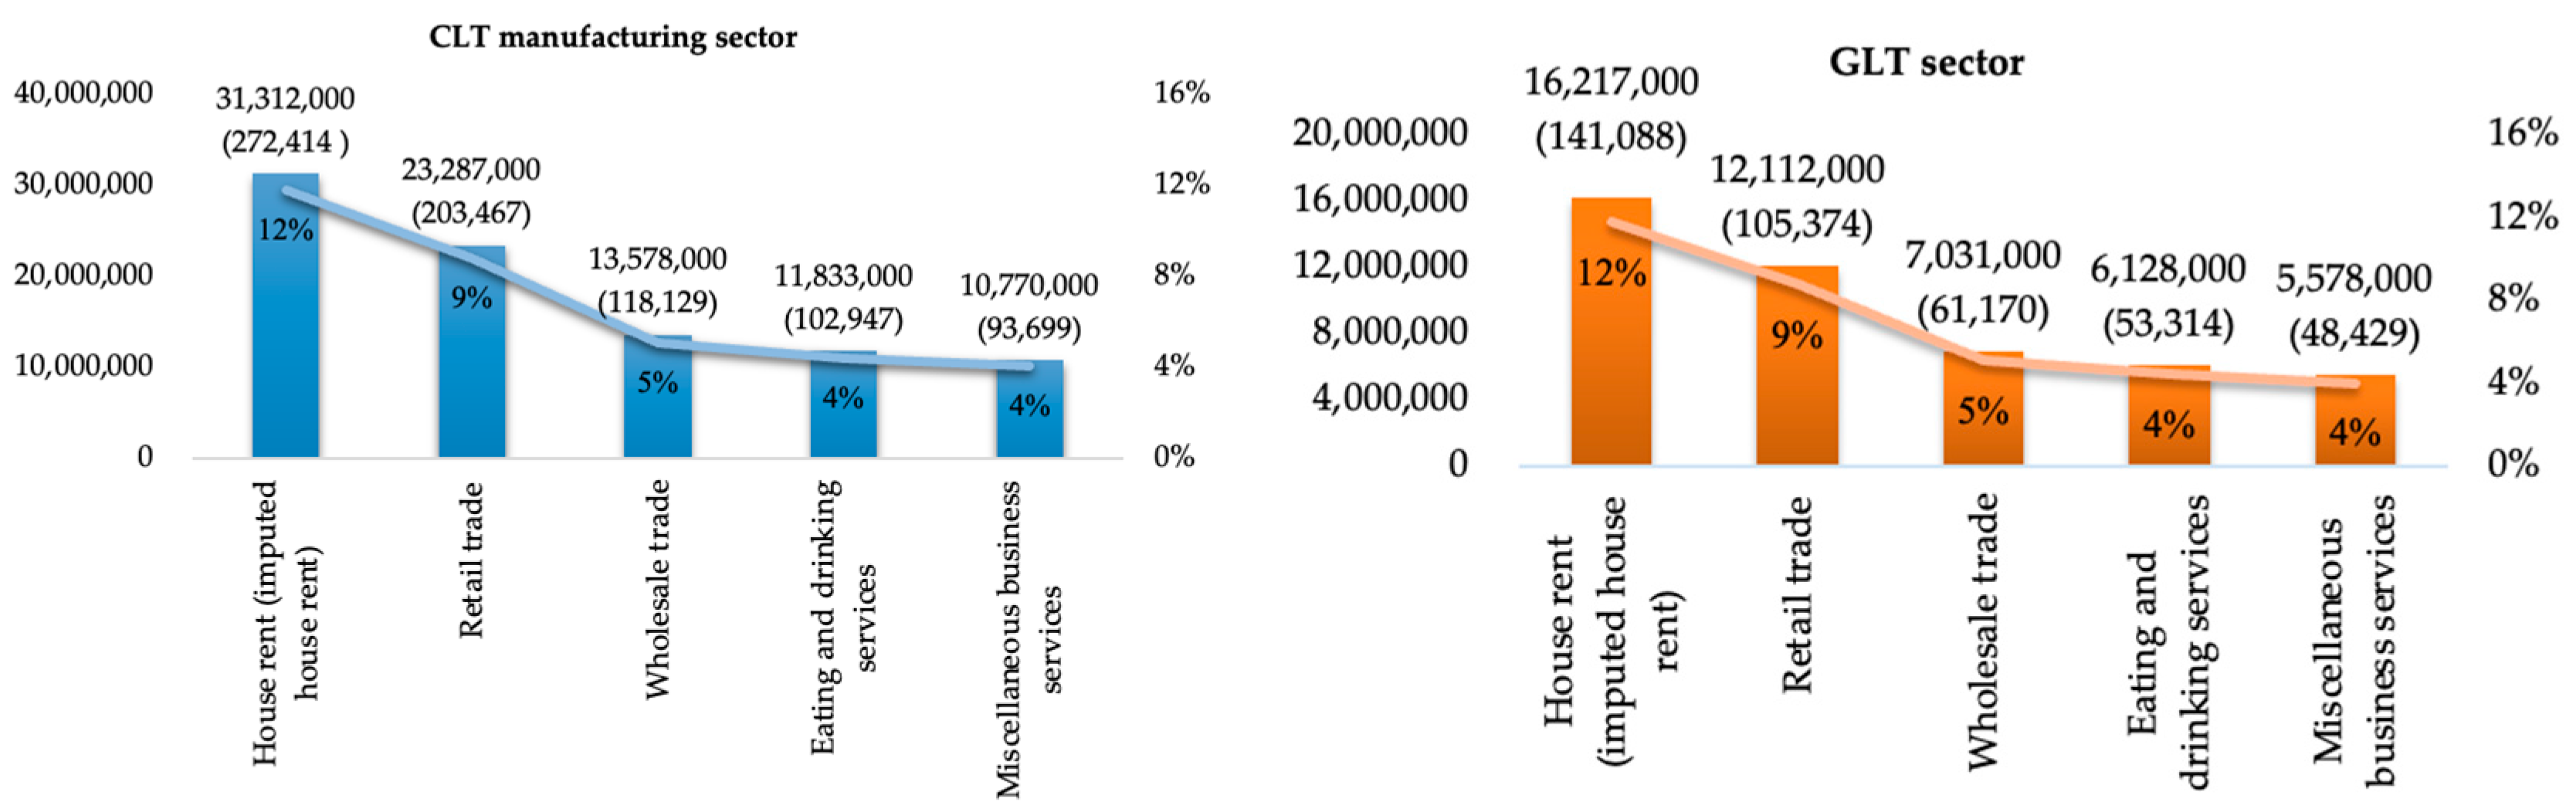
Figure 5 and Figure 6 present the top five sectors impacted by the indirect and induced effects in the CLT manufacturing and GLT sectors, respectively. The top five sectors impacted by indirect effects in the CLT manufacturing sector were activities not elsewhere classified, timber, logs, road freight transport (except self-transport), and wholesale trade, which accounted for 23%, 17%, 8%, 6%, and 5% of the indirect effects, respectively. The top five sectors impacted by the indirect effects in the GLT sector were logs, plywood and GLT, wholesale trade, miscellaneous final chemical products, and timber. The top five sectors impacted by the induced effects in the CLT manufacturing sector and GLT sector were the same, which were house rent (imputed house rent), retail trade, wholesale trade, eating and drinking services, and miscellaneous business services, which accounted for 12%, 9%, 5%, 4%, and 4% of the induced effects, respectively. The induced effects indicated the general consumption activities of employees. The figures showed a generally similar structure of employee consumption in the CLT manufacturing and GLT sectors.
3.2. Comparison after Unifying the Domestic Self-Sufficiency
The results revealed that the economic ripple effects of the CLT manufacturing sector were significantly larger than those of the GLT sector, both in terms of the production ripple effects and employment ripple effects. According to the actual situation of CLT manufacturing, the main supply and manufacturing of wood came from Japan. Thus, we set the domestic self-sufficiency ratio of logs and timber to 100%. However, in the calculation of the economic ripple effect of the GLT sector, the current domestic self-sufficiency ratio of 70% for the logs sector and 63% for the timber sector was used. To eliminate the impact caused by different self-sufficiency ratios, we set the self-sufficiency ratio of the above two sectors to 100%. As a result, the production ripple effect of the GLT sector increased to JPY 1,362,063,000 (USD 11,849,948), and the production ripple multiplier was 1.47. The employment ripple effect increased to 91.55 people, and the employment ripple multiplier was 2.77 (Table 6).
Considering an extreme case, in addition to unifying the domestic self-sufficiency ratio of 100% for the logs and timber sectors, we set the domestic self-sufficiency ratio for the GLT sector to 100% (i.e., both plywood and GLT are produced domestically), at which point the direct effect was the same as for the CLT sector at JPY 923,868,000 (USD 8,037,652). Therefore, the production ripple effect of the GLT sector increased to JPY 2,209,218,000 (USD 19,220,197), and the production ripple multiplier was 2.39. The employment ripple effect increased to 130.01 people, and the employment ripple multiplier was 3.94 (Table 7).
4. Discussion
4.1. Comparison between the CLT Manufacturing and GLT Sectors
To truly reflect the impact of the economic ripple effects of CLT manufacturing, we used an extended input–output table. The current input–output table was used with the same increase in final demand for a comparison with the GLT sector.
In terms of production ripple effects (Table 2 and Table 3), the total production ripple effect of the CLT manufacturing sector was 84% higher than that of the GLT sector. According to the survey, the logs and timber required for CLT manufacturing came from Japan, which increased the ripple effect to a certain extent.
In terms of employment creation (Table 4 and Table 5), higher production ripple effects were accompanied by higher employment size. The employment ripple effect of the CLT manufacturing sector was also much larger than that of the GLT sector, especially the indirect effect of 63.82 people, and CLT manufacturing had a significant effect on employment creation in timber, silviculture, and road freight transport sectors, while the GLT sector had a significant effect on employment creation in the silviculture, logs, and wholesale trade sectors, showing the difference in the talent required for employment creation in the CLT and GLT sectors. It is worth mentioning that in both the CLT manufacturing and the GLT sectors, silviculture greatly impacted the employment ripple effect, while the impact on the employee ripple effect was minimal owing to the larger share of individual workers and family workers in silviculture.
Regarding the top five sectors of indirect effects (Figure 5 and Figure 6), the indirect effects of CLT manufacturing on the timber and logs sectors accounted for 25% of the total indirect effects, and the economic effects of the two sectors were significant. The impacts of the GLT sector on the indirect effects of each sector were more balanced. As the GLT sector included both plywood and GLT, and plywood had a larger proportion, the economic impact of manufacturing GLT was weakened in the current input–output tables. It is worth noting that the activities not elsewhere classified sector also accounted for a large percentage of the indirect effect. To balance the residuals in the row and column sectors in an input–output table, the residuals could be placed in the activities not elsewhere classified sector as the endogenous sector and the operating surplus of the exogenous sector. In our calculations, we found that the residuals were mainly caused by the residential and non-residential construction sectors of the endogenous sector. Thus, we placed the residuals in the activities not elsewhere classified as the endogenous sector, which did not impact the calculation results much.
The economic ripple effect of the GLT sector increased when the domestic self-sufficiency ratios for the logs and timber sectors were unified to 100% (Table 6), at which point the production ripple effect of the CLT sector was 69% higher than that of the GLT sector. If the domestic self-sufficiency ratio for the GLT sector was unified to 100% (Table 7), the production ripple effect of the CLT sector was still 4% higher than that of the GLT sector because the top five sectors of the indirect effect in the CLT sector were relatively larger and concentrated, while the ripple effect of each sector in the GLT sector was smaller and dispersed (Figure 5). However, the employment ripple effect of the CLT sector was lower than that of the GLT sector because the GLT sector had a larger employment coefficient (including the plywood and GLT sectors), and the employment ripple effect was more significant when the final demand increased. Therefore, for the CLT sector, the production ripple effect was more significant than the employment ripple effect.
4.2. Domestic Self-Sufficiency Ratios and CLT Prices for CLT Manufacturing
According to the above results, CLT manufacturing had a significant economic effect on the timber and logs sectors. Thus, we considered the impact of the domestic self-sufficiency of both sectors on the economic ripple effect of CLT manufacturing.
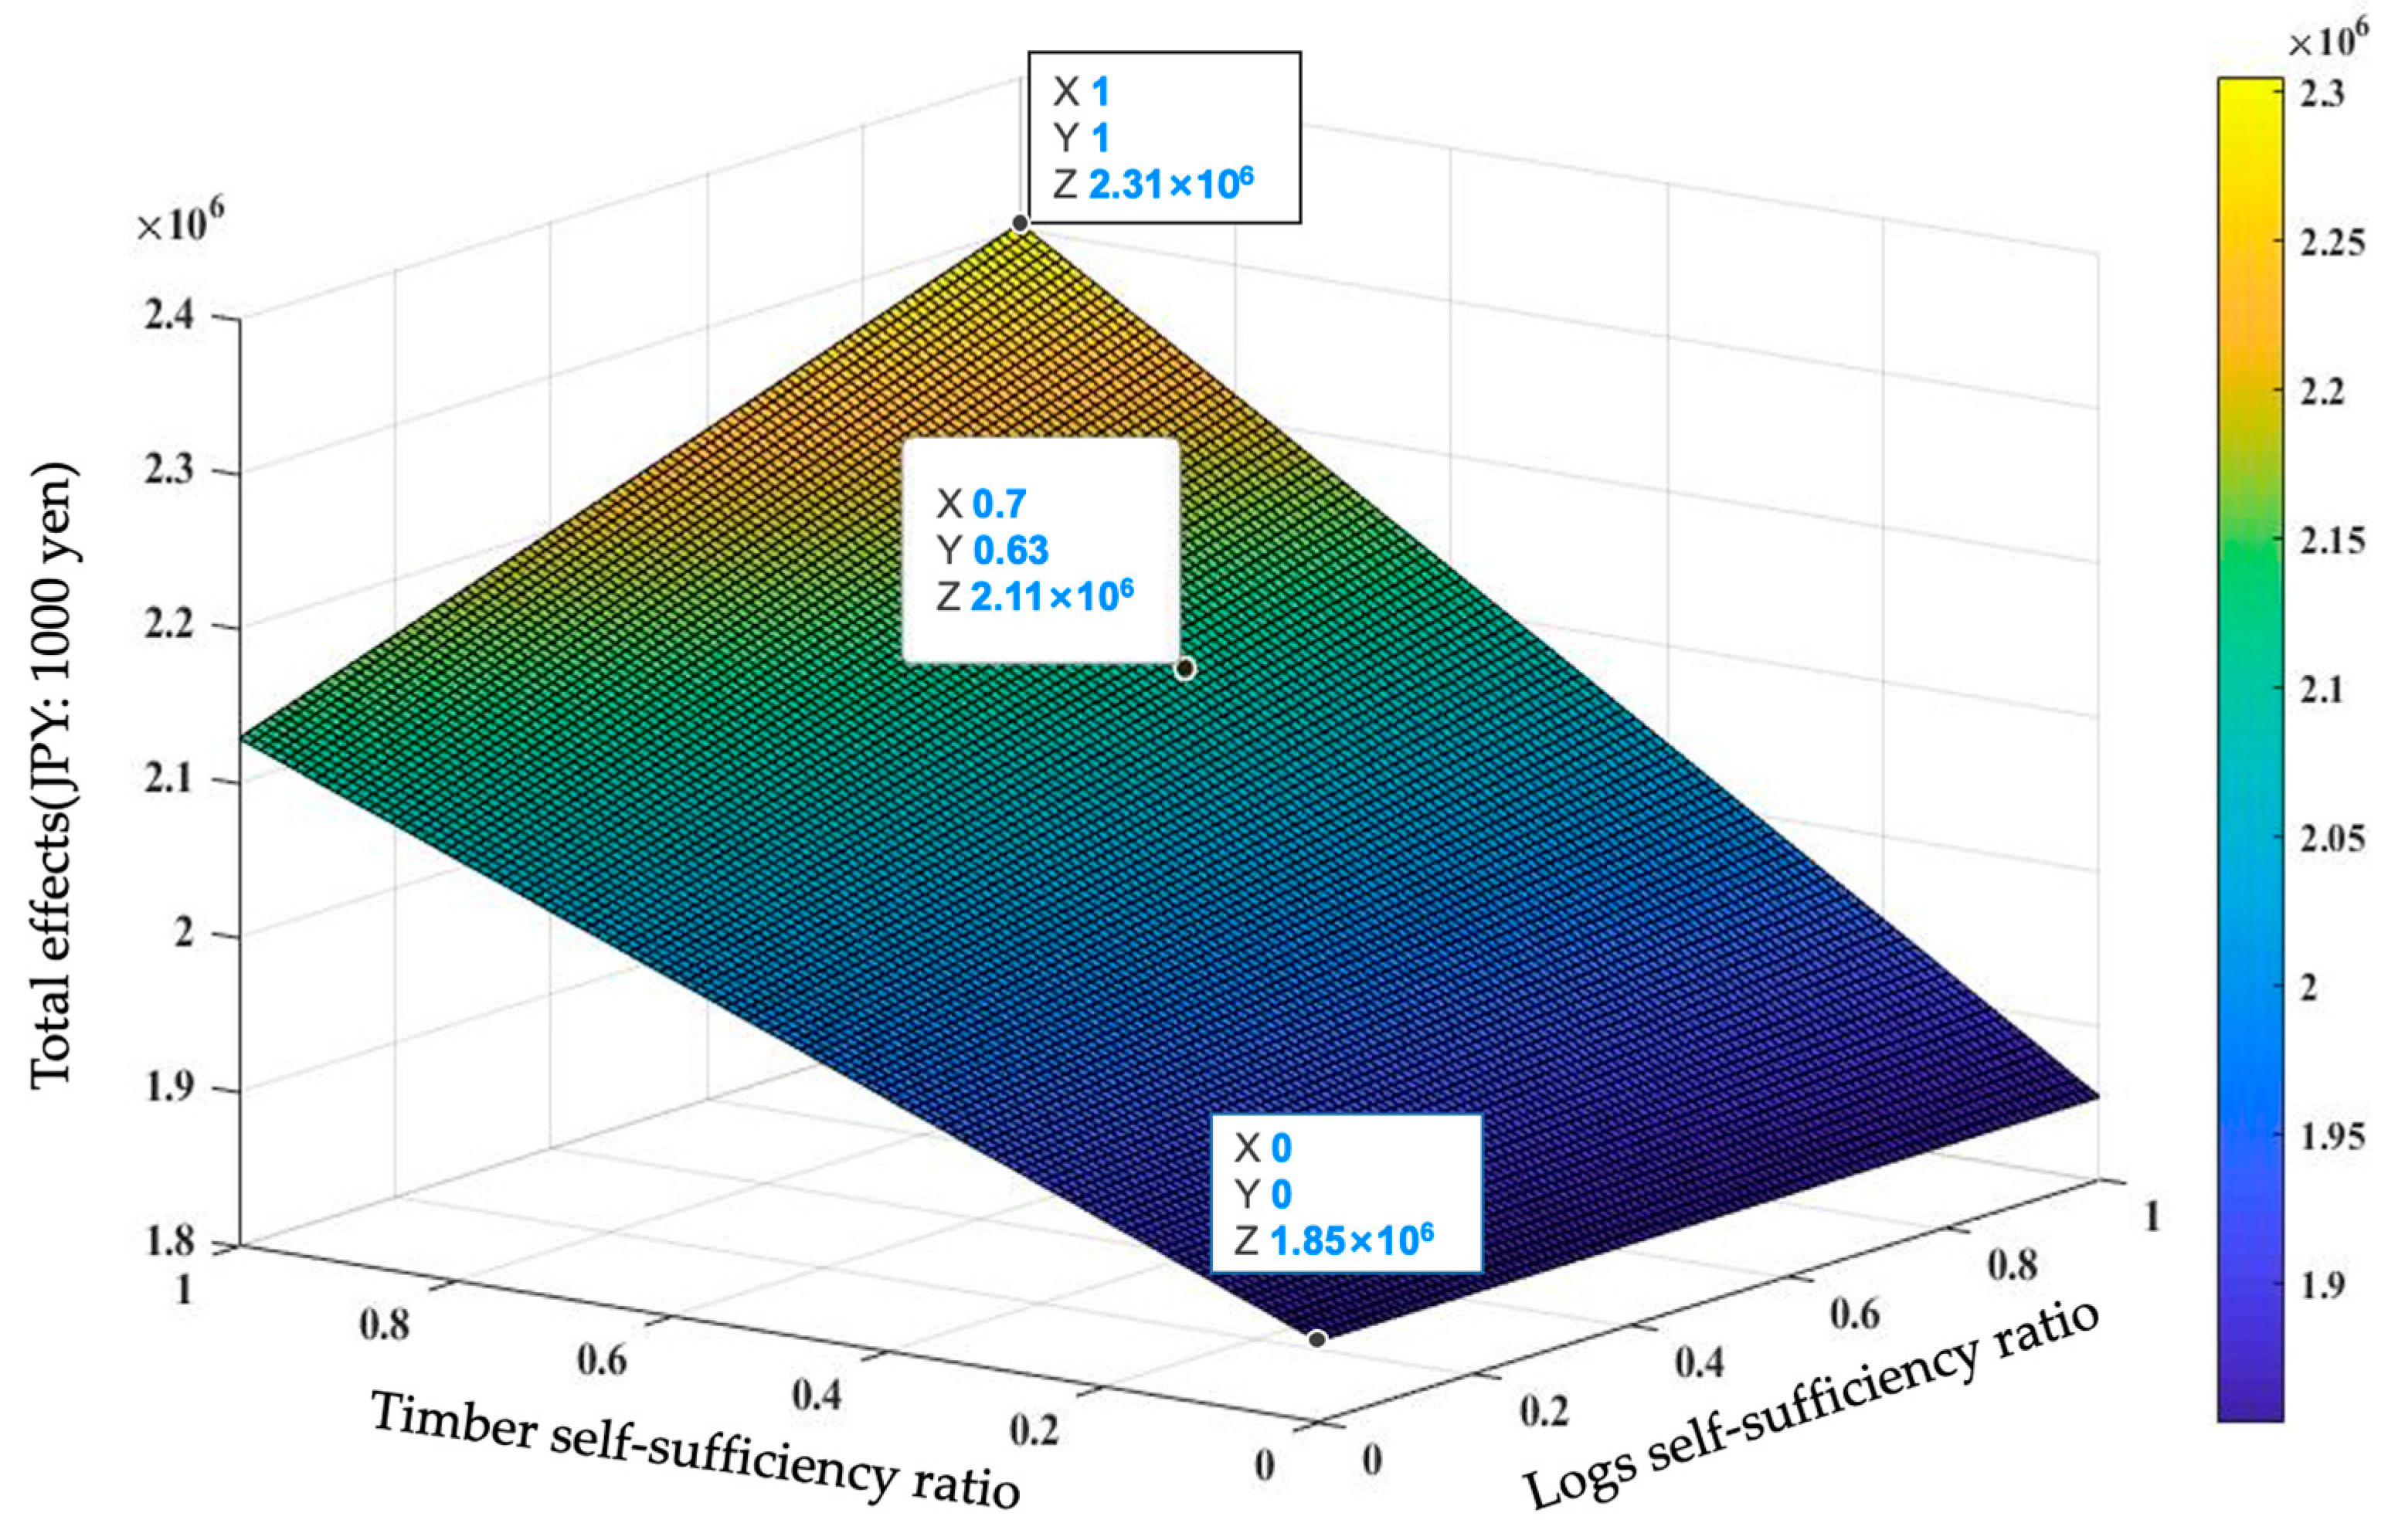
Figure 7 shows the impact of changes in the self-sufficiency ratio in timber and logs sectors on the total effect. The total effect (Z-axis) was positive on the self-sufficiency ratio of the logs sector (X-axis) and the self-sufficiency ratio of the timber sector (Y-axis). Since the domestic self-sufficiency ratio of the timber sector was more sensitive than that of the logs sector, the cost of laminas could be indirectly reduced without impacting the total production effect by harvesting nearby or importing cheaper logs for domestic processing. In addition, the total effect increased gradually with increasing self-sufficiency in the logs sector, indicating that domestically harvested logs had a positive economic impact. Meanwhile, Figure 7 labels the extreme case when the domestic self-sufficiency ratio of logs and timber was zero. The total effect at this point was JPY 1,853,000,000 (USD 16,121,100), which was still larger compared with the total effect of JPY 1,249,899,000 (USD 10,874,121) in the GLT sector (Table 3), indicating that the domestic manufacturing CLT did have a larger economic effect than the GLT sector. However, the reason for this was still the 100% self-sufficiency ratio in the CLT sector, that is, it was all manufactured domestically in Japan.
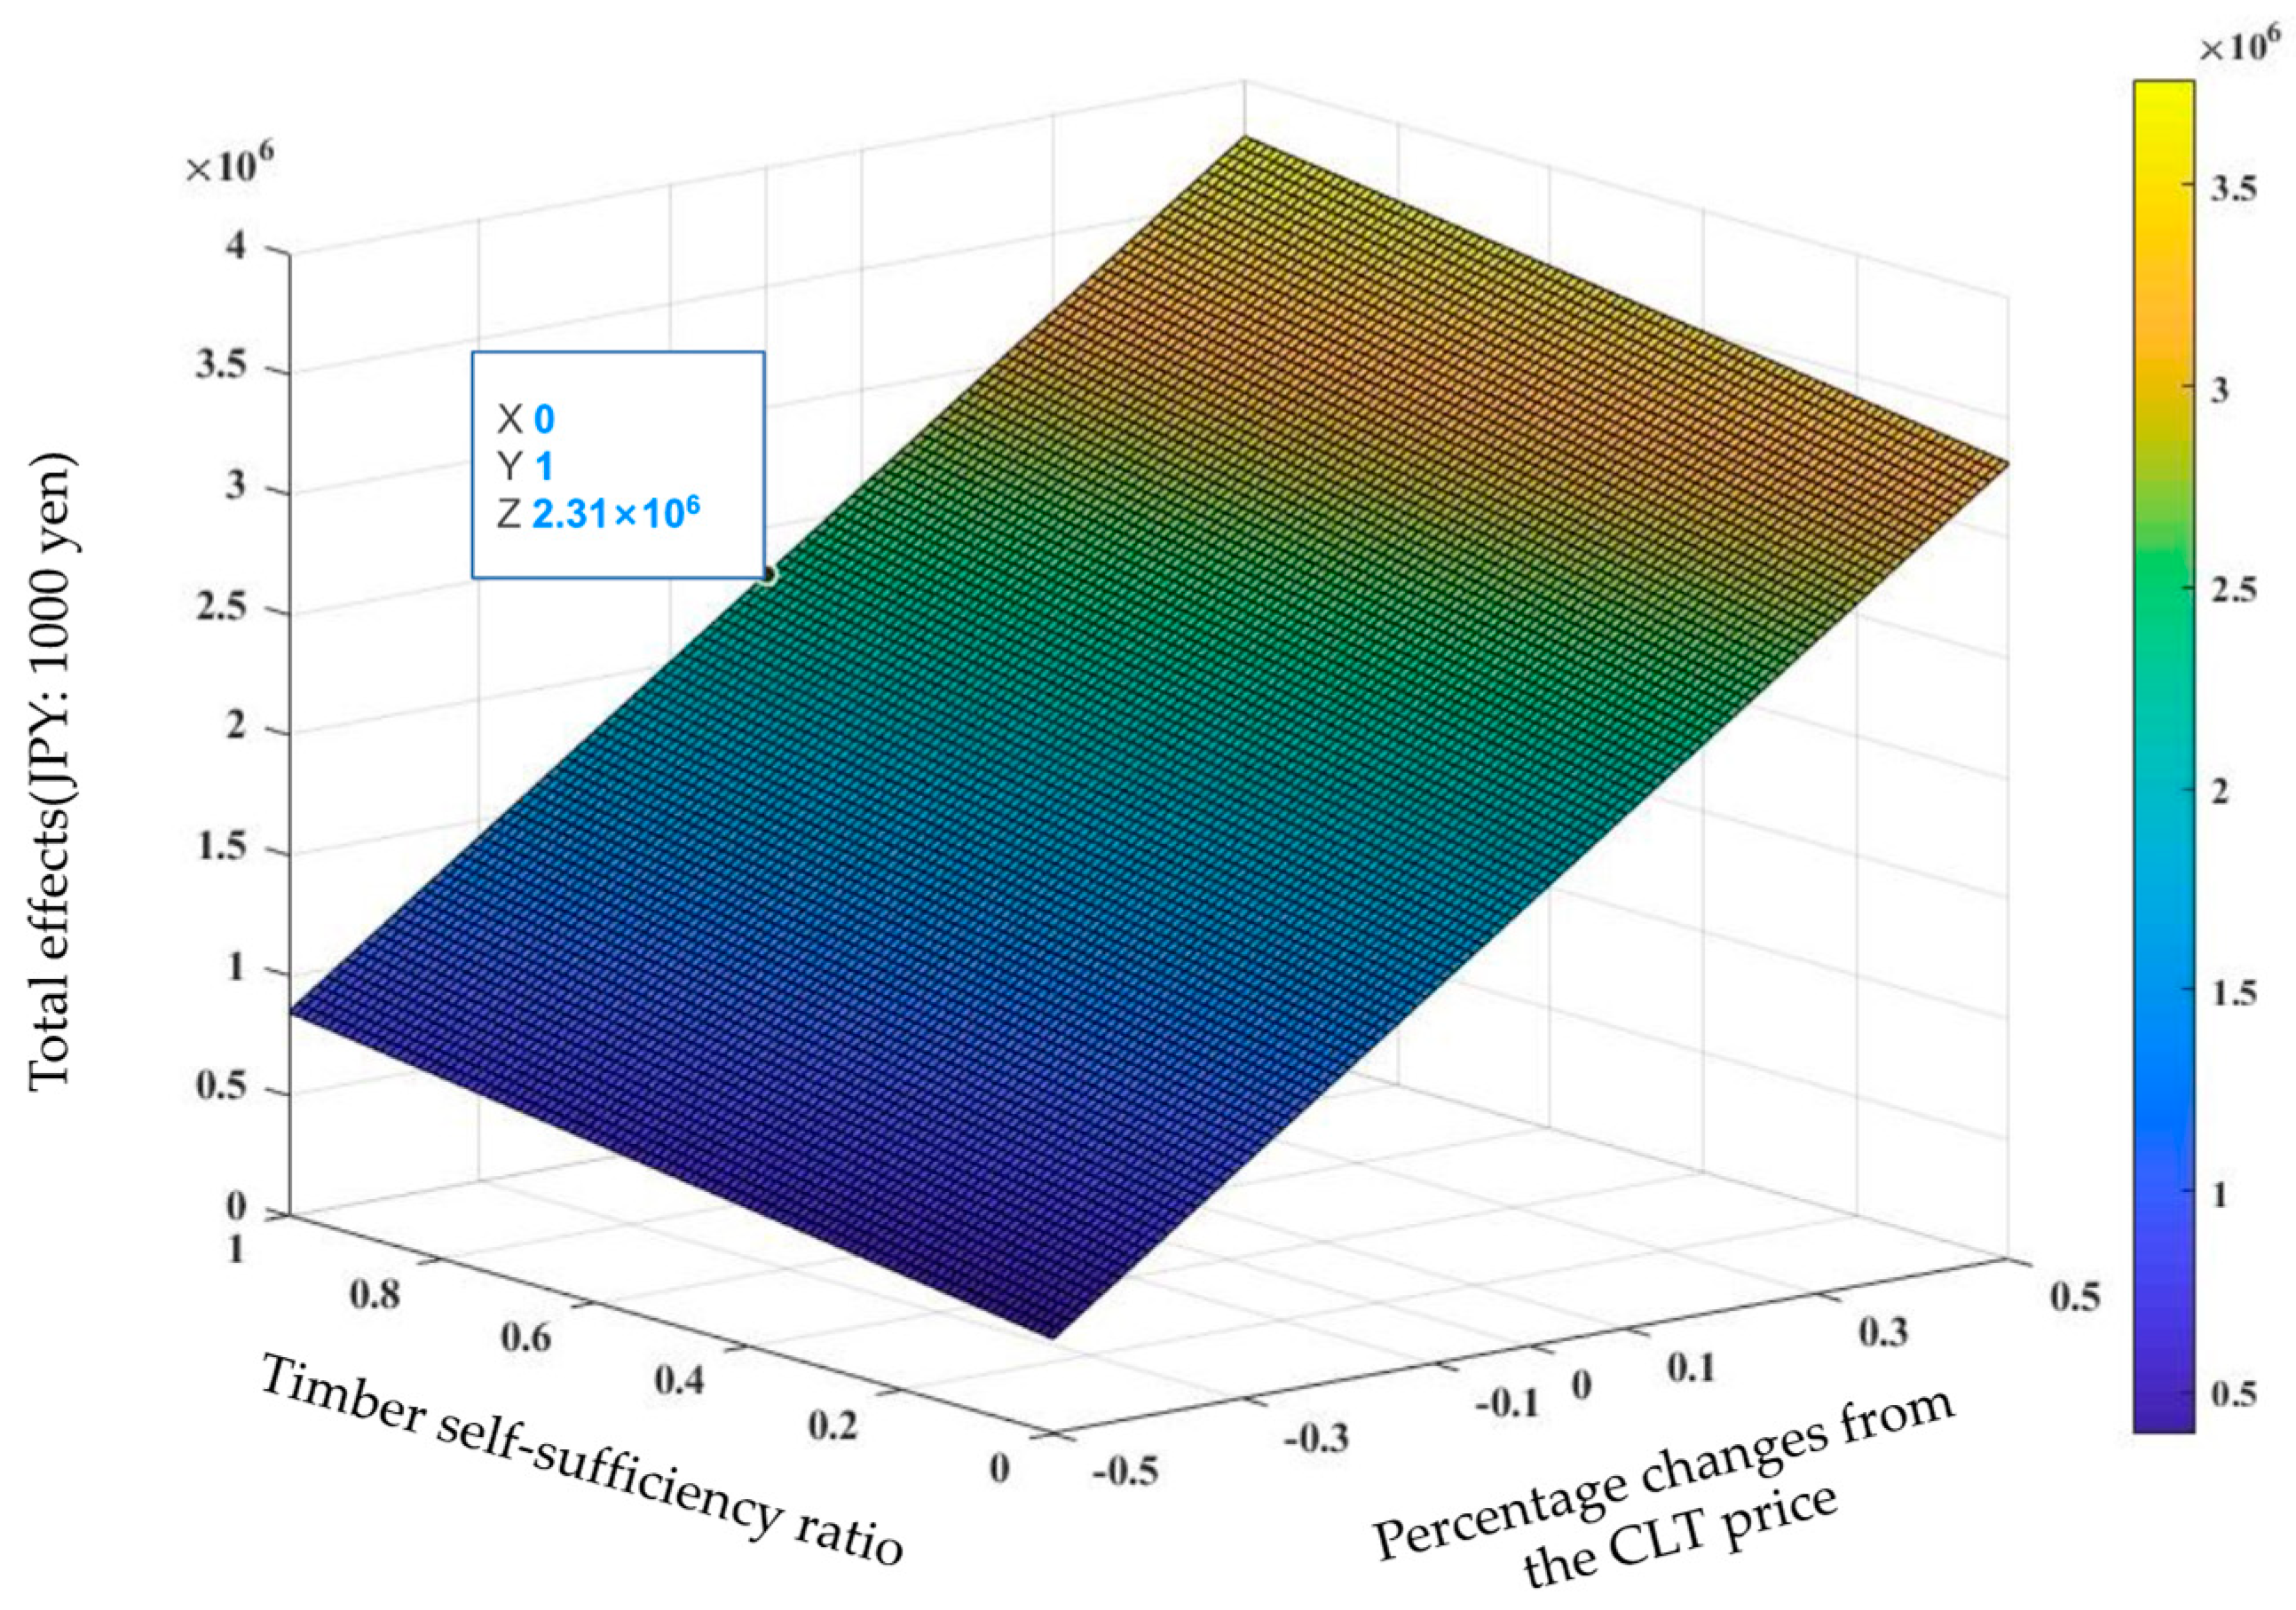
Figure 8 shows the impact of changes in the self-sufficiency ratio of the timber sector and CLT prices on the total effect when the domestic self-sufficiency ratio of the logs sector was 100%. The result indicated that the total effect was more sensitive to changes in CLT prices than domestic self-sufficiency in the timber sector, mainly because the CLT price directly impacted the final demand.
The current CLT promotion roadmap aims to achieve a sales price of 70,000–80,000 JPY/m3 (609–696 USD/m3) and to establish a production system of 500,000 m3 [9]. In this study, if the CLT price was reduced to 75,000 JPY/m3 (656 USD/m3) (half of the current price of 150,000 JPY/m3 (1305 USD/m3) and the manufacturing volume remained unchanged, the total production effect would be reduced by 63%, and if the manufacturing volume of CLT was doubled to 12,798 m3 simultaneously, the total production effect would remain unchanged. If CLT manufacturing continued to increase, the total effect growth rate decreased, although the total effect continued to increase. Although the results in Figure 8 indicate that the CLT price was positively related to the total effect, the large value of the total effect weakened the decreasing trend of the growth rate of the total effect, which will not grow indefinitely due to factors such as the CLT demand and production capacity.
4.3. Comparison with Previous Studies
The production ripple effect multiplier in this study was 2.49. In a previous study by Huzita et al. [12] on CLT for bridge repair, the maximum economic ripple multiplier for CLT during the bridge maintenance phase was 2.0. In Scouse et al.’s [22] study of the economic impact of CLT-related mass timber construction in Oregon, the economic multiplier was 1.75 when the total economic impact was USD 9.71 million. In addition, Huzita et al. [36], Higuma et al. [37], Fuchigami et al. [38], and Komata et al. [39] studied the economic ripple effects of regional timber for Akita, Saitama, Oita, and Hokkaido prefectures with production ripple multipliers of 1.94, 1.39, 1.65, and 1.76, respectively. The ripple effect multiplier of this study was greater than those of these prefectures because the laminas used to manufacture CLT were mainly sourced domestically from Japan. The production ripple effect in Fuchigami et al.’s [40] study of Kyoto lumber reached 2.71 when all lumber supplies were sourced domestically from the prefecture. Therefore, using domestic raw materials for CLT manufacturing had a significant economic impact.
5. Conclusions
This study developed an extended input–output table by adding a CLT manufacturing sector to calculate its economic ripple effect. Simultaneously, the economic ripple effects of the GLT sector were calculated for the same increase in final demand for comparison. The following are the key findings of this study:
- The total production ripple effect of the CLT manufacturing sector was JPY 2,304,651,000 (USD 20,050,464), with a production ripple multiplier of 2.49. The total production ripple effect of the GLT manufacturing sector was JPY 1,249,899,000 (USD 10,874,121), with a production ripple multiplier of 1.35. The results showed that CLT manufacturing had a significant economic impact on the timber and logs sectors.
- The employment ripple effect of the CLT manufacturing sector was 116.34 people, and the employment ripple multiplier was 3.53. In particular, the indirect effect of 63.82 people had the greatest impact on the employment of wood-related industries. CLT is still in the promotion stage in Japan, and the development of the CLT will contribute to the revitalization of forestry and wood-related industries.
- After unifying the logs, timber, and GLT sectors’ domestic self-sufficiency to 100%, the production ripple effect of the CLT manufacturing sector was still 4% higher than that of the GLT sector, indicating that the economic effects of CLT as a high-value-added material were underestimated. Therefore, it was necessary to consider adding the CLT manufacturing sector to the current input–output table to make it independent of the GLT sector. Moreover, we observed that domestic self-sufficiency had a significant economic effect in the CLT and GLT sectors; therefore, the focus should be on the domestic processing and manufacturing of the wood industry.
- If the price of CLT was reduced to 75,000 JPY/m3 (653 USD/m3) (half of the current price of 150,000 JPY/m3 (1305 USD/m3) while the manufacturing volume remained unchanged, the total production effect would be reduced by 63%. Therefore, while considering the reduction of CLT price, a corresponding manufacturing volume is required, but it is worth exploring whether manufacturing 500,000 m3 of CLT can achieve the maximum production effect under the trend of a decreasing growth rate of the total production effect.
The results of this study were based on a survey of the CLT manufacturers in 2020 and might be different depending on the duration considered and the sales price of CLT. A limitation of this study was that it only targeted one CLT manufacturer.
However, this study’s research method of using extended input–output tables to reflect the actual economic effects of an industry can be applied by industry policy researchers. Additionally, according to the results of the CLT study, we consider that CLT, as a high-value-added material, is likely to have its economic effects underestimated in current input–output tables compared with the traditional GLT sector; therefore, CLT can be considered independent of the GLT sector in input–output tables.
Author Contributions
Conceptualization, M.L. and C.K.; methodology, M.L., T.H. and C.K.; data curation, M.L., T.H., A.M. and C.K.; writing—original draft preparation, M.L.; writing—review and editing, M.L., A.M., C.S.G. and C.K. All authors have read and agreed to the published version of the manuscript.
Funding
This work was funded by the Japan Society for the Promotion of Science, grant number JP20H04384; the Kajima Foundation Fiscal 2021 Research Grant, grant number 4; Japan Cross-Laminated Timber Association Fiscal 2021 Grant; Institute of Global Innovation Research in Tokyo University of Agriculture and Technology; WISE Program for 2021 Proposal-Based Project in Tokyo University of Agriculture and Technology; and FLOuRISH JIRITSU Fellowship in Tokyo University of Agriculture and Technology.
Data Availability Statement
The data presented in this study are available on request from the corresponding author.
Acknowledgments
We are deeply grateful to the Meiken Lamwood Corp. for providing invaluable data and assistance for this study.
Conflicts of Interest
The authors declare no conflict of interest. The funders had no role in the design of the study; in the collection, analyses, or interpretation of data; in the writing of the manuscript; or in the decision to publish the results.
References
- Albee, R.R. Global Overview of the Cross-laminated Timber Industry. Master’s Thesis, Oregon State University, Corvallis, OR, USA, 2019. [Google Scholar]
- Brandner, R.; Flatscher, G.; Ringhofer, A.; Schickhofer, G.; Thiel, A. Cross laminated timber (CLT): Overview and development. Eur. J. Wood Wood Prod. 2016, 74, 331–351. [Google Scholar] [CrossRef]
- Espinoza, O.; Buehlmann, U. Cross-laminated timber in the USA: Opportunity for hardwoods? Curr. For. Rep. 2018, 4, 1–12. [Google Scholar] [CrossRef]
- Muszynski, L.; Hansen, E.; Fernando, S.; Schwarzman, G.; Rainer, J. Insights into the global cross-laminated timber industry. BioProd. Bus. 2017, 22, 77–92. [Google Scholar]
- Muszynski, L.; Larasatie, P.; Guerrero, J.E.; Albe, R.; Hansen, E.N. Global CLT industry in 2020: Growth beyond the Alpine Region. In Proceedings of the 63rd International Convention of Society of Wood Science and Technology, Virtual Conference, 12–17 July 2020. [Google Scholar]
- Forest Products Annual Market Review 2020–2021; Food and Agriculture Organization of the United Nations: Rome, Italy, 2021; p. 70.
- Trends in Forests and Forestry in FY2020. 2021. Available online: https://www.rinya.maff.go.jp/j/kikaku/hakusyo/R2hakusyo/attach/pdf/zenbun-64.pdf (accessed on 1 June 2021).
- Supply and Demand Table of Wood in 2020. 2021. Available online: https://www.rinya.maff.go.jp/j/press/kikaku/attach/pdf/210930-2.pdf (accessed on 30 September 2021).
- New Roadmap for the Diffusion of CLT. 2021. Available online: https://www.cas.go.jp/jp/seisaku/cltmadoguchi/pdf/r3_roadmap.pdf (accessed on 25 March 2021).
- Evans, L. Cross-Laminated Timber: Taking Wood Buildings to the Next Level; Continuing Education Center: Statesville, NC, USA, 2013; Available online: https://studylib.net/doc/12742769/c-cross-laminated-timber-taking-wood-buildings-to-the-nex (accessed on 30 September 2018).
- Hassan, O.A.B.; Öberg, F.; Gezelius, E. Cross-laminated timber flooring and concrete slab flooring: A comparative study of structural design, economic and environmental consequences. J. Build. Eng. 2019, 26, 100881. [Google Scholar] [CrossRef]
- Huzita, T.; Sasaki, T.; Araki, S.; Kayo, C. Life cycle regional economic impacts of bridge repair using cross-laminated timber floor slabs: A case study in Akita Prefecture, Japan. Buildings 2022, 12, 158. [Google Scholar] [CrossRef]
- Japan CLT Association. Domestic CLT Manufacturing Enterprises. 2022. Available online: https://clta.jp/wp-content/uploads/2022/07/ce7fc35859a43bc2c96d218faa55bcff.pdf (accessed on 14 July 2022).
- Komata, H. Construction and Verification of Utilizing Models for Expansion of Domestic CLT. 2019. Available online: https://kaken.nii.ac.jp/en/file/KAKENHI-PROJECT-16H03128/16H03128seika.pdf (accessed on 20 June 2019).
- Albee, R.R.; Muszyński, L.; Hansen, E.N.; Knowles, C.D.; Larasatie, P.; Guerrero, J.E. Recent Developments in the Global Cross-laminated Timber (CLT) Market. In Proceedings of the WCTE 2018-World Conference on Timber Engineering: Seoul, Republic of Korea, 20–23 August 2018. [Google Scholar]
- Chen, C.X.; Pierobon, F.; Ganguly, I. Life cycle assessment (LCA) of cross-laminated timber (CLT) produced in Western Washington: The role of logistics and wood species mix. Sustainability 2019, 11, 1278. [Google Scholar] [CrossRef] [Green Version]
- Benedetti, F.; Rosales, V.; Jélvez, A.; Núñez, M.; Rebolledo, A.; Jara-Cisterna, A. Economic and technical analysis of CLT production facilities: An application to small and emerging markets. Eur. J. Wood Wood Prod. 2022, 80, 1247–1261. [Google Scholar] [CrossRef]
- Brandt, K.; Wilson, A.; Bender, D.; Dolan, J.D.; Wolcott, M.P. Techno-economic analysis for manufacturing cross-laminated timber. BioResources 2019, 14, 7790–7804. [Google Scholar] [CrossRef]
- Zhang, Z.; Lan, K. Understanding the impacts of plant capacities and uncertainties on the techno-economic analysis of cross-laminated timber production in the Southern U.S. J. Renew. Mater. 2022, 10, 53–73. [Google Scholar] [CrossRef]
- Burback, B.; Pei, S. Cross-laminated timber for single-family residential construction: Cost comparative study. J. Archit. Eng. 2017, 23, 06017002. [Google Scholar] [CrossRef]
- Cazemier, D.S. Comparing cross laminated timber with concrete and steel: A financial analysis of two buildings in Australia. In Modular and Offsite Construction (MOC) Summit Proceedings; University of Alberta Library: Edmonton, AB, Canada, 2017. [Google Scholar]
- Iwase, T.; Sasaki, T.; Araki, S.; Huzita, T.; Kayo, C. Environmental and economic evaluation of small-scale bridge repair using cross-laminated timber floor slabs. Sustainability 2020, 12, 3424. [Google Scholar] [CrossRef] [Green Version]
- Scouse, A.; Kelley, S.S.; Liang, S.; Bergman, R. Regional and net economic impacts of high-rise mass timber construction in Oregon. Sustain. Cities Soc. 2020, 61, 102154. [Google Scholar] [CrossRef]
- Ministry of Internal Affairs and Communications. 2015 Input-Output Tables for Japan, Basic Transaction Tables (Producer Price Valuation) (Integrated Sub-Categories). Available online: https://www.e-stat.go.jp/stat-search/files?page=1&layout=datalist&toukei=00200603&tstat=000001130583&cycle=0&year=20150&month=0&stat_infid=000031839446&tclass1val=0 (accessed on 27 June 2019).
- Ministry of Internal Affairs and Communications. 2015 Input-Output Tables for Japan, Explanatory Report. Chapter Ⅶ Concept, Definition, and Scope by Sector. Available online: https://www.soumu.go.jp/main_content/000732915.pdf (accessed on 31 January 2021).
- Read This to Understand CLT. 2016. Available online: https://clta.jp/wp-content/uploads/2017/04/CLT_BOOK_28P_FIX_9MB.pdf (accessed on 15 April 2016).
- Survey of Wood Distribution Statistics. 2022. Available online: https://www.maff.go.jp/j/tokei/kouhyou/mokuryu/kakaku/attach/pdf/index-15.pdf (accessed on 5 September 2022).
- MEIKEN LAMWOOD Corp. 2022. Available online: https://www.meikenkogyo.com/company/ (accessed on 25 March 2022).
- Huzita, T.; Noda, R.; Kayo, C. Regional economic impacts from timber check dam construction—A comparison with concrete check dam construction. Forests 2020, 11, 1073. [Google Scholar] [CrossRef]
- Watson, P.; Wilson, J.; Thilmany, D.; Winter, S. Determining economic contributions and impacts: What is the difference and why do we care? J. Reg. Anal. 2007, 37, 140–146. [Google Scholar]
- Ministry of Internal Affairs and Communications. 2015 Input-Output Tables for Japan, Output Tables (Integrated Sub-Categories). Available online: https://www.e-stat.go.jp/stat-search/files?page=1&layout=datalist&toukei=00200603&tstat=000001130583&cycle=0&year=20150&month=0&stat_infid=000031839444&tclass1val=0 (accessed on 27 June 2019).
- Ministry of Internal Affairs and Communications. 2015 Input-Output Tables for Japan. Explanatory Report. Chapter Ⅳ Coefficients for Input-Output Analysis and Computation Methods. Available online: https://www.soumu.go.jp/main_content/000732915.pdf (accessed on 31 January 2021).
- Ministry of Internal Affairs and Communications. 2015 Input-Output Tables for Japan. Import Coefficients, Import Input Coefficients, Aggregate Import Coefficients, and Aggregate Gross Value Added Coefficients Table (Integrated Sub-Categories). Available online: https://www.e-stat.go.jp/stat-search/files?page=1&layout=datalist&toukei=00200603&tstat=000001130583&cycle=0&year=20150&month=0&stat_infid=000031839507&tclass1val=0 (accessed on 27 June 2019).
- Ministry of Internal Affairs and Communications. 2020 Family Income and Expenditure Survey. Yearly Average of Monthly Receipts and Disbursements Per Household (Workers’ Households of Total Households). Available online: https://www.e-stat.go.jp/statsearch/files?page=1&layout=datalist&toukei=00200561&tstat=000000330001&cycle=7&year=20200&month=0&tclass1=000000330001&tclass2=000000330019&tclass3=000000330021&stat_infid=000032106657&result_back=1&cycle_facet=tclass1%3Atclass2%3Atclass3%3Acycle&tclass4val=0 (accessed on 27 June 2019).
- Ministry of Internal Affairs and Communications. 2015 Input-Output Tables for Japan. Business, Household, Economy (187 Sectors). Available online: https://www.e-stat.go.jp/en/stat-search/files?page=1&layout=datalist&toukei=00200603&tstat=000001130583&cycle=0&year=20150&month=0&stat_infid=000031839522&tclass1val=0 (accessed on 27 June 2019).
- Huzita, T.; Kayo, C. Regional economic impacts from timber check dam construction—A comparison with concrete check dam construction, Part II: The question of premium vouchers. Forests 2021, 12, 347. [Google Scholar] [CrossRef]
- Higuma, Y.; Tachibana, S.; Ujiie, K. Economic ripple impact of utilization of local wood products on a public building: A case study of Sugito kindergarten-nursery school in Saitama Prefecture. J. Jpn. For. Soc. 2019, 101, 115–121. [Google Scholar] [CrossRef] [Green Version]
- Fuchigami, Y.; Nakai, T. Economic ripple effect analysis of using wood grown in Oita Prefecture, Japan, to build conventional wooden houses. Trans. Mat. Res. Soc. Jpn. 2020, 45, 103–108. [Google Scholar] [CrossRef]
- Komata, H.; Kato, Y.; Ohashi, Y.; Ishikawa, Y.; Ishiko, S.; Yamamoto, N. Economic repercussion effects using local wood products for wood frame construction in Hokkaido. J. Jpn. Wood Res. Soc. 2019, 58, 209–215. [Google Scholar] [CrossRef] [Green Version]
- Fuchigami, Y.; Kimura, Y.; Komata, H.; Sasaki, F.; Furuta, Y. Economic repercussions of using local wood products for public buildings-discussion of a case for Kyoto prefecture. J. Jpn. Wood Res. Soc. 2015, 61, 326–334. [Google Scholar] [CrossRef] [Green Version]
Figure 1.
CLT manufacturers certified by Japanese Agricultural Standards [13] (the name of the prefecture is in brackets; values represent the production capacity).
Figure 1.
CLT manufacturers certified by Japanese Agricultural Standards [13] (the name of the prefecture is in brackets; values represent the production capacity).

Figure 2.
Cost composition of CLT raw materials and origin.

Figure 3.
Schematic diagram of the extended input–output table.

Figure 4.
The flowchart of the economic ripple effect calculation.

Figure 5.
The top five sectors impacted by the indirect effects (unit: JPY (USD); “%” indicates the percentage of the sector relative to the indirect effect).
Figure 5.
The top five sectors impacted by the indirect effects (unit: JPY (USD); “%” indicates the percentage of the sector relative to the indirect effect).

Figure 6.
The top five sectors impacted by induced effects (unit: JPY (USD); “%” indicates the percentage of the sector relative to the induced effect).
Figure 6.
The top five sectors impacted by induced effects (unit: JPY (USD); “%” indicates the percentage of the sector relative to the induced effect).

Figure 7.
Impact of the changes in self-sufficiency ratios for the timber and logs sectors on the total effects. The labels indicate the total effects corresponding to the case of a certain self-sufficiency ratio.
Figure 7.
Impact of the changes in self-sufficiency ratios for the timber and logs sectors on the total effects. The labels indicate the total effects corresponding to the case of a certain self-sufficiency ratio.

Figure 8.
Impact of changes in the domestic self-sufficiency ratios for the timber and CLT price on the total effect. The labels indicate the total effects corresponding to the CLT sector in this study.
Figure 8.
Impact of changes in the domestic self-sufficiency ratios for the timber and CLT price on the total effect. The labels indicate the total effects corresponding to the CLT sector in this study.


Table 1.
Assigning expenditures to sectors.
| Materials and Expenditures | Sectors | |
|---|---|---|
| Intermediate Sector | Gross Value Added | |
| Material cost (lamina) | Timber | |
| Material cost (adhesive) | Miscellaneous final chemical products | |
| Material cost (some transportation costs) | Road freight transport (except self-transport) | |
| Salary allowance | Wages and salaries | |
| Excess work allowance | ||
| Bonuses | ||
| Legal welfare expenses | Consumption expenditure of households | |
| Welfare expenses | ||
| Freight | Road freight transport (except self-transport) | |
| Consumables expenses | Office supplies | |
| Vehicle-related expenses | Petroleum refinery products 40% Machine repair services 60% | |
| Rental expenses | Goods rental and leasing (except car rental) | |
| Insurance expenses | Insurance | |
| Repair expenses | Machine repair services | |
| Fuel expenses | Petroleum products | |
| Utility expenses | Electricity 94% Steam and hot water supply 5% Water supply 1% | |
| Packaging | Packaging | |
| Tax and rent | Indirect taxes (except custom duties and commodity taxes on imported goods) | |
| Travel and transportation expenses | Consumption expenditure of households | |
| Depreciation and amortization | Consumption of fixed capital | |
| Small depreciable assets | ||
| Lump-sum depreciable assets | ||
| Storage charges | Storage facility service | |
| Communication expenses | Communications | |
| Business fees | Miscellaneous business services | |
| Security and cleaning expenses | Wages and salaries | |
| Recruitment and training expenses | ||
| Meeting expenses | Office supplies | |
| Allocation to other departments | Wages and salaries | |
| Expense transfer (dry steam, etc.) | Activities not elsewhere classified | |
Table 2.
Economic ripple effects of the CLT manufacturing sector (unit: JPY (USD), people).
| Direct Effect | Indirect Effect | Induced Effect | Total Effect | Ripple Effect Multiplier | |
|---|---|---|---|---|---|
| Production induced | 923,868,000 (8,037,652) | 1,115,699,000 (9,706,581) | 265,084,000 (2,306,231) | 2,304,651,000 (20,050,464) | 2.49 |
| Gross value-added induced | 319,640,000 (2,780,868) | 547,385,000 (4,762,250) | 155,167,000 (1,349,953) | 1,022,193,000 (8,893,079) | |
| Employee income induced | 143,767,000 (1,250,773) | 179,836,000 (1,564,573) | 51,789,000 (450,564) | 375,392,000 (3,265,910) | |
| Employment induced | 33.00 | 63.82 | 19.51 | 116.34 | 3.53 |
| Employees induced | 33.00 | 47.07 | 15.87 | 95.94 |
Table 3.
Economic ripple effects of the GLT sector (unit: JPY (USD), people).
| Direct Effect | Indirect Effect | Induced Effect | Total Effect | Ripple Effect Multiplier | |
|---|---|---|---|---|---|
| Production induced | 602,341,000 (5,240,367) | 510,290,000 (4,439,523) | 137,268,000 (1,194,232) | 1,249,899,000 (10,874,121) | 1.35 |
| Gross value-added induced | 220,659,000 (1,919,733) | 241,363,000 (2,099,858) | 80,352,000 (699,062) | 543,387,000 (4,727,467) | |
| Employee income induced | 75,189,000 (654,144) | 92,407,000 (803,941) | 26,818,000 (233,317) | 194,524,000 (1,692,359) | |
| Employment induced | 33.00 | 35.86 | 10.10 | 78.96 | 2.39 |
| Employees induced | 33.00 | 23.77 | 8.33 | 65.10 |
Table 4.
Top five sectors with the largest employment impact in the CLT manufacturing sector (unit: people).
Table 4.
Top five sectors with the largest employment impact in the CLT manufacturing sector (unit: people).
| Employment Induced | Employees Induced | |||
|---|---|---|---|---|
| 1 | Timber | 12.20 | Timber | 9.51 |
| 2 | Silviculture | 11.62 | Road freight transport (except self-transport) | 8.21 |
| 3 | Road freight transport (except self-transport) | 8.65 | Logs | 5.90 |
| 4 | Logs | 8.28 | Miscellaneous business services | 5.11 |
| 5 | Miscellaneous business services | 5.94 | Wholesale trade | 4.36 |
Table 5.
Top five sectors with the largest employment impact in the GLT sector (unit: people).
| Employment Induced | Employees Induced | |||
|---|---|---|---|---|
| 1 | Silviculture | 8.33 | Logs | 4.23 |
| 2 | Logs | 5.94 | Wholesale trade | 3.53 |
| 3 | Wholesale trade | 3.65 | Road freight transport (except self-transport) | 2.80 |
| 4 | Road freight transport (except self-transport) | 2.95 | Miscellaneous business services | 2.23 |
| 5 | Timber | 2.72 | Retail trade | 2.21 |
Table 6.
Economic ripple effects of the GLT sector (after unifying two sectors’ self-sufficiency; unit: JPY (USD), people).
Table 6.
Economic ripple effects of the GLT sector (after unifying two sectors’ self-sufficiency; unit: JPY (USD), people).
| Direct Effect | Indirect Effect | Induced Effect | Total Effect | Ripple Effect Multiplier | |
|---|---|---|---|---|---|
| Production induced | 602,341,000 (5,240,367) | 606,104,000 (5,273,105) | 153,617,000 (1,336,468) | 1,362,063,000 (11,849,948) | 1.47 |
| Gross value-added induced | 220,659,000 (1,919,733) | 291,675,000 (2,537,573) | 89,920,000 (782,304) | 603,268,000 (5,248,432) | |
| Employee income induced | 75,189,000 (654,144) | 112,340,000 (977,358) | 30,012,000 (261,104) | 217,652,000 (1,893,572) | |
| Employment induced | 33.00 | 47.24 | 11.31 | 91.55 | 2.77 |
| Employees induced | 33.00 | 29.52 | 9.32 | 71.85 |
Table 7.
Economic ripple effects of the GLT sector (after unifying three sectors’ self-sufficiency; unit: JPY (USD), people).
Table 7.
Economic ripple effects of the GLT sector (after unifying three sectors’ self-sufficiency; unit: JPY (USD), people).
| Direct Effect | Indirect Effect | Induced Effect | Total Effect | Ripple Effect Multiplier | |
|---|---|---|---|---|---|
| Production induced | 923,868,000 (8,037,652) | 1,036,152,000 (9,014,522) | 249,198,000 (2,168,023) | 2,209,218,000 (19,220,197) | 2.39 |
| Gross value-added induced | 338,446,000 (2,944,480) | 492,526,000 (4,284,976) | 145,862,000 (1,268,999) | 978,478,000 (8,512,759) | |
| Employee income induced | 115,324,000 (1,003,319) | 188,836,000 (1,642,873) | 48,684,000 (423,551) | 353,023,000 (3,071,300) | |
| Employment induced | 33.00 | 78.66 | 18.34 | 130.01 | 3.94 |
| Employees induced | 33.00 | 49.77 | 15.12 | 97.89 |
Disclaimer/Publisher’s Note: The statements, opinions and data contained in all publications are solely those of the individual author(s) and contributor(s) and not of MDPI and/or the editor(s). MDPI and/or the editor(s) disclaim responsibility for any injury to people or property resulting from any ideas, methods, instructions or products referred to in the content. |
© 2023 by the authors. Licensee MDPI, Basel, Switzerland. This article is an open access article distributed under the terms and conditions of the Creative Commons Attribution (CC BY) license (https://creativecommons.org/licenses/by/4.0/).
Share and Cite
MDPI and ACS Style
Liu, M.; Huzita, T.; Murano, A.; Goh, C.S.; Kayo, C. Economic Ripple Effects Analysis of Cross-Laminated Timber Manufacturing in Japan. Forests 2023, 14, 492. https://doi.org/10.3390/f14030492
AMA Style
Liu M, Huzita T, Murano A, Goh CS, Kayo C. Economic Ripple Effects Analysis of Cross-Laminated Timber Manufacturing in Japan. Forests. 2023; 14(3):492. https://doi.org/10.3390/f14030492
Chicago/Turabian StyleLiu, Mengyuan, Tomohumi Huzita, Akito Murano, Chun Sheng Goh, and Chihiro Kayo. 2023. "Economic Ripple Effects Analysis of Cross-Laminated Timber Manufacturing in Japan" Forests 14, no. 3: 492. https://doi.org/10.3390/f14030492
Note that from the first issue of 2016, this journal uses article numbers instead of page numbers. See further details here.