Gene Flow and Recruitment Patterns among Disjunct Populations of Allocasuarina verticillata (Lam.) L.A.S. Johnson
by
 , ,
, ,
Yong Zhang
1,2,* ,
,
Nigel England
2,
Linda Broadhurst
3 ,
,
Lan Li
3,
Chonglu Zhong
1 and
David Bush
2
1
Research Institute of Tropical Forestry, Chinese Academy of Forestry, Guangzhou 510520, China
2
CSIRO Australian Tree Seed Centre, GPO Box 1700, Canberra, ACT 2601, Australia
3
National Collections and Marine Infrastructure, CSIRO, Canberra, ACT 2601, Australia
*
Author to whom correspondence should be addressed.
Forests 2022, 13(7), 1152; https://doi.org/10.3390/f13071152
Submission received: 28 June 2022
/
Revised: 18 July 2022
/
Accepted: 19 July 2022
/
Published: 21 July 2022
(This article belongs to the Section Forest Ecology and Management)
Abstract
:Allocasuarina verticillata (Lam.) L.A.S. Johnson is a widespread species in south-eastern Australia providing vegetation cover, protecting fragile soils and providing food for birds. Understanding the effects of gene flow on the recruitment patterns, genetic differentiation and structure of fragmented populations provides fundamental guidelines to underpin plant conservation strategies and activities. In this study, four spatially disjunct populations of A. verticillata were sampled to explore the effects of population size, reproductive patterns and pollen and seed dispersal on among-population genetic diversity, genetic differentiation and structure, using field survey and microsatellite marker techniques. It was found that stands of A. verticillata were predominantly sexually reproductive, but asexual reproduction through root suckering was an additional mode of reproduction. The reproductive success of A. verticillata is positively correlated with the effective population size rather than actual population size. The reduction in effective population size and increment of spatial isolation resulted in lower genetic diversity and higher inbreeding coefficient of progenies. Moderate pairwise genetic differentiation and weak genetic structure were identified. The results suggest that exogenous, wind-mediated pollen flow provides some maintenance of genetic diversity in the isolated stands. Seed dispersal appears mainly to be over short distances (i.e., within populations), but the infrequent transport of seeds between disjunct locations cannot be ruled out as another factor that may help maintain genetic diversity.
1. Introduction
Habitat loss and vegetation fragmentation, due to natural disturbance regimes and increasing anthropogenic land use changes, pose major risks to plant population persistence and genetic diversity [1]. A major determinant of genetic connectivity within and among the populations of plants is pollen-mediated gene flow. High levels of gene flow are expected to maintain genetic cohesion among the populations, whereas low levels drive genetic differentiation through genetic drift and local selection. Population isolation, associated with habitat fragmentation, limits the gene flow across landscapes and may also affect the subsequent demographic stages, such as seedling establishment [2,3]. One of the major changes imposed by the fragmentation of plant populations is elevated inbreeding. The effects of inbreeding depression typically adversely affect the fitness traits, with reduced fruit set, seed production, viability and less-vigorous seedling growth observed in many of the plant species [3,4,5,6,7]. The recruitment patterns of some of the plant populations can also be influenced by habitat fragmentation. For example, some of the plants can regenerate asexually to ensure population survival and persistence in the face of unfavorable environmental conditions, if mate-availability is limited or if pollen vectors are absent. Species, including monoecious black spruce (Picea mariana) [8] and the dioecious tropical hardwood Diospyros lasiocalyx (Mart.) B. Walln. [9], also reproduce asexually, ensuring population persistence.
The gene flow within and among tree populations involves both pollen and seed dispersal. The pollen and seed dispersal not only influence the genetic structure and populations’ size, but also affect recruitment and sustainability. The dispersal distance and patterns vary among the plant species [10], and are critical drivers of the ecological and evolutionary genetics of plant populations. For example, animal-pollinated plants generally have longer effective pollen dispersal than wind-pollinated species, since wind speed and direction, topography and barriers strongly influence the dispersal patterns [11,12,13]. However, under some favorable circumstances, examples of extreme long-distance wind dispersal (up to 60 km) were documented [14]. This long-distance pollen dispersal of wind-pollinated species is likely to play a primary role in maintaining genetic diversity and low genetic differentiation among the fragmented populations. In contrast, both animal-mediated (zoochoric) and wind-mediated (anemochoric) seed dispersal distance is generally shorter than that of pollen dispersal, and has less influence on gene flow among the populations, since most of the dispersal events occur within populations [15,16]. Importantly, however, the recruitment, sustainability and extension of fragmented populations rely mainly on seed dispersal and seedling establishment [17,18].
The differences in genetic diversity and structure between isolated and continuous populations have long been studied [19,20,21,22,23]. It is often assumed that the fragmented populations have higher inbreeding, experience more genetic drift and directional selection and exhibit stronger among-population genetic divergence, due to reduced gene flow [21,24]. However, it is not known to what extent the effects of isolation are confounded by those of population size, especially effective population size, defined as the number of individuals that contribute offspring to the next generation [25]. The population genetic structure largely arises from the formation of local pedigrees caused by gene flow at a restricted scale (e.g., within a population). The studies of population genetic structure and its causes have provided fundamental guidelines for plant conservation strategies and activities, e.g., minimum distances required for seed collections [26], associations between population size and recruitment success, etc. [27].
Allocasuarina verticillata (Lam.) L.A.S. Johnson is a small tree (5–9 m tall), widely distributed across south-eastern mainland Australia and Tasmania. It is predominantly dioecious and wind pollinated. Its seeds possess a wing and are also wind-dispersed. It can tolerate a range of unfavorable environmental conditions, including thin soils, exposed sites, heat, cold and drought, and is an important food source for the endangered glossy black Cockatoo (Calyptorhynchus lathami Temminck), making it a key restoration species [28,29,30]. Vegetation clearing, land modification and agricultural activities have impacted on the connectivity of A. verticillata populations throughout much of its range [30,31].
In the Australian Capital Territory (ACT), the species occupies a naturally occurring niche on dry, stony ridges and low hills [32] to about 900 m above sea level (asl) [32,33]. Canberra is in many ways a unique city, developed only 100 years ago, with strict planning rules that exclude the intensive development of the many hills that rise from 100–200 m (700–800 m asl) above the urban areas of the city, which is situated at around 600 m asl. Before the city was developed, the study area was a pastoral district, having been opened up for grazing from the 1820s onwards, with extensive clearing and grazing in the lowland areas that are now suburban sites. The autecology and successional processes of A. verticillata on the hills of the ACT were studied in detail by Hueneke [33]. The interaction of various factors, including grazing, clearing for pastoral activity and rabbit control, fire and mechanical disturbances, such as track building associated with infrastructure development including radio mast installations on the hills, has resulted in conditions favorable to the spread and stand development of A. verticillata on some of the hills, including Mt. Stromlo and the range formed by Mt. Ainslie and Mt Majura. The species thrives in disturbed areas that are exposed to full sun with thin, stony soils, and the species is serotinous [34]. Intense fire in 1952 on the slopes of Mt. Stromlo led to reduced competition from other plants and created ideal conditions for the A. verticillata seedling regeneration, leading to very dense stands of the species that are still extant in 2020, following another major fire in 2003. In contrast to the fragmentation of the stands described by Broadhurst [30,31], Hueneke [33] concluded that A. verticillata has become, or is likely to become, more dominant on hillslopes in the ACT, due to a combination of anthropogenic disturbance and the areas being increasingly protected but heavily used for recreational purposes, due to their peri-urban position in the midst of a city. Despite this difference, stands in the ACT are nevertheless strongly, naturally disjunct, as the species does not spread to the plains between ridges and hills, formerly because it was outcompeted by other taxa including eucalypts, and more latterly because of urban development.
However, whether A. verticillata possesses an asexual reproduction pattern as the supplementary recruitment mechanism in fragmented populations remains unknown. Broadhurst [31] found that the male trees closest to each female did not have an obvious reproductive advantage for seed production, and that the bi-parental inbreeding was also generally low in the larger fragmented populations of A. verticillata. However, the seed dispersal distance and spatial patterns of disjunct population of A. verticillata is still unclear. Broadhurst [31] found that, on average, A. verticillata pollen travels ~100 m and can disperse up to 1 km. However, many fragmented A. verticillata populations are more than 1 km from their nearest neighbor and it is unclear whether the pollen flow occurs among trees isolated by these longer distances. In this study, microsatellite markers were used to determine the levels of asexual reproduction, gene flow (pollen and seed dispersal) distances, genetic differentiation and genetic structure of fragmented populations. Understanding how the fragmented populations respond to fragmentation at varied spatial scales is important to help the government make strategic decisions for the conservation and management of the fragmented populations of A. verticillata. In this study, four A. verticillata populations of varying size were surveyed and sampled, to address the following questions: (1) Are there differences in genetic diversity, genetic differentiation and structure among the populations in relation to the sizes of population or effective population? (2) What are the distances and patterns of pollen and seed dispersal and is there long-distance gene flow among the isolated populations of A. verticillata? (3) Does A. verticillata reproduce asexually as a supplementary recruitment mechanism in the ACT populations? and (4) How does population disjunction affect the genetic diversity and genetic structure of A. verticillata?
2. Materials and Methods
2.1. Study Sites and Measures of Population Size and Density
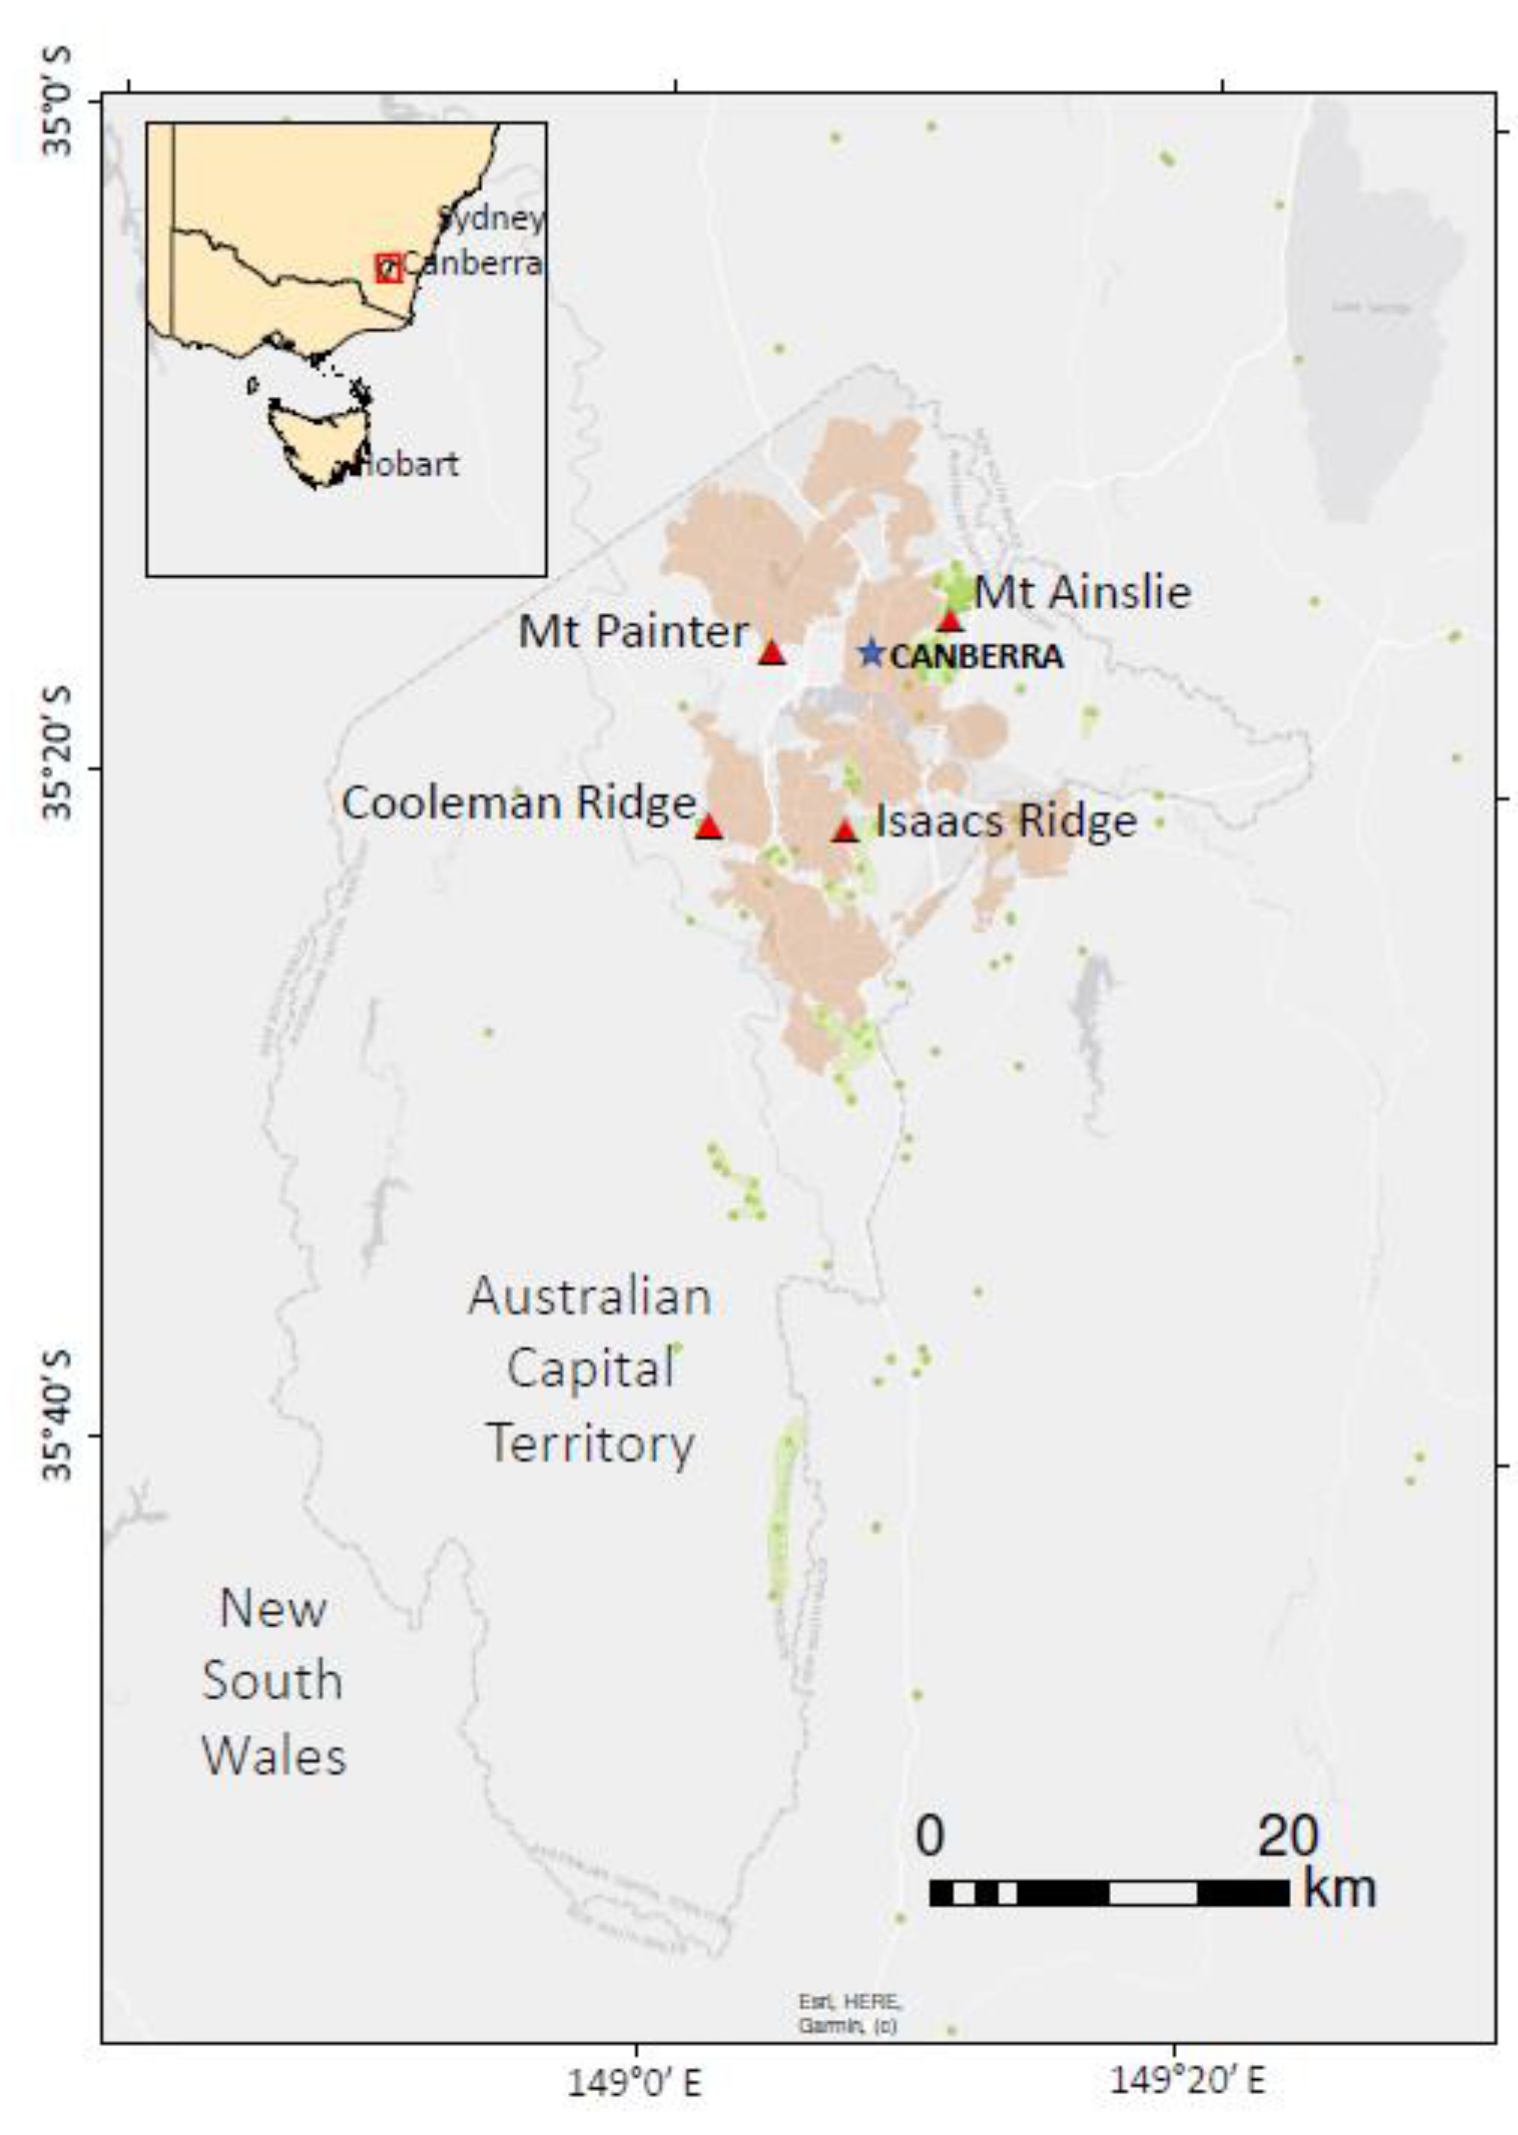
This study was conducted in four natural stands of A. verticillata in the Australian Capital Territory, Australia, namely Cooleman Ridge, Mt. Painter, Isaacs Ridge and Mt. Ainslie. The straight-line distances among the four populations varied from 7.6 to 14.2 km (Figure 1). Three of the stands, Cooleman Ridge, Mt. Painter and Isaacs Ridge, have small populations of A verticillata, and sampling of every tree was possible. The fourth stand at Mt. Ainslie is much more extensive; we undertook limited sampling there. The sample stratification was designed to address our research questions, viz. the estimation of kinship between the generations represented by the seedlings and mature diecious trees; the population-level genetic diversity; and the characterization of the transmission of pollen and seeds within and between the distant stands. Accordingly, the individuals were categorized into five groups: field-grown seedlings, i.e., young trees lacking reproductive structures and less than 3 m in height; females (trees bearing cones); males (trees bearing male inflorescences); monoecious (trees bearing both cones and male inflorescences); gender unknown (trees > 3 m tall but bearing no cones or male inflorescences). The female, male, monoecious and gender-unknown trees were regarded as adults.
The Cooleman Ridge population is a medium-sized population, which comprised 175 individuals, including adult trees and seedlings. The Mt. Painter population was the smallest, consisting of 107 individuals. The Isaacs Ridge stand is a medium-sized population and consisted of 193 individuals, but was isolated by an open gap of only 200 m from another larger population of A. verticillata, probably comprising many more individuals. The Mt. Ainslie stand is a large and continuous population with a large number of individuals, probably numbering in the thousands (Table 1). It was used as a control population for the comparison of population genetic diversity, genetic differentiation and structure. Other tree and shrub species co-occurring in the stands of A. verticillata included Eucalyptus mannifera Mudie, E. melliodora A.Cunn. ex Schauer, E. rossii R.T. Baker & H.G.Sm., E. blakelyi Maiden E. macrorhyncha F.Muell. ex Benth. and Exocarpus cupressiformis Labill.. These species, together with A. verticillata, form associations that are typical of the upland areas in the ACT. The larger eucalypts, which commonly develop extensive hollows, are likely to support populations of both arboreal mammals and birds through the provision of nesting sites, and perches.
2.2. Sampling
2.2.1. Samples Collected for DNA Extraction
Young branchlets of individuals were sampled from the four populations. Prior to the sampling, the sexual identity of each tree was identified, using the reproductive structures (Table 1). All of the individuals (females, males, field-grown seedlings, gender-unknown adults and monoecious individuals) at Cooleman Ridge (45, 45, 55, 29 and 1, respectively) were sampled. All of the 107 individuals at Mt. Painter and all of the 193 individuals at Isaacs Ridge were sampled. At Mt. Ainslie, 49 field-grown seedlings were sampled for genetic diversity analysis (Table 1). All of the sampled trees were mapped using a hand-held GPS (Garmin eTrex 30). The collected samples (about 2 g of young branchlets) were fully desiccated on silica gel for two weeks, prior to DNA extraction in the laboratory.
2.2.2. Cultivation of Open-Pollinated Seedlings to Study Pollen Flow at Mt. Painter and Cooleman Ridge
To study the pollen flow within the stands, ten mature cones were collected from one large female individual in the middle of each population at Mt. Painter and Cooleman Ridge. The seeds were extracted from these cones, following desiccation on silica gel for two weeks. The seeds were then sown in a tray and kept in a greenhouse for germination and seedling growth. Forty of the Mt. Painter and 48 of the Cooleman Ridge seedlings were harvested, respectively, for DNA extraction when they attained a height of 10 cm.
2.2.3. Cone Collections for Study of Reproductive Success
For the purpose of studying the reproductive success in each population, three healthy female trees bearing numerous cones were selected in the middle of each population. Ten cones of a similar size were collected from each tree. In total, 120 cones were collected and dried on silica gel for two weeks, until all of the seeds were shed. The average seed numbers per cone were calculated. To estimate the percentage of viable seeds for each population, three replicates of 100 seeds extracted randomly from the different cones of the three trees of each population were sown in petri dishes containing moistened fine vermiculite, and grown in an incubator maintained at 28 °C for 20 days, until all of the viable seeds germinated. The Analysis of Variance (ANOVA) among the four populations, with Duncan’s multiple range test at the 5% level, was performed for the seed numbers per cone and seed germination rate variates, using SAS 8.2 statistical package [35].
2.3. Population Density, Sex Proportion, Reproductive Success Measures
The population size (i.e., the total number of individuals in each population) and the population density (i.e., the total number of individuals divided by the population area) were determined for Cooleman Ridge, Mt. Painter and Isaacs Ridge. The polygon area measure function of Google Earth Pro was used to process the GPS points and estimate the area of the three populations. Sex (male, female and monoecious) and sex proportion (male/female) of the three populations was observed and calculated.
2.4. DNA Extraction and SSR Marker Screening
In total, 620 samples were used to extract genomic DNA, which consisted of 175, 107, 193 and 49 individuals from Cooleman Ridge, Mt. Painter, Isaacs Ridge and Mt. Ainslie, respectively, and 48 nursery-raised seedlings from Cooleman Ridge and Mt. Painter, respectively. The genomic DNA of the 620 samples was extracted using Invisorb DNA Plant HTS 96 Kit, following the manufacturer’s protocol (Stractec Biomedical AG, Germany). Its concentration and purity were quantified on a NanoDrop spectrophotometer (Wilmington, USA). Twelve SSR makers were selected by means of screening and optimization of 48 EST-SSR markers that had previously been developed for Casuarina equisetifolia subsp. Equisetifolia L. [36,37], and six genomic-derived SSR markers developed for A. verticillata by Broadhurst [30]. The marker primer sequences and repeat motif, and the fluorescent dyes used for each marker, are listed in Table 2.
2.5. PCR Amplification and Genotyping
The polymerase chain reaction (PCR) system, 5 µL in volume, was composed of: 10 X PCR buffer (Meridian, Bioline, Australia) 0.5 µL; 50 mM MgCl2 0.15 µL (Meridian); 5 µM fluorescent dye-labeled M13 universal primer (FAM, VIC, NED or PET dyes) 0.25 µL; 5 µM of each forward primer (known as the Chimera; has a tail of nucleotides identical to the sequence of the M13 primer at its 5ʹend) [38] 0.05 µL; 5 µM of each reverse primer 0.25 µL, 2 mM dNTP (Sigma) 0.5 µL; 10% BSA (Bovine serum albumin, Sigma) 0.05 µL; 10% PVP-360 0.5 µL; 5u/µL Immolase Taq (Meridian) 0.05 µL; 10 ng evaporated DNA template and 2.7 µL sterile deionized water. A Touchdown PCR program was implemented on an Eppendorf Mastercycler (Eppendorf, Germany). The touchdown amplification protocol was as follows: denaturation at 95 °C for 10 min; followed with 15 cycles touchdown program of 30 s denaturation at 94 °C; annealing from 65 °C to 50 °C for 30 s with a decrease of 1 °C per cycle, and 1 min extension at 70 °C; then 35 cycles of normal PCR with 15 s denaturation at 94 °C, 15 s annealing at 50 °C, and 45 °C extension at 72 °C; ending with a final extension at 72 °C for 10 min. The capillary electrophoresis detection of specific amplified fragments of each EST-SSR locus were performed on an ABI 3130XL Genetic Analyzer (Applied Biosystems, USA), with a LIZ 600 bp internal standard when the PCR products were confirmed through agarose gel electrophoresis. To optimize the genotyping process, a subset of samples where the data were missing or difficult to score with certainty was re-run several times to confirm that the genotyping error rate was acceptably low and provided repeatable results. The genotype data were collected using software GeneMapper Version 4.0 (Thermo Fisher Scientific, Waltham, MA, USA).
2.6. Clonality
The multilocus matches module of GenAlEx 6.5 [39] was used to identify the clonal genets in the three isolated populations by allele matching at all twelve loci, i.e., the clones share identical genotypes. The population samples were filtered to remove all but a single genet for the subsequent calculation of the population parameters.
2.7. Genetic Diversity, Differentiation and Structure
The genotype data from the field-grown seedling populations at the four locations were used to compare their genetic diversity, differentiation and population structure. Fifty-six of the 167 seedling genotypes were sampled at random from the Isaacs Ridge population to create an approximately even number of samples from each population (Table 1), with 55, 56 and 49 seedlings from Cooleman Ridge, Mt. Painter and Mt. Ainslie, respectively. The seedling genetic diversity indices of each population based on 12 loci, including the number of alleles per locus (Na), the number of effective alleles per locus (Ne), the Shannon information index (I), observed heterozygosity (Ho), expected heterozygosity (He), number of private alleles and the inbreeding coefficient (FIS) were calculated using GenAlEx 6.5 [39]. The allelic richness (AR) of the seedling genotypes of the four populations was calculated using FSTAT (version 2.9.4) [40]. The Hardy–Weinberg equilibrium (HWE) of the 12 loci across the four populations was analyzed using CERVUS Version 3.0 [41]. Isolation by distance (IBD) among the four populations was tested, using the Mantel test implemented in software IBD version 1.53 [42], to analyze the relationship between genetic distance (GD) and geographical distance (GGD). The Mantel test was applied to the matrices of the pairwise population differentiation, and to the log-transformed pairwise geographic distances among the four populations with 1000 random permutations. The significance of the IBD values was assessed using 10,000 permutations.
The seedling samples from the four populations were then used to undertake population genetic structure analyses. The analyses of molecular variance (AMOVA), pairwise unbiased Nei’s genetic distance, pairwise genetic differentiation values (FST) and Principal Coordinate Analysis (PCoA) among the four populations were implemented using GenAlEx 6.5. A Bayesian analysis was performed to analyze the genetic structure of the set of sampled seedling accessions (four populations), using STRUCTURE 2.3.2 [43]. The analysis was undertaken assuming the Admixture model with a “burn-in” of 100,000 iterations followed by 1,000,000 iterations of the Markov chain Monte Carlo model (MCMC). The model was run for a range of K values varying from 1 to 10 and with five replications in each iteration. The optimal K groups were gauged using the online Structure Harvester software [44].
2.8. Parentage Analysis of Cultivated Seedlings
Paternity analyses of the greenhouse-raised, open-pollinated seedlings from selected female trees with known genotypes representative of two populations, Cooleman Ridge and Mt. Painter (48 from Cooleman Ridge, 40 from Mt. Painter) were performed. All of the mature male trees across the three isolated populations were considered as candidate fathers. A likelihood-based approach to paternity analysis, based on multilocus genotypes for all of the adult individuals and offspring, was undertaken using CERVUS Version 3.0 [41]. Two confidence intervals of 95.0% and 80.0% were set for the determination of the most likely male parent when implementing the parentage analyses. In this study, the simulation parameters required by the program were set as follows: 10,000 cycles; 159 candidate parents; 0.85 as the proportion of candidate parents sampled; and 0.90 and 0.01 as the proportions of loci typed and mistyped, respectively.
Maternity imputation was performed by estimating the pairwise kinship between all of the trees (adults and offspring), using Coancestry software [45]. This program uses multi-locus marker data to estimate the pairwise relatedness (i.e., twice the coefficient of co-ancestry, θ) between the individual trees, using various estimators. The software also implements a simulation to estimate the likely precision and bias of a chosen estimator for a given empirical marker set. Following the simulation approach and methods previously detailed for forest trees [46,47], we chose the Wang [48] estimator. We used the kinship estimates (i) to determine a likely mother (having 2θ ≅ 0.5, allowing for bias and precision) for each offspring and (ii) to determine whether each offspring have any close relatives (2θ > 0, allowing for bias and precision). The latter estimate allowed us to gauge whether the offspring have close relatedness (i.e., identity by descent significantly above zero) to any of the parents: offspring with no close relatedness to any potential parent (i.e., 2θ ≅ 0) are potentially resultant of exogenous seed transport (anemochory or zoochory).
2.9. General Statistics
The correlations among variables were determined using the Pearson (product-moment) method, using SAS software (SAS, Cary, NC, USA) [35].
3. Results
3.1. Population Density, Sex Proportion and Reproductive Success
The population densities of the three populations varied from 177 to 3628 individuals/ha. The sex proportions of male/female in the populations of Cooleman Ridge, Mt. Painter and Isaacs Ridge were 1.53, 1.00 and 1.89, respectively (Table 3). Only one monoecious individual was found at Cooleman Ridge, indicating that A. verticillata is predominantly dioecious, bearing in mind that the sex of 7.8% of the individuals could not be determined due to a lack of reproductive structures. The average seed numbers per cone at Cooleman Ridge, Mt. Painter, Isaacs Ridge and Mt. Ainslie were 86.4, 88.8, 81.2 and 94.4, respectively. Only the Mt. Ainslie population presented significantly higher seed numbers per cone than that of Mt. Painter (p = 0.012). The percentage of viable seeds of the populations of Cooleman Ridge, Mt. Painter, Isaacs Ridge and Mt. Ainslie were 66.67%, 36.00%, 32.33% and 78.67%, respectively, and significant differences among the populations for the percentage of viable seeds were indicated (p = 0.0032). There were positive correlations (r = 0.988, p = 0.0342) between the effective population size (number of parental trees) and the percentage of viable seeds in the three fragmented populations, rather than between the actual population size and the percentage of viable seeds, suggesting that it is the effective population size instead of the actual population size that plays a key role in influencing the reproductive success of A. verticillata.
3.2. Clonality
Based on the multilocus matches of the genotypes of all of the individuals in the three populations where field-grown seedlings were sampled (Cooleman Ridge, Mt. Painter and Isaacs Ridge), 3, 8 and 12 genetically identical pairs of individuals were detected in the three populations, respectively (Table 3). The results confirmed the presence of asexual reproduction in the natural populations of A. verticillata, presenting as root suckers, a result that was not surprising for some of the individuals, as these were clearly sprouting from mature roots emanating from mature trees. A negative, but non-significant, product–moment correlation (r = −0.980, p = 0.127) was noted between the effective population size (number of trees possessing reproductive structures) and the identified clonal individuals; 90 vs. 3, 43 vs. 8 and 26 vs. 12 in the Cooleman Ridge, Mt. Painter and Isaacs Ridge populations, respectively.
3.3. Genetic Diversity Indices of Different Populations
The genotype data from 55, 55, 56 and 49 seedlings in the four populations were obtained, with all of the SSR loci polymorphic across the four populations (Table S1, Supplementary Materials). The 12 SSR markers yielded 169 alleles and a range of 7 to 26 alleles (Na), with an average of 14.08 alleles per locus across the 215 seedling samples of the four populations; the observed heterozygosity (Ho) and expected heterozygosity (He) of the 215 seedling samples in each locus ranged from 0.012–0.891 and 0.102–0.916, respectively; the polymorphism information content (PIC) of the 12 loci varied from 0.101 to 0.907, with a mean of 0.636; 9 of 12 markers had a high level of PIC in all of the samples, according to the suggested criterion of high (PIC > 0.5), moderate (0.25 < PIC < 0.5), and low (PIC < 0.25) [49].
The genetic diversity indices for the four populations are shown in Table 4. Clearly, the large and continuous population at Mt. Ainslie presented a higher genetic diversity than the three small, isolated populations. All of the measures, including total number of alleles (Na), effective alleles (Ne), Shannon index (I), observed and expected heterozygosity (Ho and He), private alleles (Pa) and allelic richness (AR), of the Mt. Ainslie population were higher than those of the three small populations, while the inbreeding coefficient was lower. The Mantel test IBD software [42] revealed that there was no significant correlation between the genetic distances and log-transformed geographic distances among the four populations (r = -0.435, p = 0.175), indicating the absence of isolation by distance of the four populations, despite quite significant isolation (7.6 to 14.2 km).
3.4. Pollen Flow and Paternity Assignation
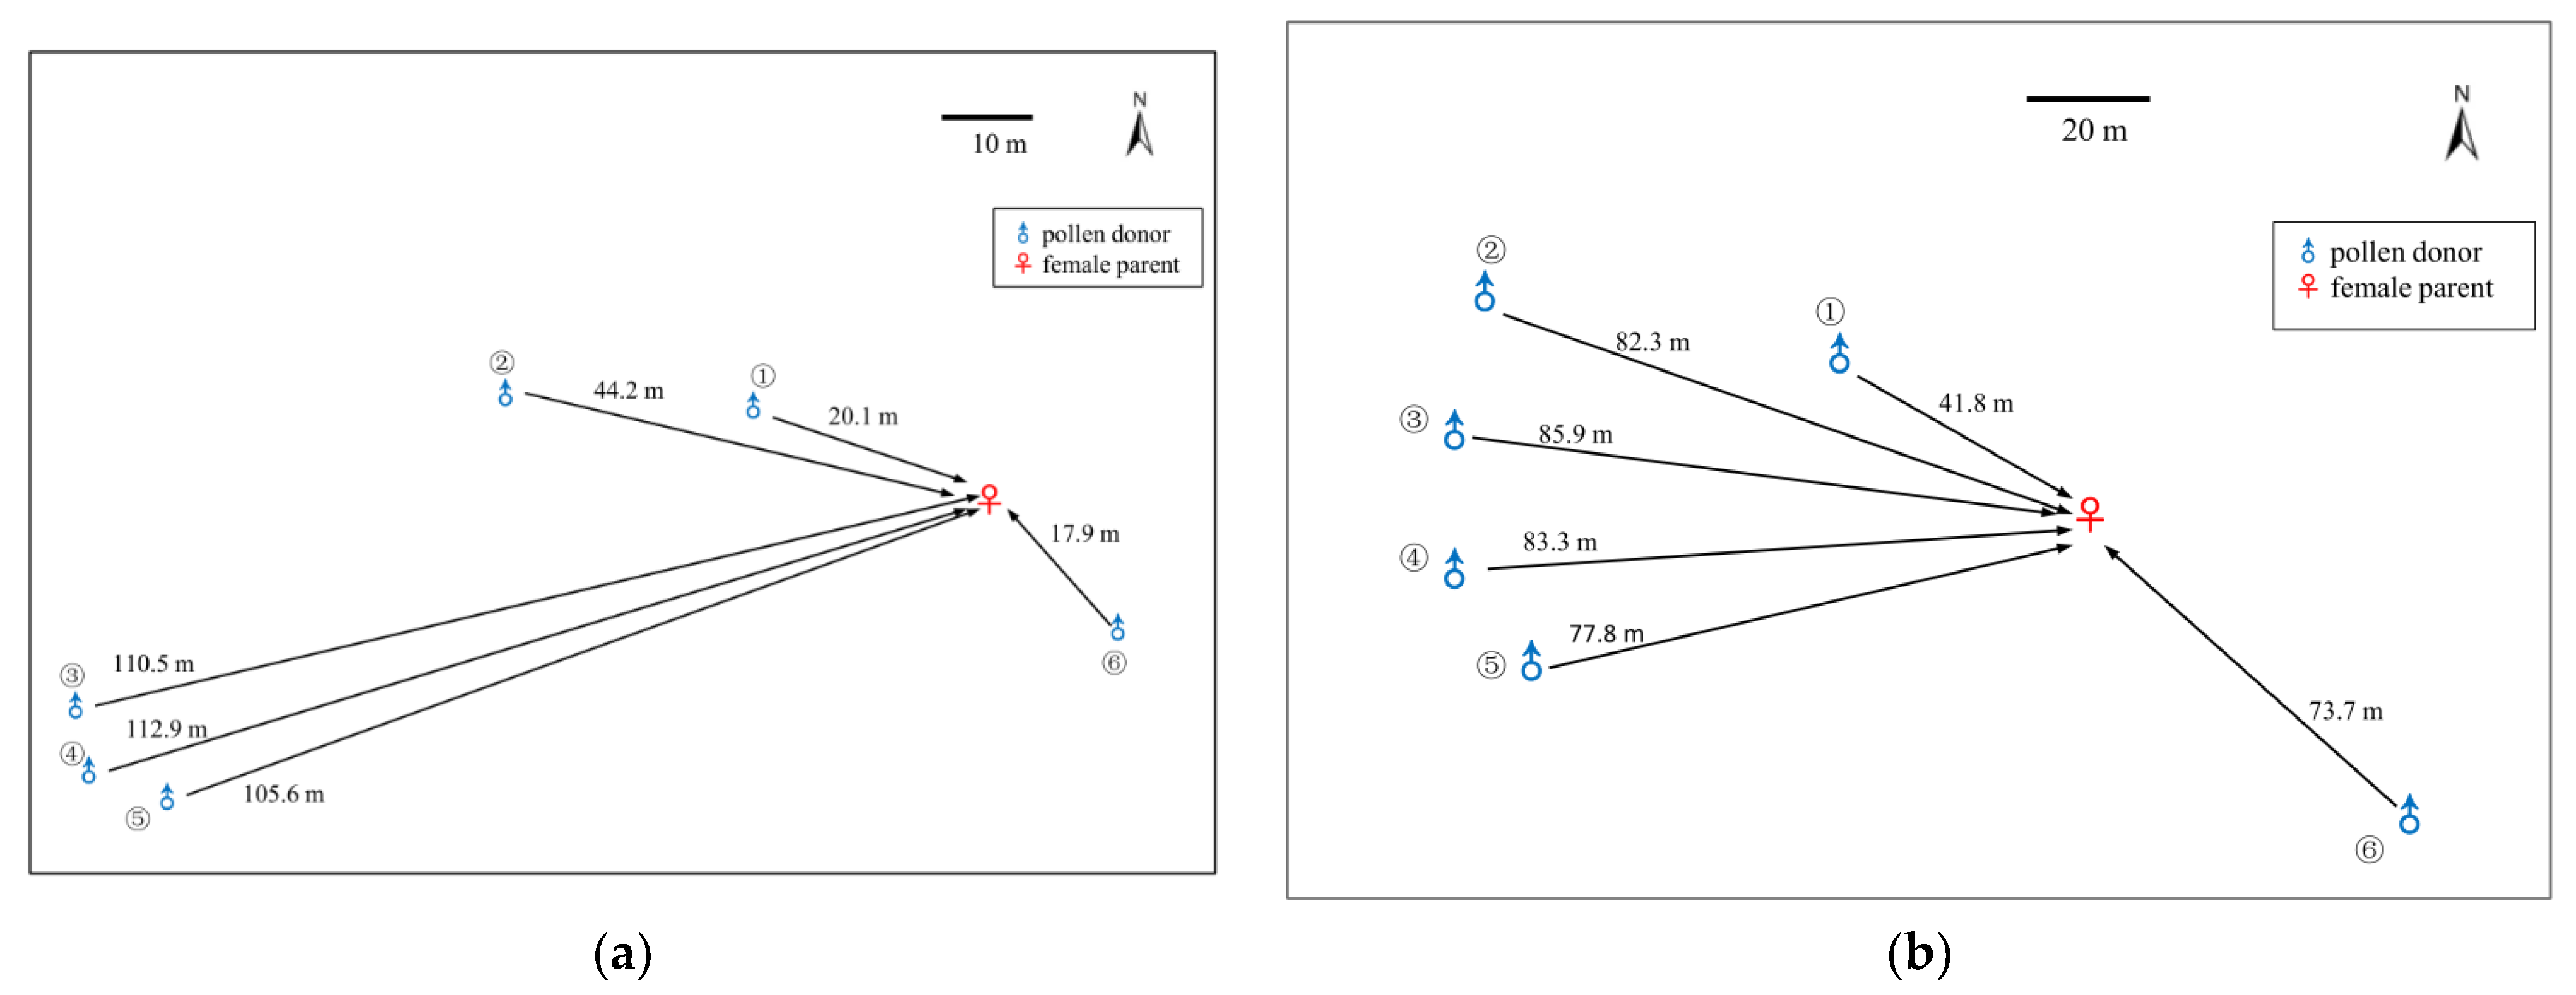
The paternity analysis of the 48 open-pollinated seedlings raised from a single, large female tree at Cooleman Ridge assigned paternity to six male trees. Similarly, 34 of 40 seedlings raised from a single female tree at Mt. Painter were assigned to six male trees, with the pollen parents of the remaining six seedlings not identified at both 95% and 80% confidence levels, either from within the Mt. Painter population or from among the trees genotyped at the other locations. This suggests an external pollen flow (from outside the four study populations) to Mt. Painter. The distances between the identified pollen donors (father trees) and pollen receivers (mother tree) varied from 18 to 113 m and 42.8 to 86 m, with an average of 69 and 74 m, respectively, in the two populations (Figure 2a,b). The pollen flow at both sites was predominantly from the west, indicating the direction of the prevailing wind.
3.5. Maternity Imputation and Seed Dispersal
The analysis of the two sets of 1000 simulated dyads, each representing parent–offspring (PO) and half-sib (HS) relationships, revealed that the Wang [45] estimator performed best, in terms of bias and precision among the five estimators included in the Coancestry package. The simulations indicated that the marker panel would likely be slightly downwardly biased (2θ approximately 1% under-estimated, on average) and reasonably precise (95% CI 0.35 < 2θ < 0.69) for the PO relationships, and slightly downwardly biased (r approximately 1% under-estimated, on average) but less precise (95% CI 0.07 < 2θ < 0.58) for the HS dyads. Since the main objective of the study was to identify potential PO relationships, the marker panel was deemed acceptable to draw inferences on the potential pollen, maternal parents and relatedness within the subpopulations. The estimates of relatedness between the female adults and putative offspring with 2θ ≥ 0.4 were taken as evidence of a PO relationship. We acknowledge that this may result both in some false-positive identifications, where trees are actually full siblings, for example, and also some missed PO relative identifications, where Mendelian sampling and/or limitations of the marker panel and estimator may put the estimate below the cutoff. Although the overall missing data rate of 17% was factored into the simulations, the preliminary analysis of the empirical data revealed that the individuals with a high proportion of missing loci were prone to reducing the results that were likely erroneous. This was evident from several estimates of close relatedness (2θ > 0.5) in dyads, based on poor quality data comprising individuals from each of Cooleman Ridge and Mt. Painter: clearly, these relationships would be unlikely in reality. This is due to the software interpretation of the alleles identical by state as being identical by descent: the issue is mitigated by including a larger number of loci. A total of 33 individuals with between six and nine missing loci were therefore removed from the empirical dataset.
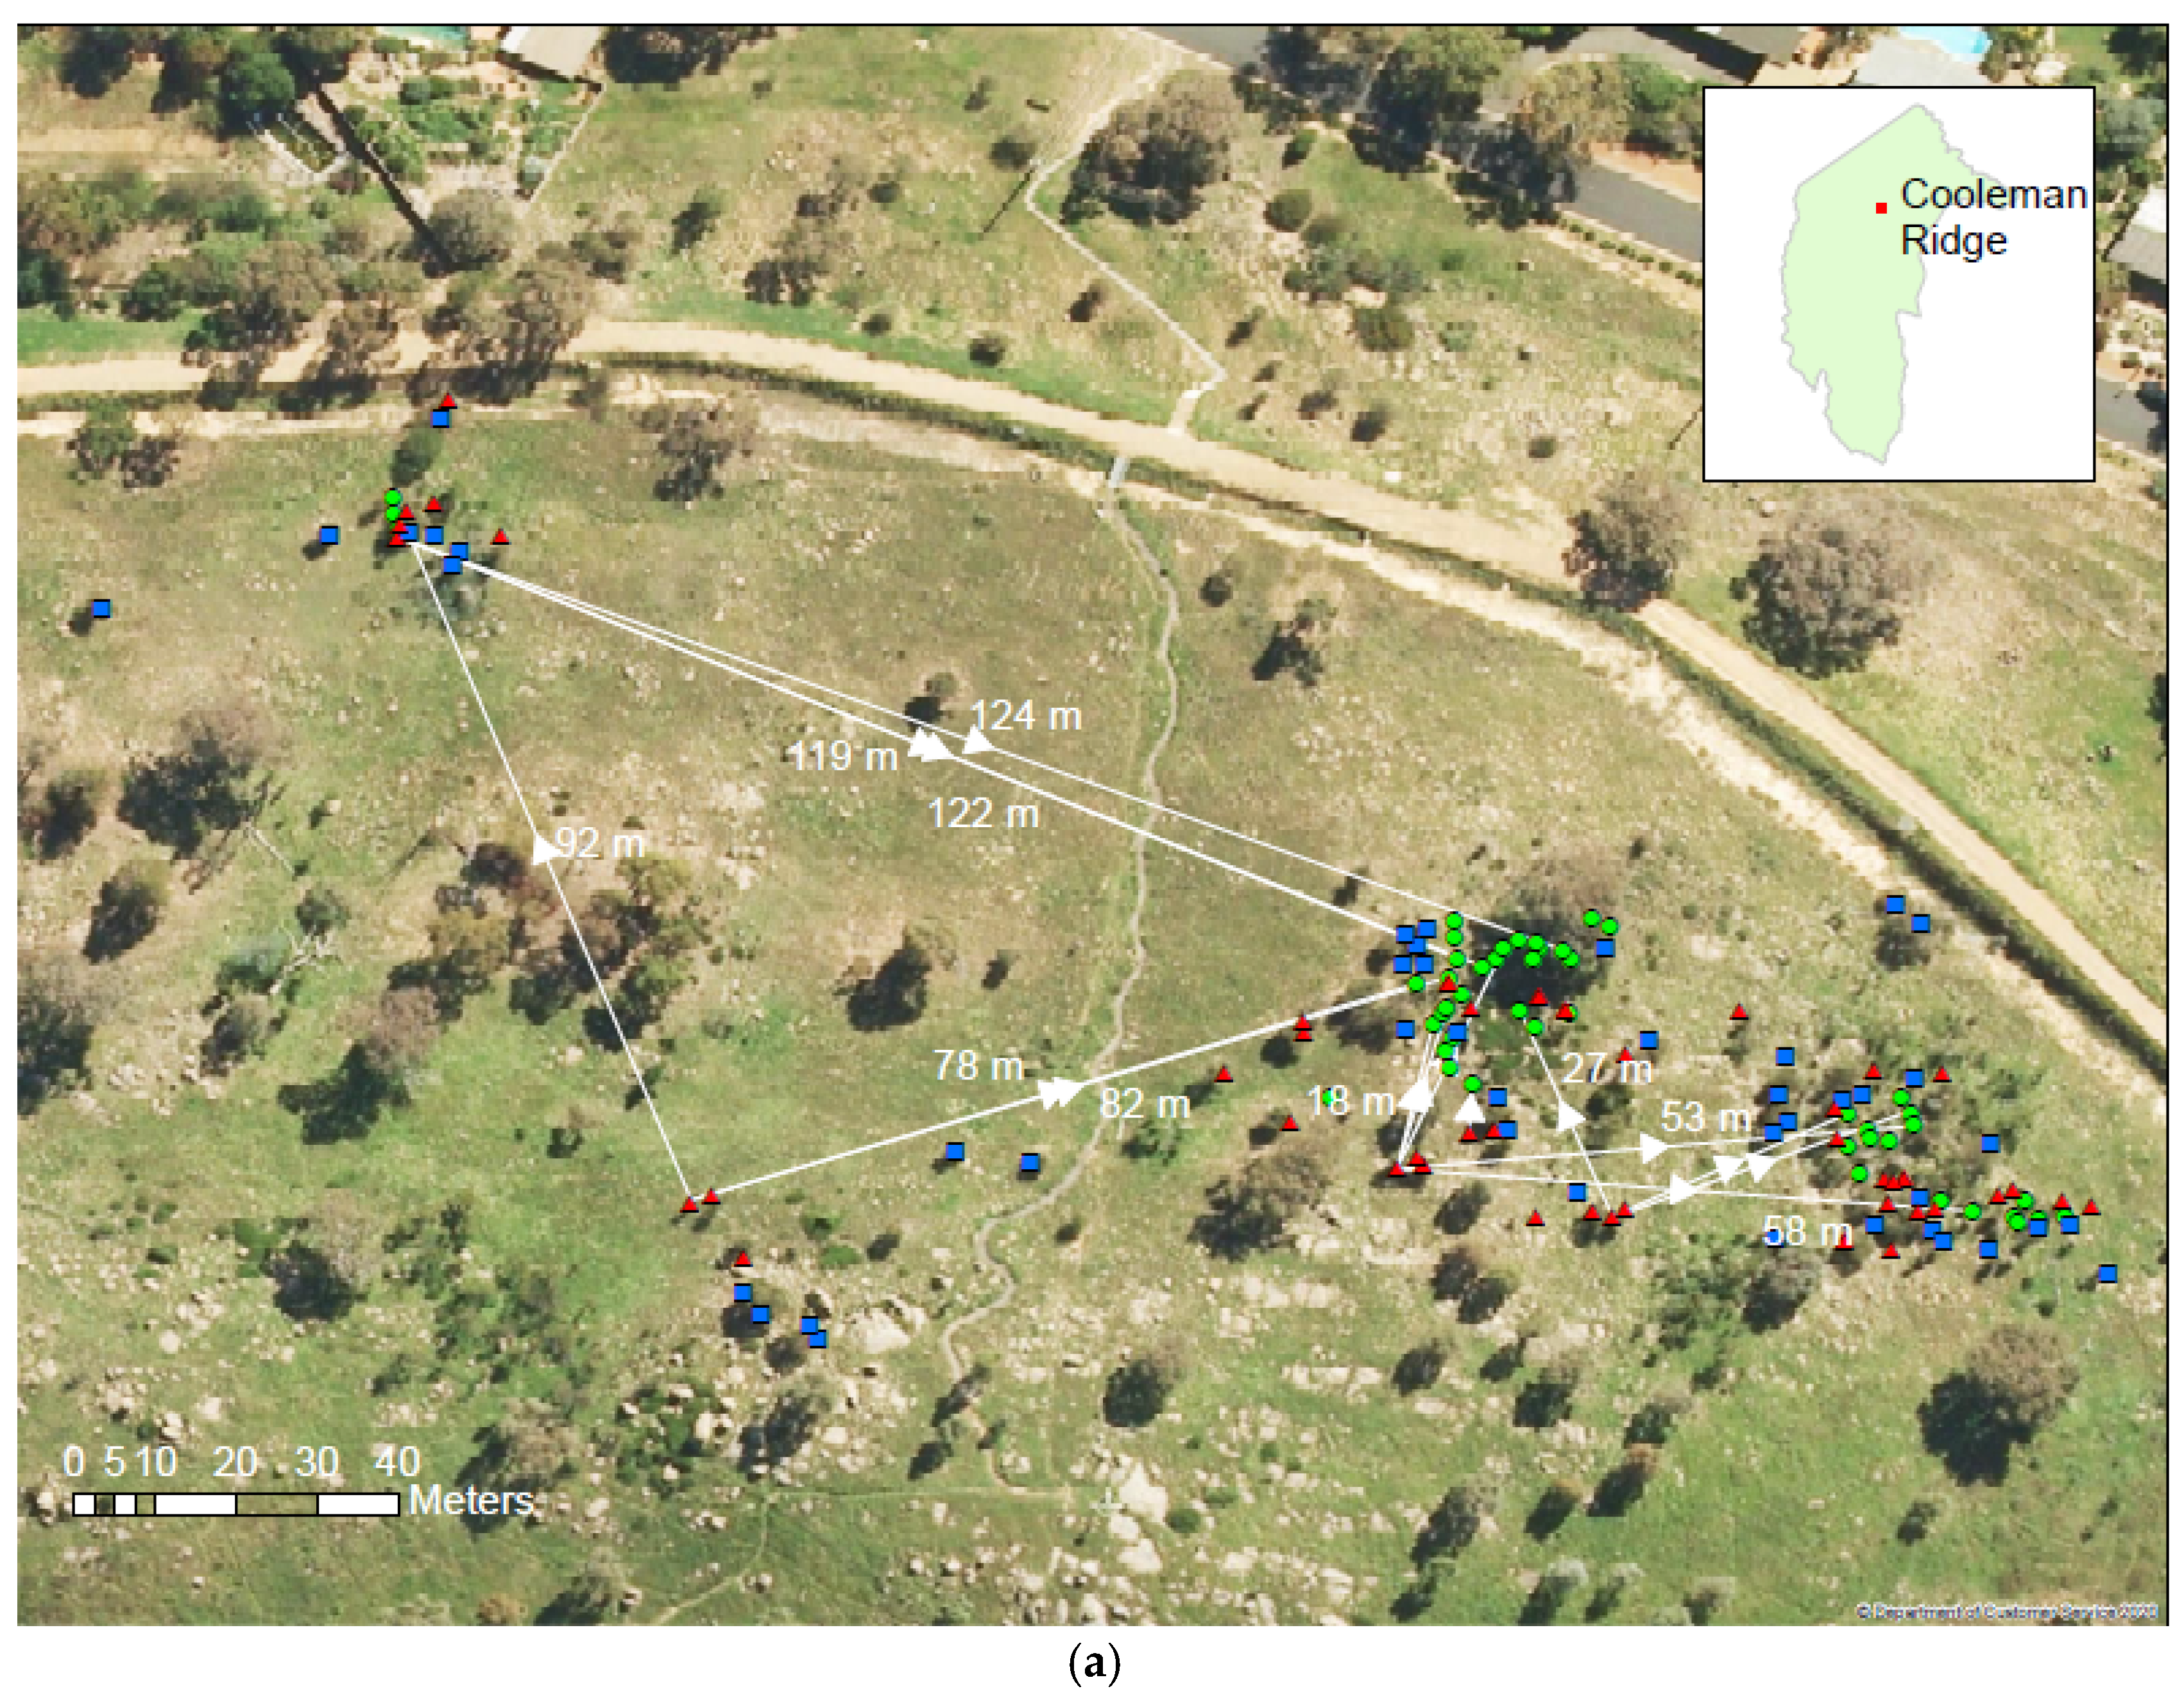
As expected for a small subpopulation with limited seed dispersal, the marked relatedness among parents was indicated at Cooleman Ridge; some close relatedness among parents was indicated with average 2θ = 0.12. However, no clonal genets were identified with certainty, although seven dyads with 2θ > 0.7 were indicated, including a single male-female dyad with 2θ = 0.89. This may be the product of more than one generation of inbreeding, although it is more likely that these are underestimates of clonal relatedness. The maternity analyses, based on estimated coefficients of co-ancestry, assigned 29 female trees as the mothers of 64 of the 88 offspring (trees lacking reproductive structures under 3 m in height), while the mothers of the remaining 24 offspring were not identified from within- and among-population female trees. Only one progeny had neither a potential male nor female parent identified, providing limited evidence for the transport of seeds to the site. Most of the seeds appear to have been transported in northerly and easterly directions (Figure 3a). The distances between the offspring and mother trees ranged from 1 to 228 m with an average of 54 m.
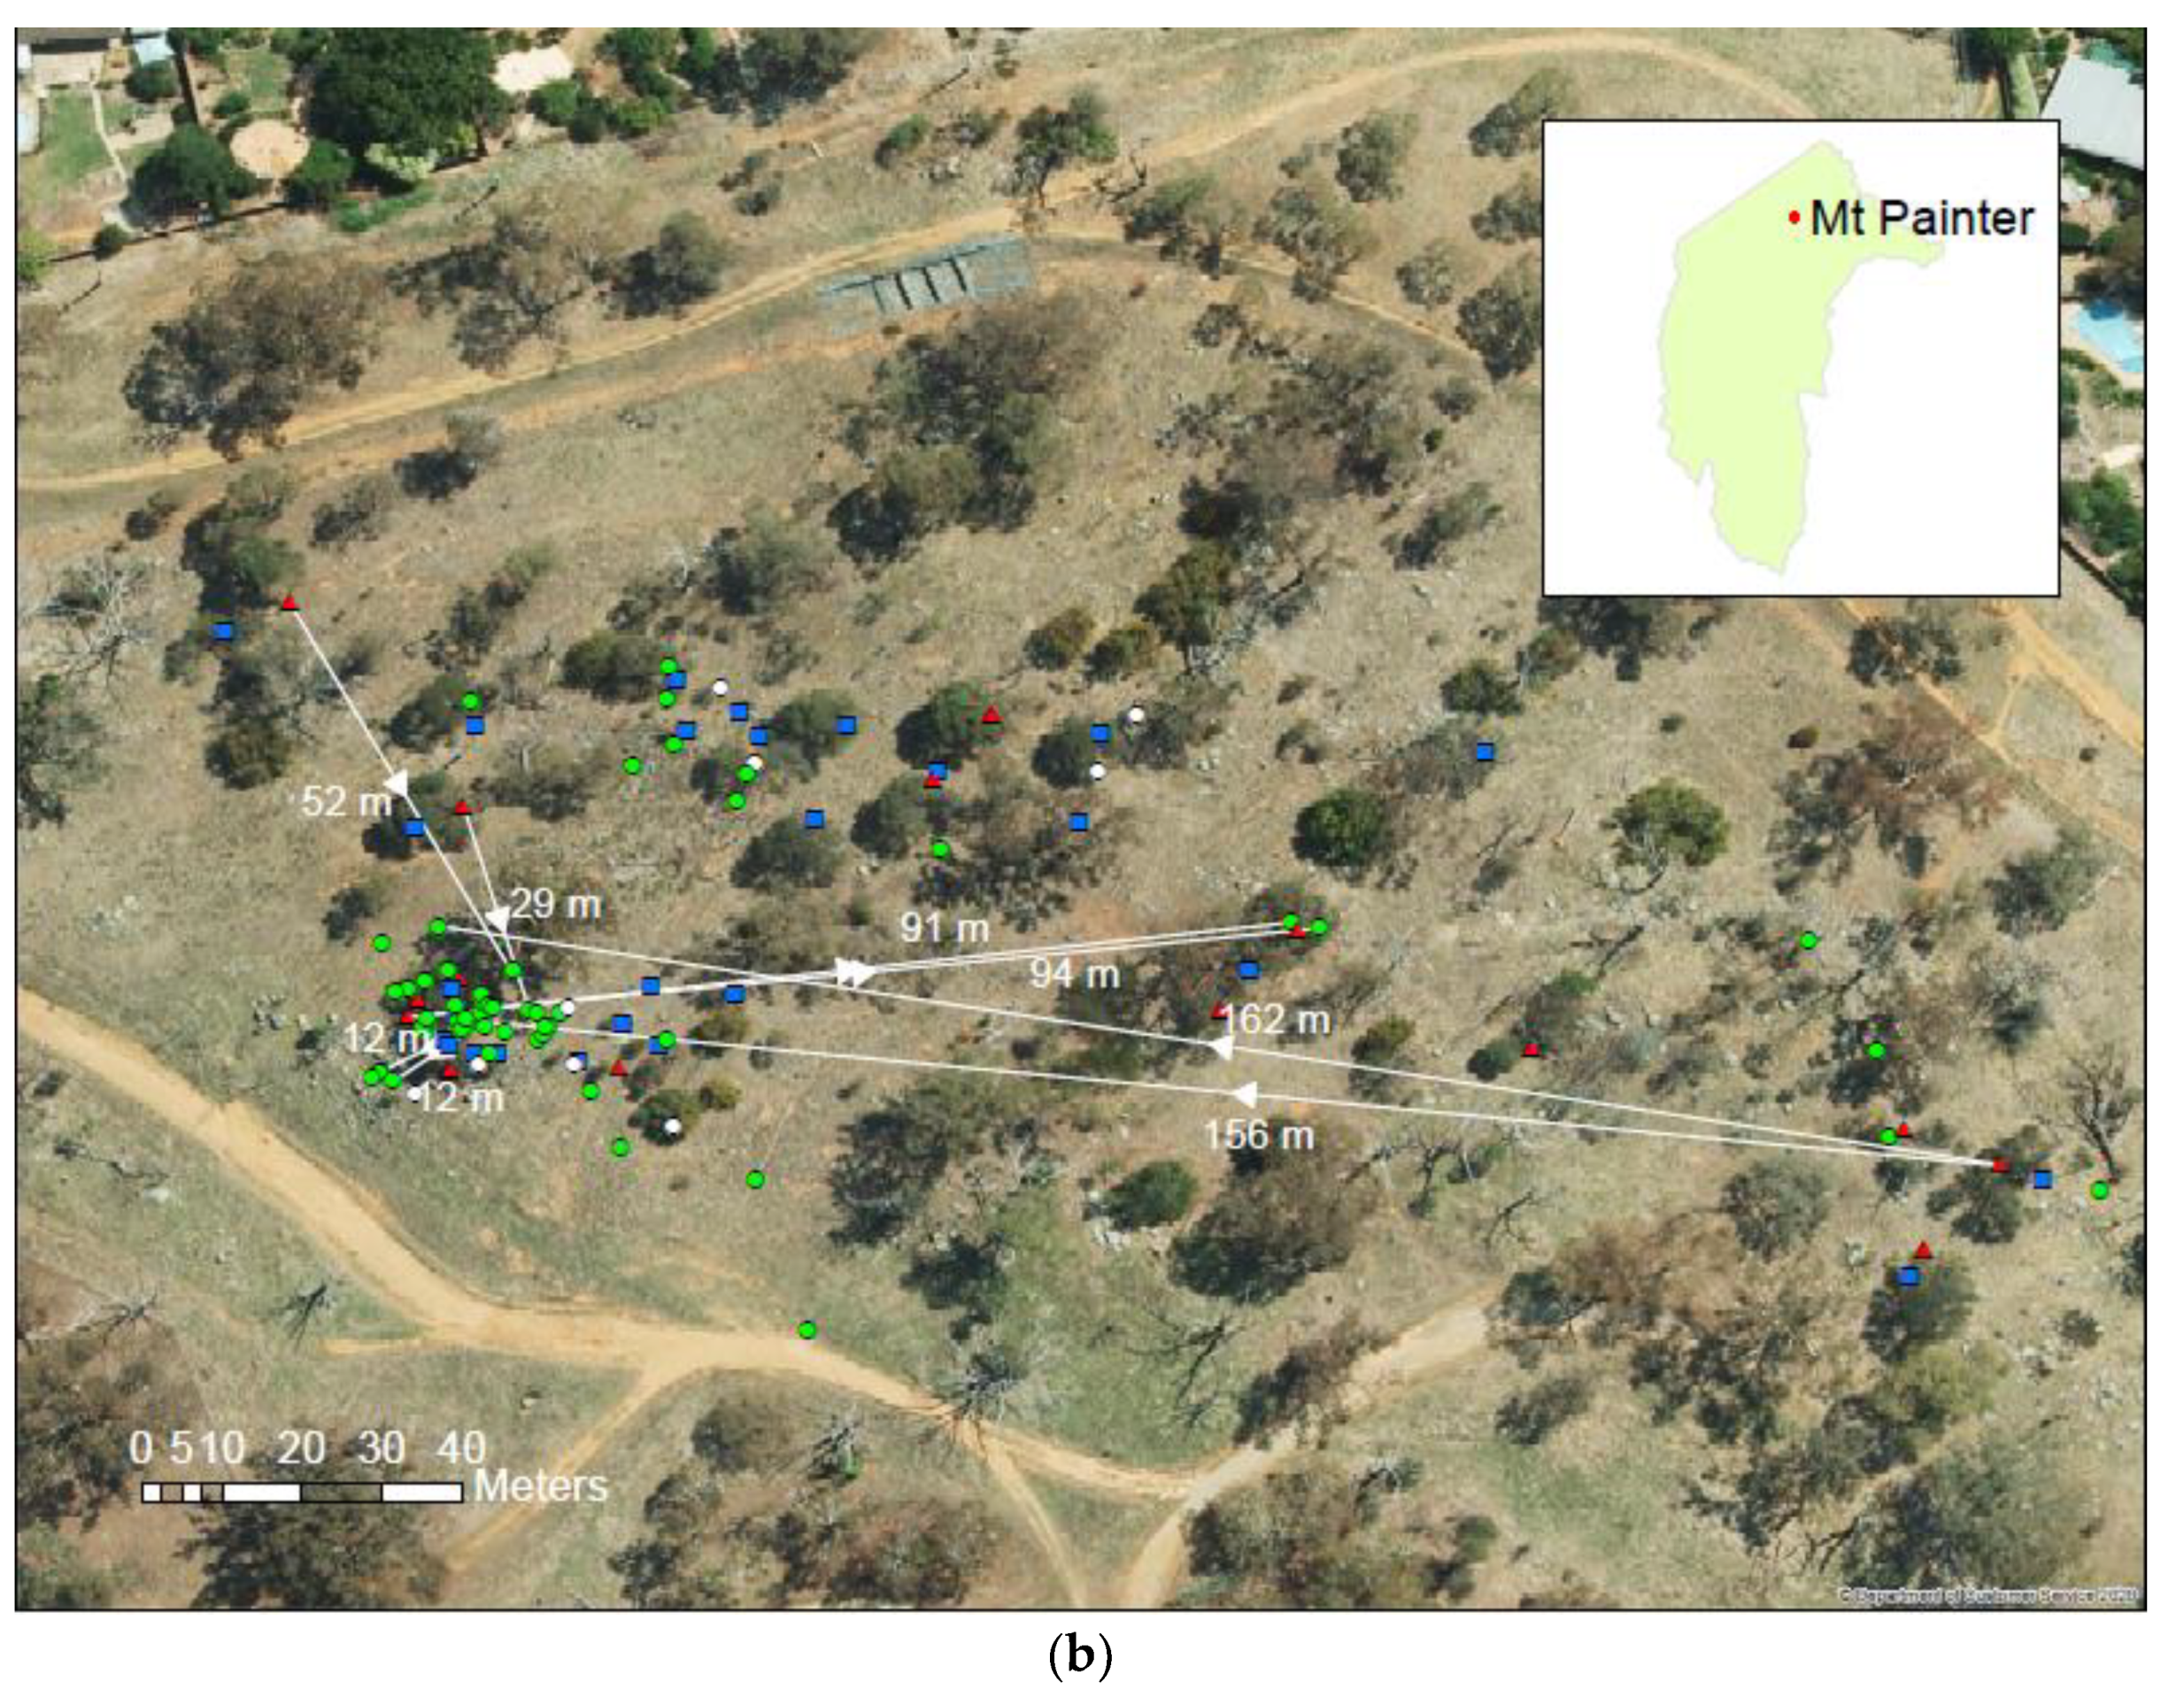
Considerable relatedness among the parents was indicated at Mt. Painter. Three of the adult females formed a genet with 2θ = 1, and two other adult females were very closely related with 2θ = 0.87. Numerous likely HS and full-sib relationships (the latter could also possibly be PO relationships) were also identified among the female parents. Eighteen female trees were identified as mother trees for 22 out of 55 offspring seedlings, with the maternal parents of 33 seedlings not identified from within- and among-population female trees. While not all of the mothers were identifiable using the available marker panel, all of the Mt. Painter individuals had some level of close relatedness to at least one female parent. This could be explained by (i) the female parent being no longer present but other relatives of the parent remaining; (ii) the marker panel lacking sufficient information for the accurate assignation of parentage. The result, therefore, does not present strong evidence that the seeds were transported to Mt. Painter from another site. The distances between the offspring and mother trees ranged from 2 to 165 m, with an average of 40 m at Mt. Painter (Table 5). However, unlike pollen flow, there was no strong trend in the direction of seed fall at Mt. Painter, with many progenies located in a large clump (Figure 3b).
It should be noted that maternity imputation is more likely to result in offspring which have indeterminate maternal genotypes, compared with the paternity analysis described in Section 3.4. This is because in the maternity analysis conducted here, the genotypes of neither parent were known, whereas the paternity analysis was based on the offspring of mothers of known genotypes. Our marker panel was not sufficiently informative to impute maternal genotypes for all of the progeny. It is therefore important to recognize that the presence of offspring with indeterminate maternal genotypes does not necessarily indicate the inflow of seeds from outside the sample populations.
3.6. Genetic Differentiation and Structure
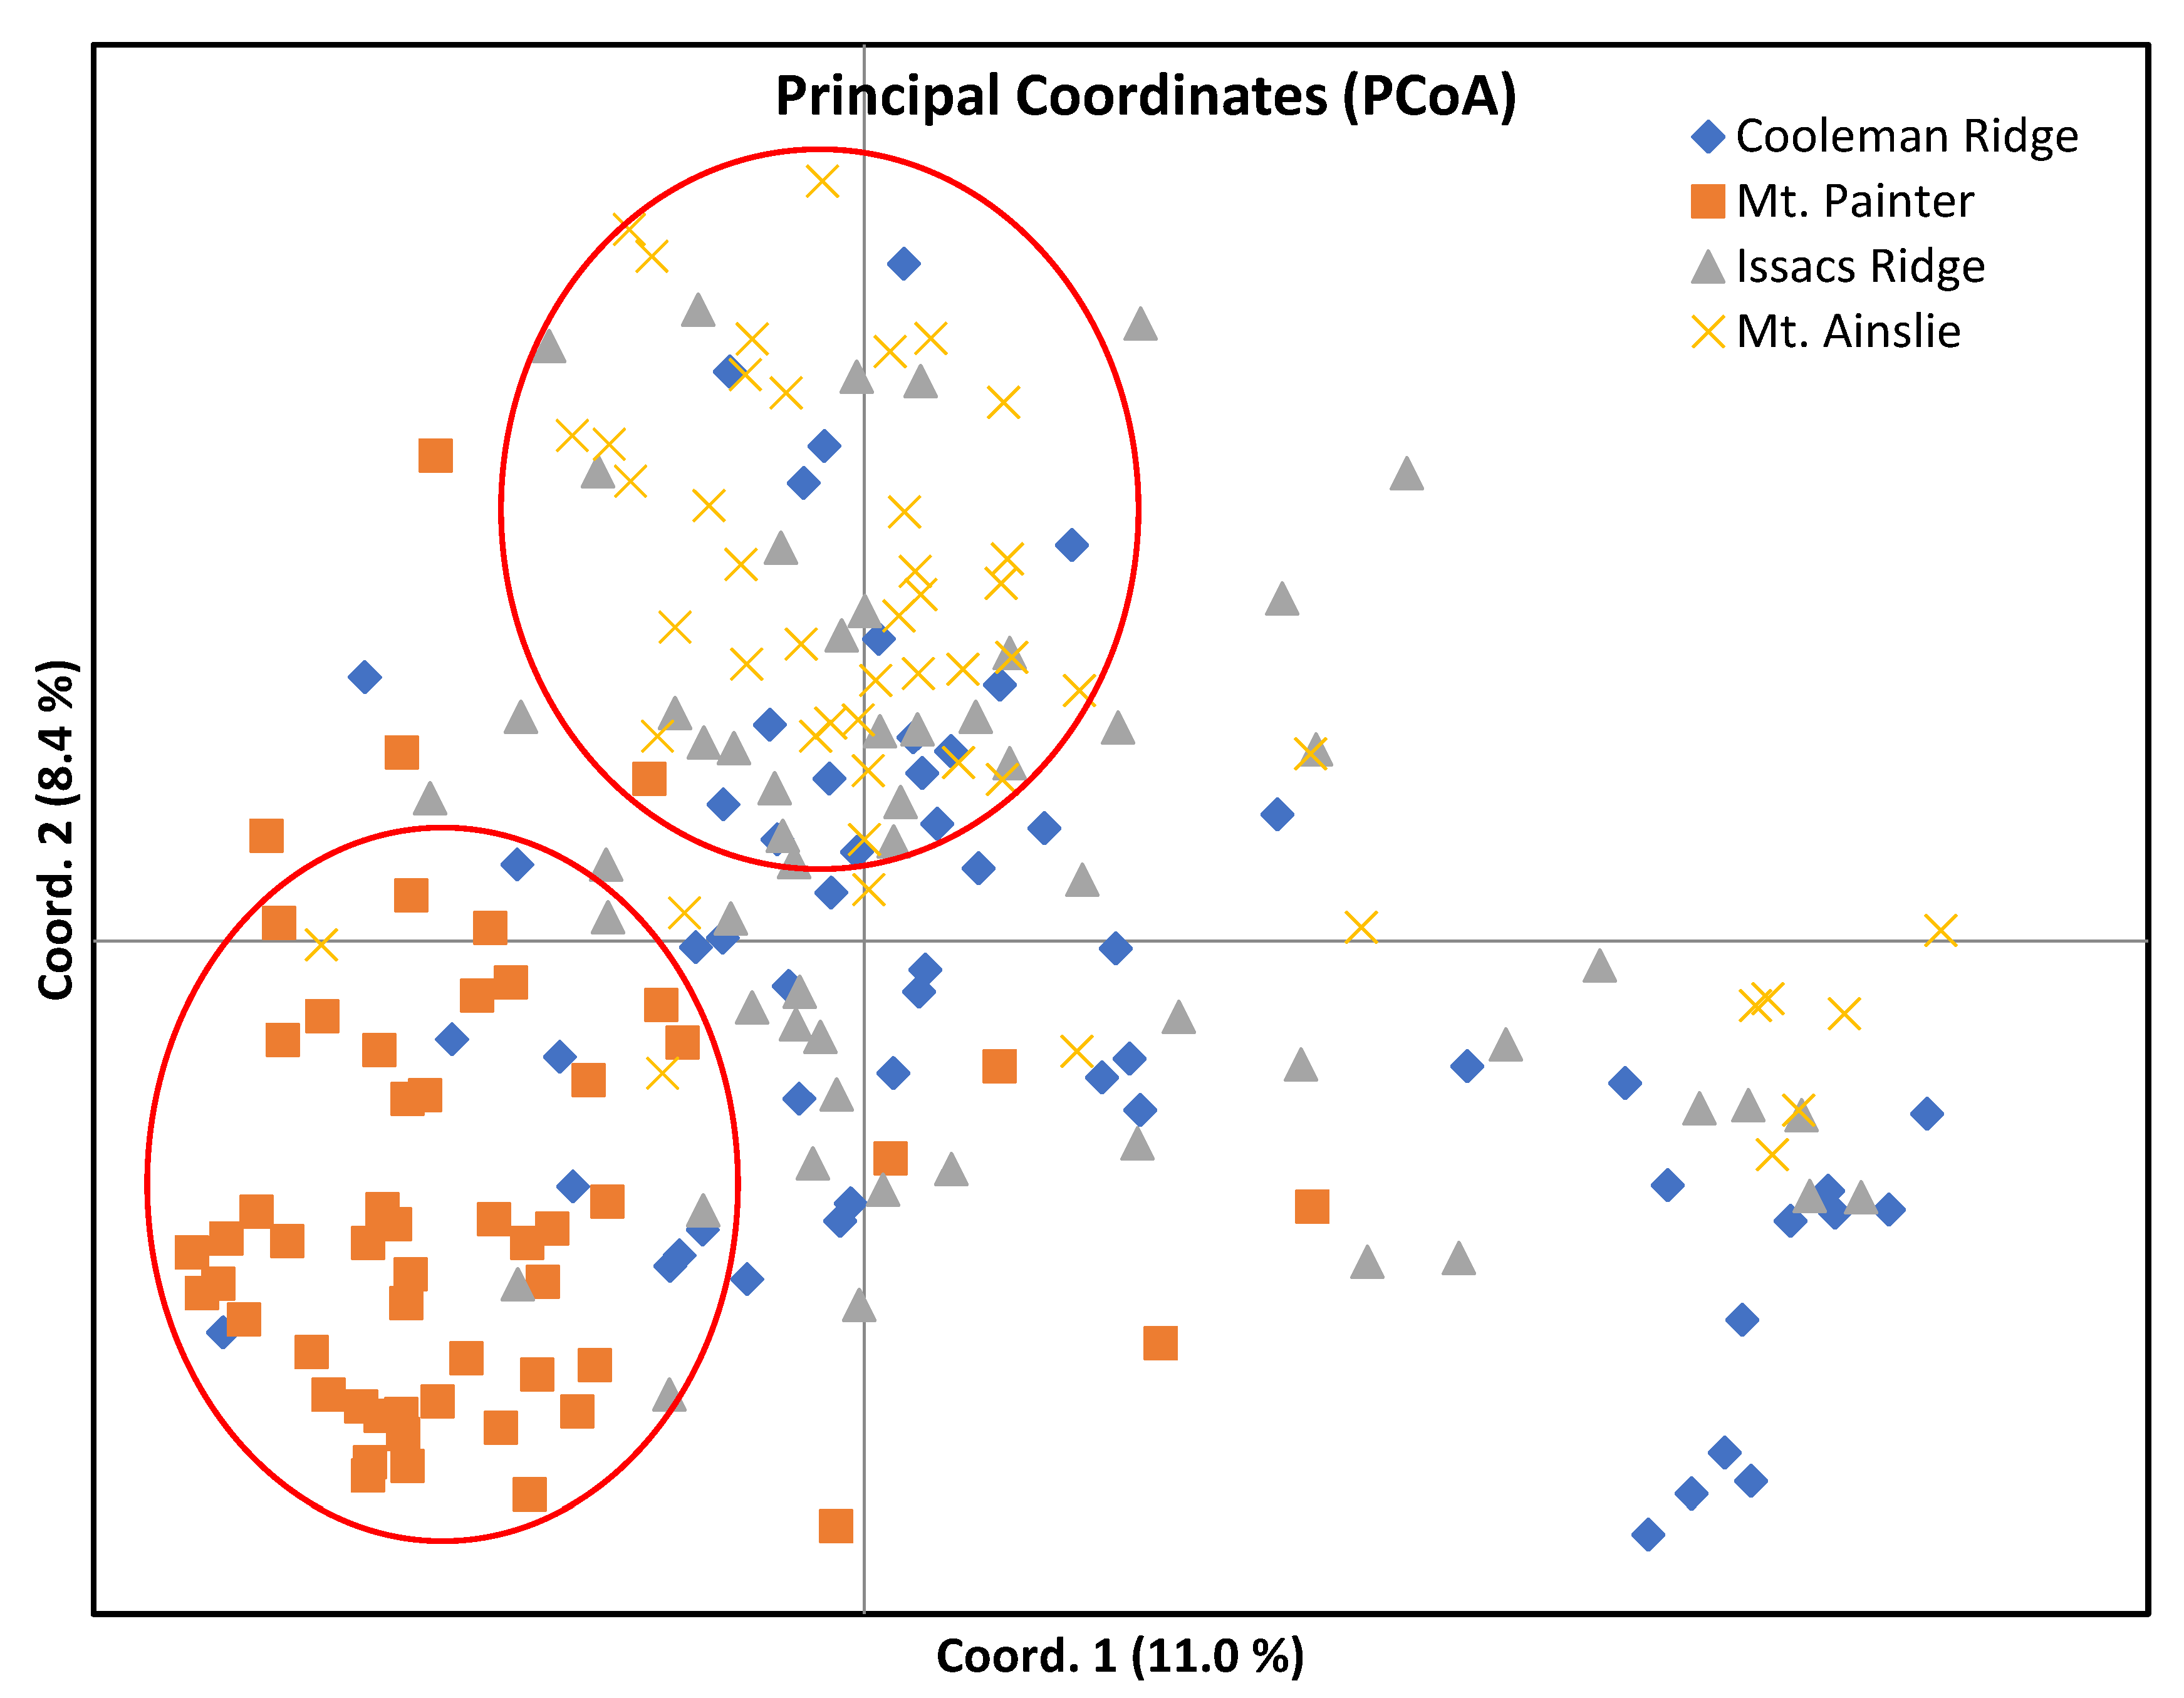
The analysis of the genetic structure of seedlings among the four populations showed that the pairwise population genetic differentiation (FST) values ranged from 0.057 (Isaacs Ridge vs. Mt. Ainslie) to 0.165 (Mt. Painter vs. Mt. Ainslie) (Table 6), suggesting a moderate to high degree of genetic differentiation among the four populations, according to the suggested criterion of low (FST < 0.05), moderate (0.05 < FST < 0.15), high (FST > 0.15) [50,51]. Meanwhile, the pairwise population gene flow (Nm) ranged from 1.336 (Mt. Painter vs. Mt. Ainslie) to 4.378 (Isaacs Ridge vs. Mt. Ainslie) and showed an obviously negative correlation with the FST values. The AMOVA revealed that only a small proportion of the genetic variation (8%) was partitioned among the four populations and most of the genetic variation (92%) was generated within the populations (Table 7). The Principal Coordinate Analysis (PCoA) (Figure 4) revealed that the first two axes in the analysis accounted for 19.4% (11.0% and 8.4%, respectively) of the total variation, with considerable overlap of individuals among the populations of Cooleman Ridge, Isaacs Ridge and Mt. Ainslie, while individuals from the Mt. Painter subpopulation exhibited stronger clustering.
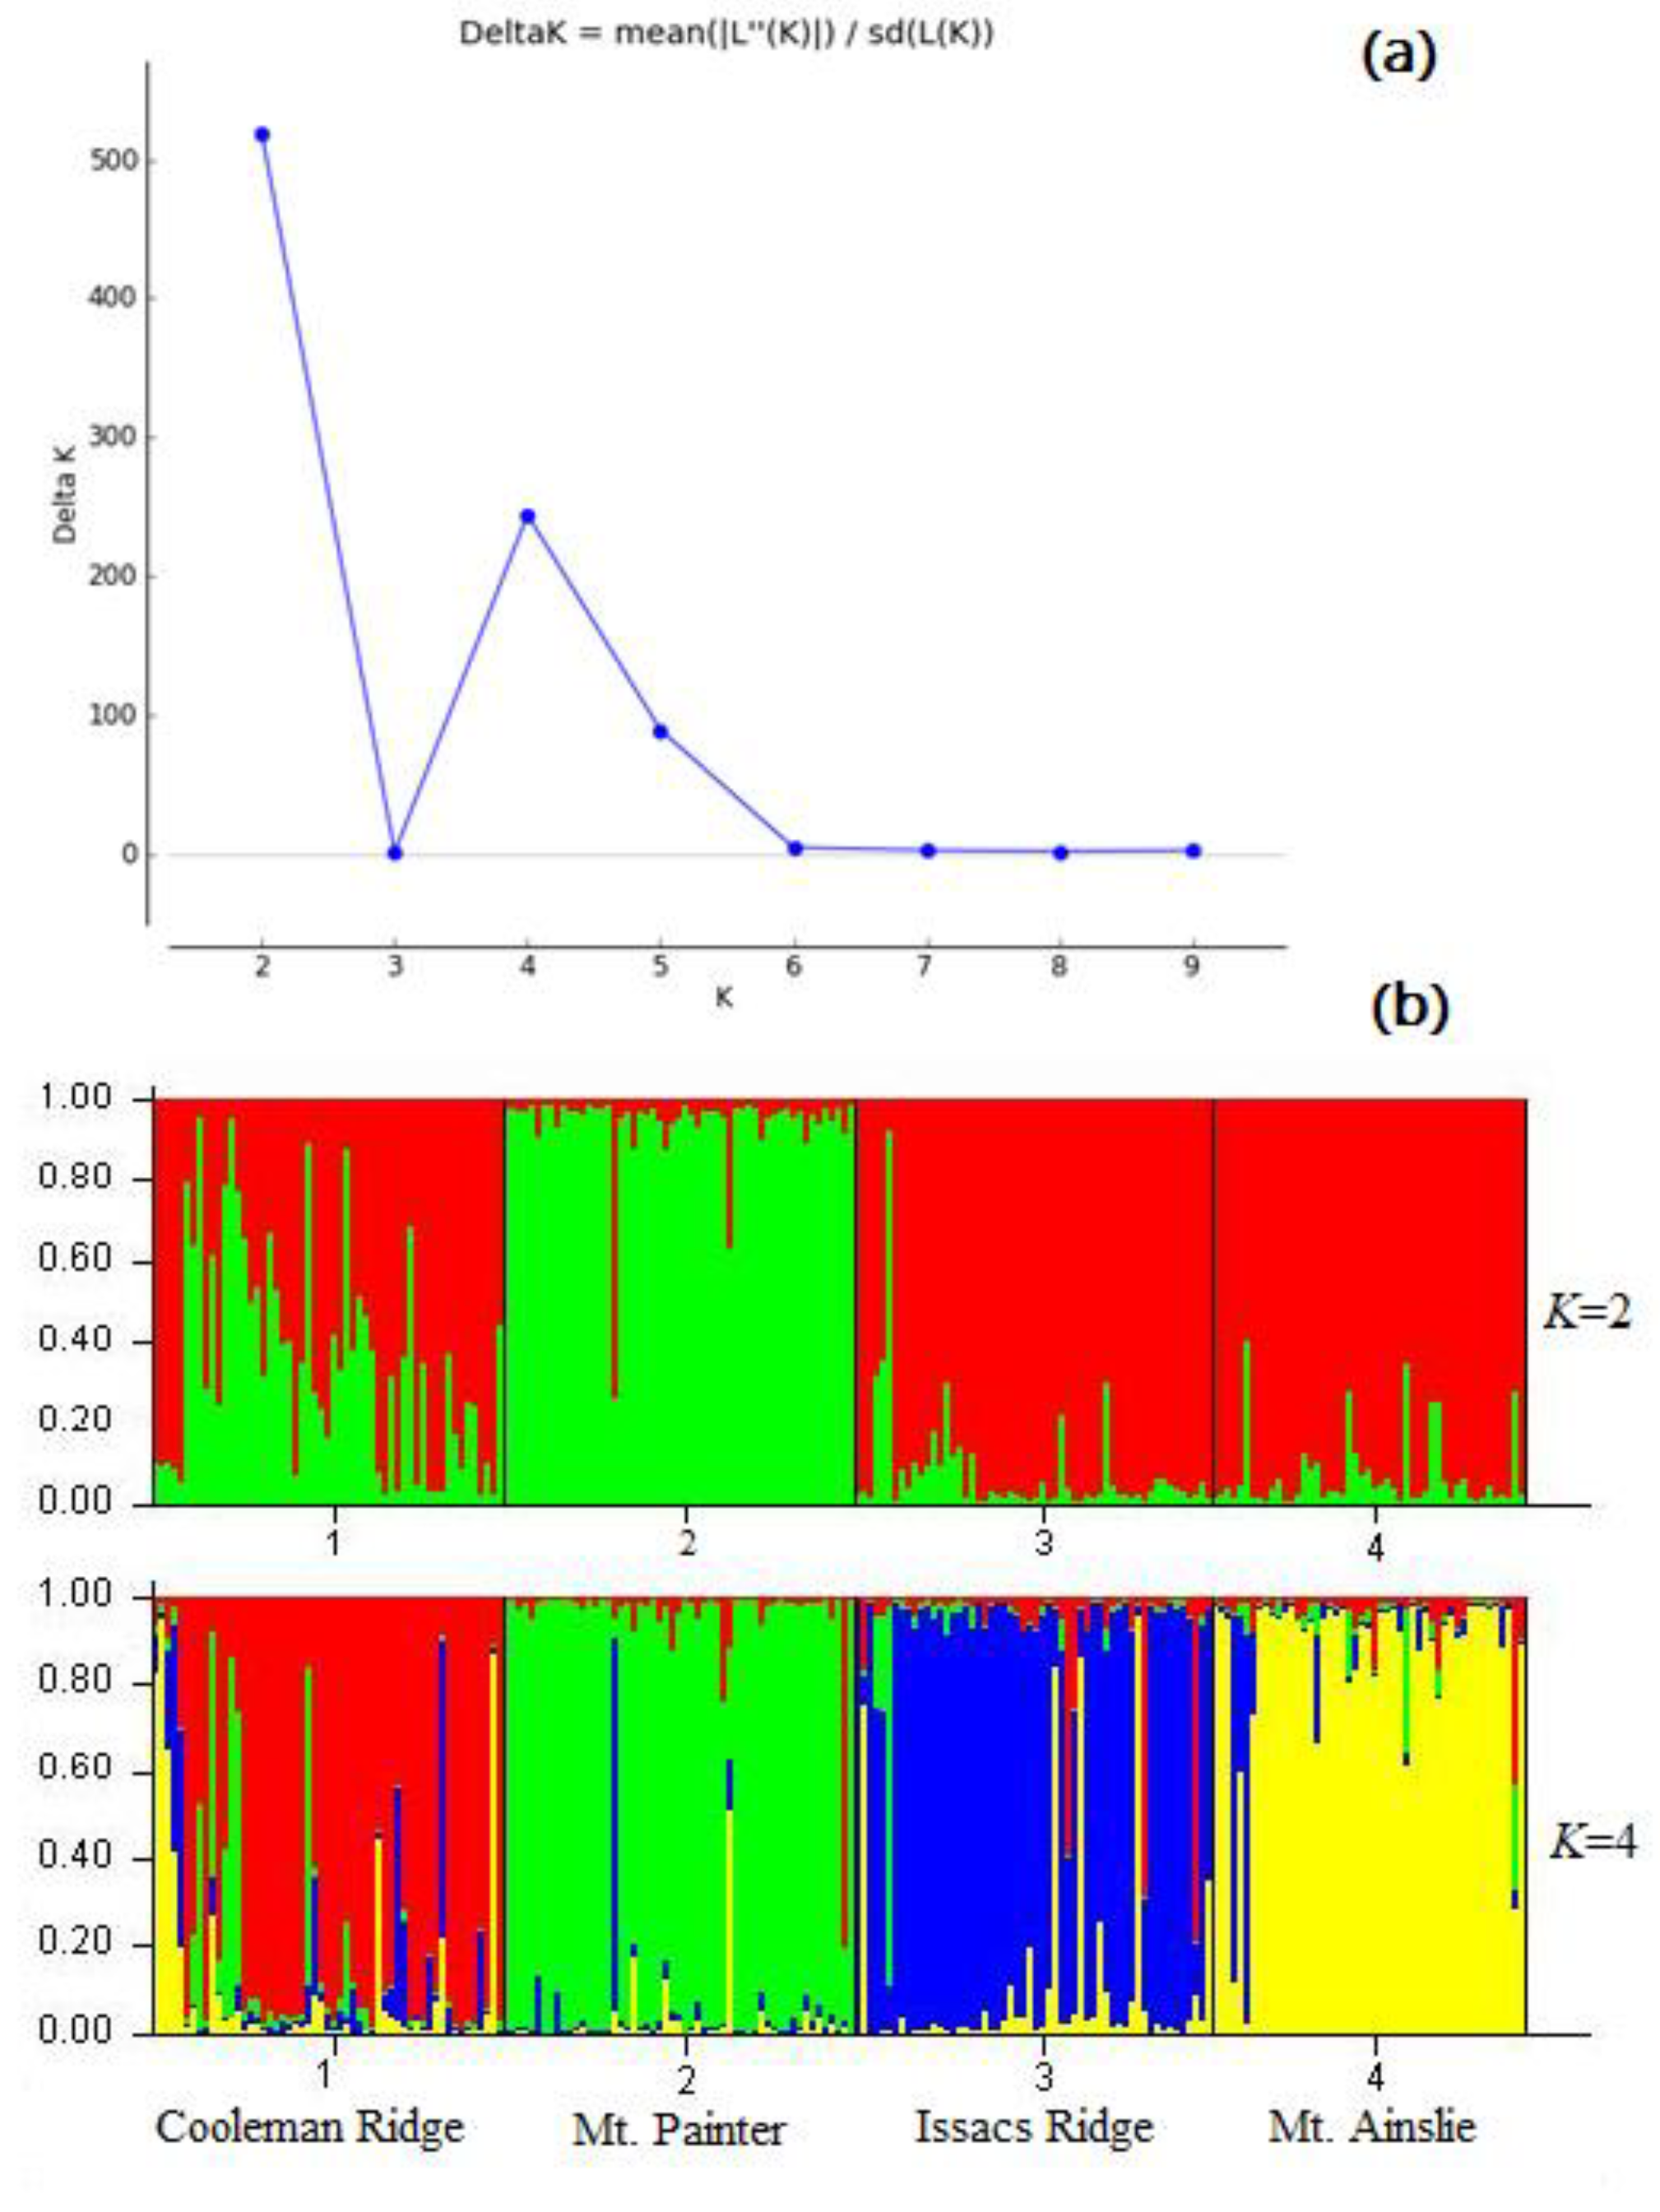
The Bayesian clustering analysis, performed in STRUCTURE software and Structure Harvester software, provides additional support for the determination of genetic structure and optimal K value. The log-likelihood of the number of clusters suggested that the optimal K value was two (corresponding to the populations mostly comprising (i) Mt. Painter individuals and (ii) the others), but a marked secondary peak in delta K = 4 was found (Figure 5), consistent with the four sampling locations.
4. Discussion
This study of A. verticillata on the geographically isolated hills in the ACT provides evidence of limited wind-mediated gene flow, presumably via long-distance pollen dispersal, among subpopulations. We found strong evidence for short-distance seed dispersal, with numerous individuals dispersed close to the female parent, despite the species’ winged seeds suggesting adaptation to anemochorous dispersal. While we could not positively identify all of the maternal parents of the sampled progeny, the evidence for long-distance seed transport was limited. The identification of the vegetatively reproduced trees in three of the studied stands suggests that asexual reproduction plays a role in the species’ strategy for adaptation to challenging sites.
It is estimated that a high proportion (c. 80%) of angiosperms incorporate some form of asexual reproduction in their life cycle, under certain conditions, combined with sexual reproduction [52]. In this study, the asexually reproductive plants (root suckers) were confirmed in the three smaller populations (Table 3), indicating that A. verticillata possess both sexual and asexual reproduction modes, as is the case in the allied species Casuarina glauca [53]. The combination of sexual and asexual reproduction can be considered advantageous compared with either strategy alone, especially under adverse or intensively competitive environmental conditions [54,55]. The A. verticillata occurs naturally on dry exposed slopes with thin, stony soils, that present difficult conditions for seed germination and seedling establishment. There have been reports that many angiosperms that experience an absence or limited availability of mating partners caused by habitat fragmentation revert to asexual reproduction [8,56,57,58]. However, in this case, the presence of root suckers might be attributable to anthropogenic and/or grazing animal disturbance of the root zone, perhaps partially accounting for the species’ noted success on the hills of the ACT [33].
Deforestation and fragmentation are expected to decrease the genetic diversity and increase inbreeding due to the reduction in effective population size and increment of spatial isolation, thus resulting in a decrease in gene flow [7,59]. In this study, lower genetic diversity indices and elevated inbreeding coefficients of the field-grown seedlings were found in the three smaller populations (Mt. Painter, Cooleman Ridge and Issacs Ridge). In contrast, the larger population at Mt. Ainslie had lower inbreeding and higher heterozygosity (Table 4). According to population genetics theory, the reduction in effective population size and the spatial isolation of remnant trees results in a loss of genetic diversity [60]. The mechanisms that explain such loss, over a short period of time, are genetic bottleneck, increase in inbreeding (decrease in heterozygosity) and reduction in gene flow and number of effective parents. Over generations, increases in the genetic drift and founder effects are also expected [61,62]. Elevated inbreeding within populations would result in impacts, such as reduced seed production, viability and fruit set and seedlings with reduced vigor [3,4,5]. In our case, the two small populations at Mt. Painter and Issacs Ridge had a lower percentage of viable seeds and fewer seeds per cone than those of the populations at Cooleman Ridge and Mt. Ainslie. This might be attributed to higher levels of inbreeding within the populations, caused by their smaller effective population sizes (Table 3). This result accords with the theory that small populations become inbred more rapidly than large ones, due to increased rates of genetic drift and biparental inbreeding [4]. The paternity analysis of the progenies revealed that only six males each in the Cooleman Ridge and Mt. Painter populations sired the 48 and 34 open-pollinated progenies of single mother trees at these sites, respectively, presenting a good case in point in this study.
The gene flow within and among populations can exert important influences on the patterns of genetic differentiation and the evolution of local adaptation in plant species [63,64,65,66]. Pollen is the more important vector of gene flow in plant species, relative to its large and relatively immobile seeds [31,67]. The studies have shown that the majority of fertilization of maternal trees occurs nearby the pollen donors, and the pollen density declines rapidly from the source [68,69], even though some long-distance dispersal is found [14,70,71]. Similarly, the average pollen dispersal distance of A. verticillata are 68.5 m (range from 17.9 to 112.9) and 74.1 m (range from 41.8 to 85.9) (Figure 2 and Figure 3) in the Cooleman Ridge and Mt. Painter populations, respectively, indicating that the within-population pollen flow predominates in fragmented populations. However, the fact that we failed to determine the paternal trees for the six offspring in the Mt. Painter population suggested that external pollen flow probably exists, since long-distance pollen dispersal is not unusual in wind-pollinated tree species [14,70,71]. In contrast, the relatively closer seed dispersal distance obtained from the same two populations revealed that the seed dispersal of A. verticillata plays major role in population regeneration and colonization instead of gene exchange, as with other tree species with wind-dispersed seeds [72]. However, in our cases, due to a relatively low viable seed percentage and poor progeny fitness caused by inbreeding in the fragmented population with low effective population size (such as Mt. Painter and Issacs Ridge) (Table 3), the seed dispersal also contributed little to the genetic diversity maintenance and population extension, as with other tree species [10,57], even though huge amount of seeds are produced and dispersed by the female trees of A. verticillata [73].
It is commonly assumed that habitat fragmentation would promote genetic differentiation among the populations, and consequently result in obvious genetic structure due to a reduction in the gene flow and higher rates of genetic drift and inbreeding [74,75,76]. In this study, though substantial genetic differentiation among the four populations was found (e.g., pairwise genetic differentiation, FST = 0.165 between Mt. Painter and Mt. Ainslie), most (FST) of the values of the four populations were low to moderate (0.05 < FST < 0.15). Statistically significant among-population gene flow (Nm) was also found (Table 6), suggesting that the hard barriers to gene flow do not exist among the four populations, even though they are relatively spatially distant (pairwise distance range from 7.6 to 14.2 km). This conclusion was supported by the results of the Principal Coordinate Analysis (PCoA) and Bayesian clustering of the four populations (Figure 4 and Figure 5), which indicated that, while each location is genetically distinct, there was considerable admixture among the four populations.
We presume that the main mode of genetic exchange among the isolated stands of A. verticillata in the ACT is via wind-transported pollen. All of the four populations are located high in the landscape, at the top or in upslope positions on the hills rising above the plain where the city is situated. This position favors the longer dispersal of pollen due to a higher exposure to strong winds. Furthermore, other populations of A. verticillata situated at intermediate positions among the four sampled populations may serve as “stepping-stones” for gene flow, helping to maintain the genetic connectivity among the four populations (Figure 1). On the other hand, the substantial genetic differentiation and genetic structure formation among the populations, presented by genetic parameters (Table 6) and genetic structure analyses (PCoA and STRUCTURE), indicated that the among-population gene flow is limited, causing clear population differentiation. This suggests that gene movement occurs sporadically, when wind conditions are conducive to long-distance transport.
Anemochoric long-distance seed dispersal is far less likely to be a significant driver of gene flow among the localities in this study. Though the seed is winged, it would only be likely to travel comparatively short distances, even under strong wind conditions. The calculations made by Hueneke [33], based on seed mass measurements from ACT populations of A. verticillata, show that a 60 km/h wind would only disperse seeds up to about 84 m. However, it was also noted that isolated individual trees can be found within the ACT in places that have not been cleared, indicating that long-distance seed dispersal does occasionally occur. The possible vectors could be unusual wind conditions, such as updrafts created by large bushfires, for example the 1952, 2003 and 2020 fires in the ACT. Allocasuarina verticillata is a favorite food of cockatoos, which possess strong bills able to crack open the cones. While these birds would typically fragment and digest the seeds, it is possible that a small percentage may survive the passage through the gut intact [77], making endozoochory another possible low-frequency vector of gene movement. Unexplained long-distance seed dispersal, also attributed to cockatoos moving entire cones, has been noted in Banksia spp. [78].
The maternal identities were not determined for a high percentage of the field-grown seedlings at Cooleman Ridge and Mt. Painter. Prima facie, this might be taken as evidence of significant long-distance seed transport. However, a likely reason may be insufficient marker data to make a statistically significant identity by descent determination between parents and offspring. Drawing conclusions about the likely pollen parents when the mother is known with certainty (as was the case for the cultivated seedlings collected from known mothers) requires much less marker information than determining kinship among the individuals for which no pedigree exists. We therefore think it likely that most of the individuals in each population will be the progeny of local mothers, though the possibility of long-distance seed transport remains open—as evidenced, for example, by the presence of an individual at Cooleman Ridge for which no close relatives could be determined.
Moreover, the relatively low genetic differentiations and weak genetic structure among the four populations may be partly due to the inadequate time for a significant genetic change in A. verticillata populations, since long-lived woody plants would require a long period to accumulate genetic changes [79], but land-use change in the ACT hills commenced less than 100 years prior to the study. Further genetic differentiation and strong genetic structure formation among fragmented populations of A. verticillata may occur in the future.
5. Conclusions
Allocasuarina verticillata is well adapted to harsh climatic and edaphic conditions within the section of its natural range on the exposed ridges and hills in peri-urban areas in the ACT, Australia. The species has several adaptations that allow it to thrive under the influence of these environmental conditions and anthropogenic disturbances. Firstly, asexual reproduction through root suckering was found at the three smaller sites where fewer trees, both as a proportion of the populations and in absolute terms, were found to be sexually reproductive. This may be because these sites were harsher and/or because the species had not fully occupied the sites. The effective population size, rather than the actual population size, exerts positive influences on reproductive success (percentage of viable seeds and seed numbers per cone). The reduction in effective population size and increment of spatial isolation resulted in lower genetic diversity and a higher inbreeding coefficient of the three fragmented populations, in comparison with the continuous population. Moderate pairwise genetic differentiations and low genetic structures, coupled with substantial gene flow among the four distantly isolated populations, suggested that gene exchange via pollen flow maintains partial genetic connectivity among the fragmented populations, while seed dispersal appears to be predominantly over shorter distances within populations. Allocasuarina verticillata is a predominantly dioecious woody plant, but monoecious individuals rarely occur, based on our field survey.
Supplementary Materials
The following are available online at https://www.mdpi.com/article/10.3390/f13071152/s1: Table S1: Genotyping data of four populations and progenies.
Author Contributions
Conceptualization and methodology, C.Z., D.B. and L.B.; validation, Y.Z. and D.B.; formal analysis, Y.Z. and L.L.; investigation, Y.Z. and N.E.; resources, D.B. and N.E.; data curation, Y.Z. and D.B.; writing—original draft preparation, Y.Z; writing—review and editing, D.B. and C.Z.; supervision, project administration and funding acquisition, D.B. All authors have read and agreed to the published version of the manuscript.
Funding
This work was financially supported by CSIRO and the Fundamental Research Funds for the Central Non-profit Research Institution of CAF (No. CAFYBB2018SZ002fh) and the National Natural Science Foundation of China (Grant No. 31770716).
Acknowledgments
We would like to acknowledge Brendan Lepschi, Curator of the Australian National Herbarium, for identification of plant specimens and useful advice on the fire history of the ACT.
Conflicts of Interest
The authors declare no conflict of interest.
References
- Hedric, P.W. Conservation genetics: Where are we now? Trends Evol. 2001, 16, 629–636. [Google Scholar] [CrossRef]
- Lindborg, A.; Eriksson, O. Historical landscape connectivity affects present plant species diversity. Ecology 2004, 85, 1840–1845. [Google Scholar] [CrossRef]
- Sánchez, P.C.; Valerio, P.D.; Sáenz-Romero, C.; Diego, Y.H. Reproductive success and inbreeding differ in fragmented populations of Pinus rzedowskii and Pinus ayacahuite var. veitchii, two endemic Mexican pines under threat. Forests 2016, 7, 178. [Google Scholar] [CrossRef] [Green Version]
- Ellstrand, N.C.; Elam, D.R. Population genetic consequences of small population size: Implications for plant conservation. Annu. Rev. Ecol. Syst. 1993, 34, 217–242. [Google Scholar] [CrossRef]
- Frankham, R.; Briscoe, D.A.; Ballou, J.D. Introduction to Conservation Genetics; Cambridge University Press: New York, NY, USA, 2002. [Google Scholar]
- Aguilar, R.; Ashworth, L.; Galetto, L.; Aizen, M.A. Plant reproductive susceptibility to habitat fragmentation: Review and synthesis through a meta-analysis. Ecol. Lett. 2006, 9, 968–980. [Google Scholar] [CrossRef] [PubMed]
- Aguilar, R.; Quesada, M.; Ashworth, L.; Herrerias-Diego, Y.; Loco, J. Genetic consequences of habitat fragmentation in plant populations: Susceptible signals in plant traits and methodological approaches. Mol. Ecol. 2008, 17, 5177–5188. [Google Scholar] [CrossRef]
- Viktora, M.; Savidge, R.A.; Rajora, O.P. Clonal and nonclonal genetic structure of subarctic black spruce (Picea mariana) populations in Yukon territory. Bot. Bot. 2011, 89, 133–140. [Google Scholar] [CrossRef]
- Aguiar, B.I.; Sebbenn, A.M.; Tarazi, R.; Vogado, N.O.; Kageyama, P.Y. Phenology, seed germination, and genetics explains the reproductive strategies of Diospyros lasiocalyx (mart.) b. wall. Trop. Plant Biol. 2020, 13, 23–35. [Google Scholar] [CrossRef]
- Scheepens, J.F.; Frei, E.S.; Armbruster, G.F.J.; Stöcklin, J. Pollen dispersal and gene flow within and into a population of the alpine monocarpic plant Campanula thyrsoides. Ann. Bot. 2012, 110, 1479–1488. [Google Scholar] [CrossRef] [Green Version]
- O’Connell, L.M.; Mosseler, A.; Rajora, O.P. Extensive long-distance pollen dispersal in a fragmented landscape maintains genetic diversity in white spruce. J. Hered. 2007, 98, 640–645. [Google Scholar] [CrossRef]
- Pluess, A.R.; Sork, V.L.; Dolan, B. Short distance pollen movement in a wind-pollinated tree, Quercus lobata (Fagaceae). For. Ecol. Manag. 2009, 258, 735–744. [Google Scholar] [CrossRef]
- Lander, T.A.; Boshier, D.H.; Harris, S.A. Fragmented but not isolated: Contribution of single trees, small patches and long-distance pollen flow to genetic connectivity for Gomortega keule, an endangered Chilean tree. Biol. Conserv. 2010, 143, 2583–2590. [Google Scholar] [CrossRef]
- Williams, C.G. Long-distance pine pollen still germinates after meso-scale dispersal. Am. J. Bot. 2010, 97, 846–855. [Google Scholar] [CrossRef] [PubMed]
- Cain, M.L.; Milligan, B.G.; Strand, A.E. Long-distance seed dispersal in plant populations. Am. J. Bot. 2000, 87, 1217–1227. [Google Scholar] [CrossRef] [PubMed] [Green Version]
- He, T.; Krauss, S.L.; Lamont, B.B.; Miller, B.P.; Enright, N.J. Long-distance seed dispersal in a metapopulation of Banksia hookeriana inferred from a population allocation analysis of amplified fragment length polymorphism data. Mol. Ecol. 2004, 13, 1099–1109. [Google Scholar] [CrossRef] [PubMed]
- Howe, H.F.; Miriti, M.N. When seed dispersal matters. BioScience 2004, 54, 651–660. [Google Scholar] [CrossRef]
- Hampe, A.; Carcia-Castono, L.; Shupp, E.; Jordano, P. Spatio-temporal dynamics and local hotspots of initial recruitment in vertebrate-dispersed trees. J. Ecol. 2008, 96, 668–678. [Google Scholar] [CrossRef]
- Hoffmann, A.A.; Blows, M.W. Species borders-ecological and evolutionary perspectives. Trends Ecol. Evol. 1994, 9, 223–227. [Google Scholar] [CrossRef]
- Lesica, P.; Allendorf, F.W. When are peripheral populations valuable for conservation? Conserv. Biol. 1995, 9, 753–760. [Google Scholar] [CrossRef]
- Arnaud-Haond, S.; Teixeira, S.; Massa, S.I.; Billot, C.; Saenger, P.; Coupland, G.; Serrao, E.A. Genetic structure at range edge: Low diversity and high inbreeding in Southeast Asian mangrove (Avicennia marina) populations. Mol. Ecol. 2006, 15, 3515–3525. [Google Scholar] [CrossRef]
- Eckert, C.; Samis, K.; Lougheed, S. Genetic variation across species’ geographical ranges: The central-marginal hypothesis and beyond. Mol. Ecol. 2008, 17, 1170–1188. [Google Scholar] [CrossRef] [PubMed]
- Pironon, S.; Villellas, J.; Morris, W.F.; Doak, D.F.; García, M.B. Do geographic, climatic or historical ranges differentiate the performance of central versus peripheral populations? Glob. Ecol. Biogeogr. 2015, 24, 611–620. [Google Scholar] [CrossRef]
- Gapare, W.J.; Aitken, S.N. Strong spatial genetic structure in peripheral but not core populations of Sitka spruce [Picea sitchensis (Bong.) Carr.]. Mol. Ecol. 2005, 14, 2659–2667. [Google Scholar] [CrossRef]
- Ridley, M. Evolution, 3rd ed.; Blackwell Publishing: Oxford, UK, 2003; p. 751. [Google Scholar]
- Tarazi, R.; Moreno, M.A.; Gandara, F.B.; Feraz, E.M.; Moraes, M.L.T.; Vinson, C.C.; Ciampi, A.Y.; Vencovsky, R.; Kageyama, P.Y. High levels of genetic differentiation and selfing in the Brazilian cerrado fruit tree Dipteryx alata Vog. (Fabaceae). Genet. Mol. Biology. 2010, 33, 78–85. [Google Scholar] [CrossRef]
- Lázaro-Nogal, A.; Matesanz, S.; García-Fernández, A.; Traveset, A.; Valladares, F. Population size, center-periphery, and seed dispersers’s effects on the genetic diversity and population structure of the Mediterranean relict shrub Cneorum tricoccon. Ecol. Evol. 2017, 7, 7231–7242. [Google Scholar] [CrossRef]
- Joseph, L. The glossy black-cockatoo on Kangaroo Island. Emu–Austral Omithology 1982, 82, 46–49. [Google Scholar] [CrossRef]
- Marcar, N.E.; Crawford, D.F. Tree for Saline Landscapes; RIRDC: Canberra, Australia, 2004. [Google Scholar]
- Broadhurst, L. Genetic diversity and population genetic structure in fragmented Allocasuarina verticillata (Allocasuarinaceae)—Implications for restoration. Aus. J. Bot. 2011, 59, 770–780. [Google Scholar] [CrossRef]
- Broadhurst, L. Pollen dispersal in fragmented populations of the dioecious wind-pollinated tree, Allocasuarina verticillata (Drooping Sheoak, Drooping She-oak, Allocasuarinaceae). PLoS ONE 2015, 10, e0119498. [Google Scholar] [CrossRef] [Green Version]
- Burbidge, N.; Gray, M. Flora of the Australian Capital Territory; Australian National University Press: Canberra, ACT, Australia, 1970. [Google Scholar]
- Hueneke, K. Aspects of the Autecglogy and Secondary Succession of Casuarina Stricta on Canberra’s Hills; Australian National University: Canberra, ACT, Australia, 1976. [Google Scholar]
- Turnbull, J.W.; Martenz, P.N. Seed production, collection and germination in Casuarinaceae. In Proceedings of the International Workshop on Casuarina Ecology, Management and Utilization, Canberra, Australia, 17–21 August 1981; Midgley, S.J., Turnbull, J.W., Johnston, R.D., Eds.; CSIRO: Canberra, Australia, 1983; p. 286. [Google Scholar]
- SAS Institute Incorporated. SAS Software Release 8.2; SAS Cirle; SAS Institute Incorporated: Cary, NC, USA, 1999. [Google Scholar]
- Zhang, Y.; Zhong, C.L.; Han, Q.; Jiang, Q.B.; Chen, Y.; Chen, Z.; Pinyopusarerk, K.; Bush, D. Reproductive biology and breeding system in Casuarina equisetifolia (Casuarinaceae)—Implication for genetic improvement. Aus. J. Bot. 2016, 64, 120–128. [Google Scholar] [CrossRef]
- Xu, X.Y.; Zhou, C.P.; Zhang, Y.; Zhang, W.Q.; Gan, X.H.; Zhang, H.X.; Guo, Y.; Gan, S.M. A novel set of 223 EST-SSR markers in Casuarina L. ex Adans: Polymorphisms, cross-species transferability, and utility for commercial clone genotyping. Tree Genet. Genomes 2018, 14, 30. [Google Scholar] [CrossRef]
- Arruda, M.P.D.; Goncalves, E.C.; Schneider, M.P.C.; Silva, A.L.D.C.; Morielle-Versute, E. An alternative genotyping method using dye-labeled universal primer to reduce unspecific amplifications. Mol. Biol. Rep. 2010, 37, 2031–2036. [Google Scholar] [CrossRef] [PubMed]
- Peakall, R.; Smouse, P.E. Gen Al Ex 6.5: Genetic analysis in Excel, population genetic software for teaching and research: An update. Bioinformatics 2006, 28, 2537–2539. [Google Scholar] [CrossRef] [PubMed] [Green Version]
- Goudet, J. FSTAT (Version 2.9.4), a Program (for Windows 95 and above) to Estimate Population Genetics Parameters; Lausanne University: Lausanne, Switzerland, 2003. [Google Scholar]
- Kalinowski, S.T.; Taper, M.L.; Marshall, T.C. Revising how the computer program CERVUS accommodates genotyping error increases success in paternity assignment. Mol. Ecol. 2007, 16, 1099. [Google Scholar] [CrossRef] [PubMed]
- Bohonak, A.J. IBD (Isolation by Distance): A program for analyses of isolation by distance. J. Hered. 2002, 93, 153–154. [Google Scholar] [CrossRef]
- Pritchard, J.K.; Stephens, M.; Donnelly, P. Inference of population structure using multilocus genotype data. Genetic 2000, 155, 945–959. [Google Scholar] [CrossRef]
- Earl, D.; Vonholdt, B.M. Structure Harvester: A website and program for visualizing STRUCTURE output and implementing the Evanno method. Conser. Genet. Resour. 2011, 4, 359–361. [Google Scholar] [CrossRef]
- Wang, J. Triadic IBD coefficients and applications to estimating pairwise relatedness. Genet. Res. 2007, 89, 135–153. [Google Scholar] [CrossRef]
- Han, L.; Love, K.; Peace, B.; Broadhurst, L.; England, N.; Li, L.; Bush, D. Origin of planted Eucalyptus benthamii trees in Camden NSW: Checking the effectiveness of circa situm conservation measures using molecular markers. Biodivers. Conserv. 2020, 29, 1301–1322. [Google Scholar] [CrossRef]
- Broadhurst, L.; Bush, D.; Begley, J. Managing genetic diversity and representation in Banksia marginata (Proteaceae) seed production areas used for conservation and restoration. Diversity 2021, 13, 39. [Google Scholar] [CrossRef]
- Wang, J. Coancestry: A program for simulating, estimating and analysing relatedness and inbreeding coefficients. Mol. Ecol. Resour. 2010, 11, 141–145. [Google Scholar] [CrossRef]
- Botstein, D.; White, R.L.; Skolnick, M.; Ronald, W.D. Construction of a genetic linkage map in man using rec striction fragment length polymorphisms. Am. J. Hum. Genet. 1980, 32, 314–331. [Google Scholar] [PubMed]
- Sathyanarayana, N.; Pittala, R.K.; Tripathi, P.K.; Chopra, R.; Singh, H.R.; Belamkar, V.; Bhardwaj, P.K.; Doyle, J.J.; Egan, A.N. Transcriptomic resources for the medicinal legume Mucuna pruriens: De novo transcriptome assembly, annotation, identification and validation of EST-SSR markers. BMC Genom. 2017, 18, 409. [Google Scholar] [CrossRef] [PubMed] [Green Version]
- Guo, Q.; Li, X.Y.; Yang, S.H.; Yang, Z.H.; Sun, Y.H.; Zhang, J.T.; Cao, S.; Dong, L.; Uddin, S.; Li, Y. Evaluation of the genetic diversity and differerntiation of Black Locust (Robinia pseudoacacia L.) based on genomic and expressed sequence tag-simple sequence repeats. Int. J. Mol. Sci. 2018, 19, 2492. [Google Scholar] [CrossRef] [PubMed] [Green Version]
- KlimeŠ, L.; LlieŠova, J.; Hendriks, R.; Van, G.J. Clonal plant architecture: A comparative analysis of form and function. In The Ecology and Evolution of Clonal Plants; de Kroon, H., van Groenendael, J., Eds.; Backhuys: Leiden, The Netherlands, 1997. [Google Scholar]
- Doran, J.C.; Hall, N. Notes on fifteen Australian Casuarina species. In Casuarina Ecology, Management and Utilization; Midgely, S.J., Turnbull, J.W., Johnson, R.D., Eds.; CSIRO: Melbourne, Australia, 1983; pp. 19–25. [Google Scholar]
- Benzing, D.H. Bromeliaceae: Profile of an Adaptive Radiation; Cambridge University Press: Cambridge, UK, 2000. [Google Scholar]
- Rogalski, J.M.; Reis, A.D.; Reis, M.S.; Hmeljevski, K.V. Biologia reproductive da reófita Dyckia brevifolia Baker (Bromeliaceae), do Rio Itajai-Acu, Santa Catarina Brasil. Rev. Bras. Bot. 2009, 32, 691–702. [Google Scholar] [CrossRef] [Green Version]
- Pellergrino, G.; Bellusci, F.; Palermo, A.M. Effects of population structure on pollen flow, clonality rates and reproductive success in fragmented Serapias lingua populations. BMC Plant Biol. 2015, 15, 222. [Google Scholar] [CrossRef] [Green Version]
- Garcia, A.S.; Bressan, E.A.; Ballester, M.V.R.; Figueira, A.; Sebbenn, A.M. High rates of pollen and seed flow in Hymenaea stigonocarpa on a highly fragmented savanna landscape in Brazil. New For. 2019, 50, 991–1006. [Google Scholar] [CrossRef]
- Wiberg, R.A.W.; Scobie, A.R.; A’Hare, S.W.; Ennos, R.A.; Cottrell, J.E. The genetic consequences of long-term habitat fragmentation on a self-incompatible clonal plant, Linnaea borealis L. Biol. Conserv. 2016, 201, 405–413. [Google Scholar] [CrossRef] [Green Version]
- Sork, V.L. Gene flow and natural selection shape spatial patterns of genes in tree populations: Implications for evolutionary processes and applications. Evol. Appl. 2016, 9, 291–310. [Google Scholar] [CrossRef]
- Franklin, I.A. Evolutionary change in small populations. In Conservation Biology: An Evolutionary-Ecological Perspective; Soulé, M.E., Wilcox, B.A., Eds.; Sinauer Associates: Sunderland, MA, USA, 1980; pp. 135–150. [Google Scholar]
- Holderegger, R.; Buehler, D.; Gugerli, F.; Manel, S. Landscape genetics of plants. Trends Plants Sci. 2010, 15, 675–683. [Google Scholar] [CrossRef]
- Sampson, J.F.; Byrne, M.; Gibson, N.; Yates, C. Limiting inbreeding in disjunct and isolated populations of a woody shrub. Ecol. Evol. 2016, 6, 5867–5880. [Google Scholar] [CrossRef] [Green Version]
- Streiff, R.; Ducousso, A.; Lexer, C.; Steinkellner, H.; Gloess, J.; Kremer, A. Pollen dispersal inferred from paternity analysis in a mixed oak stand of Quercus robur L. and Q. petraea (Matt.) Liebl. Mol. Ecol. 1999, 8, 831–841. [Google Scholar] [CrossRef]
- Rieseberg, L.H.; Burke, J.M. The biological reality of species: Gene flow, selection, and collective evolution. Taxon 2001, 50, 47–67. [Google Scholar] [CrossRef]
- Lenormand, T. Gene flow and the limits to natural selection. Trends. Ecol. Evol. 2002, 17, 183–189. [Google Scholar] [CrossRef]
- Sork, V.L.; Smouse, P.E. Gene analysis of landscape connectivity in tree populations. Landsc. Ecol. 2006, 21, 821–836. [Google Scholar] [CrossRef]
- Dow, B.D.; Ashley, M.V. Factors influencing male mating success in bur oak, Quercus macrocarpa. New For. 1998, 15, 161–180. [Google Scholar] [CrossRef]
- Smouse, P.E.; Sork, V.K. Measuring pollen flow in forest trees: An exposition of alternative approaches. For. Ecol. Manag. 2004, 197, 21–38. [Google Scholar] [CrossRef]
- Deacon, N.J.; Cavender-Bares, J. Limited pollen dispersal contributes to population genetic structure but not local adaptation in Qercus oleoides forests of Costa Rica. PLoS ONE 2015, 10, e138783. [Google Scholar] [CrossRef] [PubMed] [Green Version]
- Smouse, P.E.; Dyer, R.J.; Westfall, R.D.; Sork, V.L. Two-generation analysis of pollen flow across a landscape. I. Male gamete heterogeneity among females. Evolution 2001, 55, 260–271. [Google Scholar] [CrossRef]
- Hampe, A.; Pemonge, M.-H.; Petit, R.J. Efficient mitigation of founder effects during the establishment of leading-edge oak population. Proc. Roy. Soc. B 2013, 280, 20131070. [Google Scholar] [CrossRef] [PubMed] [Green Version]
- Troupin, D.; Nathan, R.; Vendramin, G. Analysis of spatial genetic structure in an expanding Pinus halepensis population reveals development of fine-scale genetic clustering over time. Mol. Ecol. 2006, 15, 317–3630. [Google Scholar] [CrossRef]
- Chapman, T.F.; Paton, D.C. Casuarina ecology: Factors limiting cone production in the drooping sheoak, Allocasua rina verticillata. Aus. J. Bot. 2007, 55, 171–177. [Google Scholar] [CrossRef]
- Young, A.G.; Boyle, T.J.B.; Brown, T. The population genetic consequences of habitat fragmentation for plants. Trends. Ecol. Evol. 1996, 11, 413–417. [Google Scholar] [CrossRef]
- Lowe, A.J.; Boshier, D.; Ward, M.; Bacles, C.F.E.; Navarro, C. Genetic resource impacts of habitat loss and degradation; reconciling empirical evidence and predicted theory of neotropical trees. Heredity 2005, 95, 255–273. [Google Scholar] [CrossRef] [PubMed] [Green Version]
- Oyama, K.; Herrera-Arroyo, M.L.; Rocha-Ramírez, V.; Benítez-Malvido, J.; Ruiz-Sánchez, E.; González-Rodríguez, A. Gene flow interruption in a recently human-modified landscape: The value of isolated trees for the maintenance of genetic diversity in a Mexican endemic red oak. For. Ecol. Manag. 2017, 390, 27–35. [Google Scholar] [CrossRef]
- Blanco, G.; Bravo, C.; Chamorro, D.; Lovas-Kiss, Á.; Hiraldo, F.; Tella, J.L. Herb endozoochory by cockatoos: Is ‘foliage the fruit’? Aust. Ecol. 2020, 45, 122–126. [Google Scholar] [CrossRef]
- He, T.; Lamont, B.B.; Krauss, S.L.; Enright, N.J.; Miller, B.P. Long-distance dispersal of seeds in the fire-tolerant shrub Banksia attenuata. Ecography 2009, 32, 571–580. [Google Scholar] [CrossRef]
- Landguth, E.L.; Cushman, S.A.; Schwartz, M.K.; McKelvey, K.S.; Murphy, M.; Luikart, G. Quantifying the lag time to detect barriers in landscape genetics. Mol. Ecol. 2010, 19, 4179–4191. [Google Scholar] [CrossRef]
Figure 1.
Locations of the four A. verticillata populations (red triangle). Blue asterisk denotes the city center of Canberra, and the pink-colored layer indicates the urban extent of the Canberra suburbs. The green dots are spot locations of A. verticillata and the green shaded areas indicate regions where extensive stands of the species are found. Species occurrence data points are a subset from Atlas of Living Australia download at https://biocache.ala.org.au/occurrences/search?q=qid:1624403041177, accessed on 23 June 2021.

Figure 2.
Distances and relative positions between pollen donors and the single female parent at Cooleman Ridge, ACT. (a) Distances and relative positions between pollen donors and the single female parent at Cooleman Ridge, ACT. Pollen donor ①, ②, ③, ④, ⑤, ⑥ sired 6, 12, 1, 20, 8 and 1 offspring (greenhouse-raised, open-pollinated seedlings), respectively; (b) Distances and relative positions between pollen donors and the single female parent at Mt. Painter, ACT. Pollen donor ①, ②, ③, ④, ⑤, ⑥ sired 8, 1, 5, 1, 15 and 4 offspring (greenhouse-raised open-pollinated seedlings), respectively.

Figure 3.
(a) Population of A. verticillata at Cooleman Ridge with an indicative selection of mothers and their progeny linked by vector traces (adult females, red triangles; adult males, blue squares; field-grown seedlings, green circles). (b) Population of A. verticillata at Mt. Painter with an indicative selection of mothers and their progeny linked by vector traces (adult females, red triangles; adult males, blue squares; adults of indeterminate sex, white circles; field-grown seedlings, green circles). Arrow heads indicate the inferred direction of seed dispersal.


Figure 4.
Genetic relationship between the four populations (field-grown seedling samples) revealed by principal coordinates analysis (PCoA), based on Nei’s genetic distances.
Figure 4.
Genetic relationship between the four populations (field-grown seedling samples) revealed by principal coordinates analysis (PCoA), based on Nei’s genetic distances.

Figure 5.
(a) the optimal K value generated by STRUCTURE HARVESTER; (b) population structure inferred by Bayesian cluster analyses (STRUCTURE) for four populations of A. verticillata. Results for K (number of clusters) are two and four, respectively. Each individual (grouped by population) is represented by a vertical bar.


Table 1.
GPS coordinates and individual components of the four populations involved in this study.
| Population | GPS Coordinate | Individual | Total | |||||
|---|---|---|---|---|---|---|---|---|
| Latitude S | Longitude E | Female Trees | Male Trees | Seedling | Gender Unknown (Adult) | Monoecious | ||
| Cooleman Ridge | 35°21′16.61″ | 149°01′49.69″ | 45 | 45 | 55 | 29 | 1 | 175 |
| Mt. Painter | 35°15′53.41″ | 149°03′49.17″ | 17 | 26 | 56 | 8 | 107 | |
| Isaacs Ridge | 35°21′21.75″ | 149°06′57.52″ | 9 | 17 | 167 | 0 | 193 | |
| Mt. Ainslie | 35°16′36.88″ | 149°09′20.54″ | -- | -- | 49 | -- | ||
Note: For even number of each population purpose, 56 out of 167 seedlings were extracted at random in Isaacs Ridge population for genotyping; only 49 seedlings were sampled in Mt. Ainslie population for comparison of genetic diversity index of the four populations.
Table 2.
Microsatellite loci used for PCR amplification in samples of A. verticillata.
| Locus | Repeat Motif | Primer Sequences (5′-3′) | Fluorescent Dye | Expected Product Size Range (bp) | GenBank Accession Number |
|---|---|---|---|---|---|
| EST-C15 | (AG)13 | F: CTTCGCCGTTTCCTCAGA | Vic | 170–220 | FQ365696 |
| R: ATATTTGCTTCGCAGGTCA | |||||
| EST-C20 | (TC)9 | F: ACACGCCCTGTGATAGTT | Fam | 240–305 | FQ376339 |
| R: GAGGAATTGAGCTTGCTG | |||||
| EST-C26 | (AG)8 | F:ACTGTCGGATCGAGAAGCC R:AGCCAGCCATTGAAGCCC | Pet | 193–264 | FQ326101 |
| EST-C27 | (CTC)8 | F:TTGACACTCTGGGCGGAAG R:AGCATTGATGAGAAACGCTGG | Pet | 190–250 | FQ327961 |
| EST-C31 | (CT)9 | F:GCCTCCCACATCACAGGAG R:TCGGAAAGGCAACCGGAAG | Ned | 170–195 | FQ363031 |
| EST-C36 | (AG)6 | F:TGCTTGGACGGGTGGAAAG R:GAGGCAACTGGGAACAGC | Fam | 190–260 | FQ326412 |
| EST-C41 | (CT)6 | F:GTCAGATGCTGGCGTTTGG R:CCACAGTCCCGATGAAAGC | Vic | 344–391 | FQ328541 |
| Ge-AV43 | (GAA)8 | F: TGGAGCCGCACTCAA R: AATCTTCCGAAATAGGTCCC | Pet | 165–183 | FJ589775 |
| Ge-AV44 | (TCT)6 | F: CCAGGGACAAAATTAGGAACC R: CAGAGACCAAATACAAGAGCG | Ned | 153–195 | FJ589776 |
| Ge-AV46 | (GA)12 | F: CATTTGGATTAGACGCCTGC R: AAAGCGGGTGGATTGTCA | Ned | 296–338 | FJ589778 |
| Ge-AV47 | (TC)12 | F: TTGAGTTGGGCCGTCTGG R: TTAGATCAGAGCCGGATGGA | Vic | 161–184 | FJ589779 |
| Ge-AV48 | (CT)17 | F: AAAGAGGTTTATAGTGCTCG R: GGCCTTGAAGTCAATCC | Fam | 141–186 | FJ589780 |
Note: the first seven loci are EST (express sequence tag)-derived markers, and the latter five loci are genomic-derived markers (Broadhurst, 2011).
Table 3.
Population size, density, sex proportion, seed numbers per cone, viable seed percentage and clonality of A. verticillata populations.
Table 3.
Population size, density, sex proportion, seed numbers per cone, viable seed percentage and clonality of A. verticillata populations.
| Population | Pop. Size | Pop. Density (Individual/ha) | Sex Proportion (Male/Female) | Seed Numberper Cone | Viable Seed (%) | No. of Pairwise Clonal Individuals |
|---|---|---|---|---|---|---|
| Cooleman Ridge | 175 | 1450 | 1.00 (45/45) * | 86.37 ± 32.72 ab | 66.67 ± 9.81b | 3 |
| Mt. Painter | 107 | 177 | 1.53 (26/17) | 88.76 ± 21.97 ab | 36.00 ± 9.00 c | 8 |
| Isaacs Ridge | 193 | 3628 | 1.89 (17/9) | 81.23 ± 20.62bc | 32.33 ± 6.43 c | 12 |
| Mt. Ainslie | -- | -- | -- | 94.43 ± 21.63 a | 78.67 ± 9.07 a | -- |
Note: *, only one monoecious individual was found (at Cooleman Ridge) across all the four populations; Population size, density and sex proportion were not measured at Mt. Ainslie because only seedlings were sampled there; For seed numbers per cone and viable seed percentage, values followed by the same letter are not significantly different according to Duncan’s multiple range test (p < 0.05).
Table 4.
Genetic diversity indices of seedlings in four populations of A. verticillata.
| Population | N | Na | Ne | I | Ho | He | Pa | AR | FIS |
|---|---|---|---|---|---|---|---|---|---|
| Cooleman Ridge | 55 | 87 | 41.55 | 1.27 | 0.38 | 0.57 | 10 | 6.48 | 0.38 |
| Mt. Painter | 55 | 67 | 31.65 | 0.99 | 0.28 | 0.48 | 4 | 4.39 | 0.43 |
| Isaacs Ridge | 56 | 98 | 41.98 | 1.33 | 0.41 | 0.59 | 22 | 6.89 | 0.36 |
| Mt. Ainslie | 49 | 110 | 46.25 | 1.42 | 0.42 | 0.62 | 33 | 7.38 | 0.29 |
| Overall/Mean | 215 | 90.5 | 40.35 | 1.25 | 0.37 | 0.57 | 17.25 | 6.29 | 0.36 |
N, number of samples of each population; Na, mean number of alleles per population; Ne, mean number of effective alleles per population; I, Shannon index; Ho, observed heterozygosity; He, mean expected heterozygosity; Pa, number of private alleles in a single population; AR, allelic richness; FIS, inbreeding coefficient.
Table 5.
Number of offspring attributable to different female parents and the distances between mother trees and seedlings.
Table 5.
Number of offspring attributable to different female parents and the distances between mother trees and seedlings.
| Cooleman Ridge (44 Potential Mothers, 88 Offspring) | Mt. Painter (22 Potential Mothers, 55 Offspring) | ||||
|---|---|---|---|---|---|
| Female Parent | No. of Offspring | Dispersal Distance (m) | Female Parent | No. of Offspring | Dispersal Distance (m) |
| 725 | 1 | 120 m | 899 | 3 | 136–149 m |
| 733 | 4 | 18–30 m | 900 | 5 | 149–165 m |
| 734 | 8 | 15–58 m | 901 | 1 | 149 m |
| 735 | 2 | 23–63 m | 902 | 6 | 2–157 m |
| 737 | 2 | 6–45 m | 908 | 6 | 60–64 m |
| 741 | 2 | 27–32 m | 913 | 10 | 48–67 m |
| 742 | 3 | 27–33 m | 914 | 1 | 52 m |
| 743 | 6 | 24–39 m | 921 | 6 | 8–51 m |
| 746 | 1 | 9 m | 923 | 3 | 51–60 m |
| 748 | 3 | 6–131 m | 926 | 3 | 22–38 m |
| 749 | 5 | 12–54 m | 927 | 6 | 7–35 m |
| 750 | 10 | 13–46 m | 928 | 4 | 12–13 m |
| 753 | 2 | 17–18 m | 930 | 3 | 5–6 m |
| 762 | 1 | 7 m | 933 | 4 | 6–55 m |
| 772 | 1 | 62 m | 937 | 11 | 6–51 m |
| 779 | 1 | 176 m | 938 | 5 | 3–28 m |
| 782 | 7 | 14–51 m | 942 | 7 | 15–21 m |
| 783 | 1 | 43 m | 944 | 10 | 7–43 m |
| 784 | 2 | 172–173 m | |||
| 785 | 3 | 171–173 m | |||
| 786 | 3 | 48–175 m | |||
| 788 | 1 | 42 m | |||
| 791 | 3 | 24–33 m | |||
| 797 | 1 | 92 m | |||
| 798 | 1 | 115 m | |||
| 806 | 3 | 119–228 m | |||
| 810 | 4 | 1–129 m | |||
| 811 | 1 | 117 m | |||
| 815 | 6 | 13–131 m | |||
| Mothers with ≥1 offspring | 29 | 18 | |||
| Mothers with no offspring | 15 | 4 | |||
| Offspring with determinate mothers | 64 | 22 | |||
| Offspring with indeterminate mothers | 24 | 33 | |||
| Offspring not closely related to any adult male or female | 1 | 0 | |||
Table 6.
Pairwise population matrix of genetic differentiation FST values (upper right corner) and pairwise estimates of gene flow Nm (lower left corner) among the four populations.
Table 6.
Pairwise population matrix of genetic differentiation FST values (upper right corner) and pairwise estimates of gene flow Nm (lower left corner) among the four populations.
| Population | Cooleman Ridge | Mt. Painter | Isaacs Ridge | Mt. Ainslie |
|---|---|---|---|---|
| Cooleman Ridge | 0.083 | 0.062 | 0.065 | |
| Mt. Painter | 1.736 | 0.122 | 0.165 | |
| Isaacs Ridge | 3.311 | 1.702 | 0.057 | |
| Mt. Ainslie | 2.652 | 1.336 | 4.378 |
Table 7.
Results of Analysis of Molecular Variance.
| Source | df | SS | MS | Est. Var. | % |
|---|---|---|---|---|---|
| Among Populationss | 3 | 3,926,803 | 1,308,934 | 9949 | 8% |
| Among Individuals | 212 | 49,935,452 | 235,545 | 117,669 | 92% |
| Within Individuals | 216 | 44,635 | 207 | 2071 | |
| Total | 431 | 53,906,889 | 127,824 | 100% |
Publisher’s Note: MDPI stays neutral with regard to jurisdictional claims in published maps and institutional affiliations. |
© 2022 by the authors. Licensee MDPI, Basel, Switzerland. This article is an open access article distributed under the terms and conditions of the Creative Commons Attribution (CC BY) license (https://creativecommons.org/licenses/by/4.0/).
Share and Cite
MDPI and ACS Style
Zhang, Y.; England, N.; Broadhurst, L.; Li, L.; Zhong, C.; Bush, D. Gene Flow and Recruitment Patterns among Disjunct Populations of Allocasuarina verticillata (Lam.) L.A.S. Johnson. Forests 2022, 13, 1152. https://doi.org/10.3390/f13071152
AMA Style
Zhang Y, England N, Broadhurst L, Li L, Zhong C, Bush D. Gene Flow and Recruitment Patterns among Disjunct Populations of Allocasuarina verticillata (Lam.) L.A.S. Johnson. Forests. 2022; 13(7):1152. https://doi.org/10.3390/f13071152
Chicago/Turabian StyleZhang, Yong, Nigel England, Linda Broadhurst, Lan Li, Chonglu Zhong, and David Bush. 2022. "Gene Flow and Recruitment Patterns among Disjunct Populations of Allocasuarina verticillata (Lam.) L.A.S. Johnson" Forests 13, no. 7: 1152. https://doi.org/10.3390/f13071152
Note that from the first issue of 2016, this journal uses article numbers instead of page numbers. See further details here.