
Effects of Urbanization on the Dynamics and Equity of Access to Urban Parks from 2000 to 2015 in Beijing, China

The Key Laboratory for Silviculture and Conservation of Ministry of Education, Key Laboratory for Silviculture and Forest Ecosystem of State Forestry and Grassland Administration, Research Center for Urban Forestry, Beijing Forestry University, Beijing 100083, China
*
Author to whom correspondence should be addressed.
Forests 2021, 12(12), 1796; https://doi.org/10.3390/f12121796
Submission received: 8 November 2021
/
Revised: 29 November 2021
/
Accepted: 14 December 2021
/
Published: 17 December 2021
(This article belongs to the Section Urban Forestry)
Abstract
:Urban parks provide multiple ecosystem services as an important element of the urban space and improve human health and wellbeing. This study used the Gaussian-based 2SFCA method to evaluate the spatiotemporal distribution of and changes in park accessibility within the Sixth Ring Road in Beijing over 15 years. The study also used bivariate correlation analysis to analyze the relationship between urbanization factors and park access. The results showed that the overall park accessibility in both quantity and proximity had increased from 2000 to 2015, but there were still certain areas (percentage) that had limited access to parks. The inequity of distribution in park accessibility had been detected accompanying the rapid increase in park quantity in 2015. Furthermore, the development of urban parks mismatched that of urbanization in terms of urban land increase. The correlation between accessibility changes and population urbanization is not significant. Proper urban green space planning based on the distribution of population density and urban land use is indispensable in avoiding the aggravation of inequity in the process of urban expansion. This study contributes to the assessment of the current park allocation efficiency and helps urban planners and policymakers make prompt adjustments in the rapidly urbanizing process.
1. Introduction
Urban green spaces such as parks, street greenery, playgrounds, as well as those informal green spaces with spontaneous vegetation play an important role in improving the quality of life and wellbeing of urban residents [1,2]. As important components of the green space, urban parks provide multiple ecosystem services such as heat island mitigation [3,4], air pollution purification [5,6], noise reduction [7], etc. Urban parks could also provide a wide range of cultural ecosystem services for citizens, including leisure and recreation, aesthetic appreciation and education [8,9]. Urban parks have also been recognized as contributing to human wellbeing by creating positive impacts on physical and mental health [1,10,11,12,13,14,15]. As an essential part of green infrastructure, urban parks also offer various socioeconomic benefits [16,17,18]. However, urban land, especially land for green space development, has increasingly become limited with the acceleration of urbanization in cities with high-density populations. Thus, the mismatch between residents’ demand and the supply of green spaces might increase in metropolises and developing countries [19,20]. Therefore, the disparities in the distribution of urban parks and green spaces for residents have received increasing attention during the past two decades [21].
The equity of urban parks and green spaces or lack thereof has been widely reported in recent years with increasing attention on the social inclusion and equity contexts of urban greening, given that accessibility might influence whether urban residents can benefit from various ecosystem services provided by those green spaces during urban development or not [22]. Previous studies have found that areas with larger urban parks and green spaces or lower population density usually have higher accessibility [23,24]. The differences in accessibility of urban parks among different racial and socioeconomic groups might result from unequal political power and the corresponding disproportionate allocation of environmental amenities [25,26,27,28]. However, most previous studies have investigated park accessibility and inequity at a single time and longitudinal study on rapidly urbanizing cities is insufficient.
For China, the urban population is expected to reach 6.68 billion by 2050, accounting for 68% of the world’s population, and more than 255 million people from this population are predicted to become urban residents [29]. Therefore, the relationship between demand and supply of public green spaces is increasingly concerning [30]. The distribution of park and green spaces accessibility has been analyzed in many studies [31,32,33], and the effects of social and economic data on green space equity have been discussed [19,34,35,36]. Some literature has also touched upon accessibility dynamics and the effects of the rapid urbanization process, but few studies have been reported for megacities [20].
To enrich our understanding of the underlying processes of the inequity and facilitate the development of an inequity mitigation policy in large cities undergoing rapid urbanization, we took Beijing as a case study and used the Gaussian-based, two-step floating catchment area (2SFCA) method [37,38] to measure the park access level. Based on the accessibility in 2000, 2005, 2010 and 2015, we investigated the changes in the distribution of urban park accessibility and the relationship with population and urban land data at the sub-district level of Beijing. The aims of our research were: (1) to map the spatial distribution pattern and identify the disparity of urban park accessibility in Beijing; (2) to reveal the dynamics in urban park accessibility from 2000 to 2015; and (3) to examine how urbanization factors (in terms of both population density and urban land use), as well as policies related to urban green spaces, have led to change and equity in accessibility to urban parks.
2. Materials and Methods
2.1. Study Area
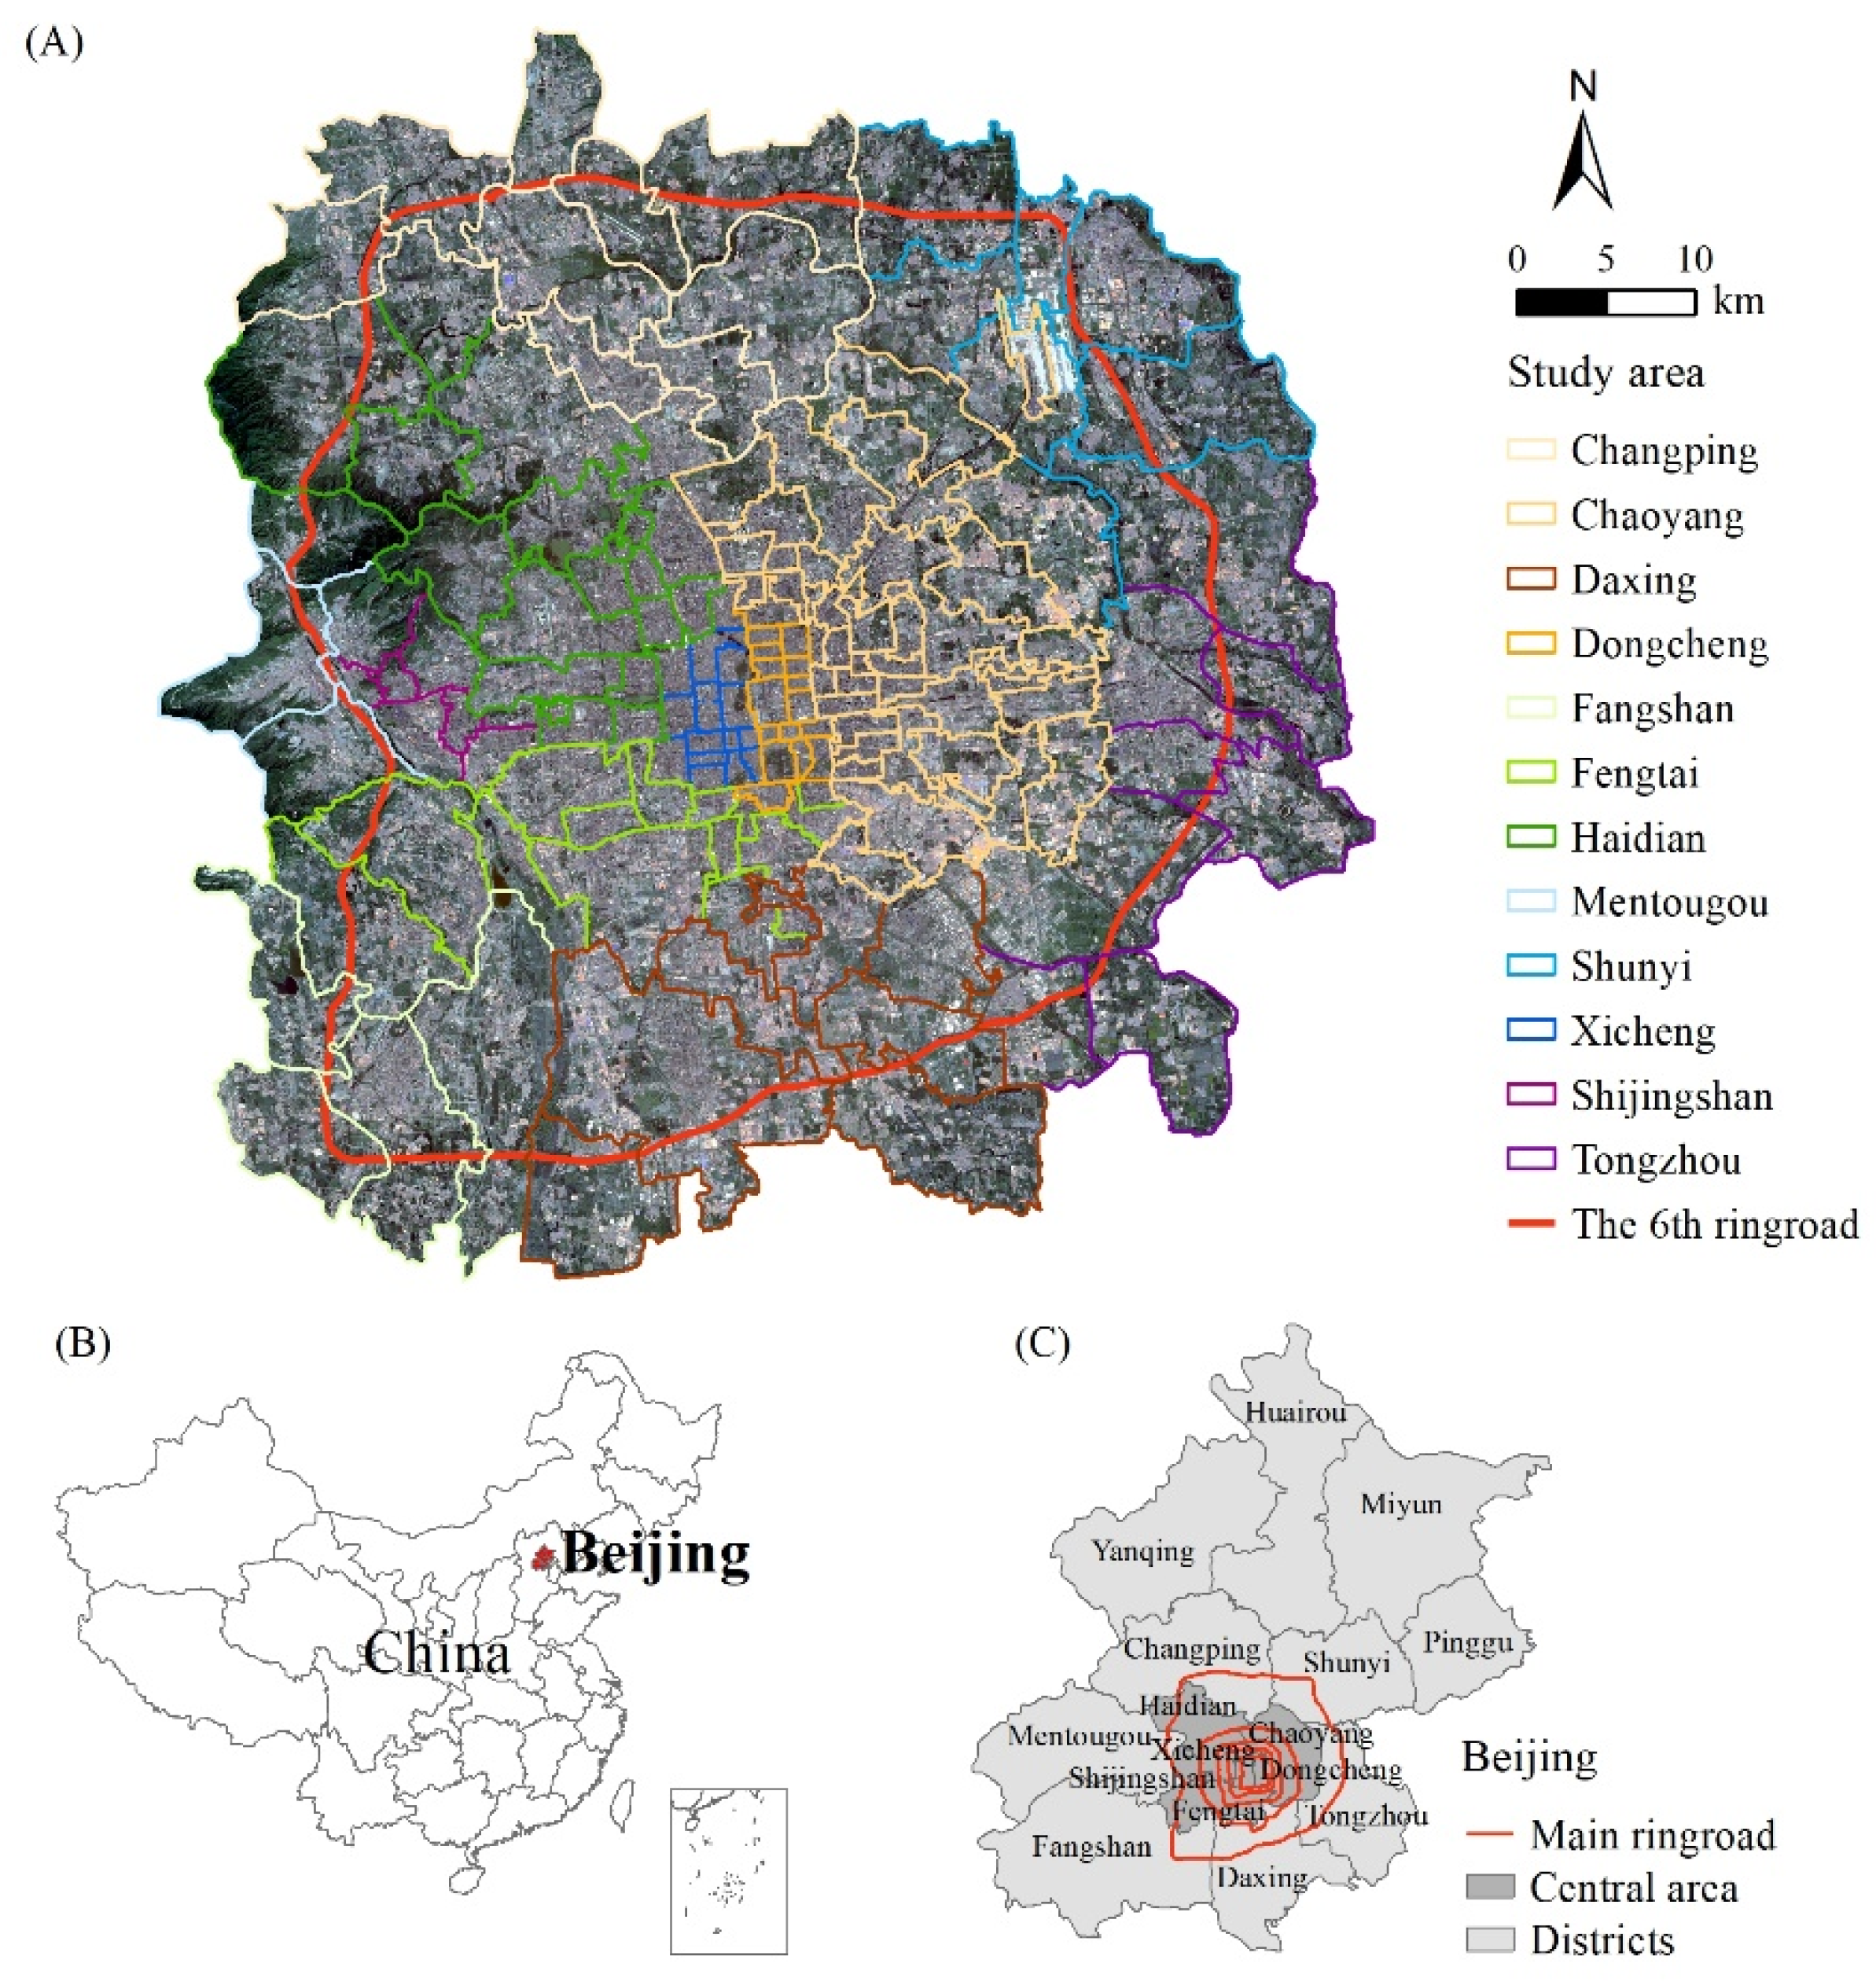
Beijing, located in the north of the North China Plain, is the capital city of China. The total area of Beijing city with its 16 municipal districts is 16,411 km2. Beijing has experienced rapid urbanization since the 1978 Reform and Opening-up Policy [39] and the average annual growth rate of urban land areas during the past four decades has been reported to be around 3.5% [40]. To improve the resilience of the urban ecosystem and the living quality of residents, Beijing government has designed policies and strategies to construct, restore and conserve parks and green spaces in Beijing. Particularly, a series of initiatives has been carried out to increase the provision of urban parks and the famous Beijing Olympic Forest Park in Chaoyang District, constructed in 2008, has been the largest urban greening landscape in Asia. According to the Beijing Statistical Yearbook, the green park area of Beijing had reached 35.2 ha by the end of 2019, and the park area was 16.4 m2 per capita [41]. Our study is focused on the main urbanized area which is within the Sixth Ring Road and includes 12 administrative districts and numerous sub-districts (Figure 1). The study area was approximately 2267 km2 and held about 12.2 million permanent residents in 2000 and about 13.9 million in 2015.
2.2. Data Sources
We used multiple data sources to explore the accessibility dynamics and driving factors. Our population data at the sub-district level in 2000 and 2010 were extracted from the Sixth National Population Census of China. The demographic data of 2005 and 2015 were calculated according to the annual growth rate of the population at each sub-district from 2000 to 2010 based on the exponential growth model. The exponential growth model, which is a typical model for population forecasting, is suitable for Beijing before 2015 when the urbanization rate was high and there were no considerable population policy changes [42]. The type of green space dataset might lead to substantial differences in identifying the green spaces availability [43]. In this study, we mainly refer to Google satellite aerial maps as they have rather high resolution and are easy to access, which could facilitate park availability assessment. The shapefile of the location and the boundary of the parks were created based on the Google satellite aerial maps (https://www.google.com/earth/, accessed on 12 March 2020), as well as the Baidu electronic maps (https://map.baidu.com/, accessed on 12 March 2020). Parks within a 1.5 km distance from the boundary of the study area were also included, considering the “edge effect”. Parks in 2000 were identified after checking the directory in Beijing Parks and Forestry Census Compilation, and those of 2005, 2010 and 2015 were identified based on the park directories in the Beijing Parks Yearbook and Beijing Parks and Forestry Yearbook. A total number of 81, 86, 88 and 173 parks within the study area have been identified in 2000, 2005, 2010 and 2015, respectively. We selected parks larger than 2 ha to quantify urban green space size in this study, according to the standard of the Accessible Natural Greenspace Standards (ANGSt) recommendation of 2 ha as the minimum size of accessible green space for each person [44]. The spatial resolution of urban land cover data is 30 m and this set of land use production was mainly extracted from Landsat satellite images by the Institute of Geographic Sciences and Natural Resources Research, Chinese Academy of Sciences.
2.3. Calculation and Mapping of Urban Park Accessibility
The urban park access dynamics were analyzed based on the presence of urban parks in this study and the accessibility of urban parks was evaluated from two major aspects: quantity and proximity characteristics. The quantity of the urban park describes the densities of park acreage within each sub-district [45], and was calculated using the following formula:
where the is the quantity of the urban park in the sub-district d, is the total area of the urban parks in sub-district d, and is the total area of sub-district d.
The proximity of urban parks was evaluated using the Gaussian-based two-step floating catchment area (2SFCA) method [37,38] at the sub-district level. The pioneering work was proposed as 2SFCA, which defined accessibility using a dichotomous measure [37]. The Gaussian-based 2SFCA differentiated access within the catchment to avoid the problem in the 2SFCA model, wherein it tends to give higher accessibility scores to areas with low accessibility [21]. The steps of the Gaussian-based 2SFCA are summarized as follows.
First, for each park location j, search all population locations k that are within a threshold from j, thus forming the catchment for park location j. Then, weigh populations at k using a Gaussian function (G), and sum up the populations within the catchment for j as the potential users for the park at j. The ratio () of the park j to the population is as follows:
where is the population at location k with its centroid in the catchment (i.e., ≤ ) from park location j; is the travel distance between population location k and park location j; is the capacity (i.e., size in acres) of park at j; G is the friction-of-distance written as:
Second, for each population location i, search all parks l within the threshold from i, thus forming the catchment for the population at i. Then, sum up discounted R using the Gaussian function (G) within the catchment area i to obtain the spatial accessibility at population location i:
where l represents all parks within the catchment of population location i. The accessibility score implies the number of parks per capita in a neighbourhood.
In this study, we chose the catchment threshold () of 2 km as the maximum distance. A survey conducted in Guangzhou found that a 20 min walking distance is a critical divide in determining whether the public would walk to urban green spaces [46]. Additionally, biking has become a widespread means of transportation due to the popularity of shared bikes in Beijing. Considering that the normal walking speed for the public is between 3.6 and 7.2 km/h, and biking speed is between 10 and 15 km/h, we decided that the maximum time is approximately 20 min walking or 10 min biking. Thus, the distance threshold of 2 km is adopted in the study. We did not calculate the distance via route system and adopted the static 2 km buffer zone since the urban roads within the study area went through changes at multiple levels from the government during the 15-year urban expansion process. Furthermore, a 2 km buffer distance covered approximately 97% of all residents in the study area, which avoided many zero values of accessibility in many census tracts. The travel distance from the origin to the destination was calculated as the Euclidean distance. Although network distance is more precise than Euclidean distance, the latter is simple to compute. In the previous study, a very strong correlation between Euclidean and network distances was found across the metropolitan area of Montreal [47]. Next, geographic centroids of parks and sub-districts were used to calculate the distance between the two locations. The reason for using geographic centroids is that although using the entrance of parks is considered more accurate when calculating the distance, the real entrances are often difficult to identify on the map, and some entrances are often inaccessible. Some studies have used geographic centroids for distance calculation previously [23,48].
3. Results
3.1. Changes in Scale and Spatial Distribution of Urban Parks from 2000–2015 in Beijing
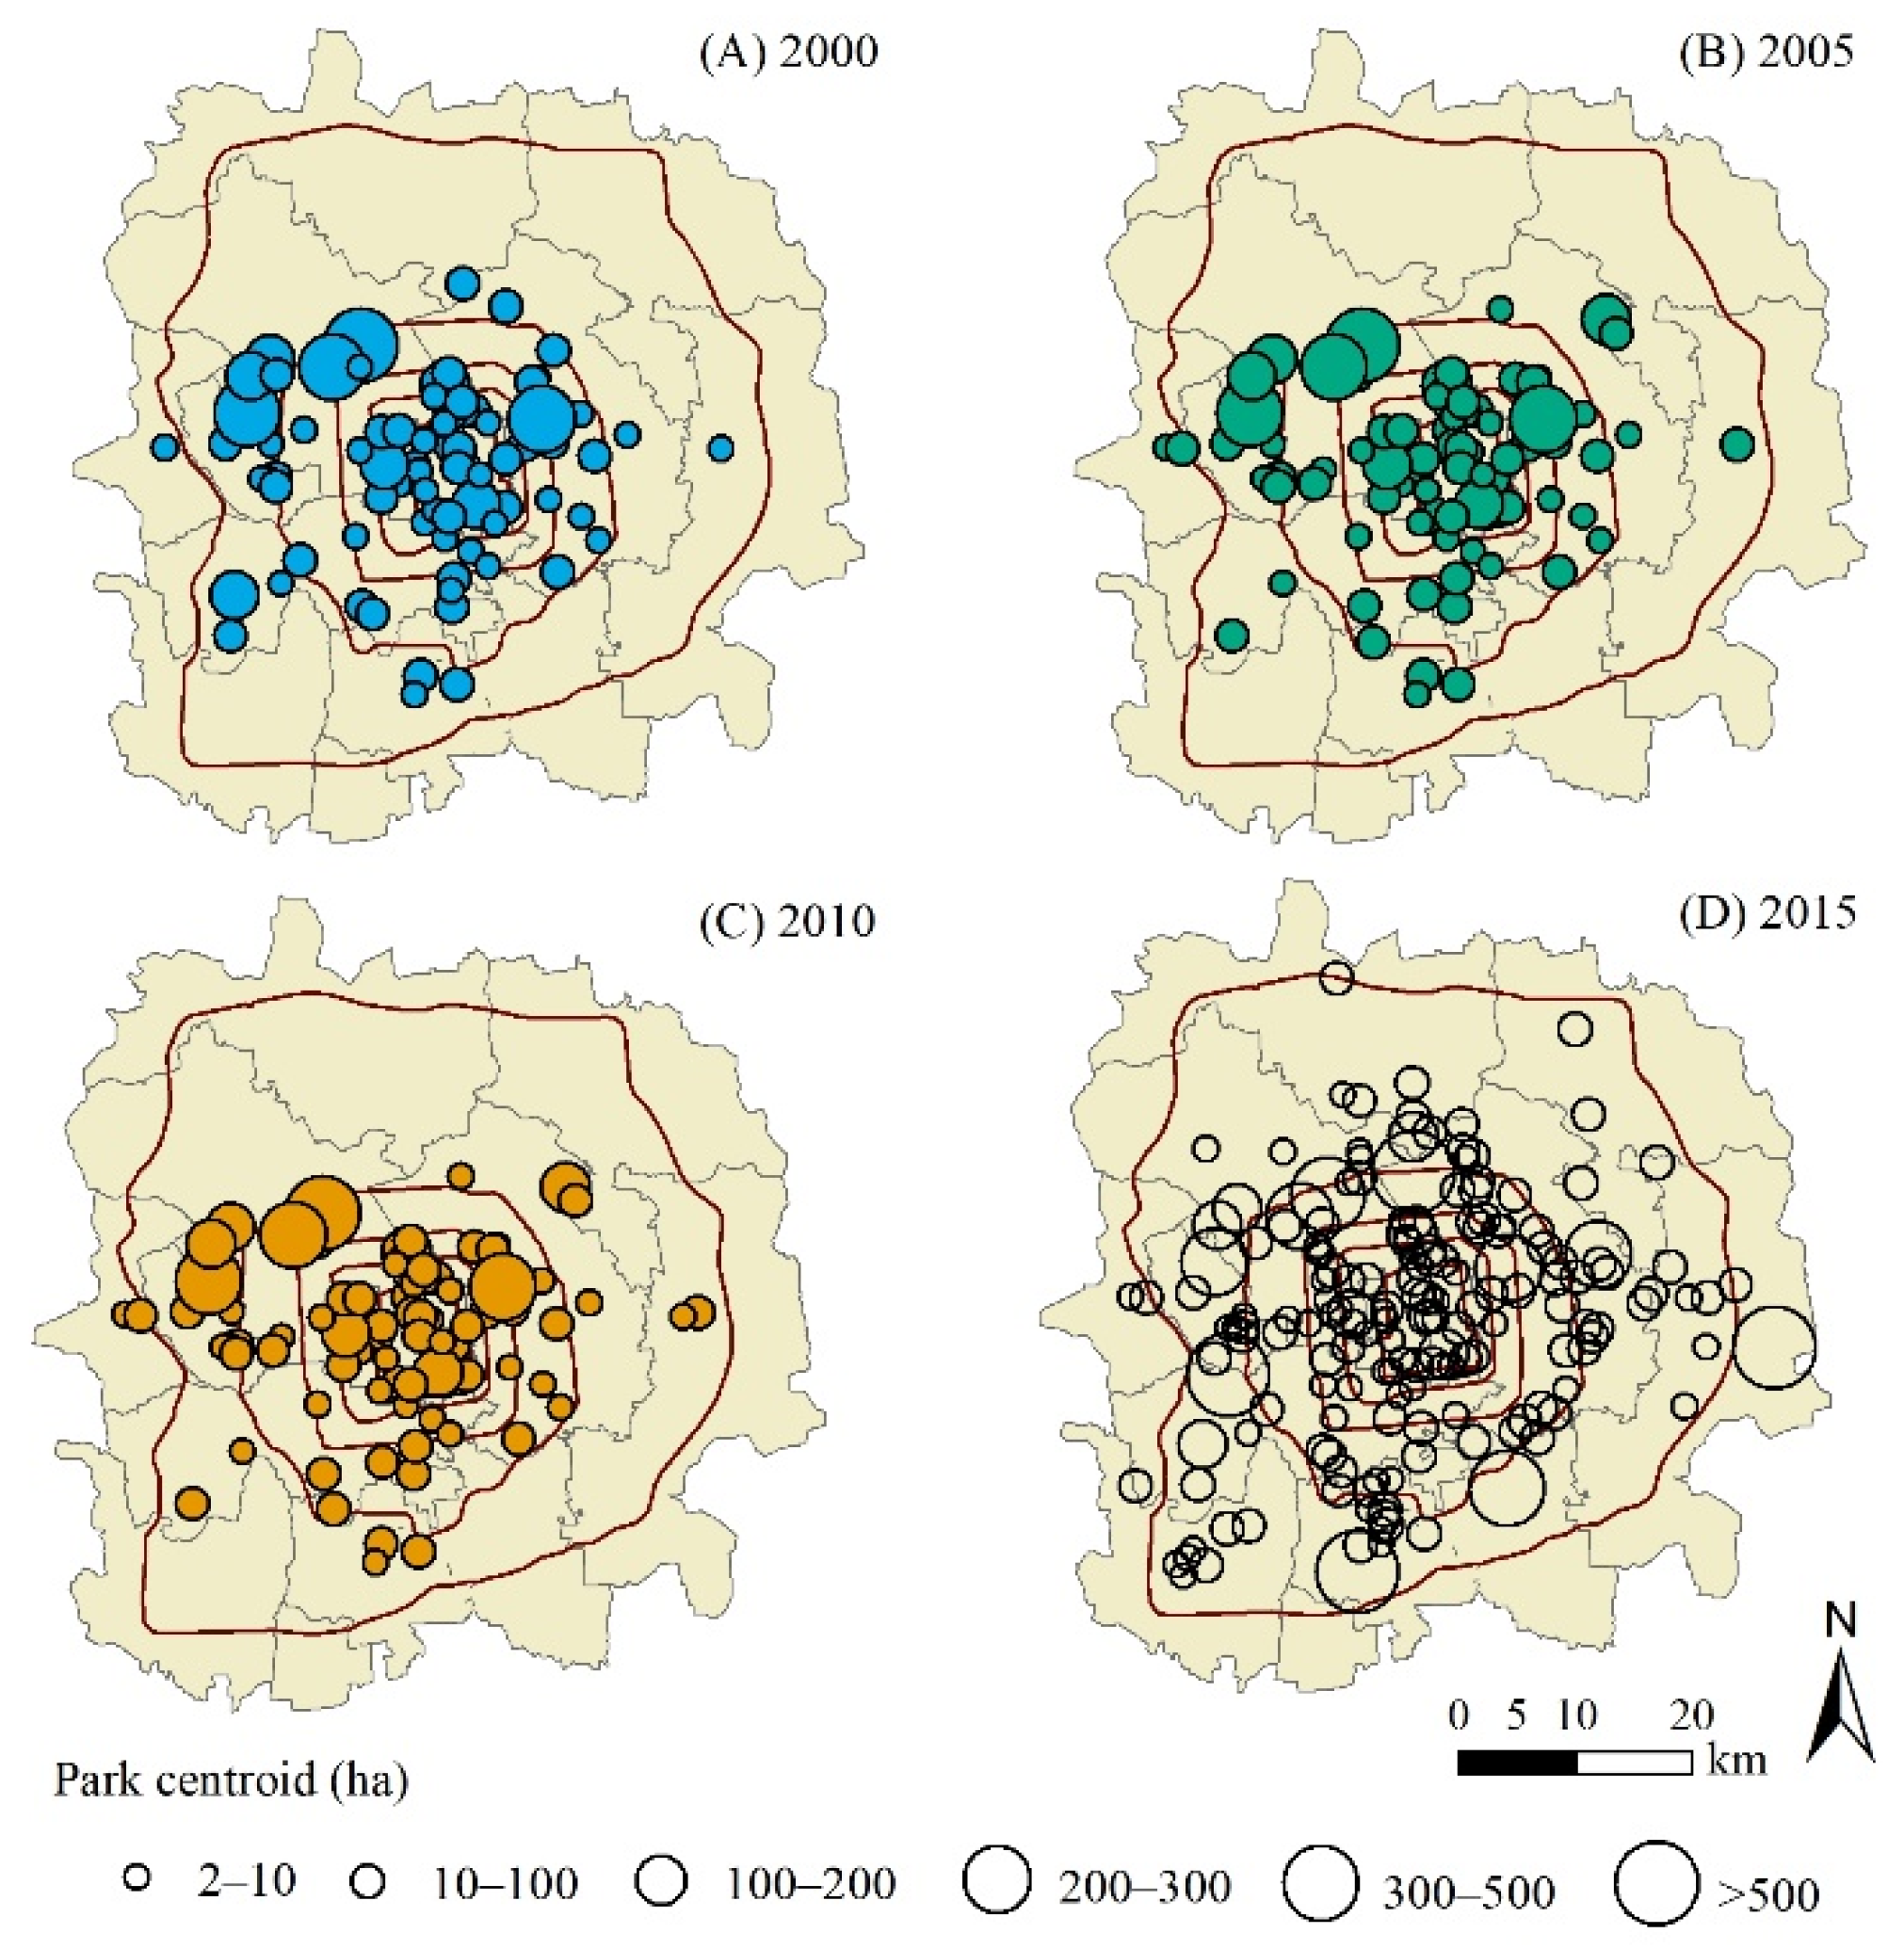
The parks were divided into six classes based on their sizes (ha). Table 1 shows the number of parks in different classes in four statistical years. From 2000 to 2010, most urban parks are within 100 ha. Figure 2 shows a higher density of parks in the center of the city; few parks are located near the north of the Sixth Ring Road.
The number of parks increased significantly from 2010 to 2015, but less change had occurred from 2000 to 2010. In the meantime, it was the speedy urbanization in Beijing and the initiation of country park development from 2008 in the isolation areas which included the first isolation area from the Fourth to the Fifth Ring Road and the second isolation area from the Fifth to the Sixth Ring Road. Newly established parks are mainly small and mid-sized ones, and over half of them are in Haidian and Chaoyang District. The park density in Haidian and Chaoyang District increased by 172.7% in 2010 to 120% in 2015, while parks in the central city including Dongcheng and Xicheng District have barely changed. Four large parks (over 500 ha) belonging to country parks were newly included in 2015, which are all close to the Fifth or Sixth Ring Road since the edge of the study area was relatively far from the city center, which could carry many large parks.
3.2. Distribution and Changes of Park Access in Quantity Characteristic
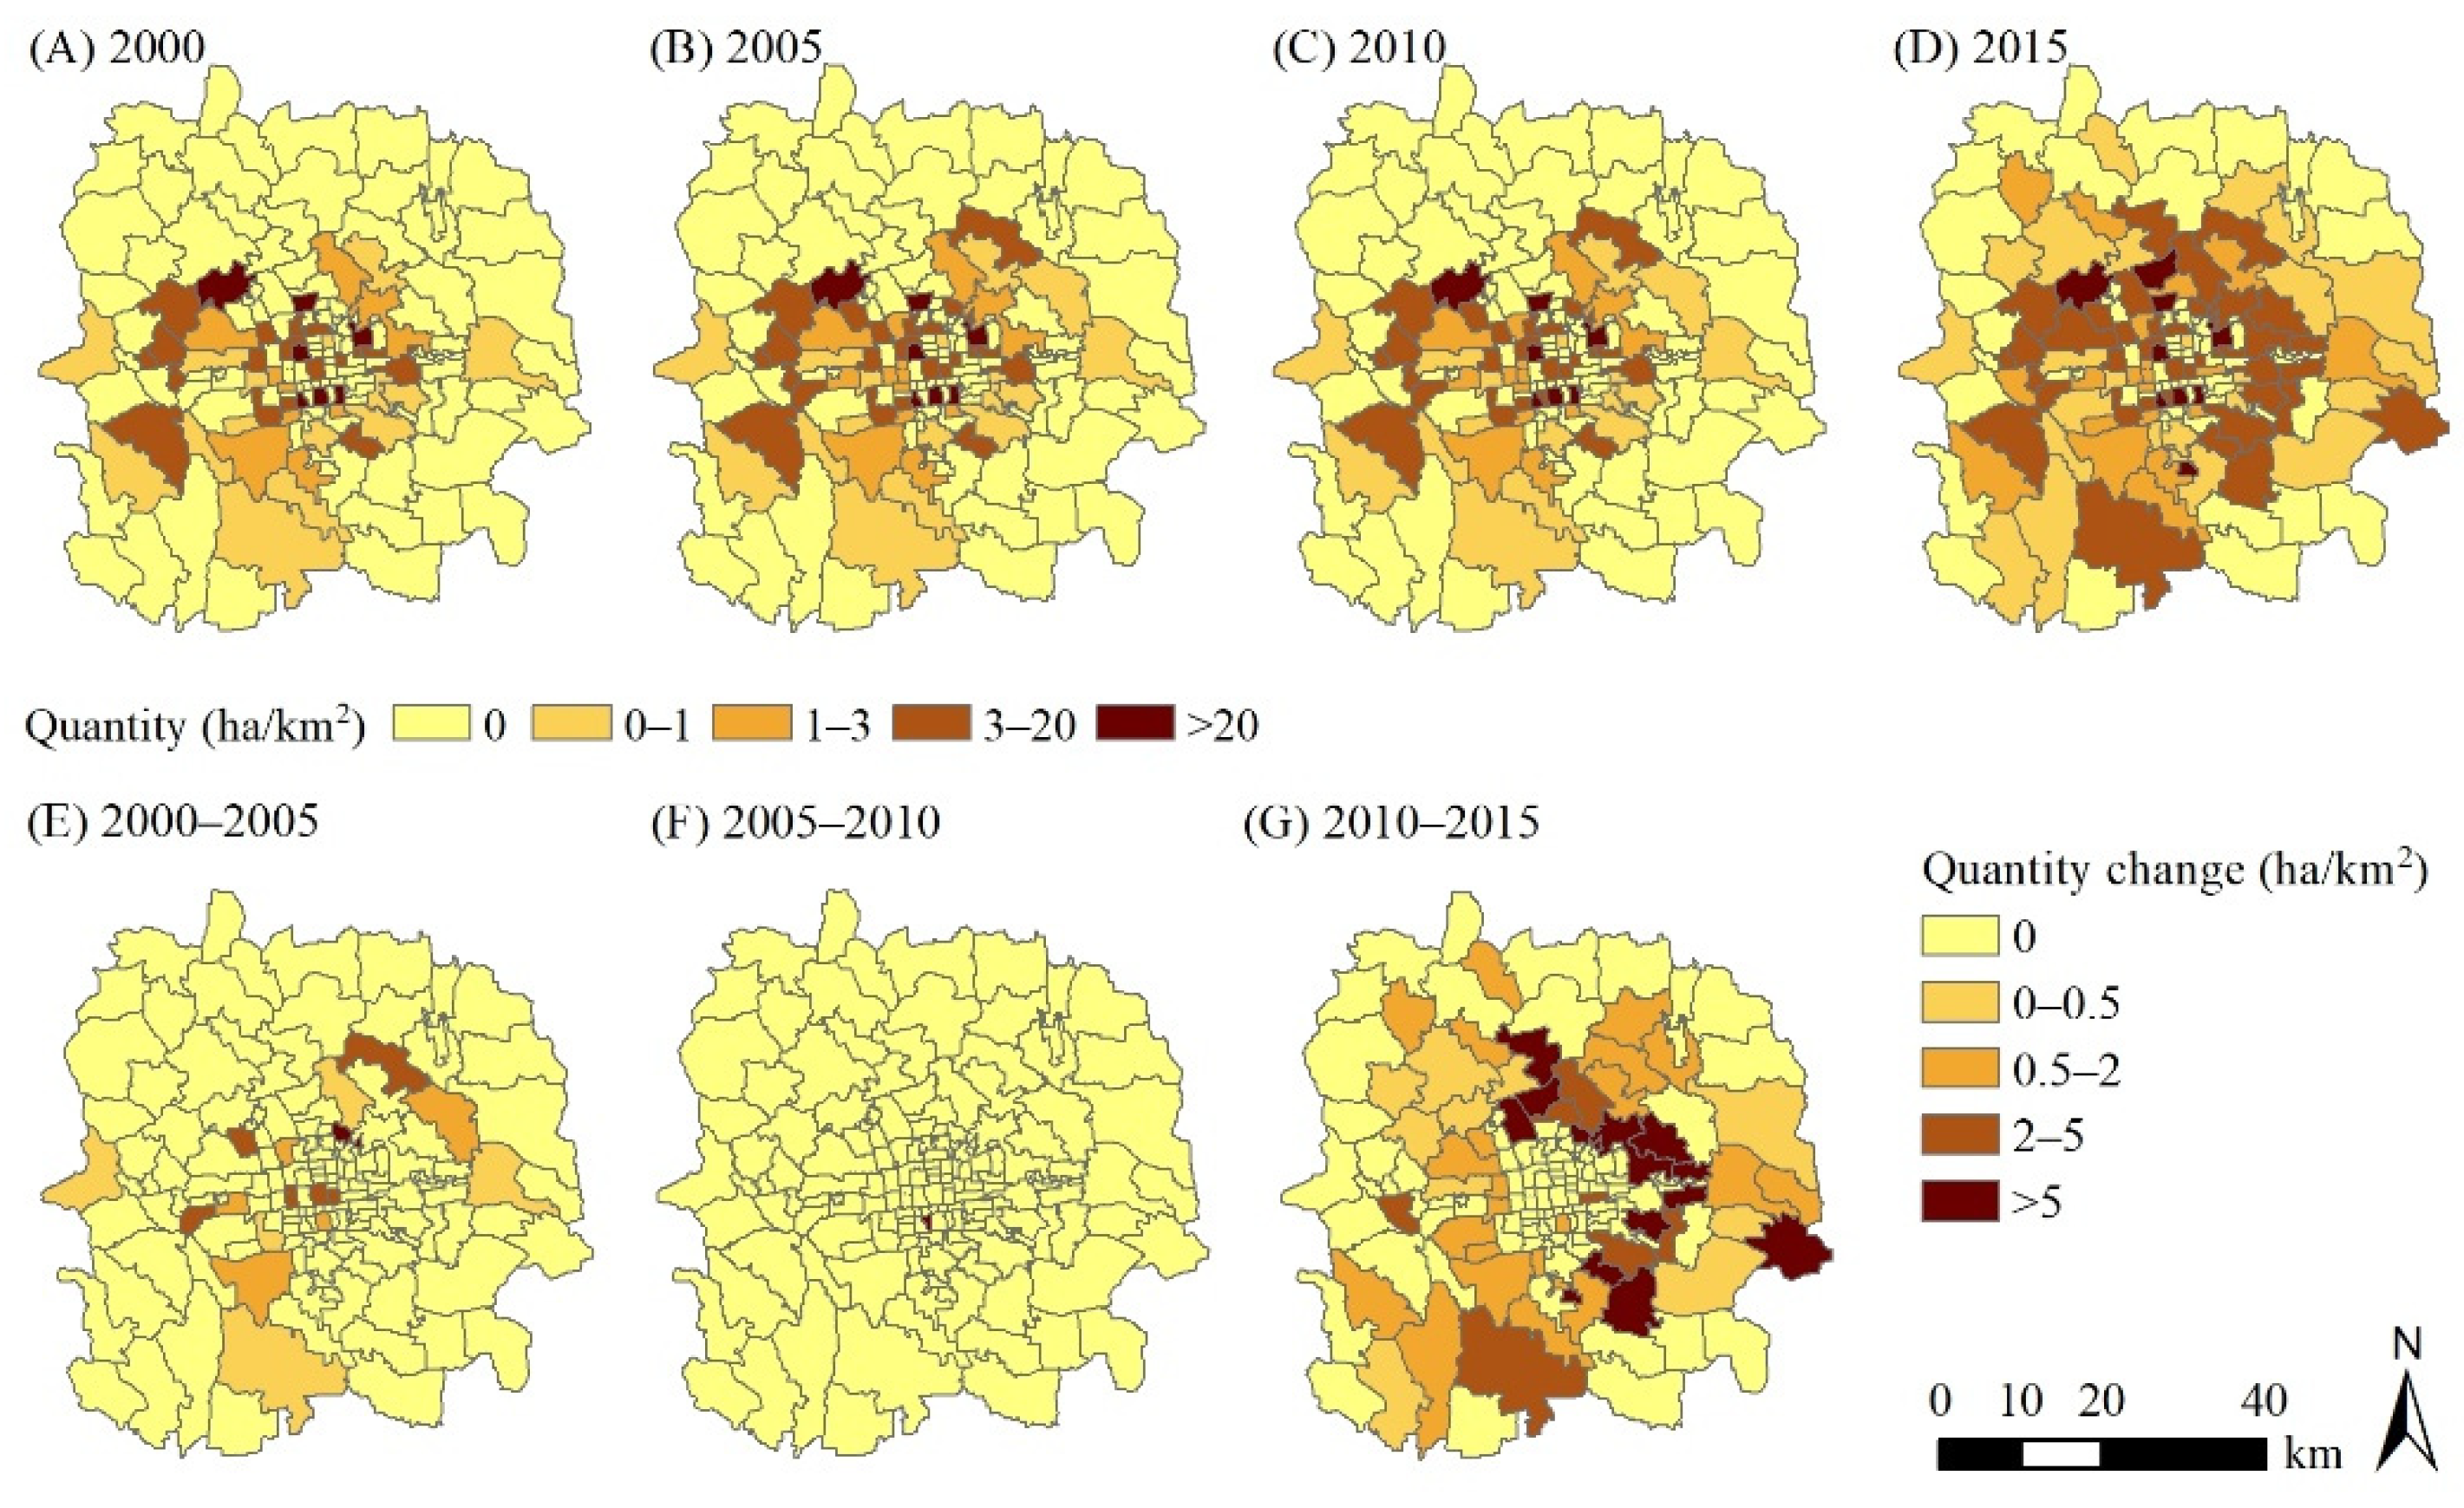
We first analyzed park accessibility using park quantity (ha/km2) characteristics. Limited accessibility seemed to be prevalent throughout the city in 2000 (Figure 3). Park access varied among sub-districts to a certain extent. In 2000, the central area of the city appeared to have a higher quantity than the outer city. Some sub-districts in the western parts of the city which were between the Fifth and Sixth Ring Roads had larger parks than the ones located at the same distance from the city center. A large number of sub-districts had poor or zero access to parks. In 2005, a few parks were newly built in the central, southern and northeastern parts of the city.
The overall pattern of the spatial distribution of park access varied slightly from 2000 to 2010. In 2015, the accessibility to parks in terms of park quantity increased dramatically. A great number of new parks were renovated, and most of them spread around the Fifth Ring Road and expanded outwards. Sub-districts in Haidian and Chaoyang Districts have experienced rapid growth in park quantity. Although park access in the city periphery had certain improvements in 2015, some sub-districts still have no parks over 2 ha.
3.3. Distribution and Changes in Park Access in Proximity Characteristic
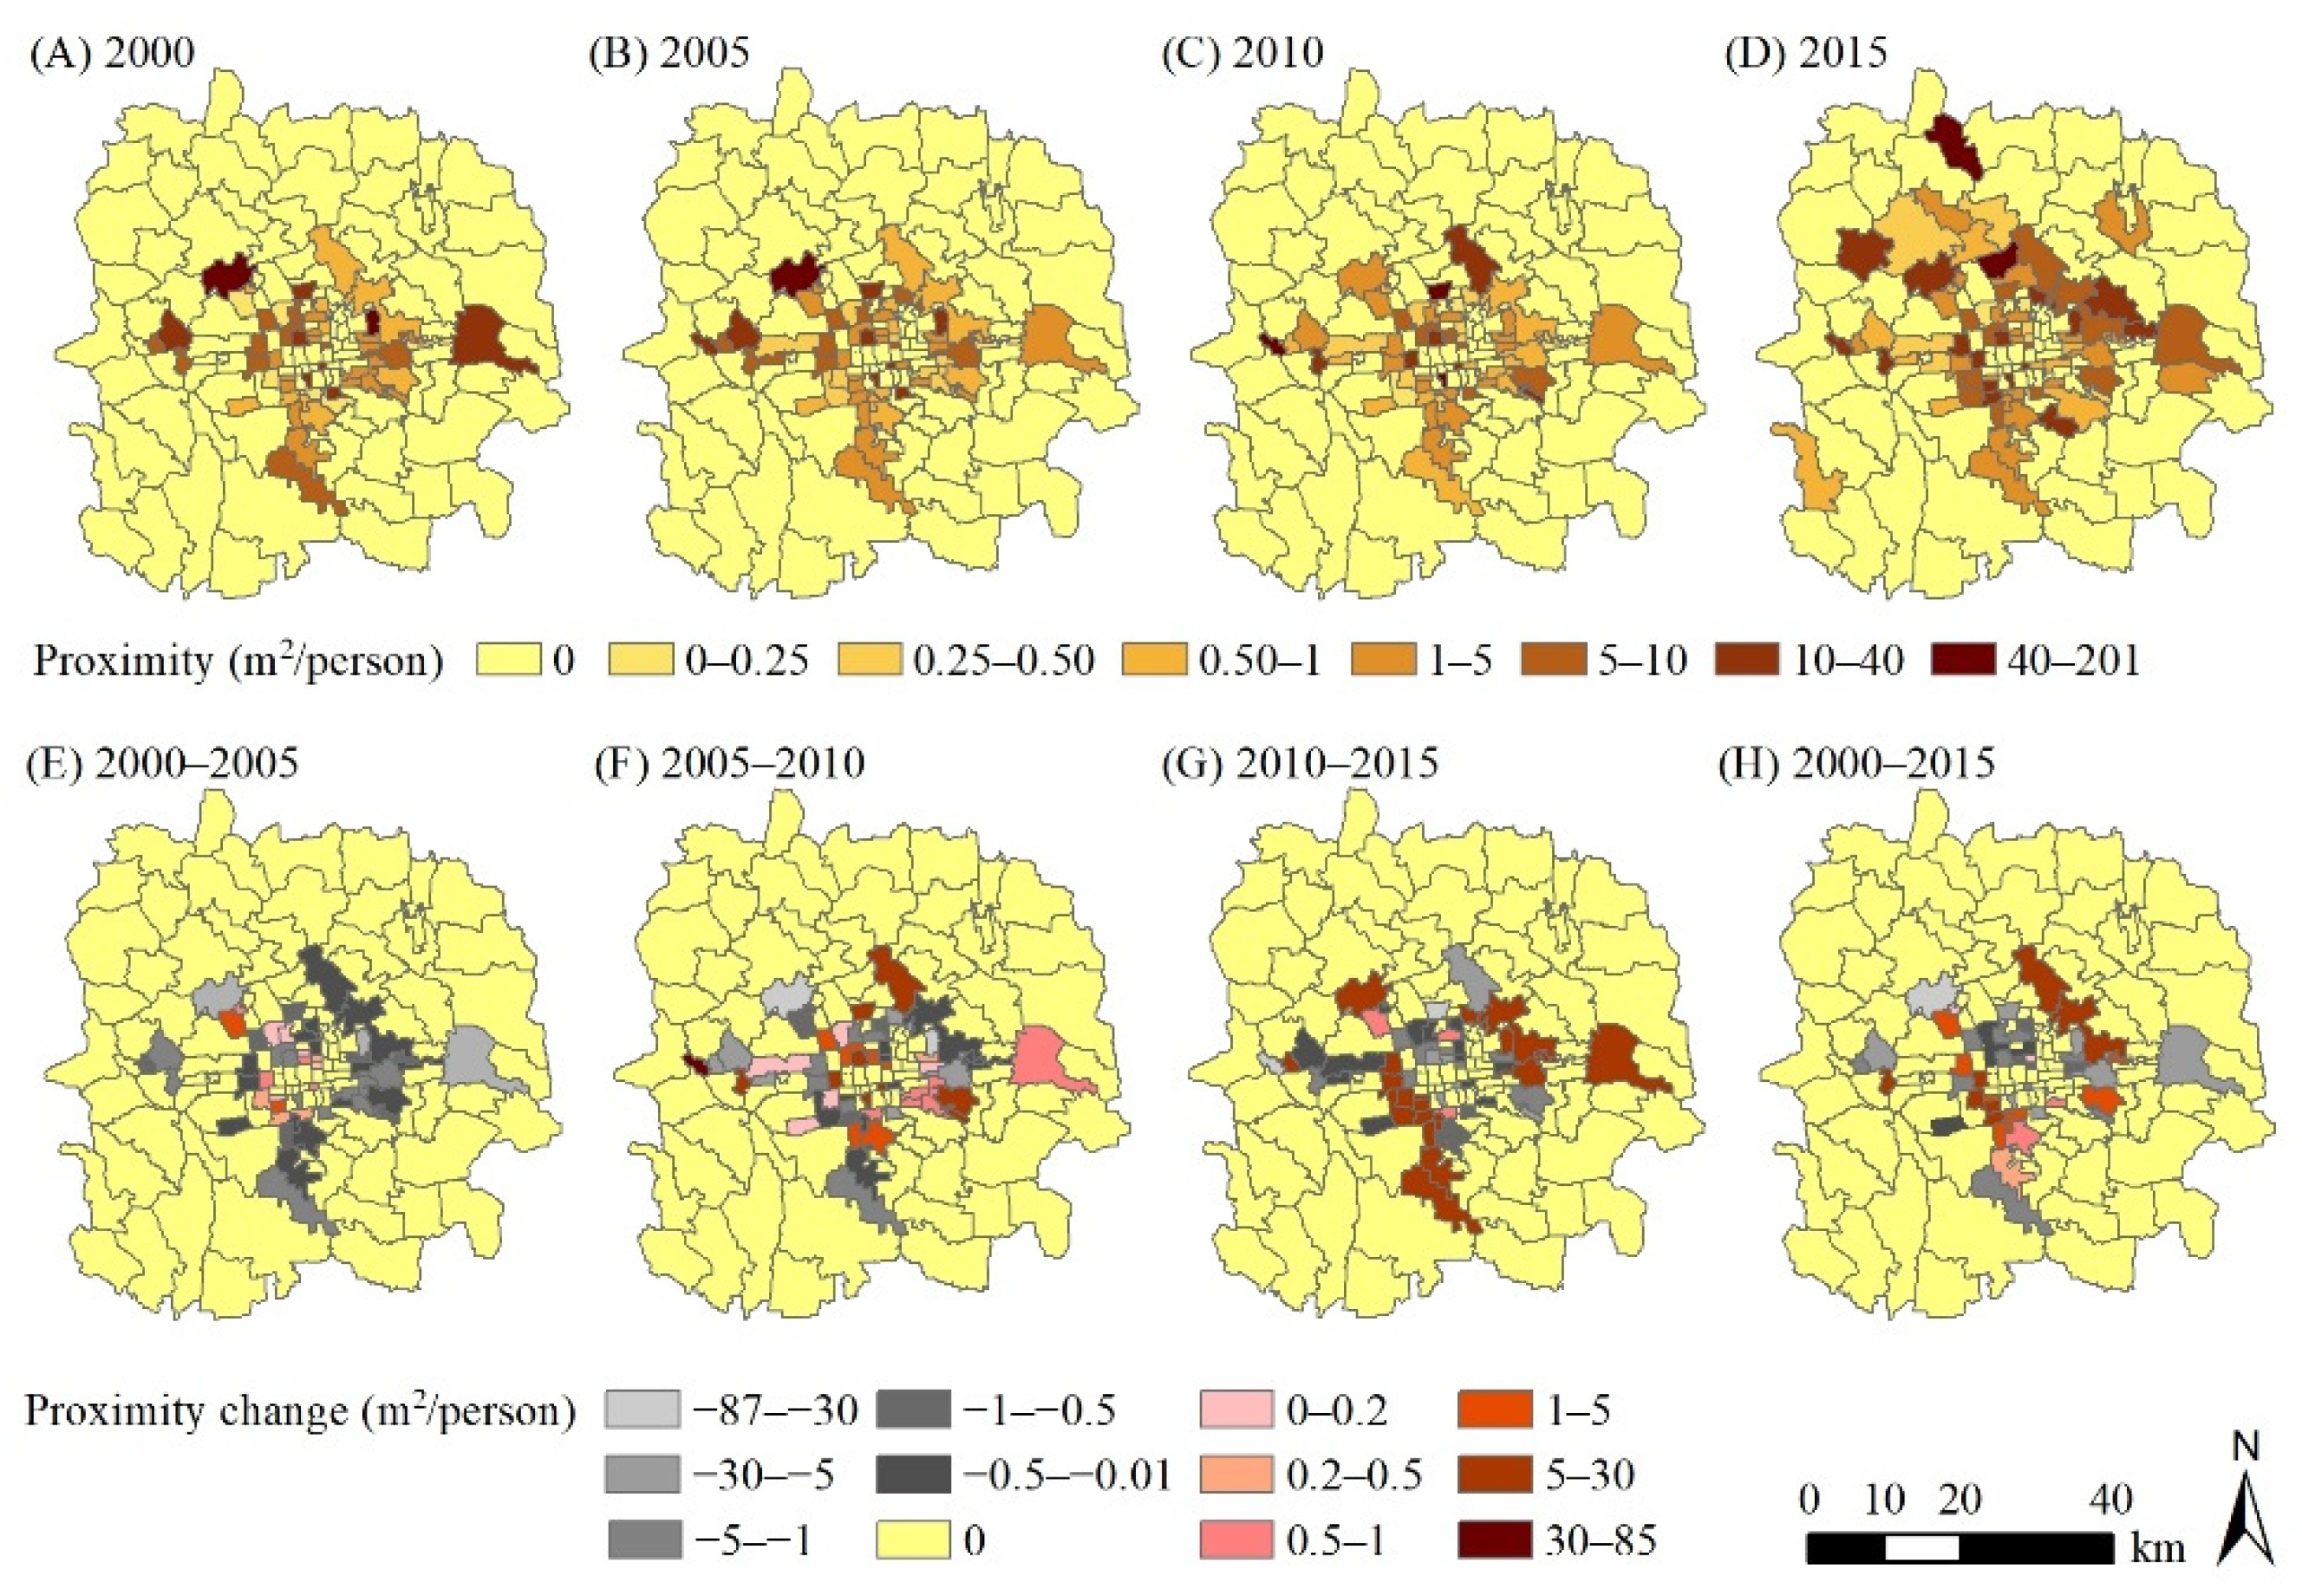
Figure 4 describes the distribution and changes in park access in proximity aspect from 2000 to 2015. From 2000 to 2010, sub-districts with a proximity over 0 mainly formed around the middle of the city, with higher accessibility in the southern areas than in the northern. Urban park accessibility significantly increased from 2010 to 2015, but the largest changes were found between the Fourth and Fifth Ring Road where the first isolated area greening project was implemented and was then followed by the country park ring development project. The situation improved significantly for 70 sub-districts with park access over 0 who gained low and moderate access in 2015. The accessibility of 18 sub-districts in Changping, Haidian and Chaoyang reached over 10 ha/km2 and two of them even reached more than 40 ha/km2 in individual areas.
As shown in Figure 4E–H, changes to park access in proximity suggested a more complex situation compared to the quantity characteristic. Overall, park access increased from 2000 to 2015 for the catchment of 2 km and the mean value of access increased from 7.58 m2 to 9.31 m2 per capita. However, changes to park accessibility in different areas varied in different periods. From 2000–2005, 70% of the sub-districts with park access experienced a loss of accessibility and most of them had a minor decrease of less than 3 m2 per capita while two sub-districts lost over 10 m2 per resident in proximity. The value of proximity in other sub-districts changed from 0.02 m2 to 2.09 m2 per resident because of rapid population growth and less increase in park access.
Changes in accessibility for sub-districts became more heterogeneous from 2005 to 2010. The number of sub-districts whose park access increased was the same as those who suffered from a decrease in park access. A sub-district in Shijingshan District benefitted from the great enhancement of park proximity for a 2 km catchment with an increase of over 80 m2 per capita. At the same time, a few sub-districts showed a great loss in park access, ranging from 24 m2 to 60 m2 per resident.
Third, some sub-districts in the southern and eastern parts of the city have witnessed a moderate increase in park access from 2010 to 2015. The number of parks increased along with the growth of population in these areas. However, there are some sub-districts experiencing a greater reduction in park proximity. For example, the accessibility of a sub-district in the Shijingshan District decreased by over 80 m2 per capita. Overall, the total decrease of accessibility exceeded the increase, and thus park accessibility demonstrated a decrease pattern in those five years.
Finally, the changes in park accessibility in the overall 15 years from 2000 to 2015 can be seen in Figure 4H. Over 70% of the sub-districts have a slight fluctuation in park access within 5 m2 per capita, sub-districts with an increase in park access were mainly located near and within the Fifth Ring Road, while sub-districts with a decrease of accessibility of parks were scattered from the inner to the outer city. Particularly, a sub-district in Haidian District suffered a loss of over 60 m2 per resident in park access during the studied 15 years.
It should be noted that some sub-districts still suffered from inaccessibility in the four statistical years. Except for the sub-districts with a reduced population which we did not include in the analysis, many sub-districts had no accessibility to parks over 2 ha for the 2 km catchment. About 40% of the sub-districts still had zero accessibility. Those areas were mainly located in the city periphery and were remote from those small or medium-sized parks in the central city.
3.4. Urbanization and Park Accessibility Changes
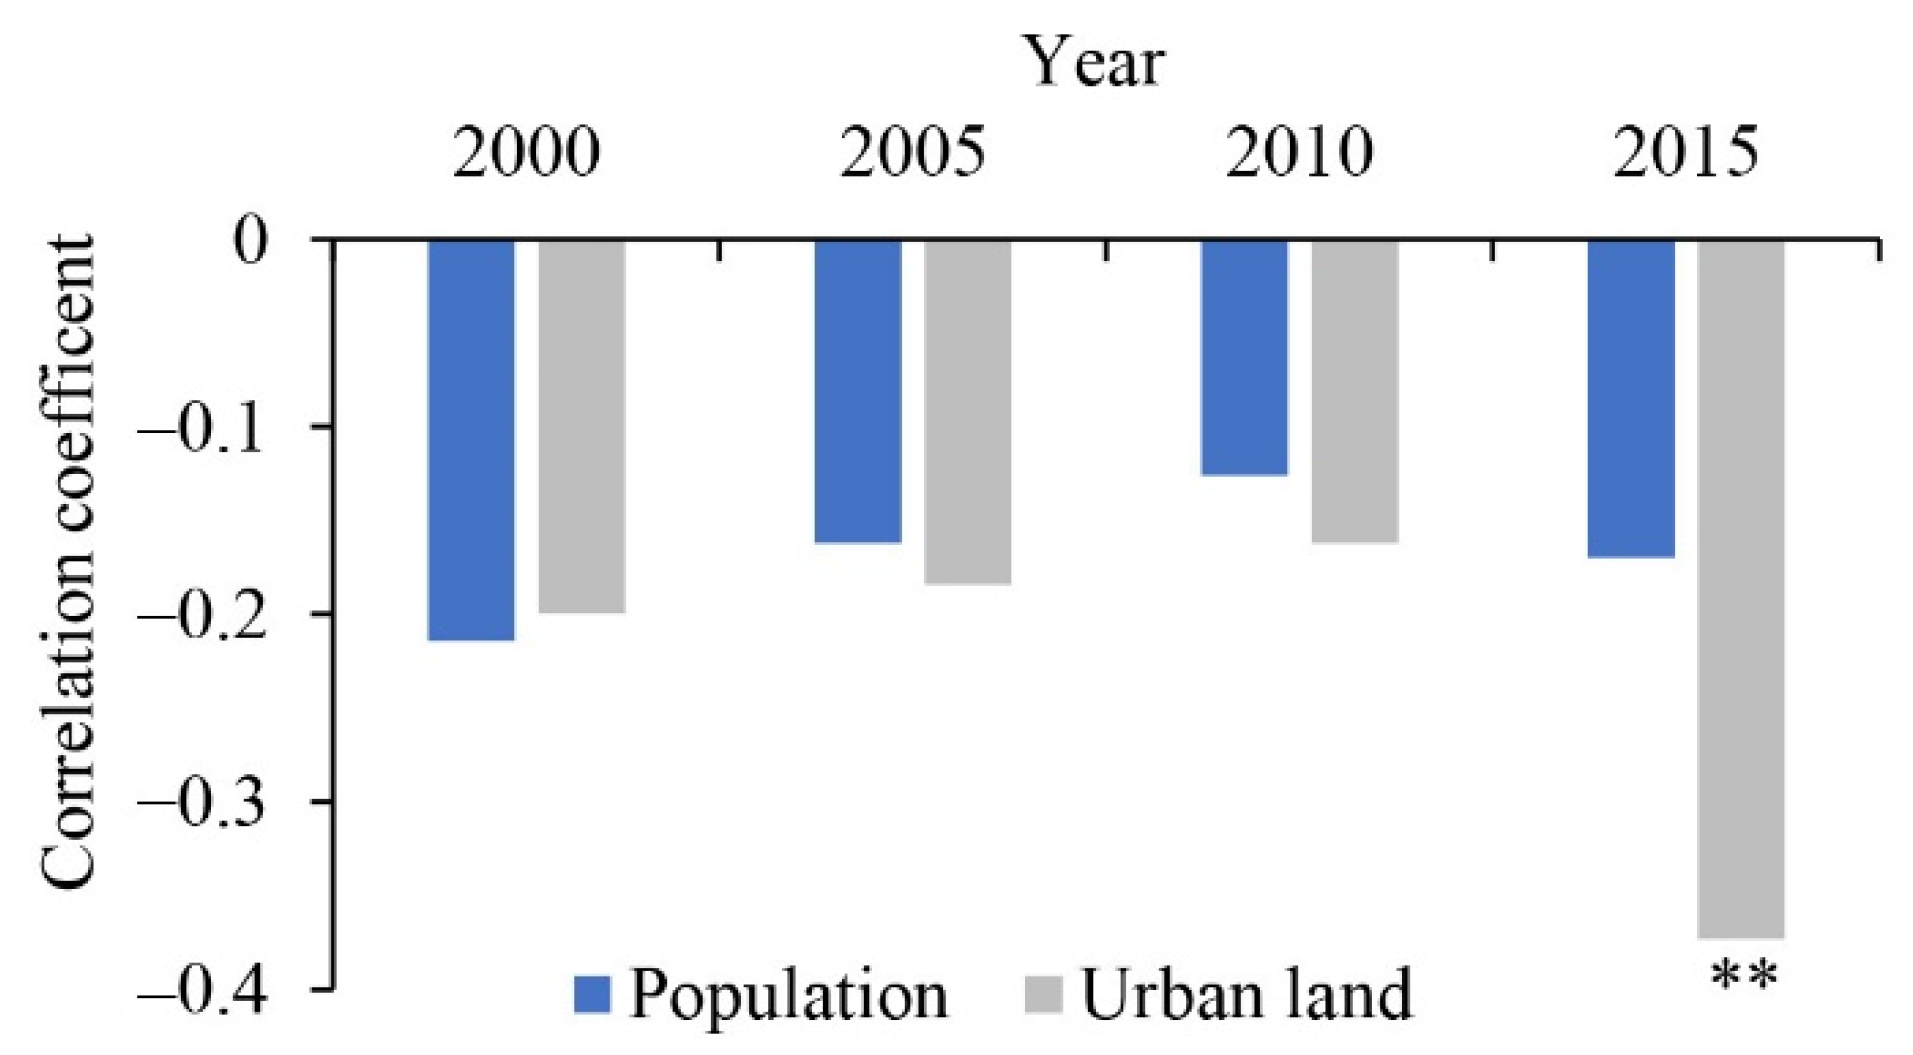
Park access was not significantly associated with the population density or urban land area in all of those three points of 2000, 2005 and 2010. However, it is noteworthy that although with the population density, the relationship showed no significance in 2015, the park access had a significant negative correlation with urban land area in 2015 (Figure 5).
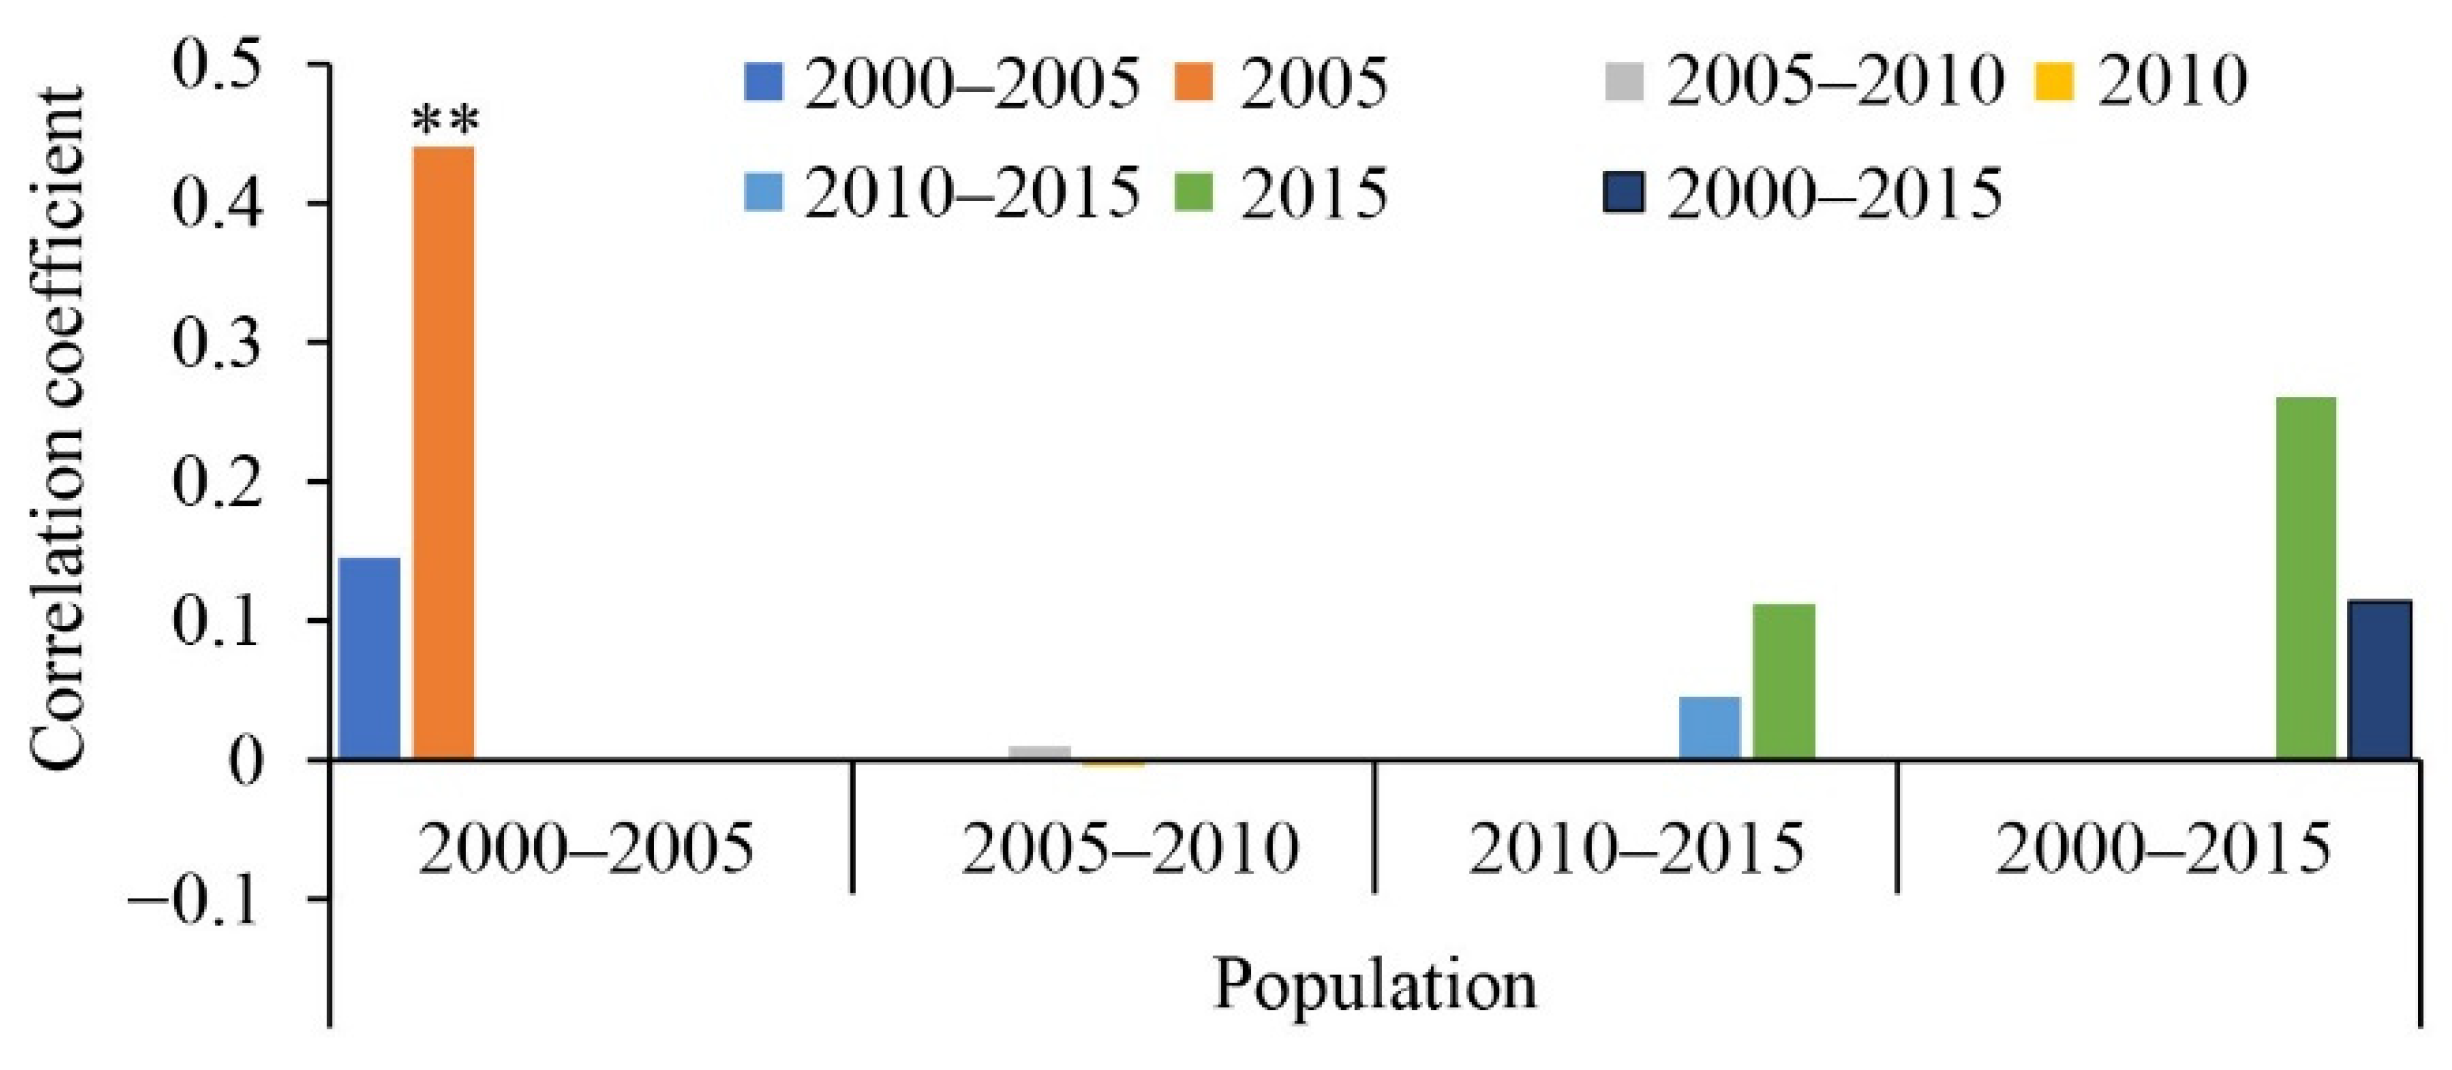
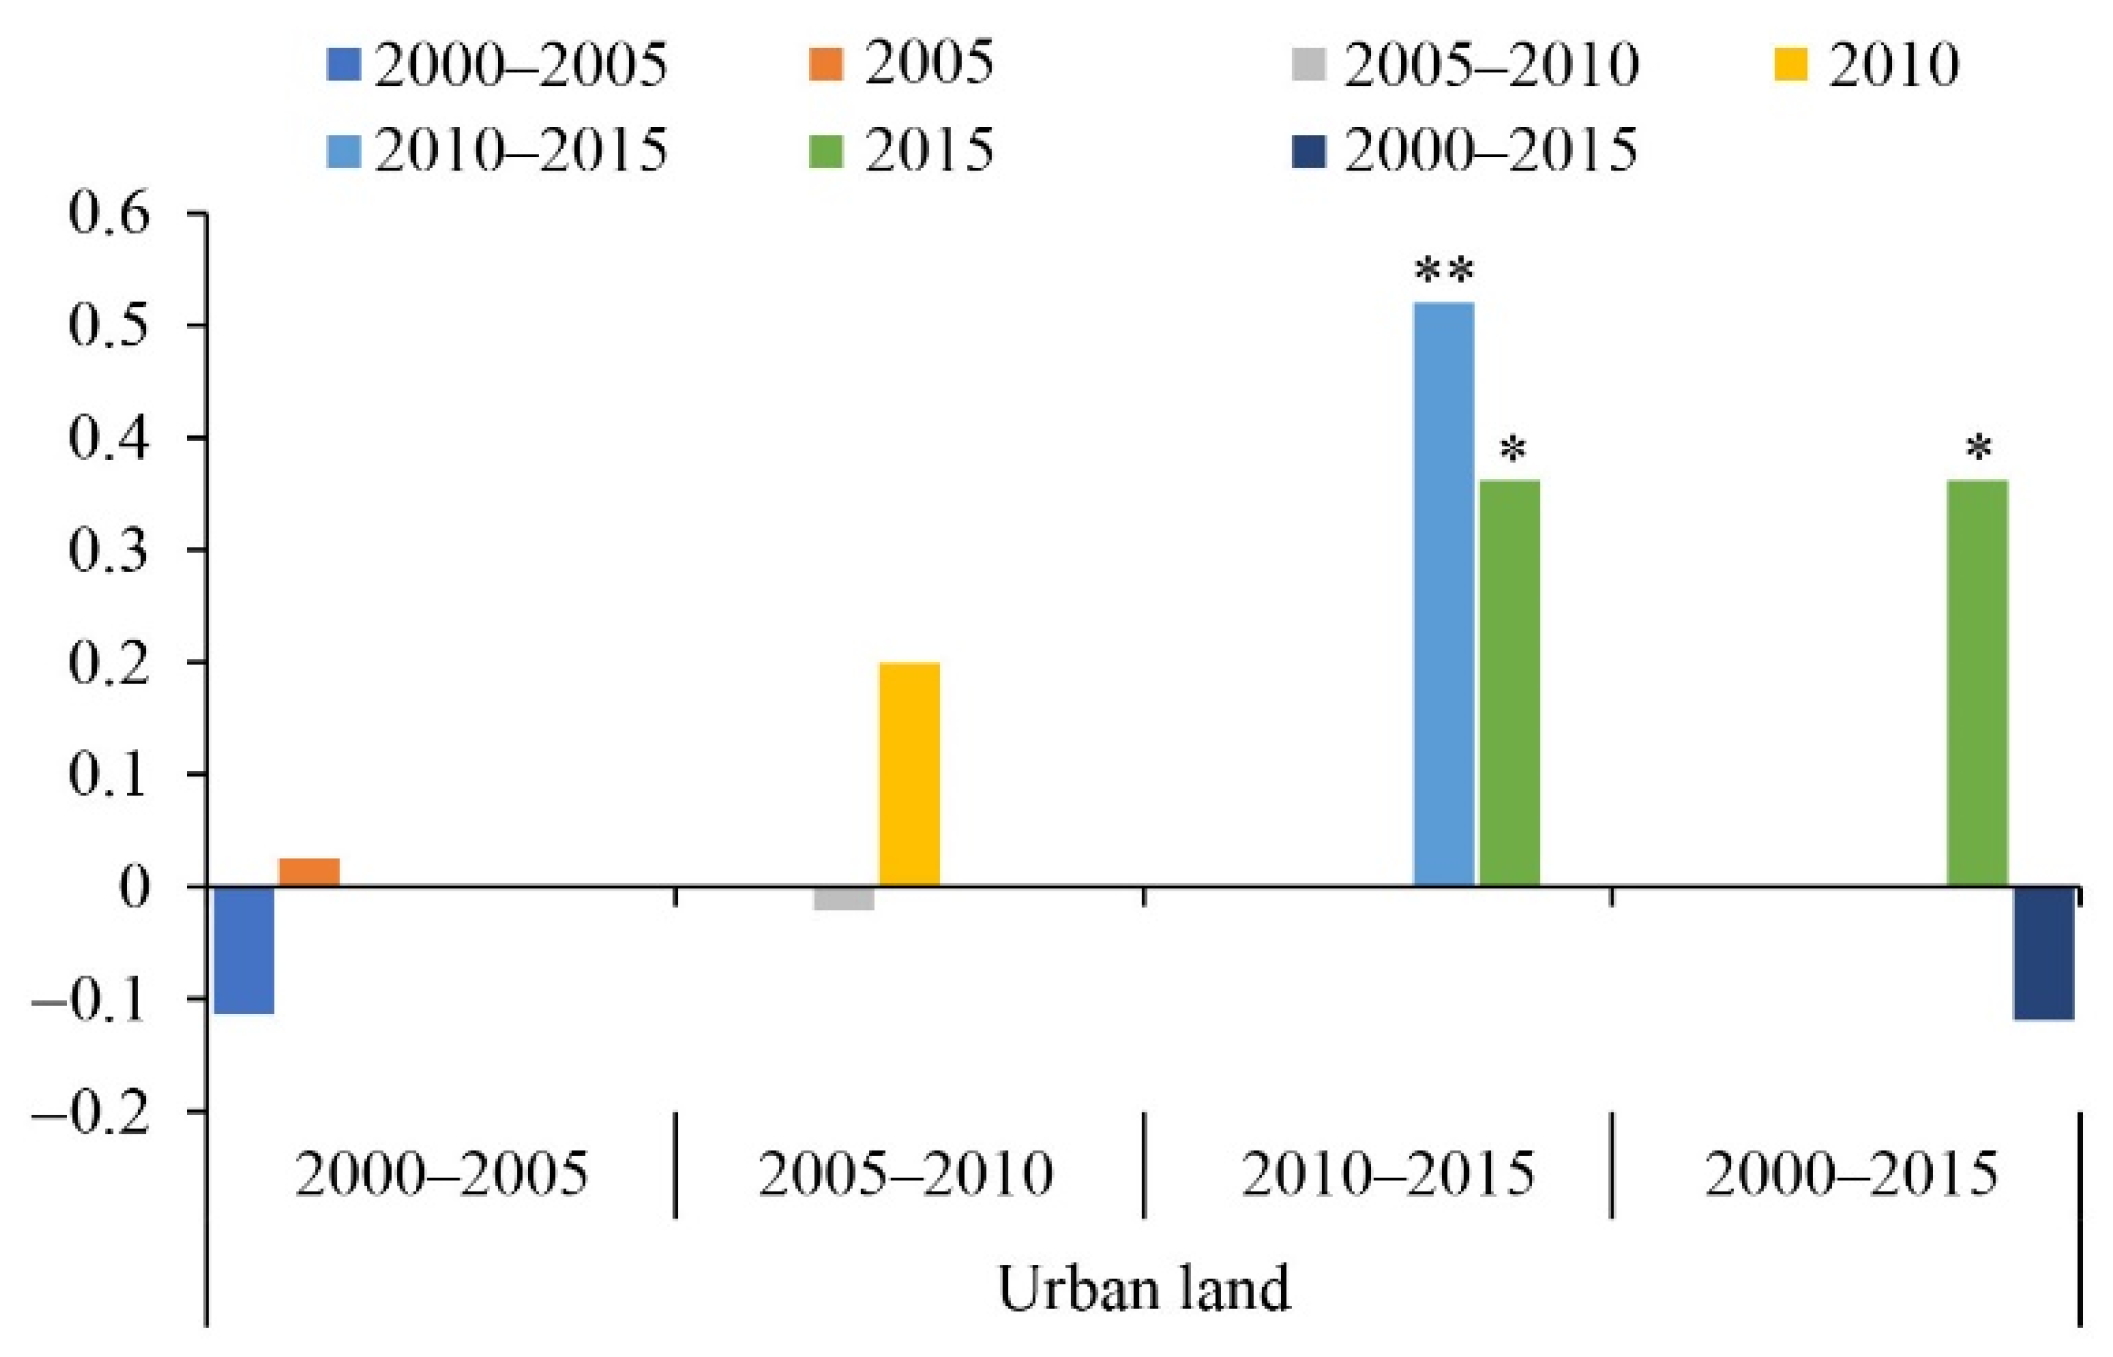
Figure 6 and Figure 7 show the relation between park access changes and urbanization during the studied 15 years in terms of population and urban land, respectively. Changes in park access from 2000 to 2005 showed a strong correlation with population density in 2005 (Figure 6). In addition, changes in accessibility from 2010 to 2015 were significantly correlated with the urban land proportion from 2010 to 2015. Changes in park access showed a positive correlation with urban land area in 2015.
4. Discussion
4.1. Urban Park Accessibility Dynamics over 15 Years
We have discussed the spatial distribution pattern of urban park accessibility in park quantity and proximity. This study shows that the presence of parks is still insufficient across the study area and the distribution of accessibility in terms of park quantity is not equal. This finding is consistent with previous studies that were conducted in high-density cities in China, such as Hangzhou and Beijing [19,34,49]. Sub-districts with high park quantity are mainly located in Dongcheng and Xicheng District and those near large parks such as Beijing Sun Park (also known as Beijing Chaoyang Park), the Summer Palace and the Old Summer Palace. This study reveals the great demand for parks in Fengtai District and most areas around the Sixth Ring Road, especially those in Changping and Shunyi District, by examining the number of parks over 2 ha in the Sixth Ring Road for 15 years. The development of park quantity in 15 years is imbalanced as well. The number of parks in Chaoyang District increased significantly from 2000 to 2015. As for the parks distributed on the border of the study area, the construction of parks in the southern regions was better than in the northern, and the number of parks on the western side was still inadequate.
Although the general proximity of the parks in the study area had increased, different levels of park accessibility among sub-districts were identified. Areas with high accessibility are mainly located in the inner city or in sub-districts with large parks in the outer city. For example, in 2015, with the completion of the Olympic Forest Park, the accessibility of the surrounding areas increased. The result was consistent with previous studies in Beijing [50,51,52]. Different areas experienced substantially different changes from 2000 to 2015; most of the sub-districts experienced a slight increase or decrease in park access, areas with reduced accessibility are mainly in the city center, and a few were distributed on the edge of the Sixth Ring Road. The sub-districts with increased park proximity were adjacent to each other. The overall trend of increased accessibility might be mainly due to an increase in park investments in individual areas, while others have seen little change or even a decrease.
By investigating the quantity and proximity of parks, the study found that some areas with a higher quantity of parks may not present higher proximity and vice versa. The spatial inequality of park access in the study area means that it is necessary to pay more attention to the population and urban development speed of the concerned areas. Local governments might overemphasize the quantity of green space and may not pay sufficient attention to the elaborate allocation of green space according to the development pattern of the city [53]. Instead of large investment in large parks and green spaces in areas far away from residents, the construction of parks should keep up with the regional urbanization process [49].
4.2. Spatiotemporal Disparity in Response to Population and Land Urbanization
The correlation analysis showed some interesting results in the relationship between park proximity and urbanization data. First, for correlation analysis between park access and population density, no significant differences were found in every single year. This finding is similar to the previous study in Wuhan, which found inconsiderable correlation between population density and walking accessibility to parks [20]. Wu and Kim [54] investigated 221 cities in China and found that areas with high population density suffered more serious inequity problems. Moreover, we found that the areas with higher urban land proportion were disadvantaged at park accessibility in 2015, which means that the construction of parks lags behind the urbanization process. Therefore, it is of great importance for megacities to identify the areas with spatial inequity in park accessibility, especially those areas that would experience continual urbanization. Research on the spatially explicit changes in park accessibility would be necessary to guide the future planning and policy implementation of green spaces [24,49]. The distribution and structure of urban parks would be optimized effectively if greening strategies could be targeted toward the areas with access deficit.
Second, more significant correlations were found between the changes in urban park access and urbanization indicators. We found that the accessibility of parks over 2 ha is mainly affected by urban land proportion in high-density cities like Beijing, while the population density is not a significant impact factor. Changes in accessibility from 2000 to 2005 are positively associated with population density, and in the latter part of 15 years, urban land proportion exerted a positive and significant impact on park accessibility. In the initial stage of the statistical years, population density was a dominating influencing factor of park access, which helped in identifying the inequity of park accessibility in terms of urban land use. This result showed that within the 2 km threshold distance, areas with higher urban land use proportion had higher proximity. Areas with less developed urbanization processes might have received less attention or investment for park construction, and there might be no large demand for parks in suburban sub-districts.
In the light of the above findings, it is essential to consider both equities of the distribution of and equities of changes in park access. We can find limited correlations between the urbanization variables (population density and urban land proportion) and park accessibility. However, urban land proportion has been identified as a key driving factor of changes in park access in the correlation analysis. The local government should consider the dynamics of park accessibility from the population and land urbanization aspects and incorporate them into the analysis framework of the driving mechanism of changes in park accessibility.
4.3. Policy and Urban Planning Promotion
Table 2 shows that the national and local governments have developed a series of policies and standards to increase urban green spaces from 2000 to 2015. During 2000–2010, the local government proposed the Beijing City Overall Plan (2004–2020) which promoted the construction of Beijing’s first isolation greenbelt in 2001 followed by the launch of the second isolation greenbelt construction in 2003, resulting in the substantial development of parks and green spaces in Beijing. During the 12th Five-Year Plan period from 2011 to 2015, the Beijing Municipal Government formulated the “Three Greening Actions Plan” and other guidelines to further promote the construction of parks and green spaces in Beijing and improve the urban ecological environment.
In this study, we found that the urban park supply has improved from 2000 to 2015 and the results were similar with some other cities in China. Wei [49] investigated the changes in park accessibility from 2000 to 2010 in Hangzhou and found that both the quantity and proximity of parks had improved. The spatiotemporal research in Wuhan also found a synchronic increase in supply and demand of green spaces from 2010 to 2014 and highlighted the crucial impact of policy and urban planning factors on changes in park accessibility [20]. Therefore, conducting a longitudinal study on park accessibility is essential for evaluating the outcomes of greening policies, and could inform policymakers and stakeholders when it comes to adjusting park allocation and retaining rational accessibility of urban parks, especially in the context of rapid urbanization.
Local governments should also consider the long-term tradeoffs of the standards and policies related to urban parks and construction of green spaces. The shift from inequity to equity cannot simply lie with increasing the park quantity. Therefore, taking both the outcome and changes of park access into account is essential to the sustainable development of efficient and effective urban planning policies [20,49]. Investigating changes in urban park accessibility over time can reflect the outcomes of urban park construction and provide an opportunity for urban planners and policymakers to assess the distribution efficiency of park allocation.
4.4. Contributions, Limitations and Implications
Our study evaluated the spatiotemporal disparity of accessibility of urban parks in Beijing at different periods based on the Gaussian-based 2SFCA method provided by Dai [21]. We also identified the change in park accessibility and analyzed the correlations between that and urban land use and population density.
The study on park accessibility dynamics in Beijing is meaningful and practical for not only other megacities in China, but also those large cities worldwide. Rapidly urbanizing cities in developing countries might have been confronted with the problems of limited park resources and spatial inequality (or social inequality); other cities in developed countries may also face the problems of social and economic inequity in park access. This longitudinal research could help us understand the relationship between accessibility and the urbanization process [49]. Findings about the influence of land and population urbanization on access inequity could provide practical insights into environmental justice and help urban planners develop proper strategies of park allocation and construction for future sustainable urban development.
This study has some limitations. The main research on urban parks and green spaces accessibility focuses on three aspects: the acreage [15,55,56], the proximity [21,57] and the quality of the parks and green spaces [27,58,59]. We adopted the static 2 km buffer zone to calculate the proximity in this study, not via the route system. Available multi-temporal spatially explicit urban road productions in the future could be applied to reduce the uncertainty and error in park proximity evaluation. This research only considered two of the above-mentioned factors, and the quality of the parks was not included in our analysis. Previous research has pointed out that park quality is an important factor that affects the access of public parks for residents [60]; some places may be poorly maintained or have fewer amenities so that people who live nearby have relatively low accessibility. In addition, park landscape feature extracted from high-resolution satellite imagery could be incorporated in future research to improve park quality analysis. However, we have not obtained the data for park amenities, cleanliness and maintenance. Park landscape feature extracted from satellite imagery could be incorporated in future research to improve park quality analysis. This study only considered the parks with an area of more than 2 ha, and some micro parks were ignored. However, considering the land shortage of the inner city, it is very difficult to develop large parks and green spaces in highly urbanized areas. In addition, other kinds of green spaces, such as some informal green spaces, are neglected by stakeholders, but they are also critical in providing urban ecosystem services [2]. Therefore, more investment in pocket parks and informal green spaces could be considered due to the scarce land resources, and research on park quality improvement such as an increase in entertainment facilities and maintenance is also needed. Future research should pay more attention to different social groups, especially vulnerable groups like children and senior citizens, and reveal the disparities of different groups to inform local urban green space planning.
5. Conclusions
This study evaluated the spatiotemporal distribution and changes of park accessibility using the Gaussian-based 2SFCA method within the Sixth Ring Road in Beijing over 15 years and the relationship between urbanization factors and park access was also analyzed using bivariate correlation analysis. The results showed that overall park accessibility in both quantity and proximity has increased in 15 years, but there are still certain regions that have limited park access across the study area. Some areas with a greater quantity of parks may not have higher park proximity and vice versa. The inequity of distribution of park accessibility has been detected despite the rapid increase in park quantity in 2015. Results of the correlation analysis showed that some significant correlations were found between the changes in urban park access and urbanization indicators. Changes in accessibility from 2000 to 2005 are mainly associated with population density, and after that, there was a significant positive correlation between park accessibility and land urbanization instead. Therefore, the results corroborated that the supply of urban parks mismatched the development of urbanization in terms of urban land use, and park access change might not be influenced by population urbanization. Proper urban planning incorporated with the distribution information of population density and urban land area is indispensable to avoid the aggravation of inequity in the process of urban expansion and promote the sustainable development of the megacity.
Author Contributions
Conceptualization, Y.S. and C.X.; data curation, X.K.; formal analysis, X.K.; project administration, Y.S.; supervision, Y.S. and C.X.; validation, Y.S.; writing—original draft, X.K.; writing—review & editing, Y.S. and C.X. All authors have read and agreed to the published version of the manuscript.
Funding
This research was funded by the Fundamental Research Funds for the Central Universities (BLX201906) and the National Natural Science Foundation of China (41801058).
Institutional Review Board Statement
Not applicable.
Informed Consent Statement
Not applicable.
Data Availability Statement
The data presented in this study are available from the corresponding author upon reasonable request.
Acknowledgments
We would like to thank anonymous reviewers for their constructive comments.
Conflicts of Interest
The authors declare no conflict of interest.
References
- van den Berg, M.; van Poppel, M.; van Kamp, I.; Andrusaityte, S.; Balseviciene, B.; Cirach, M.; Danileviciute, A.; Ellis, N.; Hurst, G.; Masterson, D.; et al. Visiting green space is associated with mental health and vitality: A cross-sectional study in four european cities. Health Place 2016, 38, 8–15. [Google Scholar] [CrossRef]
- Sikorska, D.; Łaszkiewicz, E.; Krauze, K.; Sikorski, P. The role of informal green spaces in reducing inequalities in urban green space availability to children and seniors. Environ. Sci. Policy 2020, 108, 144–154. [Google Scholar] [CrossRef]
- Bowler, D.E.; Buyung-Ali, L.; Knight, T.M.; Pullin, A.S. Urban greening to cool towns and cities: A systematic review of the empirical evidence. Landsc. Urban Plan. 2010, 97, 147–155. [Google Scholar] [CrossRef]
- Chang, C.R.; Li, M.H.; Chang, S.D. A preliminary study on the local cool-island intensity of Taipei city parks. Landsc. Urban Plan. 2007, 80, 386–395. [Google Scholar] [CrossRef]
- Jim, C.Y.; Chen, W.Y. Assessing the ecosystem service of air pollutant removal by urban trees in Guangzhou (China). J. Environ. Manag. 2008, 88, 665–676. [Google Scholar] [CrossRef]
- Paoletti, E.; Bardelli, T.; Giovannini, G.; Pecchioli, L. Air quality impact of an urban park over time. Procedia Environ. Sci. 2011, 4, 10–16. [Google Scholar] [CrossRef] [Green Version]
- Li, H.; Chau, C.K.; Tang, S.K. Can surrounding greenery reduce noise annoyance at home? Sci. Total Environ. 2010, 408, 4376–4384. [Google Scholar] [CrossRef]
- Buchel, S.; Frantzeskaki, N. Citizens’ voice: A case study about perceived ecosystem services by urban park users in Rotterdam, the Netherlands. Ecosyst. Serv. 2015, 12, 169–177. [Google Scholar] [CrossRef]
- Langemeyer, J.; Baró, F.; Roebeling, P.; Gómez-Baggethun, E. Contrasting values of cultural ecosystem services in urban areas: The case of park Montjuïc in Barcelona. Ecosyst. Serv. 2015, 12, 178–186. [Google Scholar] [CrossRef]
- Aerts, R.; Honnay, O.; Van Nieuwenhuyse, A. Biodiversity and human health: Mechanisms and evidence of the positive health effects of diversity in nature and green spaces. Br. Med. Bull. 2018, 127, 5–22. [Google Scholar] [CrossRef] [Green Version]
- Bedimo-Rung, A.L.; Mowen, A.J.; Cohen, D.A. The significance of parks to physical activity and public health: A conceptual model. Am. J. Prev. Med. 2005, 28, 159–168. [Google Scholar] [CrossRef]
- Cohen, D.A.; McKenzie, T.L.; Sehgal, A.; Williamson, S.; Golinelli, D.; Lurie, N. Contribution of public parks to physical activity. Am. J. Public Health 2007, 97, 509–514. [Google Scholar] [CrossRef] [PubMed]
- Dai, P.C.; Zhang, S.L.; Hou, H.P.; Yang, Y.J.; Liu, R. Valuing sports services in urban parks: A new model based on social network data. Ecosyst. Serv. 2019, 36, 100891. [Google Scholar] [CrossRef]
- Ugolini, F.; Massetti, L.; Calaza-Martinez, P.; Carinanos, P.; Dobbs, C.; Ostoic, S.K.; Marin, A.M.; Pearlmutter, D.; Saaroni, H.; Sauliene, I.; et al. Effects of the COVID-19 pandemic on the use and perceptions of urban green space: An international exploratory study. Urban For. Urban Green. 2020, 56, 126888. [Google Scholar] [CrossRef]
- Wood, L.; Hooper, P.; Foster, S.; Bull, F. Public green spaces and positive mental health—Investigating the relationship between access, quantity and types of parks and mental wellbeing. Health Place 2017, 48, 63–71. [Google Scholar] [CrossRef] [PubMed]
- Chiesura, A. The role of urban parks for the sustainable city. Landsc. Urban Plan. 2004, 68, 129–138. [Google Scholar] [CrossRef]
- Kazmierczak, A. The contribution of local parks to neighbourhood social ties. Landsc. Urban Plan. 2013, 109, 31–44. [Google Scholar] [CrossRef]
- Majumdar, S.; Deng, J.Y.; Zhang, Y.Q.; Pierskalla, C. Using contingent valuation to estimate the willingness of tourists to pay for urban forests: A study in Savannah, Georgia. Urban For. Urban Green. 2011, 10, 275–280. [Google Scholar] [CrossRef]
- Feng, S.; Chen, L.; Sun, R.; Feng, Z.; Li, J.; Khan, M.S.; Jing, Y. The Distribution and Accessibility of Urban Parks in Beijing, China: Implications of Social Equity. Int. J. Environ. Res. Public Health 2019, 16, 4894. [Google Scholar] [CrossRef] [Green Version]
- Xing, L.; Liu, Y.; Liu, X.; Wei, X.; Mao, Y. Spatio-temporal disparity between demand and supply of park green space service in urban area of Wuhan from 2000 to 2014. Habitat Int. 2018, 71, 49–59. [Google Scholar] [CrossRef]
- Dai, D. Racial/ethnic and socioeconomic disparities in urban green space accessibility: Where to intervene? Landsc. Urban Plan. 2011, 102, 234–244. [Google Scholar] [CrossRef]
- Kronenberg, J.; Haase, A.; Łaszkiewicz, E.; Antal, A.; Baravikova, A.; Biernacka, M.; Dushkova, D.; Filčak, R.; Haase, D.; Ignatieva, M.; et al. Environmental justice in the context of urban green space availability, accessibility, and attractiveness in postsocialist cities. Cities 2020, 106, 102862. [Google Scholar] [CrossRef]
- La Rosa, D. Accessibility to greenspaces: GIS based indicators for sustainable planning in a dense urban context. Ecol. Indic. 2014, 42, 122–134. [Google Scholar] [CrossRef]
- Ye, C.; Hu, L.; Li, M. Urban green space accessibility changes in a high-density city: A case study of Macau from 2010 to 2015. J. Transp. Geogr. 2018, 66, 106–115. [Google Scholar] [CrossRef]
- Abercrombie, L.C.; Sallis, J.F.; Conway, T.L.; Frank, L.D.; Saelens, B.E.; Chapman, J.E. Income and Racial Disparities in Access to Public Parks and Private Recreation Facilities. Am. J. Prev. Med. 2008, 34, 9–15. [Google Scholar] [CrossRef]
- Lara-Valencia, F.; Garcia-Perez, H. Space for equity: Socioeconomic variations in the provision of public parks in Hermosillo, Mexico. Local Environ. 2015, 20, 350–368. [Google Scholar] [CrossRef]
- Rigolon, A.; Browning, M.; Jennings, V. Inequities in the quality of urban park systems: An environmental justice investigation of cities in the United States. Landsc. Urban Plan. 2018, 178, 156–169. [Google Scholar] [CrossRef]
- Zhou, X.L.; Kim, J. Social disparities in tree canopy and park accessibility: A case study of six cities in Illinois using GIS and remote sensing. Urban For. Urban Green. 2013, 12, 88–97. [Google Scholar] [CrossRef]
- United Nations, World Urbanization Prospects: The 2018 Revision. Available online: https://www.un.org/development/desa/pd/content/world-urbanization-prospects-2018-revision (accessed on 10 March 2021).
- Xiao, Y.; Wang, Z.; Li, Z.; Tang, Z. An assessment of urban park access in Shanghai—Implications for the social equity in urban China. Landsc. Urban Plan. 2017, 157, 383–393. [Google Scholar] [CrossRef]
- Xing, L.; Liu, Y.; Liu, X. Measuring spatial disparity in accessibility with a multi-mode method based on park green spaces classification in Wuhan, China. Appl. Geogr. 2018, 94, 251–261. [Google Scholar] [CrossRef]
- Zhang, J.G.; Cheng, Y.Y.; Wei, W.; Zhao, B. Evaluating Spatial Disparity of Access to Public Parks in Gated and Open Communities with an Improved G2SFCA Model. Sustainability 2019, 11, 5910. [Google Scholar] [CrossRef] [Green Version]
- Zhu, Z.Q.; Ren, J.; Liu, X. Green infrastructure provision for environmental justice: Application of the equity index in Guangzhou, China. Urban For. Urban Green. 2019, 46, 126443. [Google Scholar] [CrossRef]
- Guo, S.H.; Song, C.; Pei, T.; Liu, Y.X.; Ma, T.; Du, Y.Y.; Chen, J.; Fan, Z.D.; Tang, X.L.; Peng, Y.; et al. Accessibility to urban parks for elderly residents: Perspectives from mobile phone data. Landsc. Urban Plan. 2019, 191, 103642. [Google Scholar] [CrossRef]
- Liu, W.P.; Chen, W.J.; Dong, C.L. Spatial decay of recreational services of urban parks: Characteristics and influencing factors. Urban For. Urban Green. 2017, 25, 130–138. [Google Scholar] [CrossRef]
- Xiao, Y.; Wang, D.; Fang, J. Exploring the disparities in park access through mobile phone data: Evidence from Shanghai, China. Landsc. Urban Plan. 2019, 181, 80–91. [Google Scholar] [CrossRef]
- Luo, W.; Wang, F. Measures of Spatial Accessibility to Healthcare in a GIS Environment: Synthesis and a Case Study in Chicago Region. Environ. Plan. B Plan. Des. 2003, 30, 865–884. [Google Scholar] [CrossRef] [Green Version]
- Wu, J.; Chen, H.; Wang, H.; He, Q.; Zhou, K. Will the opening community policy improve the equity of green accessibility and in what ways?—Response based on a 2-step floating catchment area method and genetic algorithm. J. Clean. Prod. 2020, 263, 121454. [Google Scholar] [CrossRef]
- Dai, Z.; Guldmann, J.M.; Hu, Y. Spatial regression models of park and land-use impacts on the urban heat island in central Beijing. Sci. Total Environ. 2018, 626, 1136–1147. [Google Scholar] [CrossRef] [PubMed]
- Yan, S.; Zhao, S. Spatiotemporal dynamics of urban expansion in 13 cities across the Jing-Jin-Ji Urban Agglomeration from 1978 to 2015. Ecol. Indic. 2018, 87, 302–313. [Google Scholar]
- Beijing Bureau of Statistics. Beijing Statistical Yearbook 2020. Available online: http://nj.tjj.beijing.gov.cn/nj/main/2020-tjnj/zk/indexch.htm (accessed on 17 January 2020).
- Chen, Y.; Bin, Y.U. Three models for predicting population growth—Theoretical foundation, application methods, and revised expressions. J. Cent. China Norm. Univ. 2006, 40, 452–456. [Google Scholar] [CrossRef] [Green Version]
- Feltynowski, M.; Kronenberg, J.; Bergier, T.; Kabisch, N.; Łaszkiewicz, E.; Strohbach, M.W. Challenges of urban green space management in the face of using inadequate data. Urban For. Urban Green. 2018, 31, 56–66. [Google Scholar] [CrossRef]
- Natural England. Nature Nearby: Accessible Natural Greenspace Guidance; Natural England: Peterborough, UK, 2010. [Google Scholar]
- Maroko, A.R.; Maantay, J.A.; Sohler, N.L.; Grady, K.L.; Arno, P.S. The complexities of measuring access to parks and physical activity sites in New York City: A quantitative and qualitative approach. Int. J. Health Geogr. 2009, 8, 34. [Google Scholar] [CrossRef] [Green Version]
- Shan, X.-Z. The socio-demographic and spatial dynamics of green space use in Guangzhou, China. Appl. Geogr. 2014, 51, 26–34. [Google Scholar] [CrossRef]
- Apparicio, P.; Abdelmajid, M.; Riva, M.; Shearmur, R. Comparing alternative approaches to measuring the geographical accessibility of urban health services: Distance types and aggregation-error issues. Int. J. Health Geogr. 2008, 7, 7. [Google Scholar] [CrossRef] [Green Version]
- Shen, Y.A.; Sun, F.; Che, Y.Y. Public green spaces and human wellbeing: Mapping the spatial inequity and mismatching status of public green space in the Central City of Shanghai. Urban For. Urban Green. 2017, 27, 59–68. [Google Scholar] [CrossRef]
- Wei, F. Greener urbanization? Changing accessibility to parks in China. Landsc. Urban Plan. 2017, 157, 542–552. [Google Scholar] [CrossRef]
- Rojas, C.; Páez, A.; Barbosa, O.; Carrasco, J. Accessibility to urban green spaces in Chilean cities using adaptive thresholds. J. Transp. Geogr. 2016, 57, 227–240. [Google Scholar] [CrossRef]
- Tu, X.Y.; Huang, G.L.; Wu, J.G. Contrary to Common Observations in the West, Urban Park Access Is Only Weakly Related to Neighborhood Socioeconomic Conditions in Beijing, China. Sustainability 2018, 10, 1115. [Google Scholar] [CrossRef] [Green Version]
- Wu, J.Y.; Feng, Z.; Peng, Y.S.; Liu, Q.Y.; He, Q.S. Neglected green street landscapes: A re-evaluation method of green justice. Urban For. Urban Green. 2019, 41, 344–353. [Google Scholar] [CrossRef]
- Wang, X.J. Analysis of problems in urban green space system planning in China. J. For. Res. 2009, 20, 79–82. [Google Scholar] [CrossRef]
- Wu, L.; Kim, S.K. Does socioeconomic development lead to more equal distribution of green space? Evidence from Chinese cities. Sci. Total Environ. 2021, 757, 143780. [Google Scholar] [CrossRef] [PubMed]
- Rigolon, A. A complex landscape of inequity in access to urban parks: A literature review. Landsc. Urban Plan. 2016, 153, 160–169. [Google Scholar] [CrossRef]
- Francis, J.; Wood, L.J.; Knuiman, M.; Giles-Corti, B. Quality or quantity? Exploring the relationship between Public Open Space attributes and mental health in Perth, Western Australia. Soc. Sci. Med. 2012, 74, 1570–1577. [Google Scholar] [CrossRef] [PubMed]
- Wen, M.; Zhang, X.; Harris, C.D.; Holt, J.B.; Croft, J.B. Spatial disparities in the distribution of parks and green spaces in the USA. Ann. Behav. Med. 2013, 45 (Suppl. 1), S18–S27. [Google Scholar] [CrossRef] [Green Version]
- Rigolon, A. Parks and young people: An environmental justice study of park proximity, acreage, and quality in Denver, Colorado. Landsc. Urban Plan. 2017, 165, 73–83. [Google Scholar] [CrossRef]
- Stessens, P.; Khan, A.Z.; Huysmans, M.; Canters, F. Analysing urban green space accessibility and quality: A GIS-based model as spatial decision support for urban ecosystem services in Brussels. Ecosyst. Serv. 2017, 28, 328–340. [Google Scholar] [CrossRef]
- Wolch, J.R.; Byrne, J.; Newell, J.P. Urban green space, public health, and environmental justice: The challenge of making cities ‘just green enough’. Landsc. Urban Plan. 2014, 125, 234–244. [Google Scholar] [CrossRef] [Green Version]
Figure 1.
Study area of the sub-districts within Sixth Ring Road in Beijing (A), the location of Beijing in China (B), and the districts of Beijing (C).
Figure 1.
Study area of the sub-districts within Sixth Ring Road in Beijing (A), the location of Beijing in China (B), and the districts of Beijing (C).

Figure 2.
The distribution of the centroids of urban parks in 2000 (A), 2005 (B), 2010 (C), and 2015 (D) in Beijing.
Figure 2.
The distribution of the centroids of urban parks in 2000 (A), 2005 (B), 2010 (C), and 2015 (D) in Beijing.

Figure 3.
Urban park accessibility in quantity characteristic from 2000 to 2015. (A–D) represented the distribution pattern of urban park quantity in 2000, 2005, 2010 and 2015, respectively and (E–G) represented the change in urban park quantity from 2000–2005, 2005–2010 and 2010–2015, respectively.

Figure 4.
Distribution and changes of accessibility of 2 km catchment. (A–D) represent the distribution pattern of urban park proximity of 2 km catchment in 2000, 2005, 2010 and 2015, respectively; (E–H) represent the change of urban park proximity of 2 km catchment from 2000–2005, 2005–2010, 2010–2015 and 2000–2015, respectively.

Figure 5.
Bivariate correlation between park access and urbanization variables of population density and urban land proportion (** denote the significance of correlation coefficient estimate at the 0.01 level).
Figure 5.
Bivariate correlation between park access and urbanization variables of population density and urban land proportion (** denote the significance of correlation coefficient estimate at the 0.01 level).

Figure 6.
Bivariate correlation between changes in park access and population urbanization (** denote the significance of correlation coefficient estimate at the 0.01 level).
Figure 6.
Bivariate correlation between changes in park access and population urbanization (** denote the significance of correlation coefficient estimate at the 0.01 level).

Figure 7.
Bivariate correlation between changes in park access and land urbanization (* and ** denote the significance of correlation coefficient estimate at the 0.05 and 0.01 level, respectively).
Figure 7.
Bivariate correlation between changes in park access and land urbanization (* and ** denote the significance of correlation coefficient estimate at the 0.05 and 0.01 level, respectively).


Table 1.
The number of urban parks from 2000 to 2015 in Beijing.
| Park Class 1 | 2000 | 2005 | 2010 | 2015 |
|---|---|---|---|---|
| 1 | 35 | 36 | 37 | 60 |
| 2 | 36 | 40 | 41 | 96 |
| 3 | 6 | 6 | 6 | 7 |
| 4 | 3 | 3 | 3 | 4 |
| 5 | 1 | 1 | 1 | 2 |
| 6 | 0 | 0 | 0 | 4 |
| Total | 81 | 86 | 88 | 173 |
1 Park class: Class 1, 2–10 ha; Class 2, 10–100 ha; Class 3, 100–200 ha; Class 4, 200–300 ha; Class 5, 300–500 ha; Class 6, >500 ha.
Table 2.
Policies and regulations of urban forest construction in Beijing.
| Year | Institution | Item | Relative Contents |
|---|---|---|---|
| 2000–2010 | |||
| 2002 | Beijing Municipal Commission of Planning and Natural Resources | Green Space System Planning in Beijing | Increase the number of ribbon parks and green spaces around roads and waterways as well as country parks |
| 2004 | Beijing Municipal Government | Beijing Master Plan (2004–2020) | Construction of the initial two urban isolation greenbelts |
| 2005 | Ministry of Housing and Urban-Rural Development | Standards of National Landscape Garden City | Park green space service radius coverage ≥ 70% |
| 2009 | Beijing Municipal Government | Green Space System Planning in Beijing | Increase green belt and build the ring-distributed urban parks around the city |
| 2010–2015 | |||
| 2010 | Beijing Municipal People’s Congress | Regulations of Beijing Municipality on Greening | Strengthen urban park, country park and rural park construction and provide more green activity spaces for the public |
| 2010 | Beijing Municipal Forestry and Parks Bureau | Beijing Public Green Land Construction Management Measures | Strengthen construction and management and provide behavior standards for public green land construction management |
| 2011 | Beijing Municipal Forestry and Parks Bureau | Three Greening Actions Plan | Increase per capita green area to 15.3 m2 |
| 2012 | Ministry of Housing and Urban-Rural Development | Guidance for promoting the healthy development of urban forestry and greening enterprise | Visible greenness in 300 m and visible parks in 500 m |
| 2012 | Beijing Municipal People’s Congress | Beijing Wetland Protection Legislation | Set up wetland parks and wetland reserves |
Publisher’s Note: MDPI stays neutral with regard to jurisdictional claims in published maps and institutional affiliations. |
© 2021 by the authors. Licensee MDPI, Basel, Switzerland. This article is an open access article distributed under the terms and conditions of the Creative Commons Attribution (CC BY) license (https://creativecommons.org/licenses/by/4.0/).
Share and Cite
MDPI and ACS Style
Kong, X.; Sun, Y.; Xu, C. Effects of Urbanization on the Dynamics and Equity of Access to Urban Parks from 2000 to 2015 in Beijing, China. Forests 2021, 12, 1796. https://doi.org/10.3390/f12121796
AMA Style
Kong X, Sun Y, Xu C. Effects of Urbanization on the Dynamics and Equity of Access to Urban Parks from 2000 to 2015 in Beijing, China. Forests. 2021; 12(12):1796. https://doi.org/10.3390/f12121796
Chicago/Turabian StyleKong, Xiangqi, Yan Sun, and Chengyang Xu. 2021. "Effects of Urbanization on the Dynamics and Equity of Access to Urban Parks from 2000 to 2015 in Beijing, China" Forests 12, no. 12: 1796. https://doi.org/10.3390/f12121796
Note that from the first issue of 2016, this journal uses article numbers instead of page numbers. See further details here.