Public Preferences and Willingness to Pay for Invasive Forest Pest Prevention Programs in Urban Areas
by
 , , and
Damian C. Adams
1,* ,
,
José R. Soto
2,
John Lai
3,
Francisco J. Escobedo
4,
Sergio Alvarez
5 and
Abu S.M.G. Kibria
2 1
School of Forest Resources & Conservation, University of Florida, P.O. Box 110410, Gainesville, FL 32611, USA
2
School of Natural Resources & The Environment, The University of Arizona, ENR2-N216, Tucson, AZ 85721, USA
3
Food and Resource Economics Department, University of Florida, McCarty Hall B, Gainesville, FL 32603, USA
4
USDA Forest Service, Pacific Southwest Research Station, 4955 Canyon Crest Dr., Riverside, CA 92507, USA
5
Rosen College of Hospitality Management and National Center for Integrated Coastal Research, University of Central Florida, Orlando, FL 32819, USA
*
Author to whom correspondence should be addressed.
Forests 2020, 11(10), 1056; https://doi.org/10.3390/f11101056
Submission received: 26 August 2020
/
Revised: 26 September 2020
/
Accepted: 27 September 2020
/
Published: 30 September 2020
(This article belongs to the Section Forest Economics, Policy, and Social Science)
Abstract
:Invasive forest pests can cause environmental and economic damage amounting to billions of dollars (US) in lost revenues, restoration and response costs, and the loss of ecosystem services nationwide. Unfortunately, these forest pests do not stay confined to wildland forest areas and can spread into suburban and urban areas, imposing significant costs on local governments, homeowners, and management agencies. In this study, a contingent valuation experiment is used to estimate Florida residents’ willingness to pay (WTP) a monthly utility fee that would protect urban forests from invasive pests by implementing a monitoring and prevention program for their early detection and eradication. On average, the respondents are WTP US $5.44 per month to implement the surveillance program, revealing an aggregate WTP in the order of US $540 million per year. The results also reveal that respondents are sensitive to the scope of the program, with higher rates of participation and higher WTP for a program that is more effective at preventing forest pest invasions.
1. Introduction
Forest pest invasions by non-native pest plants, animals, and pathogens cause environmental and economic damage amounting to billions of dollars (US) in terms of lost ecosystem service and revenues as well as cleanup efforts nationwide. Unfortunately, invasive pests do not stay confined to wildland forest areas and can spread into suburban and urban areas [1]. Some of the impacts of infestations include disturbances of ecosystem processes and habitats [2,3,4,5], reductions in the value of residential properties due to increased wildfire risk, risks to human safety due to hazardous dead trees, harm to businesses, and ecosystem degradation [1,6]. These impacts have been exacerbated by the lower aesthetic appeal of dead and dying trees, land use conflicts, hindrances to trail and forest accessibility, lower timber value compared to healthy trees [7], and decreasing biodiversity in the ecosystem [8]. According to Aukema et al. [9], the costs associated with damage caused by forest pests are primarily borne by local governments and homeowners. For local governments, costs arise in the form of treatments for live trees to mitigate infestations, the removal of dead trees, and replanting new trees. Homeowners shoulder this burden in the form of diminished property values, treatment for pests, and the removal of trees from their landscapes to prevent the proliferation of the pests [9,10].
Pest infestations and invasion risks have the potential to cause harm to native biodiversity and alterations of biogeochemical processes [11]. Many states in the U.S. have been impacted by pest invasions in recent decades with rising world trade flows [12,13]. States with infestations have continued to suffer economic and social losses [14]. For example, Florida has experienced several natural and anthropogenic disturbances over the course of the past century and, along with California and Texas, is one of the only U.S. states in the high-risk cluster for biological invasions [15]. Governments and homeowners in Florida continually attempt to control the exotic redbay ambrosia beetle (Xyleborus glabratus Eichhoff) causing laurel wilt disease, which is estimated to potentially cause $356 million in unabated damages to the avocado industry [16]. Aquatic plants such as the hydrilla (Hydrilla verticillata (Linn. f.) Royle) cause an annual loss of $10 million by impeding waterways, altering nutrient cycles, and preventing the recreational use of Florida lakes and rivers [17,18]. Cogongrass (Imperata cylindrical (L.) Beauv.), an invasive perennial grass that can survive disturbance events such as fire, flooding, and drought, results in an annual loss of $35 million to the state’s forestry sector [19]. The arboreal conehead termite (Nasutitermes corniger Motschulsky), native to South America and the Caribbean, has become established in South Florida, with estimated costs to homeowners ranging between $6.9 and $9.9 million over 10 years [20]. Human health can also be threatened by the introduction of invasive plants in Florida, such as the Melaleuca (Melaleuca quinquenervia (Cav.) S.T. Blake) and Pepper-tree (Schinus terebinthifloius Raddi), which cause respiratory problems and contact dermatitis [8].
Considerable impacts to residential property values have also been measured in a number of studies and can potentially overshadow other categories of market and non-market impacts [21]. Many studies support findings that show that urban areas with a greater urban forest cover have significantly increased property values [22,23,24]. The reverse is true, due to the loss of associated ecosystem services, such as wildlife habitats, carbon sequestration, air quality, temperature regulation, energy savings from shading, and increased storm water retention [25,26,27,28,29,30,31,32]. However, if a forest pest outbreak occurs, these services can be reduced or potentially disappear completely, resulting in substantial costs to local governments, management agencies, and homeowners [33].
Intervention by local governments is often necessary to mitigate the deleterious effects of forest pest invasion [34]. Mitigation practices can include prevention through reductions in the amount of host materials such as timber, wood products, and live plants that are transported between regions. Monitoring (or surveillance) programs that include the deployment of insect and spore traps as part of a multipronged approach [35] have also been determined to be effective, since the early detection of a non-native species allows for the possibility of eradication of the pest as well as preventative actions to protect trees [36]. While these approaches are costly and require up-front expenditures by federal, state, and local governments and thus taxpayers, they are likely to yield significant returns in the form of lower costs from invasive pest invasions [37].
Consumers’ valuations of urban forests and their related ecosystem services have been measured in a number of studies and have revealed insights related to problems including climate protection [38], the protection of ecologically sensitive areas [39,40,41], forest disease control [42], and biological controls in urban landscapes [43]. However, few studies have focused on the implementation of mitigation strategies that rely on developing a connection between a suitable policy and consumers’ valuation of ecosystem services. Soto et al. [44] found that connections between urban forests and polices are important because residents of urban communities are increasingly concerned with tradeoffs associated with the maintenance, planting, and preservation of urban forests. The authors also found that policies enacted by local decision makers in cities or towns have been found to reflect individuals’ values in regard to the environment.
Urban forests provide a number of ecosystem services and direct financial benefits to their surrounding populations [45]. Forests near coastal cities, particularly in warm subtropical climates, are particularly vulnerable to the infestation of invasive forest pests due to the presence of airports and ports and the high diversity of trees (native or non-native) in streets, parks, and gardens [46]. In order to protect these urban natural resources, local government agencies need funding from taxpayers to develop and implement programs that provide the early detection of an impending forest pest invasion. The problem is that policymakers need context-specific, science-based information to better understand the level of funding residents are willing to support, specifically for efforts to enact policies that are consistent with residents’ preferences. Thus, the objective of this analysis is to estimate Florida residents’ willingness to pay (WTP) for a program funded through a utility fee that would protect urban forests from invasive pests, and to assess the levels of potential support for such a program.
2. Methodology
2.1. The Survey and Data
The data used in this analysis were obtained through a survey of residents in the state of Florida in the US. Data collection took place in August 2016 in the form of an online questionnaire. The purpose of the survey was two-fold. First, it was used to determine the preferences and concerns regarding environmental and invasive species issues in Florida. Second, we used a contingent valuation survey approach to determine a utility fee to be paid as a supplement that would allow funds for the protection of ecosystem services, specifically urban forests. A total of 3210 responses were received through an online panel provider, Qualtrics, out of 14,386 invitations sent. With 2486 respondents omitted from data analysis due to a lack of survey attentiveness or people dropping out of the survey, 724 responses remained viable for analysis. The overall completion rate was 23%.
First, the respondents were informed that pest invasions can result in the death of trees—sometimes by the thousands—resulting in expensive removal and replacement costs that are borne by landowners and local governments. The respondents were also told that if pests are detected in a timely manner, trees can usually be treated and saved, and, in addition, that reducing the amount of host material transported between regions could also prevent outbreaks of forest pests. This information led the respondent into a scenario where the state of Florida is considering a program that would deploy thousands of insect and spore traps throughout the state to enhance the early detection of pests. The respondents were also told that experts estimated the effectiveness (percentage chance of invasion reduction) of such a program in percentage terms, with the effectiveness shown to each respondent varying randomly between three levels (50%, 70%, 90%). The respondent was then asked a referendum-style question on a ballot initiative that would raise monthly utility fees to cover the costs of the program. The initial bid offered had four levels ($3, $5, $7, $9). The respondents were then asked a similar follow-up with the same effectiveness level but a different bid, depending on whether the first question had been answered positively or negatively. There were six bid levels for the follow-up question ($1, $3, $5, $7, $9, $11), with respondents seeing the next higher or lower level as in the initial referendum question, depending on if they answered “yes” or “no” to the first bid.
The respondents were also asked a series of questions concerning environmental impacts and invasive species. They were first asked about their level of concern for water pollution and invasive species in Florida (Likert scale). Similarly, the participants were also asked: (1) if they think that climate change is resulting in more extreme weather events, and this was followed by a question asking if they believe climate change is caused by human activity or natural changes in the environment, or both; (2) if they recycle; (3) if they are willing to change their lifestyle to reduce environmental damage; and (4) how important outdoor recreation is to them, as well as the types of outdoor recreation activities they have engaged in the past 12 months. Additionally, we elicited information regarding political preferences—namely, we asked, “who do you agree with more about what the government should and should not do (Republicans, Democrats, Independents, or somebody else)?”
2.2. Analytical Approach
For the second part of the survey instrument, a double-bounded contingent valuation approach was used to also estimate the respondents’ WTP a utility fee in United States Dollars, $ hereafter, to implement a program to protect trees in urban and near-urban areas by preventing and monitoring the introduction of forest pests. This analytical approach has been used in a variety of other studies involving non-market valuation for issues such as safer drinking water [47,48], green energy [49,50,51], damage from oil spills [52], and forest resource restoration [53].
Each survey participant was presented with a short introduction paragraph which briefly summarized the problem with invasive species and resulting damage to trees in forests and urban areas. The respondents were asked whether they would vote for, against, or not vote on a monthly utility fee with varying levels of effectiveness rates. The effectiveness rates represent the percentage chance of invasion reduction that experts estimate a prevention and monitoring program would provide, and were introduced in order to test for sensitivity to scope in the contingent valuation experiment [54]. To assess the sensitivity of efficacy, we included three levels of forest pest prevention (50%, 70%, and 90%).
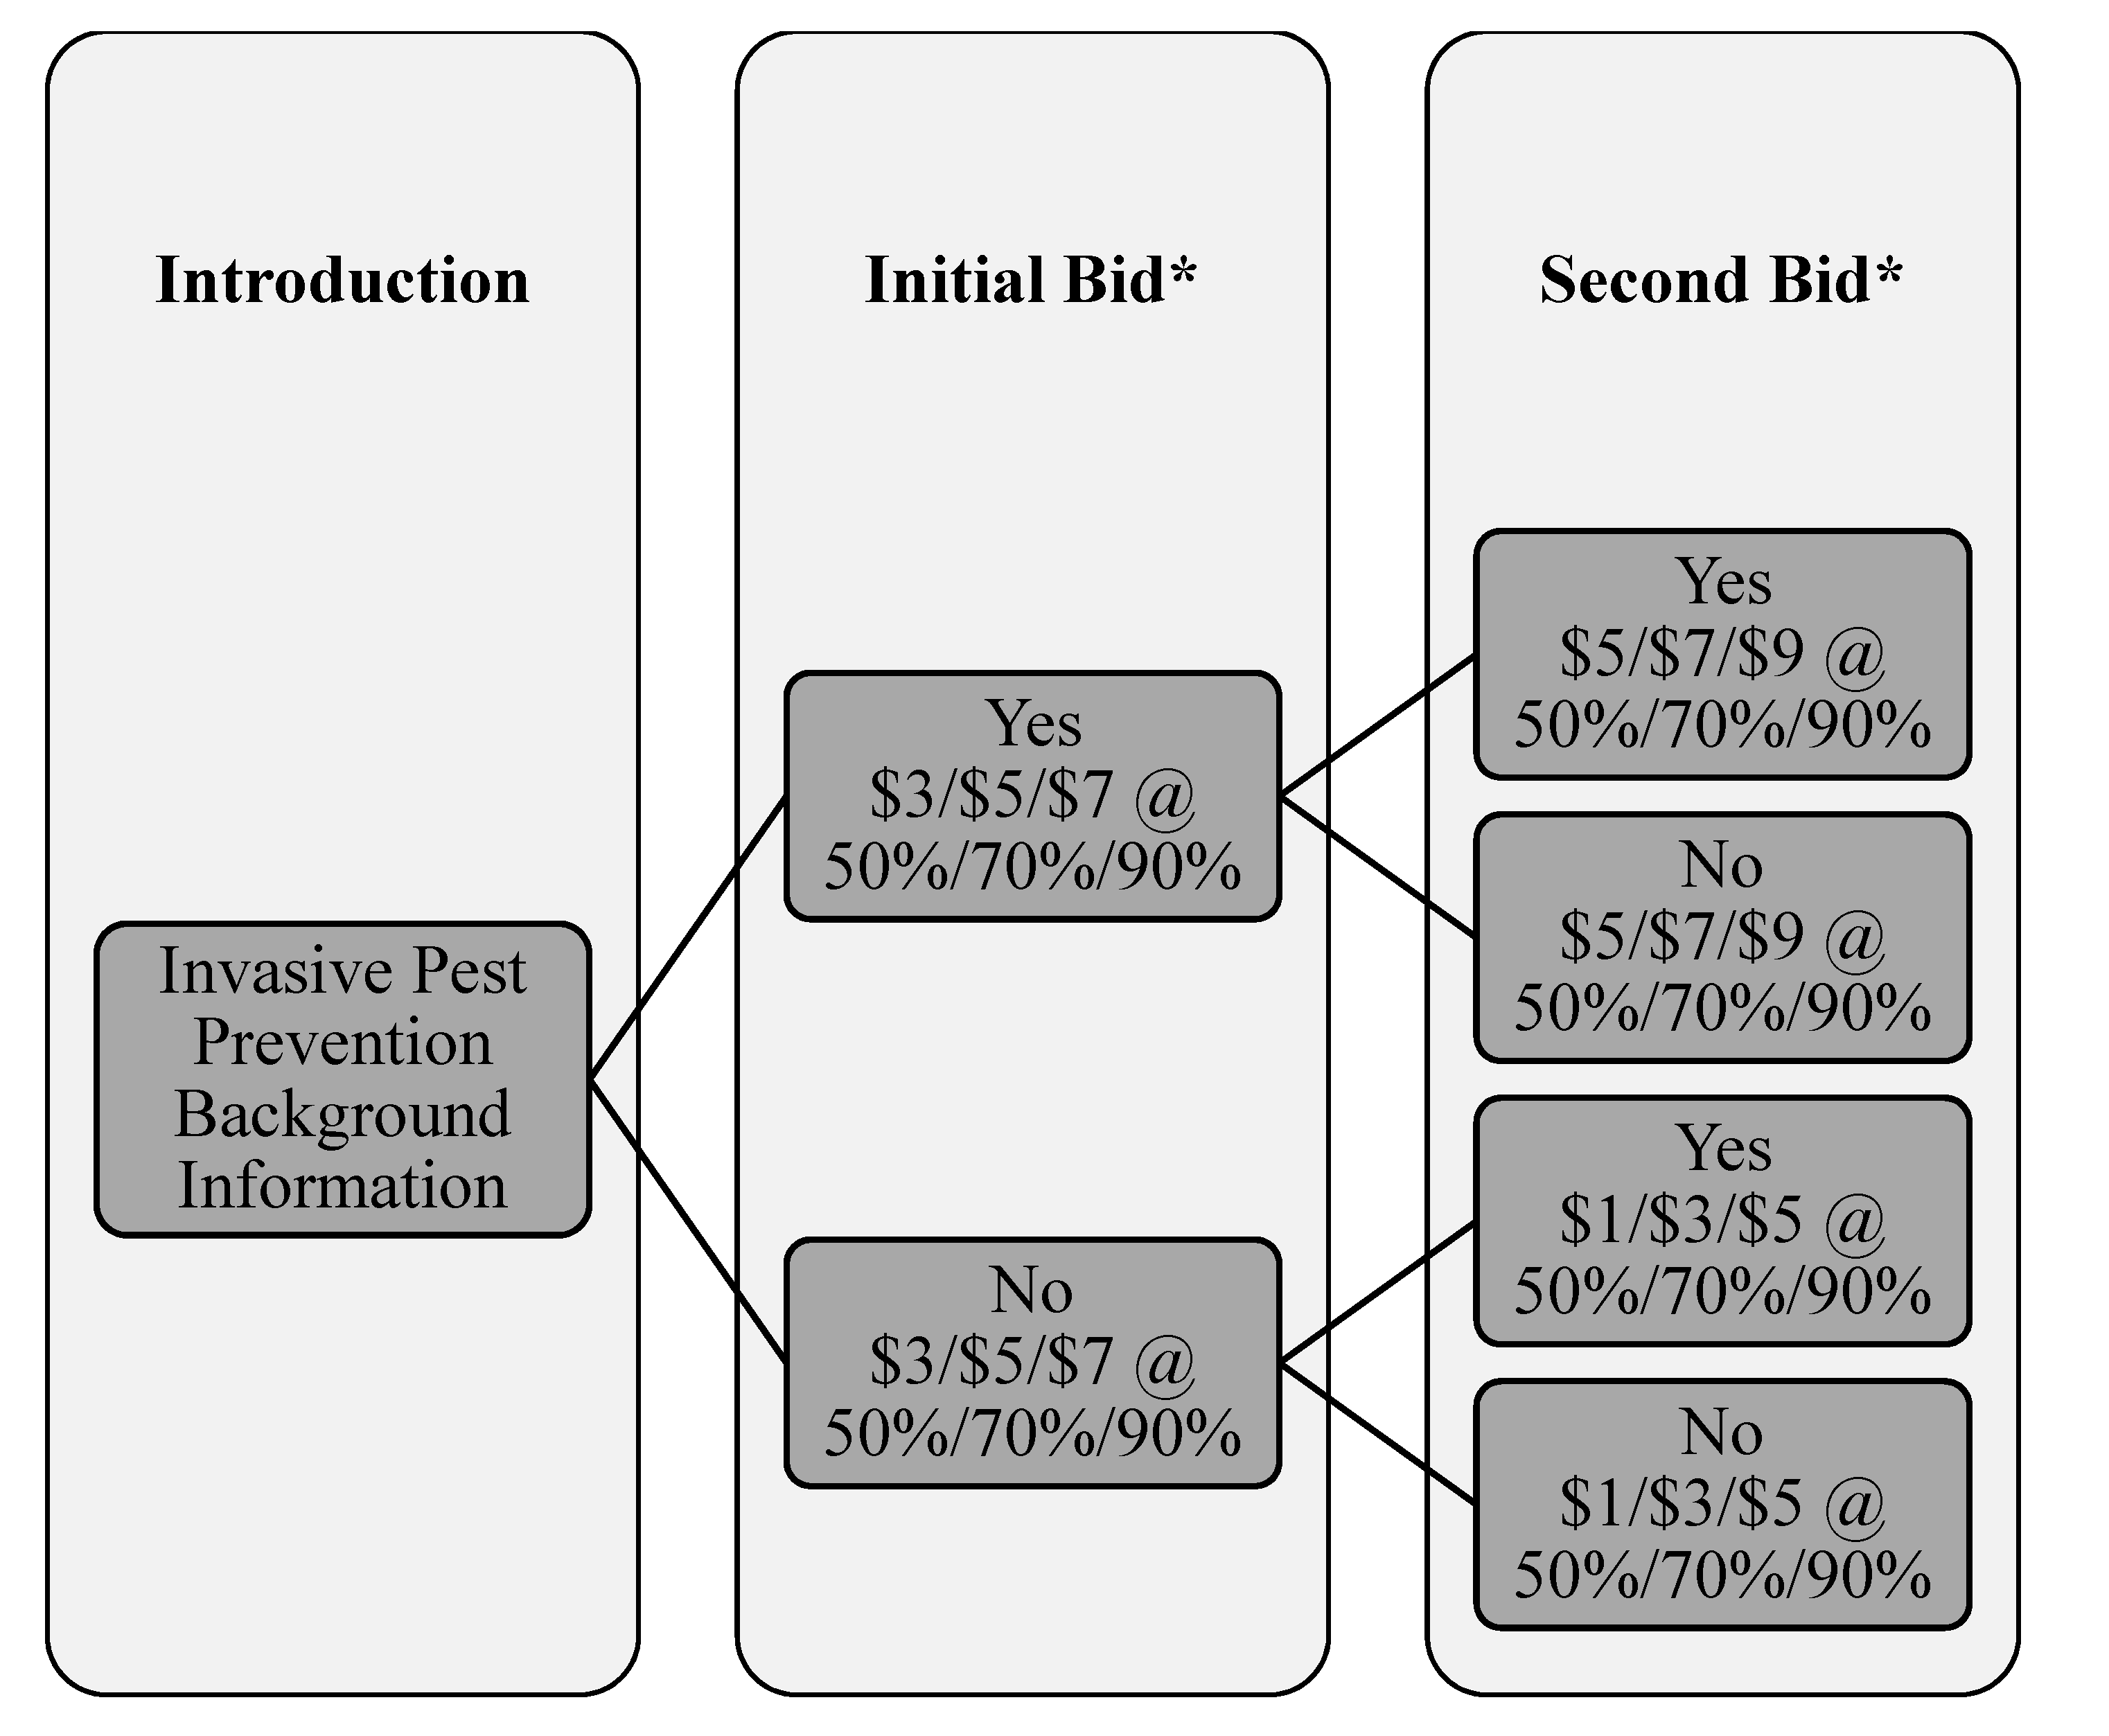
Following the standard practices of double-bounded contingent valuation (e.g., [55]), the respondents were shown two sequential bid questions—an initial bid (i.e., first bid), followed by a second bid that is lower or higher depending on the response to the initial bid. That is, the respondents were shown an initial monthly utility fee, fi, of $3, $5, or $7, and then asked to vote on the utility fee at a randomly provided invasion reduction level. If the initial fee that they were shown was voted for, then they were subsequently shown a second ballot initiative in which the monthly utility fee, fu, was higher by $2.00 (i.e., $5, $7, $9) at the same invasion reduction level as the initial bid. If, conversely, the respondent “votes against” the utility fee, then the respondent was subsequently shown a second ballot initiative in which the monthly utility fee, fd, was lower by $2.00 (i.e., $1, $3, $5) at the same invasion reduction level as the initial bid. The data from each of the individual choice tasks are comprised of two utility fee values, fi followed by fu or fd, and two bid outcomes (“Yes, Yes,” “Yes, No,” “No, Yes,” or “No, No”). Figure 1 shows a flow diagram of the decisions being made by each respondent. When the respondent answers “yes” to the first bid and “yes” to the second bid, then fu < WTP < ∞. When the respondent answers “yes” to the first bid and “no” to the second bid, then fi < WTP < fu. When the respondent answers “no” to the first bid and “yes” to the second bid, then fd < WTP < fi. When the respondent answers “no” to the first bid and “no” to the second bid, then 0 < WTP < fd.
The referendum format [56]—the double-bounded contingent valuation approach used in this analysis—is an improvement upon the single-bounded approach, where each respondent is only asked if they would vote for or against the initial bid and goes no further in eliciting information from the respondent [57]. Since a second bid was used to provide a boundary for the WTP values, more information was available than in the simpler format with only a single question—an advantage of traditional contingent valuation [55].
If we let c1 and c2 represent dichotomous variables for each response given by the respondent for the first and second question, respectively, then, for example, the probability that a respondent answers “yes” to the first question and “no” to the second question can be expressed as Pr(c1i = 1,c2i = 0|di) = Pr(yes, no|x). The WTP is estimated as the linear function WTPi(xi, ui) = xiβ + ui, where xi is a vector of explanatory variables, β is a vector of parameters, and ui is an error term that is assumed to be normally distributed with the mean, 0, and standard deviation σ2. Estimations for β and σ are directly obtained using a maximum likelihood function [57]. All the double-bound contingent valuation estimates using the data collected in the choice tasks were performed in STATA Version 14 using the doubleb command [57].
3. Results
3.1. Summary Statistics and Public Preferences
Table 1, Table 2 and Table 3 report the summary statistics for the demographics, perceptions, and other influencing factors thought to drive WTP; Table 4 explains how these data were coded for econometric model estimations. Table 1 shows the summary statistics of the respondent demographics. About two thirds of the respondents were male. Over 70% of the respondents were 54 years old or younger, with the largest age group being between 18 and 24 years. Approximately 41% of the respondents indicated an educational level of associate/technical degree, bachelor’s degree, or graduate degree. A majority of the respondents identified as white/Caucasian. The second largest group was black or African American, with a response rate of 15%. Overall, the demographics of the surveyed respondents fall within the line of the 2015 American Community Survey with the exception of gender. The sample is more representative of males than of females.
The information collected to understand the respondents’ perceptions of environmental issues shows that about 6 out of 10 respondents indicated that they were “extremely” or “very” concerned with water pollution (Table 2). With respect to invasive species, 50% were “extremely” or “very” concerned. Nearly three quarters of the respondents believed that the world’s climate is undergoing a change that is causing more extreme weather patterns and a rise in sea levels, while the remaining respondents “don’t know” (15%) or indicated “no” (11%). About 48% of the respondents believed this is solely due to “human activity,” 10% believe it is due to “natural changes in the environment,” 40% believe it is being caused by both, and the remaining respondents replied “don’t know.” Approximately 27% of the respondents indicated that they recycled less than half the time or not at all. The other 73% always recycle or recycle most of the time.
The majority of Florida residents sampled indicated that they were “very” or “extremely” willing to change their lifestyle to reduce the damage they cause to the environment (Table 3). About 38% of the respondents also found outdoor recreation personally “very” important. Nearly half of the respondents in the sample declared outdoor activities to be “somewhat” important. The remainder indicated that outdoor recreation was not important or didn’t know. The top three activities selected they were when asked if the respondent personally participated in any outdoor activities were “beach activities” (15%), “hiking or walking outdoors” (14%), and “wildlife viewing” (10%). A large proportion of the respondents indicated they agreed most with the Democrats about what the government should or should not do.
3.2. Willingness To Pay
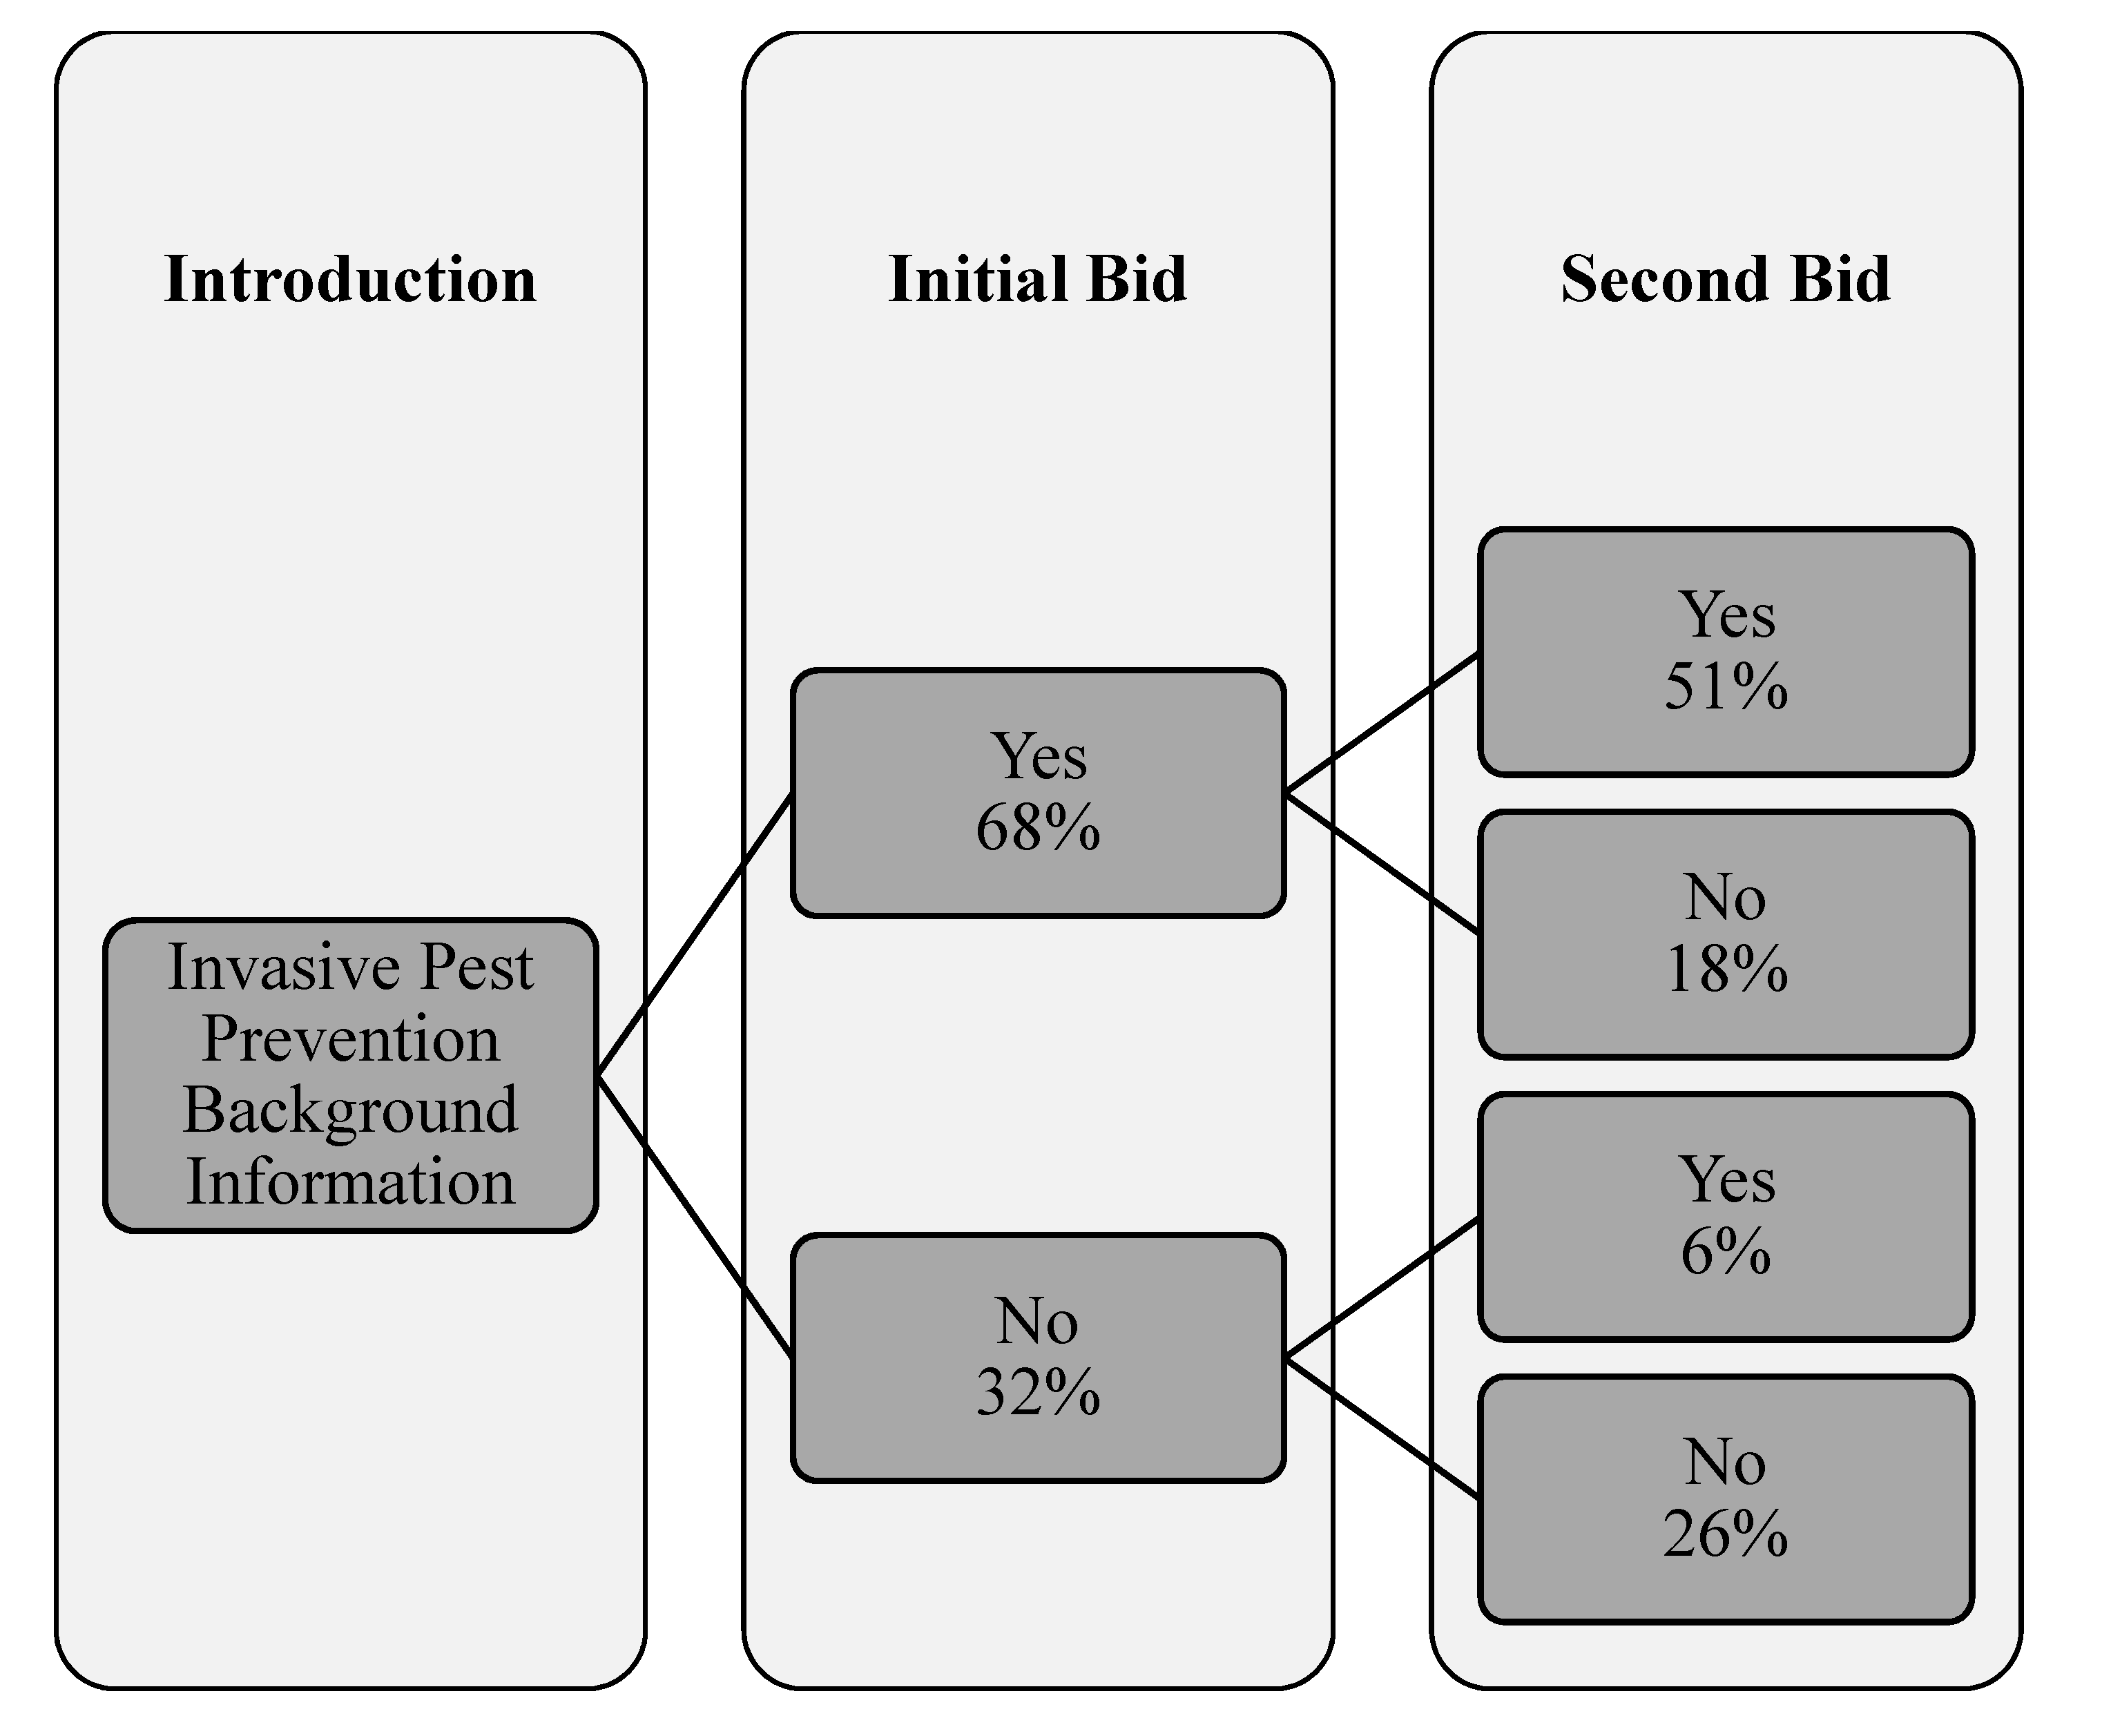
Initially, an estimation of the respondents’ WTP was estimated to serve as the base model for comparison. It also aids in the estimation procedure by serving as a seed starting point for follow-up estimations. Without controlling for demographics or environmental preferences, the Florida residents were found to be WTP $5.44, on average, as a monthly utility fee to support the implementation of a program to detect forest pests before they became a problem and monitor the introduction of forest pests. A naïve constant-only model found a mean WTP of $5.50. Indeed, the mean WTP was highly robust regardless of the model specification. See Table 5, which reports WTP estimates, including the confidence interval estimates of WTP at the 95% significance level. Figure 2 shows the breakdown of respondent percentages as they completed the choice task in the questionnaire. In the initial bid, 68% of the respondents would vote favorably towards a ballot initiative in support of the invasive pest prevention and early response program, and 32% would vote to reject the ballot. Of the former, roughly 51% voted in favor of an even higher bid, whereas ~26% of the respondents rejected both the initial and second bids. These results suggest that the respondents were diverse in their perspectives on forest pest prevention and alleviate concerns about bias in the response pool.
By accounting for demographic variables, the WTP changes only slightly. While demographic factors such as household annual income, education, and number of children in the household are statistically significant, the WTP for the average respondent was $5.49 for the monthly utility fee. Household income, education, number of children, and program effectiveness were found to influence the WTP for the monthly utility fee positively, consistent with other studies [58]. Program effectiveness had the greatest impact on the WTP, at nearly $8 on average, indicating that the respondents were sensitive to scope. Among the demographic factors, household annual income had the greatest impact on the WTP, at $1.17 to $1.25, depending on the model specification. The number of children and education level came in second and third, respectively.
With the inclusion of environmental perceptions, the WTP remains very stable at $5.44 for an average monthly utility. Program effectiveness, as measured by the percentage change in reduction in invasive pests by the implementation of the program, is still the main determinant of the WTP even when including several demographic and attitudinal factors. The environmental opinion factor regarding concern about invasive species in Florida also heavily impacts the average WTP. The more concerned a resident is about invasive species, the more they are WTP for the implementation of a prevention and monitoring program. The same can be said for the resident’s willingness to change their lifestyle, where the higher the willingness to change behavior, the greater the WTP. The ranking of impact on the WTP in this model remains the same as in the previous model with demographics. However, the variable representing the number of children in the household is not statistically significant. In both the demographic and environmental opinion models, the effectiveness of the program is an important aspect that consumers are mindful of and has the greatest impact on WTP.
4. Discussion
Forests and urban ecosystems both can act as hotspots of biological invasions that cause significant economic and ecological damage [59]. Both wildland and urban forest ecosystems are clearly presenting a new suite of challenges relating to the understanding and management of biological invasions. However, stakeholders in cities often have strongly divergent views on non-native species (invasive or not) for a wide range of reasons—aesthetic, culinary, or diverse cultural reasons [60]. It is, therefore, essential to understand the people’s perception and preferences for invasive forest pest species prevention in both urban and wildland areas. The results from this study indicate that the prevention of invasive forest pests is important to residents of the state of Florida, and, on average, they are willing to pay a small monthly fee to ensure that a program to protect the state’s forests through the early detection of forest pests is implemented. While the monthly sum that each household is willing to pay is relatively small (~$5.44), the aggregation of WTP across all Florida households would result in a substantial sum. In 2019, the state of Florida was estimated to have a total of 8,427,696 households [61], and therefore a simple extrapolation yields a total estimated WTP of $45.8 million per month to reduce the likelihood of forest pest invasions. Aggregated at the annual level, Floridians are willing to pay a substantial $550 million to reduce the chances that forest pest invasions occur. It is important to note that our models did not account for urban versus rural residents’ WTP for controlling invasive species in urban areas, which could differ significantly. However, Florida is a heavily urbanized state, with 96.6% of its population (20.8 mn of 21.48 mn total) living in urban areas [62]. Given that, even if assuming the WTP = 0 for rural residents, the overall estimate of the annual WTP is robust ($547 million).
When considered along with the avoided societal costs from invasive species, these results suggest that the policy intervention is economically feasible. It is unlikely that a prevention and monitoring program in Florida, such as the one outlined in the contingent valuation experiment, would cost as much as $550 million per year. Invasive species in urban areas can negatively affect ecosystem services [63], act as vectors of human and animal diseases [64,65], and increase wildfire risk [66]. McLean et al. [67] showed that small urban centers can act as source areas for invasions into peri-urban and natural/rural areas. Therefore, the cost of the surveillance and prevention of invasive pest in wildland and urban areas would be much lower than the cost of overcoming the consequences after invasion (e.g., Adams and Lee 2012 [68]).
Forest invasive pest management in wildland and urban areas present a diverse suite of challenges because of the diversity of public perceptions about the impacts of invasive species in urban areas and the range of different stakeholder interests [69,70]. Given the multitude of stakeholders in cities, conflicts over the management of invasive species can create intense and complex obstacles in appropriate policy interventions [70,71]. The design, implementation, and management of surveillance programs is a complex and costly endeavor [72]; the estimated WTP should greatly benefit the policy makers in designing pest prevention programs in Florida. Thus, it is clear that to some extent—at least in Florida—the life experience of survey participants may significantly condition their responses in assigning high/low values (e.g., the high WTP is partially the result of an educated public that can understand the connection between sampling programs and the prevention of negative and costly outcomes, such as forest pest invasions). This could indicate that consumers care about protecting the environment: not necessarily for future generations (e.g., bequest values) but because of Florida’s environment itself (e.g., existence values). Urban ecosystems are novel plant and faunal assemblages with altered biogeochemical cycles relative to less disturbed wildland ecosystems [73]. Hence, this information is crucial in determining trade-offs between the services and disservices of non-native plants, which often causes conflicts over whether to manage for the former or the latter [74].
Our findings suggest that residents in urban areas, especially those with a higher education and economic status, would support measures that protect their urban forests from invasive species infestations. This is consistent with findings that show public support for conservation policies and programs generally—for example, in Northern European cities, where forest conservation is driven demographically by a strong demand for both urban living and access to nature [75]. This finding has implications for policy design, specifically around “who should pay?”, including sensitivity to equity concerns and to the relative tax burdens on the poor [76].
An interesting question raised by the high WTP elicited by Floridians is: are they valuing the prevention program as a policy intervention (e.g., [40]), or are they expressing an aversion to the costs of forest pest invasions? In reality, the prevention of a forest pest invasion will be less costly than the ensuing outbreak [77]. Although we did not assess this, it is possible that individuals who have experienced the large-scale damage caused by a widespread biological invasion are likely to assign high values to these events, as it is the costs of prior outbreaks that serve as frames of reference. Conversely, it is possible that individuals who have not experienced these types of outbreaks in the past would be more likely to assign low values, as the cost of the surveillance program would serve as a frame of reference (e.g., [78]). While the survey included a question regarding concern for biological invasions, most if not all Floridians can be expected to be familiar with invasive species and their impacts. Future research replicating this experiment across other regions facing different invasion pressures would provide clearer insights on this point.
The contingent valuation method and stated preference methods in general have been criticized for their potential biases [79,80]. One of the potential limitations of the method include the possibility of protest bids, which may introduce bias. To minimize the effect of this bias and the problem of excessive zero bids or improbably large bids, open-ended questions were avoided [81] in the survey. Furthermore, the US National Oceanic & Atmospheric Administration’s Blue Ribbon Panel on Contingent Valuation (Arrow [56]) recommends providing respondents with the option to indicate that they “would not vote,” a recommendation that was implemented in the survey. Another recommendation involves asking follow-up questions, which is generally preferable to single-question contingent valuation [82], as the single-question format can introduce bias in estimates by introducing feelings of guilt or displeasure [55]. While our survey was designed with bias concerns in mind, the largest effect in our results was seen with respect to concern about invasive species (see Section 3.2). Without a diversity of responses on that item, it would not have been statistically significant. That result is encouraging, and alleviates some concern about a major bias issue. Indeed, 26% of respondents rejected both the first and second bids, so it would not be accurate to say that only the Florida residents interested in forest pest prevention provided full responses. However, we recognize the influence that bias can have on WTP and urge caution when interpreting the results. In the context of policy design, this WTP information can be very useful, but decisions made on economic criteria alone may fail along broader social goals (e.g., environmental and social), or may fail to meet the political or administrative criteria needed for policy success.
Another potential limitation of the method is the insensitivity of scope, where the respondents’ WTP does not change when the level or amount of the service provided changes [54]. However, the survey included several values of program effectiveness, and our results indicate that respondents are sensitive to the program’s scope, with a higher program effectiveness associated with a higher WTP. Therefore, the results of this study provide important insight into environmental protection policies.
5. Conclusions
Protecting Florida’s forests in wildland, wildland-urban interface, and urban areas is an important issue when dealing with invasive species, especially due the immense economic and ecosystem consequences. All consumers, regardless of whether or not they own land or property, are prone to the adverse effects of these consequences and are generally willing to pay for prevention measures. With respect to a monitoring and prevention program for invasive forest pests, consumers in Florida would support this program via monthly utility fee assessment. A number of demographic factors affect this amount, which includes household income, education, and whether a family has children. The expected effectiveness of the invasive species program, concern regarding invasive species, and propensity to change personal lifestyles also have an impact on the WTP for the program. For further research, a different approach using relatively recent advancements in choice behavior analysis through the use of choice experiments can be employed.
Author Contributions
D.C.A., J.R.S., J.L., S.A., and F.J.E. collaborated to conceptually develop the study, and on survey design and implementation. Data analysis was done primarily by J.L. and J.R.S. with assistance from co-authors. D.C.A., J.R.S., J.L., S.A., F.J.E. and A.S.M.G.K. contributed significantly to writing the manuscript. All authors have read and agreed to the published version of the manuscript.
Funding
This research was supported by US Department of Agriculture’s McIntire-Stennis program and the Institute of Food and Agricultural Sciences, University of Florida.
Conflicts of Interest
The authors declare no conflict of interest.
References
- Cartwell, C.G. Invasive Forest Pests; Nova Publishers: New York, NY, USA, 2007. [Google Scholar]
- Gordon, D.R. Effects of invasive, non-indigenous plant species on ecosystem processes: Lessons from Florida. Ecol. Appl. 1998, 8, 975–989. [Google Scholar] [CrossRef]
- Callaway, R.M.; Aschehoug, E.T. Invasive plants versus their new and old neighbors: A mechanism for exotic invasion. Science 2000, 290, 521–523. [Google Scholar] [CrossRef]
- Hiatt, D.; Serbesoff-King, K.; Lieurance, D.; Gordon, D.R.; Flory, S.L. Allocation of invasive plant management expenditures for conservation: Lessons from Florida, USA. Conserv. Sci. Pract. 2019, 1, e51. [Google Scholar] [CrossRef] [Green Version]
- Aizen, M.A.; Smith-Ramírez, C.; Morales, C.L.; Vieli, L.; Sáez, A.; Barahona-Segovia, R.M.; Arbetman, M.P.; Montalva, J.; Garibaldi, L.A.; Inouye, D.W.; et al. Coordinated species importation policies are needed to reduce serious invasions globally: The case of alien bumblebees in South America. J. Appl. Ecol. 2019, 56, 100–106. [Google Scholar] [CrossRef] [Green Version]
- Grady, M.J.; Harper, E.E.; Carlisle, K.M.; Ernst, K.H.; Shwiff, S.A. Assessing public support for restrictions on transport of invasive wild pigs (Sus scrofa) in the United States. J. Environ. Manag. 2019, 237, 488–494. [Google Scholar] [CrossRef] [Green Version]
- Pitts, M. Monarch Vegetation Management Plan; Oregon State University: Corvallis, OR, USA, 2014. [Google Scholar]
- Austin, D.F. Exotic plants and their effects in southeastern Florida. Environ. Conserv. 1978, 5, 25–34. [Google Scholar] [CrossRef]
- Aukema, J.E.; Leung, B.; Kovacs, K.; Chivers, C.; Britton, K.O.; Englin, J.; Frankel, S.J.; Haight, R.G.; Holmes, T.P.; Liebhold, A.M.; et al. Economic Impacts of Non-Native Forest Insects in the Continental United States. PLoS ONE 2011, 6, e24587. [Google Scholar] [CrossRef] [PubMed]
- Li, X.; Holmes, T.P.; Boyle, K.J.; Crocker, E.V.; Nelson, C.D. Hedonic Analysis of Forest Pest Invasion: The Case of Emerald Ash Borer. Forests 2019, 10, 820. [Google Scholar] [CrossRef] [Green Version]
- Mack, R.N.; Simberloff, D.; Mark Lonsdale, W.; Evans, H.; Clout, M.; Bazzaz, F.A. Biotic invasions: Causes, epidemiology, global consequences, and control. Ecol. Appl. 2000, 10, 689–710. [Google Scholar] [CrossRef]
- Costello, C.; McAusland, C. Protectionism, trade, and measures of damage from exotic species introductions. Am. J. Agric. Econ. 2003, 85, 964–975. [Google Scholar] [CrossRef]
- Margolis, M.; Shogren, J.F.; Fischer, C. How trade politics affect invasive species control. Ecol. Econ. 2005, 52, 305–313. [Google Scholar] [CrossRef] [Green Version]
- Pimentel, D.; McNair, S.; Janecka, J.; Wightman, J.; Simmonds, C.; O’connell, C.; Wong, E.; Russel, L.; Zern, J.; Aquino, T. Economic and environmental threats of alien plant, animal, and microbe invasions. Agric. Ecosyst. Environ. 2001, 84, 1–20. [Google Scholar] [CrossRef]
- Borchert, D.; Brightwell, J.; Magarey, R. Revised State Comparative Risk Ranking; Department of Agriculture, Animal and Plant Health Inspection Service, Plant Protection and Quarantine: Raleigh, NC, USA, 2013. [Google Scholar]
- Evans, E.A.; Crane, J.; Hodges, A.; Osborne, J.L. Potential economic impact of laurel wilt disease on the Florida avocado industry. HortTechnology 2010, 20, 234–238. [Google Scholar] [CrossRef] [Green Version]
- Centner, T.J.; Alvey, J.C.; Stelzleni, A.M. Beta agonists in livestock feed: Status, health concerns, and international trade. J. Anim. Sci. 2014, 92, 4234–4240. [Google Scholar] [CrossRef]
- Pimentel, D. Invasive plants: Their role in species extinctions and economic losses to agriculture in the USA. In Management of Invasive Weeds; Springer: Berlin/Heidelberg, Germany, 2009; pp. 1–7. [Google Scholar]
- Divate, N.; Solis, D.; Thomas, M.; Alvarez, S.; Harding, D. An Economic Analysis of the Impact of Cogongrass among Non-Industrial Private Forest Landowners in Florida. For. Sci. 2016, 63, 201–208. [Google Scholar] [CrossRef] [Green Version]
- Alvarez, S. Potential economic costs of invasive structural pests: Conehead termites, Nasutitermes corniger, in Florida. J. Environ. Plan. Manag. 2016, 59, 2145–2162. [Google Scholar] [CrossRef]
- Holmes, T.P.; Aukema, J.E.; Von Holle, B.; Liebhold, A.; Sills, E. Economic impacts of invasive species in forests. Ann. N. Y. Acad. Sci. 2009, 1162, 18–38. [Google Scholar] [CrossRef]
- Holmes, T.P.; Murphy, E.A.; Bell, K.P. Exotic forest insects and residential property values. Agric. Resour. Econ. Rev. 2006, 35, 155–166. [Google Scholar] [CrossRef] [Green Version]
- Payne, B.R.; White, W.B.; McCay, R.E.; McNichols, R.R. Economic analysis of the gypsy moth problem in the northeast: II. applied to residential property. Res. Pap. NE-285. Up. Darby, PA US Dep. Agric. For. Serv. Northeast. For. Exp. Stn. 1973, 285, 6. [Google Scholar]
- Sander, H.; Polasky, S.; Haight, R.G. The value of urban tree cover: A hedonic property price model in Ramsey and Dakota Counties, Minnesota, USA. Ecol. Econ. 2010, 69, 1646–1656. [Google Scholar] [CrossRef]
- Dwyer, J.F.; McPherson, E.G.; Schroeder, H.W.; Rowntree, R.A. Assessing the benefits and costs of the urban forest. J. Arboric. 1992, 18, 227. [Google Scholar]
- Sailor, D.J. Simulated urban climate response to modifications in surface albedo and vegetative cover. J. Appl. Meteorol. 1995, 34, 1694–1704. [Google Scholar] [CrossRef] [Green Version]
- Laverne, R.J.; Lewis, G.M. The effect of vegetation on residential energy use in Ann Arbor, Michigan. J. Arboric. 1996, 22, 234–243. [Google Scholar]
- Mepherson, E.G. Air pollution uptake by sacramento’s urban forest. J. Arboric. 1998, 24, 6–9. [Google Scholar]
- Simpson, J.R. Urban forest impacts on regional cooling and heating energy use: Sacramento County case study. J. Arboric. 1998, 24, 201–214. [Google Scholar]
- Simpson, J.R.; McPherson, E.G. Potential of tree shade for reducing residential energy use in California. J. Arboric. 1996, 22, 10–18. [Google Scholar]
- McPherson, G.; Simpson, J.R.; Peper, P.J.; Maco, S.E.; Xiao, Q. Municipal forest benefits and costs in five US cities. J. For. 2005, 103, 411–416. [Google Scholar]
- Nowak, D.J.; Crane, D.E.; Stevens, J.C. Air pollution removal by urban trees and shrubs in the United States. Urban For. Urban Green. 2006, 4, 115–123. [Google Scholar] [CrossRef]
- Kovacs, K.F.; Haight, R.G.; McCullough, D.G.; Mercader, R.J.; Siegert, N.W.; Liebhold, A.M. Cost of potential emerald ash borer damage in US communities, 2009–2019. Ecol. Econ. 2010, 69, 569–578. [Google Scholar] [CrossRef]
- Lodge, D.M.; Williams, S.; MacIsaac, H.J.; Hayes, K.R.; Leung, B.; Reichard, S.; Mack, R.N.; Moyle, P.B.; Smith, M.; Andow, D.A. Biological invasions: Recommendations for US policy and management. Ecol. Appl. 2006, 16, 2035–2054. [Google Scholar] [CrossRef] [Green Version]
- Liebhold, A.M.; MacDonald, W.L.; Bergdahl, D.; Mastro, V.C. Invasion by exotic forest pests: A threat to forest ecosystems. For. Sci. 1995, 41, a0001–z0001. [Google Scholar] [CrossRef] [Green Version]
- Byers, J.E.; Reichard, S.; Randall, J.M.; Parker, I.M.; Smith, C.S.; Lonsdale, W.M.; Atkinson, I.A.E.; Seastedt, T.R.; Williamson, M.; Chornesky, E. Directing research to reduce the impacts of nonindigenous species. Conserv. Biol. 2002, 16, 630–640. [Google Scholar] [CrossRef] [Green Version]
- Alvarez, S.; Solis, D. Rapid response lowers eradication costs of invasive species: Evidence from Florida. Choices 2018, 33, 1–9. Available online: file:///C:/Users/MDPI/AppData/Local/Temp/cmsarticle_662.pdf (accessed on 26 August 2020).
- Solomon, B.D.; Johnson, N.H. Valuing climate protection through willingness to pay for biomass ethanol. Ecol. Econ. 2009, 68, 2137–2144. [Google Scholar] [CrossRef]
- Bowman, T.; Thompson, J.; Colletti, J. Valuation of open space and conservation features in residential subdivisions. J. Environ. Manag. 2009, 90, 321–330. [Google Scholar] [CrossRef]
- Kreye, M.M.; Adams, D.C.; Escobedo, F.J.; Soto, J.R. Does policy process influence public values for forest-water resource protection in Florida? Ecol. Econ. 2016, 129, 122–131. [Google Scholar] [CrossRef] [Green Version]
- Kreye, M.M.; Adams, D.C.; Escobedo, F.J. The value of forest conservation for water quality protection. Forests 2014, 5, 862–884. [Google Scholar] [CrossRef] [Green Version]
- Sheremet, O.; Healey, J.R.; Quine, C.P.; Hanley, N. Public Preferences and Willingness to Pay for Forest Disease Control in the UK. J. Agric. Econ. 2017, 68, 781–800. [Google Scholar] [CrossRef]
- Jetter, K.; Paine, T.D. Consumer preferences and willingness to pay for biological control in the urban landscape. Biol. Control 2004, 30, 312–322. [Google Scholar] [CrossRef]
- Soto, J.R.; Escobedo, F.J.; Khachatryan, H.; Adams, D.C. Consumer demand for urban forest ecosystem services and disservices: Examining trade-offs using choice experiments and best-worst scaling. Ecosyst. Serv. 2018, 29, 31–39. [Google Scholar] [CrossRef]
- Nowak, D.J.; Dwyer, J.F. Understanding the benefits and costs of urban forest ecosystems. In Urban and Community Forestry in the Northeast; Springer: Dordrecht, The Netherlands, 2007; pp. 25–46. [Google Scholar]
- Branco, M.; Nunes, P.; Roques, A.; Fernandes, M.R.; Orazio, C.; Jactel, H. Urban trees facilitate the establishment of non-native forest insects. NeoBiota 2019, 52. [Google Scholar] [CrossRef] [Green Version]
- Crutchfield, S.R.; Cooper, J.C.; Hellerstein, D. The Benefits of Safer Drinking Water: The Value of Nitrate Reduction. Econ. Res. Serv. Agric. Econ. Rep. 1997, 62. [Google Scholar]
- Wang, H.; Shi, Y.; Kim, Y.; Kamata, T. Valuing water quality improvement in China: A case study of Lake Puzhehei in Yunnan Province. Ecol. Econ. 2013, 94, 56–65. [Google Scholar] [CrossRef] [Green Version]
- Bigerna, S.; Polinori, P. Italian households׳ willingness to pay for green electricity. Renew. Sustain. Energy Rev. 2014, 34, 110–121. [Google Scholar] [CrossRef]
- Akcura, E. Mandatory versus voluntary payment for green electricity. Ecol. Econ. 2015, 116, 84–94. [Google Scholar] [CrossRef]
- Georgiou, I.; Areal, F.J. Economic valuation of an offshore wind farm in Greece: The role of individual׳ s base-state influences and beliefs in the value formation process. Renew. Sustain. Energy Rev. 2015, 52, 717–724. [Google Scholar] [CrossRef] [Green Version]
- Carson, R.T.; Mitchell, R.C.; Hanemann, M.; Kopp, R.J.; Presser, S.; Ruud, P.A. Contingent Valuation and Lost Passive Use: Damages from the Exxon Valdez Oil Spill. Environ. Resour. Econ. 2003, 25, 257–286. [Google Scholar] [CrossRef]
- Adhikari, D.; Thacher, J.A.; Chermak, J.M.; Berrens, R.P. Linking Forest to Faucets in a Distant Municipal Area: Public Support for Forest Restoration and Water Security in Albuquerque, New Mexico. Water Econ. Policy 2016, 3, 1650019. [Google Scholar] [CrossRef]
- Carson, R.T. Contingent valuation surveys and tests of insensitivity to scope. In Determining the Value of Non-Marketed Goods; Springer: Berlin/Heidelberg, Germany, 1997; pp. 127–163. [Google Scholar]
- Watson, V.; Ryan, M. Exploring preference anomalies in double bounded contingent valuation. J. Health Econ. 2007, 26, 463–482. [Google Scholar] [CrossRef]
- Arrow, K.; Solow, R.; Portney, P.R.; Leamer, E.E.; Radner, R.; Schuman, H. Report of the NOAA panel on contingent valuation. Fed. Regist. 1993, 58, 4601–4614. [Google Scholar]
- Lopez-Feldman, A. Introduction to Contingent Valuation Using Stata; MPRA: Munich, Germany, 2012. [Google Scholar]
- Adams, D.C.; Bucaram, S.; Lee, D.J.; Hodges, A. Public preferences and values for management of aquatic invasive plants in state parks. Lake and Reservoir Mgt. 2010, 26, 185–193. [Google Scholar] [CrossRef]
- Paap, T.; Burgess, T.I.; Wingfield, M.J. Urban trees: Bridge-heads for forest pest invasions and sentinels for early detection. Biol. Invasions 2017, 19, 3515–3526. [Google Scholar] [CrossRef] [Green Version]
- Colla, S.R.; MacIvor, J.S. Questioning public perception, conservation policy, and recovery actions for honeybees in North America. Conserv. Biol. 2017, 31, 1202–1204. [Google Scholar] [CrossRef] [PubMed]
- Rayer, S.; Wang, Y.; Doty, R.; Roulston-Doty, S.; Smith, K.S. Households and Average Household Size in Florida; Bureau of Economic and Business Research, University of Florida Gainesville: Gainesville, FL, USA, 2019; Volume 53. [Google Scholar]
- USDA Economic Research Service. State Facts Sheets: Florida Population, Income, Food Insecurity, Education, and Employment. Available online: https://data.ers.usda.gov/reports.aspx?StateFIPS=12&StateName=Florida&ID=17854 (accessed on 26 August 2020).
- Charles, H.; Dukes, J.S. Impacts of Invasive Species on Ecosystem Services. In Biological Invasions; Nentwig, W., Ed.; Springer: Berlin/Heidelberg, Germany, 2007; pp. 217–237. [Google Scholar] [CrossRef] [Green Version]
- Eritja, R.; Escosa, R.; Lucientes, J.; Marques, E.; Roiz, D.; Ruiz, S. Worldwide invasion of vector mosquitoes: Present European distribution and challenges for Spain. Biol. Invasions 2005, 7, 87. [Google Scholar] [CrossRef]
- Juliano, S.A.; Lounibos, L.P. Ecology of invasive mosquitoes: Effects on resident species and on human health. Ecol. Lett. 2005, 8, 558–574. [Google Scholar] [CrossRef] [Green Version]
- Donovan, G.H.; Brown, T.C. Be careful what you wish for: The legacy of Smokey Bear. Front. Ecol. Environ. 2007, 5, 73–79. [Google Scholar] [CrossRef] [Green Version]
- McLean, P.; Gallien, L.; Wilson, J.R.U.; Gaertner, M.; Richardson, D.M. Small urban centres as launching sites for plant invasions in natural areas: Insights from South Africa. Biol. Invasions 2017, 19, 3541–3555. [Google Scholar] [CrossRef]
- Adams, D.C.; Lee, D.J. Technology Adoption and Mitigation of Invasive Species Damage and Risk: Application to Zebra Mussels. J. Bioeconomics 2012, 14, 21–40. [Google Scholar] [CrossRef]
- Dodds, K.J.; Orwig, D.A. An invasive urban forest pest invades natural environments—Asian longhorned beetle in northeastern US hardwood forests. Can. J. For. Res. 2011, 41, 1729–1742. [Google Scholar] [CrossRef] [Green Version]
- Dickie, I.A.; Bennett, B.M.; Burrows, L.E.; Nuñez, M.A.; Peltzer, D.A.; Porté, A.; Richardson, D.M.; Rejmánek, M.; Rundel, P.W.; van Wilgen, B.W. Conflicting values: Ecosystem services and invasive tree management. Biol. Invasions 2014, 16, 705–719. [Google Scholar] [CrossRef]
- Crowley, S.L.; Hinchliffe, S.; McDonald, R.A. Conflict in invasive species management. Front. Ecol. Environ. 2017, 15, 133–141. [Google Scholar] [CrossRef] [Green Version]
- Kovacs, K.F.; Haight, R.G.; Mercader, R.J.; McCullough, D.G. A bioeconomic analysis of an emerald ash borer invasion of an urban forest with multiple jurisdictions. Resour. Energy Econ. 2014, 36, 270–289. [Google Scholar] [CrossRef]
- Francis, R.A.; Chadwick, M.A. Urban invasions: Non-native and invasive species in cities. Geography 2015, 100, 144. [Google Scholar] [CrossRef]
- Vaz, A.S.; Kueffer, C.; Kull, C.A.; Richardson, D.M.; Vicente, J.R.; Kühn, I.; Schröter, M.; Hauck, J.; Bonn, A.; Honrado, J.P. Integrating ecosystem services and disservices: Insights from plant invasions. Ecosyst. Serv. 2017, 23, 94–107. [Google Scholar] [CrossRef] [Green Version]
- Kabisch, N.; Strohbach, M.; Haase, D.; Kronenberg, J. Urban green space availability in European cities. Ecol. Indic. 2016, 70, 586–596. [Google Scholar] [CrossRef]
- Yaghi, A.; Alibeli, M. Theoretical and empirical analysis of citizens’ willingness to pay: Ethical and policy implications for the environment in the United Arab Emirates. Public Integr. 2017, 19, 41–57. [Google Scholar] [CrossRef]
- Alvarez, S.; Solís, D. Rapid Response Lowers Eradication Costs of Invasive Species. Choices 2018, 33, 1–9. Available online: https://www.jstor.org/stable/26758654?seq=1, (accessed on 26 August 2020).
- Adams, D.C.; Bwenge, A.N.; Lee, D.J.; Larkin, S.L.; Alavalapati, J.R. Public preferences for controlling upland invasive plants in state parks: Application of a choice model. For. Policy Econ. 2011, 13, 465–472. [Google Scholar] [CrossRef]
- Haab, T.C.; Interis, M.G.; Petrolia, D.R.; Whitehead, J.C. From hopeless to curious? Thoughts on Hausman’s “dubious to hopeless” critique of contingent valuation. Appl. Econ. Perspect. Policy 2013, 35, 593–612. [Google Scholar] [CrossRef] [Green Version]
- Kling, C.L.; Phaneuf, D.J.; Zhao, J. From Exxon to BP: Has some number become better than no number? J. Econ. Perspect. 2012, 26, 3–26. [Google Scholar] [CrossRef] [Green Version]
- Haddad, B.; Howarth, R. Protest bids, commensurability, and substitution: Contingent valuation and ecological economics. In Handbook on Contingent Valuation; Alberini, A., Kahn, J.R., Eds.; Edward Elgar Publishing: Northampton, MA, USA, 2006; pp. 133–152. [Google Scholar]
- Hanemann, M.; Loomis, J.; Kanninen, B. Statistical efficiency of double-bounded dichotomous choice contingent valuation. Am. J. Agric. Econ. 1991, 73, 1255–1263. [Google Scholar] [CrossRef]
Figure 1.
Double-bounded contingent valuation flow diagram (note: * non-voters were omitted).

Figure 2.
Response rates for the initial and second bids.


Table 1.
Summary statistics of the respondents.
| Demographic | Response Rate (%) | 2015 American Community Survey (%) | |
|---|---|---|---|
| Gender | |||
| Female | 64 | 48 | |
| Male | 36 | 52 | |
| Age | |||
| 18–24 years | 27 | 14 | |
| 25–34 years | 17 | 17 | |
| 35–44 years | 15 | 16 | |
| 45–54 years | 12 | 17 | |
| 55–64 years | 13 | 16 | |
| 65 years and over | 16 | 19 | |
| Household’s Annual Income | |||
| Less than $25,000 | 30 | 26 | |
| $25,000–$49,000 | 28 | 27 | |
| $50,000–$99,999 | 27 | 29 | |
| $100,000–199,999 | 11 | 15 | |
| $200,000 or More | 4 | 4 | |
| Education | |||
| Less than 12th grade | 10 | 13 | |
| High school graduate or GED | 23 | 28 | |
| Some college | 26 | 23 | |
| Associate or technical degree | 11 | 13 | |
| Bachelor’s degree | 20 | 15 | |
| Graduate degree | 10 | 8 | |
| Ethnicity | |||
| White/Caucasian | 67 | 76 | |
| Black or African American | 15 | 16 | |
| American Indian or Alaska Native | 1 | 0 | |
| Asian | 4 | 3 | |
| Native Hawaiian or Other Pacific Islander | 0 | 0 | |
| From multiple races | 6 | 3 | |
| Other | 7 | 2 | |
Table 2.
Perceptions concerning key environmental and invasive species issues in Florida.
| Environmental Issue | Response Rate (%) | |
|---|---|---|
| Water Pollution Concern | ||
| Extremely | 33 | |
| Very | 28 | |
| Moderately | 28 | |
| Slightly | 7 | |
| Not at all | 4 | |
| Invasive Species Concern | ||
| Extremely | 23 | |
| Very | 27 | |
| Moderately | 35 | |
| Slightly | 9 | |
| Not at all | 6 | |
| Climate Change | ||
| Yes, this is happening | 74 | |
| No, is not happening | 11 | |
| Don’t know | 15 | |
| Cause of Climate Change | ||
| Human activity | 48 | |
| Natural changes in the environment | 10 | |
| Both equally of the above | 40 | |
| Don’t know | 3 | |
| Recycle | ||
| Always | 36 | |
| Most of the time | 37 | |
| About half the time | 14 | |
| Once in a while | 9 | |
| Never | 4 | |
Table 3.
Personal influencing factors.
| Personal Preferences | Response Rate (%) | |
|---|---|---|
| Lifestyle Change | ||
| Extremely willing | 26 | |
| Very willing | 37 | |
| Moderately willing | 30 | |
| Slightly willing | 6 | |
| Not at all willing | 2 | |
| Outdoor Recreation | ||
| Very important | 38 | |
| Somewhat important | 47 | |
| Not at all important | 14 | |
| Don’t know | 1 | |
| Activities | ||
| Wildlife viewing | 10 | |
| Hiking or walking outdoors | 14 | |
| Horseback riding | 2 | |
| Camping | 5 | |
| Visiting historical or archaeological sites | 6 | |
| Geocaching | 1 | |
| Canoeing or kayaking | 4 | |
| Hunting | 2 | |
| Sport shooting | 2 | |
| Off-road vehicle driving | 2 | |
| Fishing | 8 | |
| Beach activities | 15 | |
| Bicycling | 8 | |
| Swimming in public pools | 9 | |
| Golf | 3 | |
| Outdoor team sports | 4 | |
| Other | 4 | |
| Political Agreement | ||
| Republicans | 24 | |
| Democrats | 42 | |
| Independents | 26 | |
| Other | 8 | |
Table 4.
Variables and Coded Values.
| Variable | Coding | Definition |
|---|---|---|
| Program Effectiveness | 1 | 50% |
| 2 | 70% | |
| 3 | 90% | |
| Household Income | 1 | Less than $25,000 |
| 2 | $25,000–$49,999 | |
| 3 | $50,000–$99,999 | |
| 4 | $100,000–$199,999 | |
| 5 | $200,000 or more | |
| Education | 1 | Less than 12th grade |
| 2 | High school graduate or GED | |
| 3 | Some college | |
| 4 | Associate or technical degree | |
| 5 | Bachelor’s degree | |
| 6 | Graduate degree | |
| Children | 1 | None |
| 2 | 1 child | |
| 3 | 2 children | |
| 4 | 3 children | |
| 5 | 4 children | |
| 6 | More than 4 children | |
| Invasive Species | 1 | Extremely concerned |
| 2 | Very concerned | |
| 3 | Moderately concerned | |
| 4 | Slightly concerned | |
| 5 | Not at all concerned | |
| Change Lifestyle | 1 | Extremely willing |
| 2 | Very willing | |
| 3 | Moderately willing | |
| 4 | Slightly willing | |
| 5 | Not at all willing |
Table 5.
Double-bound contingent valuation estimations.
| Constant Only | Effectiveness | Demographics | Environment Opinions | |||||
|---|---|---|---|---|---|---|---|---|
| Coef. (Std. Err.) | 95% C.I. | Coef. (Std. Err.) | 95% C.I. | Coef. (Std. Err.) | 95% C.I. | Coef. (Std. Err.) | 95% C.I. | |
| Constant | $5.50 | [$4.70, $6.30] | $0.05 | [$−3.55, $3.65] | −$6.55 | [−$11.08, −$2.03] | $5.16 | [$0.30, $10.02] |
| (0.41) | (1.84) | (2.31) | (2.48) | |||||
| Effectiveness | $7.78 | [$2.80, $12.76] | $7.93 | [$3.03, $12.83] | $6.62 | [$1.92, $11.31] | ||
| (2.54) | (2.50) | (2.40) | ||||||
| Household Income | $1.17 | [$0.37, $1.97] | $1.25 | [$0.48, $2.02] | ||||
| (0.41) | (0.39) | |||||||
| Education | $0.64 | [$0.07, $1.20] | $0.48 | [−$0.06, $1.02] | ||||
| (0.29) | (0.28) | |||||||
| Children | $1.01 | [$0.15, $1.88] | $0.56 | [−$0.28, $1.39] | ||||
| (0.4428) | (0.43) | |||||||
| Invasive Species | −$2.63 | [−$3.43, −$1.83] | ||||||
| (0.41) | ||||||||
| Change Lifestyle | −$1.46 | [−$2.32, −$0.60] | ||||||
| (0.44) | ||||||||
| Mean WTP (US $) | $5.50 | [$4.70, $6.30] | $5.44 | [$1.96, $8.93] | $5.49 | [$4.71, $6.27] | $5.44 | [$4.69, $6.20] |
© 2020 by the authors. Licensee MDPI, Basel, Switzerland. This article is an open access article distributed under the terms and conditions of the Creative Commons Attribution (CC BY) license (http://creativecommons.org/licenses/by/4.0/).
Share and Cite
MDPI and ACS Style
Adams, D.C.; Soto, J.R.; Lai, J.; Escobedo, F.J.; Alvarez, S.; Kibria, A.S.M.G. Public Preferences and Willingness to Pay for Invasive Forest Pest Prevention Programs in Urban Areas. Forests 2020, 11, 1056. https://doi.org/10.3390/f11101056
AMA Style
Adams DC, Soto JR, Lai J, Escobedo FJ, Alvarez S, Kibria ASMG. Public Preferences and Willingness to Pay for Invasive Forest Pest Prevention Programs in Urban Areas. Forests. 2020; 11(10):1056. https://doi.org/10.3390/f11101056
Chicago/Turabian StyleAdams, Damian C., José R. Soto, John Lai, Francisco J. Escobedo, Sergio Alvarez, and Abu S.M.G. Kibria. 2020. "Public Preferences and Willingness to Pay for Invasive Forest Pest Prevention Programs in Urban Areas" Forests 11, no. 10: 1056. https://doi.org/10.3390/f11101056
Note that from the first issue of 2016, this journal uses article numbers instead of page numbers. See further details here.