Proceeding Paper

An Urban Water Simulation Model for the Design, Testing and Economic Viability Assessment of Distributed Water Management Systems for a Circular Economy †

Department of Water Resources and Environmental Engineering, School of Civil Engineering, National Technical University of Athens, Heroon Polytechneiou 5, Zografou, 15780 Athens, Greece
*
Author to whom correspondence should be addressed.
Presented at the 4th EWaS International Conference: Valuing the Water, Carbon, Ecological Footprints of Human Activities, Online, 24–27 June 2020.
Environ. Sci. Proc. 2020, 2(1), 14; https://doi.org/10.3390/environsciproc2020002014
Published: 11 August 2020

Abstract

:
The concept of Circular Economy, although not entirely new, has in recent years gained traction due to growing concern with regards to the Earth’s natural reserves. In this context, Sewer Mining, a wastewater management method based on extracting wastewater from local sewers for reuse applications, presents an interesting option that lies in the interplay between reuse at a household scale and centralized reuse at a wastewater treatment plant. As part of the EU-funded program NextGenWater, a new unit is being prepared for operation in Athens’s Plant Nursery, in Goudi. This paper examines the water flow within the proposed installation, using the Urban Water Optioneering Tool (UWOT). Further research is focused on the economic viability of Sewer Mining and the proposed investment. The results produced are promising regarding Sewer Mining’s capabilities and benefits, as well as its future prospects, in the hopes that this technology can provide an attractive alternative to conventional water sources within the urban water cycle.

1. Introduction

Climate Change, increasing world population and rapid urbanization create a stranglehold on the environment and the natural resources [1]. Over the past five decades, the global population has doubled, extraction of materials has tripled and gross domestic product has quadrupled. A scenario developed by the IRP (International Resource Panel) shows that, unless a fundamental shift occurs, resource use will continue to grow (up to 190 billion tons), greenhouse gas emissions will increase by 43% and water withdrawals will increase up to 100% from 2010’s levels by 2060 [2]. These environmental pressures have led to an increased interest in alternative solutions, so as to reduce global waste and resource usage. Thus, the transition from the current economic model of a Linear Economy, where resource is converted into waste via production, to the Circular Economy model has gained traction towards Sustainability.

1.1. Circular Economy and Water

The concept of Circular Economy has deep roots and its origins cannot be traced back to a specific individual or essay. Simmonds [3], R.W Hofman [4] and K. Boulding [5] are just some of the people credited with developing the first definition of the concept. Circular Economy is based around two cycles which represent types of nutrients: the biological cycle and the technical cycle. All products are designed in such a way that once they are no longer used, their nutrients can safely re-enter either the biological or/and the technical cycle [6].
Within the context of the water cycle some measures that can be implemented, based on the principles of the model are as follows:
Avoid water use: Redesigning products and services and eliminating inefficient practices;
Reduce water use: Improving the efficiency of the water systems and the distribution of the resource;
Reuse: Keeping water either within one system (closed loop), or redirecting it for use in other systems o communities;
Recycle: In external systems, or/and external practices;
Replenish natural reserves: Safely and efficiently returning water to the natural basins (rivers, lakes, oceans).

1.2. The Case of Sewer Mining

Water reuse in particular is a concept that is gaining traction, and is considered an innovative way to address water scarcity [7]. Within the context of the urban water cycle, water reuse translates mainly into using treated wastewater (a waste) to supply (as a resource) a usually non-potable water use, such as irrigation, industrial use, urban use (non-potable), replenishing the aquifers or surface water bodies among others [8]. Recently decentralized technologies have emerged as options, that can be installed in situ, and therefore are closer to the circular economy concept. The latest wastewater recycling invention called Sewer Mining is gradually increasing in popularity due to its high treatment efficiency and the limited space required for installation [9]. A pilot Sewer Mining Unit is already in use in EYDAP’s (Athens’s Water Supply and Sewage Company) Research and Development facilities (KEREFYT) in Athens as part of the EU-funded program DESSIN and a new set-up for the city’s Plant Nursery consists of a SM Unit that aims to reduce the cost for irrigation water and promote sustainable technologies.

2. Materials and Methods

2.1. Case Study: Athens’s Plant Nursery

The Nursery is located in the Goudi region of Athens. It covers an area of approximately 96 acres, 40 of which are used in the production, development and maintenance of the plants while the rest are used for general purposes such us the administration buildings and offices. The Nursery’s water needs for the irrigation of the plants are currently being met by potable water that is supplied through the city’s main water system. According to data acquired from the Nursery, peak mean daily consumption (for example in summer) is estimated at 250 m3/day, while the yearly consumption is around 62.250 m3. This results in a significant yearly cost for the supply of the water that reaches 72.750 EUR/year.
The proposed set-up consists of a Sewer Mining Unit that produces water form treated wastewater extracted from the local sewers, compost form the sludge that is the byproduct of the treatment process and recovers energy with the use of heat pumps for technology processes, heating, etc. (Figure 1).
The unit is similar in form to the already operational pilot unit at KEREFYT (EYDAP), but employs MBR and UV radiation technologies for water disinfection. Capacity is at 25 m3/day, and according to the results of the assessment of the operational unit, the effluent presents high-quality characteristics that meet the water quality requirements for reclaimed water, as dictated by the Greek legislation (JMD 145116/2011).

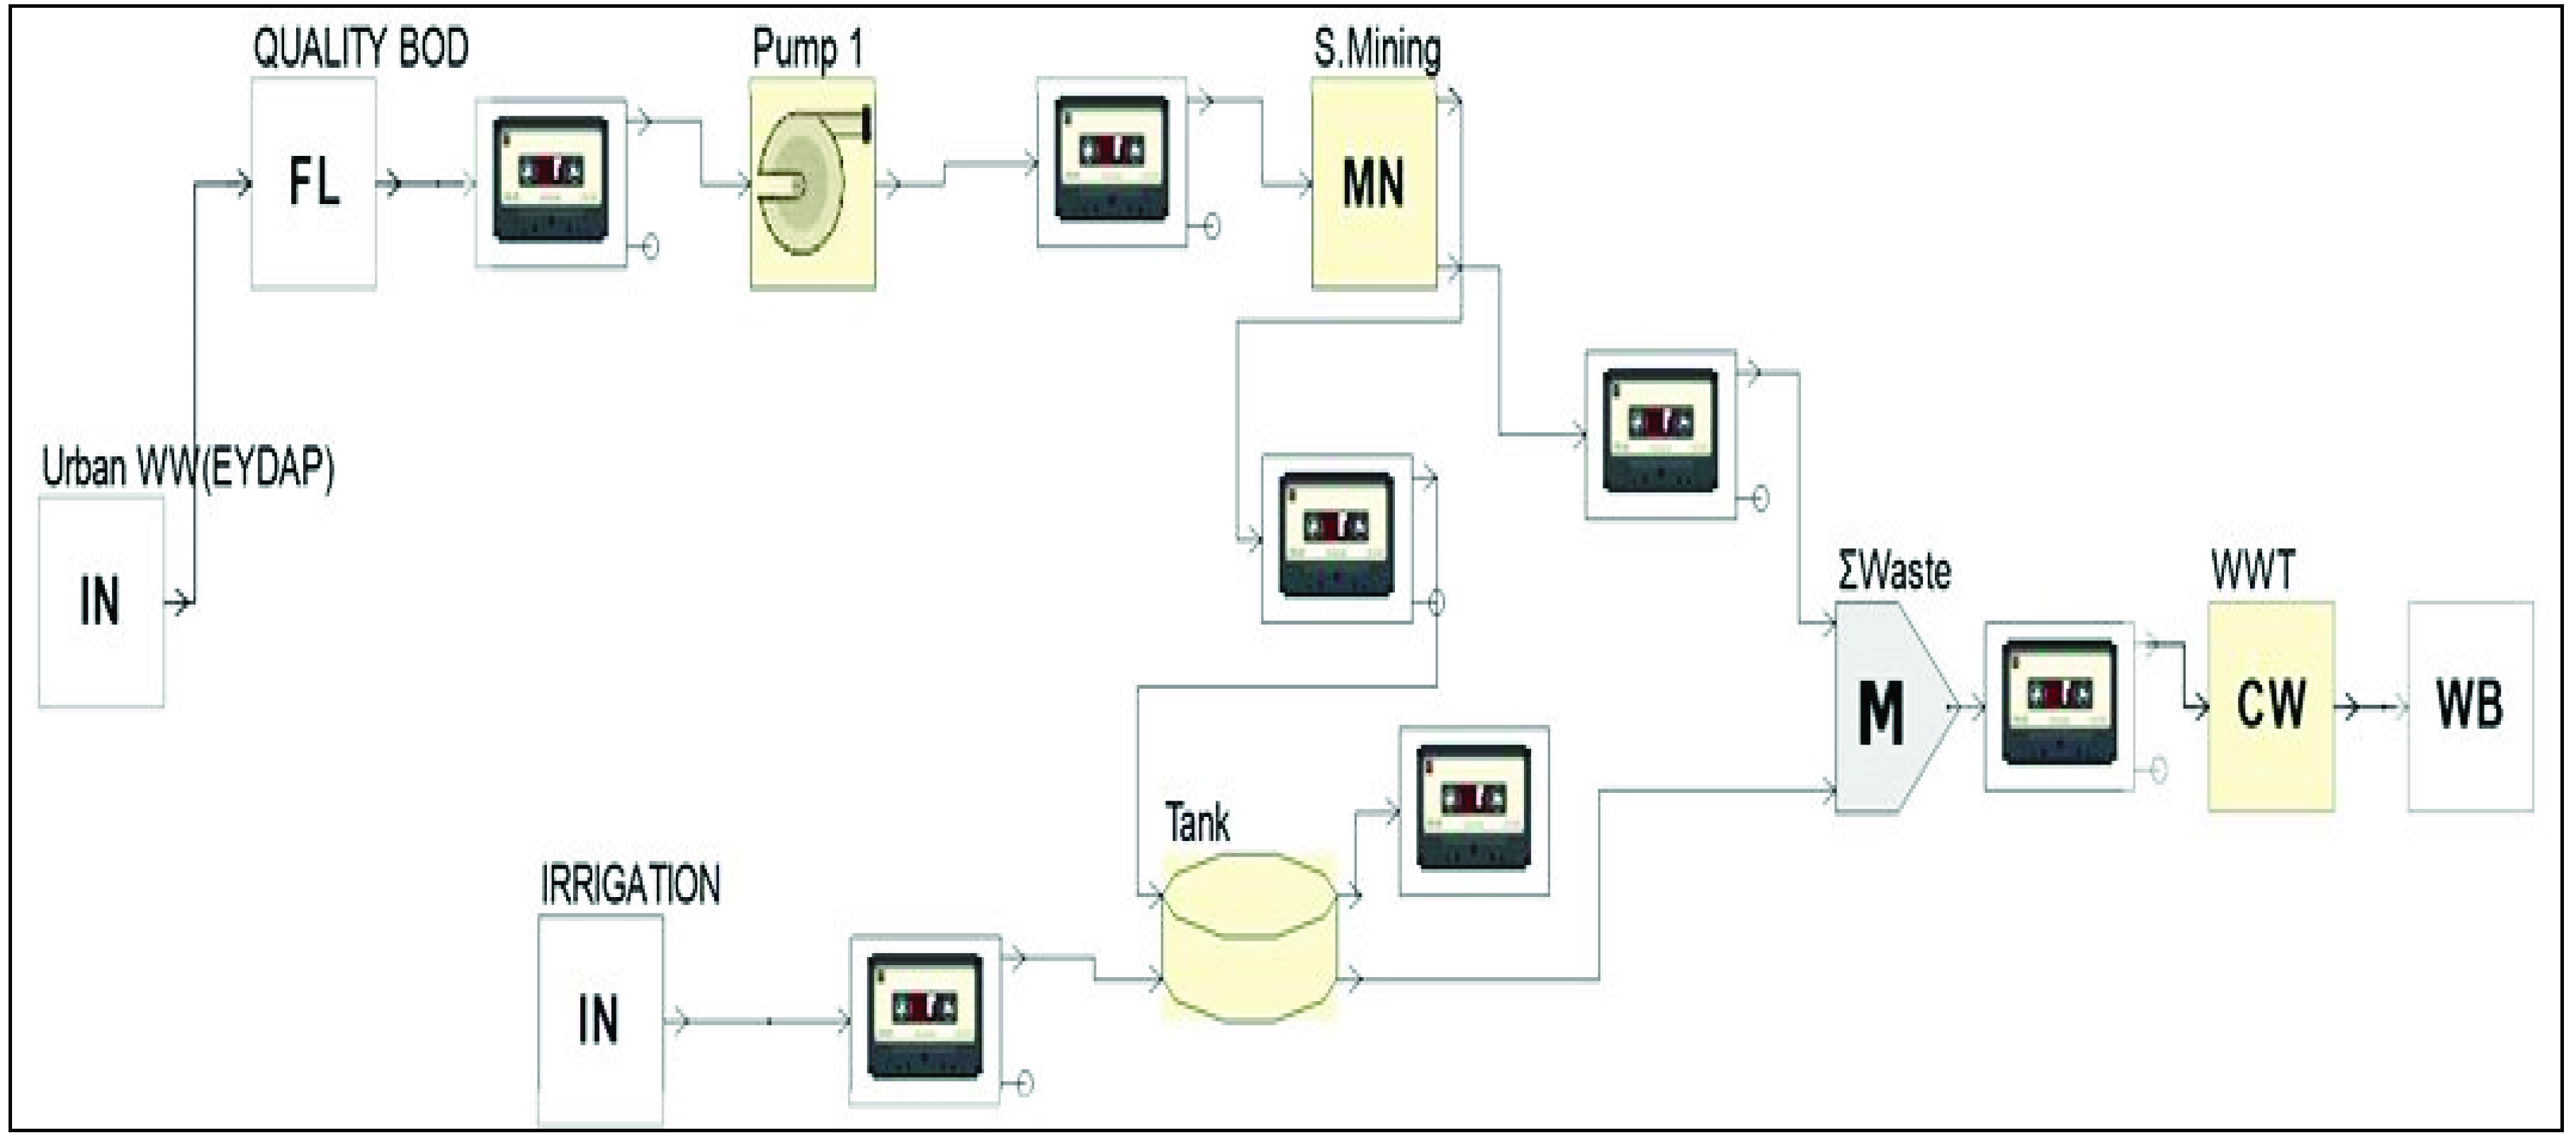
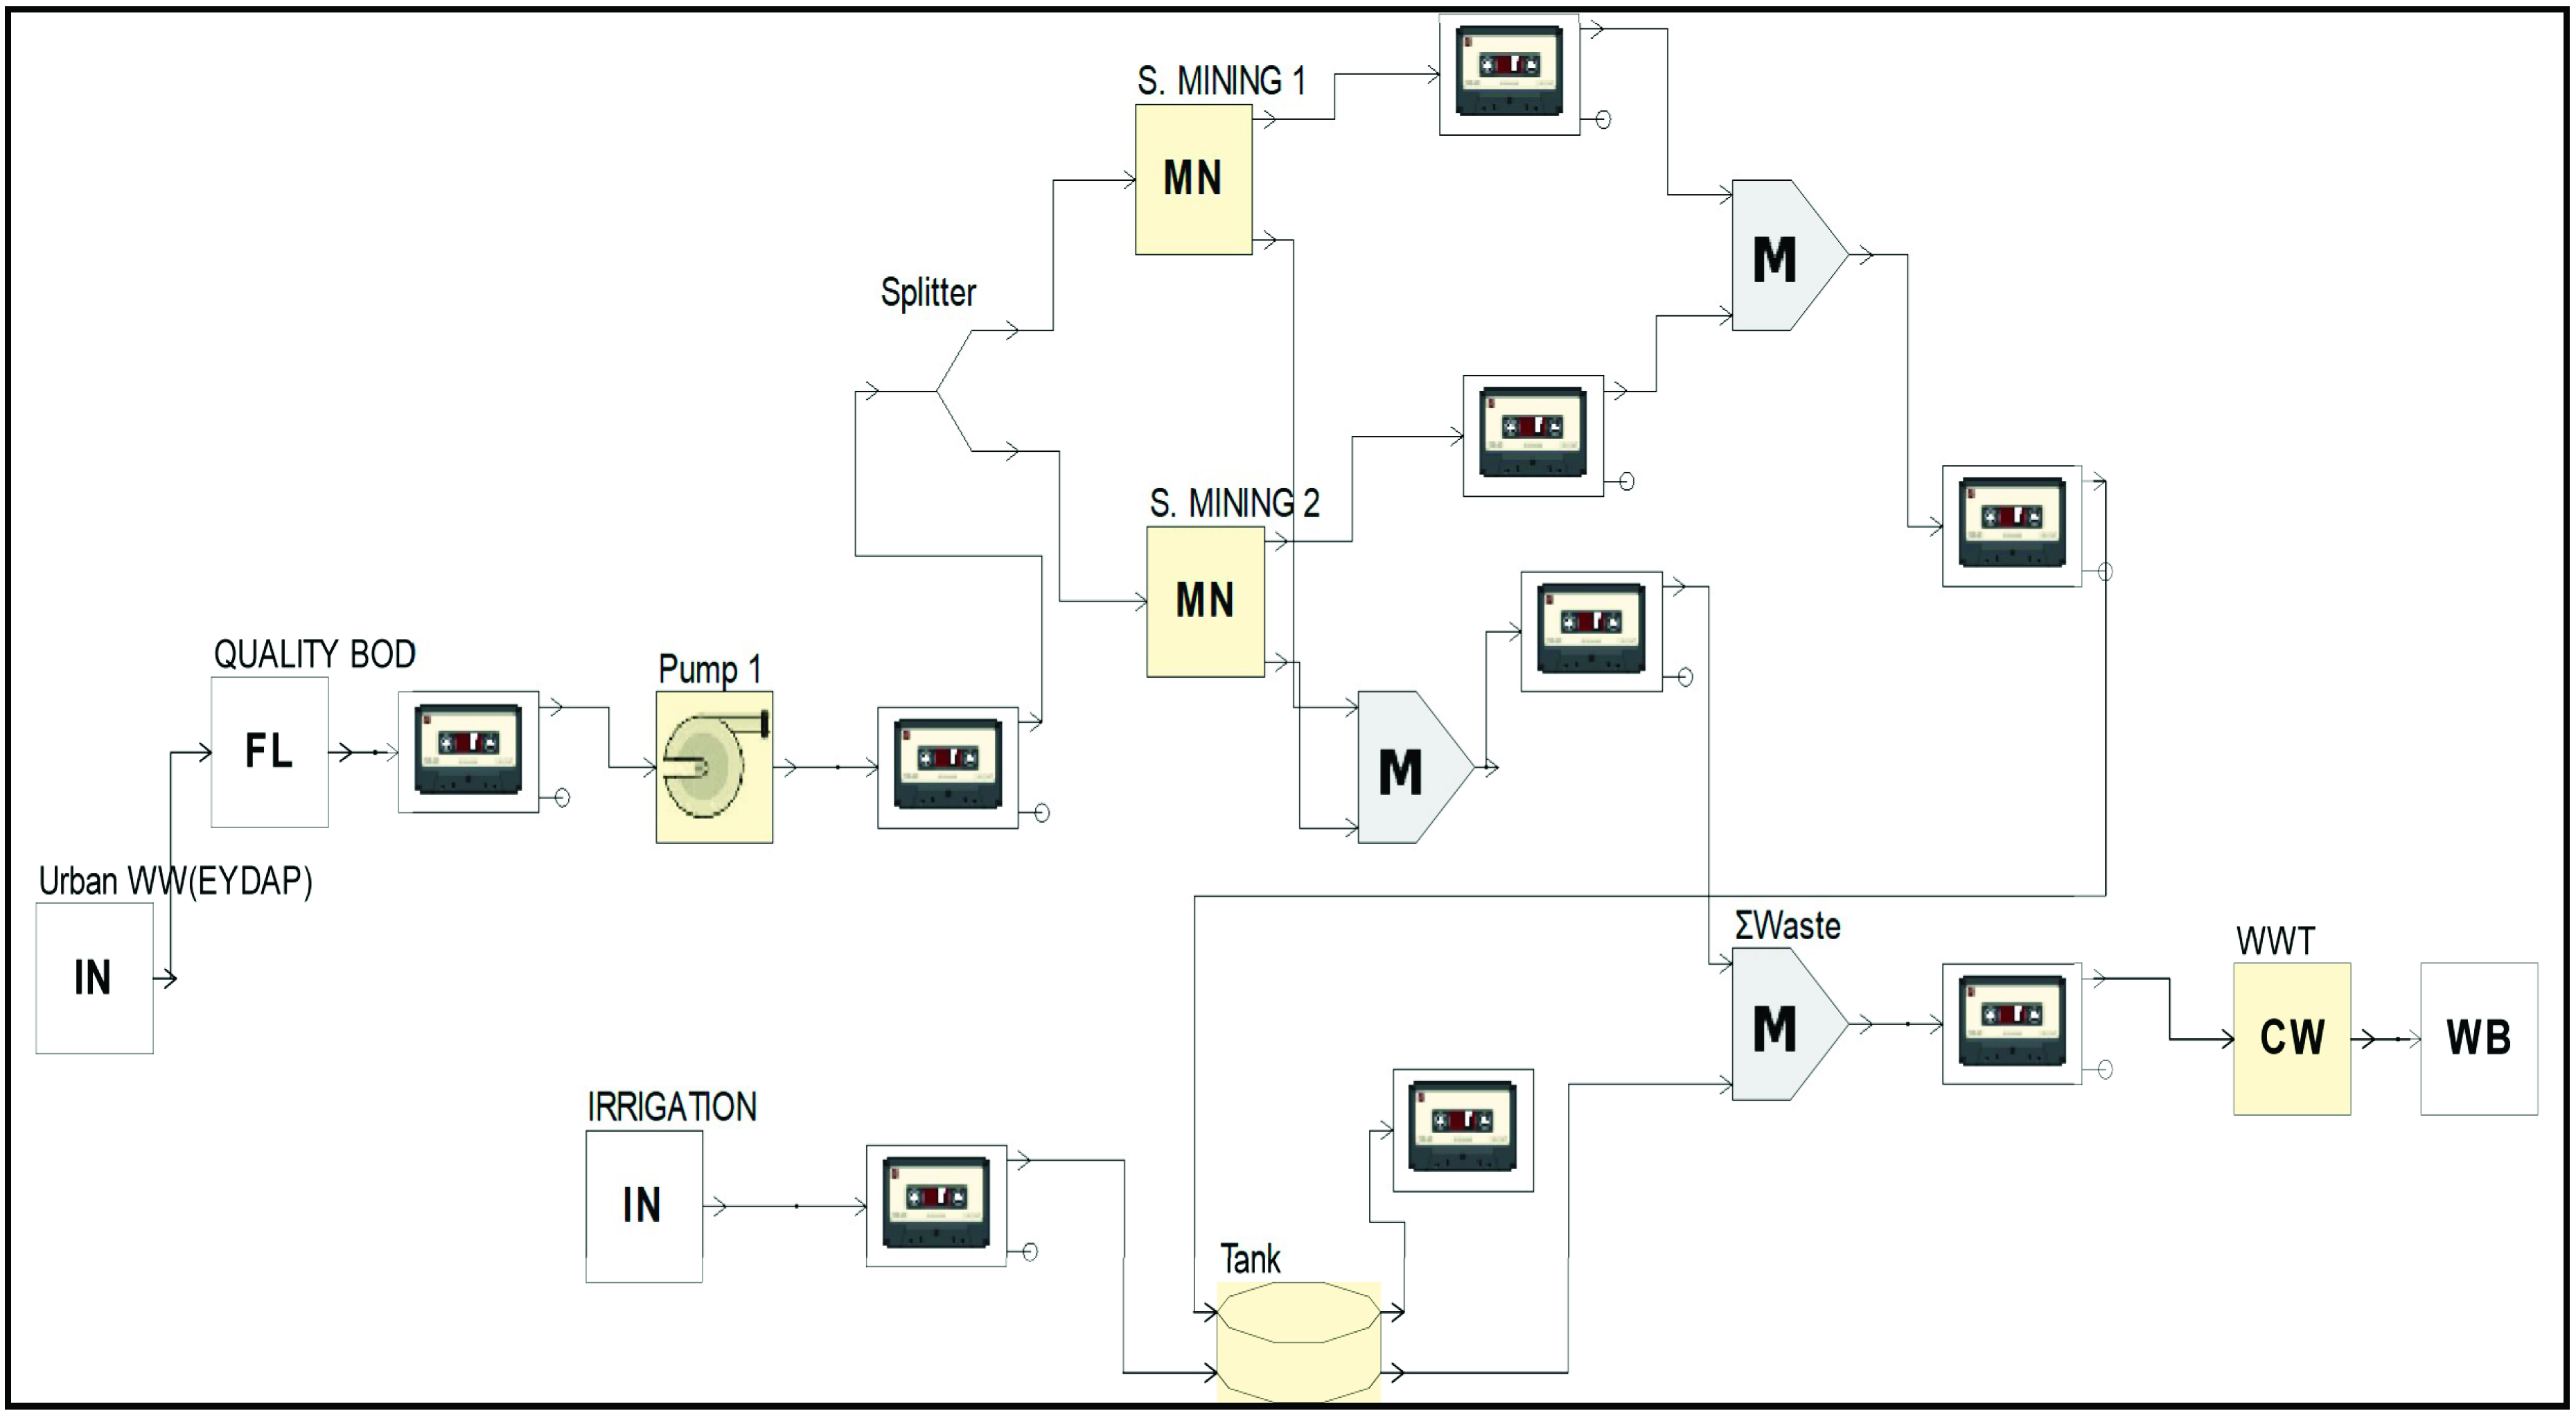
2.2. Modelling the Water Cycle in UWOT

UWOT is a decision support tool that supports the design of the complete (integrated) urban water cycle and helps to achieve sustainable water management for new and existing urban areas [10,11]. In the context of this study, the Urban Water Optioneering Tool (UWOT) is used to assess the water flows of the Sewer Mining set-up in the Nursery.
Sample testing was performed during the period of August–October 2018 for the assessment of the inflow’s quality. The statistical characteristics for the BOD (Biological Oxygen Demand) of the inflow are shown in Table 1.
Figure 1. Diagram of the processes in the Nursery’s Sewer Mining set-up.
Environsciproc 02 00014 g001
Additionally, data concerning the wastewater supply as well as the mean daily and yearly water consumption in the Nursery were provided by EYDAP. Furthermore, monthly timeseries for rainfall and mean temperature for the 2006–2018 period (13 years) were acquired through the meteorological station in National Technical University of Athens’s campus in Zografou, Greece.
An important parameter in the pre-processing stage was the estimation of the water demands that would be used as an input in UWOT. For that purpose, it was first necessary to calculate the evapotranspiration using the Blaney–Criddle method, the time series for the rainfall and the temperature and taking into account two different scenarios regarding the types of plant in the Nursery: clover and fruit-bearing trees. With the aforementioned data, the water needs were estimated for the period 2006–2018 and the timeseries that was selected was the one referring to the fruit-bearing trees, as the results were closer to the data provided by the Nursery in regards to their water usage. UWOT was used in the next stage of the study to simulate two different set-ups: the first consists of a single SM Unit (Figure 2) and the second consists of two SM Units working in parallel (Figure 3).

2.3. Economic Analysis and Investment Assesment

The last part of this study consists of an economic evaluation of the technology and the proposed Nursery scheme. The evaluation is based mainly on the Net Present Value criterion as well as the Internal Rate of Return criterion in some cases. The first part of the evaluation refers solely to the Sewer Mining technology (not in regards to the Nursery set-up) and three different scenarios are evaluated: one SM Unit, two SM Units and seven SM Units. In the second part, the evaluation refers to the complete proposed investment in the Plant Nursery and four scenarios are evaluated: investment of one unit, investment of two units, investment of seven units and finally no Sewer Mining investment (current situation). In this case, apart from the costs assessed in the first part, the cost for water consumption from the main water system is also taken into consideration.

3. Results and Discussion

3.1. Simulation Results

The simulation was performed using a monthly time step from 1 January 2006 to 1 December 2018. UWOT calculated the quantity and the quality (BOD concentration) of the water flows within the water system. The water flows simulated include the flow of wastewater, the reclaimed water, the water from system and the returning flow from the Sewer Mining unit back to the sewers. The results for the quality of the reclaimed water in both set-ups can be seen in Table 2.
It is notable that in both setups the BOD concentrations calculated are well below the limit values of <10 mg/L imposed by the Greek legislation.
The evaluation of the results for the simulated water quantities is not particularly easy due to lack of comparable data. For this reason, broad data provided by the Nursery are used to estimate the quality of the results. The Nursery claims that mean daily consumption during peak season is 250 m3/day and as a result the reclaimed water (25 m3/day) can meet about 10% of those needs. Unfortunately, it provides no data for monthly consumption and as a result the monthly demand fluctuation is unknown. With the assumption that 250 m3/day is the daily consumption, the monthly consumption is estimated at 7,500 m3/day. We compare this figure with the maximum monthly water demands that are estimated in UWOT.
The results of the simulation are comparable with the provided data, both as far as peak water demand and yearly mean demand is concerned. In fact, the simulation estimated that yearly water demand ranges from 13,414.19 to 28,292.23 m3/year while the data from the Nursery calculated yearly water demand at 62,250 m3/year. This is perfectly reasonable if we take into account that this number is not referring solely to irrigation needs but the complete water needs of the Nursery (drinking needs, toilet water, water for vehicle washing etc.).

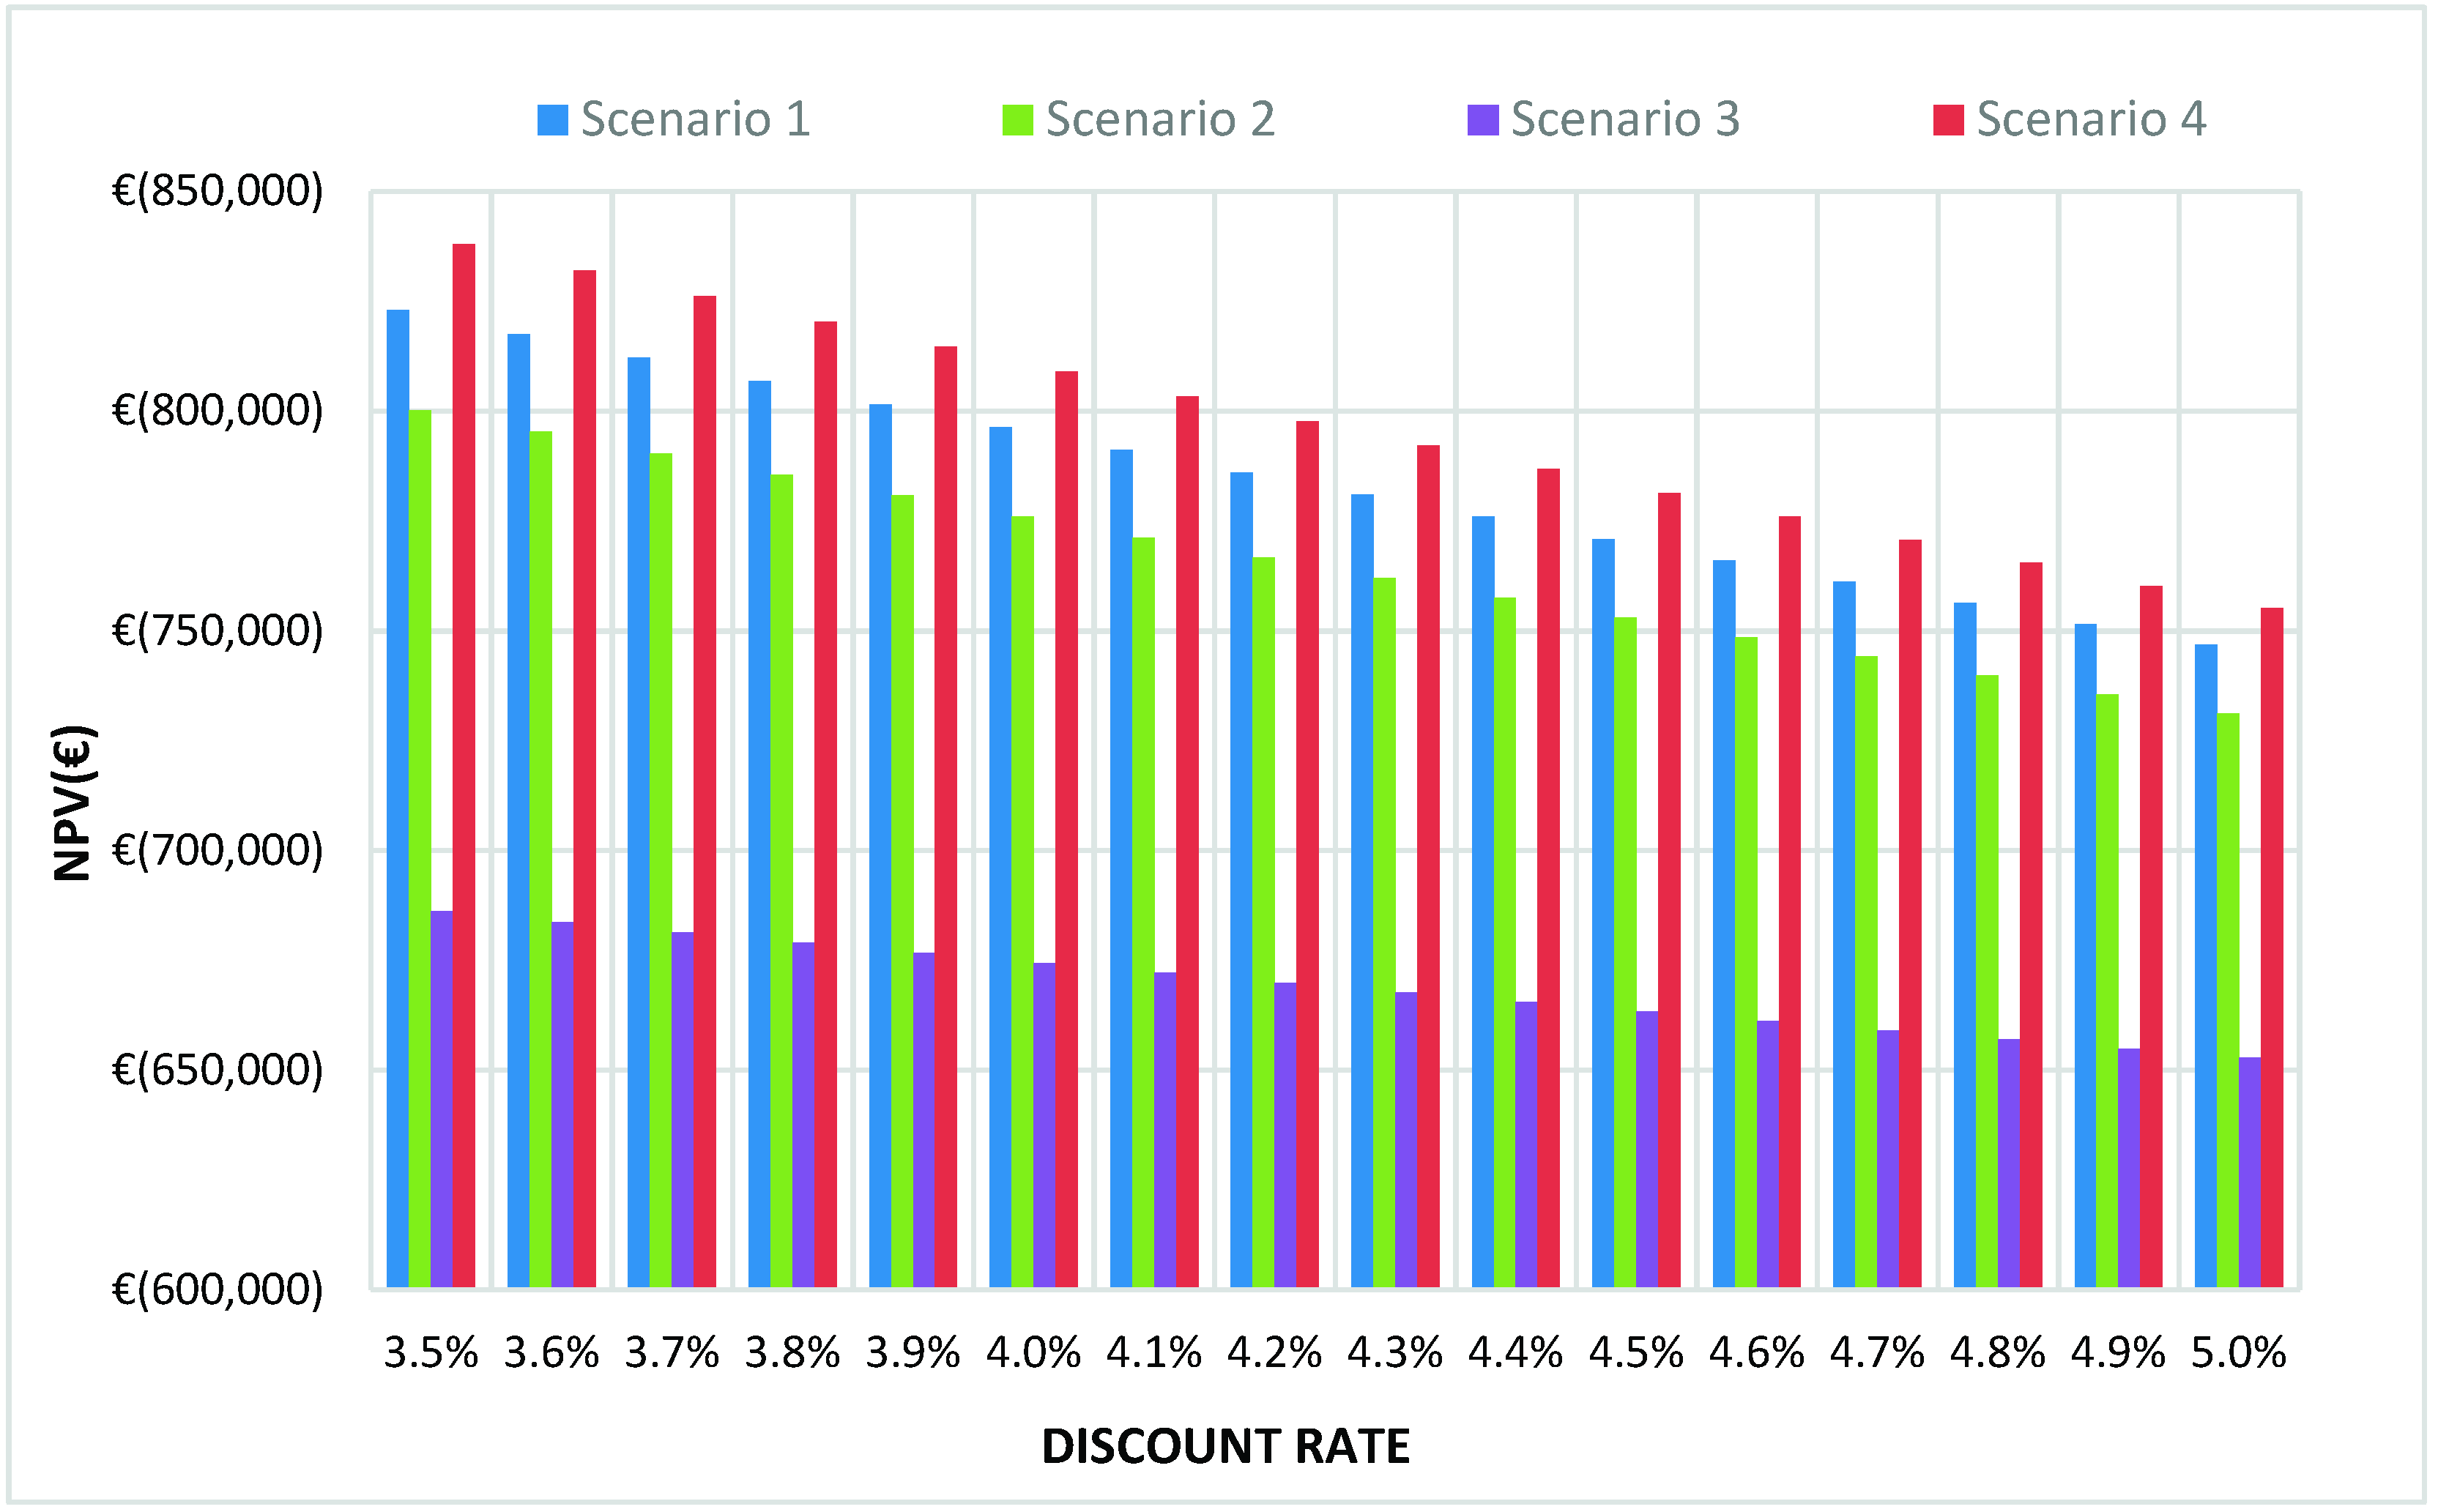
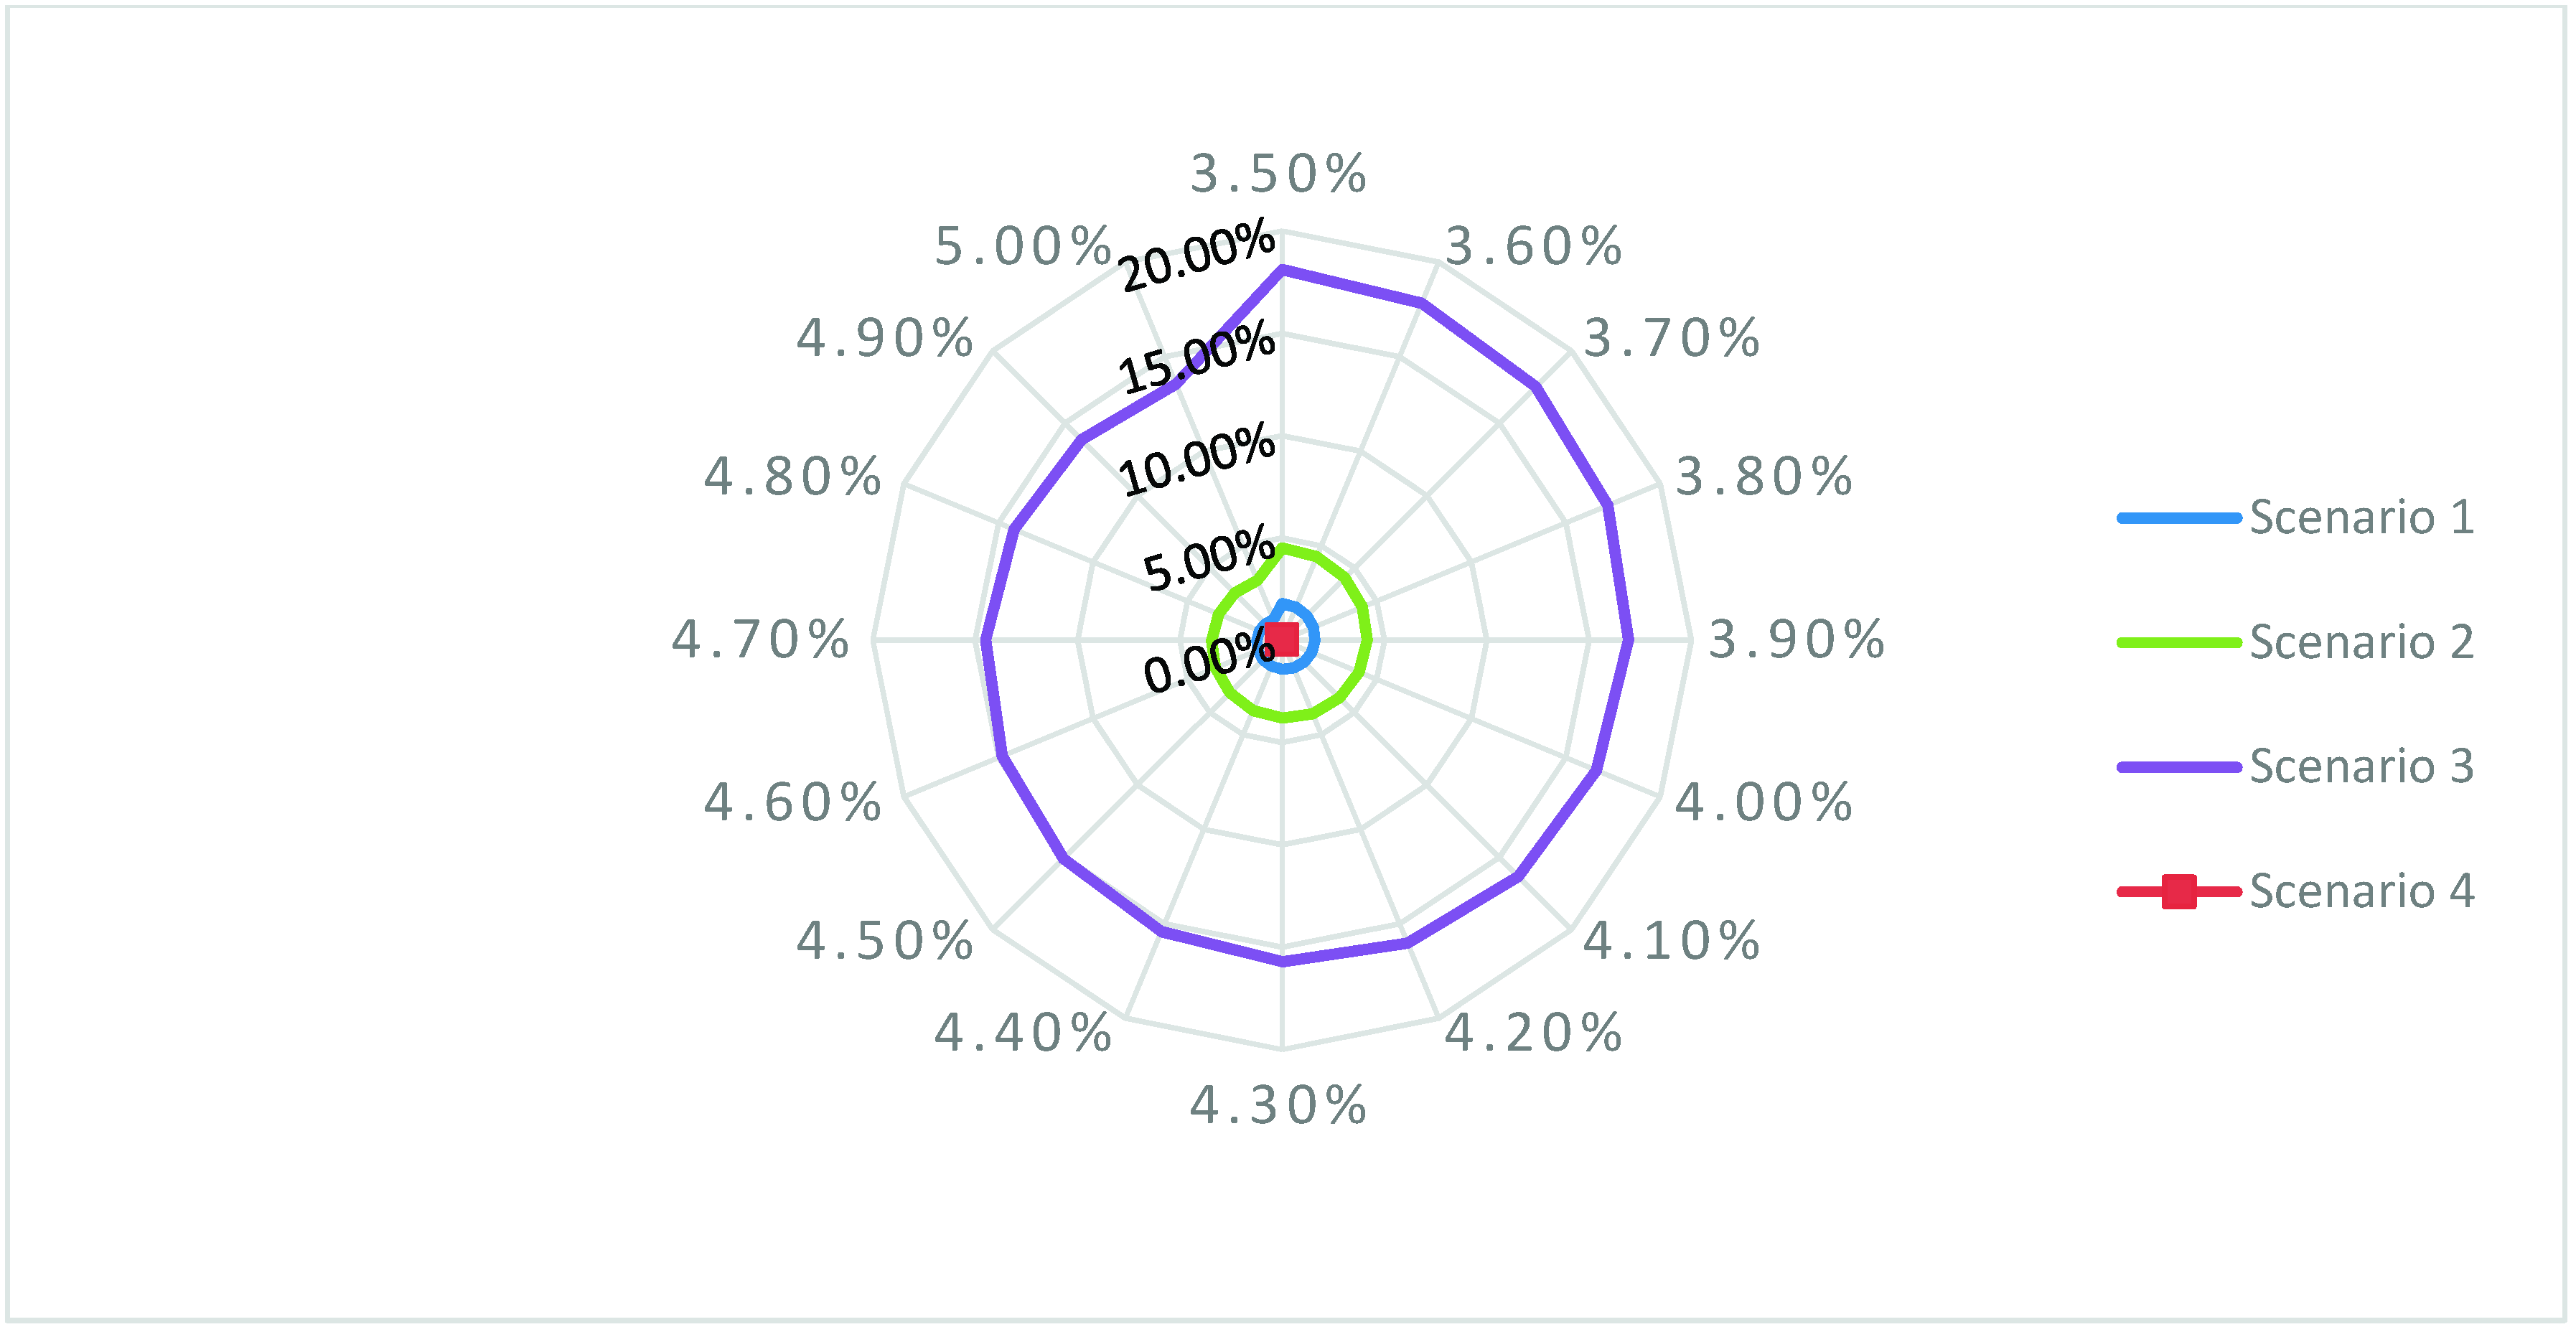
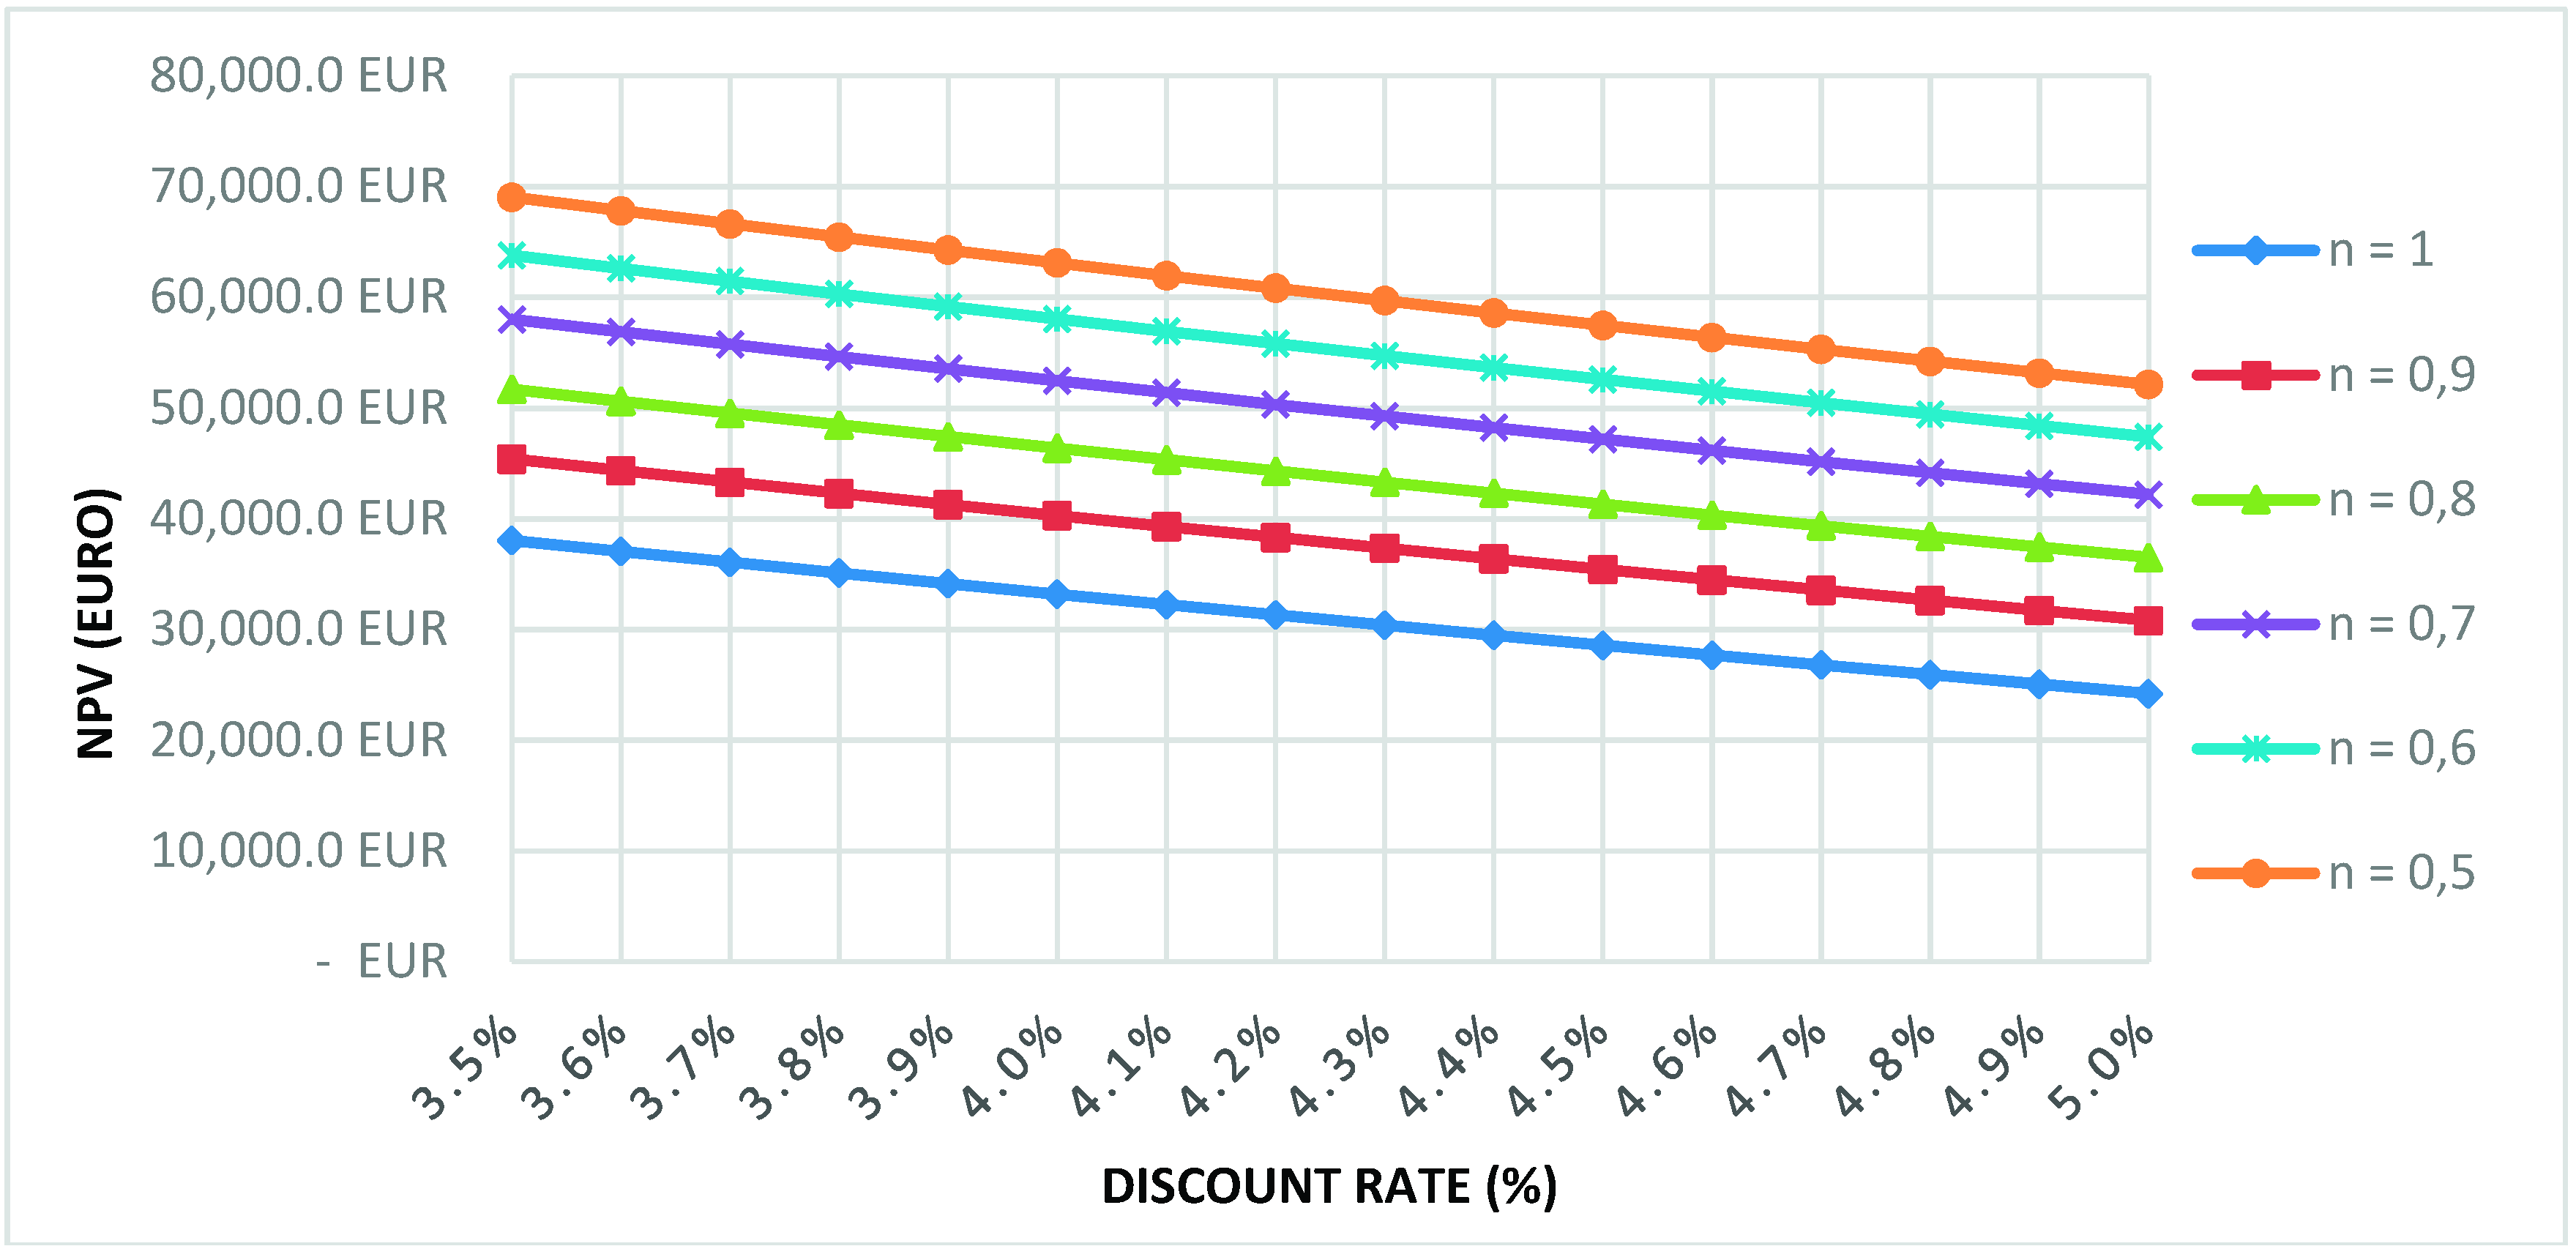
3.2. Economic Assessment Results

The evaluation for the Sewer Mining Units was performed first. The unit cost of each component was estimated through previous works [12,13,14] and data from the technology library of UWOT. For each of the three cases, the time period considered is 15 years. Based on the economic data, the Cash Flow Table of each case is constructed and therefore the NPV and IRR are calculated through a spreadsheet in Excel for 15 different discount rates. According to the results all three cases are viable, since NPV > 0 & IRR > Discount Rate, with the third case being the most profitable of all three in both criteria.
The second part consists of the economic evaluation of the Nursery scheme and takes into account the cost for water consumption from the main water system, which was provided by EYDAP based on the company’s data on the Nursery. Due to the considerable cost of potable water consumption, all scenarios have negative NPVs (they do not produce gains in the time period examined). However, the most attractive alternatives are those with the lowest negative NPV, which translates to lower cost for the Nursery within this time period. In Figure 4, it is shown that between these four scenarios, the third scenario (seven SM Units) is considerably less costly than the other three. This happens because in this case the SM Units can provide the entirety of the water that is needed for the irrigation of the plants and as a result the cost for water from the main water system is nonexistent. The economic benefit of each scenario (in %) as opposed to the current situation (Scenario 4) is shown in Figure 5 for the different discount rates examined. This was calculated by comparing the NPV of each scenario (and discount rate) with the NPV of the fourth scenario. Scenario 3 is once again estimated to be the most attractive alternative, with Scenarios 2 and 1 following. This shows that, even though the capital cost of investing in multiple SM Units is significant, the economic benefits in the long run are worth-considering. It is important to acknowledge at this point that this study does not take into consideration the environmental and social benefits of this SM scheme, which make this investment even more attractive overall.
Lastly, an investigation is performed on the effect of economies of scale and learning curves on the investment. Economies of scale is a concept which supports that increasing production units leads to a decrease in overall costs (estimated via a coefficient n). Similarly, applying a learning curve means that each year in the time period examined the performance of the set-up is improved due to experience gained in operating it. The case considered here is the one with two SM Units, for simplification purposes. In Figure 6, the NPV for two SM Units is calculated for different values of coefficient n. The resulting increase in NPV when applying a learning curve as well as economies of scale in a two SM Units scenario is presented in Table 3. The results produced show that implementing these concepts in the economic evaluation can drastically improve the estimated gains for this technology.

4. Conclusions

The purpose of this study is two-fold. First, to perform an economic evaluation for the proposed SM technology and the investment and second, to demonstrate UWOT’s capabilities in simulating a water recycling scheme at a local scale. The UWOT simulation and the economic evaluation results show that SM technology in general is a viable and profitable scheme and can be an interesting alternative water source to more conventional options (such as potable water from central system). The Nursery’s Sewer Mining investment allows for significant cost reduction compared to the current situation. A complete cost–benefit analysis that takes into consideration the sum of the environment, social and economic costs–benefits, is expected to make the Sewer Mining technology even more attractive, while a large part of its cost reduction depends on the investment attributes of ‘learning curve’ and ‘economies of scale’.

Author Contributions

All authors have read and agree to the published version of the manuscript. Conceptualization, L.A. and M.C.; methodology, L.A., M.C., N.D., M.K., and K.G.; writing—original draft preparation, L.A.; writing—review and editing, L.A., N.D., M.K. and M.C. All authors have read and agreed to the published version of the manuscript.

Funding

This research was funded by the European Union’s Horizon 2020 research and innovation program under grant agreement No. 776541, as part of the circular economy call CIRC-02-2016-2017.

Acknowledgments

The research leading to these results has received funding from the European Union’s Horizon 2020 under grant agreement no 776541, for the research project NextGen “Towards a next generation of water systems and services for the circular economy”. The research and its conclusions reflect only the views of the authors and the European Union is not liable for any use that may be made of the information contained herein.

Conflicts of Interest

The authors declare no conflict of interest.

Abbreviations

BODBiological Oxygen Demand
DESSINDemonstrate Ecosystem Services Enabling Innovation in the Water Sector (European program)
IRPInternational Resource Panel
IRRInternal Return of Rate
JMDJoint Ministerial Decision
MBRMembrane Bioreactor
SMSewer Mining
UVUltraviolet

References

  1. World Water Development Report 2019—Leaving No One Behind. Available online: https://en.unesco.org/themes/water-security/wwap/wwdr/2019 (accessed on 15 September 2019).
  2. International Resources Panel. Global Resources Outlook 2019: Natural Resources for the Future We Want. A Report of the International Resource Panel. United Nations Environment Program. Available online: https://www.resourcepanel.org/reports/global-resources-outlook (accessed on 4 June 2019).
  3. Simmonds, P. Waste Products and Undeveloped Substances: Or, Hints for Enterprise in Neglected Fields; R. Hardwicke: London, UK, 1862. [Google Scholar]
  4. Lancaster, M. Principles of sustainable and green chemistry. In Handbook of Green Chemistry and Technology, 1st ed.; Clark, J., Macquarrie, D., Eds.; Blackwell: Oxford, UK, 2002; pp. 10–27. [Google Scholar]
  5. Boulding, K. The economics of the Coming Spaceship Earth. In Environmental Quality in a Growing Economy, Resources for the Future, 1st ed.; Jarett, H., Ed.; John Hopknis University Press: Baltimore, MD, USA, 1966. [Google Scholar]
  6. Ellen Macarthur Foundation. Towards a Circular Economy—Economic and Business Rationale for an Accelerated Transition. 2015. Available online: https://www.ellenmacarthurfoundation.org/assets/downloads/TCE_Ellen-MacArthur-Foundation_9-Dec-2015.pdf (accessed on 3 June 2019).
  7. Angelakis, A.; Gikas, P. Water reuse: Overview of current practices and trends in the world with emphasis on EU states. Water Utility J. 2014, 8, 67–78. [Google Scholar]
  8. Makropoulos, C.; Rozos, E.; Tsoukalas, I.; Plevri, A.; Karakatsanis, G.; Karagiannidis, L.; Makri, E.; Lioumis, C.; Noutsopoulos, C.; Mamais, D.; et al. Sewer Mining: A water reuse option supporting circular economy, public service provision and entrepreneurship. J. Environ. Manag. 2017, 216, 285–298. [Google Scholar] [CrossRef]
  9. Marleni, N.; Gray, S.; Sharma, A.; Burn, S.; Muttil, N. Modeling the Effects of Sewer Mining on Odor and Corrosion in Sewer Systems. In Proceedings of the 20th International Congress on Modelling and Simulation, Adelaide, Australia, 1–6 December 2013; Available online: https://www.researchgate.net/publication /261876959 (accessed on 3 August 2019).
  10. Rozos, E.; Makropoulos, C. Source to tap urban water cycle modelling. Environ. Mod. Softw. 2013, 41, 139–150. [Google Scholar] [CrossRef]
  11. Rozos, E.; Tsoukalas, I.; Ripis, K.; Smeti, E.; Makropoulos, C. Turning black into green: Ecosystem services from treated wastewater. Desal. Water Treat. 2017, 91, 198–205. [Google Scholar] [CrossRef]
  12. Plevri, A.; Mamais, D.; Noutsopoulos, C.; Makropoulos, C.; Andreadakis, A.; Rippis, K.; Smeti, E.; Lioumis, C. Promoting on-site urban wastewater reuse through MBR-RO treatment. Desal. Water Treat. 2017, 91, 2–11. [Google Scholar] [CrossRef]
  13. Ghazy, M.; Dockhorn, T.; Dichtl, N. Sewage Sludge Management in Egypt: Current Status and Perpectives towards a Sustainable Agricultural Use. Int. J. Environ. Ecol. Eng. 2009, 3, 270–278. [Google Scholar] [CrossRef]
  14. Success Stories on Composting and Separate Collections. 2000. Available online: https://ec.europa.eu/environment/waste/publications/pdf/compost_en.pdf (accessed on 22 August 2019).
Figure 2. The set-up consisting of a single SM Unit in Urban Water Optioneering Tool (UWOT).
Environsciproc 02 00014 g002
Figure 3. The set-up consisting of two SM Units in UWOT.
Environsciproc 02 00014 g003
Figure 4. NPV for Scenarios 1, 2, 3 and 4 for different discount rates.
Environsciproc 02 00014 g004
Figure 5. Benefit Comparison for Scenarios 1, 2, 3 in comparison to 4 (current situation).
Environsciproc 02 00014 g005
Figure 6. NPV for the case of 2 units for different values of coefficient n (Economies of scale).
Environsciproc 02 00014 g006
Table 1. Statistical characteristics for inflow BOD (all values in mg/L).
ParameterValueParameterValueParameterValueParameterValue
Average253St. Deviation69Maximum383Minimum142
Table 2. Statistical values of the BOD concentration in the reclaimed water (in mg/L).
Number of UnitsAverageSt. DeviationMaximumMinimum
12.630.734.780.91
23.000.815.001.00
Table 3. Net Present Value for 2 units (NPV 1 = no learning curve & no economies of scale, NPV 2 = with learning curve and economies of scale) for different discount rates.
NPV 1 (EUR)NPV 2 (EUR)% of NPV IncreaseDiscount Rate
38,051.6563,931.5368.0%3.5%
37,059.6762,724.1969.3%3.6%
36,078.0261,529.5670.5%3.7%
35,106.5860,347.4971.9%3.8%
34,145.2259,177.8073.3%3.9%
33,193.8158,020.3674.8%4.0%
32,252.2256,874.9976.3%4.1%
31,320.3355,741.5678.0%4.2%
30,398.0254,619.9179.7%4.3%
29,485.1753,509.8981.5%4.4%
28,581.6752,411.3683.4%4.5%
27,687.3951,324.1785.4%4.6%
26,802.2250,248.1887.5%4.7%
25,926.0649,183.2689.7%4.8%
25,058.7848,129.2692.1%4.9%
24,200.2847,086.0594.6%5.0%
Publisher’s Note: MDPI stays neutral with regard to jurisdictional claims in published maps and institutional affiliations.

