Article

On the Road to Sustainable Water Supply: Reducing Public Health Risks and Preserving Surface Water Resources in the Milluni Micro-Basin, Bolivia

by
Paola Andrea Alvizuri Tintaya
1,2,
Esteban Manuel Villena Martínez
1,3,
Bárbara Micó Vicent
4,
Jaime Lora Garcia
5,
Juan Ignacio Torregrosa-López
5 and
Vanesa G. Lo-Iacono-Ferreira
1,*
1
Project Management, Innovation and Sustainability Research Center (PRINS), Alcoy Campus, Universitat Politècnica de València, Plaza Ferrándiz y Carbonell, s/n, 03801 Alcoy, Spain
2
Centro de Investigación en Agua, Energía y Sostenibilidad, Universidad Católica Boliviana “San Pablo”, Sede La Paz, Bolivia
3
Departamento de Ingeniería y Ciencias Exáctas, Universidad Católica Boliviana “San Pablo”, Sede Tarija, Bolivia
4
Departamento de Ingeniería Gráfica, Campus d’Alcoi, Universitat Politècnica de València, 03801 Alcoy, Spain
5
Research Institute for Industrial, Radiophysical and Environmental Safety (ISIRYM), Alcoy Campus, Universitat Politècnica de València, Plaza Ferrándiz y Carbonell, s/n, 03690 Alcoy, Spain
*
Author to whom correspondence should be addressed.
Environments 2022, 9(1), 4; https://doi.org/10.3390/environments9010004
Submission received: 16 November 2021 / Revised: 14 December 2021 / Accepted: 17 December 2021 / Published: 24 December 2021

Abstract

:
Bolivia is among the countries with the highest availability of freshwater globally. However, many of its natural sources are impacted by anthropogenic activities, such as mining. Water is intimately linked to public health and is essential to achieving sustainable development. It is necessary to preserve water resources by designing and validating monitoring programs that help control the quality of the sources that supply important population centers. The study area in this research is the upper part of the Milluni micro-basin, whose lagoon system supplies water for two large cities. Milluni is close to illegal and abandoned mining areas, making the region highly vulnerable to heavy metal contamination. This study aimed to optimize the resources available for monitoring Milluni. The frequency of monitoring was statistically determined, and the correlation between parameters measured in situ (pH and conductivity) and metal ion concentrations to determine low-cost indicators to monitor the presence of heavy metals. A multivariate analysis of friction of the results of the pilot year of the monitoring program designed for Milluni, considering the characteristics and economic limitations, is presented. An approximation of the quality of the surface water resources of Milluni is presented as a result of the monitoring operations.

1. Introduction

Developing countries suffer from the highest rates of poverty and greater vulnerability to environmental degradation. This confirms that poverty arises from complex interactions between social and environmental factors, as is also stated in the work [1]. Water is known to be a vital factor for life on Earth. In this regard, the contamination of the aquatic environment is becoming an increasingly serious problem [2]. Hence, the quality of surface water bodies represents an aspect of great relevance that should be a fundamental object of study [3,4]. Currently, considerable amounts of time, effort, and money are invested in controlling, protecting, managing, and restoring surface water resources, recognizing the importance of water for the quality of the environment, economic development, and nations’ social well-being [5,6].
Water and Sanitation were named a Human Right on 28 July 2010, through United Nations Resolution 64/292 [7]. However, estimates reveal that about 40% of the population does not have access to safe water and sanitation services, and again developing countries suffer the greatest impact of this [8]. As a result, the current water problem is reflected as a priority in Goal 6, “Clean Water and Sanitation”, within the Sustainable Development Goals (SDGs), which frame the 2030 agenda [9]. In Latin America, alarming data on this situation are evident, with only 80% of the urban population having safe drinking water systems. This situation is aggravated in rural areas, where it is stated that 50% do not have this type of system for the management of drinking water [9].
According to the Scientific and Technological Consultative Forum [10], in Latin America, Bolivia has one of the highest supplies of freshwater per capita. However, its surface and underground water potential have not been entirely determined. There are few exhaustive studies on water sources’ quality [11], which generates uncertainty about the type of water to which one has access. Drinking water has long been known to be indisputably linked to public health, and public health and sustainable development are also clearly linked [12]. Thus, preserving natural sources of fresh water is an intrinsic necessity for human survival, now and much more in the future.
The Spanish Agency for International Development Cooperation (AECID) report indicates that the lack of adequate access to sufficient quality and quantity of drinking water is one of the main factors in the increase in diseases in the Bolivian population [13]. The WHO states that only 50% of Bolivia has access to clean water [14]. There are also other problems related to the supply of drinking water; for example, the state of the infrastructure in the water supply in Bolivia shows that the water storage capacity is only 56 m3 per inhabitant; the main sources of water supply in urban areas are affected by severe and growing pollution; between 42% and 61% of drinking water is not accounted for by local operators due to deficiencies in the control and operation systems; and systems are characterized by poor home connections and distribution systems, frequently due to the age of the systems’ pipes [15].
To ensure the quality of drinking water, systems should provide integrated and preventive management of water resources, in which all those involved collaborate [16]. Among the most important points within this management system is the methodology that allows systematic measurements and water quality observations [17], known as water quality monitoring programs. These programs aim to define a standardized procedure, minimize errors, and ensure the generation of consistent data and information [18]. Drinking water has long been of concern [19]. This is because many sources of drinking water are vulnerable to all types of contamination, which reduces its quality, denoting the need for constant monitoring to avoid environmental degradation and a decrease in the availability of safe water [20].
The Andes of Bolivia, an altiplano region, presents problems in the management of its water resources, in turn leading to an issue of water scarcity in the area [21]. Therefore, the preservation and monitoring of drinking water sources are very important to avoid uncertainty about future access to safe water [22]. An important source of water for the La Paz Department is the upper part of the Milluni basin [23]. The main issues affecting the surface water bodies in Milluni are the illegal, operational, and abandoned mines that pollute their waters with heavy metals [24], because the consumption of heavy metals represents an imminent risk for public health [25,26].
The report “Water and sanitation in the Plurinational State of Bolivia” indicates that the water and sanitation systems in the main urban areas are managed by operating companies that show adequate control between the water and sewerage connections. However, in rural areas, the administration of services is local, where the treatment or purification systems in many cases are not adequately controlled, leading to contamination of drinking water sources [27].
This article presents the results of the implementation of the first year (pilot year) of a monitoring program for the detection of heavy metals in the upper part of the Milluni micro-basin. This program was designed to consider international standards, the particularities of the Milluni area, and the limitations of economic resources and trained personnel [28]. This work aimed to optimize the available resources for monitoring Milluni, ensuring the control of surface water, thus avoiding risks to public health in the area. For this purpose, the results of the pilot year of the proposed monitoring program were evaluated. The contributions of this research are: 1. the determination of the final monitoring frequency, which generates representative data for the area and aims to adjust the existing management system; 2. presentation of the correlation between parameters measured in situ (pH and conductivity) and metal ions concentrations, to determine low-cost indicators for monitoring the presence of heavy metal; and 3. an approximation of the quality of surface water resources of Milluni.

2. Materials and Methods

In this section, a description of the study area is presented, followed by the description of the monitoring program and the methodology used in this study.

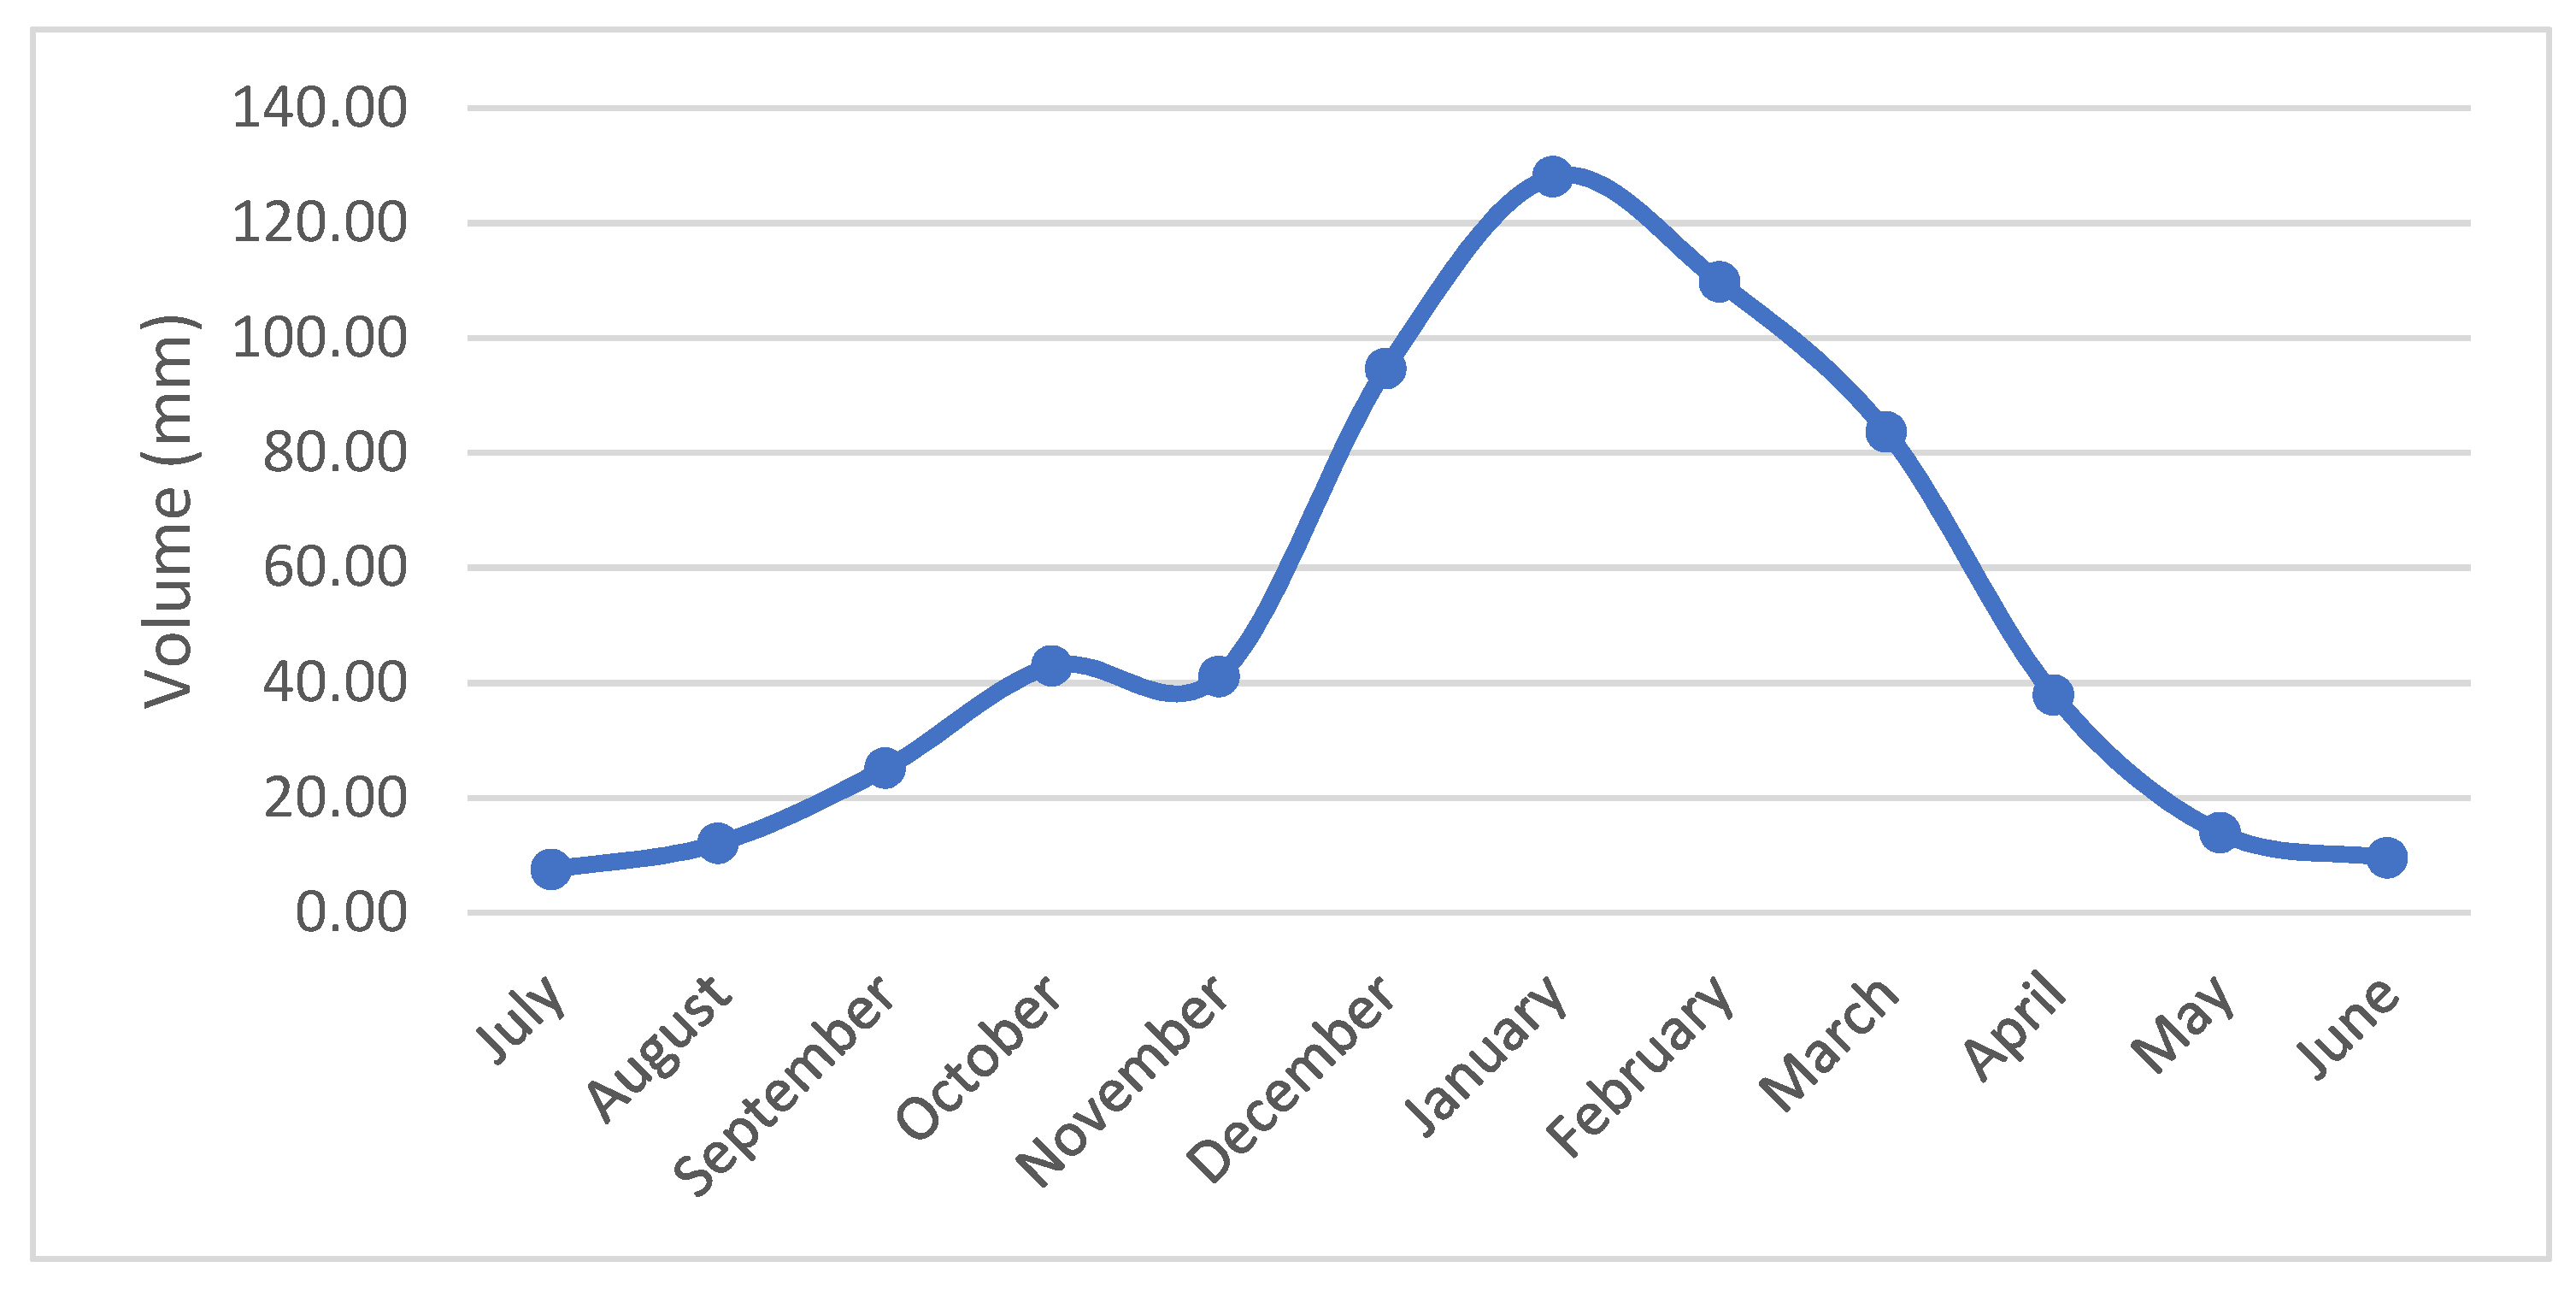
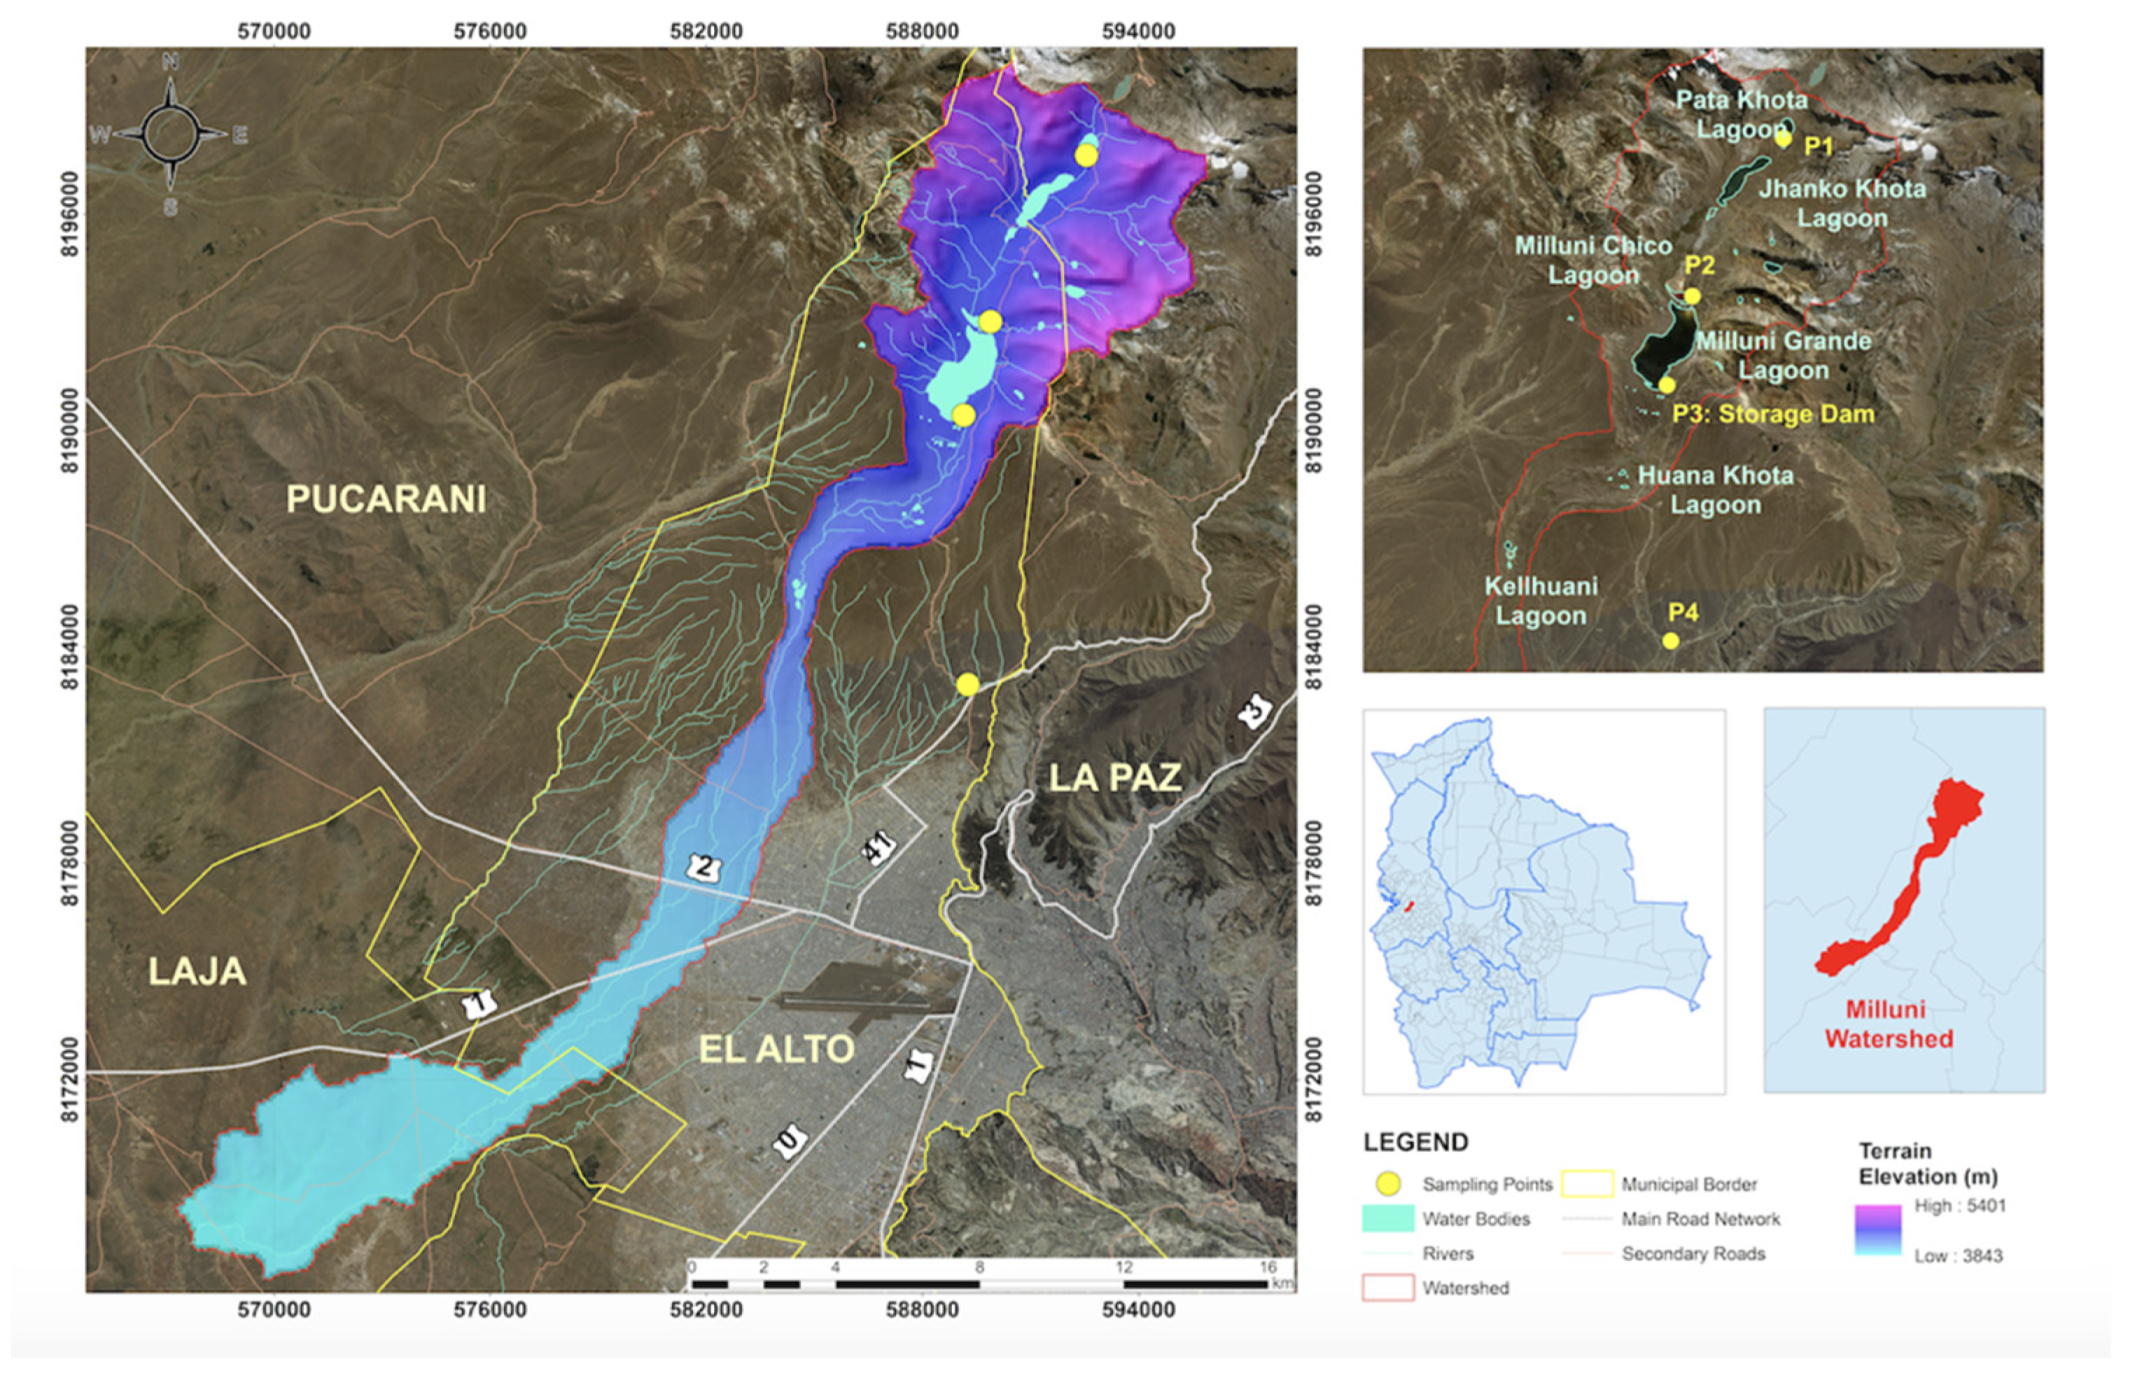
2.1. Description of the Study Area

The Milluni micro-basin covers an area of 58.2 km2; it is part of the Altiplano basin system, where extreme climatic conditions typical of the area occur [29,30]. Figure 1 shows the average data for all months of the year in terms of total precipitation, denoting that Milluni has defined dry and wet seasons. The information was collected from the SENHAMI meteorological precipitation stations from 1999 to 2018; full data are presented in the Supplementary Materials [31].
Milluni has an altitude of 4500 to 4700 m.a.s.l. [32]. Lithological units can be summarized from north to south as:
  • Granitic terrain partially covered by glaciers (Huayna Potosí granite, HPG);
  • Slightly metamorphosed fine-grained sandstone with bedded black shales (Cambrian to Ordovician);
  • Mineralized Silurian sandstone (Catavi Formation). The Catavi Formation is mainly composed of sandstone deformed by faults and folds, which allowed mineralization to occur [29].
Lehmann (1978) [33] performed several geological and mineralization investigations. The primary minerals in the region are: pyrite (FeS2), marcasite (FeS2), pyrrhotite (Fe(1−X)S), sphalerite (ZnS), arsenopyrite (FeAsS), cassiterite (SnO2), galena (PbS), wolframite (Fe,Mn [WO4]2), and stannite (Cu2FeSnS4). Associated minerals include quartz (SiO2), siderite (FeCO3), hematite (Fe2O3), apatite (Ca5(PO4)3F2), and monazite ([Ce,La,Nd]PO4) [33]. Underground mining was used to exploit this mineralization, and a maximum production of 110,000 T/a of rough mineral extracted was achieved between 1970 and the 1980s [34]. A large amount of produced mining waste, after mineral extraction by gravimetric and flotation procedures, was spread hazardously on slopes in the Milluni Chico sector (4.6 km2). Due to this exposure, although Milluni was a mining area last century, the impact of mining waste on water quality remains a serious national environmental problem [35]. Another problem that affects water quality in this area is small-scale and often illegal mining activities, for which there is no precise information [24].
The upper part of the Milluni micro-basin is one of the main sources of freshwater for two important cities, La Paz and El Alto, in the Department of La Paz. Both cities are among the most populated in Bolivia. The surface water system of Milluni is composed of 4 lagoons, which are interconnected by surface water currents that flow downhill by gravity. A storage dam is located in the Milluni Grande lagoon, the last lagoon in the system, that collects the water used to supply the urban water system [36]. Some characteristics of these lagoons are detailed below, and Figure 2 shows their distribution.
  • Pata Khota: A natural lagoon of irregular shape that receives water from the glacier of the Huayna Potosí. It is located at 4665 m.a.s.l.
  • Jankho Khota: Located at 4560 m.a.s.l., an irregular-shaped natural lagoon that receives water from the Pata Khota lagoon.
  • Milluni Chico: An artificial lagoon at an altitude of 4550 m.a.s.l., having an irregular shape and receiving water from natural springs, Jankho Khota lagoon, and mines. This artificial lagoon aims to capture the acid drainage of the mines to prevent it from entering the Milluni Grande lagoon.
  • Milluni Grande: Located at 4530 m.a.s.l, the Milluni Grande lagoon receives effluents from natural springs, the Milluni Chico lagoon, and mines’ drainage. It also receives water from the Jankho Khota lagoon through a bypass system. In this lagoon, there is a water storage dam for public supply, which has a high probability of contamination by heavy metals due to its tributaries.
The Milluni watershed is within the Katari macro watershed. This macro-basin was determined as strategic by the National Plan of Basins of Bolivia, due to its extension, resources, and the large population it sustains [37]. The management of this macro-basin is overseen by the Katari Basin Management Unit (KBMU), which depends on the Vice Ministry of Water Resources and Irrigation (VRHR). The KBMU has been in charge of monitoring the entire area that comprises the Katari macro-basin from 2006 to the present.
The macro-basin monitoring program was developed with many limitations in terms of human resources, economic, and time. An analysis of the historical data from monitoring the Milluni area determined some inconsistencies in its development, such as a non-uniform monitoring frequency, variation in the location of the monitoring points, and variation in the parameters to be analyzed [22].

2.2. Monitoring Program Designed for Milluni

The monitoring program implemented was designed specifically for the upper part of the Milluni micro-basin, because this area includes natural water sources that must be monitored. The basis of the program was international standards: the UNEP/WHO [38] monitoring program design guide and Bolivian Standard NB/ISO 5667-4 [39], the latter specifically for the monitoring of surface water bodies. The program considered the limitations within the management systems of the Katari macro-basin. The framework and characteristics of the monitoring program were developed in the study of Alvizuri in 2020 [28] and are listed and detailed below.
  • Objective of the monitoring program. Determine the water quality of the Milluni area.
  • Purpose of the monitoring program. Becoming a control program that generates representative data and contributes to the water management of the area.
  • Monitoring area. The upper part of Milluni, including its 4 lagoons: Pata Khota, Jankho Khota, Milluni Chico, and Milluni Grande.
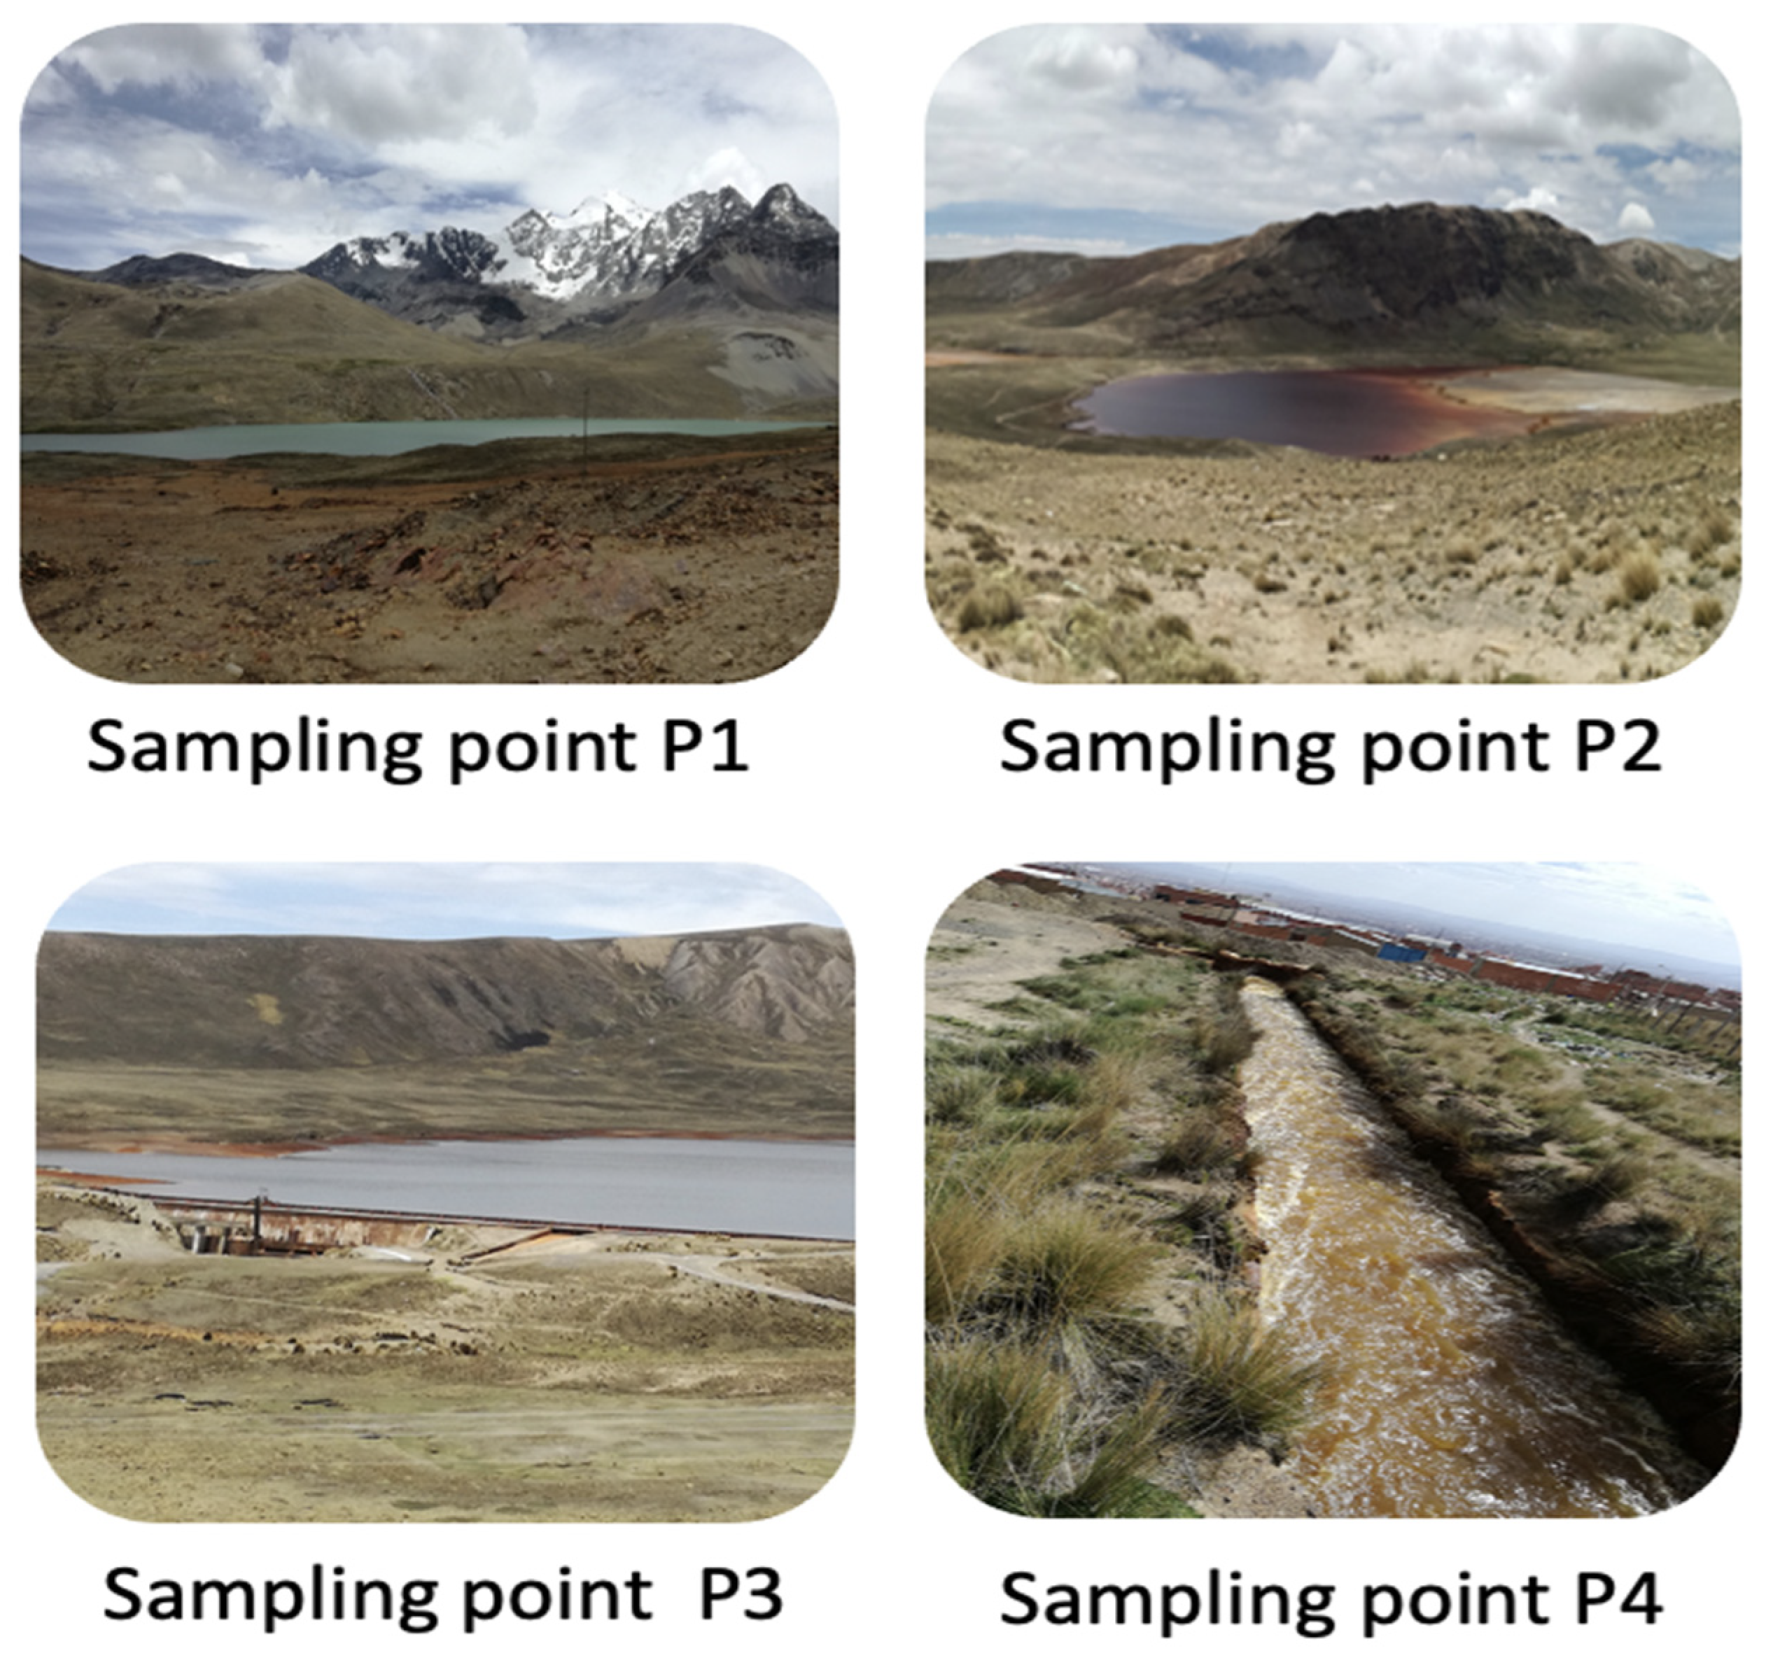
  • Sampling points. Four sampling points were determined to monitor the water quality in Milluni, and they were distributed throughout the water system. Figure 2 shows their location.
    • Point 1: Used to identify the reference conditions in the watercourse system.
    • Point 2: Used to determine any signs of deterioration in water quality.
    • Point 3: Used to show if the body of water meets the desired quality standards because it is a water storage dam within the course system.
    • Point 4: Seeks to evaluate the effectiveness of human intervention in water quality management.
  • Frequency of monitoring. The samplings will be carried out three times in the dry season and three times in the rainy season with intervals of 1 month between samples.
  • Variables to measure. The in situ parameters that must be monitored are pH, dissolved oxygen, conductivity, turbidity, and temperature, because they are basic control parameters established in Bolivian regulations. The ex situ parameters that must be monitored are quantities of 33 metals, due to the high susceptibility of the area to present contamination by heavy metals.
  • Sampling protocol. The monitoring program adopts the Protocol established in “ISO 5667-4 [39]: 2016 Water quality-Sampling-Part 4: Guidance on the sampling of lakes, natural and artificial”.
  • Determination of resources. This program considers that financial resources and trained personnel are limited. In this sense, all the components were thought to save resources.
  • Evaluation and control of the program. The key to optimizing a monitoring program is to evaluate its components through the implementation of the first year of the program (pilot year). With the results of this first year, it will be possible to redefine components and seek continuous improvement within them.
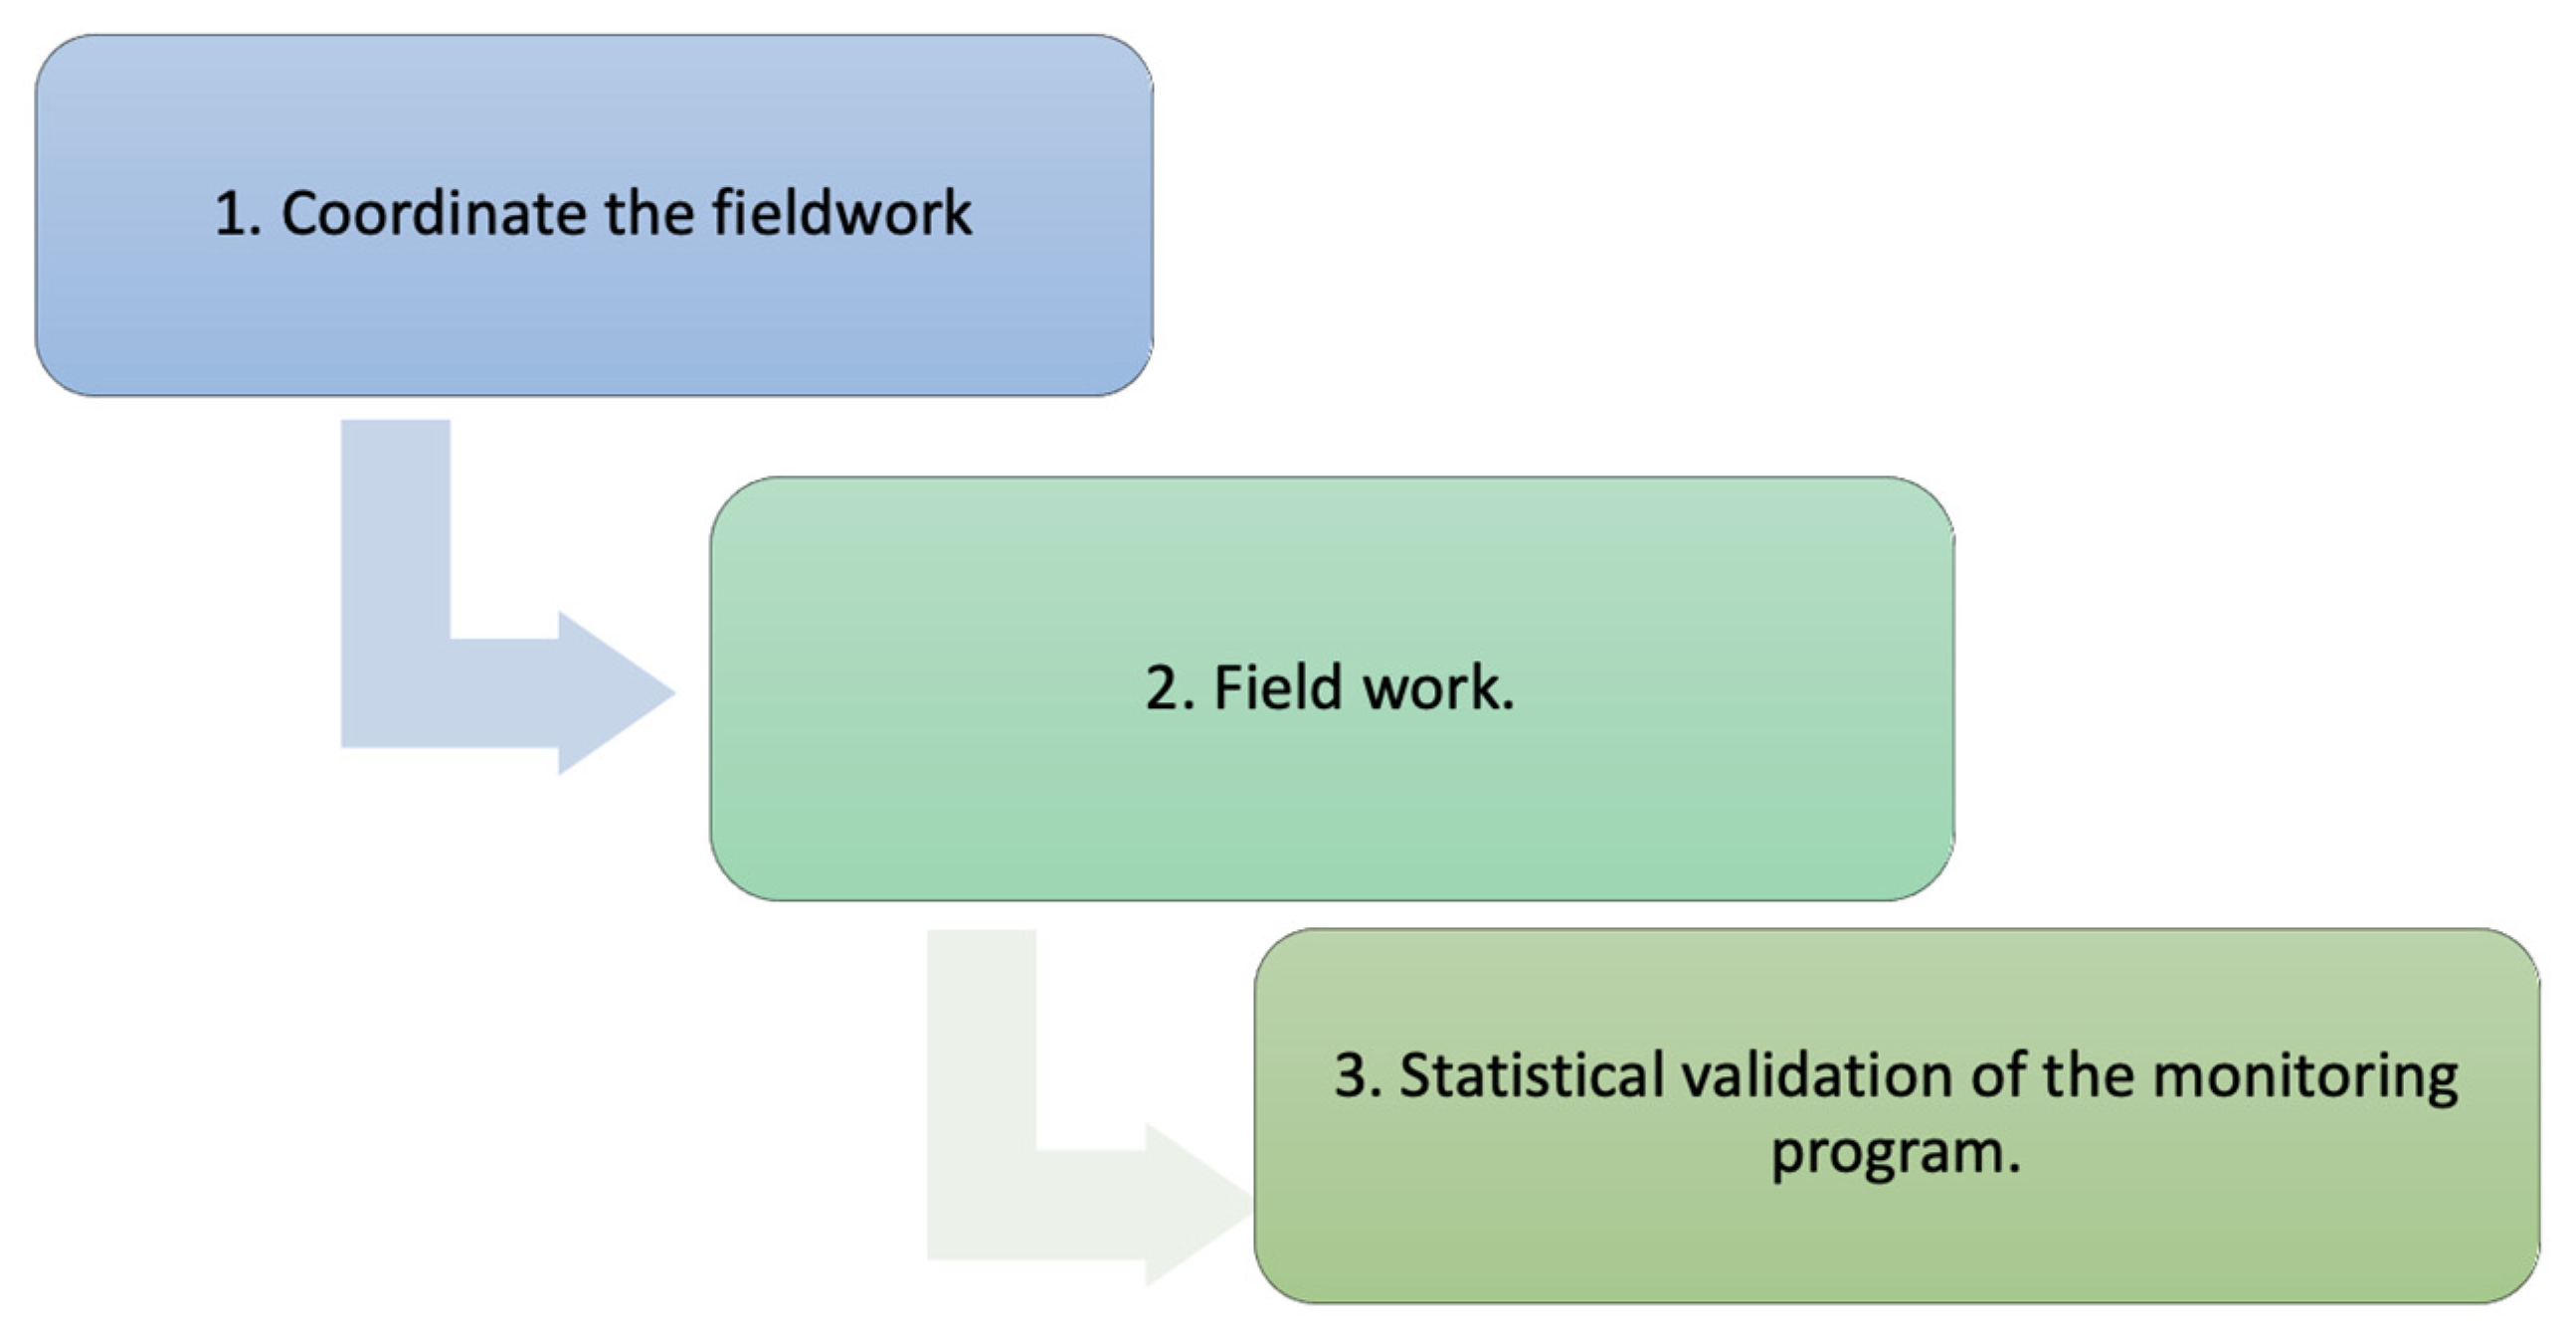
2.3. Methodology

The methodology developed in this study is divided into three main parts. The first is coordinated field work. The second part is the implementation of the pilot year of the monitoring program designed for the upper part of the Milluni micro-basin. Finally, the third part is the statistical validation of the results of year 1 of the monitoring program. The methodological diagram is presented in Figure 3.

2.3.1. Coordinated Fieldwork

The field work was coordinated with the Katari macro-basin management entity, which is the Katari Basin Management Unit, as mentioned above. This was undertaken with the objectives of not interfering with or hindering the work that this unit undertakes within the macro-basin, and optimizing resources.
The months for the field work were defined by the temporality of the area because there are two marked seasons, namely, the dry and wet seasons. Thus, six months were determined. The three representative months of the dry season were May, August, and October; and the three months representative of the wet season were December, January, and March. By monitoring three times during each season, the dynamics of the pollutants could be determined and the most representative month within each season could be identified if it exists.

2.3.2. Field Work

The field work was undertaken in the months indicated in the previous section. This field work comprised the following:
  • Measurement of parameters in situ with a HQ40D-Hach portable multimeter and a Hach 2100Q portable turbidimeter.
  • Sampling, transport, and storage, following the protocol established in ISO 5667-1 [40], to avoid contamination of the samples.
  • Heavy metal analytics were developed in the Services Laboratory of the University of Alicante in Spain.

2.3.3. Statistically Analyze the Results of the Pilot Year

After the implementation of the pilot year of the monitoring program, the objective was to validate and optimize the components of the program. This required a statistical study that analyzed the results to determine the frequency that the monitoring program will adopt in its future implementation. At the same time, the parameters measured in situ were statistically analyzed to assess whether they can be indicators of the presence of heavy metals, to optimize resources during future monitoring. The development described below is based on a statistical analysis of similar problems from other studies in other parts of the world [41,42,43].
The statistical analysis was carried out with the Statgraphics Centurion 18 software [44]. First, this included determination of the correlation between the defined points and the month of the year with the concentrations of the metals found in the analysis of the water samples. MANOVA (multivariate analysis of variance) was performed to detect the presence of interactions, to determine if the time of year affects the selected monitoring points differently. If this did not occur, ANOVA (analysis of variance) was performed to individually determine the effect of these two factors (sampling points and month of the year) on the concentration of metals.
In addition, two hypotheses regarding the influence of the pH and conductivity indicators with the concentrations at the sample collection points were contrasted.
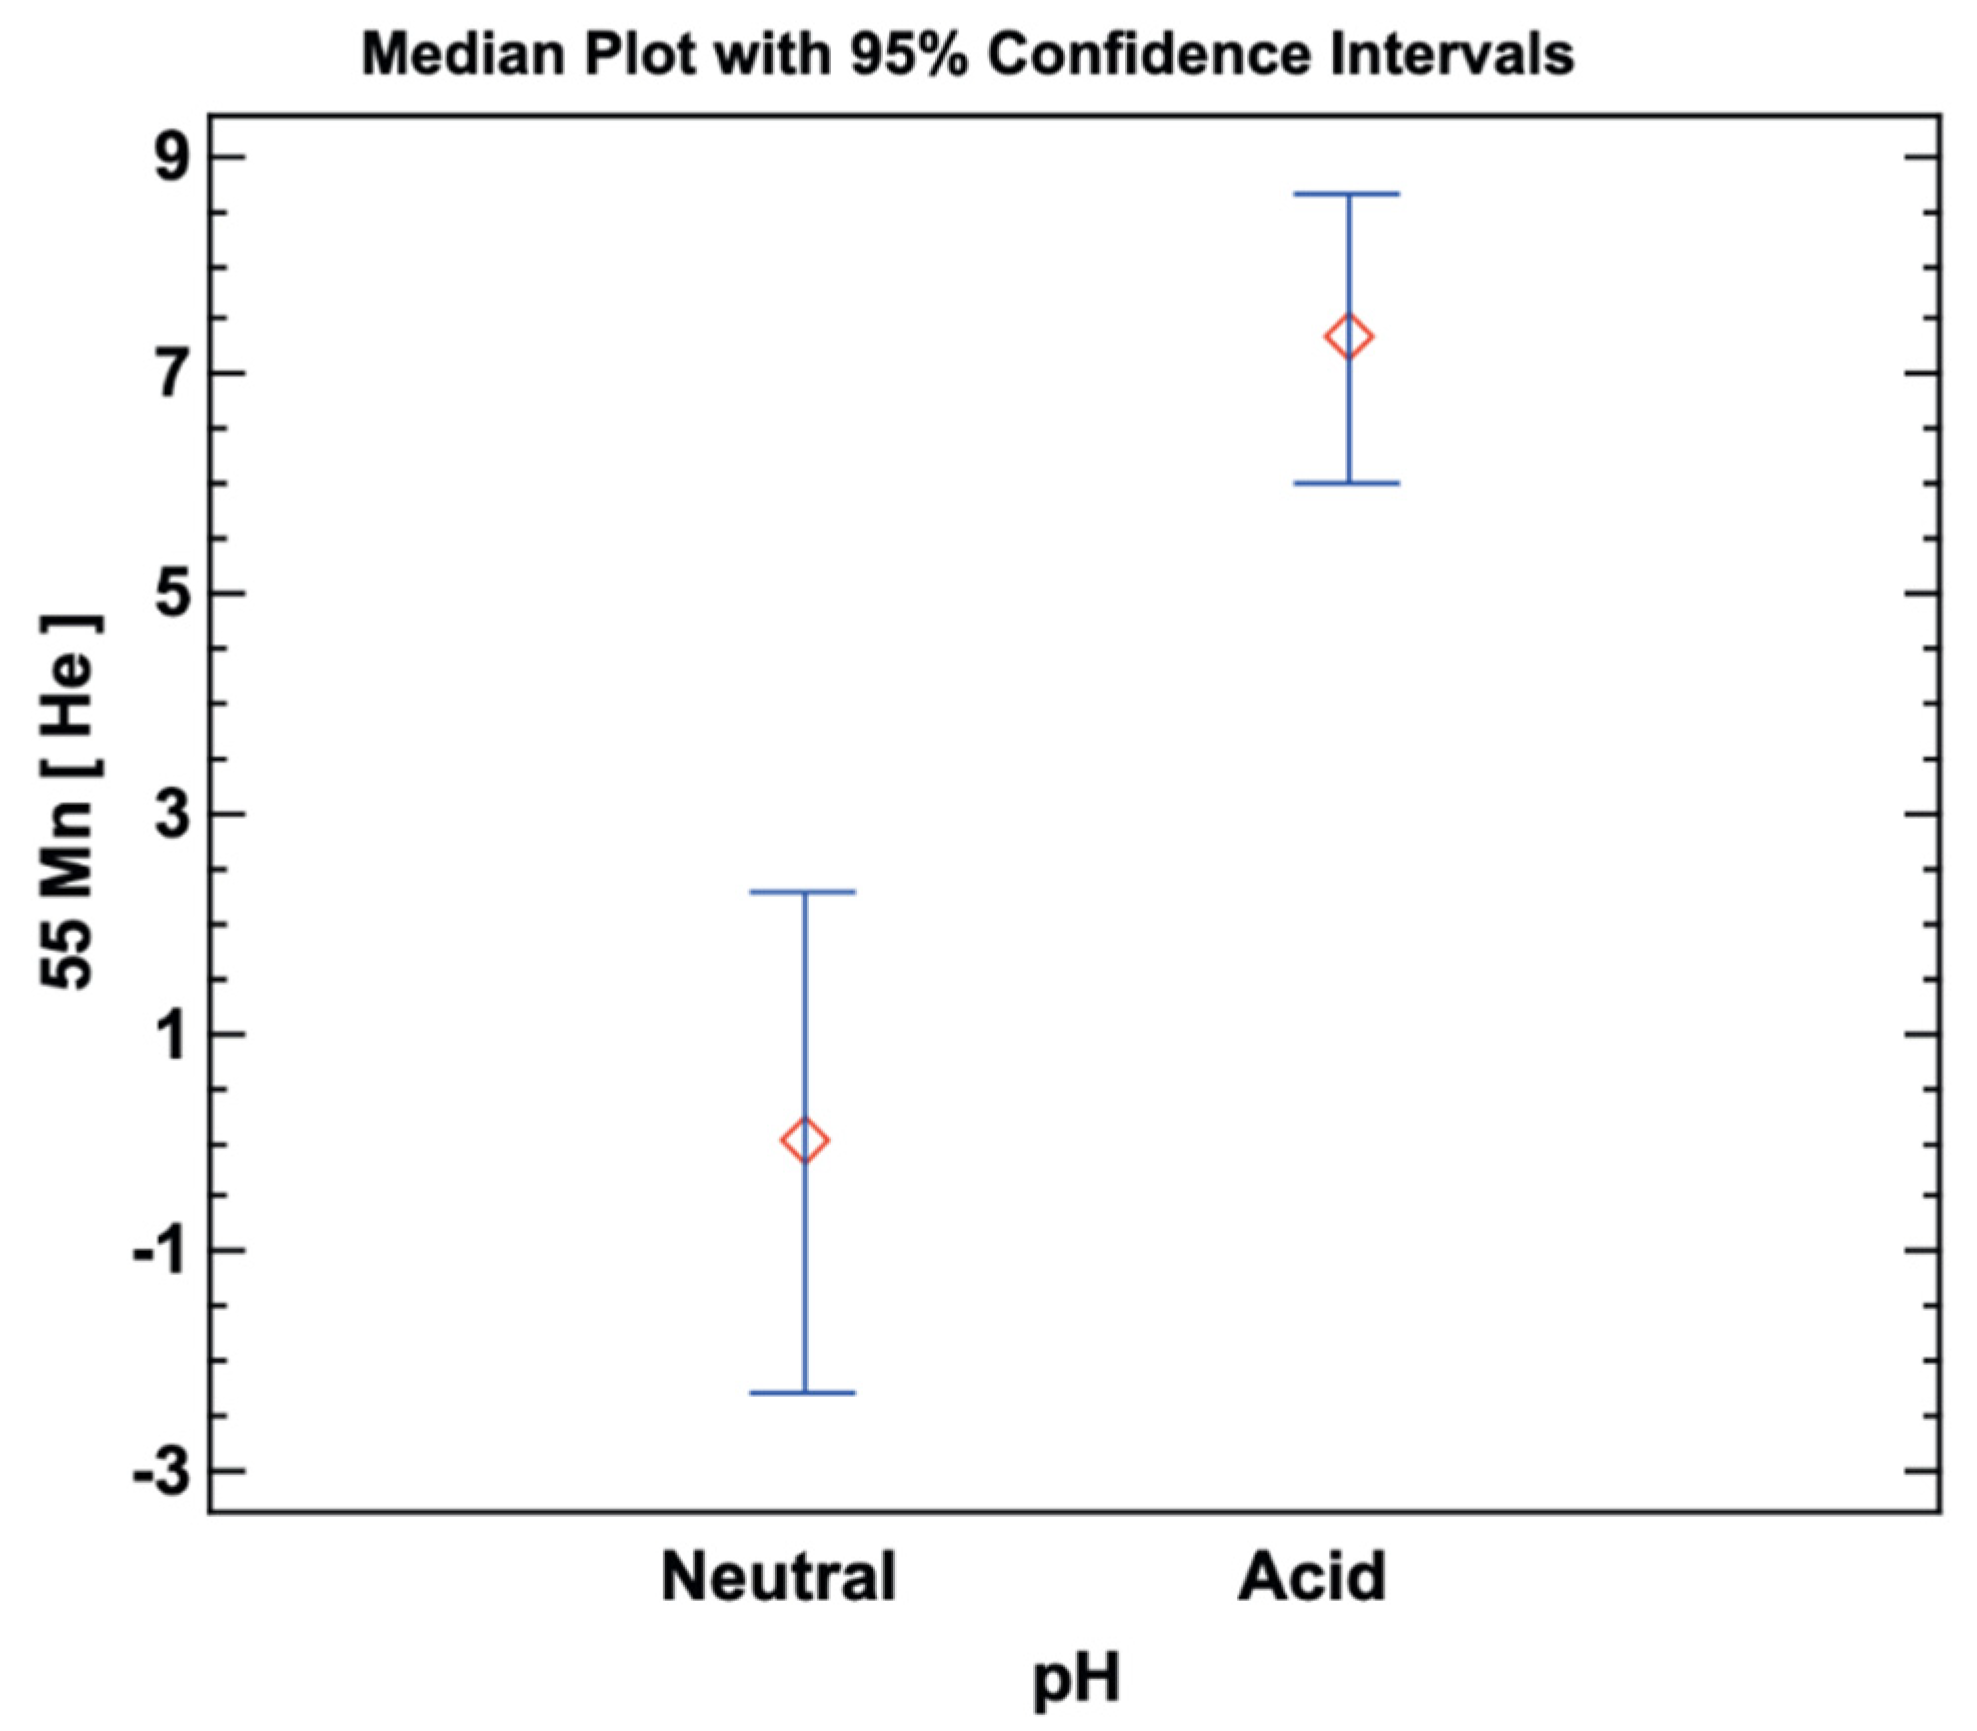
  • PH is a parameter that describes the acid–base properties of a solution [45]. In this regard, the acidic condition of metal ions leads us to understand that a low pH is related to a greater presence of metal ions.
  • Pure water is not a good conductor of electricity, and dissolved ions increase its conductivity [46]. Hence, high conductivity is related to a greater presence of metal ions.
In this case, to assess the relationships between numerical variables, concentrations vs. conductivity, or pH values, correlations were sought through multiple regression, with the intention of identifying joint effects/interactions and determining the importance of the effect in each case. If an independent variable was found to be non-significant, we proceeded with the analysis of the simple regression between the variable remaining as significant and the concentration of the metals. In addition, the pH was also treated as a factor having two levels, i.e., acid below 6 and the remainder of the values neutral. In this case, ANOVA was again conducted, which allows determining if, in this case, there is a correlation between the factor and the concentration of metals.

3. Results

This section presents the results of this study in three parts. The first part shows the values of parameters measured in situ and ex situ. The second part presents the analysis on the sampling frequency adopted in the first year. Finally, the third part shows the analysis carried out to identify which of the in situ parameters can be indicators of the presence of heavy metals.

3.1. Results of Parameters Measured In Situ and Ex Situ

During the pilot year of the monitoring program, in situ and ex situ parameters were measured at four sampling points, which are illustrated in Figure 4. The georeferential locations are presented in UTM (Universal Transversal Mercator) coordinates. The sampling point P1 is located at the beginning of the lagoon system with the coordinates 592549 E and 8197635 N; P2 is in the Milluni Chico lagoon with UTM 589887 E and 8193022 N; P3 is located in the drinking water storage dam in the Milluni Grande lagoon with UTM 589147 E and 8190424 N; the last sampling point, P4, at UTM 592251 E and 8186615 N, is located at the exit of the lagoon system.
The results of the monitoring of the five parameters measured in situ, which were temperature, turbidity, pH, dissolved oxygen, and conductivity, are presented in Table 1. The highest turbidity was found at point 4 for all the months monitored. The lowest pH occurred in points 2 and 3, exposing an acid character in the waters of these points. The dissolved oxygen range for all points is acceptable, denoting that there are no anoxic conditions. Finally, it was observed that the highest conductivities are present at points 2 and 3, for all the monitored months.
In addition, relating the values presented in Table 1 with the locations of the monitored points, we can say that:
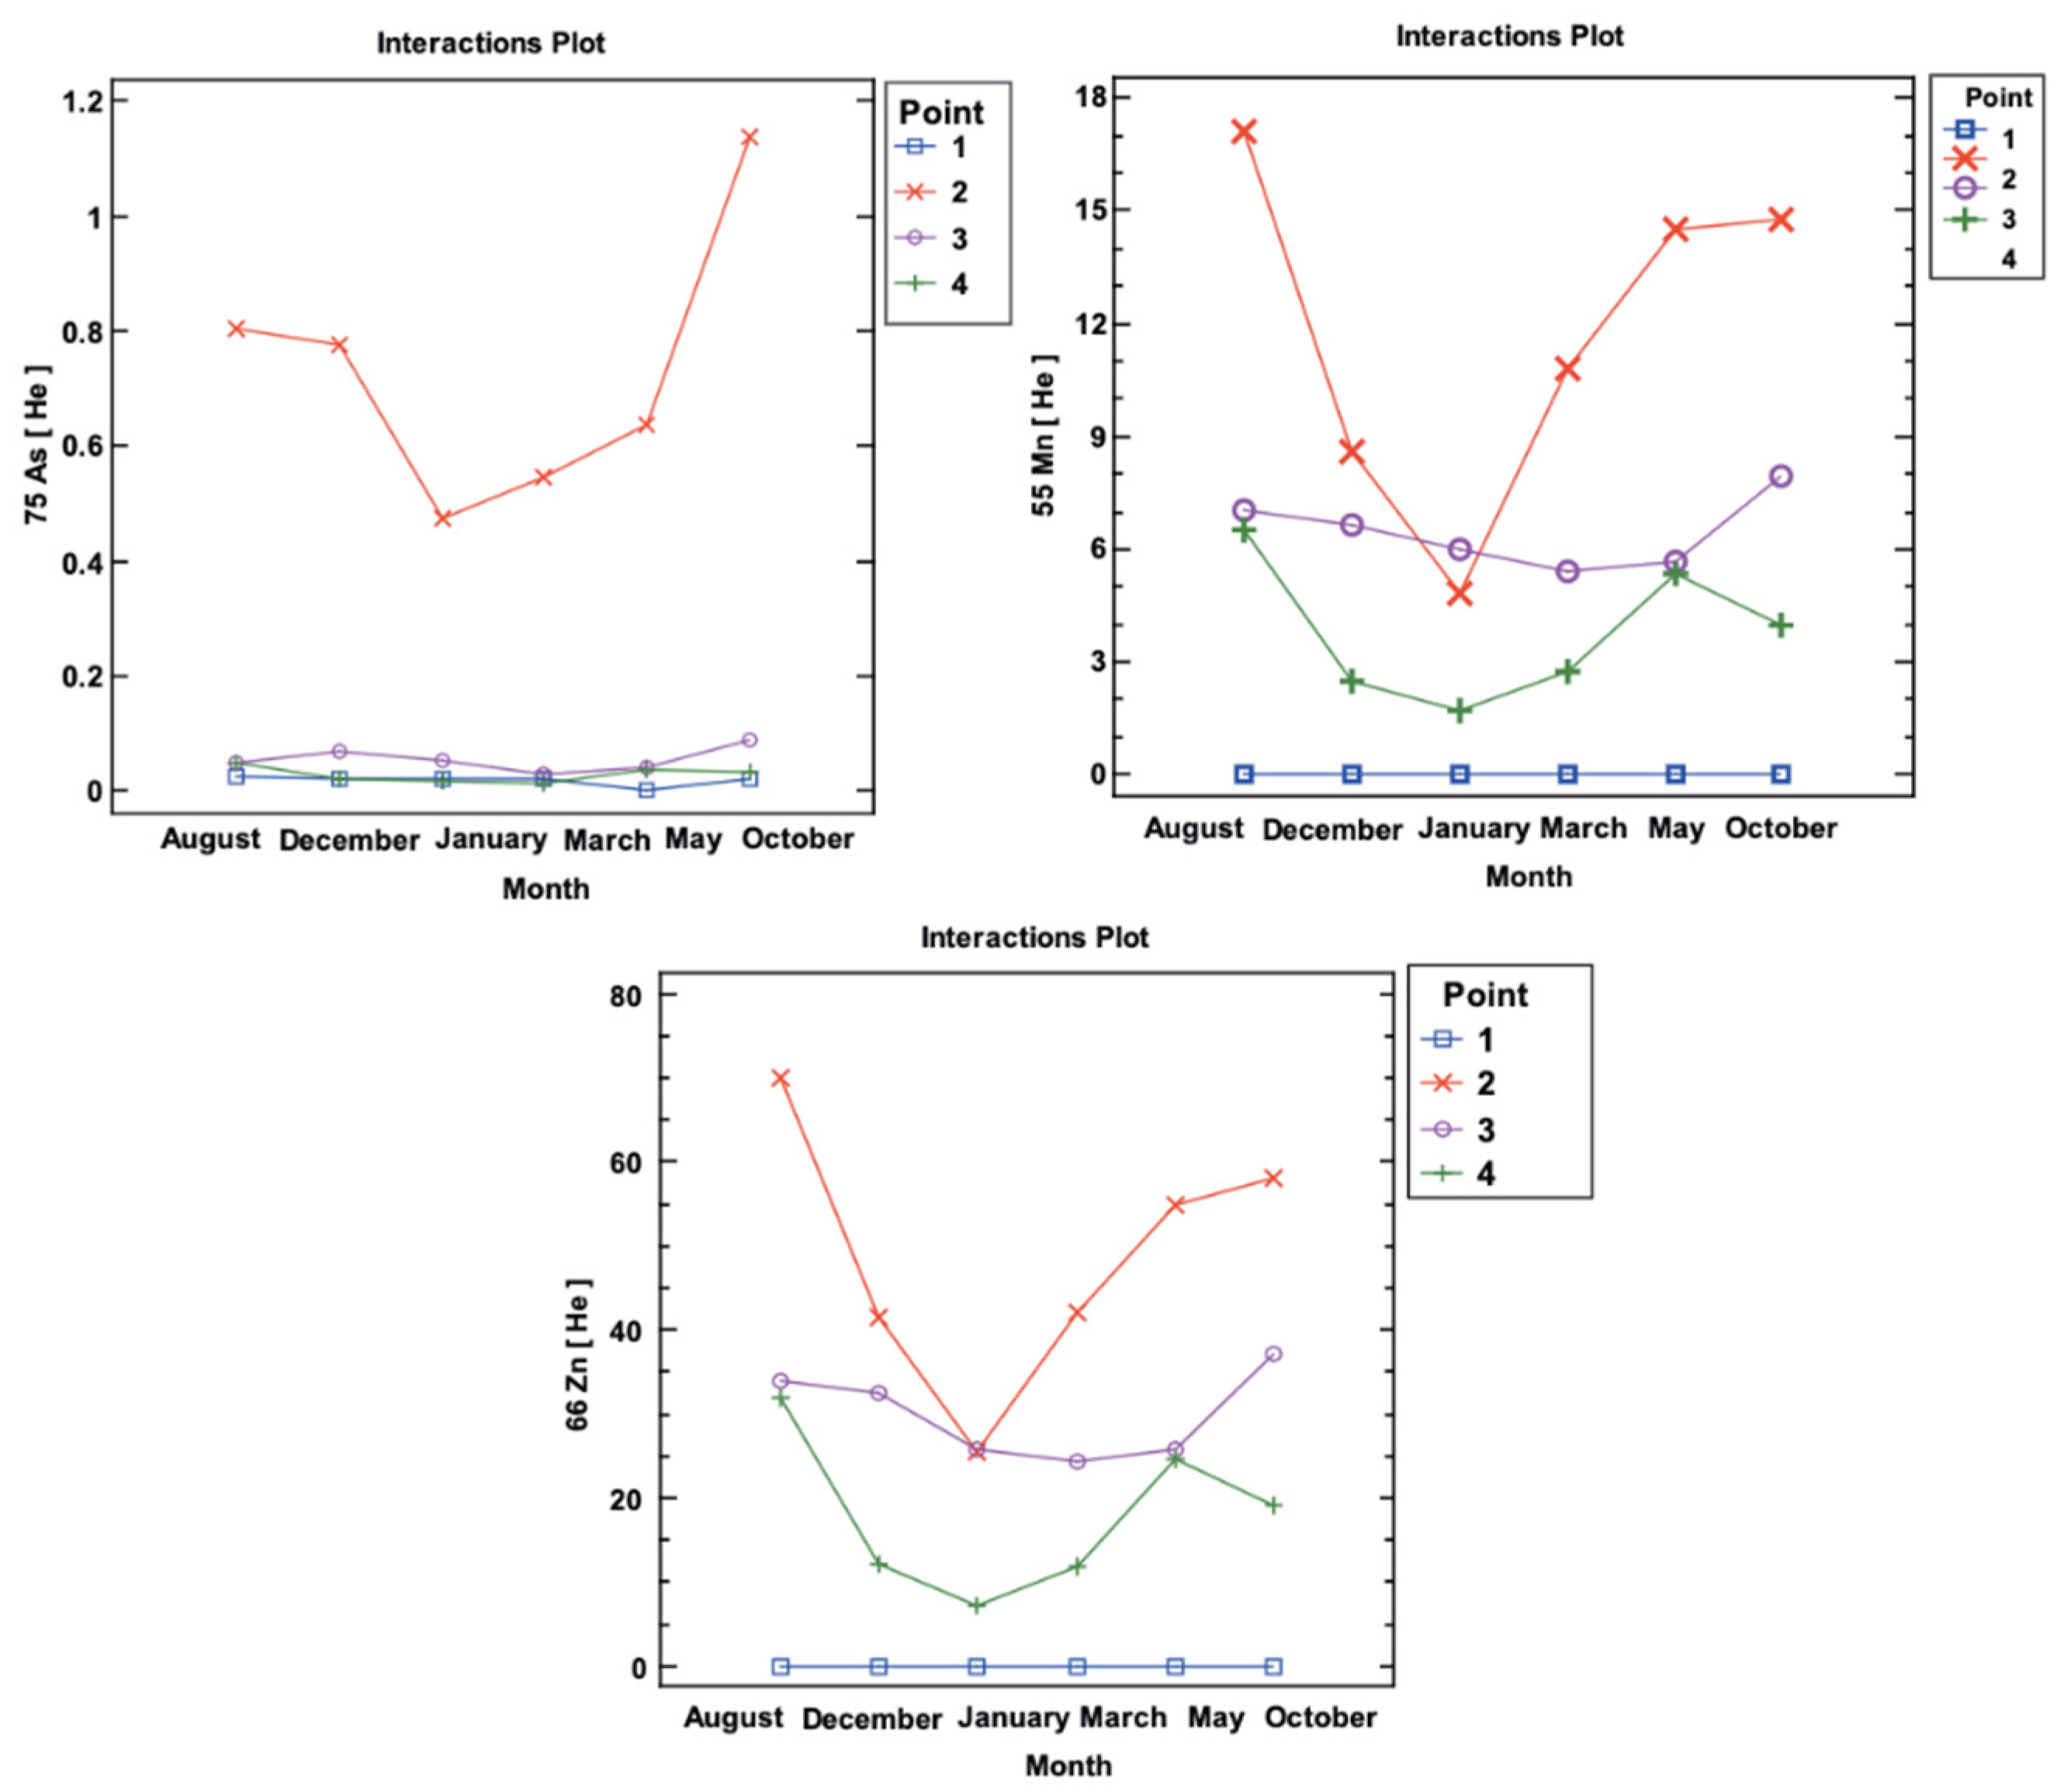
  • The first point, located at the headwaters of the Milluni water system, is the least polluted, verifying the values obtained with the Bolivian regulation 1333 in its Water Pollution Regulation.
  • The effluent from the Milluni Chico Lagoon is the most polluted point (2), and this can be attributed to the mining activity that takes place around it, because it has an acid character and high conductivities.
  • At the third point a water storage dam is located, which is supposed to have a superior water quality. The results prove that the natural water sources that are the tributaries of the Milluni Grande lagoon are negatively impacted by anthropogenic activities in the area.
  • The fourth point shows that the pretreatment applied to the effluent from the dam is not adequately conditioning the water for its entrance into the purification plant, posing a risk to its correct operation.
Regarding the parameters measured ex situ, the maximum concentration limits (MCL) of heavy metals in drinking water have been established by international organizations such as the World Health Organization (WHO) and the United States Environmental Protection Agency (EPA). Many countries have adopted these LCMs in their regulatory standards to avoid risks to public health, as is the case of Bolivia in NB 512 [46]. From the monitoring carried out in Milluni, 33 metal ions were analyzed (ex situ parameters), confirming the presence of arsenic, zinc, and manganese in concentrations that exceed the national regulation of drinking water, which are 0.01, 5, and 0.05 ppm, respectively.
The study of metal ions is important due to their high toxicity [47]. The excessive concentrations found can be highly toxic to living beings and because they are pollutants that are difficult to eliminate in water treatment plants that do not have specific processes for their removal [48]. Only three heavy metals that exceed the MCL were analyzed in this study. These were selected due to their high toxicity (arsenic), their high concentration detected (zinc), and their persistence in the area (manganese). For these reasons, these metals were the basis for the statistical analysis presented below.

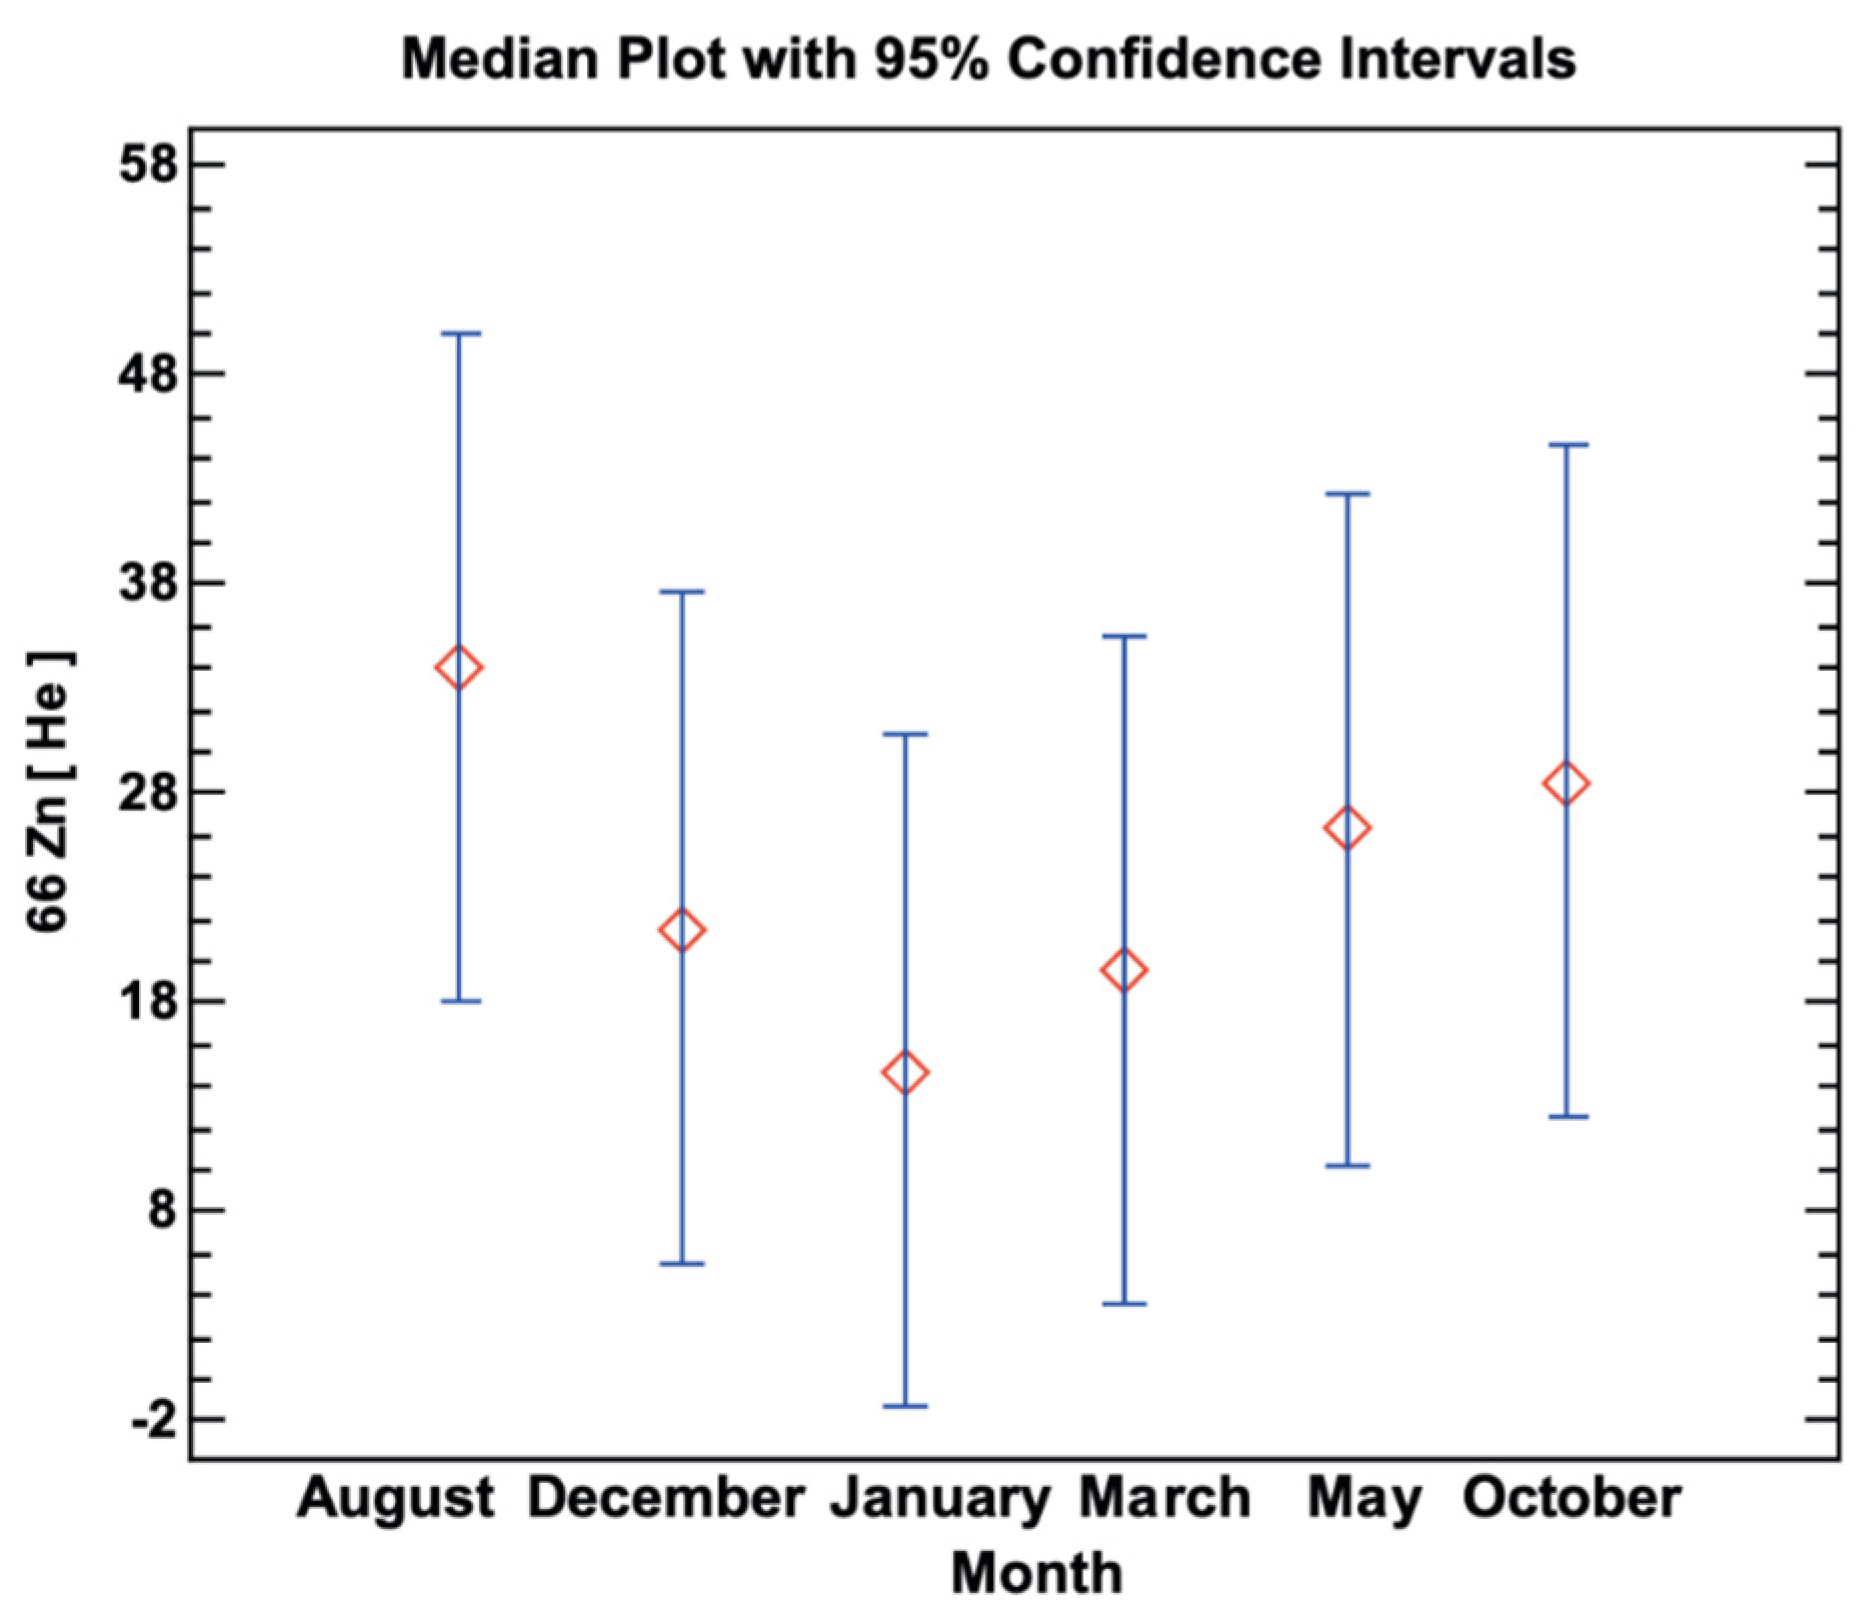
3.2. Analysis of Sampling Frequency at Different Points

Following detection of concentrations outside the permissible limits of manganese (Mn), arsenic (As), and zinc (Zn), multifactorial analysis of variance was performed for these metals. This analysis seeks to detect interactions between the sampling frequency, in this case by months and sampling points. In none of the three cases were significant interactions detected between both factors. In general, it appears that the least number of metals were found in January at all points. In the case of Mn and Zn, it is possible to see that January is the only month in which the concentration is the same between points 2 and 3, as can be seen in the example in Figure 5.
Analysis of variance by factors was performed for the three metals after ruling out the presence of significant interactions. In the three cases, p-values of 0.05 were obtained for the analysis of the effect of the sampling time (month). It was concluded, for the three metals, that there is no significant effect of the time of sampling. The only trend that can be observed in the graphs is that the lowest concentration of any of the three metals appears to occur in January, and the highest concentrations appear to occur in August. An example of this can be seen in Figure 6. Full analysis can be found in Supplementary Materials Figures S1–S26 and Tables S1–S15.
In the three metals analyzed, the same behavior is seen when the effect of the sampling point factor with respect to the metal concentration is analyzed. In all cases, a p-value of 0.000 was obtained (Table 2), and the point at which the highest concentration of metals was point 2, followed by point 3, point 4, and, finally, point 1. An example of this is seen in Figure 7.

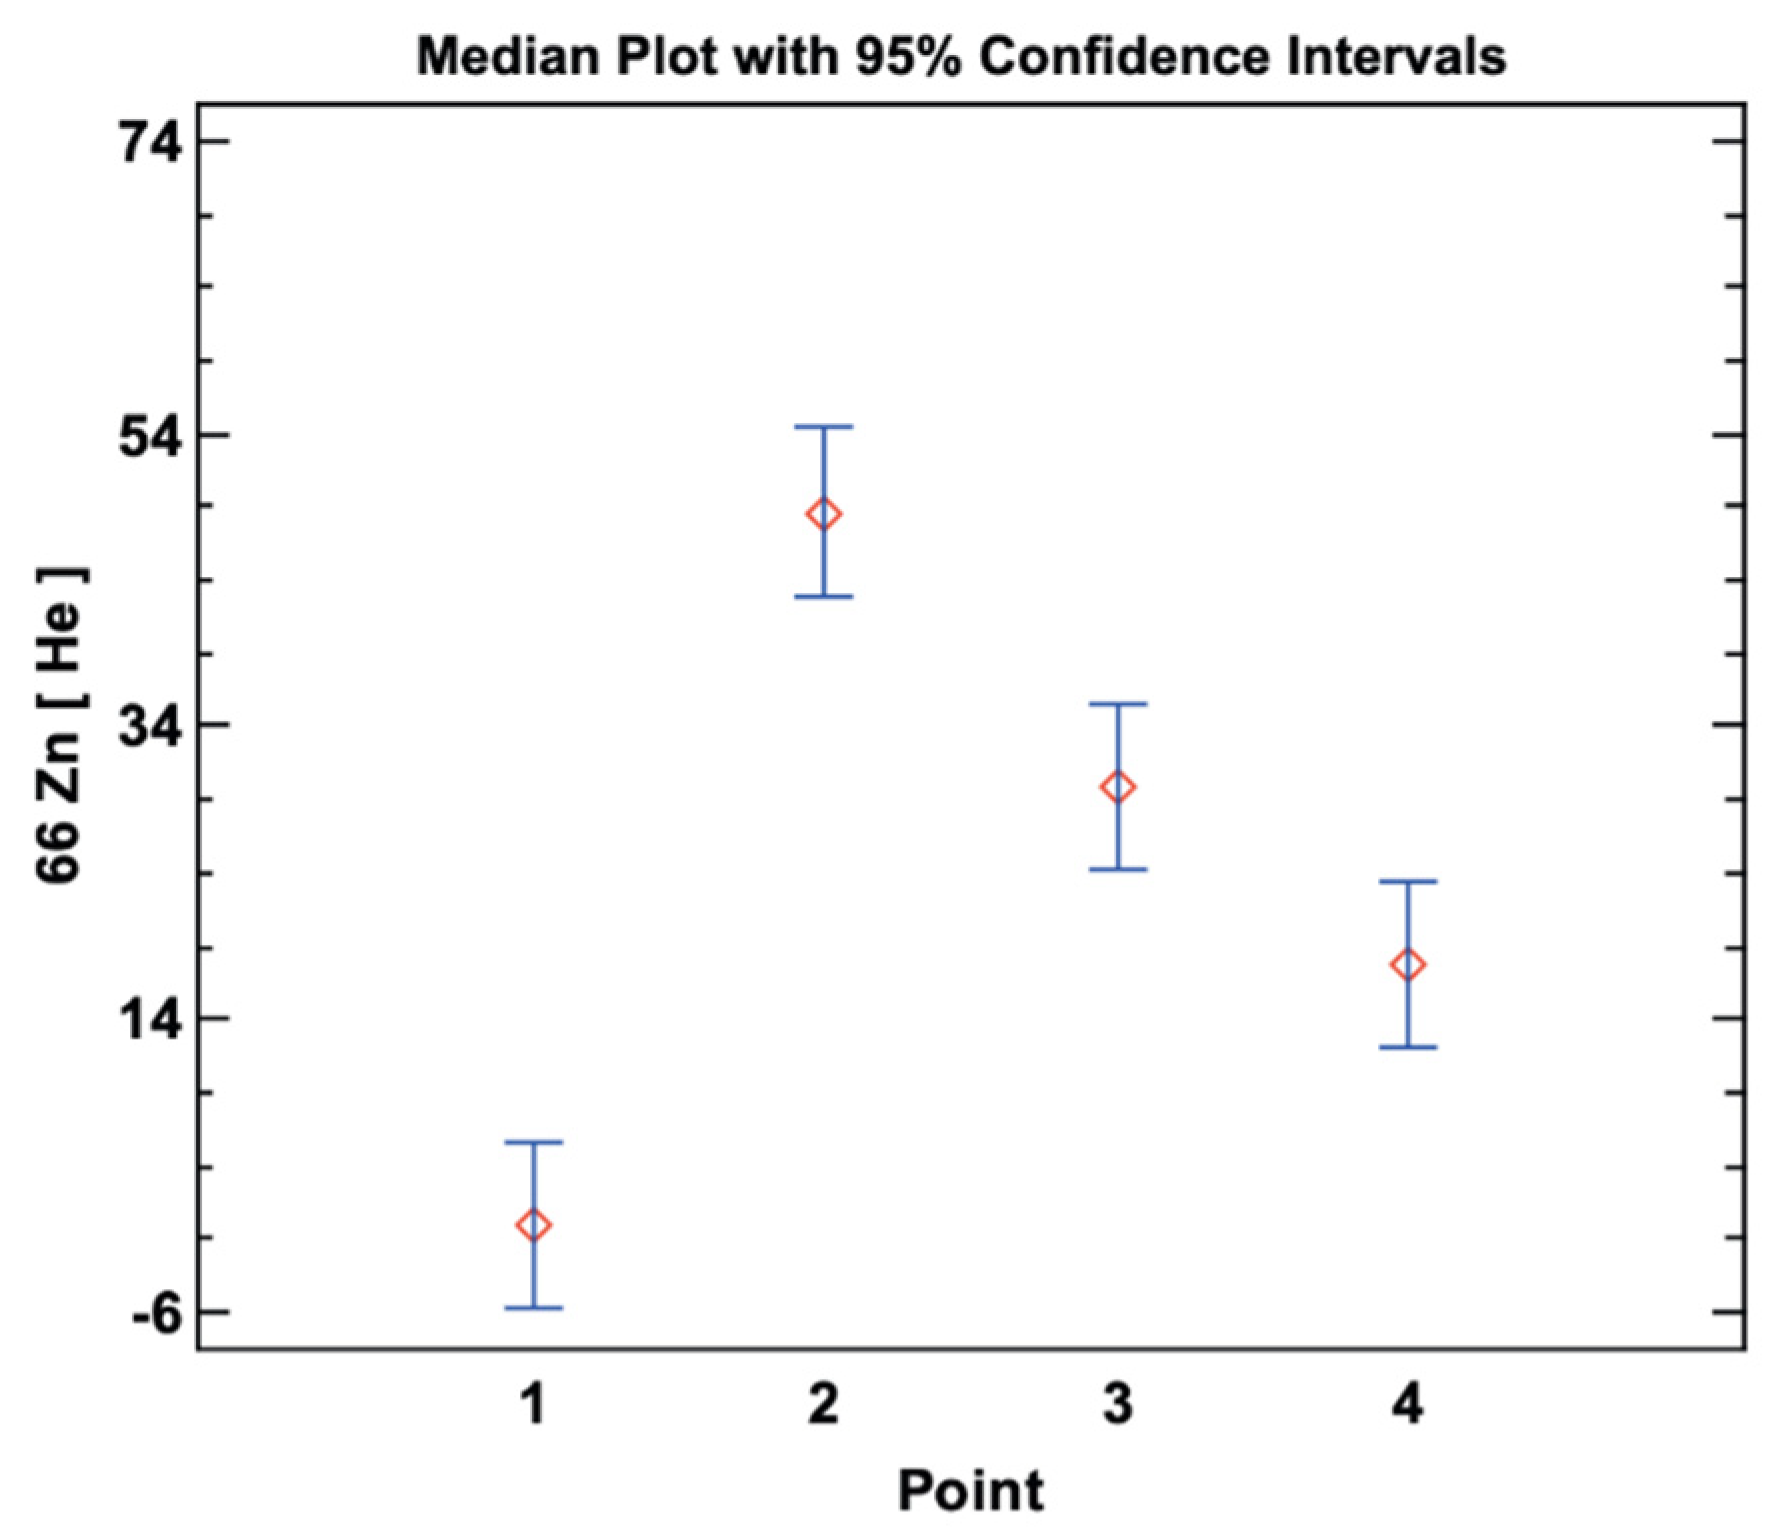
3.3. Search for Indicators for High Metal Concentration

First, a multiple regression adjustment was made between the pH and conductivity values as independent variables in contrast to the metal concentration. Due to the high correlation between the pH and conductivity factors, it was not possible to model the concentration of the three metals with these two factors, and the pH also appeared as non-significant in both the multiple and simple regressions. As an alternative, both variables were analyzed separately with the three metals’ concentrations, transforming the pH into a factor (acid or basic), and keeping the conductivity as numerical. The results in both cases are summarized in the following points.

3.3.1. Validation of the Hypothesis on the Effect of pH

Following the transformation of the pH values into acid (<6) and neutral (from 7) levels, because there are no pH levels to be considered basic, ANOVA was carried out. In the three cases, the results coincide, showing that the three metals’ concentrations are significantly higher in acidic pH than in neutral pH, as can be seen in Table 3 and Figure 8.

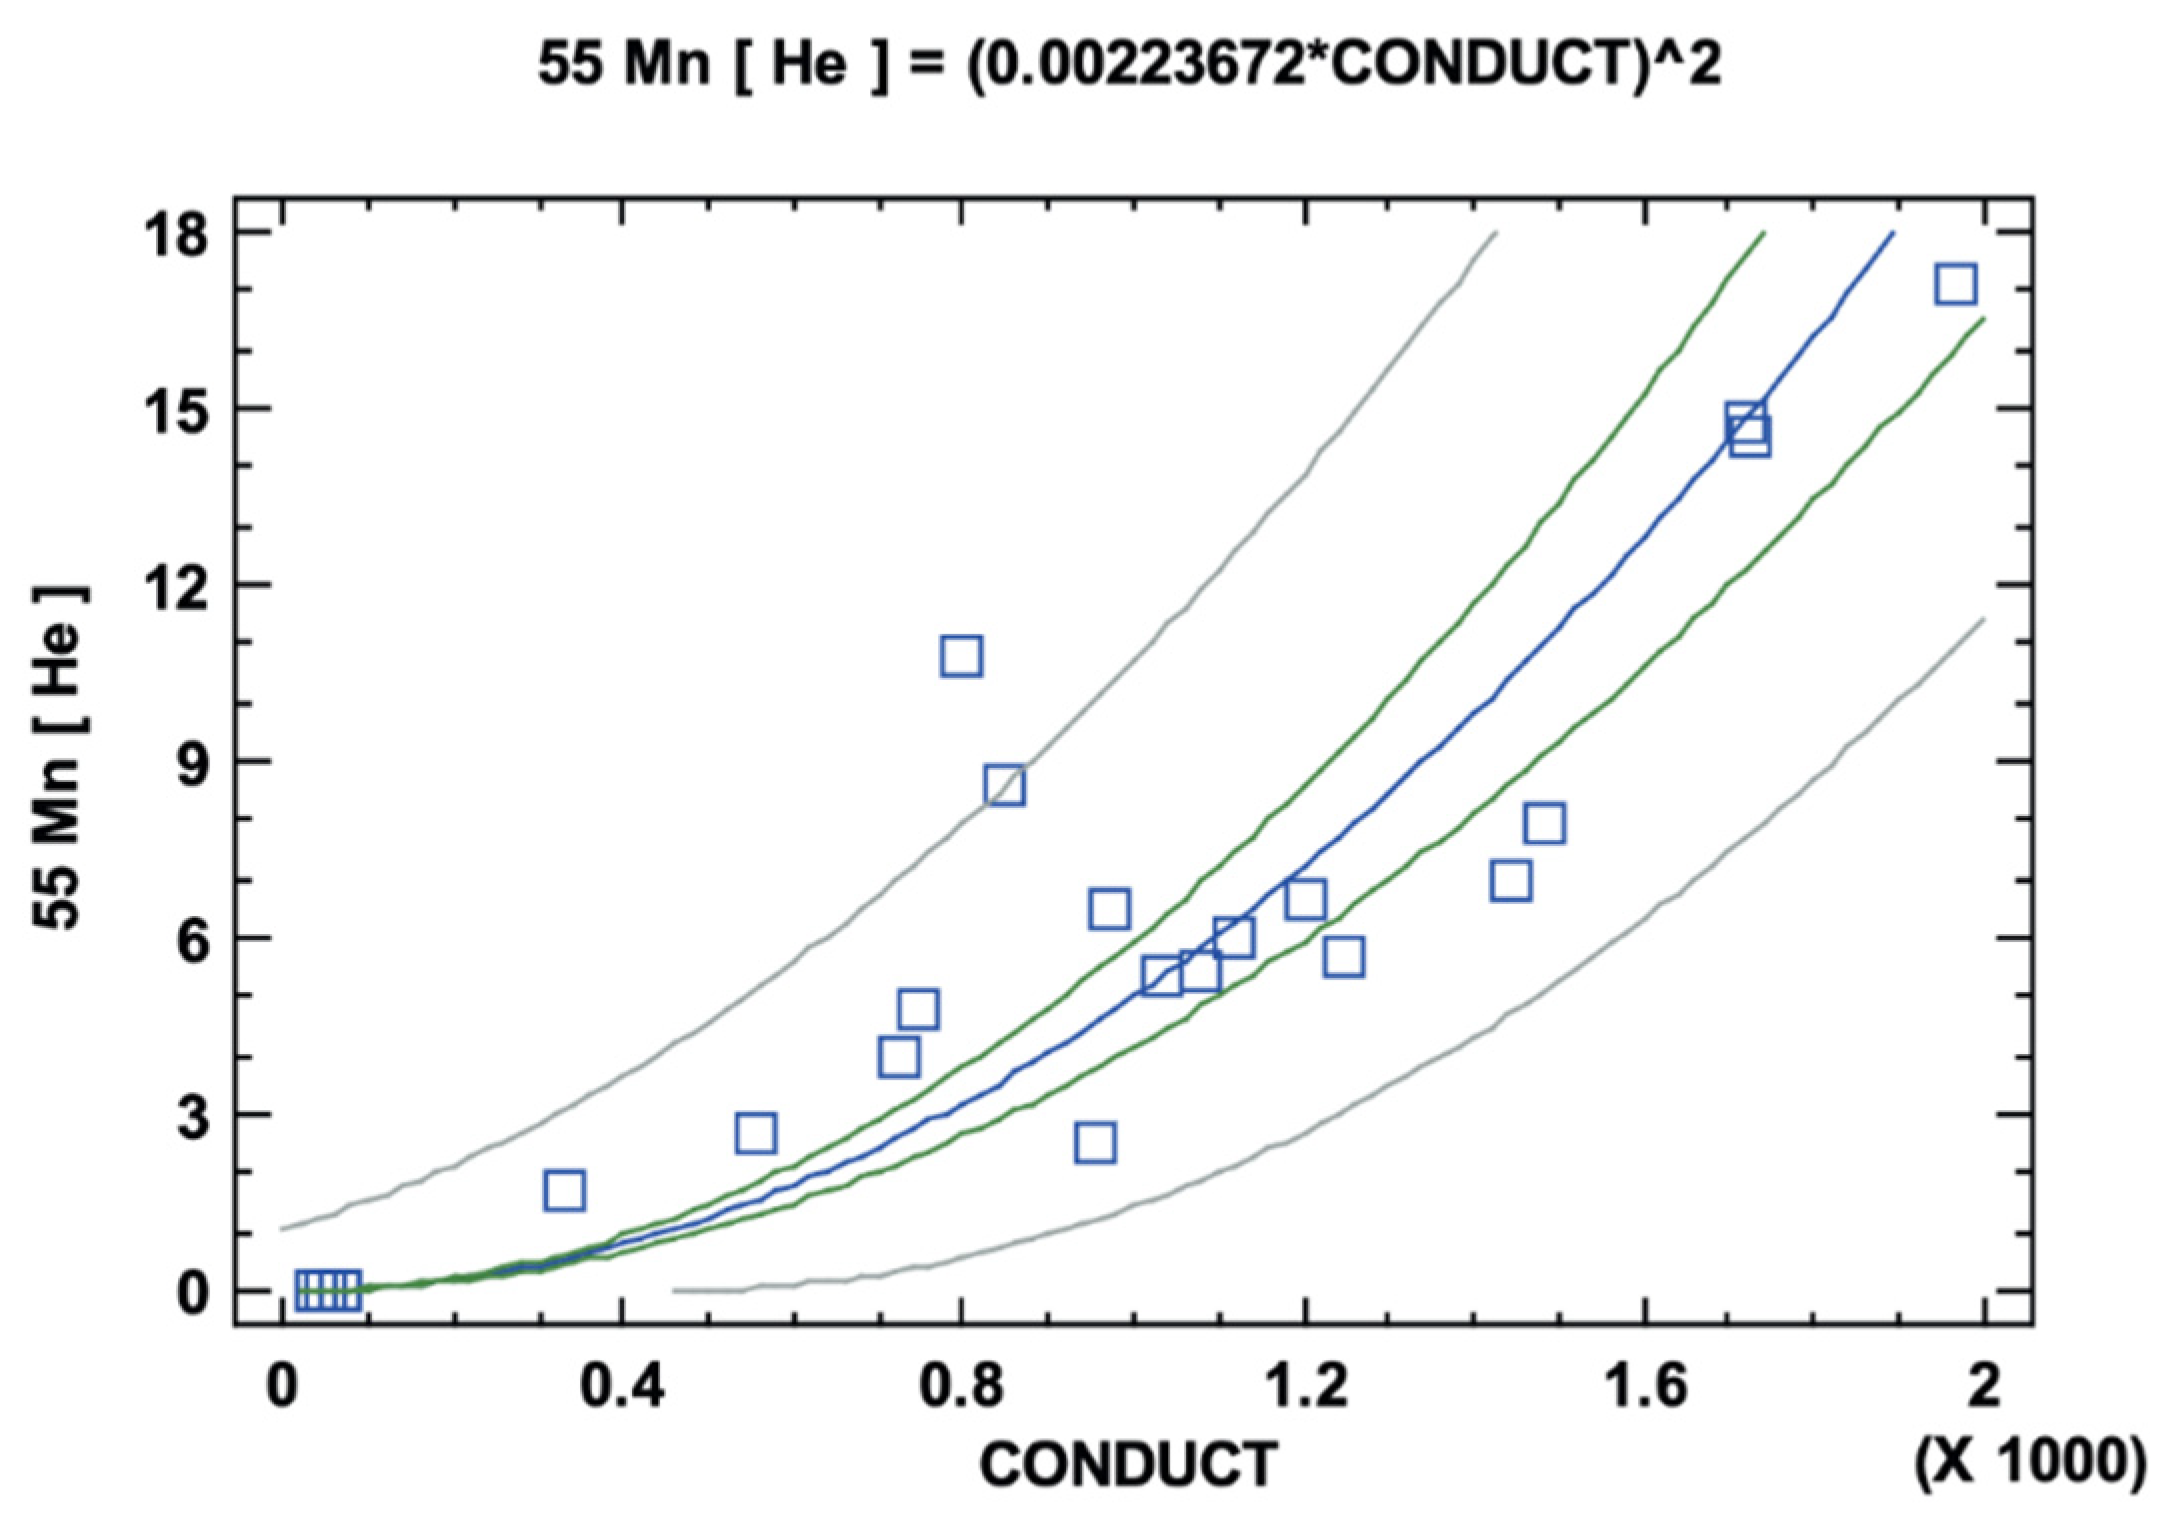
3.3.2. Hypothesis Validation of the Effect of Measured Conductivity

Conductivity appeared as a significant dependent variable in multiple regression modeling attempts. It was decided to search for the model with the best fit using linear regression. After comparing the models in the three metals, it was concluded that the model with the best fit was the square root of Y:Y = (b × X)2. In the example shown for the analysis of the Mn concentration, a correlation coefficient of 0.98 and an R-square of 95.8% were obtained (Table 4). The fit of the model was improved by eliminating the non-significant constant, leaving a positive relationship between the conductivity values and that of the three metals analyzed, as can be seen in Figure 9.

4. Discussion

Safe water is linked to, and has a positive impact on, public health. This has been previously corroborated by numerous health studies globally. Thus, water having adequate quality for consumption plays a fundamental role in the race to achieve sustainable development in different nations. Considering that surface water resources are not infinite, maintaining water quality is a necessity for the survival of living things. Thus, it is very important to design and validate water quality monitoring programs to preserve the quality of water from natural sources.
The results of the pilot year of the monitoring program for the upper part of the Milluni micro-basin were statistically analyzed to validate its components. The aim was to optimize the economic, technical, and time resources for future implementation of the program. Milluni was monitored six times to observe the dynamics of the pollutants throughout the year.
The problem of access to safe water, as previously mentioned, is linked to the issue of public health. Therefore, an environment without degradation does not affect the health of the people and is an important requirement to achieve sustainable development. This initial study of the water quality of the upper part of the Milluni micro-basin shows that the contamination of heavy metals has negatively impacted the natural sources of water, exposing public health to a significant risk. This problem must be addressed to ensure access to safe water for the population.

5. Conclusions

It was shown that there is no variation in the concentration of pollutants within the wet and dry seasons. However, there is a significant variation that contrasts the two seasons. Therefore, it was established that the valid monitoring frequency for the program can be changed from that used in the pilot study. Monitoring should be carried out twice a year in the most representative months of each season, which were determined to be January for the wet season and August for the dry season.
The pH and conductivity parameters measured in situ, considered as basic control parameters in the Bolivian Regulation 512 [38] and other regulations on the quality of drinking water, were related to the presence of metal ions detected outside the permissible limits (As, Mn, and Zn). This was corroborated by the statistical analysis carried out. Thus, both pH and conductivity were found to be indicators of the presence of heavy metals. These two parameters should not replace specific heavy metal monitoring but can be a low-cost alternative to additional metal ion monitoring, with the aim of continuous control of the quality of the surface resources of Milluni without adding additional costs to the proposed monitoring program.
Regarding the other components of the monitoring program, such as objective, purpose, sampling points, sampling protocol, and variables measured, it was concluded that they are adequate and aligned, and can be incorporated into the water management system of the Katari macro-basin, to which Milluni belongs.
According to the statistical analysis carried out, which can be seen specifically in Figure 5 and Figure 9, the source of the Milluni water system (monitoring point 1) does not exhibit contamination, meaning that it is not negatively impacted by external factors. However, points 2, 3, and 4 are contaminated by toxic heavy metals resulting from mining activities in the area. Finally, it should be noted that point 2 is the most polluted sector of Milluni, and the degradation of the quality of its waters is very high, according to observations of the results of the parameters analyzed. The effluents from Laguna Milluni Chico (where point 2 is located) are tributaries of Laguna Milluni Grande, where the storage dam is located (point 3). This indicates that the contaminated effluents from point 2 are decreasing the quality of the water at point 3. The above findings suggest Milluni must be continuously monitored to avoid a risk to public health.
Future research should seek to provide a comprehensive solution to the problem of water contamination in the lagoon system in the upper part of the Milluni basin. Although the main challenge is solving the problem of water quality, the soils and ecosystems that surround the basin should also not be neglected.

Supplementary Materials

The following are available online at https://www.mdpi.com/article/10.3390/environments9010004/s1, Excel file: Table S1: Results in situ parameters, Table S2: Results ex situ parameters, Table S3: Heavy metal selection methodology, and Table S4: Precipitation in Milluni. Word file containing Figure S1: MANOVA: Point and month interaction, Figure S2: ANOVA point, Table S5: ANOVA table for 55 Mn [He] by Point, Figure S3: Median plot with 95% confidence intervals, Figure S4: ANOVA month, Table S6: ANOVA table for 55 Mn [He] by Month, Figure S5: Median plot with 95% confidence intervals, Figure S6: 66 Zn [He] MANOVA: Point and month interaction, Table S7: ANOVA Table for 66 Zn [He] by Point, Figure S7: Box Plot, Figure S8: Median plot with 95% confidence intervals, Table S8: ANOVA Table for 66 Zn [He] by Mont, Figure S9: Box Plot, Figure S10: Median plot with 95% confidence intervals, Figure S11: 75 As [He]-MANOVA: Point and month interaction, Figure S12: ANOVA: point, Table S9: ANOVA for 75 As [He] per Plot, Figure S13: Median plot with 95% confidence intervals, Figure S14: ANOVA: month, Table S10: ANOVA for 75 As [He] per Month, Figure S15: Median plot with 95% confidence intervals, Figure S16: CONCENTRATION- MANOVA: metal an d month interaction, Table S11: ANOVA Table for CONC by METAL, Figure S17: Box plot, Figure S18: Median plot with 95% confidence intervals, Table S12: ANOVA table for CONC by Month, Figure S19: Box plot, Figure S20: Median plot with 95% confidence intervals, Table S13: ANOVA Table by 55 Mn [He] by pH, Figure S21: Box plot, Figure S22: Median plot with 95% confidence intervals, Table S14: ANOVA Table for 66 Zn [He] by pH, Figure S23: Box plot, Figure S24: Median plot with 95% confidence intervals, Table S15: ANOVA Table for 75 As [He] by pH, Figure S25: Box plot, Figure S26: Median plot with 95% confidence intervals.

Author Contributions

P.A.A.T.: Conceptualization, Data curation, Formal analysis, Investigation, Writing–Original Draft, Writing Review, Editing, Visualization & Funding acquisition. E.M.V.M.: Visualization, Writing Review, Editing. B.M.V.: Statistical analysis methodology, Investigation & Visualization. J.L.G.: Review and Visualization. J.I.T.-L.: Project administration, Writing Review & Editing. V.G.L.-I.-F.: Supervision, Writing Review & Editing. All authors have read and agreed to the published version of the manuscript.

Funding

This work was supported by The Universidad Católica Boliviana-Academic Units of La Paz and Tarija, and PROGRAMA ADSIDEO-2018 Development Cooperation Center Of the Universitat Politècnica de València.

Institutional Review Board Statement

Not applicable.

Informed Consent Statement

Not applicable.

Acknowledgments

The research has been carried out with the support of the Center for Research in Water, Energy and Sustainability (CINAES) of the Environmental Engineering career of the Universidad Católica Boliviana, and the Tarija headquarters of the Universidad Católica Boliviana. The research has been co-funded by PROGRAMA ADSIDEO-2018 Development Cooperation Center of the Universitat Politècnica de València.

Conflicts of Interest

The authors declare no conflict of interest.

References

  1. Haider, L.J.; Boonstra, W.J.; Peterson, G.D.; Schlüter, M. Traps and Sustainable Development in Rural Areas: A Review. World Dev. 2018, 101, 311–321. [Google Scholar] [CrossRef] [Green Version]
  2. Tkaczyk, A.; Mitrowska, K.; Posyniak, A. Synthetic organic dyes as contaminants of the aquatic environment and their implications for ecosystems: A review. Sci. Total Environ. 2020, 717, 137222. [Google Scholar] [CrossRef] [PubMed]
  3. Ha, P.T.T.; Kokutse, N.; Duchesne, S.; Villeneuve, J.-P.; Bélanger, A.; Hien, H.N.; Toumbou, B.; Bach, D.N. Assessing and selecting interventions for river water quality improvement within the context of population growth and urbanization: A case study of the Cau River basin in Vietnam. Environ. Dev. Sustain. 2016, 19, 1701–1729. [Google Scholar] [CrossRef]
  4. Slaughter, A.; Hughes, D.; Retief, D.; Mantel, S. A management-oriented water quality model for data scarce catchments. Environ. Model. Softw. 2017, 97, 93–111. [Google Scholar] [CrossRef]
  5. Francisco, R.R.; Xiomara, M.Q. Acuerdos de Monitoreo de Calidad del Agua en Estados Unidos de Norte América: Estado del Arte. Vis. Gerenc. 2011, 173–187. Available online: https://www.redalyc.org/articulo.oa?id=465545890013 (accessed on 23 January 2021).
  6. Loucks, D.P.; van Beek, E. Water Resources Planning and Management: An Overview. In Water Resource Systems Planning and Management; Springer: Cham, Switzerland, 2017. [Google Scholar] [CrossRef] [Green Version]
  7. Cairns, M.R. Metering water: Analyzing the concurrent pressures of conservation, sustainability, health impact, and equity in use. World Dev. 2018, 110, 411–421. [Google Scholar] [CrossRef]
  8. Langergraber, G.; Muellegger, E. Ecological Sanitation—A way to solve global sanitation problems? Environ. Int. 2005, 31, 433–444. [Google Scholar] [CrossRef] [PubMed]
  9. United Nations. The General Assembly Adopts the 2030 Agenda for Sustainable Development. 2015. Available online: https://www.un.org/sustainabledevelopment/es/2015/09/la-asamblea-general-adopta-la-agenda-2030-para-el-desarrollo-sostenible/ (accessed on 25 June 2021).
  10. Foro Consultivo Científico y Tecnológico, AC. Diagnóstico del agua en las Américas; The InterAmerican Network of Academies of Sciences: Irvine, CA, USA, 2012; ISBN 978-607-9217-04-4. Available online: https://www.ianas.org/water/book/mexico.pdf (accessed on 20 February 2021).
  11. Chatelain, D.; Wittinton, H.M. Evaluación de los Recursos Hídricos en Bolivia, Sur América. In Seminario de los Recursos Hídricos en Bolivia y su Dimensión Ambiental: Políticas, Planificación, Aspectos Legales, Aprovechamiento y Calidad de Aguas, Manejo de Cuencas, Degradación, Contaminación y Estudios; Ricaldi, V., Flores, C., Anaya, L., Eds.; AROL: Cochabamba, Bolivia, 1992; pp. 133–136. [Google Scholar]
  12. Pereira, M.A.; Marques, R.C. The ‘Sustainable Public Health Index’: What if public health and sustainable development are compatible? World Dev. 2021, 149, 105708. [Google Scholar] [CrossRef]
  13. AECID. Programa de Gestión Integral del Agua en Areas Urbanas; AECID: La Paz, Bolivia, 2020. [Google Scholar]
  14. WHO. Proporción de la Población que Usa Instalaciones de Saneamiento Mejoradas. 2015. Available online: https://www.esglobal.org/bolivia-agua-una-relacion-complicada/ (accessed on 7 November 2021).
  15. WHO. Agua y Saneamiento. Joint Monitoring Programme, JMP. 2017. Available online: https://www.paho.org/es/temas/agua-saneamiento (accessed on 7 November 2021).
  16. WHO. World Health Organization Guidelines for Drinking Water Quality; WHO: Geneva, Switzerland, 2021; Volume 1. [Google Scholar]
  17. Chapman, D.V.; World Health Organization; Unesco & United Nations Environment Programme. Water Quality Assessments: A Guide to the Use of Biota, Sediments and Water in Environmental Monitoring, 2nd ed.; Chapman, D., Ed.; E & FN Spon: London, UK, 1996; Available online: https://apps.who.int/iris/handle/10665/41850 (accessed on 15 February 2021).
  18. Autoridad Nacional del Agua, ANA. Protocolo de Monitoreo de la Calidad de los Recursos Hídricos. 2011. Available online: https://www.gwp.org/globalassets/global/gwp-sam_files/publicaciones/varios/2011-protocolo-anaperu.pdf (accessed on 15 January 2021).
  19. Fu, H.-Z.; Wang, M.-H.; Ho, Y.-S. Mapping of drinking water research: A bibliometric analysis of research output during 1992–2011. Sci. Total Environ. 2013, 443, 757–765. [Google Scholar] [CrossRef] [PubMed]
  20. Da Rocha, M.P.; Dourado, P.L.R.; Cardoso, C.A.L.; Candido, L.S.; Pereira, J.G.; De Oliveira, K.M.P.; Grisolia, A.B. Tools for monitoring aquatic environments to identify anthropic effects. Environ. Monit. Assess. 2018, 190, 61. [Google Scholar] [CrossRef] [PubMed] [Green Version]
  21. Rivero, N.P.P.; Morais, D.C.; Pereira, L.D.S. Assessment of actions to tackle the shortages of water in La Paz, Bolivia. Hydrol. Res. 2020, 22, 177–192. [Google Scholar] [CrossRef] [Green Version]
  22. Alvizuri Tintaya, P.A.; Torregrosa López, J.I.; Lo Iacono Ferreira, V.G.; Salinas Villafañe, O.R. Heavy metals problem in micro basin that feeds a drinking water dam, Milluni—Bolivia case. In Proceedings of the XXIII International Congress on Project Management and Engineering, Málaga, Spain, 10–12 July 2019; Available online: http://dspace.aeipro.com/xmlui/handle/123456789/2396 (accessed on 20 June 2021).
  23. Public Social Company of Water Sanitation EPSAS. Capacidad de Fuentes. 2013. Available online: https://www.epsas.com.bo/web/ (accessed on 8 April 2021).
  24. Salvarredy-Aranguren, M.M.; Probst, A.; Roulet, M.; Isaure, M.-P. Contamination of surface waters by mining wastes in the Milluni Valley (Cordillera Real, Bolivia): Mineralogical and hydrological influences. Appl. Geochemestry 2008, 23, 1299–1324. [Google Scholar] [CrossRef]
  25. Wang, X.; Sato, T.; Xing, B.; Tao, S. Health risks of heavy metals to the general public in Tianjin, China via consumption of vegetables and fish. Sci. Total Environ. 2005, 350, 28–37. [Google Scholar] [CrossRef] [PubMed]
  26. Zhu, Y.; Fan, W.; Zhou, T.; Li, X. Removal of chelated heavy metals from aqueous solution: A review of current methods and mechanisms. Sci. Total Environ. 2019, 678, 253–266. [Google Scholar] [CrossRef] [PubMed]
  27. Corporación Andina de Fomento. Agua y Saneamiento en el Estado Plurinacional de Bolivia. 2017. Available online: https://scioteca.caf.com/handle/123456789/1081?show=full (accessed on 7 November 2021).
  28. Alvizuri Tintaya, P.A.; Villena Martínez, E.M.; Torregrosa López, J.I.; Lo Iacono Ferreira, V.G.; Lora Garcia, J. Design of a monitoring program with the application of Bolivian Standard NB/ISO 5667-4: A case study of Milluni, Bolivia. In Proceedings of the XXIV International Congress on Project Management and Engineering, Alcoy, Spain, 7–10 July 2020; Available online: http://dspace.aeipro.com/xmlui/handle/123456789/2499 (accessed on 20 July 2021).
  29. Ahlfeld, F.; Schneider-Scherbina, A. Los Yacimientos Minerales y de Hidrocarburos de Bolivia; Departamento Nacional de Geología, Ministerio de Minas y Petróleo: La Paz, Bolivia, 1964. [Google Scholar]
  30. Peñarrieta, L. Estudio del tratamiento de las aguas ácidas provenientes de los pasivos ambientales y desagües de la mina de la cuenca de Milluni del departamento de la Paz-Bolivia. Método de Biodsorción. Reutilización sostenible del espacio minero. In I Simposio Red REUSE y Seminario Internacional de Reconversión de Territorios; Instituto Juan Herrera: Madrid, Spain, 2012; pp. 129–135. Available online: https://www.academia.edu/23257074/Minera%C3%A7%C3%A2o_em_Minas_Gerais_territ%C3%B3rio_e_paisagem_cultural (accessed on 20 May 2021).
  31. SENAMHI. Base de Datos Meteorológico del Servicio Nacional de Meteorología e Hidrología-SISMET. Bolivia. 2021. Available online: http://senamhi.gob.bo/index.php/inicio (accessed on 7 November 2021).
  32. Miranda, A.; Arancibia, H.; Quispe, R. Reconocimiento del Patrimonio Geológico y Minero de la Región de Milluni en La Paz Bolivia. 2010, pp. 74–76. Available online: https://www.slideshare.net/neocien/patrimonio-geolgico-y-minero-de-la-regin-de-milluni-enla-paz-bolivia (accessed on 7 November 2021).
  33. Lehmann, B. Memoria explicativa del mapa geológico de Milluni, Cordillera Real (Bolivia). Rev. Geocien. Univ. Mayor San Andrés 1978, 2, 187–257. [Google Scholar]
  34. Ríos, C.G. Estudio de la Contaminación Ambiental por las Descargas Mineras de COMSUR en la Represa de Milluni; Universidad Mayor de San Andrés: La Paz, Bolivia, 1985. [Google Scholar]
  35. Raffaillac, E. Estudio in Situ de la Contaminación Minera de la Cuenca Milluni, Mémoire de Stage en Aguas del Illimani; Inédito: La Paz, Bolivia, 2002; p. 96. [Google Scholar]
  36. Iltis, A. Datos Sobre las Lagunas Altura de la Región de la Paz (Bolivie); ORSTOM: La Paz, Bolivia, 1988; 50p, Available online: http://horizon.documentation.ird.fr/exl-doc/pleins_textes/doc34-05/26148.pdf (accessed on 15 February 2021).
  37. Saavedra, C. Plan Nacional de Cuencas de Bolivia. Conference: La Gestión Integral de Cuencas en Los Andes. 2015. Available online: https://www.researchgate.net/publication/281244646_Plan_Nacional_de_Cuencas_de_Bolivia (accessed on 20 January 2021).
  38. United Nations Environment Programme and World Health Organization, UNEP/WHO. Water Quality Monitoring—A Practical Guide to the Design and Implementation of Freshwater Quality Studies and Monitoring Programmes; Bartram, J., Balance, R., Eds.; United Nations Environment Programme and the World Health Organization: Geneva, Switzerland, 1996; ISBN 0419223207. Available online: https://www.who.int/water_sanitation_health/resourcesquality/waterqualmonitor.pdf (accessed on 18 February 2021).
  39. International Organization for Standardization. ISO 5667-4: Water Quality—Sampling—Part 4: Guidance on Sampling from Lakes, Natural and Man-Made; ISO: Geneva, Switzerland, 2016. [Google Scholar]
  40. International Organization for Standardization. ISO 5667-1: Water Quality—Sampling—Part 1: Guidance on the Design of Sampling Programmes and Sampling Techniques; ISO: Geneva, Switzerland, 2006. [Google Scholar]
  41. Saha, N.; Rahman, M.S. Multivariate statistical analysis of metal contamination in surface water around Dhaka export processing industrial zone, Bangladesh. Environ. Nanotechnol. Monit. Manag. 2018, 10, 206–211. [Google Scholar] [CrossRef]
  42. Adeleke, B.; Robertson-Andersson, D.; Moodley, G. Comparative analysis of trace metal levels in the crab Dotilla fenestrata, sediments and water in Durban Bay harbour, Richards Bay harbour and Mlalazi estuary, Kwazulu-Natal, South Africa. Heliyon 2020, 6, e04725. [Google Scholar] [CrossRef] [PubMed]
  43. Ugbede, F.O.; Aduo, B.C.; Ogbonna, O.N.; Ekoh, O.C. Natural radionuclides, heavy metals and health risk assessment in surface water of Nkalagu river dam with statistical analysis. Sci. Afr. 2020, 8, e00439. [Google Scholar] [CrossRef]
  44. Statgraphics. Statgraphics Centurion XVIII. 2018. Available online: https://statgraphics.net/ (accessed on 7 November 2021).
  45. Crittenden, J.C.; Rhodes Trussell, R.; Hand, D.W.; Howe, K.J.; Tchobanoglou, G. MWH’s Water Treatment: Principles and Design, 3rd ed.; John Wiley & Sons, Inc.: Hoboken, NJ, USA, 2012. [Google Scholar]
  46. Norma Boliviana NB 512: Agua Potable—Requisitos; Ibnorca: La Paz, Bolivia, 2021.
  47. Wang, Y.; Qiao, M.; Liu, Y.; Zhu, Y. Health risk assessment of heavy metals in soils and vegetables from wastewater irrigated area, Beijing-Tianjin city cluster, China. J. Environ. Sci. 2012, 24, 690–698. [Google Scholar] [CrossRef]
  48. Zamora-Ledezma, C.; Negrete-Bolagay, D.; Figueroa, F.; Zamora-Ledezma, E.; Ni, M.; Alexis, F.; Guerrero, V.H. Heavy metal water pollution: A fresh look about hazards, novel and conventional remediation methods. Environ. Technol. Innov. 2021, 22, 101504. [Google Scholar] [CrossRef]
Figure 1. Precipitation total in Milluni. Source: Own elaboration based on data from SENAMHI, 2021.
Environments 09 00004 g001
Figure 2. Location of the micro-basin and distribution of the monitored points. Source: Own elaboration, 2021.
Environments 09 00004 g002
Figure 3. Methodological scheme of the implementation of the pilot year of the monitoring program in Milluni. Source: Own elaboration, 2021. The three parts of the methodology implemented in this work are detailed in the following sections.
Environments 09 00004 g003
Figure 4. Sampling points in Milluni.
Environments 09 00004 g004
Figure 5. Graph of interactions between the month and the sampling point for the concentration of heavy metals.
Environments 09 00004 g005
Figure 6. Graph means with LSD Fisher intervals, for the effect of the month of collection of samples with the concentration of zinc (Zn).
Environments 09 00004 g006
Figure 7. Graph of means with LSD Fisher intervals at 95% confidence, for the effect of the sample collection point with the concentration of Zinc (Zn).
Environments 09 00004 g007
Figure 8. Graph means with LSD Fisher 95% confidence intervals, for the effect of the pH value with the concentration of Manganese (Mn).
Environments 09 00004 g008
Figure 9. Graph of the model adjusted to determine the effect of the conductivity of the water with the concentration of manganese (Mn).
Environments 09 00004 g009
Table 1. Results of the measured in situ parameters.
Sapling MonthPointsParameters Measured In Situ
TemperatureTurbiditypHDissolved
Oxygen
Conductivity
°CNTUmg/LuS/cm
JanuaryP14.54.146.857.3148.3
P210.829.33.325.54745.0
P313.911.73.035.211119.
P417.481.24.165.17331.2
MarchP14.53.217.017.5637.8
P28.820.63.546.01800.0
P39.511.73.455.591080.0
P413.075.34.455.2554.0
MayP14.61.836.77.938.7
P28.73.412.836.591723.0
P39.002.752.767.061246.0
P49.755.82.837.131033.0
AugustP14.003.257.377.6664.9
P210.87.832.786.411966.0
P310.68.072.686.681442.0
P47.71093.387.34972.0
OctoberP16.53.514.65.671.5
P211.55.32.814.991718.0
P314.423.22.675.671486.0
P413.036.93.256.04727.0
DecemberP15.52.546.55.865.2
P210.54.53.234.45850.0
P312.49.82.574.981200.0
P411.367.04.56.1956.0
Source: Own elaboration, 2021. Full data in Supplementary Materials (Tables S1–S3).
Table 2. ANOVA table for Zn concentration as a function of collection point 2.
SourceSum of SquaresDfMean SquareF-Ratiop-Value
Between Groups7543.2432514.4128.430.0000
Intra Groups1768.852088.4427
Total (corr.)9312.0923
Source: Own elaboration, 2021.
Table 3. ANOVA table for Mn concentration as a function of pH.
SourceSum of SquaresDfMean SquareF-Ratiop-Value
Between Groups241.2521241.25216.460.0005
Intra Groups322.4812214.6582
Total (corr.)563.73323
Source: Own elaboration, 2021.
Table 4. Simple regression—Mn vs. conductivity.
Least-Squares Coefficient
ParameterEstimateStandard ErrorT-Statisticalp-Value
Slope0.002236720.000097598922.91750.0000
Variance Analysis
SourceSum of SquaresDfMean SquareF-Ratiop-Value
Model126.5261126.526525.210.0000
Residue5.54082230.240905
Total 132.06724
Correlation coefficient = 0.978798, R-squared = 95.8045%, Model:55 Mn [He] = (0.00223672 × CONDUCT)2
Source: Own elaboration, 2021.
Publisher’s Note: MDPI stays neutral with regard to jurisdictional claims in published maps and institutional affiliations.

