
A Policy Roadmap for the Energy Renovation of the Residential and Educational Building Stock in Italy

1
Dipartimento di Scienze Teoriche e Applicate, Università degli Studi dell’Insubria, 21100 Varese, Italy
2
ECCO, The Italian Climate Change Think Tank, 00184 Rome, Italy
3
Joint Research Center of the European Commission, 21027 Ispra, Italy
*
Author to whom correspondence should be addressed.
Energies 2023, 16(3), 1319; https://doi.org/10.3390/en16031319
Submission received: 30 November 2022
/
Revised: 14 January 2023
/
Accepted: 19 January 2023
/
Published: 26 January 2023
(This article belongs to the Special Issue Building Energy System Planning and Operation)
Abstract
:The building sector is crucial in all of the possible net zero scenarios suggested for the European Union. In this area, the Italian situation is exemplary. Italy suffers from an aging and low-performance building stock and needs to increase its annual rate of energy retrofits in order to achieve its 2030 and 2050 targets. Even though since at least 2007, several different incentives schemes intended to stimulate energy-efficiency interventions have been in place, Italy has not been sufficiently able to promote deep retrofits. In 2020, in order to help the economy recover after the lockdowns that were introduced to face the first phase of the COVID-19 pandemic, the existing incentives were increased to up to 110% of investments for interventions that improved the energy class by at least two grades. This so-called “Superbonus” was also extended to the public social housing sector thanks to a credit assignment scheme. Given the results of this provisional phase, a possible policy roadmap for the energy renovation of the residential and educational building stock in Italy is presented in this paper through an analysis of data related to the implementation of current instruments in terms of number of interventions, investment needed, energy savings and evaluation of potential benefits and costs that can derive from an increase in the current deep-renovation rate. Through definition of a long-term renovation strategy, this paper illustrates how market barriers and other issues in instrument design can be tackled and how policymakers can help to develop a sustainable long-term roadmap for energy-efficient buildings. Beyond the residential sector, public buildings, particularly educational buildings, are taken into consideration as well, as they are places of collective use that represent the social values of fairness and sustainability and can therefore have an exemplary role for private initiatives.
1. Introduction
Climate-change mitigation and adaptation, as well as reduction in global warming, are rapidly emerging as urgent and challenging issues for all, particularly governments. At the end of 2019, the European Commission presented the European Green Deal [1] with the objective of reducing greenhouse gas (GHG) emissions by 55%, compared to the 1990 level, by 2030 and reaching net zero emissions by 2050. Development of renewable sources and reduction in energy consumption, especially in the built environment, represent essential actions to achieve these goals. “The building sector is the largest single energy consumer in Europe” [2], accounting for around 720 Mtoe/y, namely 40% of the entire EU primary energy demand [3], and is responsible for about 36% of CO2 emissions [4]. It represents a central pillar toward a low-carbon future, making a significant contribution to energy savings. While new buildings today consume only half as much as did buildings built in 1980 [2] and are required to be nearly zero-energy buildings (NZEBs) from 2021 onward [5], the bulk of the current building stock, which was built without significant energy-performance requirements, represents a great challenge and opportunity across Europe [6]. The annual growth rate of new buildings in Europe is less than 1% on average; therefore, the impact of new, energy-efficient buildings is limited, and regulatory measures of their energy performance are not enough to achieve 2030 targets [7]. In fact, roughly 75% of Europe’s building stock is energy-inefficient today, and almost 80% of these buildings will still be in use in 2050 [8]. Therefore, it is essential to concentrate actions and policies on the existing building stock and its extensive energy renovation. Through promotion of retrofitting practices, energy-efficiency measures, fossil-fuel phase-outs and a switch to renewables, multiple benefits can be achieved for many stakeholders: (i) A reduction in GHG emissions and other pollutants that are detrimental to human health; (ii) A decrease in the national energy bill and the level of energy dependency from foreign countries; (iii) An increase in firms’ productivity and competitiveness; (iv) Creation of new, skilled jobs [1,9]. Beyond climate and energy, fostering energy-efficiency measures offers significant opportunities for a more socially balanced transformation of the national economy, e.g., creating local construction jobs and alleviating energy poverty. In addition, improvements of indoor comfort levels can have significant positive impacts on people’s living conditions and health.
Although EU member states have already defined a national plan to accelerate building retrofitting actions, they must increase their effort to implement policies with the aim of increasing investments in deep renovations. According to the Buildings Performance Institute Europe [10], a greater effort in increasing renovation rate is essential in the next decade. The current European deep-renovation rate of 0.2% must grow by at least a factor of 10 to reach 2–3% as quickly as possible [10]. In addition, the share of fossil fuels in the energy mix in 2030 needs to decrease by 54% compared to 2015, while the renewable heat and electricity shares should grow to 53% of the final energy demand [10].
Among housing owner–occupiers, initial cost represents an important barrier, so the role of grants in promoting investments is extremely important. It is commonly agreed upon that economic incentives [7] can stimulate an increase in the building renovation rate and that policies should ensure a balance between benefits and costs in order to be attractive to private investors and effective for the whole society [11]. Furthermore, it is worth noting that improving energy efficiency in buildings through well-focused policies is largely recognized as a possible long-term structural solution to energy poverty [12]. In this regard, it is important to analyze the capacity of addressing energy poverty and its impacts on different income groups, in terms of who is paying the costs or who has access to the financial incentives, when estimating the policy’s effectiveness [13]. Beyond financial aspects, other issues can represent barriers to the optimal implementation of energy-saving strategies, such as the growing number and continuous evolution of different incentive schemes. These are pitfalls to the effectiveness of supporting programs [11]. In Italy, incentives are introduced and managed via several governance levels and affected by rapid and continuous modification of their characteristics, thus increasing the risks of developing these pitfalls [11]. In addition, the current Italian tax deduction scheme for energy building renovation was examined in [12]; this highlighted its regressive distributive effect on households, which worsens energy-poverty incidence. It has emerged that low-income households have higher burdens compared to richer households, so these policy reforms should be implemented as compensation among different income classes.
Given these considerations, this work aims to provide policymakers with possible options for improvement of actual Italian subsidy programs through development of a policy roadmap for the energy renovation of the residential and educational building stock. Through an analysis of data related to the implementation of current instruments (in terms of number of interventions, investment needed and energy savings) and an evaluation of potential benefits and costs due to an increase in current deep-renovation rate, a retrofitting roadmap to reach 2050 climate targets is provided. Through definition of a long-term renovation strategy, this paper illustrates how barriers and issues in instrument design can be tackled and how policymakers can help to develop a sustainable and eco-friendly society. Beyond the residential sector, public buildings, particularly educational buildings, are taken into consideration as well, as they are places of collective use that represent the social values of fairness and sustainability and can therefore be examples of the potential of energy-efficiency improvements so as to induce similar activities in private buildings [4].
This paper is structured as follows: The following section provides a description of the Italian context, focusing on the building stock and the policy scenario. Section 3 presents the methodology used to estimate the potential of a deep energy-renovation strategy. Results and policy recommendations are discussed in Section 4. Lastly, Section 5 concludes this paper.
2. The Italian Context
Due to the evolution of international context, since the summer of 2021, the European Union has suffered from an unprecedented increase in the price of the gas supply. Since the Italian energy system is particularly exposed to these price fluctuations, an energy transition became strategic from many points of view.
According to Eurostat statistics, Italian inhabitants represent 17% of the euro area population, and Italy has the third-largest economy in the European Union (EU) [14,15]. However, its exceptionally high public debt (150% of the GDP compared to the EU-27 average of 88%) involves structural impediments to growth [16]. Concerning its energy situation, Italy depends on foreign countries more than it does the other major EU member states for its energy supply (over 73.5% compared to the EU-27 average of 57.6%), partly due to intensive use of natural gas, especially in the residential and service sector (for space heating, water heating and cooking) [17].
The importance of improving energy efficiency in the Italian building stock is recognized by the National Energy and Climate Plan (NECP) [18] and by the Italian Long-Term Renovation Strategy (LTRS) [19], which have set national targets and guidelines to achieve respectively the 2030 and 2050 European objectives. To tackle existing buildings, it is necessary to develop a mix of technical, fiscal and regulatory measures that promote the spread of interventions and increase deep renovations: in particular, those that achieve the NZEB standard [20]. The following subsections describe the Italian building stock and the current Italian policies and targets for energy efficiency.
2.1. The Italian Building Stock
The Italian building stock is quite dated and is responsible for approximately 41.1% of the national final consumption (about 120.2 Mtoe) [21] and for 20% of the total national GHG emissions, mostly via space heating [22]. About 70% of existing buildings were built before 1970 (before the introduction of Law 373/1976, the first to regulate building-energy performance), and 25% of the stock has never undergone maintenance or renovation [23].
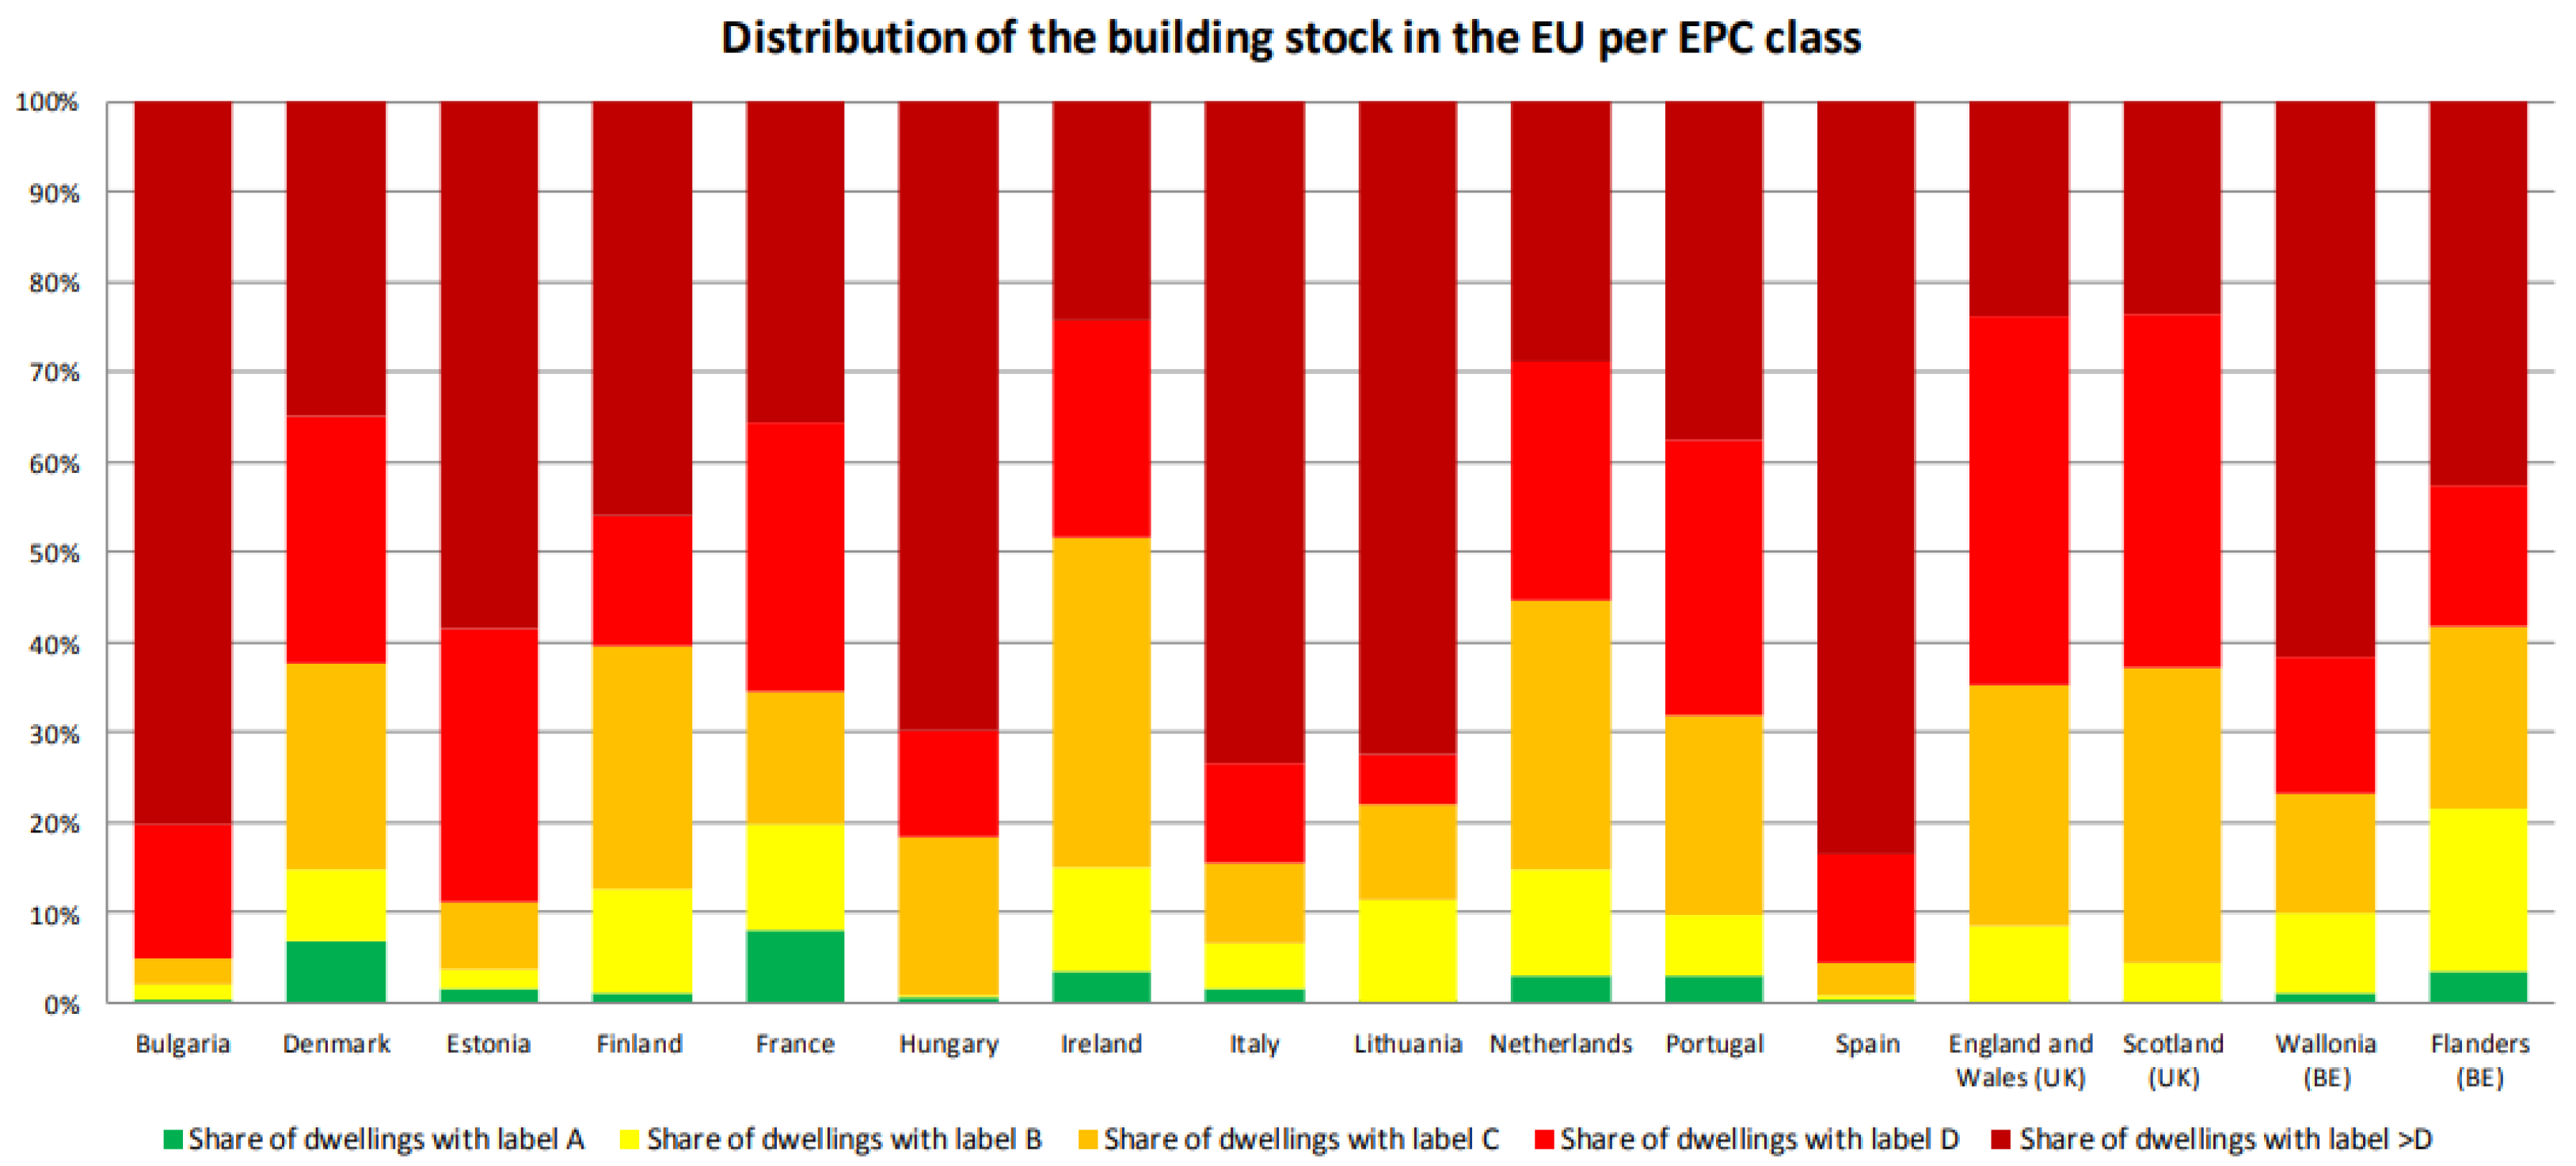
As shown in Figure 1, more than 70% of buildings in Italy are characterized with low energy performance and an energy class higher than D, resulting among the worst values of the member states [24]. In the period of 2000–2018, the average energy consumption for space heating per floor area slightly decreased in Europe, whereas it has remained almost constant in Italy: around 110 kWh/m2 on average [25,26].
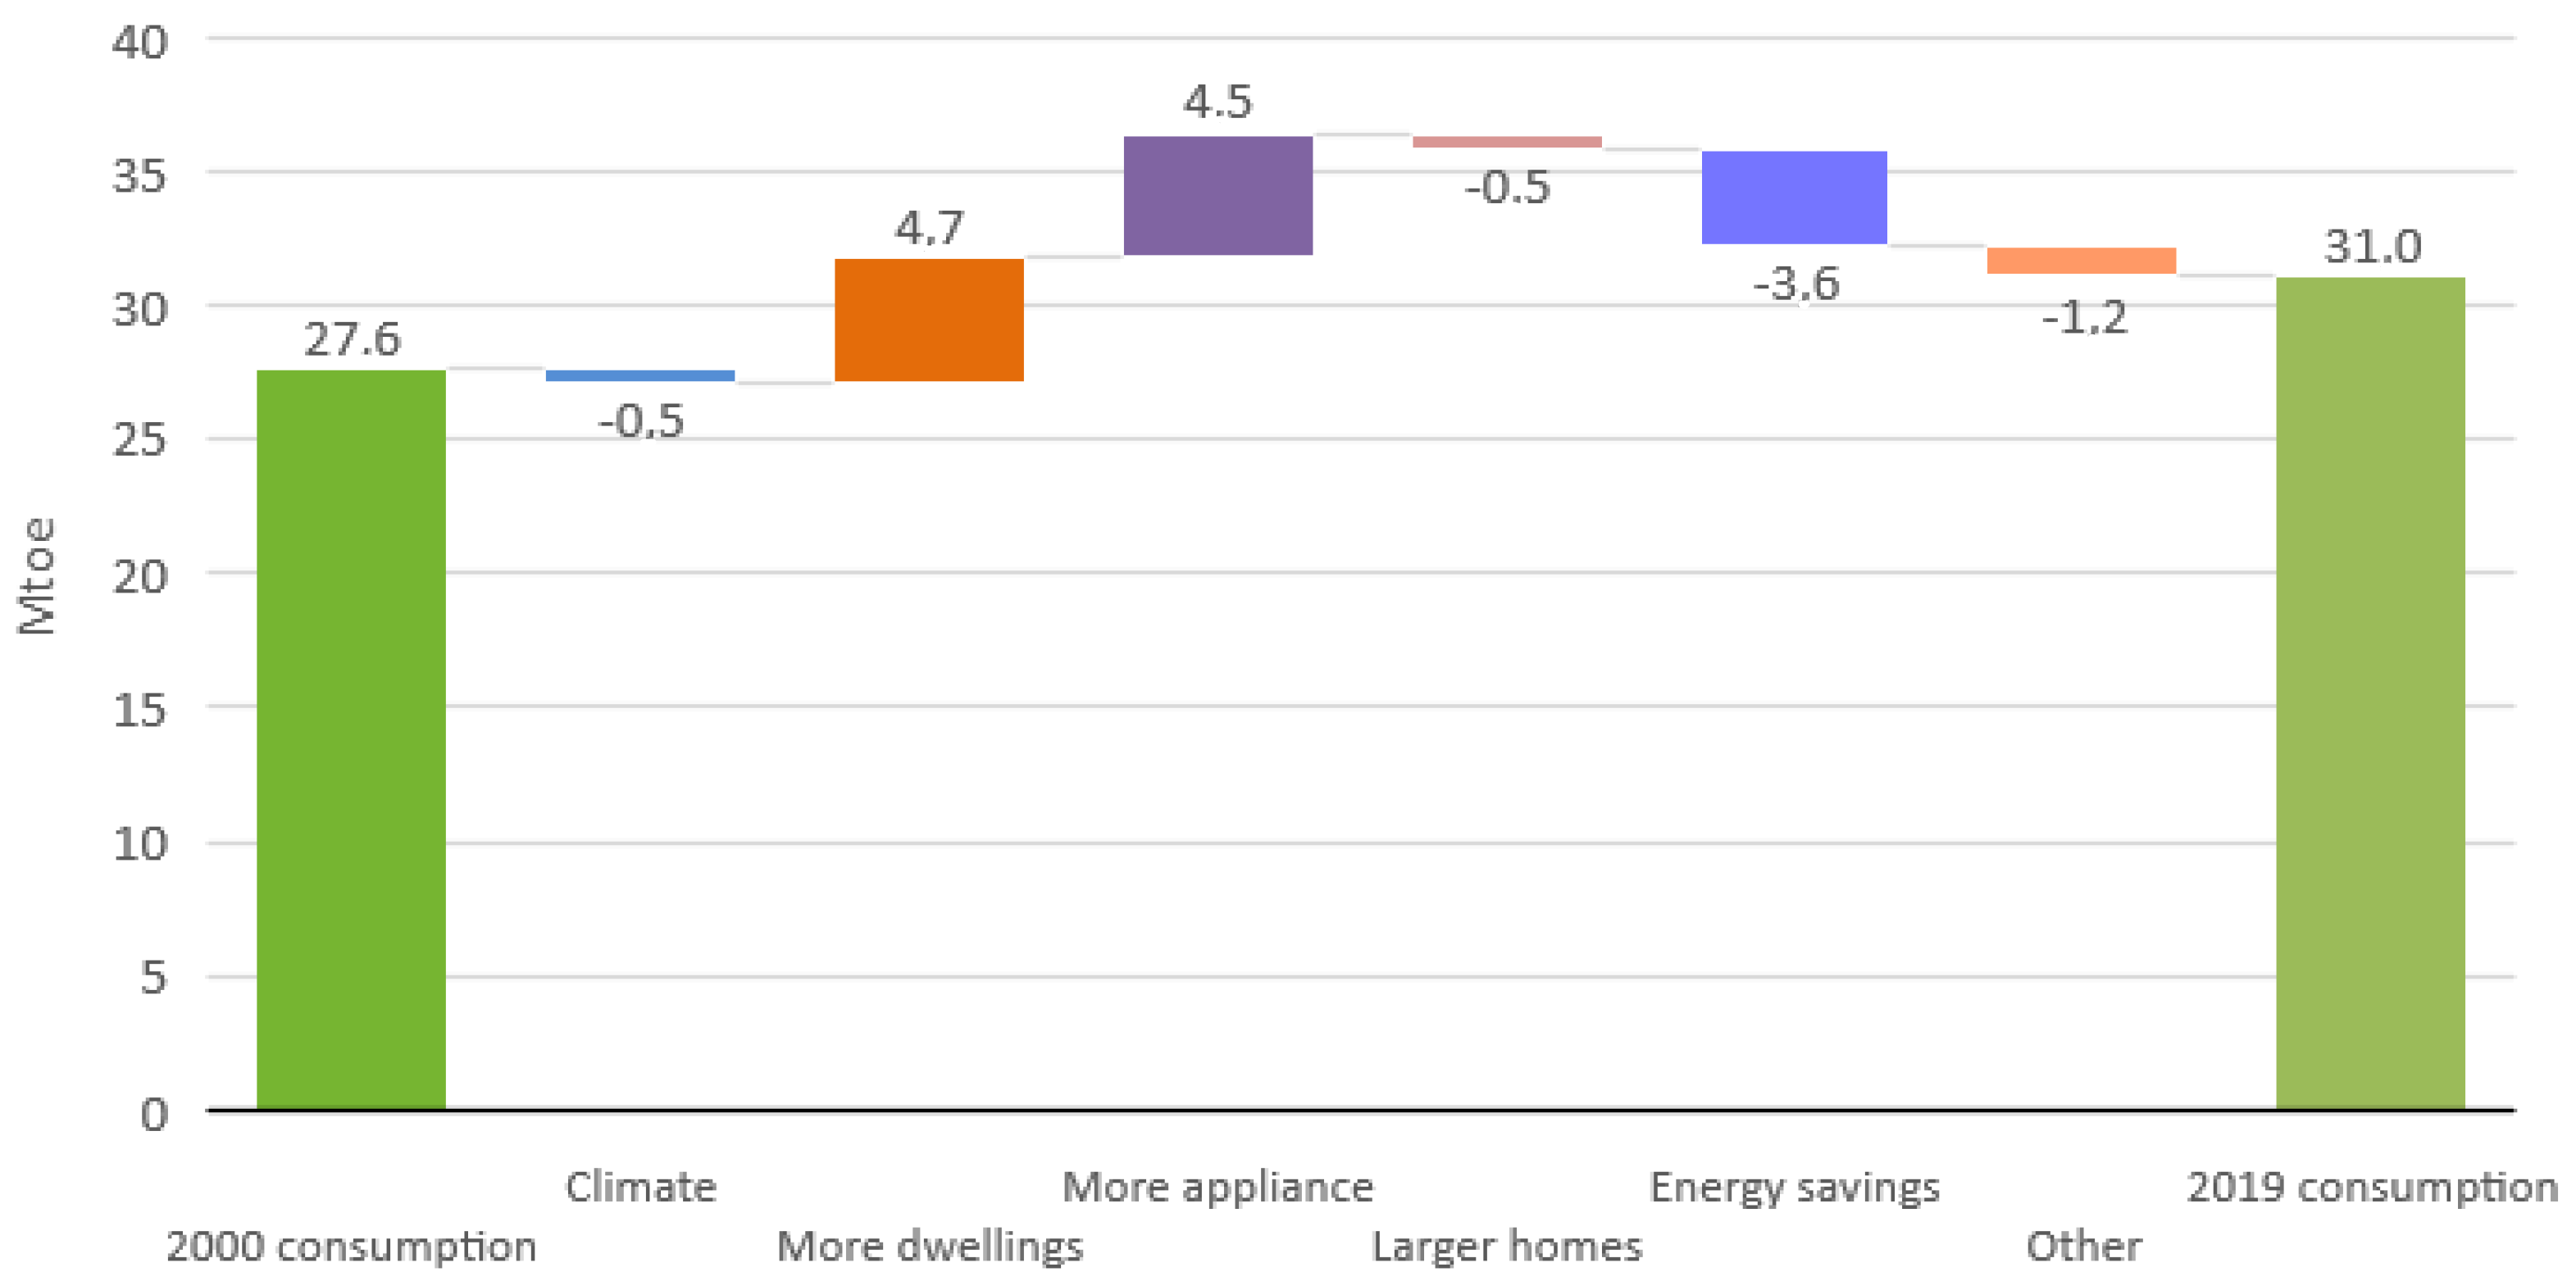
Over the period of 2000–2019, household energy consumption grew by 3.5 Mtoe, mainly due to an increased number of dwellings and better lifestyles, but energy savings have partially counterbalanced this effect, as shown in Figure 2 [26]. Nevertheless, more than 25% of Italian residential buildings report annual final energy consumptions for space heating that range from a minimum of 160 kWh/m2 to over 220 kWh/m2 [20]. In addition, thermal energy uses (heating and cooling) account for 70% of the total final energy consumption in residential buildings, followed by cooking and water heating (17%) and lighting and electrical appliances (13%) [21].
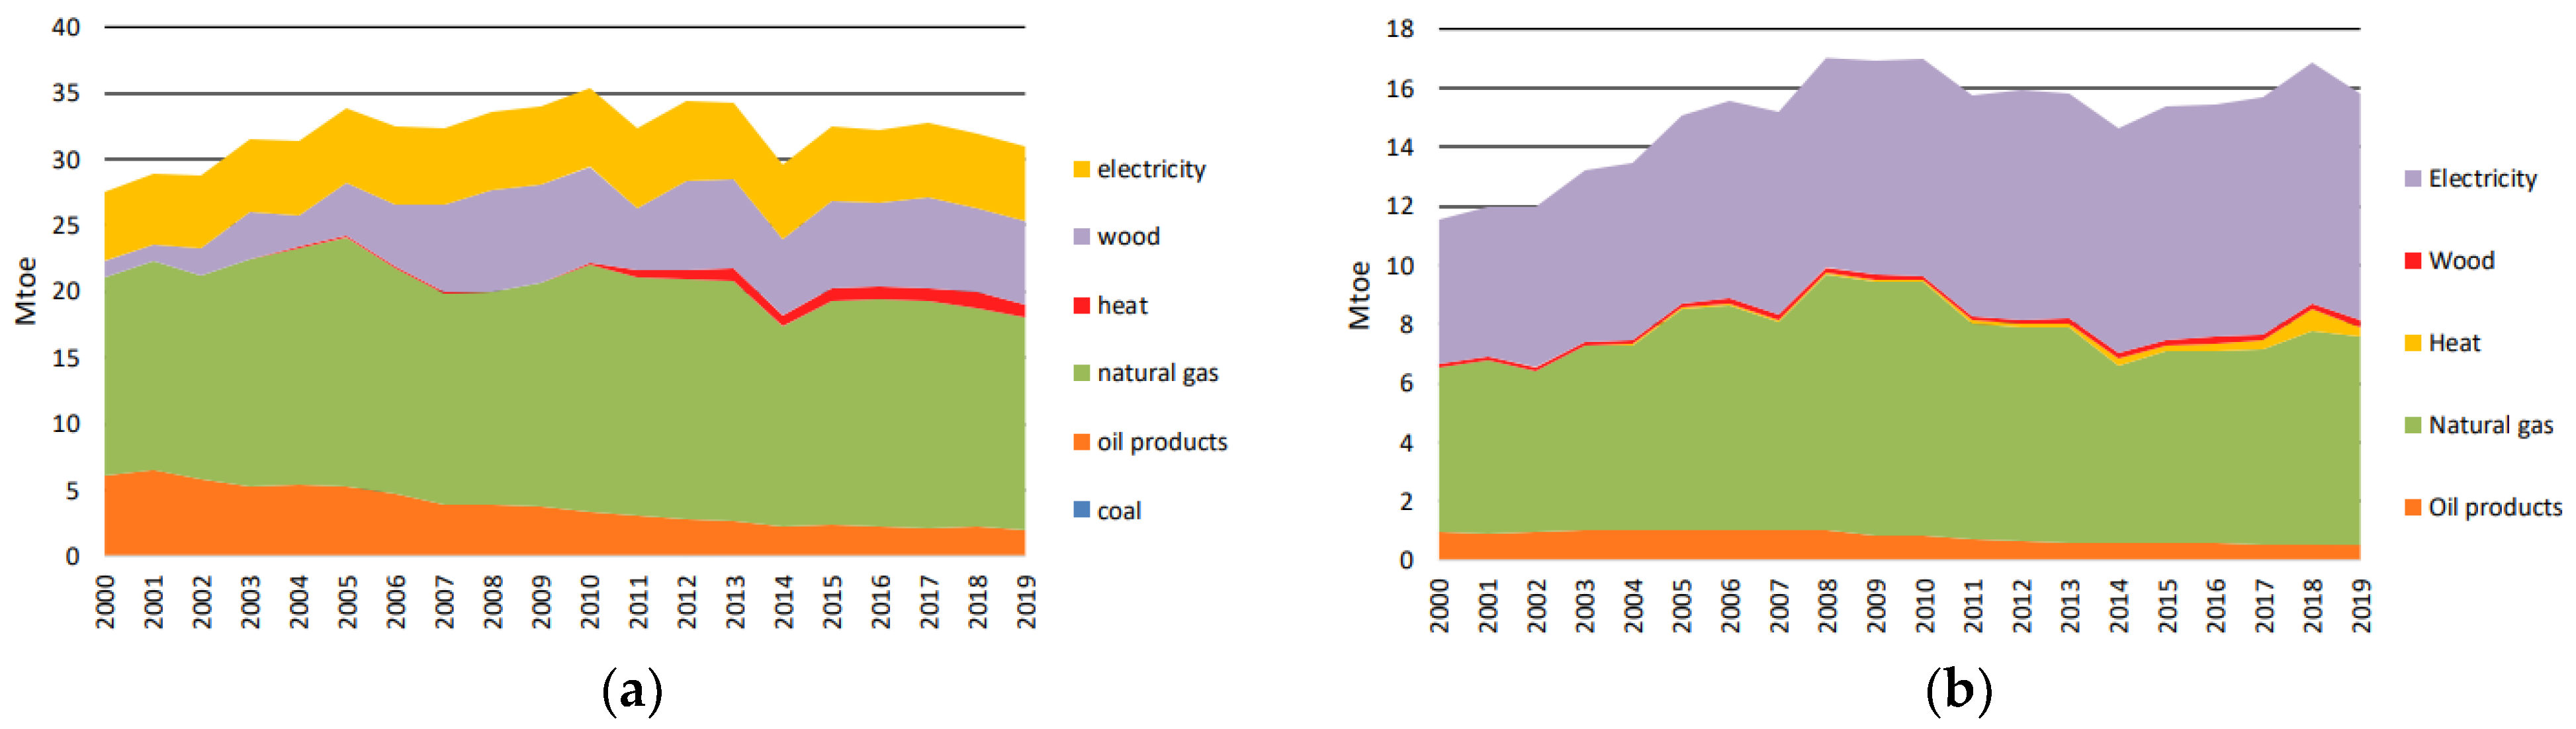
As shown in Figure 3, natural gas represents the main energy source, supplying over 50% of the final demand, followed by solid biofuels (19.4%) and electricity (17.5%) [26].
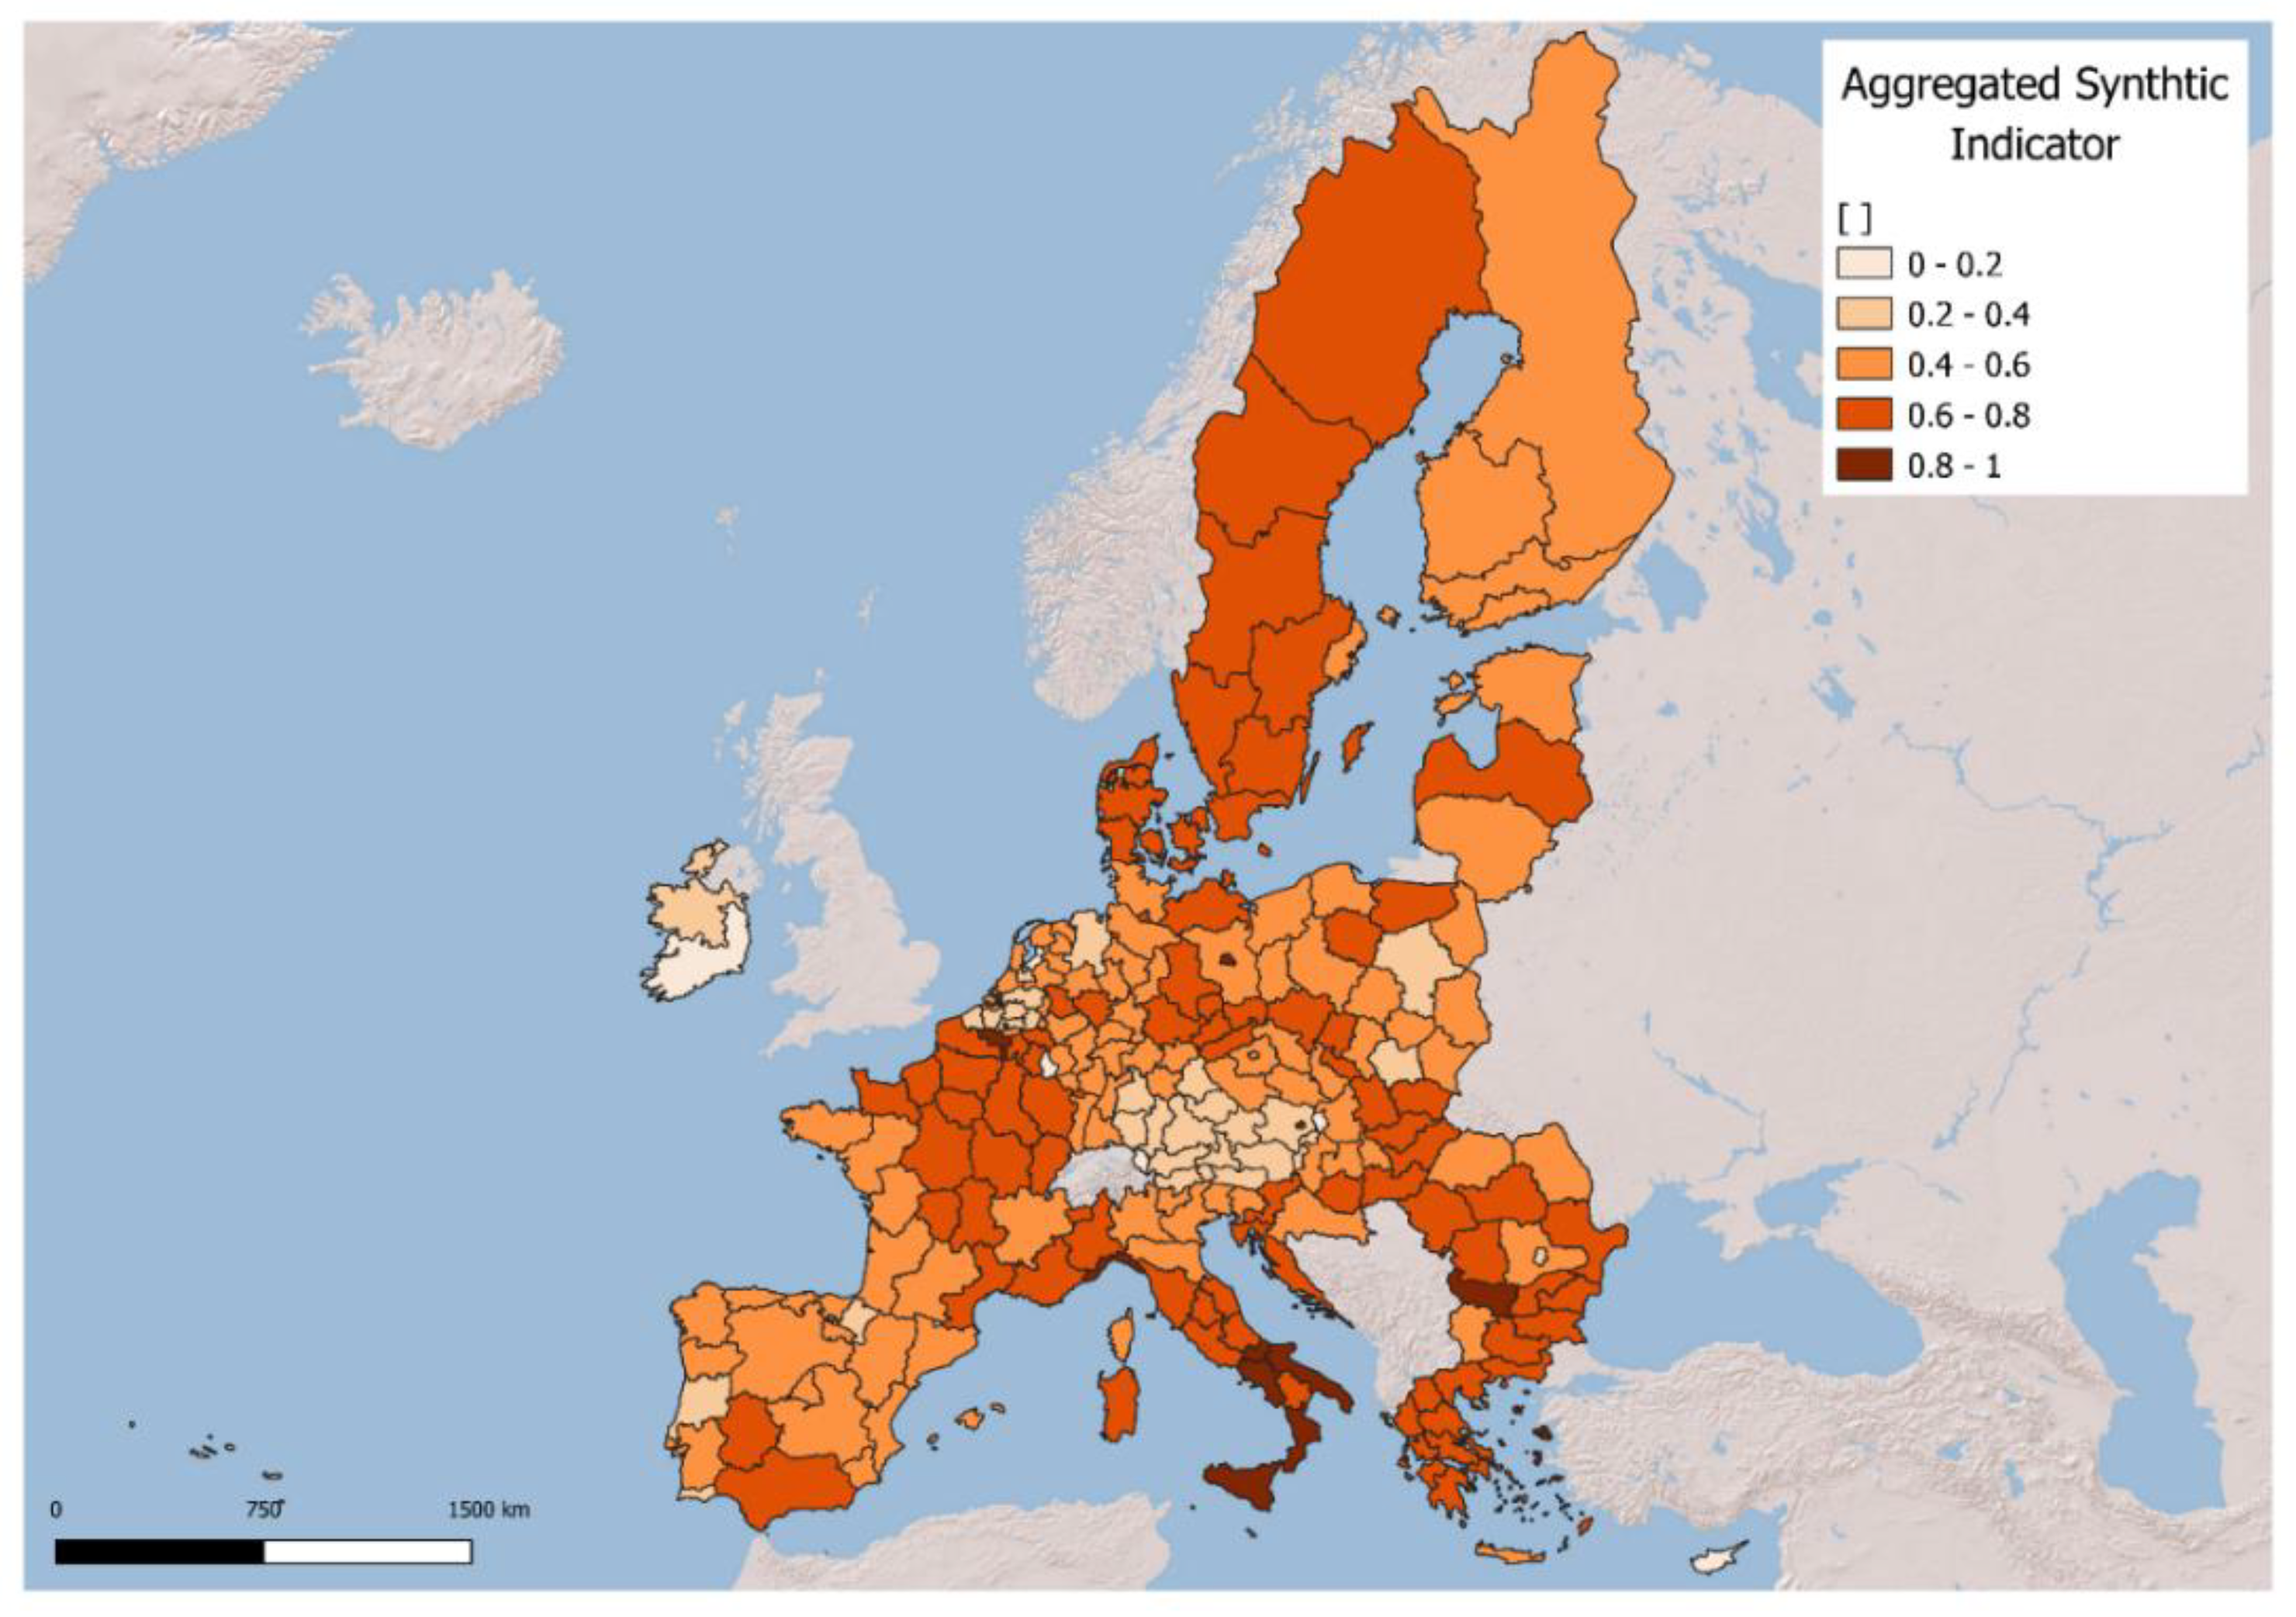
The composite index provided by the Joint Research Centre (JRC) of the European Commission [27] classifies some Italian regions (i.e., the Southern regions) as the most critical in Europe (Figure 4). This composite index combines residential-building-stock characteristics (average age of dwellings, number of dwellings built before 1991, number of historical dwellings, heating degree days, share of nonowner-occupied dwellings and share of rented multifamily dwellings) and socioeconomic indicators (average GDP per inhabitant, variation of the GDP per inhabitant, average unemployment rate, average net disposable household income per inhabitant and average net disposable income per inhabitant received by the 20% of the population with the lowest income, over the period 2018–2021).
According to the Italian Statistic Institute (ISTAT), there are about 2.2 million nonresidential buildings (15% of the total buildings) in Italy [28]. Their total final energy consumption was about 18.2 Mtoe in 2019 (−4,3% compared to data in 2018) [21], and their main energy sources are electricity and natural gas, accounting for 42% and 39% of the total final energy consumption, respectively [26].
Along with residential buildings, this work focuses specifically on schools and public housing. The former total 56,000 in a total area of 84.3 million m2, corresponding to about 256.6 m3 (Table 1 and Table 2), whereas there are 710,000 of the latter in a total area of about 53.7 million m2 (Table 3) [20]. Similarly to residential buildings, about 67% of school buildings were built before the adoption of the first regulation of management of energy consumption in 1976 and are thus characterized with high energy-consumption levels. In fact, the average annual energy consumption for schools is about 150 kWh/m2 [3]. In these buildings, thermal consumption is particularly high (on average 130–140 kWh/m2) due to the need for space heating: a service for which efficient electrical equipment is still not widespread. Regarding public housing, a recent survey, carried out on a sample of 1430 buildings, showed an energy-consumption level about 4% higher than the value reported for residential buildings [20]. This difference is mostly due to electricity consumption, which was about 16% higher. On the contrary, the thermal consumption level was similar (only +1%). It is worth noting that public housing has some specific characteristics: (i) Higher use of these dwellings by older people and fewer workers; (ii) The presence of older thermal systems combined with lower diffusion of energy-saving renovations.
2.2. Italian Policies and Targets for Energy Efficiency
Improving energy efficiency has been one of the main objectives of EU policies since 2008, when the Climate & Energy Package set an improvement goal of about 20% in energy efficiency. Consequently, important regulatory developments have been made over the last two decades to implement the Energy Performance of Buildings Directive (EPBD) [5] and the Energy Efficiency Directive (EED) [29]. In the frame of the implementation of European Directive 2010/31/EU [5], the EU member states were asked to develop policies appropriate to their national situations and provide the necessary financing to foster the transition to NZEBs, whose characteristics represent useful references to estimate energy savings in the building sector [30]. Cost-optimal levels of minimum energy-performance requirements calculated by each member state can also be very effective in assessing the impacts of policy measures. In particular, the “Minimum Requirements” Decree [31], which identified the performance requirements for an NZEB in Italy, has introduced two retrofitting levels: (1) “first level” renovations, which affect more than 50% of the building envelope and include possible replacement of the heating systems (these interventions have to meet the minimum requirements needed for NZEBs); and (2) “second level” renovations, which affect from 25% to 50% of the building envelope and include possible replacement of the heating systems (these interventions have to meet the minimum requirements defined as per the cost-optimal approach). In addition to these two retrofitting levels, considered “major building renovations”, there are other energy-saving interventions that involve areas of less than or equal to 25% of the external dispersion surface and/or include installation or renovation of the heating systems or other partial interventions. In this case, the energy-performance requirements refer only to the technical or efficiency characteristics of the intervention components.
The Italian NECP assigns a significant role in the reduction of total GHG emissions to the residential sector, combining measures for energy efficiency and use of renewables [18]. The NECP aims at reducing primary energy consumption in residential buildings by 0.33 Mtoe/year by 2030, corresponding to a CO2-emission reduction of 1.14 Mt CO2/year (from 54 Mt CO2 in 2020 to 42 Mt CO2 in 2030) [18]. To achieve these goals, the national government deployed the following instruments: fiscal incentives (i.e., tax deductions for building upgrades and the Thermal Account mechanism) and the White Certificates scheme. It is worth noting that the NECP, published prior to the entry into force of the European Green Deal [1] and the Fit For 55 package [32], needs to be updated in order to be in line with the new EU net-emissions reduction target by 2030.
Tax incentives for promotion of building renovations were introduced in Italy in 2007 [6]. The most important energy-efficiency mechanism, called “Ecobonus”, provides a tax deduction for comprehensive or single energy-efficiency retrofitting, such as thermal insulation, installation of solar panels or replacement of heating and air-conditioning systems. Originally, tax credits covered 55% of energy-related costs; subsequently, they were increased to 65–75% and 85%, depending on intervention type [6,33]. It is estimated that since 2007, this measure has stimulated approximately 45 billion EUR of private investment in residential buildings, generating total energy savings equal to 19 TWh/year [21]. In 2020, with the Relaunch Decree [34], the Ecobonus was extended and upgraded; a new tax deduction of 110% for specific interventions was introduced. The main objective of this new measure, called “Superbonus”, was to revitalize the construction industry as well as promote energy efficiency. In order to be eligible for the Superbonus, building-energy performance must be improved by at least two classes, corresponding to an average energy saving (related to an average annual primary energy consumption) of about 80–100 kWh/m2 and minimum expected savings of about 30–40%. Furthermore, at least one of these “main works” must be carried out: (i) Thermal insulation; (ii) Substitution of the heating system (gas boilers are eligible). In addition, secondary improvements, such as installation of photovoltaic panels, double glazing, electric car chargers, etc., can be carried out. In addition to the NECP, the National Recovery and Resilience Plan (NRRP) [35] addressed specific public funds for these measures, i.e., 13.95 billion EUR for the Superbonus and 18 billion EUR for the Ecobonus. According to the NRRP, these investments will allow renovation of over 100,000 buildings (a total upgraded area equal to 36 million m2) and obtaining of expected energy savings of about 191 ktoe/year, with a GHG-emission reduction of about 667 ktCO2/year.
For nonresidential buildings, the NECP aims at lowering primary energy consumption by 0.24 Mtoe/year by 2030 [18]. Nevertheless, it includes negligible programs for either schools or social housing and foresees limited public funds to be provided in the National Budget Law. Similarly, the NRRP includes a small, specific energy-efficiency action for schools that can be considered negligible, as it involves just 195 schools that represent only 0.48% of the total floor area for educational buildings [35].
Using the cost-optimal approach as a reference to define the targets of deep renovations (Table 4), the NECP has identified the deep-renovation rates through which the abovementioned 2030 energy savings objectives can be achieved (Table 5).
Currently, the Italian deep-renovation rate is quite low, i.e., 0.3% and 0.6% for residential and nonresidential buildings, respectively [2]. Even if Italy appears to have higher renovation rates with respect to the EU average, especially for nonresidential buildings [2], an optimized revision of current incentive schemes for energy retrofitting is needed. Although the Ecobonus has had a significant impact on the Italian market [34], it appears to be not completely able to contribute to an actual reduction in building-energy consumption through deep retrofitting. According to other authors [11], buildings are usually suited to achieve the maximum amount of deduction, but their refurbishment are limited to only partial intervention and total costs are therefore lower than the caps defined through their schemes. It has emerged that this measure induced private investors to implement only partial retrofitting actions that were not directly linked to an effective decrease in building-energy consumption [11]. Furthermore, this scheme was introduced in 2007 but has been reconfirmed and modified multiple times during subsequent years, with several changes in its characteristics. That a stable energy-efficiency program was missing in the long run emerged, causing a source of uncertainty in the regulatory framework, which should instead play an important role in promoting innovative investments.
3. Calculating Energy-Saving Potential
Under the framework of the Energy Performance of Building Directive (EPBD), the energy-saving potential of the existing Italian building stock was estimated through referral to cost-optimal and NZEB renovation levels. The results of official cost-optimal calculations and the official NZEB definition were selected as main reference sources. In order to define energy consumptions before and after renovation works and their investment costs, we firstly referred to the data collected within the ENTRANZE database [36]. Next, the outputs of the European projects ASSET [37] and ODYSSEE [38] were considered in order to verify and update the input data. The data that describe the building stock (i.e., the number of dwellings per construction period and per building type, the useful area per building type and status of occupation) were collected from the Census Hub of EUROSTAT.
Within the residential building stock, we considered the subsets of multifamily houses (MFH) and single-family houses (SFH). Since several references express energy performance in terms of primary energy (e.g., official NZEB definitions and cost-optimal levels), we referred to these energy levels as energy-saving potentials.
In line with previous studies [39,40,41,42], the NZEB refurbishment option, as defined by Italian regulation, refers to a medium implementation of energy-efficiency and RES technologies. A typical refurbishment to NZEB levels includes a well-insulated envelope (i.e., 10–30 cm insulation layers, double/triple low-e glasses, high-airtightness windows) and efficient generators (e.g., water-to-water heat pumps, condensing boilers or district heating), sometimes supported by heat-recovery systems and renewable solar plants (usually PV panels). Normally, cost-optimal renovations are more miscellaneous, since different technological packages can lead to less ambitious targets. Within this intervention area, competition of the deepest actions toward the building envelope, thermal systems and RES is normally observed.
Depending on climate conditions, a typical existing building, renovated according to NZEB requirements, has a nonrenewable primary energy consumption of about 50–65 kWh/m2 for all of its primary energy uses (excluding appliances).
Under this study, the primary energy saving (PES in kWh) is obtained as the sum of five contributions associated to different construction periods (i.e., before 1919, 1919–1960, 1961–1980, 1981–2000 and after 2000):
Each PESi is calculated as
With
- k: building type (SFH: single-family house; MFH: multifamily house);
- PEref,k,i: reference primary energy demand of existing building type (kWh/m2 year);
- Ak,i: useful area over all building stock, for building type and specific construction period (m2);
- focc: occupation factor (%);
- R: annual deep-renovation rate (%);
- Y: calculation period (years);
- fco: renovation ratio in compliance with the cost-optimal level (%);
- fNZEB: renovation ratio in compliance with the NZEB level (%) (fco + fnZEB = 1);
- ESco: energy savings related to cost-optimal renovation (%);
- ESNZEB: energy savings related to NZEB renovation (%).
The useful area over the whole building stock, Ak,I, was calculated on the basis of statistical data associated to differently sized categories (i.e., under 30 m2, less than 40 m2, less than 50 m2, less than 60 m2, less than 80 m2, less than 100 m2, less than 120 m2, less than 150 m2 and 150 m2 and over), as follows:
where Nk,I is the number of buildings built in a specific construction period (divided between SFH and MFH), Fj is the percentage of buildings within a certain size category (%) and Sj is the average useful area for every size category.
Similarly, the investment needs associated with these renovation works (IN) are calculated as
with INi calculated as
where Cco is the renovation cost associated with the cost-optimal level (EUR/m2) and CNZEB is the renovation cost associated with the NZEB level (EUR/m2).
Considering that, according to the data collected, an existing Italian single-family house consumes on average about 260 kWh/m2 and a multifamily house consumes an average of 200 kWh/m2 (of primary energy for space heating, cooling, water heating and lighting), the technical savings potential is estimated to be equal to about 60% of the primary energy consumption of the residential sector. As reported in Table 8, the investment needs thereof are almost 800 billion EUR, equal to 44% of the Italian GDP in 2021 and 22% of the Italian dwelling stock value in 2019.
In addition, for educational buildings, an average cost-optimal level equal to 90–110 kWh/m2 could generate energy savings of about 13.5 TWh. The investment needs thereof are estimated to be equal to 38 billion EUR. As displayed in Table 9, the amount of energy savings per EUR invested shows small variations from residential to educational buildings.
In summary, a total investment of 838 billion EUR (47% of the Italian GDP in 2021) for implementation of energy-efficiency measures in the building sector could generate a significant reduction in the total primary energy consumption, with a consequent decrease in total GHG emissions of about 17% (almost equal to 75,000 kilotons of eq. CO2 per year).
Through increasing renovation rates to 1.16% for residential buildings and 3% for schools during the period of 2030–2050, climate neutrality in the building sector will not be achieved by 2050. Therefore, as confirmed by the NLTS, higher deep-renovation rates are necessary (about 2% for residential buildings and about 4% for schools). Furthermore, according to the recent “Fit for 55” Package, the Italian 2030 emission reduction of −33% (compared to 2005) from non-ETS sectors must be upgraded to −43.7%.
Investments needed to efficiently renovate the Italian school building stock are estimated at about 40–50 billion EUR, corresponding to energy savings equal to 13.5 TWh/year. Regarding public housing, interventions for refurbishing and extending the current building stock could generate investment costs of about 15–20 billion EUR (about 13.5 bn EUR for renovation of existing buildings, corresponding to 5.5 TWh/year of energy savings).
4. Proposing New Policy Measures
Given the poor renovation-rate results achieved compared to those that are needed, in this paper, we introduce a portfolio of policy measures intended to enhance the current Italian legislation. This portfolio has four main aims: (1) Harmonize the wide range of tax rebate schemes for building interventions, linking them to actual energy-efficiency objectives; (2) Stabilize them in a long-term strategy to provide market actors with a solid framework and, at the same time, stimulate them to act as soon as possible; (3) Include decarbonization targets; (4) Act on energy poverty and equality issues.
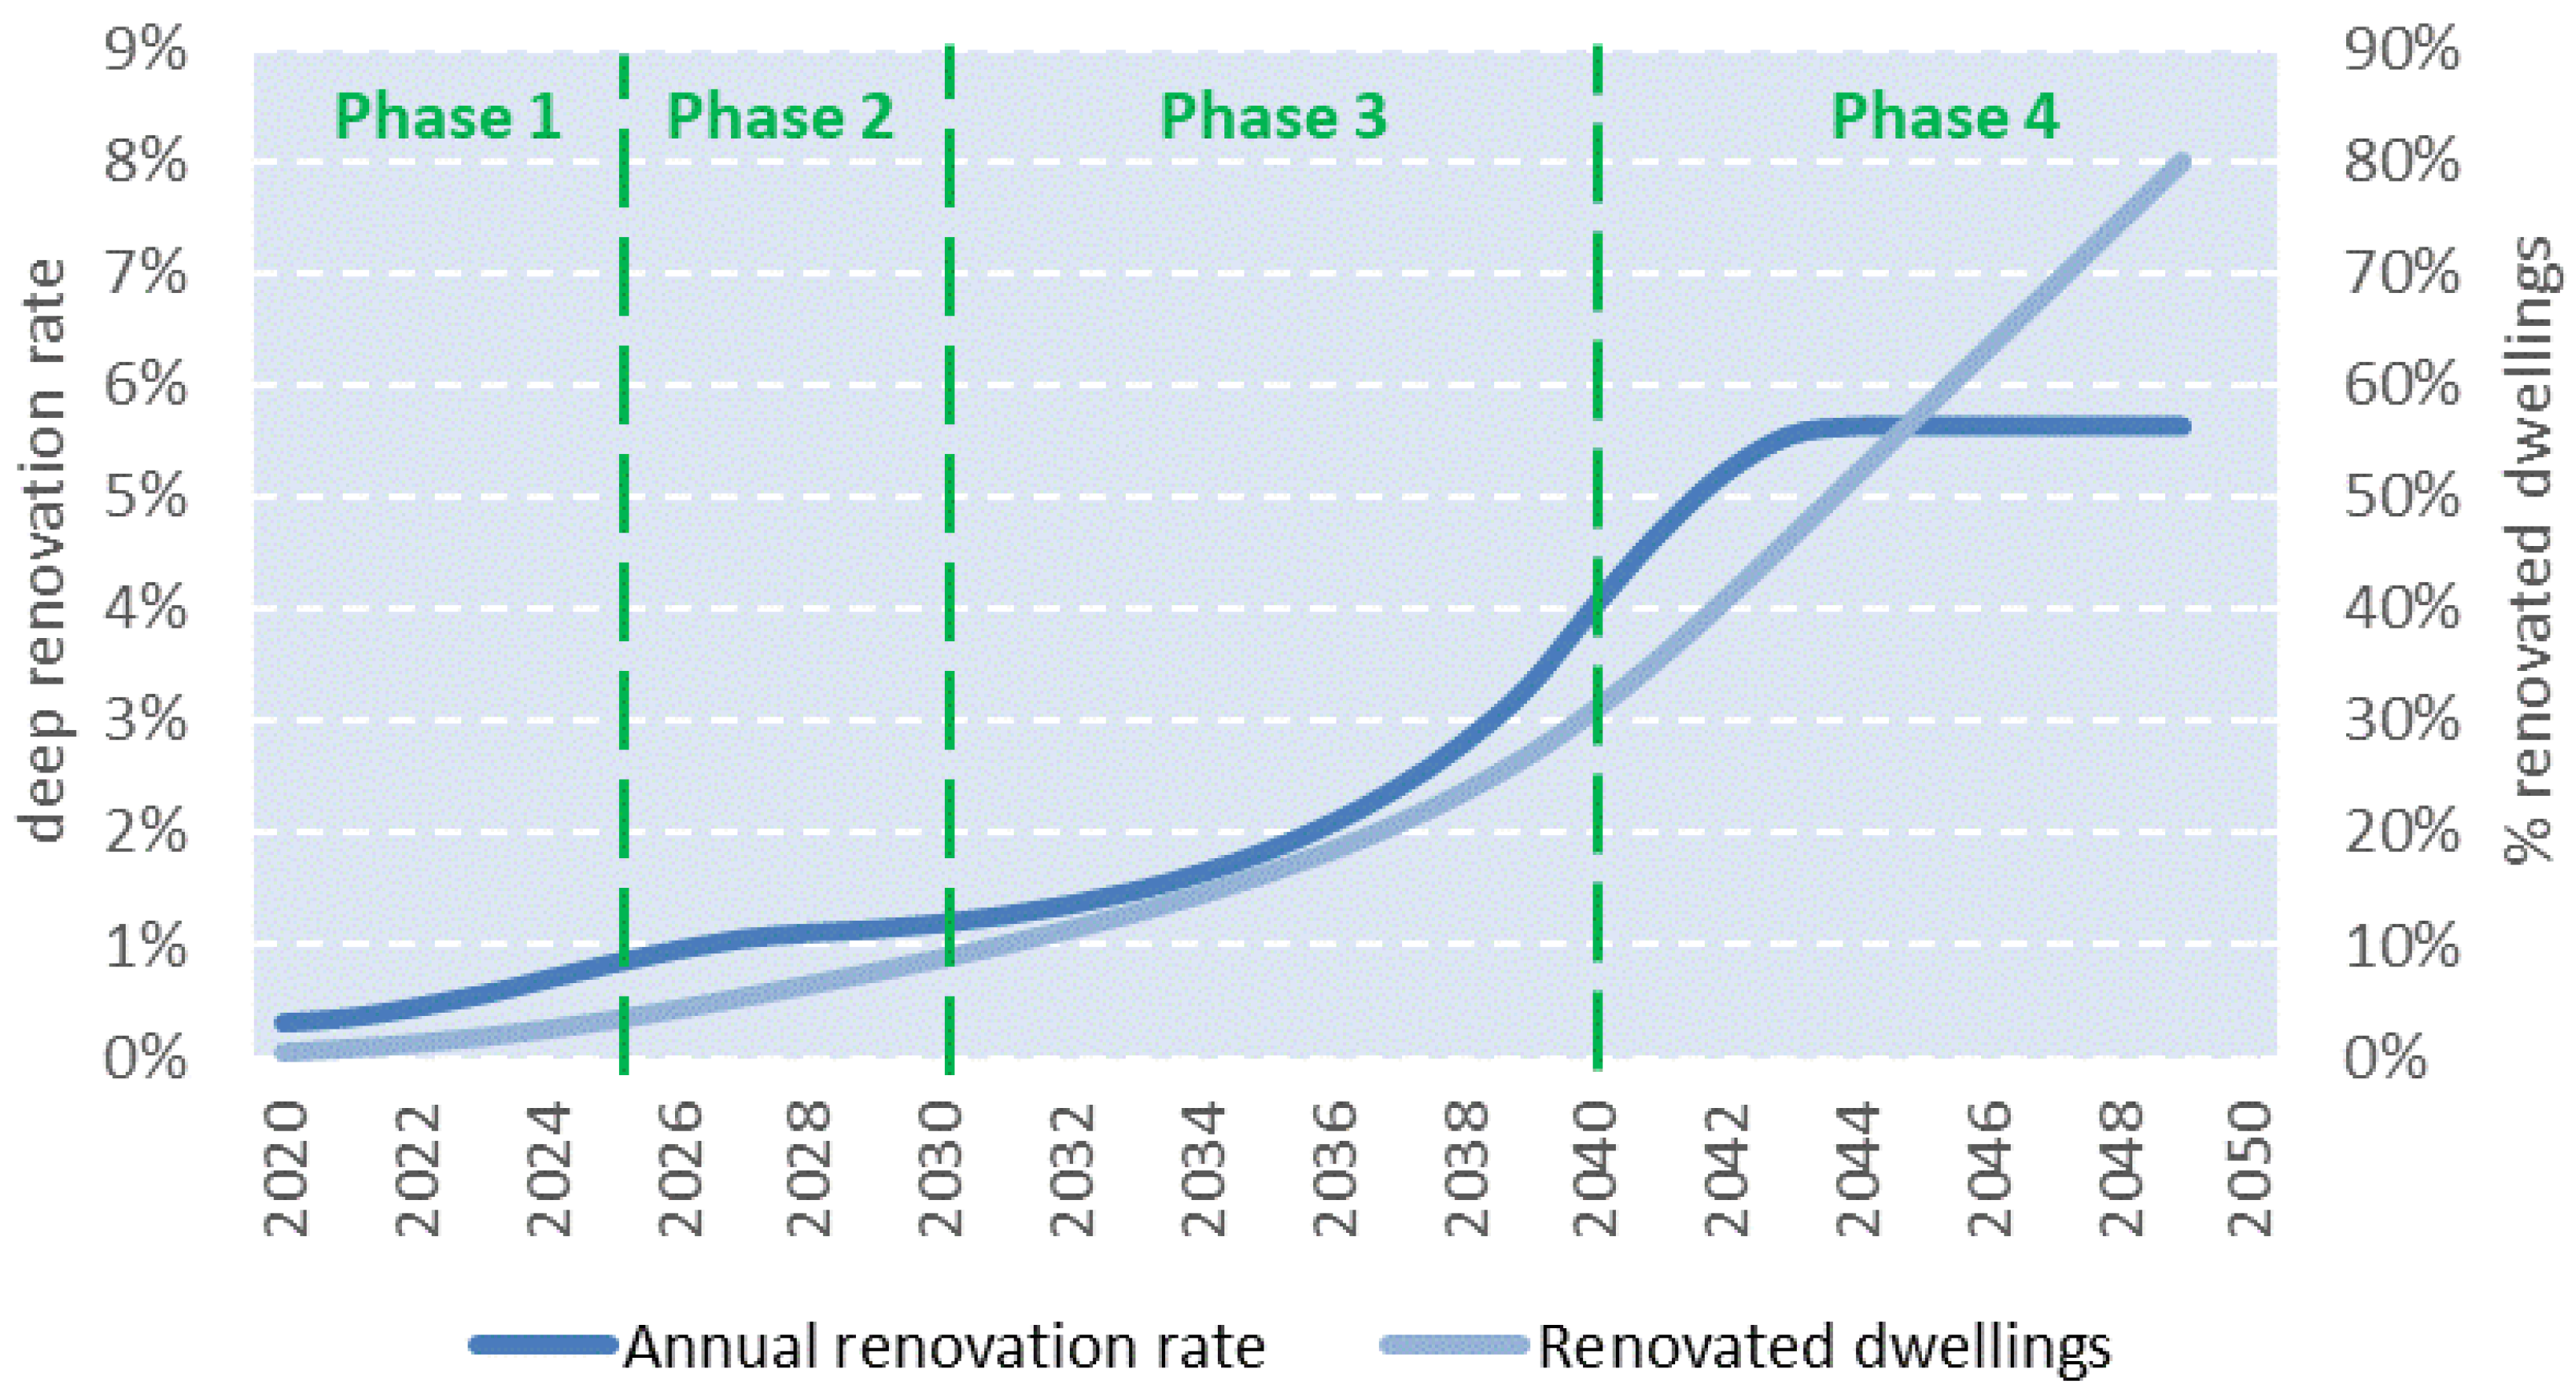
The regulatory, social, economic and technological transition should be planned in four phases, detailed as follows:
- Phase 1: “start-up”, with a duration of 3 years (until 2025), aimed at the revision and simplification of the regulatory framework and adaptation of implementation and budgetary tools for the next 25 years.
- Phase 2: “structuring”, with a duration of 5 years (until 2030), aimed at gradually reshaping incentives and allowing the construction sector to follow a sustainable expansion supported with long-term planning.
- Phase 3: “acceleration”, for a period of 10 years (up to 2040), in which to gradually reduce incentives (through support of dedicated financing instruments) and launch a renovation plan for all public buildings.
- Phase 4: “stabilization”, until 2050 (10 years), to complete the renovation of all of the building stock.
Therefore, in the following paragraphs, we present a comprehensive strategy, which walks on two legs, to have at least 80% of existing buildings deeply retrofitted by 2050. On one side, a harmonized tax rebate system that stimulates increased and accelerated deep-retrofitting rates would act on privately owned building stock. On the other side, a revolving fund mechanism would directly act on public buildings, such as schools and social housing.
4.1. Fiscal Rebate Mechanism for NZEBs
The current landscape of fiscal incentives for building interventions (see Table 10) includes at least four different measures with different rebates (36–50%, 55–65%, 90% and 110%), different energy requirements (none, technology substitution or improvement and general building-performance improvement) and very different compliance checks (none, attestation from a certified technician for each single intervention, before-and-after building-energy certification). In this chaotic framework, major retrofits can obtain higher financial incentives (i.e., higher tax rebates) but also imply higher bureaucratic burdens and overall costs (including the cost of technical interventions and that of the professional documents needed to obtain rebates). This rather confusing situation therefore provides an unintended incentive to perform only simpler interventions with low energy-saving potential but also lower costs and complications. Seen from a public-official point of view, simpler interventions also imply a higher risk of fraud, as demonstrated through Italian Revenue Agency data. False invoices have been produced to obtain undue tax rebates without even the need of a professional to check whether the interventions were carried out.
Therefore, we first of all suggest rationalization of the overall system of incentive mechanisms in order to strengthen the idea that incentives for building renovations must always guarantee application of the “energy efficiency first” principle. In line with this, our proposal is to cancel out the current tax rebate of 36% (which was temporarily raised to 50% until 2024) addressed to ordinary and extraordinary maintenance, restoration and building refurbishment that do not lead to energy savings (e.g., a corresponding tax rebate would also be provided for purchasing of furniture in connection with buildings subject to renovation). In the same perspective, the “Bonus facciate” (façade rebate, a 90% tax rebate until end of 2022) should also be permanently canceled out, since it is given out for aesthetic interventions not linked to any energy-efficiency improvements.
According to the EU’s “energy efficiency first” principle, cost-efficient alternatives should be preferred and prioritized [43]. The aim thereof is to allocate NRRP resources more efficiently (and reach a deep-renovation rate of about 1% by 2026) and develop incentive schemes into a long-term strategy to achieve NZEB (or more ambitious) targets. The key question is: How should incentives be designed to achieve these targets?
As already mentioned, the Superbonus 110% rebate scheme includes an obligation to improve building-energy certification through scaling up of at least two classes. This provision can be considered a good starting point but needs to be improved in order to be better-aligned with long-term climate objectives. For example, in the case of a class G building, does it make sense to consider class E a good benchmark? Without improving the minimum standards and the technical conditionalities to achieve the rebates, the risk is obtaining suboptimal results at both the building and stock levels.
Our proposals are therefore: (1) To design incentive mechanisms that are proportional to their achieved energy-efficiency improvements; (2) To organize a coordinated and incremental renovation plan that guarantees that at least 80% of the existing building stock can be deeply retrofitted by 2050.
Incentive schemes for private investors should be differentiated based on the most energy-intensive buildings (in terms of energy class, dimension and climate zone). Within a long-term strategy, encouraging investors to accelerate investment decisions and choose deep renovations via giving them a premium and planning a gradual reduction in tax deduction could be a useful strategy. A price signal should reward a fuel switch toward cleaner and renewable-based technologies. Furthermore, given the need for introduction of new procedures, technologies for electrification of final energy consumption and materials that are more compatible with the criteria of a circular economy, the tax rebate formula should take into account calculation of building materials’ carbon footprints from a life-cycle-analysis point of view.
In the starting phase, the current incentive scheme could be slightly modified through changing the eligibility criteria:
- Fossil-fuel boilers should be excluded, since they are not compatible with decarbonization targets.
- Second homes should be excluded as well, since they are only rarely occupied; therefore, the calculated energy savings will not be ensured.
The tax deduction should be lowered to avoid an excessive unjustified increase in restructuring costs; in this regard, a rate lower than 100% would entail a minimum outlay by the household owner, representing an incentive to verify the fairness of estimates through real competition among companies.
The new and stabilized tax deduction rate should be: (1) Differentiated between single-family houses (lower) and multifamily buildings (higher); (2) Differentiated between medium retrofitting (e.g., total energy savings between 30% and 60%) and deep retrofitting (e.g., total energy savings higher than 60%); (3) Guaranteed at least until 2030, although with decreasing rates over time in order to provide an incentive to act sooner; (4) More oriented to low-income households that should be eligible to apply for special support and have their energy-saving renovations fully financed. Table 11 shows one possible evolution of the tax deduction scheme aimed at improving energy efficiency in buildings.
The proposed scheme includes different rebate rates for medium and deep retrofits, single homes and multifamily buildings. Rates would decrease depending on the year when retrofitting is performed. Additional features of the mechanism would include deduction duration and a credit assignment possibility. The tax rebate would be reimbursed in annual installments; e.g., a 70% rebate with a 10-year duration would mean a 7% annual rebate. The credit assignment would be the possibility to assign tax rebates to the construction company or to a financial institute in exchange for an immediate discount or financing; e.g., if the cost of an intervention is 80,000 EUR and the rebate is 110%, the final customer could decide whether to keep a 88,000 EUR tax rebate and use it in the following years or to assign it to the construction company and obtain, for example, an immediate 100% discount. This may be a very important possibility for low-income families that would not be able to exploit a tax rebate (especially if they are in the no-tax area) and also may have problems financing interventions with their own resources.
To reach the abovementioned objectives, in the short run (2022–2026), the national government should use NRRP resources as an opportunity to activate investments in energy-efficiency measures and, in turn, boost the increase in the annual deep-renovation rate (equal to about 0.3% during 2012–2016), which should be four times higher in 2030 (Figure 5).
Through incentive mechanisms, public funds can be used as leverage for private investments in the building sector. After 2026, additional public budget should be allocated to redesign gradually incentive schemes provided to citizens at the individual level, focusing on the most energy-intensive buildings.
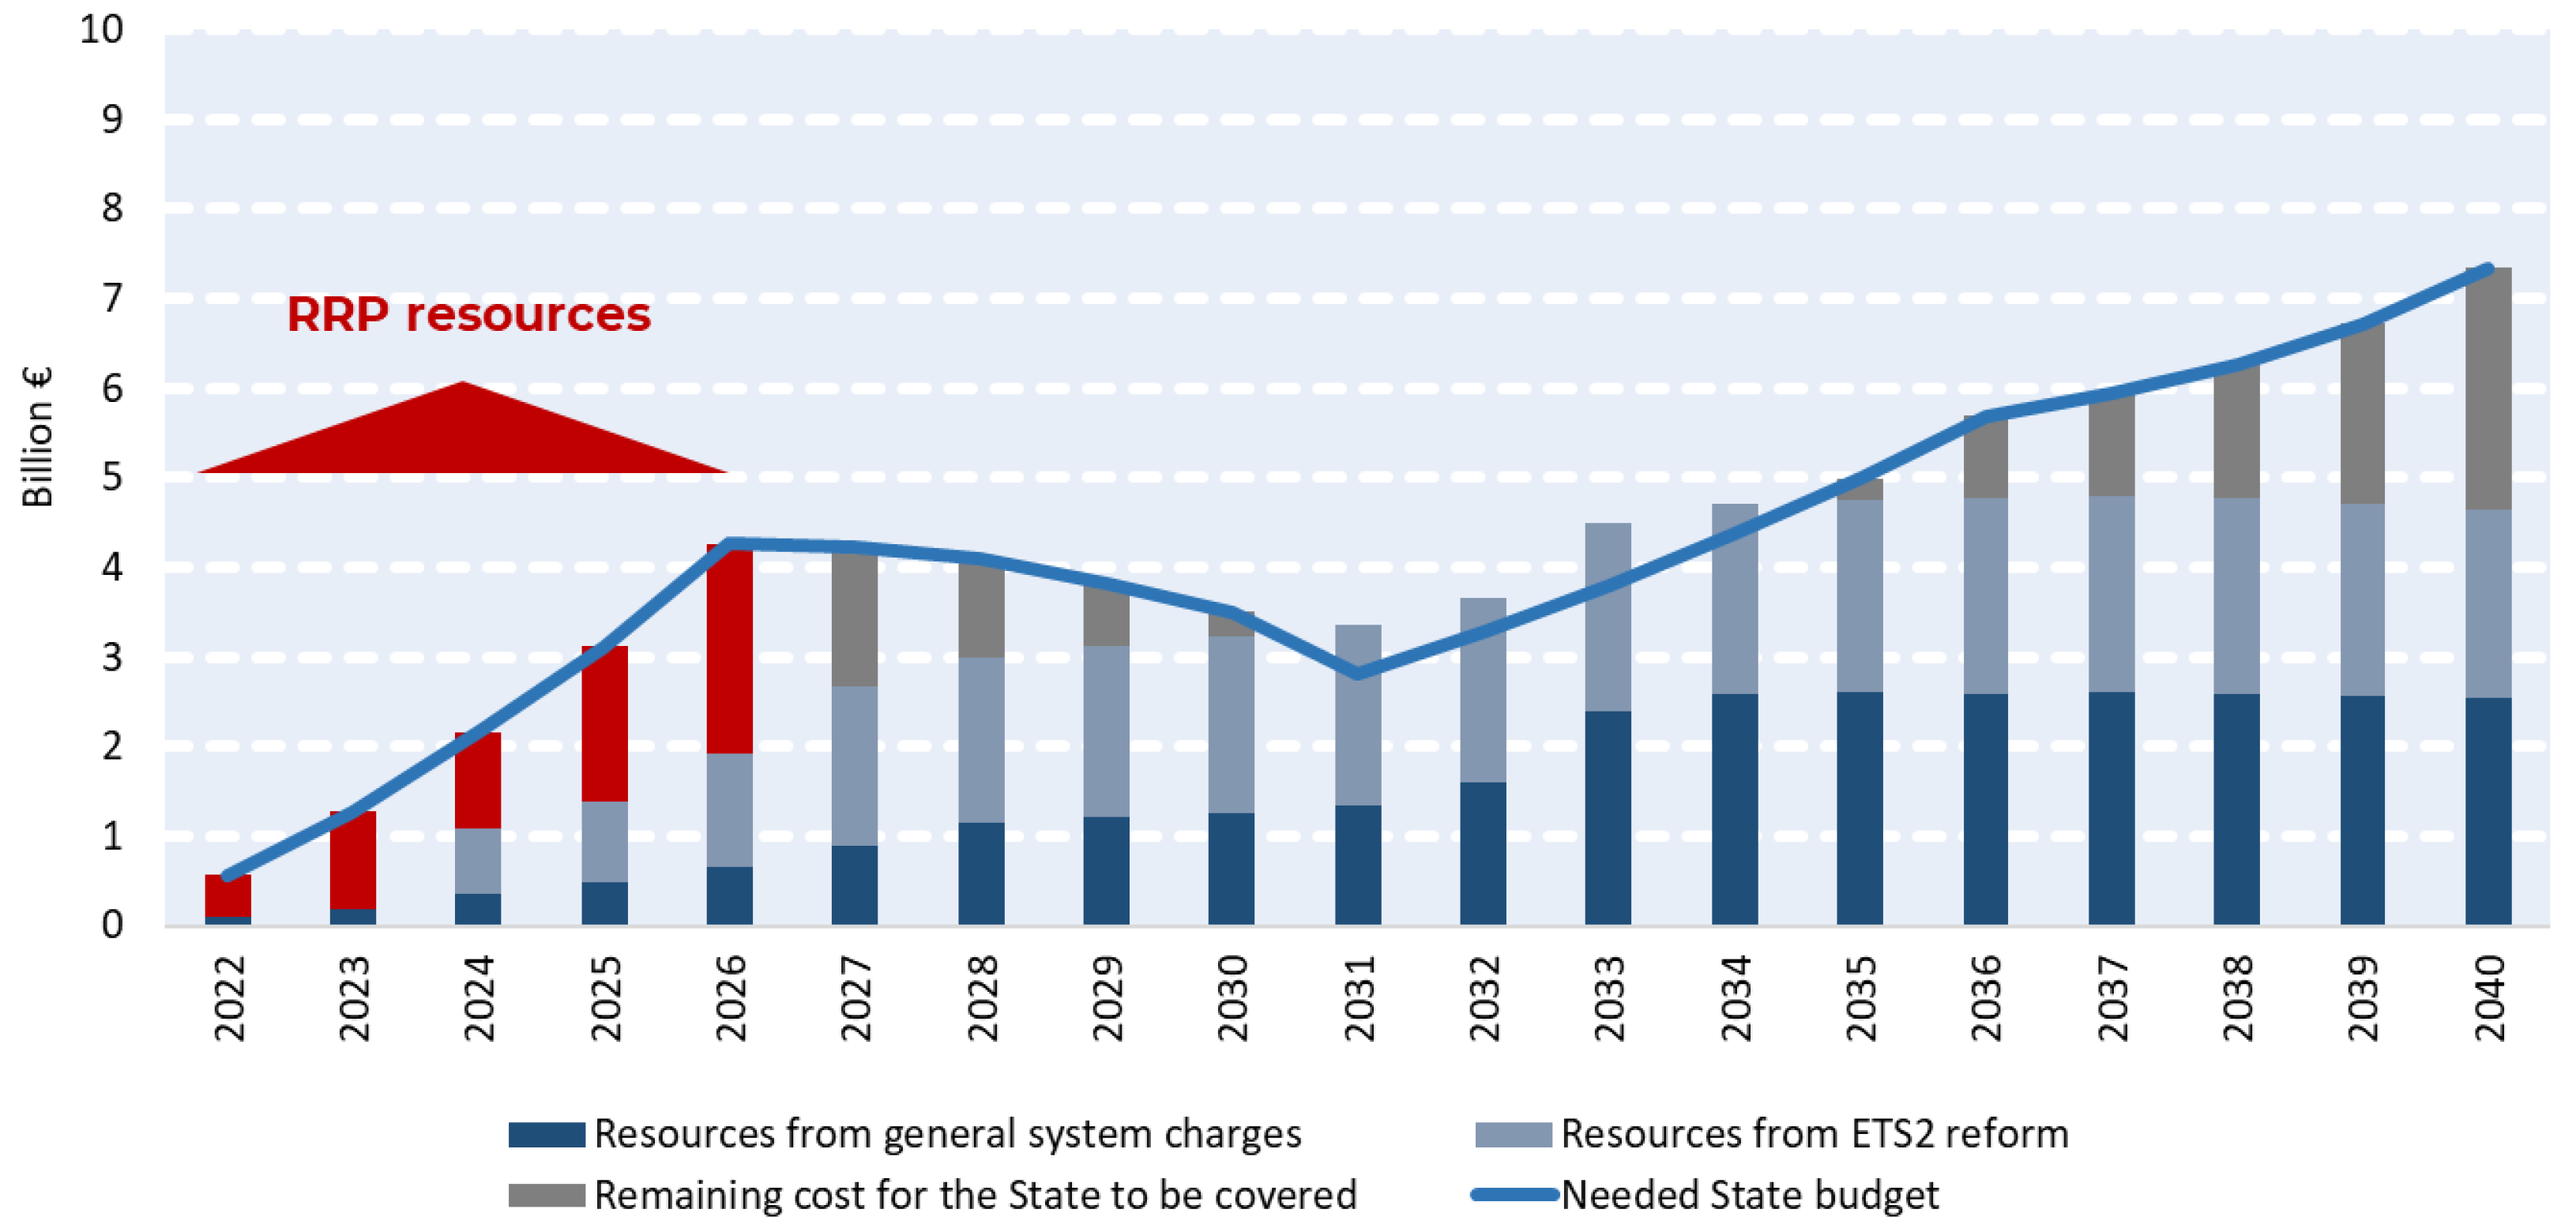
In the long run, rate reduction should be offset with simplified forms of funding at low rates, provided by credit institutions and guaranteed through public funds. A long-term strategy of financial framework and support schemes is needed. To calculate the costs of the proposed scheme, we applied the deep-renovation rates above to a total number of dwellings in multifamily buildings equal to 13,248,796 and a total number of single homes equal to 6,705,072. We also estimated the annual governmental budget needed to finance the incentive mechanism. As already mentioned, funds allocated by the NRRP (Mission 2—Component 3) can be used in the short run until 2026; then, other resources must be found and earmarked to cover the needed state budget. Some other possible financing sources include (Figure 6):
- Revenues from general system charges (namely ASOS components) that are currently addressed to incentivize renewables and included in the electricity tariff.
- In Italy, the electricity price is composed of the following components: (i) Procurement costs that cover the costs of purchasing electricity from the wholesale market, plus other marketing, dispatching and imbalance costs; (ii) Network costs, i.e., costs paid for transmission, distribution and measurement of electricity; (iii) The system charges tariff, i.e., the costs of supporting activities of general interest for the electric system, including those incurred to purchase and incentivize electricity from renewable sources (namely “ASOS” components); (iv) Taxes, i.e., VAT and excise duties. ASOS components are expected to decrease over time due to expiration of incentives for renewables. Our suggestion is to maintain and reallocate this tariff component to all energy carriers (gas, electricity, transport) according to their environmental impact so as to ensure minimum resources for financing energy-efficiency measures. This reform could also solve the existing imbalance among the electric and gas tariff with respect to the amount paid for incentivizing renewable energies. Currently, the gas tariff pays for fewer tax components and parafiscal charges (i.e., general system charges) compared to the electric tariff, disadvantaging electrification of the final energy consumption. Therefore, it is necessary to review and counterbalance the taxation of electricity and natural gas via taking into consideration (i) energy content, (ii) environmental impact (negative externalities) and (iii) stability over time.
- Resources from anticipation of the Commission proposal that will introduce a new emission trading system (ETS) for buildings.
- Within the Fit For 55 package, the European Commission proposed to create a new system (called ETS2) to cap and trade carbon emissions from two major laggard sectors, i.e., road transport and buildings, in order to accelerate their decarbonization pathways. Manufacturing and energy industries, already covered by the old EU ETS, have, in fact, cut GHG emissions by more than 40% since 1990. Designed to start in 2026, the new ETS2 will put a price on emissions from the building and road-transport sectors. Suppliers (rather than households or car drivers) will be responsible for monitoring and reporting the quantities of fuel they place on the market and surrendering emission allowances each calendar year depending on the carbon intensities of these fuels. This approach aims to incentivize fuel suppliers to decarbonize their products, as this will reduce costs of compliance with the emissions trading system. In any case, under the new system, fuel retailers will largely pass the carbon price onto their customers, so final consumers will face higher prices for fossil fuels for transport and heating. Thus, the EC also introduced a Social Climate Fund of 72 billion EUR, aimed at addressing the social challenges that vulnerable groups in society may face. Our suggestion is to introduce carbon pricing on heating before 2026 and use the revenue thereof to cover the costs of energy-efficiency measures in buildings.
- Added VAT revenues due to the increase in the construction industry’s value. The proposed mechanism could favor productivity growth in the construction sector, which would in turn generate higher revenues related to value-added taxes. According to experts, 25–30% of the public expenditure allocated to cover this mechanism would return to the public budget in the form of VAT revenues.
- Resources from incentive schemes that are removed or lowered by this proposal. The abolishment of the current tax rebate for ordinary and extraordinary maintenance, restoration and building refurbishment (which do not regard energy-efficient renovations) could release resources that could instead be used for financing energy-efficiency measures.
4.2. A Revolving Fund for Schools and Public Housing Renovations
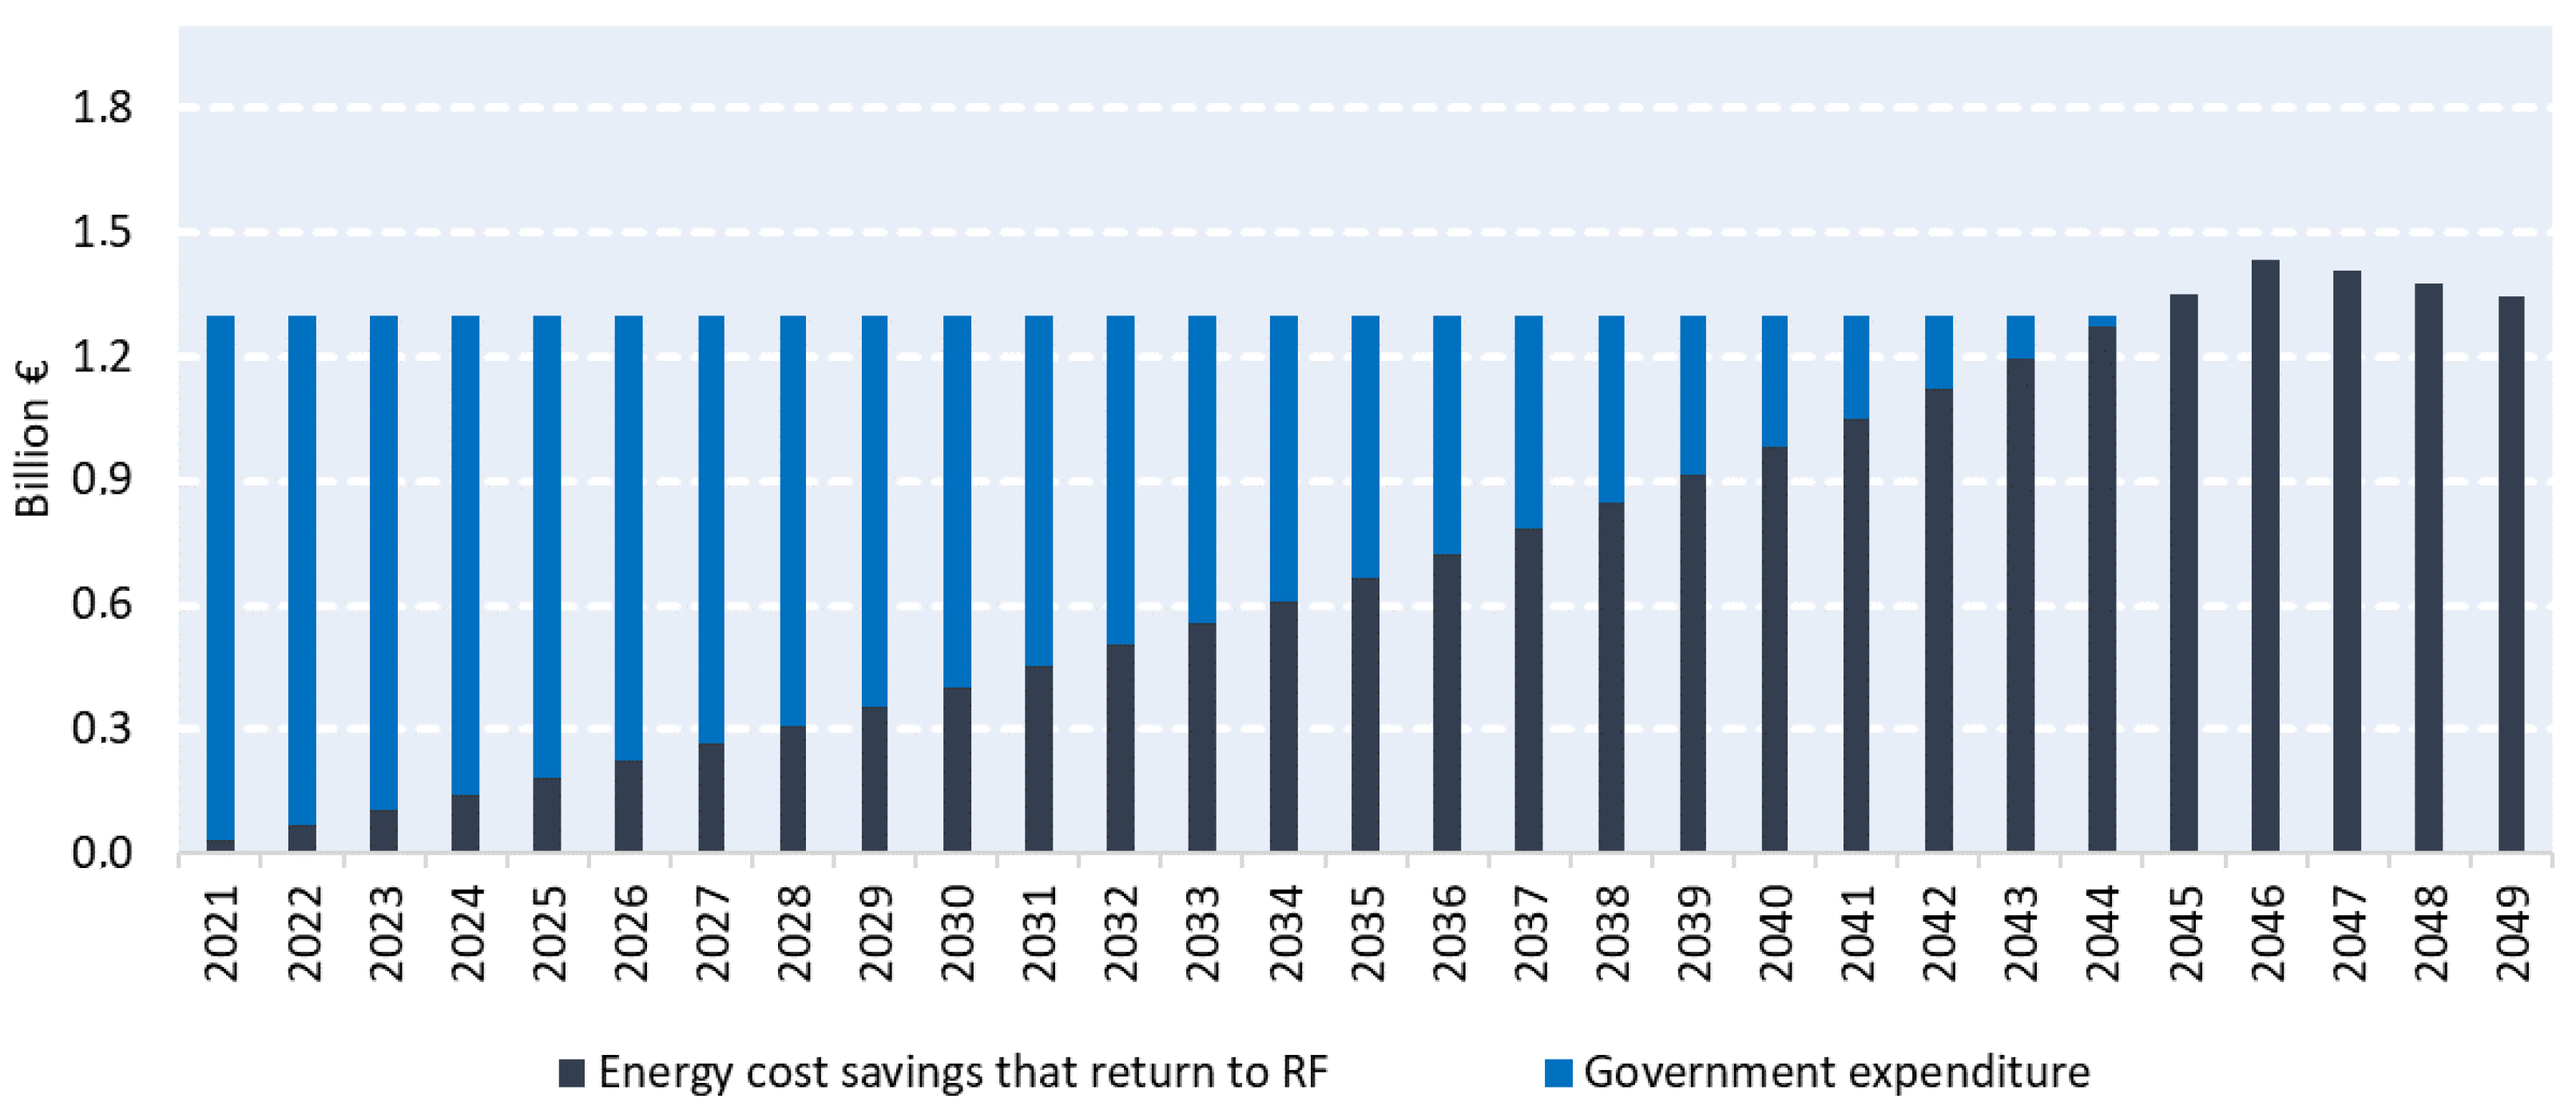
Although public authorities do not pay income taxes, the 110% Superbonus rebate has also financed public-house-renovation plans thanks to the credit-assignment mechanism. In this way, some local social housing bodies and associations have developed very interesting interventions. However, in our perspective, deep energy retrofitting of public buildings such as schools and social housing should be financed through a specific revolving scheme. According to our estimates (Chapter 3), the total size of the fund should be equal to 17 billion EUR in order to renovate about 1600 schools per year (a school renovation rate equal to 3%).
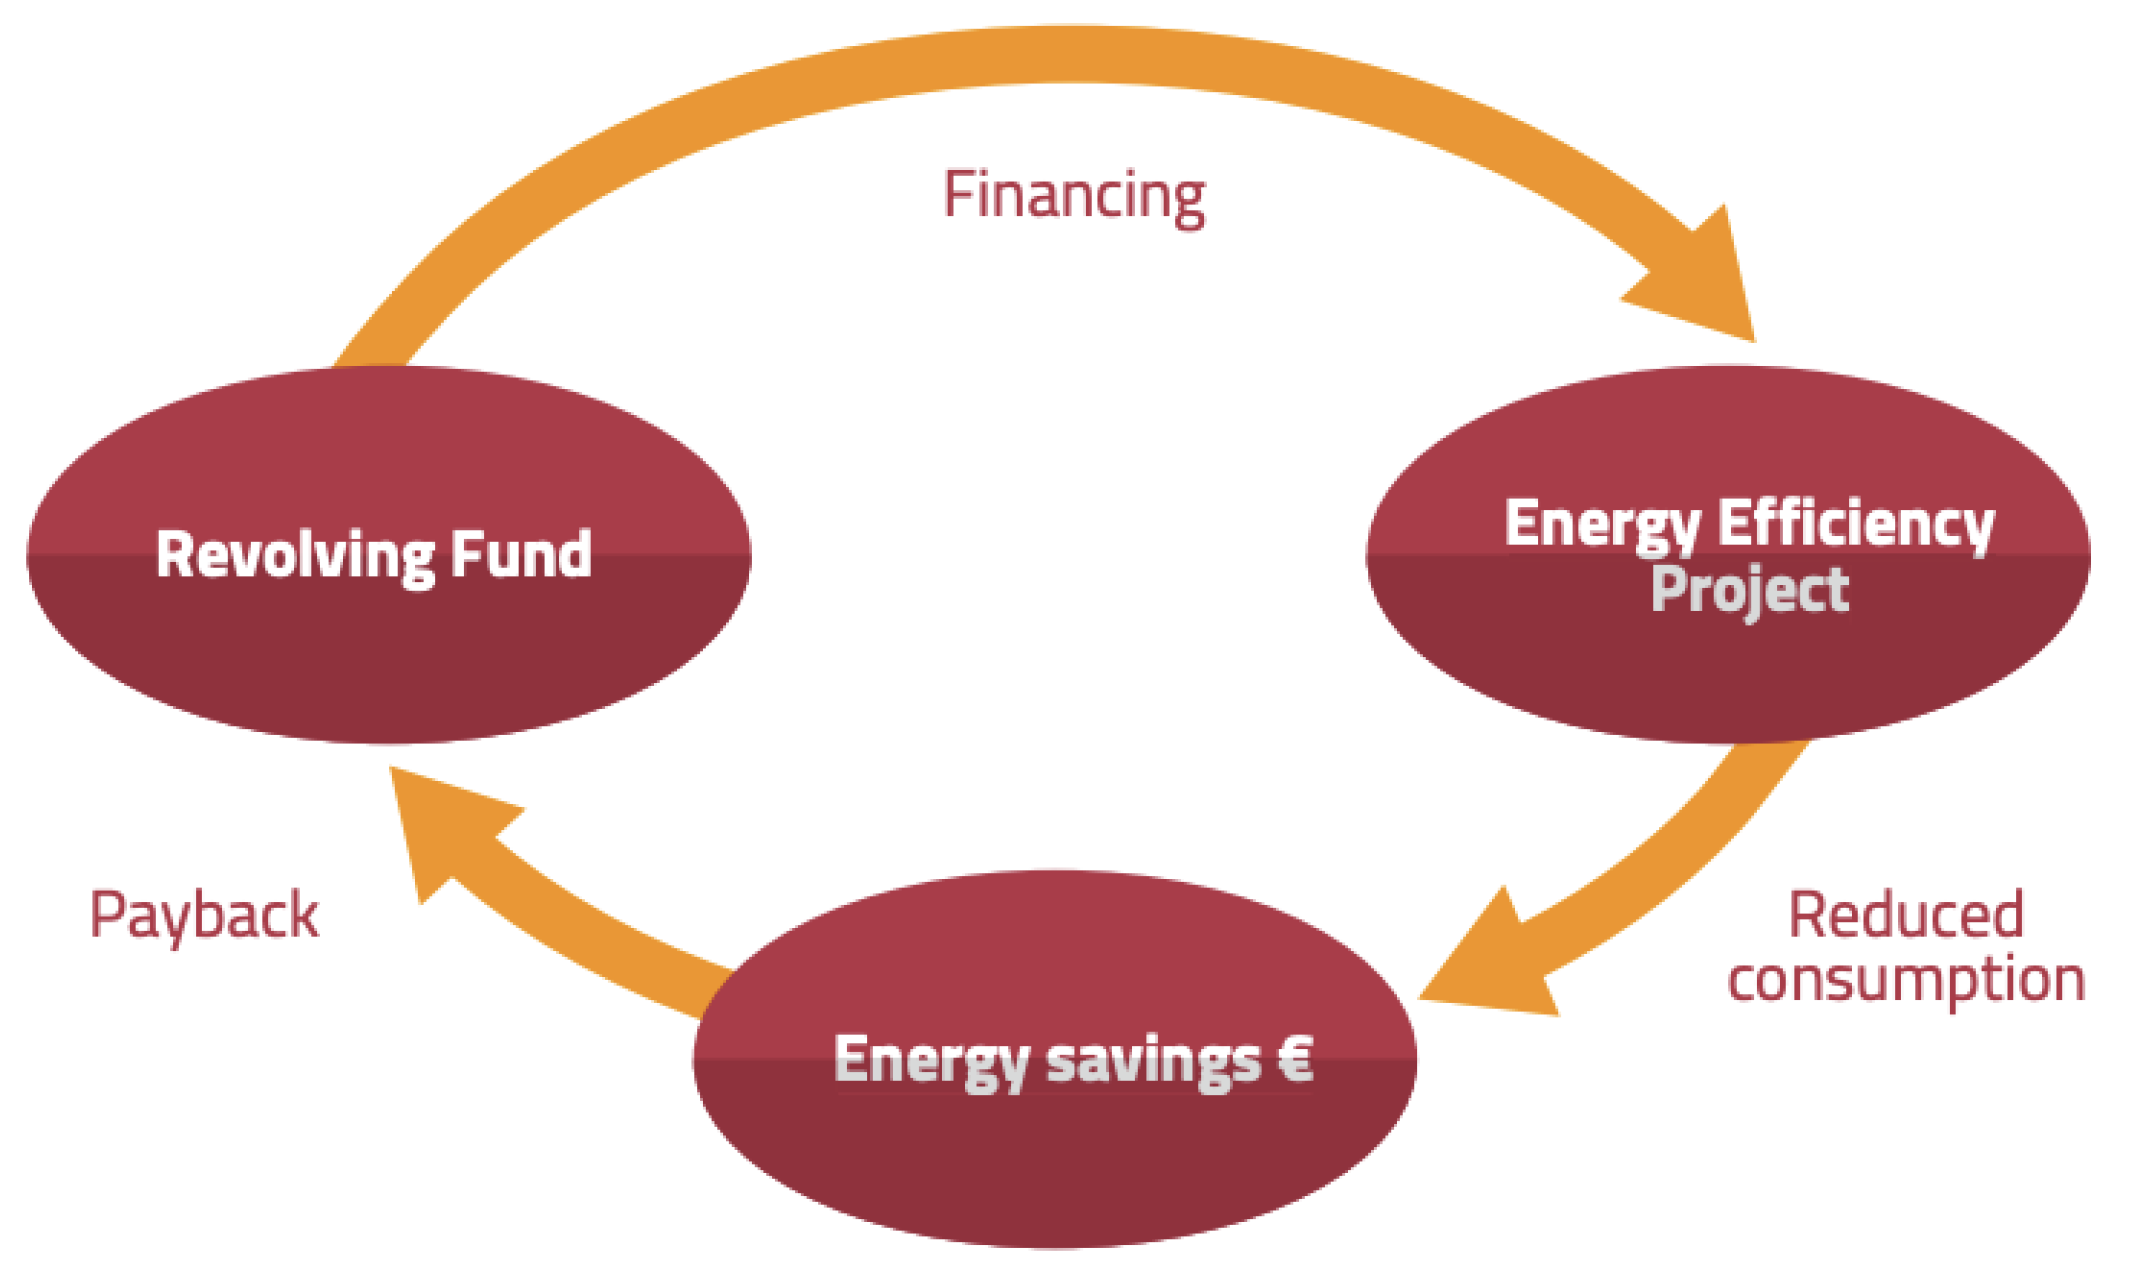
An energy-efficiency revolving fund is a type of fund that is dedicated to scaling up energy-efficiency investments using a revolving mechanism. A portion of the savings generated via supported investments is used to partially replenish the fund (i.e., revolved), allowing for reinvestments in future projects of similar value. This represents a promising support mechanism, as it acts as an ongoing funding vehicle that helps drive more energy-efficiency investments over time while generating cost savings and ensuring that capital is available for further projects [44]. To ensure that this support mechanism will deliver, it is necessary to allocate sufficient funds in the revolving fund. In addition, the rate of return of supported energy-efficiency interventions must balance the risks associated with this type of fund, which means that projects must be closely monitored to accurately calculate energy savings (and thereby rates of return) [44].
Some examples of revolving funds are the following: The Energy Efficiency and Renewable Sources Fund in Bulgaria; The Kredex Fund in Estonia; The National Revolving Fund for Energy Saving in the Netherlands; The SALIX scheme in the UK [44]. For example, in the last case, the government funded a private company called Salix Finance Ltd. to establish energy-efficiency revolving-loan schemes in the public sector. This company developed an innovative spend-to-save program to overcome barriers in the public sector. Salix provided interest-free loans to organizations that were required to provide matched funding and establish an ongoing ring-fenced energy-saving fund within the organization. The energy or estates team would then (typically) use this fund to support projects across the estate that would pay back into the loan fund using the energy savings they generated. These loans, once established, would continue to deliver energy savings over time, with recycled savings used to repay each individual project loan and then released for frontline services.
An example of a revolving fund in Italy is the “Fondo rotativo per il sostegno alle imprese e agli investimenti in ricerca" (revolving fund to support business and investment in research), which is addressed to companies that invest in the following sectors: Research and development; Technological innovation; Industry; Tourism, Trade; Craft; Agriculture; Service. The national Deposits and Loans Fund (“Cassa Depositi e Prestiti”, CDP) provides medium–long-term finance, pooled with the banking system, for entities that make investments that are eligible for public subsidies on various measures, at favorable economic conditions. Subsidized financing normally covers 50% of a loan, reaching a maximum value of 90% for research, development and innovation programs. The entity eligible for the loan (i.e., the beneficiary subject) enters a single loan contract, composed of a quota granted by the CDP at a subsidized rate and a quota granted by a bank at the market rate.
A hypothetical way to replenish the initial fund is for newly renovated buildings to pay, for a fixed number of years, the same energy bills despite their energy savings (a small reduction could also be considered) so as to feed the revolving-fund budget, which could then be used for other retrofitting interventions (Figure 7).
The revolving fund could be financed with the public budget and particularly with resources consistent with Directive 108/2018 targets. NRRP resources for renovation of schools should be better allocated through setup of a revolving fund to involve a greater number of buildings and create the opportunity to continuously finance new investments.
According to our estimates, every year, the fund should consist of about 1.3 billion EUR to renovate 1600 schools and reduce their energy consumption by about 60 kWh/m2. This fund would be partially financed via energy cost savings obtained by renovated schools, as reported in Figure 8.
5. Conclusions
Since the summer of 2021, the European Union has suffered from an unprecedented increase in the price of the gas supply. In 2019, in Italy, natural gas provided 38.5% of the primary energy, and 43% of the gas supply was imported from Russia. In this particular framework, the need to increase the rate of deep retrofitting in the building sector can jointly allow pursuance of short-term objectives (an increase in energy security, reduction in dependence on Russia, an increase in GDP, job protection) and long-term strategies (the 2030 package and the 2050 net zero emission target). In this paper, a comprehensive roadmap is presented to have at least 80% of existing buildings deeply retrofitted by 2050. Different approaches can be defined for residential and educational sectors.
Concerning the private residential sector, it is necessary to harmonize the wide range of tax rebate schemes for building interventions, linking them to actual energy-efficiency and decarbonization targets. These schemes should be stabilized in a long-term strategy to provide market actors with a solid framework and, at the same time, stimulate them to act as soon as possible. The incentives should also take into account energy poverty and equality issues. Concerning public buildings such as schools and social housing, given the results of experiences in other countries, a revolving fund is proposed. The cost and source of the financing are identified for both mechanisms.
Author Contributions
Conceptualization, G.R., F.A. and P.Z.; methodology, G.R., F.A. and P.Z.; validation, P.Z.; data curation, F.A. and P.Z.; writing—original draft preparation, G.R. and F.A.; writing—review and editing, P.Z.; visualization, F.A. and P.Z.; supervision, G.R. All authors have read and agreed to the published version of the manuscript.
Funding
This research received no external funding.
Institutional Review Board Statement
Not applicable.
Informed Consent Statement
Not applicable.
Data Availability Statement
Not applicable.
Conflicts of Interest
The authors declare no conflict of interest.
References
- European Commission. COM/2019/640 Final: Communication from the Commission to the European Parliament, the European Council, the Council, the European Economic and Social Committee and the Committee of the Regions: The European Green Deal; European Commission: Brussels, Belgium, 2019. [Google Scholar]
- European Commission. Directorate-General for Energy, Comprehensive Study of Building Energy Renovation Activities and the Uptake of Nearly Zero-Energy Buildings in the EU: Final Report; Publications Office: Brussels, Belgium, 2019. [Google Scholar]
- Gevorgian, A.; Pezzutto, S.; Zambotti, S.; Croce, S.; Oberegger, U.F.; Lollini, R.; Kranzl, L.; Muller, A. European Building Stock Analysis; Eurac Research: Bolzano, Italy, 2021. [Google Scholar]
- Napoli, G.; Gabrielli, L.; Barbaro, S. The efficiency of the incentives for the public buildings energy retrofit. The case of the Italian Regions of the “Objective Convergence”. Valori Valutazioni 2017, 18, 25–39. [Google Scholar]
- European Parliament. EPBD Recast, Directive 2010/31/EU of the European Parliament and of the Council of 19 May 2010 on the Energy Performance of Buildings (Recast). Off. J. Eur. Union 2010, L153, 15–35. [Google Scholar]
- Economidou, M.; Todeschi, V.; Bertoldi, P. Accelerating Energy Renovation Investments in Buildings–Financial & Fiscal Instruments across the EU, EUR 29890 EN; Publications Office of the European Union: Lëtzebuerg, Luxembourg, 2019. [Google Scholar]
- Caputo, P.; Pasetti, G. Overcoming the inertia of building energy retrofit at municipal level: The Italian challenge. Sustain. Cities Soc. 2015, 15, 120–134. [Google Scholar] [CrossRef]
- European Commission. COM/2020/662 Final: Communication from the Commission to the European Parliament, the Council, the European Economic and Social Committee and the Committee of the Regions: A Renovation Wave for Europe-Greening our Buildings, Creating Jobs, Improving Lives; European Commission: Brussels, Belgium, 2020. [Google Scholar]
- Avanzini, M.; Pinheiro, M.D.; Gomes, R.; Rolim, C. Energy retrofit as an answer to public health costs of fuel poverty in Lisbon social housing. Energy Policy 2022, 160, 112658. [Google Scholar] [CrossRef]
- Buildings Performance Institute Europe. Contribution from the Building Sector to a Strengthened 2030 Climate Target; Buildings Performance Institute Europe: Brussels, Belgium, 2020. [Google Scholar]
- Bonifaci, P.; Copiello, S. Incentive Policies for Residential Buildings Energy Retrofit: An Analysis of Tax Rebate Programs in Italy. In Smart and Sustainable Planning for Cities and Regions, Green Energy and Technology; Bisello, Ed.; Springer: Cham, Switzerland, 2018. [Google Scholar] [CrossRef]
- Fabbri, K.; Gaspari, J. Mapping the energy poverty: A case study based on the energy performance certificates in the city of Bologna. Energy Build. 2021, 234, 110718. [Google Scholar] [CrossRef]
- Martini, C. The Ecobonus Incentive Scheme and Energy Poverty: Is Energy Efficiency for All? In Smart and Sustainable Planning for Cities and Regions, Green Energy and Technology; Bisello, Ed.; Springer: Cham, Switzerland, 2021. [Google Scholar] [CrossRef]
- Eurostat. Population Change. Available online: https://ec.europa.eu/eurostat/cache/countryfacts/ (accessed on 31 October 2022).
- Eurostat. Which EU Countries Had the Highest GDP in 2020? Available online: https://ec.europa.eu/eurostat/web/products-eurostat-news/-/ddn-20211220-1 (accessed on 31 October 2022).
- Eurostat. General Government Gross Debt. Available online: https://ec.europa.eu/eurostat/databrowser/view/SDG_17_40__custom_2193722/bookmark/table?lang=en&bookmarkId=fef0c906-5609-4e2c-9a0f-692e93535757 (accessed on 31 October 2022).
- Eurostat. Energy Imports Dependency. Available online: https://ec.europa.eu/eurostat/databrowser/view/NRG_IND_ID__custom_2026282/bookmark/table?lang=en&bookmarkId=42bde5ba-8571-462e-8d35-62d3617a671d (accessed on 31 October 2022).
- Ministero dello Sviluppo Economico, Ministero dell’Ambiente e della Tutela del Territorio e del Mare, Ministero delle Infrastrutture e dei Trasporti. National Energy and Climate Plan. Available online: https://www.mise.gov.it/images/stories/documenti/PNIEC_finale_17012020.pdf (accessed on 18 January 2023).
- Ministero dello Sviluppo Economico, Ministero dell’Ambiente e della Tutela del Territorio e del Mare, Ministero delle Infrastrutture e dei Trasporti. Italian Long-Term Strategy. Available online: https://ec.europa.eu/clima/sites/lts/lts_it_it.pdf (accessed on 18 January 2023).
- Ministero dello Sviluppo Economico, Ministero dell’Ambiente e della Tutela del Territorio e del Mare, Ministero delle Infrastrutture e dei Trasporti. Strategia per la riqualificazione energetica del parco immobiliare nazionale. Available online: https://www.mise.gov.it/images/stories/documenti/STREPIN_2020_rev_25-11-2020.pdf (accessed on 18 January 2023).
- ENEA. Rapporto annuale Efficienza Energetica 2020: Analisi e risultati delle policy di efficienza energetica del nostro paese, Agenzia Nazionale per l’Efficienza Energetica. Available online: https://www.efficienzaenergetica.enea.it/component/jdownloads/?task=download.send&id=511&catid=40&Itemid=101 (accessed on 18 January 2023).
- ISPRA. Italian Greenhouse Gas Inventory 1990-2020. National Inventory Report 2022. Rapporti 360/2022. Available online: https://www.isprambiente.gov.it/it/pubblicazioni/rapporti/italian-greenhouse-gas-inventory-1990-2020-national-inventory-report-2022 (accessed on 18 January 2023).
- D’Alpaos, C.; Bragolusi, P. Buildings energy retrofit valuation approaches: State of the art and future perspectives. Valori Valutazioni 2018, 20, 79–92. [Google Scholar]
- Noera, M. Il Green Deal conviene. Benefici per economia e lavoro in Italia al 2030, Italian Climate Network. 2020. Available online: https://www.italiaclima.org/wp-content/uploads/2020/10/Il-Green-Deal-conviene-Italian-Climate-Network.pdf (accessed on 18 January 2023).
- ODYSSEE. Energy Efficiency Trends and Policies in European Union. 2021. Available online: https://www.odyssee-mure.eu/publications/efficiency-trends-policies-profiles/european-union.html#buildings (accessed on 18 January 2023).
- ODYSSEE. Energy Efficiency Trends and Policies in ITALY. 2021. Available online: https://www.odyssee-mure.eu/publications/national-reports/energy-efficiency-italy.pdf (accessed on 18 January 2023).
- Zangheri, P.; Armani, R.; Kakoulaki, G.; Bavetta, M.; Martirano, G.; Pignatelli, F.; Baranzelli, C. Building energy renovation for decarbonisation and Covid-19 recovery. In A Snapshot at Regional Level, EUR 30433 EN; Publications Office of the European Union: Lëtzebuerg, Luxembourg, 2020; ISBN 978-92-76-24766-1. [Google Scholar] [CrossRef]
- Istat. Population Housing Census. Available online: http://dati-censimentopopolazione.istat.it/Index.aspx?lang=en&SubSessionId=0dbca8a4-5347-43de-bf1d-964c06ab9897&themetreeid=-200 (accessed on 31 October 2022).
- European Parliament. Directive (EU) 2018/2002 of the European Parliament and of the Council of 11 December 2018 Amending Directive 2012/27/EU on Energy Efficiency. Off. J. Eur. Union 2018, L328, 210–230. [Google Scholar]
- D’Agostino, D.; Tzeiranaki, S.T.; Zangheri, P.; Bertoldi, P. Assessing Nearly Zero Energy Buildings (NZEBs) development in Europe. Energy Strategy Rev. 2021, 36, 100680. [Google Scholar] [CrossRef]
- Decreto Ministeriale on 26 June 2015: Applicazione delle metodologie di calcolo delle prestazioni energetiche e definizione delle prescrizioni e dei requisiti minimi degli edifici. Gazzetta Ufficiale n. 162 del 15-07-2015. Available online: https://www.gazzettaufficiale.it/eli/id/2015/07/15/15A05198/sg (accessed on 18 January 2023).
- European Commission. COM/2021/550 Final: Communication from the Commission to the European Parliament, the Council, the European Economic and Social Committee and the Committee of the Regions ‘Fit for 55’: Delivering the EU’s 2030 Climate Target on the way to Climate Neutrality; European Commission: Brussels, Belgium, 2021. [Google Scholar]
- Bertoldi, P.; Economidou, M.; Palermo, V.; Boza-Kiss, B.; Todeschi, V. How to Finance Energy Renovation of Residential Buildings: Review of Current and Emerging Financing Instruments in the EU. WIREs Energy Environ. 2020, 10, e384. Available online: https://wires.onlinelibrary.wiley.com/doi/10.1002/wene.384 (accessed on 18 January 2023).
- Law Decree 34/2020 on “Misure Urgenti in Materia di Salute, Sostegno al Lavoro e All’economia, Nonché di Politiche Sociali Connesse All’emergenza Epidemiologica da COVID-19”. Available online: https://www.gazzettaufficiale.it/static/20200519_128_SO_021.pdf (accessed on 18 January 2023).
- National Recovery and Resilience Plan–NRRP. 2020. Available online: https://www.governo.it/sites/governo.it/files/PNRR.pdf (accessed on 18 January 2023).
- ENTRANZE, 2014-Database of EE and RES Technologies: Energy/Cost Matrices. Available online: https://www.entranze.eu/pub/pub-optimality/ (accessed on 18 January 2023).
- De Vita, A.; Kielichowska, I.; Mandatowa, P.; Capros, P.; Dimopoulou, E.; Evangelopoulou, S.; Dekelver, G. Technology Pathways in Decarbonisation Scenarios; ASSET (Advanced System Studies for Energy Transition): 2018. Available online: https://www.buildup.eu/sites/default/files/content/2018_06_27_technology_pathways_-_finalreportmain2.pdf (accessed on 18 January 2023).
- ODYSSEE-MURE Project. Energy Efficiency Trends for Households in the EU. 2021. Available online: https://www.odyssee-mure.eu/publications/efficiency-by-sector/households/ (accessed on 18 January 2023).
- Zangheri, P.; Armani, R.; Pietrobon, M.; Pagliano, L. Identification of cost-optimal and NZEB refurbishment levels for representative climates and building typologies across Europe. Energy Effic. 2018, 11, 337–369. [Google Scholar] [CrossRef] [Green Version]
- Delia D’Agostino, S.; Tsemekidi, T.; Paolo, Z.; Paolo, B. Assessing Nearly Zero Energy Buildings (NZEBs) development in Europe. In Energy Strategy Reviews; Elsevier: Amsterdam, The Netherlands, 2021; Volume 36, p. 100680. ISSN 2211-467X. [Google Scholar] [CrossRef]
- Edoardo, B.; Silvia, C.; Marco, D.; Elisa, D.G.; Roberto, E. From cost-optimal to nearly Zero Energy Buildings’ renovation: Life Cycle Cost comparisons under alternative macroeconomic scenarios. J. Clean. Prod. 2021, 288, 125606. [Google Scholar] [CrossRef]
- Rajan, K.J.; Suprava, C.D.; Elangovan, S.P. Concept of net zero energy buildings (NZEB)-A literature review. Clean. Eng. Technol. 2022, 11, 100582. [Google Scholar] [CrossRef]
- European Commission. COM/2021/1749: Commission Recommendation on Energy Efficiency First: From principles to practice—Guidelines and Examples for Its Implementation in Decision-Making in the Energy Sector and Beyond: The European Green Deal; European Commission: Brussels, Belgium, 2021. [Google Scholar]
- Schilken, P.; Schafer, N.; Infinite Solutions Guidebook: Financing the Energy Renovation of Public Buildings through Internal Contracting. Energy Cities, Besançon, France 2017. Available online: https://energy-cities.eu/publication/infinite-solutions-guidebook-2/ (accessed on 18 January 2023).
Figure 1.
Classification of the building stock, according to energy efficiency, on a scale of A (the best) to >D (the worst), for several European countries [24].
Figure 1.
Classification of the building stock, according to energy efficiency, on a scale of A (the best) to >D (the worst), for several European countries [24].

Figure 2.
Variation in household consumption in Italy—Mtoe (2000–2016) [26].
Figure 2.
Variation in household consumption in Italy—Mtoe (2000–2016) [26].

Figure 3.
Final energy consumption (Mtoe) in the residential (a) and nonresidential (b) sectors, from 1990 to 2019 [26].
Figure 3.
Final energy consumption (Mtoe) in the residential (a) and nonresidential (b) sectors, from 1990 to 2019 [26].

Figure 4.
Aggregate indicator reflecting the regional criticality [27].
Figure 4.
Aggregate indicator reflecting the regional criticality [27].

Figure 5.
Evolution of the renovation rate to be pursued over the period of 2020–2050.

Figure 6.
Evolution of the state cost for the proposed scheme and hedging resources due to the general system charge reform and the ETS2 mechanism.
Figure 6.
Evolution of the state cost for the proposed scheme and hedging resources due to the general system charge reform and the ETS2 mechanism.

Figure 7.
Basic structure of a revolving fund (Source: [44]).
Figure 7.
Basic structure of a revolving fund (Source: [44]).

Figure 8.
Example of the possible evolution of the revolving fund (RF) for schools.


Table 1.
Total number of schools and their floor areas, divided based on climate zone [20].
Table 1.
Total number of schools and their floor areas, divided based on climate zone [20].
| Climate Zone * | Total Number | Useful Floor Area (m2) |
|---|---|---|
| Climate Zone A | 17 | 21,180 |
| Climate Zone B | 3340 | 4,412,730 |
| Climate Zone C | 11,471 | 17,223,700 |
| Climate Zone D | 13,867 | 19,671,840 |
| Climate Zone E | 24,839 | 40,236,020 |
| Climate Zone F | 2515 | 2,773,500 |
| Total | 56,049 | 84,338,970 |
* Climate zones are areas with distinct climates and are classified using different parameters. In Italy, they are identified via Presidential Decree No. 412 of 26 August 1993 according to their average daily temperatures. Their classification is based on estimates of heating degree days (HDDs); the higher the HDDs, the colder the climate. Warmer areas were identified in Climate Zone A, with HDDs lower than 600, whereas Climate Zone F represented colder areas, with HDDs higher than 3000.
Table 2.
School floor areas (thousands m2) divided based on climate zone and construction time [20].
Table 2.
School floor areas (thousands m2) divided based on climate zone and construction time [20].
| Construction Time | Climate Zones A–B | Climate Zone C | Climate Zone D | Climate Zone E | Climate Zone F | Total |
|---|---|---|---|---|---|---|
| (Thousands m2) | ||||||
| Before 1945 | 804 | 2269 | 3646 | 8117 | 586 | 15,424 |
| 1946–1976 | 1457 | 8364 | 10,345 | 20,178 | 1539 | 41,885 |
| After 1976 | 2171 | 6589 | 5680 | 11,940 | 648 | 27,030 |
Table 3.
Summary of buildings for social housing and their floor area divided based on climate zone [20].
Table 3.
Summary of buildings for social housing and their floor area divided based on climate zone [20].
| Climate Zone | Total Number | Useful Floor Area (m2) |
|---|---|---|
| Climate Zone A | 323 | 25,525 |
| Climate Zone B | 47,370 | 3,707,379 |
| Climate Zone C | 149,549 | 12,248,408 |
| Climate Zone D | 189,043 | 14,282,064 |
| Climate Zone E | 306,167 | 22,115,704 |
| Climate Zone F | 18,142 | 1.291,259 |
| Total | 710,594 | 53,670,340 |
Table 4.
Minimum total costs, optimal annual primary energy consumptions, nonrenewable primary energy (status quo), cost-optimal nonrenewable primary energy and related CO2-emission reductions for different types of residential buildings and schools [20].
Table 4.
Minimum total costs, optimal annual primary energy consumptions, nonrenewable primary energy (status quo), cost-optimal nonrenewable primary energy and related CO2-emission reductions for different types of residential buildings and schools [20].
| Building Type | Climate Zone | Total Cost (EUR/m2) | Global Nonrenewable Primary Energy (kWh/m2) |
|---|---|---|---|
| Residential | E | 212–575 | 40–106 |
| B | 185–477 | 35–90 | |
| School | E | 330 | 101 |
| B | 330 | 42 |
Table 5.
Estimates of annual deep-renovation rates, energy savings and investment needs for residential and school buildings in 2030 [20].
Table 5.
Estimates of annual deep-renovation rates, energy savings and investment needs for residential and school buildings in 2030 [20].
| Building Type | Annual Deep-Renovation Rate | Energy Savings (Mtoe/Year) | Investment Needs (Billion EUR/Year) |
|---|---|---|---|
| Residential (both public and private) | 0.62−0.81% | 0.33 | 9.18−11.94 |
| School | 1.77−2.28% | 0.01 | 0.55−0.58 |
Table 6.
Main input data for SFH (preretrofitting primary energy, percentual energy savings and renovation costs) collected for the Italian macroregions.
Table 6.
Main input data for SFH (preretrofitting primary energy, percentual energy savings and renovation costs) collected for the Italian macroregions.
| Macroregional Level | Average Primary Energy Consumption Preretrofitting, PEref (kWh/m2) | Energy Savings | Renovation Cost (EUR/m2) | ||
|---|---|---|---|---|---|
| Cost-Opt., ESCO | NZEB, ESNZEB | Cost-Opt., CCO | NZEB, CNZEB | ||
| Italy | 257 | 83% | 76% | 562 | 498 |
| North | 335 | 85% | 79% | 681 | 577 |
| Central | 226 | 82% | 76% | 536 | 490 |
| South and Islands | 168 | 80% | 74% | 416 | 395 |
Table 7.
Main input data for MFH (preretrofitting primary energy, percentual energy savings and renovation costs) collected for the Italian macroregions.
Table 7.
Main input data for MFH (preretrofitting primary energy, percentual energy savings and renovation costs) collected for the Italian macroregions.
| Macroregional Level | Average Primary Energy Consumption Preretrofitting, PEref (kWh/m2) | Energy Savings | Renovation Cost (EUR/m2) | ||
|---|---|---|---|---|---|
| Cost-Opt., ESCO | NZEB, ESNZEB | Cost-Opt., CCO | NZEB, CNZEB | ||
| Italy | 199 | 55% | 70% | 253 | 299 |
| North | 253 | 55% | 72% | 254 | 346 |
| Central | 180 | 55% | 70% | 271 | 294 |
| South and Islands | 138 | 55% | 68% | 241 | 237 |
Table 8.
Technical savings potential (primary energy), investment needs and FTE jobs associated with the renovation of the Italian residential building stock.
Table 8.
Technical savings potential (primary energy), investment needs and FTE jobs associated with the renovation of the Italian residential building stock.
| Macroregional Level | Savings Potential (Primary Energy) (TWh/Year) | Necessary Investments for Building Renovations (Billion EUR) | Full-Time Equivalent Jobs (Million FTE) |
|---|---|---|---|
| Italy | 282 | 792 | 11.8 |
| North | 147 | 353 | 5.0 |
| Central | 72 | 220 | 3.2 |
| South and Islands | 63 | 219 | 3.6 |
Table 9.
Technical savings potential (primary energy), investment needs, FTE jobs and savings per EUR invested associated with the renovation of the Italian residential and educational building stock.
Table 9.
Technical savings potential (primary energy), investment needs, FTE jobs and savings per EUR invested associated with the renovation of the Italian residential and educational building stock.
| Building Sector | Savings Potential (Primary Energy) (TWh/Year) | Necessary Investments for Building Renovations (Billion EUR) | Full-Time Equivalent Jobs (Million FTE) | Energy Savings per Invested EUR (Wh/EUR) |
|---|---|---|---|---|
| Residential | 265 | 792 | 9.9 | 356 |
| School | 13.5 | 46 | 0.7 | 294 |
Table 10.
The existing framework of incentive measures for the building sector in Italy.
| Measure | Tax Rebate | Energy Requirements | Bureaucratic Burden |
|---|---|---|---|
| Ordinary and extraordinary maintenance | 36–50% | None | None |
| Energy-efficiency measures | 55–65% | Specific requirements, e.g., minimum efficiency for boilers/heat pumps or maximum U-value for insulation | Attestation from a certified technician |
| Façade rebate | 90% | None | None |
| Superbonus | 110% | At least two classes of improvement for building-energy performance | Before-and-after building-energy certification |
Table 11.
Examples of possible evolution of the tax-deduction scheme aimed at improving energy efficiency in buildings.
Table 11.
Examples of possible evolution of the tax-deduction scheme aimed at improving energy efficiency in buildings.
| Building Type | Renovation Type | Tax Deduction Rate | ||
|---|---|---|---|---|
| 2021–2023 | 2024–2025 | 2026–2030 | ||
| Single-family home (SH) | Medium * | 36% | 20% | - |
| Deep ** | 70% | 65% | 50% | |
| Multifamily building (MF) (1) | Medium * | 65% | 50% | 36% |
| Deep ** | 110% | 90% | 75% | |
Note: Low-income households could apply for special support and have their energy-saving renovations fully financed (1). This includes “functionally-independent” houses. * Medium renovations represent those with energy savings from 30% to ≤ 60%. ** Deep renovations represent those with energy savings > 60%.
Disclaimer/Publisher’s Note: The statements, opinions and data contained in all publications are solely those of the individual author(s) and contributor(s) and not of MDPI and/or the editor(s). MDPI and/or the editor(s) disclaim responsibility for any injury to people or property resulting from any ideas, methods, instructions or products referred to in the content. |
© 2023 by the authors. Licensee MDPI, Basel, Switzerland. This article is an open access article distributed under the terms and conditions of the Creative Commons Attribution (CC BY) license (https://creativecommons.org/licenses/by/4.0/).
Share and Cite
MDPI and ACS Style
Ruggieri, G.; Andreolli, F.; Zangheri, P. A Policy Roadmap for the Energy Renovation of the Residential and Educational Building Stock in Italy. Energies 2023, 16, 1319. https://doi.org/10.3390/en16031319
AMA Style
Ruggieri G, Andreolli F, Zangheri P. A Policy Roadmap for the Energy Renovation of the Residential and Educational Building Stock in Italy. Energies. 2023; 16(3):1319. https://doi.org/10.3390/en16031319
Chicago/Turabian StyleRuggieri, Gianluca, Francesca Andreolli, and Paolo Zangheri. 2023. "A Policy Roadmap for the Energy Renovation of the Residential and Educational Building Stock in Italy" Energies 16, no. 3: 1319. https://doi.org/10.3390/en16031319
Note that from the first issue of 2016, this journal uses article numbers instead of page numbers. See further details here.