
Experimental Investigation of Thermal Bridges and Heat Transfer through Window Frame Elements at Achieving Energy Saving


Abstract
:1. Introduction
2. Materials and Methods
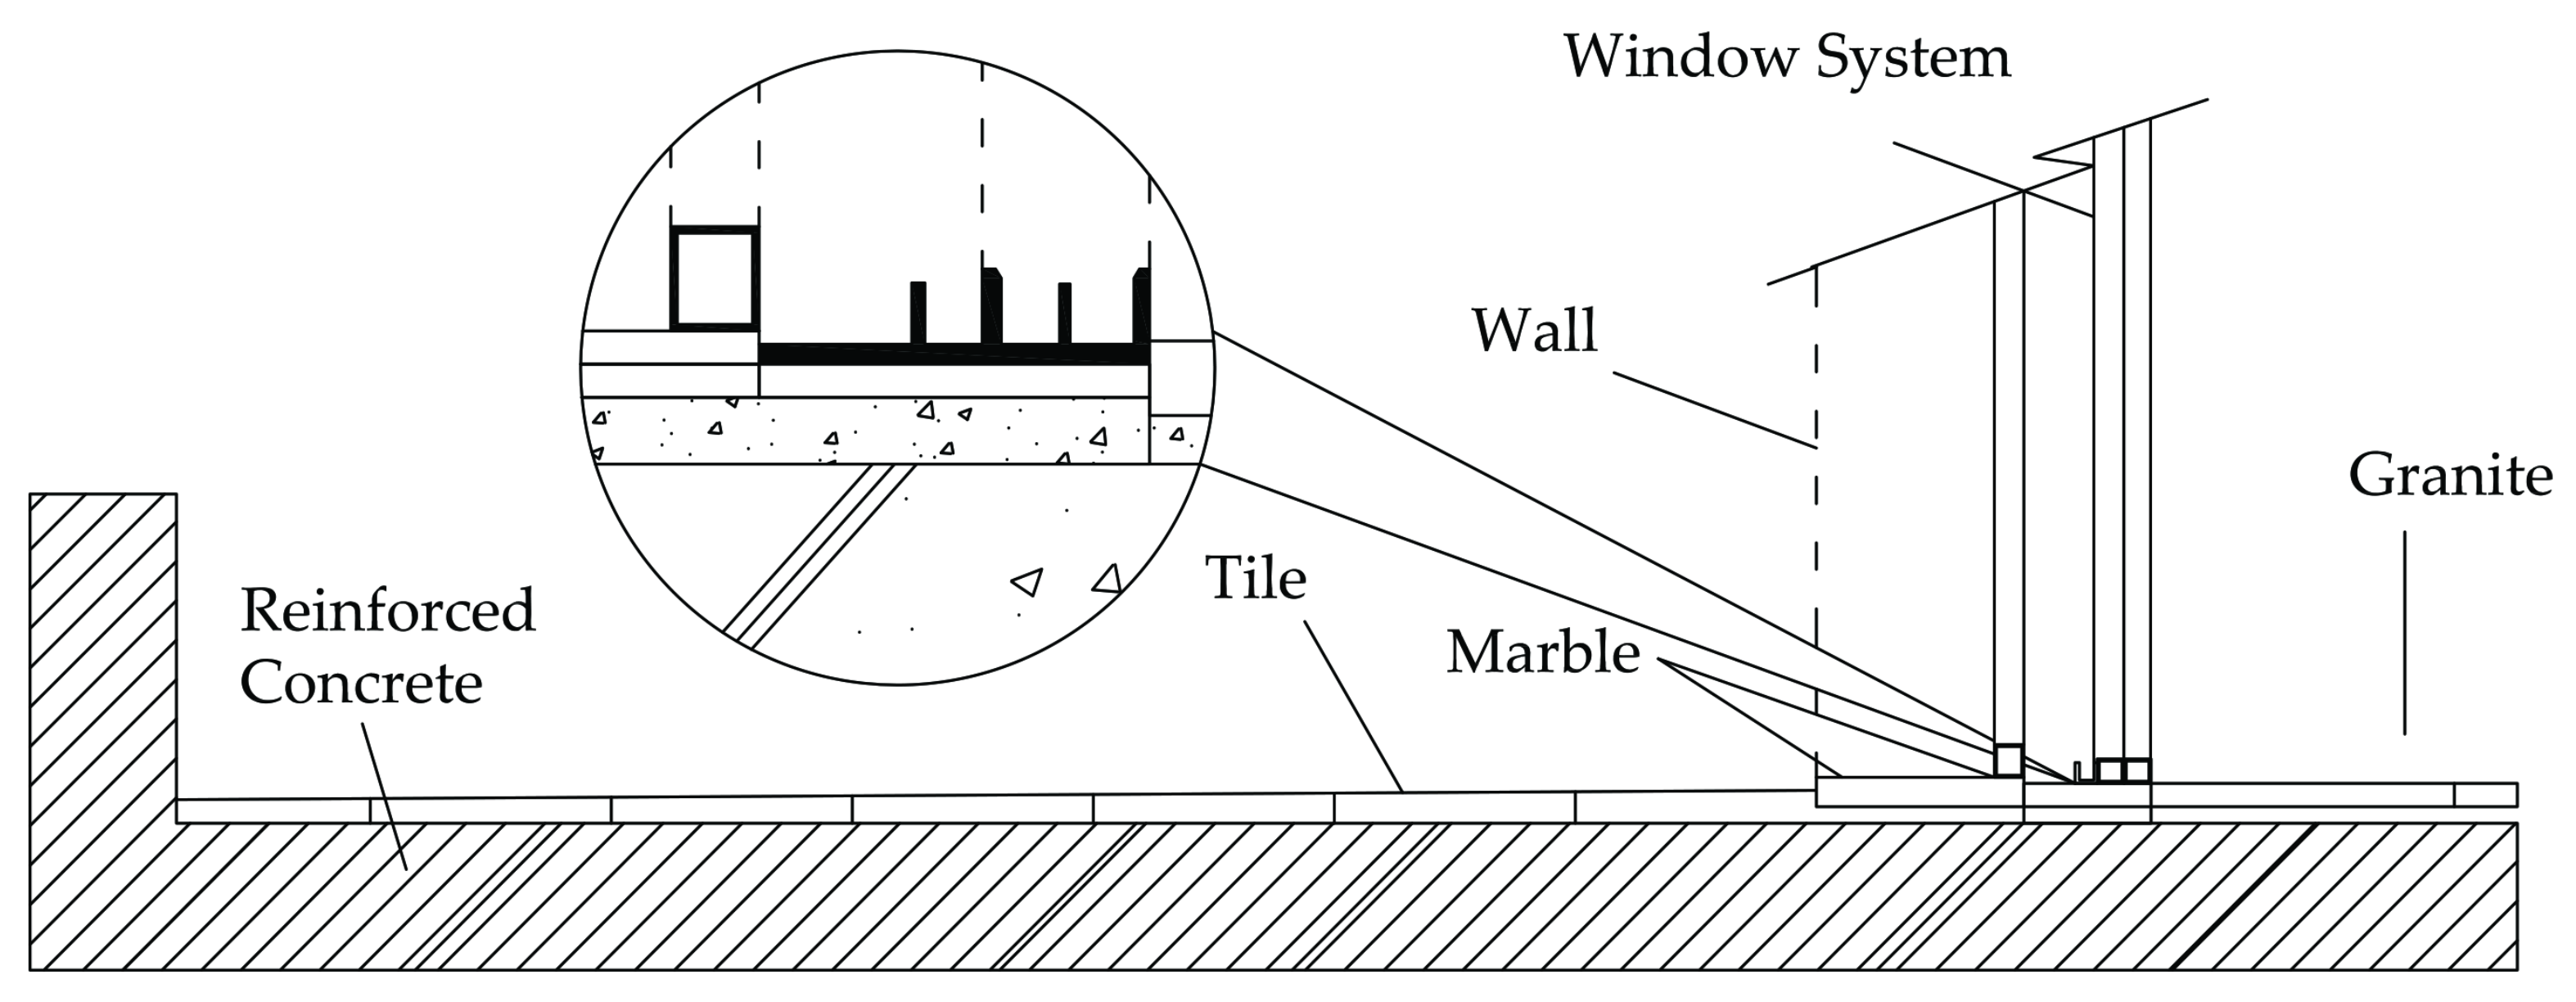
- The floor slab continued for 3.21 m at the inner side of the residential building (the vertical site of the slab at the inner part of the room was examined as an adiabatic surface);
- Each scenario was analyzed with a balcony outdoor slab length of 2.08 m on the exterior side.
- A friendly graphic user interface to design and examine the geometry shape for a given problem;
- A precise mesh generator to create the elements of the model for the finite-element analysis;
- A finite-element calculator;
- An error indicator;
- A view-factor radiation related to the model.
2.1. A 2D Heat Transfer Simulation Analysis Using THERM
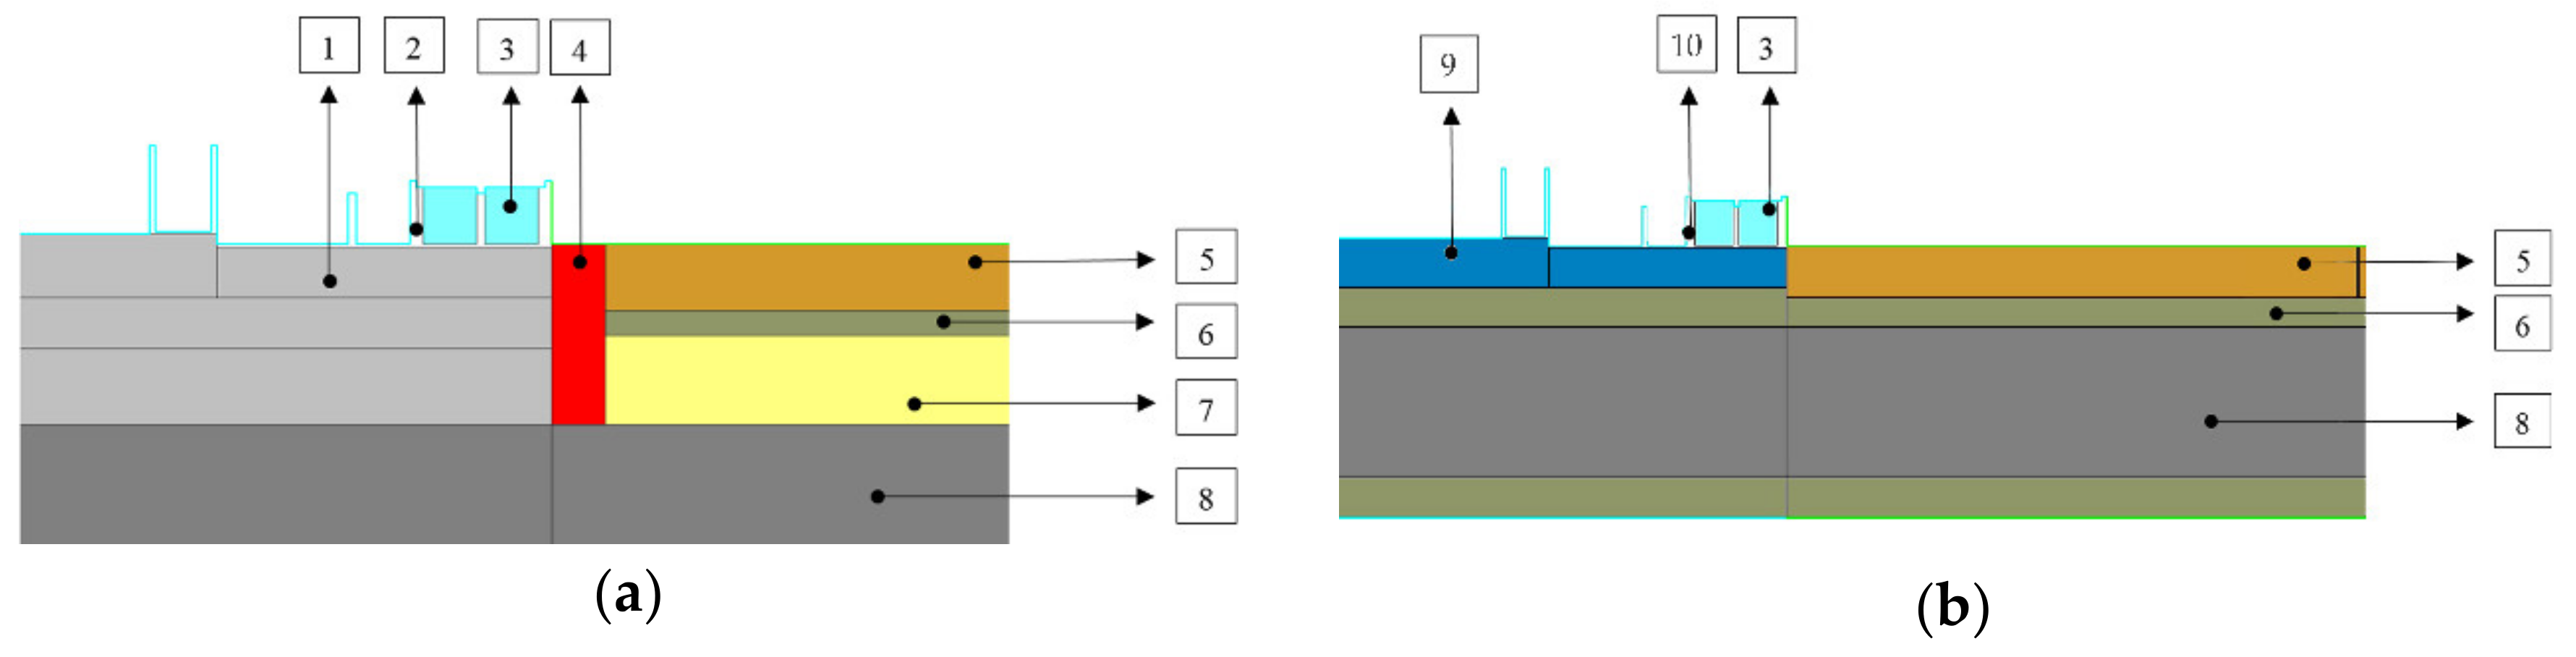
2.2. The Selected Multi-Unit Residential Building
2.3. The Selected Simulation Scenarios Analysis
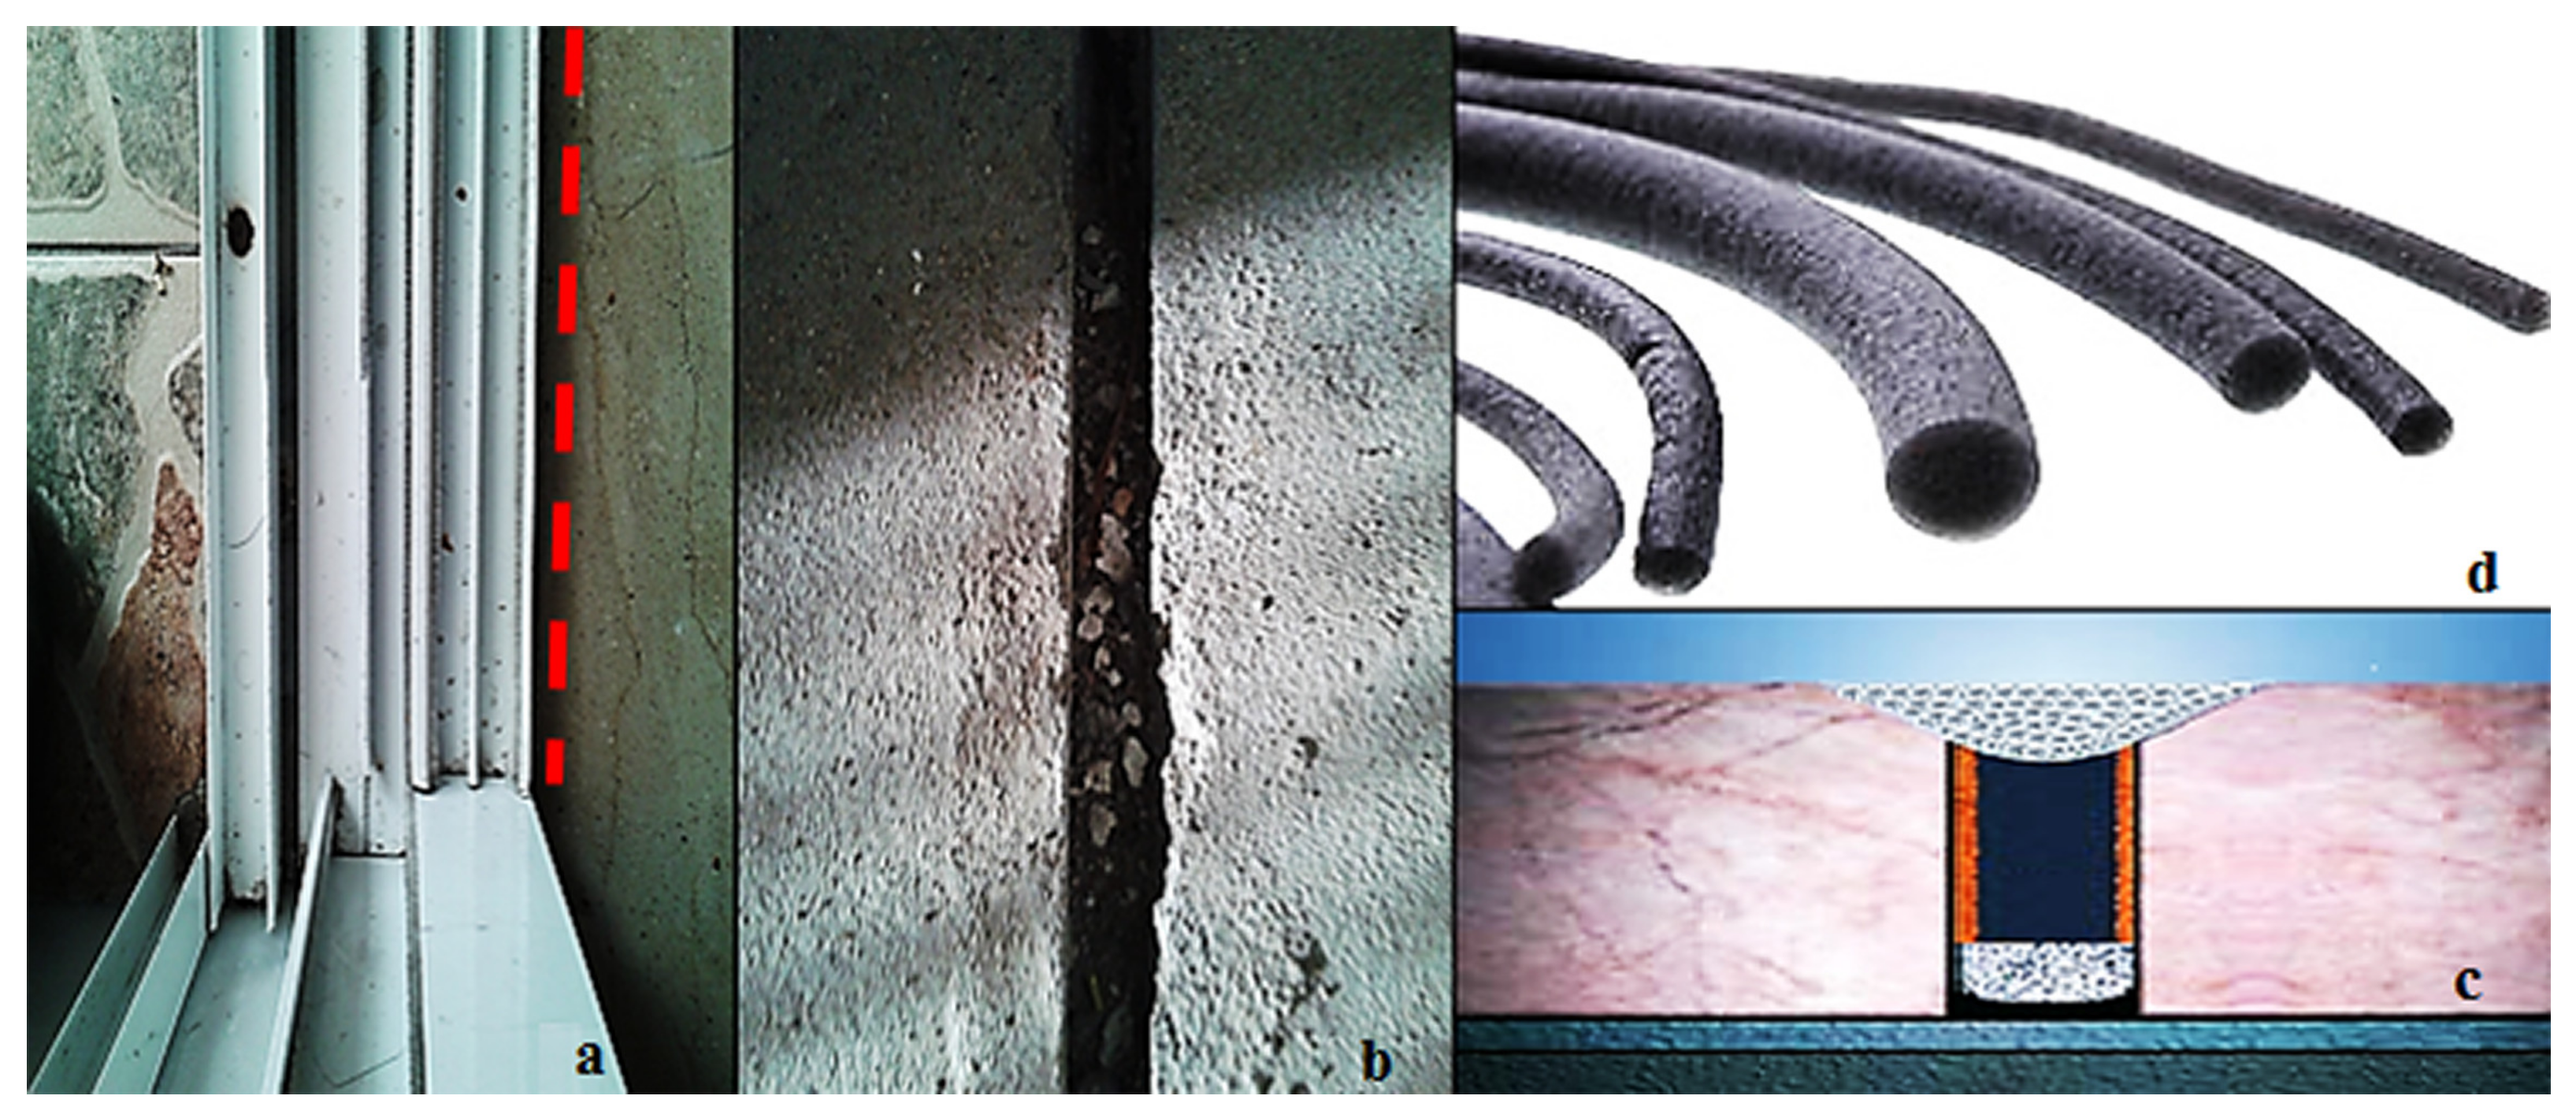
2.4. Reduction in Heat Transfer and Condensation Phenomenon
3. Results and Discussion
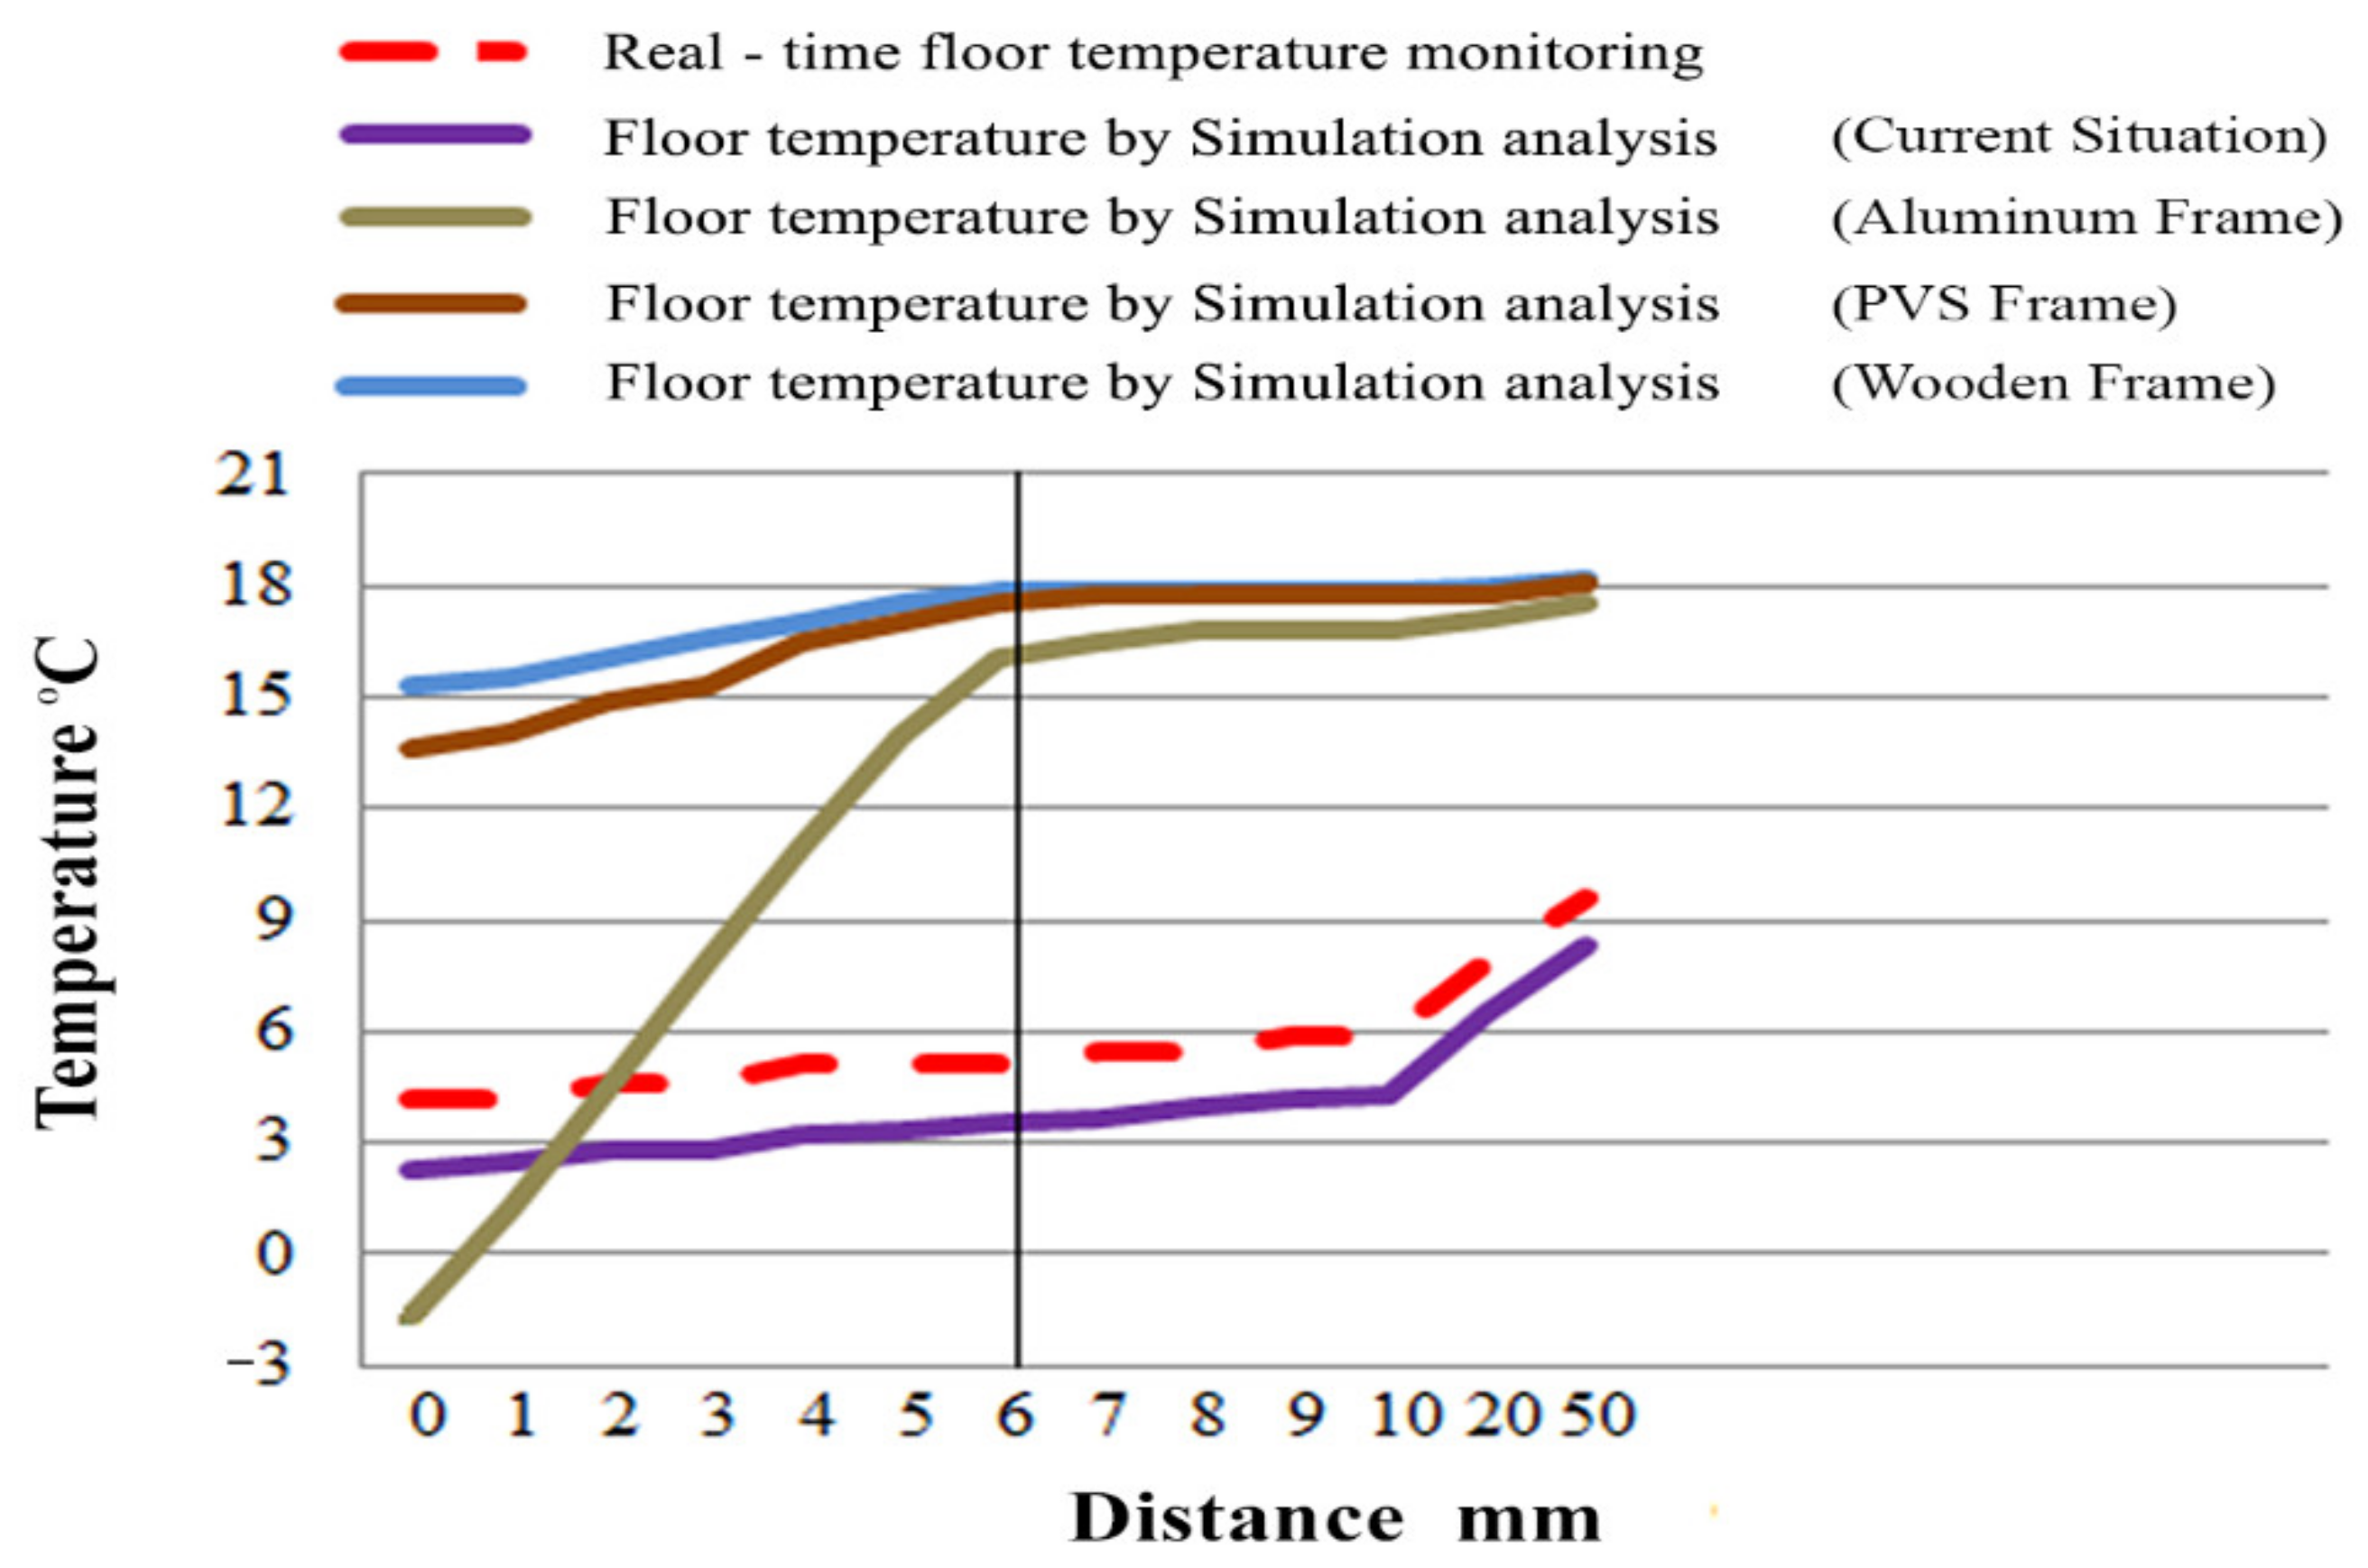
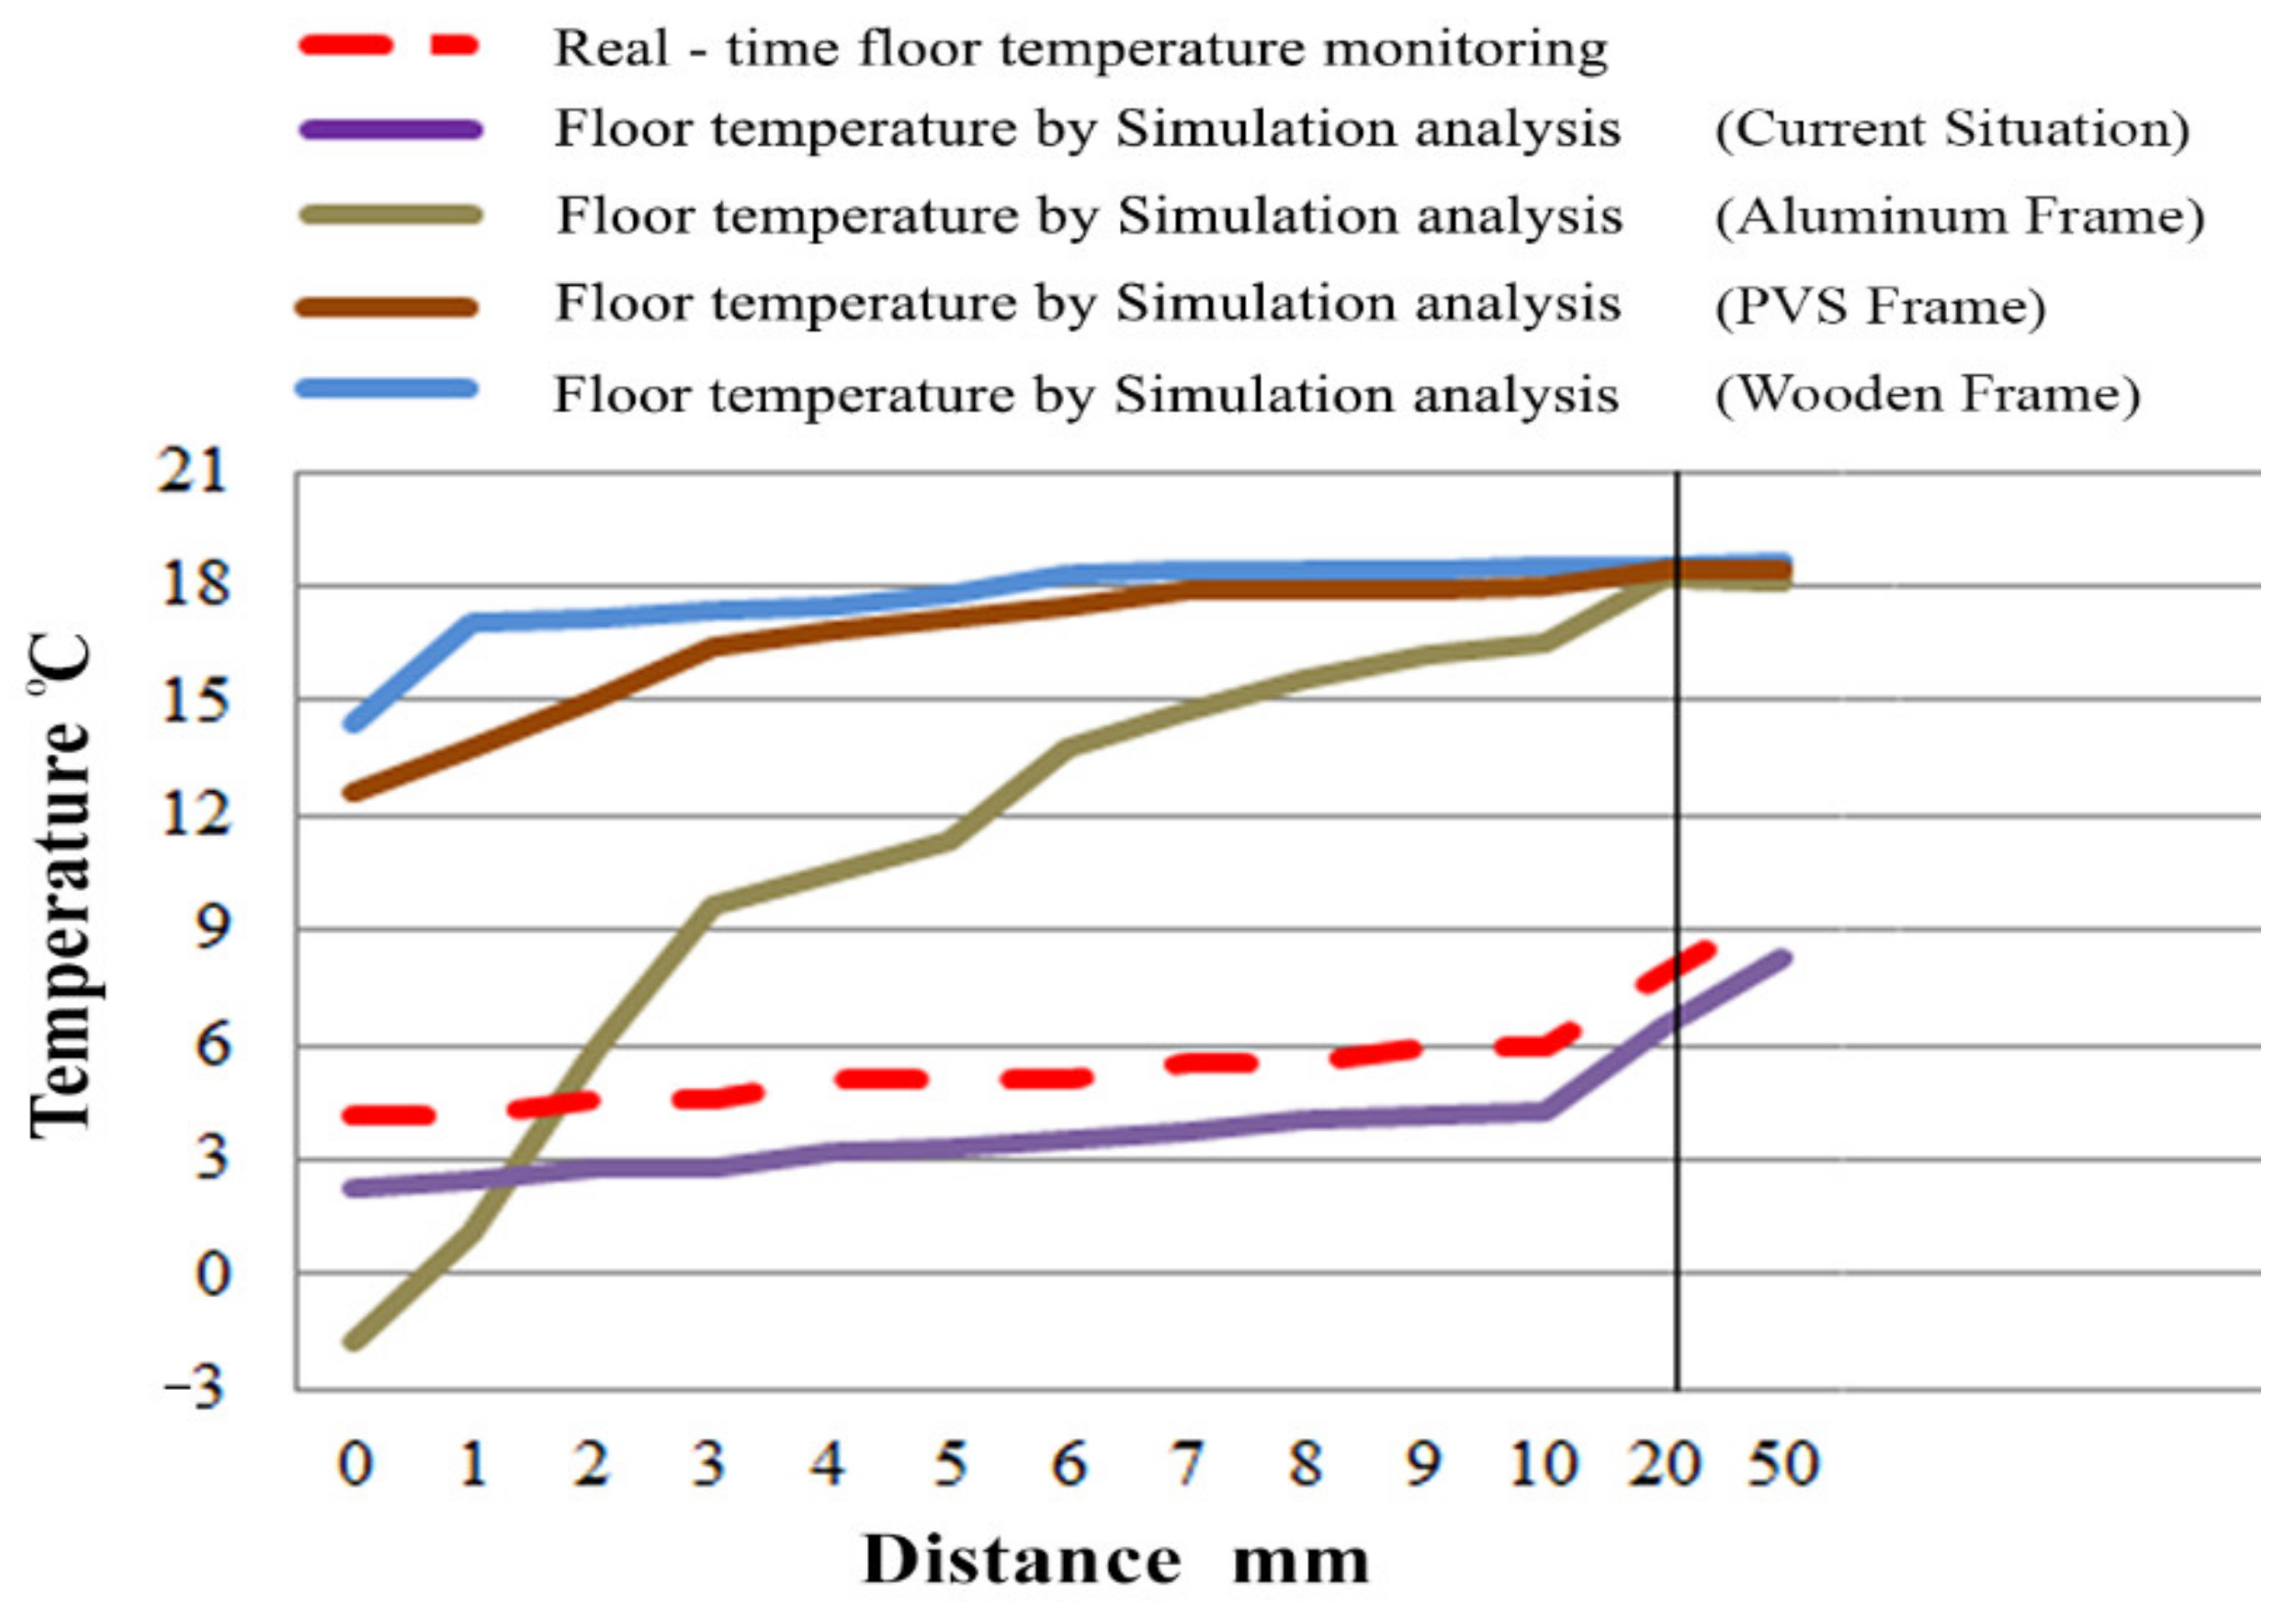
3.1. Validation of the System
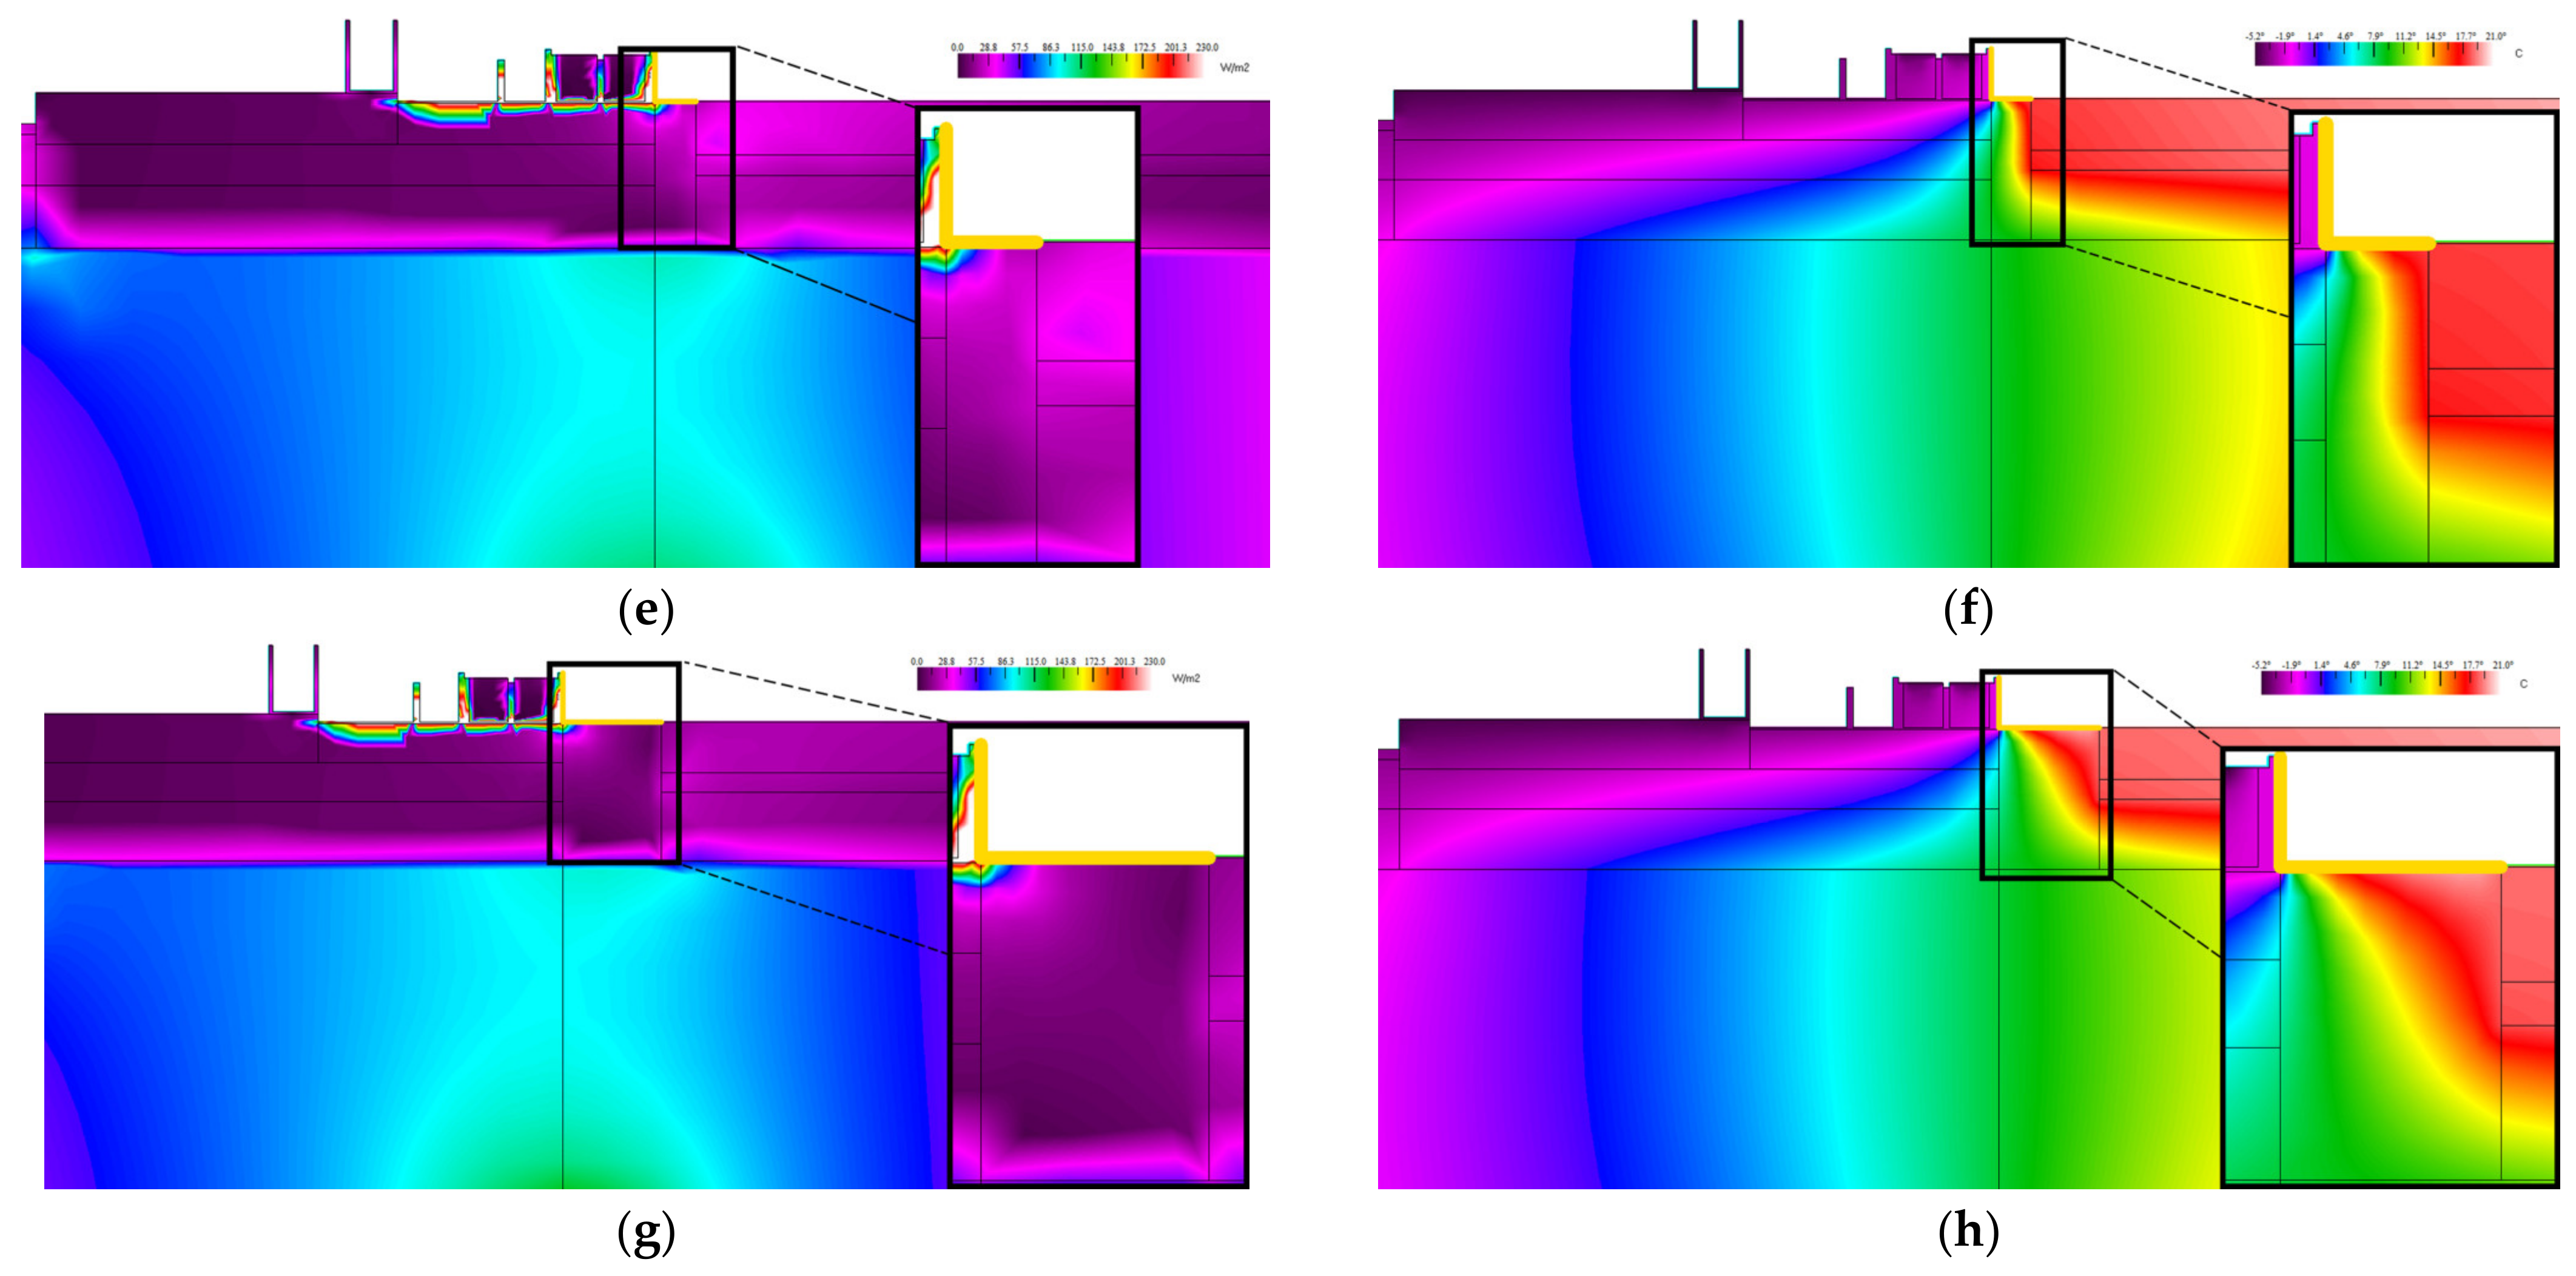
3.2. Simulated Scenarios and Window Frames
3.3. Effects of the Insulating Barrier at the Inner Space of the Room
4. Conclusions
Author Contributions
Funding
Data Availability Statement
Conflicts of Interest
References
- Balaras, C.A.; Gaglia, A.G.; Georgopoulou, E.; Mirasgedis, S.; Sarafidis, Y.; Lalas, D.P. European residential buildings and empirical assessment of the Hellenic building stock, energy consumption, emissions and potential energy savings. Build. Environ. 2007, 42, 1298–1314. [Google Scholar] [CrossRef]
- Directive 2012/27/EU of the European Parliament and of the Council of 25 October 2012 on Energy Efficiency, Amending Directives 2009/125/EC and 2010/30/EU and Repealing Directives 2004/8/EC and 2006/32/EC; European Union: Maastricht, The Netherlands, 2012.
- An Analysis Based on the ODYSSEE and MURE Databases Coordinated by ADEME, (Survey on Energy Efficiency Trends and Policies in the Household and Tertiary Sectors), Energy Europe Programme; Retrieved 11.08.2017. Available online: https://www.odysseemure.eu/publications/archives/energy-efficiency-trends-policies-buildings.pdf (accessed on 20 August 2017).
- GhaffarianHoseini, A.; Dahlan, N.D.; Berardi, U.; GhaffarianHoseini, A.; Makaremi, N.; GhaffarianHoseini, M. Sustainable energy performances of green buildings: A review of current theories, implementations and challenges. Renew. Sustain. Energy Rev. 2013, 25, 1–17. [Google Scholar] [CrossRef]
- Gustavsen, A.; Grynning, S.; Arasteh, D.; Jelle, B.P.; Goudey, H. Key elements of and material performance targets for highly insulating window frames. Energy Build. 2011, 43, 2583–2594. [Google Scholar] [CrossRef]
- Kosmopoulos, P.; Moumtzakis, A. Technical Approach for Window Fittings and Structural Elements for Energy Saving; Institute of Solar Technology–Aristotle University Thessaloniki: Thessaloniki, Greece, 2014; pp. 1–8. [Google Scholar]
- Theodosiou, T.; Papadopoulos, A. The impact of thermal bridges on the energy demand of buildings with double brick wall constructions. Energy Build. 2008, 40, 2083–2089. [Google Scholar] [CrossRef]
- Dumitrescu, L.; Baran, I.; Pescaru, R.A. The Influence of Thermal Bridges in the Process of Buildings Thermal Rehabilitation. Procedia Eng. 2017, 181, 682–689. [Google Scholar] [CrossRef]
- Levinskyte, A.; Banionis, K.; Geležiunas, V. The influence of thermal bridges for buildings energy consumption of “A“ energy efficiency class. Sustain. Archit. Civ. Eng. 2016, 2, 44–58. [Google Scholar] [CrossRef] [Green Version]
- Building Envelope Thermal Bridging Guide: Analysis, Application and Insights. A Technical Report. BC Hydro Power Smart: Vancouver, BC, Canada, 2014. retrieved on 25 June 2022. Available online: https://www.bchydro.com/content/dam/BCHydro/customer-portal/documents/power-smart/builders-developers/building-envelope-thermal-bridging-guide-1.1.pdf (accessed on 21 June 2020).
- Brzyski, P.; Grudzińska, M.; Majerek, D. Analysis of the Occurrence of Thermal Bridges in Several Variants of Connections of the Wall and the Ground Floor in Construction Technology with the Use of a Hemp–Lime Composite. Materials 2019, 12, 2392. [Google Scholar] [CrossRef] [Green Version]
- Fantucci, S.; Isaia, F.; Serra, V.; Dutto, M. Insulating coat to prevent mold growth in thermal bridges. Energy Procedia 2017, 134, 414–422. [Google Scholar] [CrossRef]
- Goulouti, K.; Castro, J.; Vassilopoulos, A.P.; Keller, T. Thermal performance evaluation of fiber-reinforced polymer thermal breaks for balcony connections. Energy Build. 2014, 70, 365–371. [Google Scholar] [CrossRef]
- Brás, A.; Gonçalves, F.; Faustino, P. Cork-based mortars for thermal bridges correction in a dwelling: Thermal performance and cost evaluation. Energy Build. 2014, 72, 296–308. [Google Scholar] [CrossRef]
- El Saied, A.; Maalouf, C.; Bejat, T.; Wurtz, E. Slab-on-grade thermal bridges: A thermal behavior and solution review. Energy Build. 2022, 257, 111770. [Google Scholar] [CrossRef]
- Ge, H.; Baba, F. Effect of dynamic modeling of thermal bridges on the energy performance of residential buildings with high thermal mass for cold climates. Sustain. Cities Soc. 2017, 34, 250–263. [Google Scholar] [CrossRef]
- Ge, H.; McClung, V.R.; Zhang, S. Impact of balcony thermal bridges on the overall thermal performance of multi-unit residential buildings: A case study. Energy Build. 2013, 60, 163–173. [Google Scholar] [CrossRef]
- Baba, F.; Ge, H. Dynamic effect of balcony thermal bridges on the energy performance of a high-rise residential building in Canada. Energy Build. 2016, 116, 78–88. [Google Scholar] [CrossRef]
- Murad, C.; Doshi, H.; Ramakrishnan, R. Impact of Insulated Concrete Curb on Concrete Balcony Slab. Procedia Eng. 2015, 118, 1030–1037. [Google Scholar] [CrossRef] [Green Version]
- Wróbel, A.; Kisilewicz, T. Thermographic detection of thermal bridges-aims, possibilities and conditions. In Proceedings of the 9th International Conference on Quantitative InfraRed Thermography, Krakow, Poland, 2–5 July 2008. [Google Scholar] [CrossRef]
- Lawrence Berkeley National Laboratory Home Page. Available online: http://windows.lbl.gov (accessed on 5 July 2017).
- ISO 10211; Thermal Bridges in Building Construction. Heat Flows and Surface Temperatures. Detailed Calculations. European Committee for Standardization: Geneva, Switzerland, 2017.
- ISO 14683; Thermal bridges in building Construction. Linear Thermal Transmittance. Simplified Methods and Default Values. European Committee for Standardization: Geneva, Switzerland, 2017.
- Theodoridou, I.; Papadopoulos, A.M.; Hegger, M. A typological classification of the Greek residential building stock. Energy Build. 2011, 43, 2779–2787. [Google Scholar] [CrossRef]
- Hellenic Statistical Authority, (Survey on Energy Consumption in Households-SECH), Greece; retrieved 15.07.2017. Available online: https://www.statistics.gr/el/statistics/-/publication/SFA40/- (accessed on 21 July 2021).
- Theodoridou, I.; Papadopoulos, A.; Hegger, M. Statistical analysis of the Greek residential building stock. Energy Build. 2011, 43, 2422–2428. [Google Scholar] [CrossRef]
- Greek National Law N.3661/2008 (FEK 89/A 19.5.2008) on ‘‘Measures for the Reduction of Energy Consumption in Buildings and Other Provisions’’; Government Gazette: Athens, Greece, 2008.
- Dascalaki, E.G.; Balaras, C.A.; Gaglia, A.G.; Droutsa, K.G.; Kontoyiannidis, S. Energy Performance of Buildings—EPBD in Greece. Energy Policy 2012, 45, 469–477. [Google Scholar] [CrossRef]
- Technical Chamber of Greece. T.O.T.E.E. 20701-2 Technical Guidelines for the implementation of the Building Energy Performance regulation; Technical Chamber of Greece: Athens, Greece, 2010. [Google Scholar]
- Baldinelli, G.; Bianchi, F. Windows thermal resistance: Infrared thermography aided comparative analysis among finite volumes simulations and experimental methods. Appl. Energy 2014, 136, 250–258. [Google Scholar] [CrossRef]
- Alev, Ü.; Kalamees, T. Avoiding mould growth in an interiorly insulated log wall. Build. Environ. 2016, 105, 104–115. [Google Scholar] [CrossRef]
- Vereecken, E.; Roels, S. Review of mould prediction models and their influence on mould risk evaluation. Build. Environ. 2012, 51, 296–310. [Google Scholar] [CrossRef] [Green Version]


| Thermal Characteristics of the Model | |||||
|---|---|---|---|---|---|
| Layer | Material | Thickness [mm] | Λ [W/mK] | ρ [kg/m3] | cp [J/kg K] |
| 1 | Lightweight concrete | 70 | 0.065 | 300 | - |
| 2 | Wood | 5 | 0.14 | 600 | 1600 |
| 3 | Atmospheric air | 20 | 0.024 | 1.3 | 1005 |
| 4 | Barrier | 6 × 70, 20 × 70, 50 × 70 | 0.045 | 40 | 1400 |
| 5 | Granite | 25 | 2.8 | 2700 | 1000 |
| 6 | Cement mortar | 10 | 1.4 | 2000 | 1100 |
| 7 | Lightweight concrete | 35 | 0.11 | 450 | - |
| 8 | Reinforced concrete | 200 | 2.5 | 2400 | 1000 |
| 9 | Marble | 25 | 3.5 | 2800 | 1000 |
| 10 | Aluminum | 5 | 160 | 2800 | 880 |
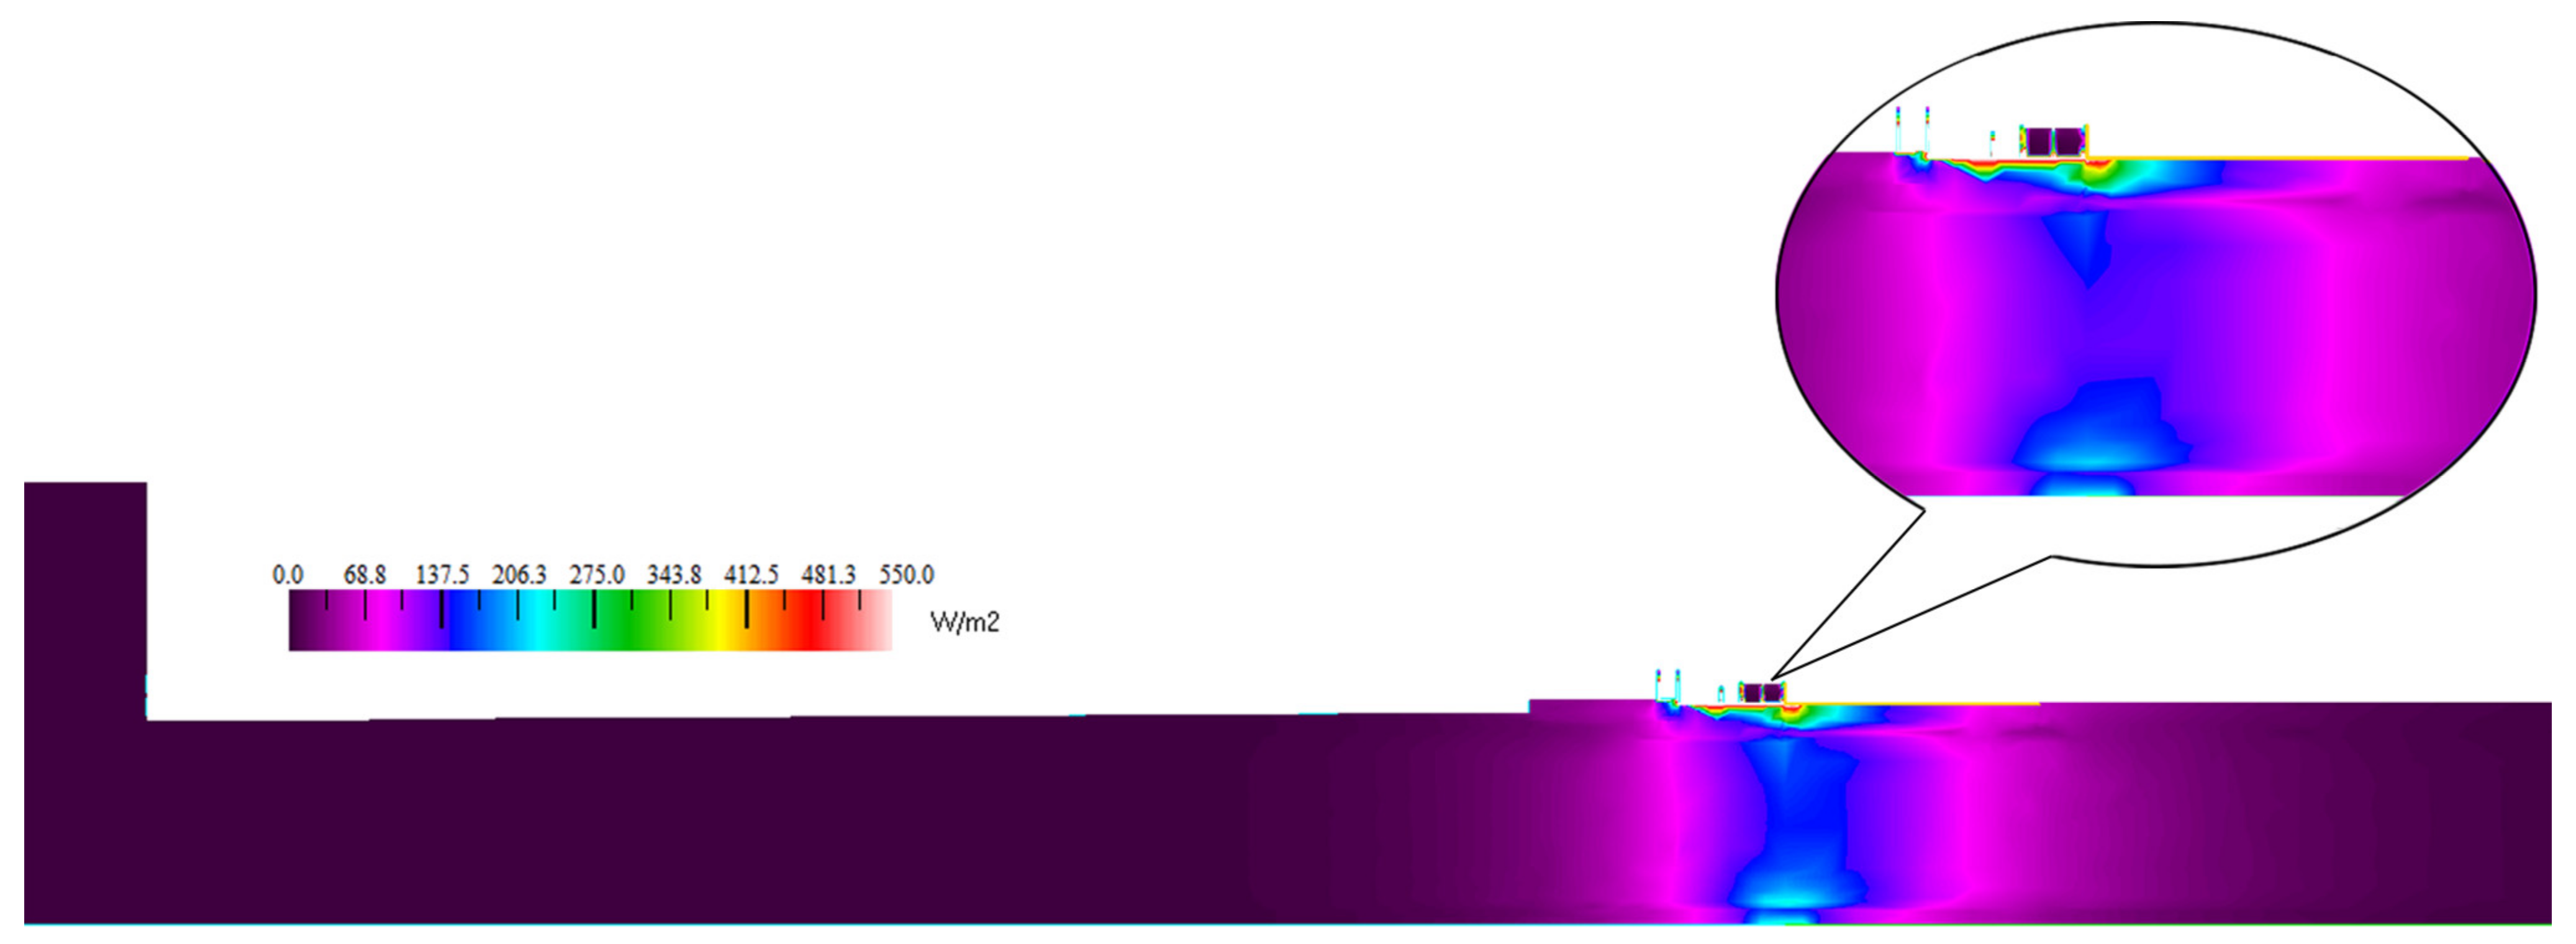
| Scenario | Scenario | Frame Types | Insulated Barrier [mm] | Length until 20 °C [mm] | Condensation | W/m2 | °C Start Point [0, mm] |
|---|---|---|---|---|---|---|---|
| 1 | Measurements | Aluminum | - | 1700 | Yes | 1250 | 4.1 |
| 2 | Simulation | Aluminum | - | 1100 | Yes | 1168 | 2.3 |
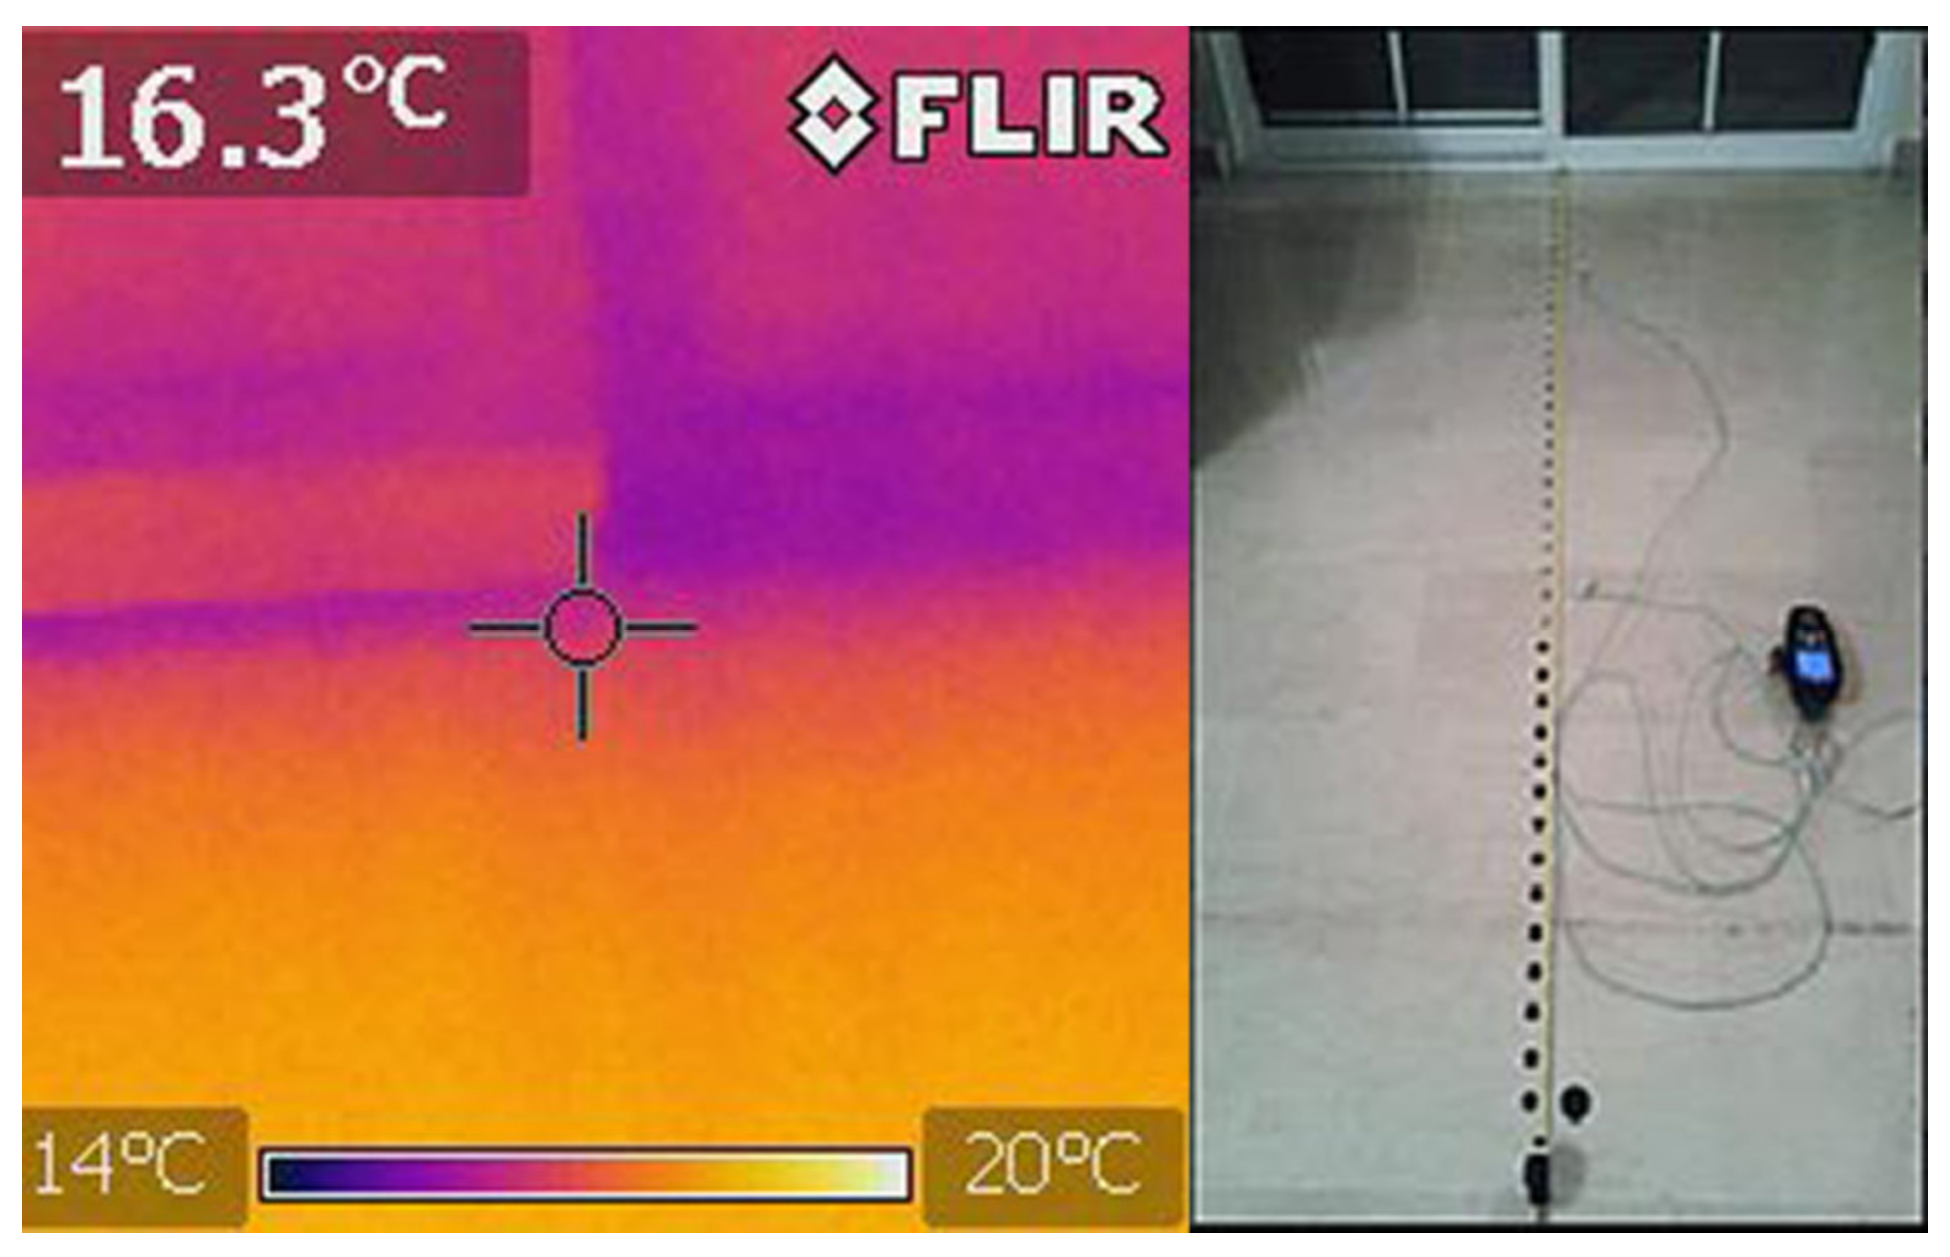
| 2.1 | Thermal cam. | Aluminum | - | 1780 | Yes | - | 3.9 |
| 3 | Simulation | Aluminum | 6 | 360 | Yes | 770 | −1.6 |
| 3.1 | Simulation | Aluminum | 20 | 340 | Yes | 659 | −1.8 |
| 3.2 | Simulation | Aluminum | 50 | 254 | Yes | 620 | −1.9 |
| 4 | Simulation | PVC | 6 | 326 | No | 73 | 13.6 |
| 4.1 | Simulation | PVC | 20 | 320 | No | 62 | 12.6 |
| 4.2 | Simulation | PVC | 50 | 235 | No | 49 | 12.4 |
| 5 | Simulation | Wood | 6 | 324 | No | 62 | 15.1 |
| 5.1 | Simulation | Wood | 20 | 315 | No | 57 | 14.5 |
| 5.2 | Simulation | Wood | 50 | 231 | No | 42 | 15.1 |
| 5.3 | Thermal cam. | Wood | 50 | 300 | No | - | 14.9 |
Publisher’s Note: MDPI stays neutral with regard to jurisdictional claims in published maps and institutional affiliations. |
© 2022 by the authors. Licensee MDPI, Basel, Switzerland. This article is an open access article distributed under the terms and conditions of the Creative Commons Attribution (CC BY) license (https://creativecommons.org/licenses/by/4.0/).
Share and Cite
Moumtzakis, A.; Zoras, S.; Evagelopoulos, V.; Dimoudi, A. Experimental Investigation of Thermal Bridges and Heat Transfer through Window Frame Elements at Achieving Energy Saving. Energies 2022, 15, 5055. https://doi.org/10.3390/en15145055
Moumtzakis A, Zoras S, Evagelopoulos V, Dimoudi A. Experimental Investigation of Thermal Bridges and Heat Transfer through Window Frame Elements at Achieving Energy Saving. Energies. 2022; 15(14):5055. https://doi.org/10.3390/en15145055
Chicago/Turabian StyleMoumtzakis, Anastasios, Stamatis Zoras, Vasilis Evagelopoulos, and Argyro Dimoudi. 2022. "Experimental Investigation of Thermal Bridges and Heat Transfer through Window Frame Elements at Achieving Energy Saving" Energies 15, no. 14: 5055. https://doi.org/10.3390/en15145055