
The Effect of Ash Silanization on the Selected Properties of Rigid Polyurethane Foam/Coal Fly Ash Composites

 ,
,  , ,
, ,  and
and
Abstract
:1. Introduction
2. Materials and Methods
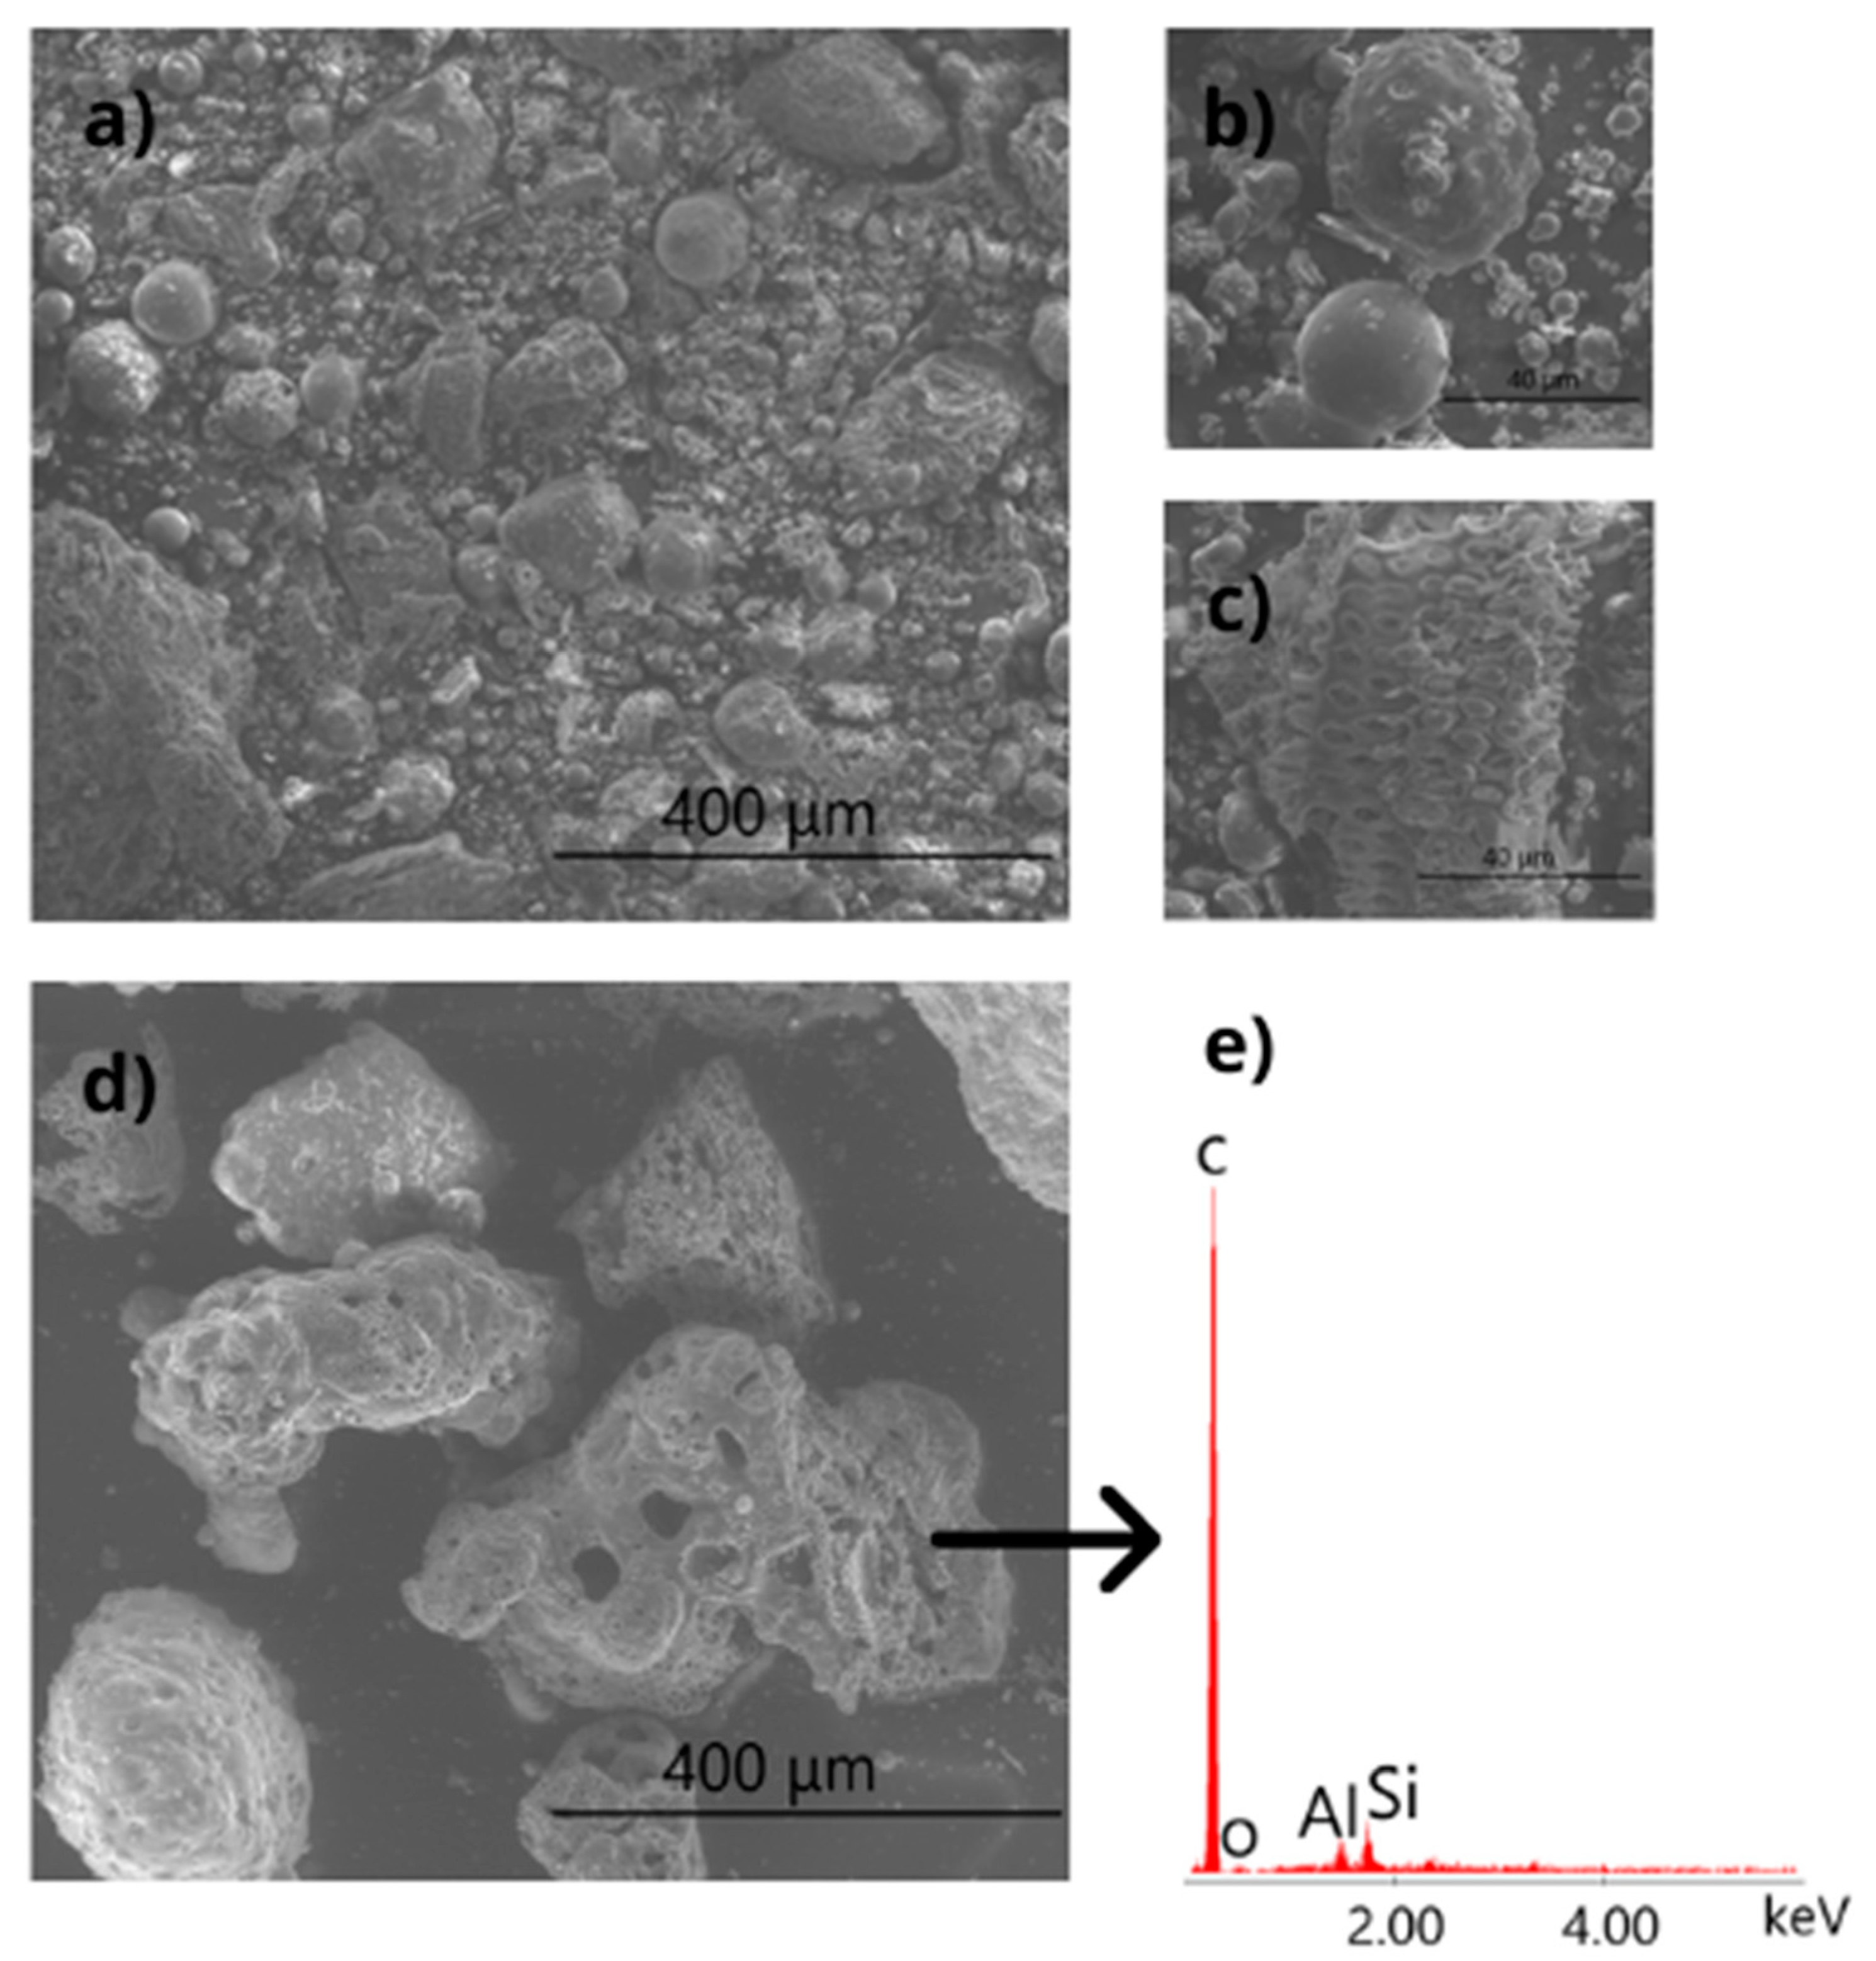
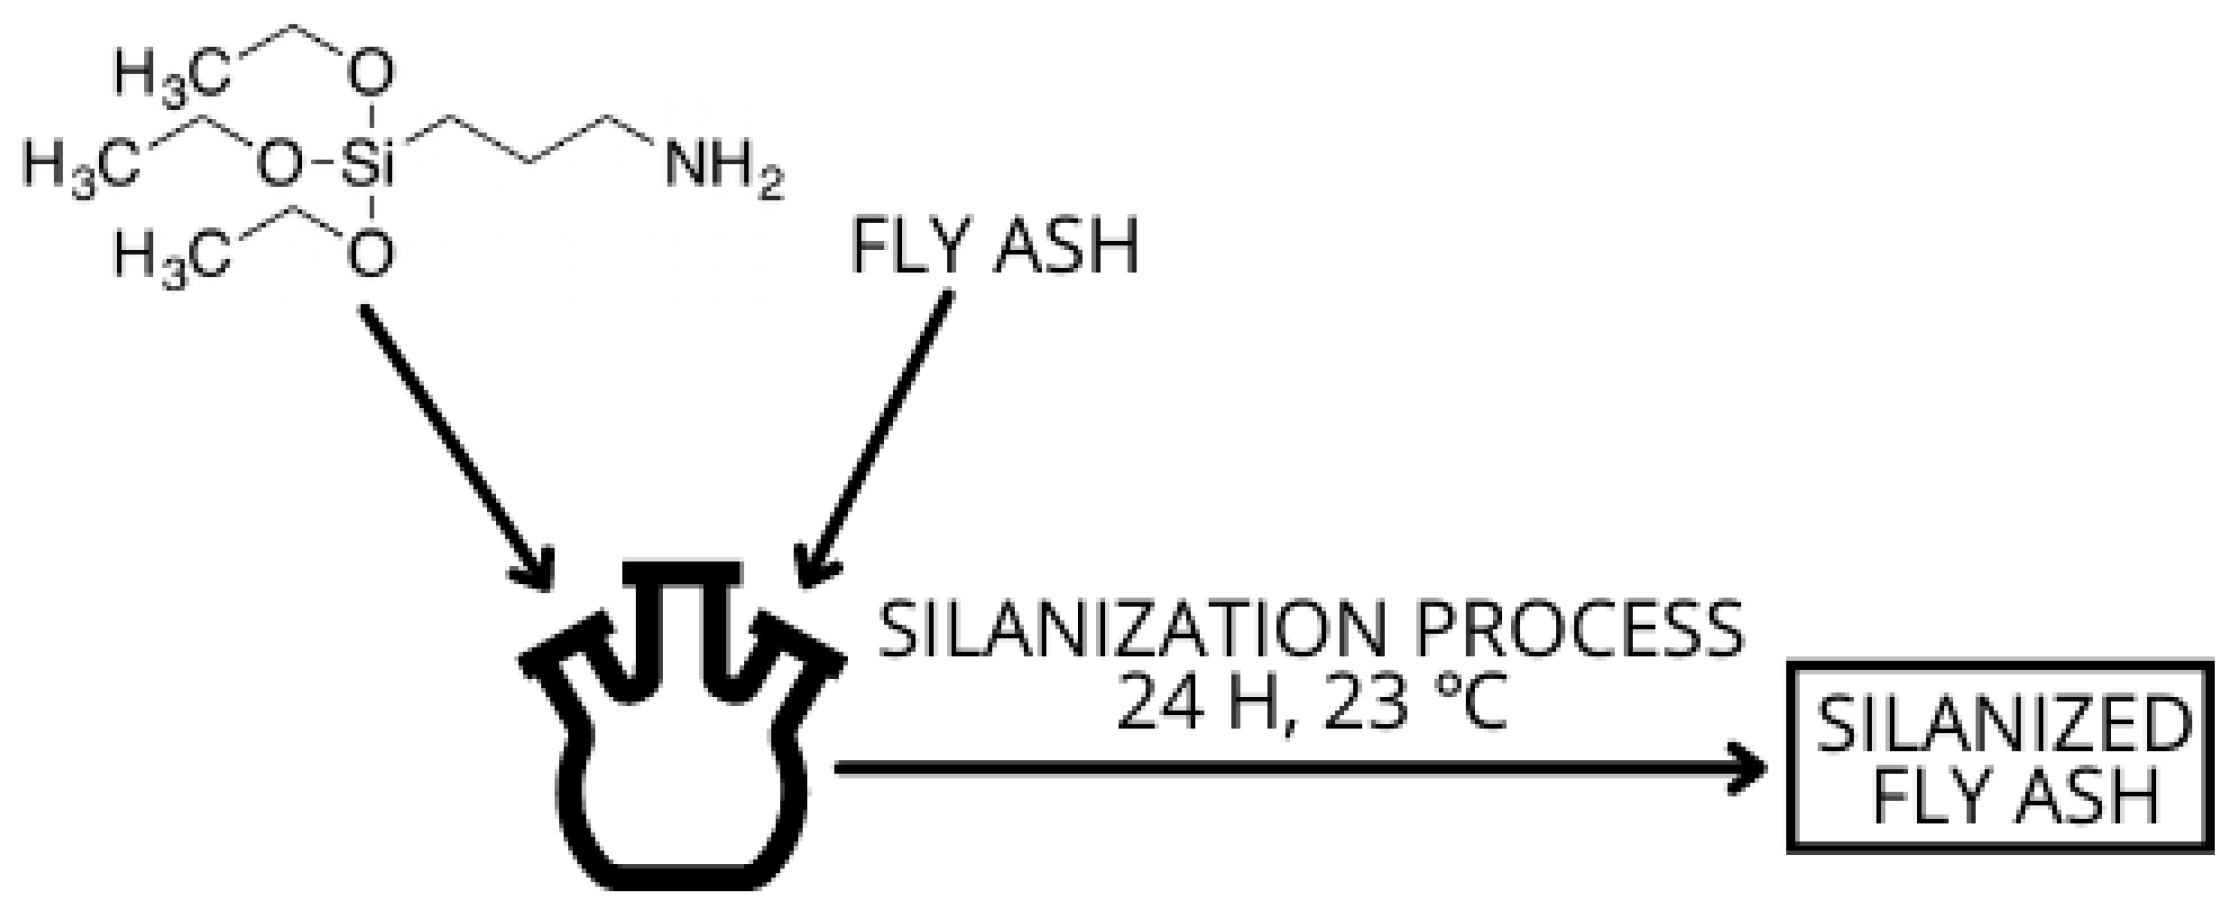
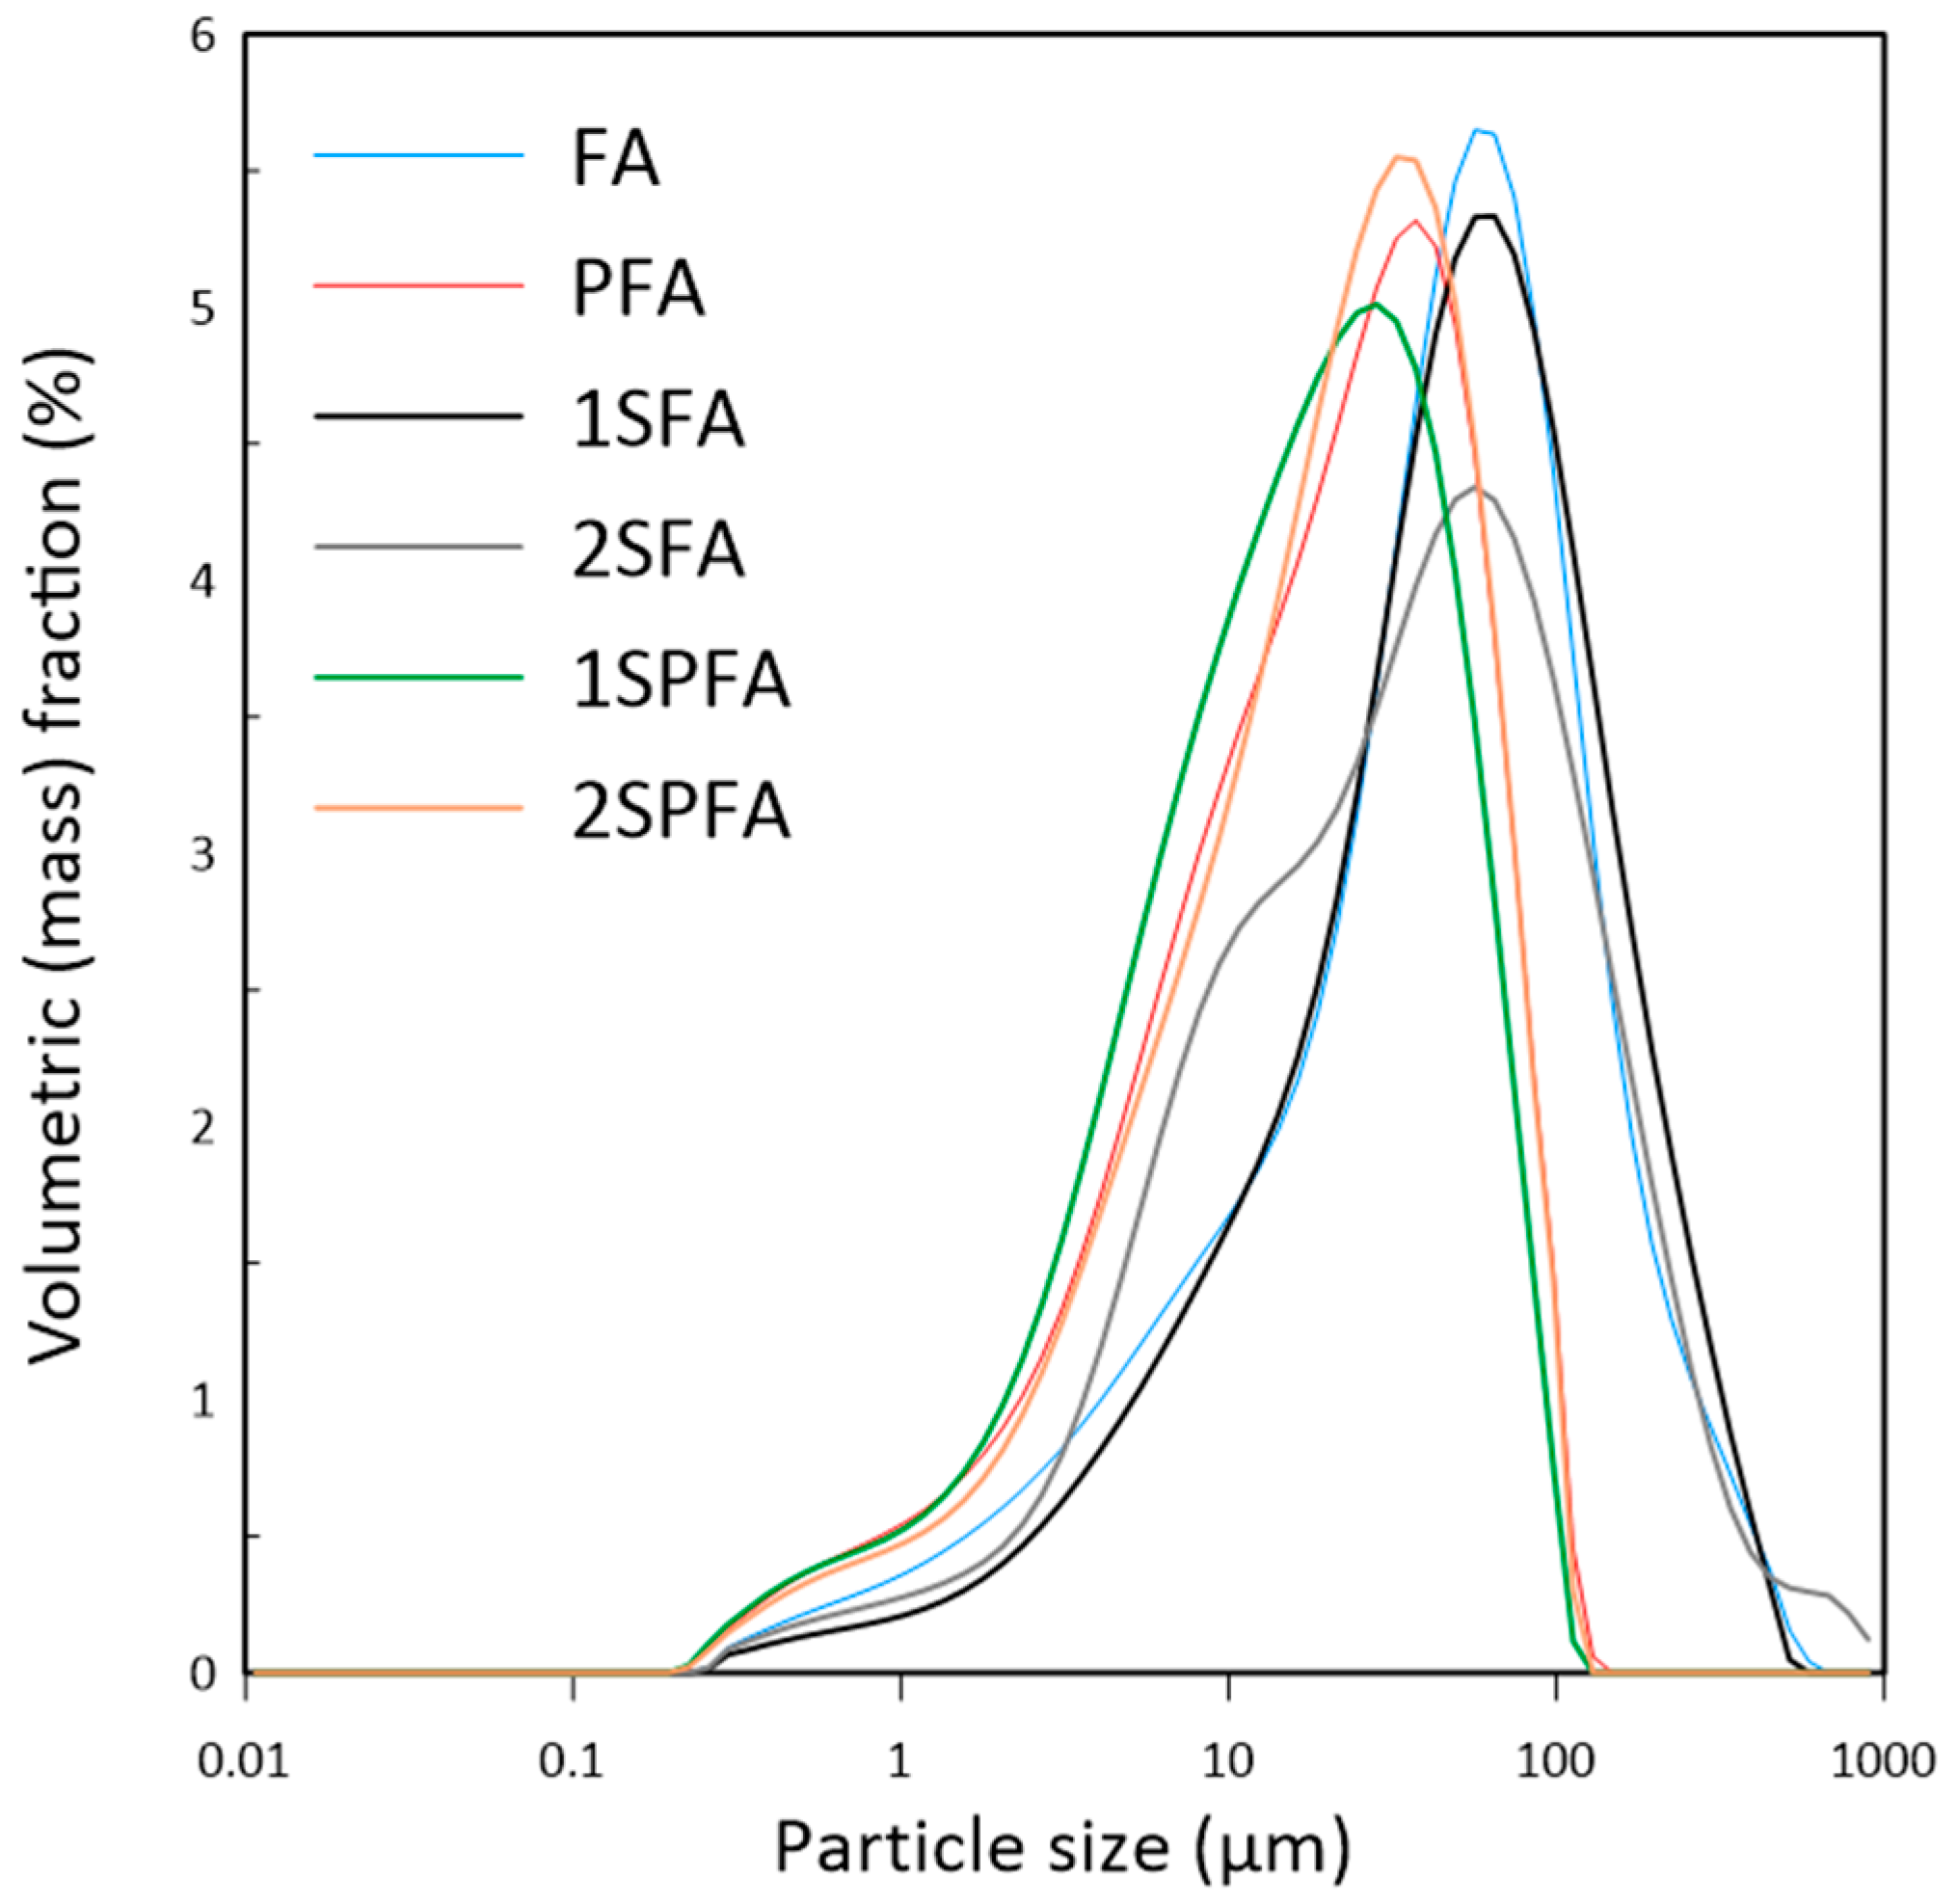
2.1. Characterization of Filler and Its Modification
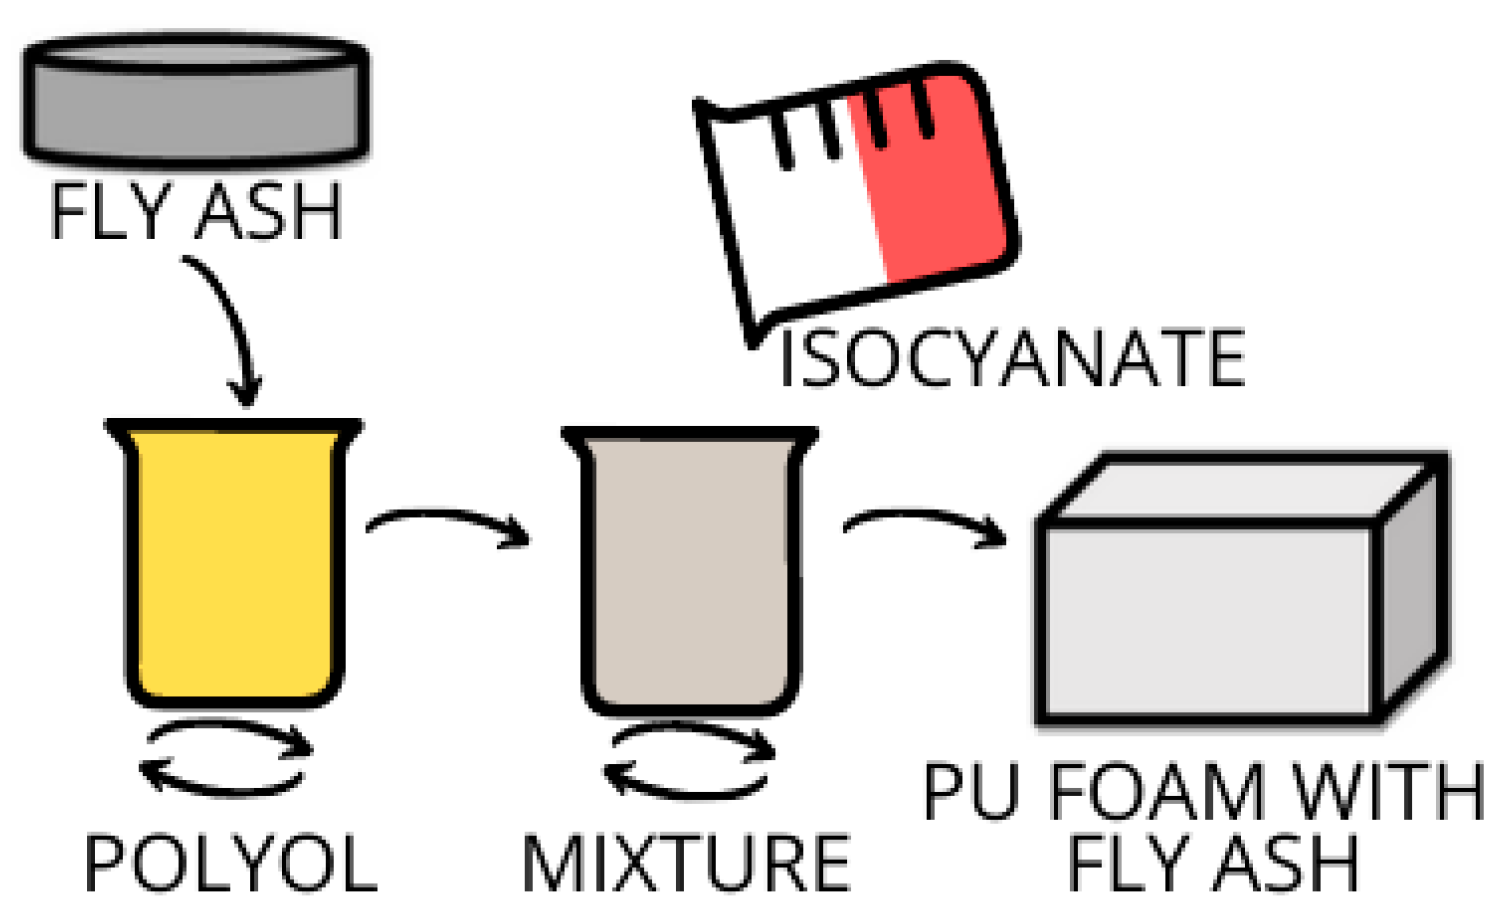
2.2. Preparation of Modified Polyurethane Foams
2.3. Methods
3. Results and Discussion
3.1. Foaming Characteristics of Polyurethane Composites
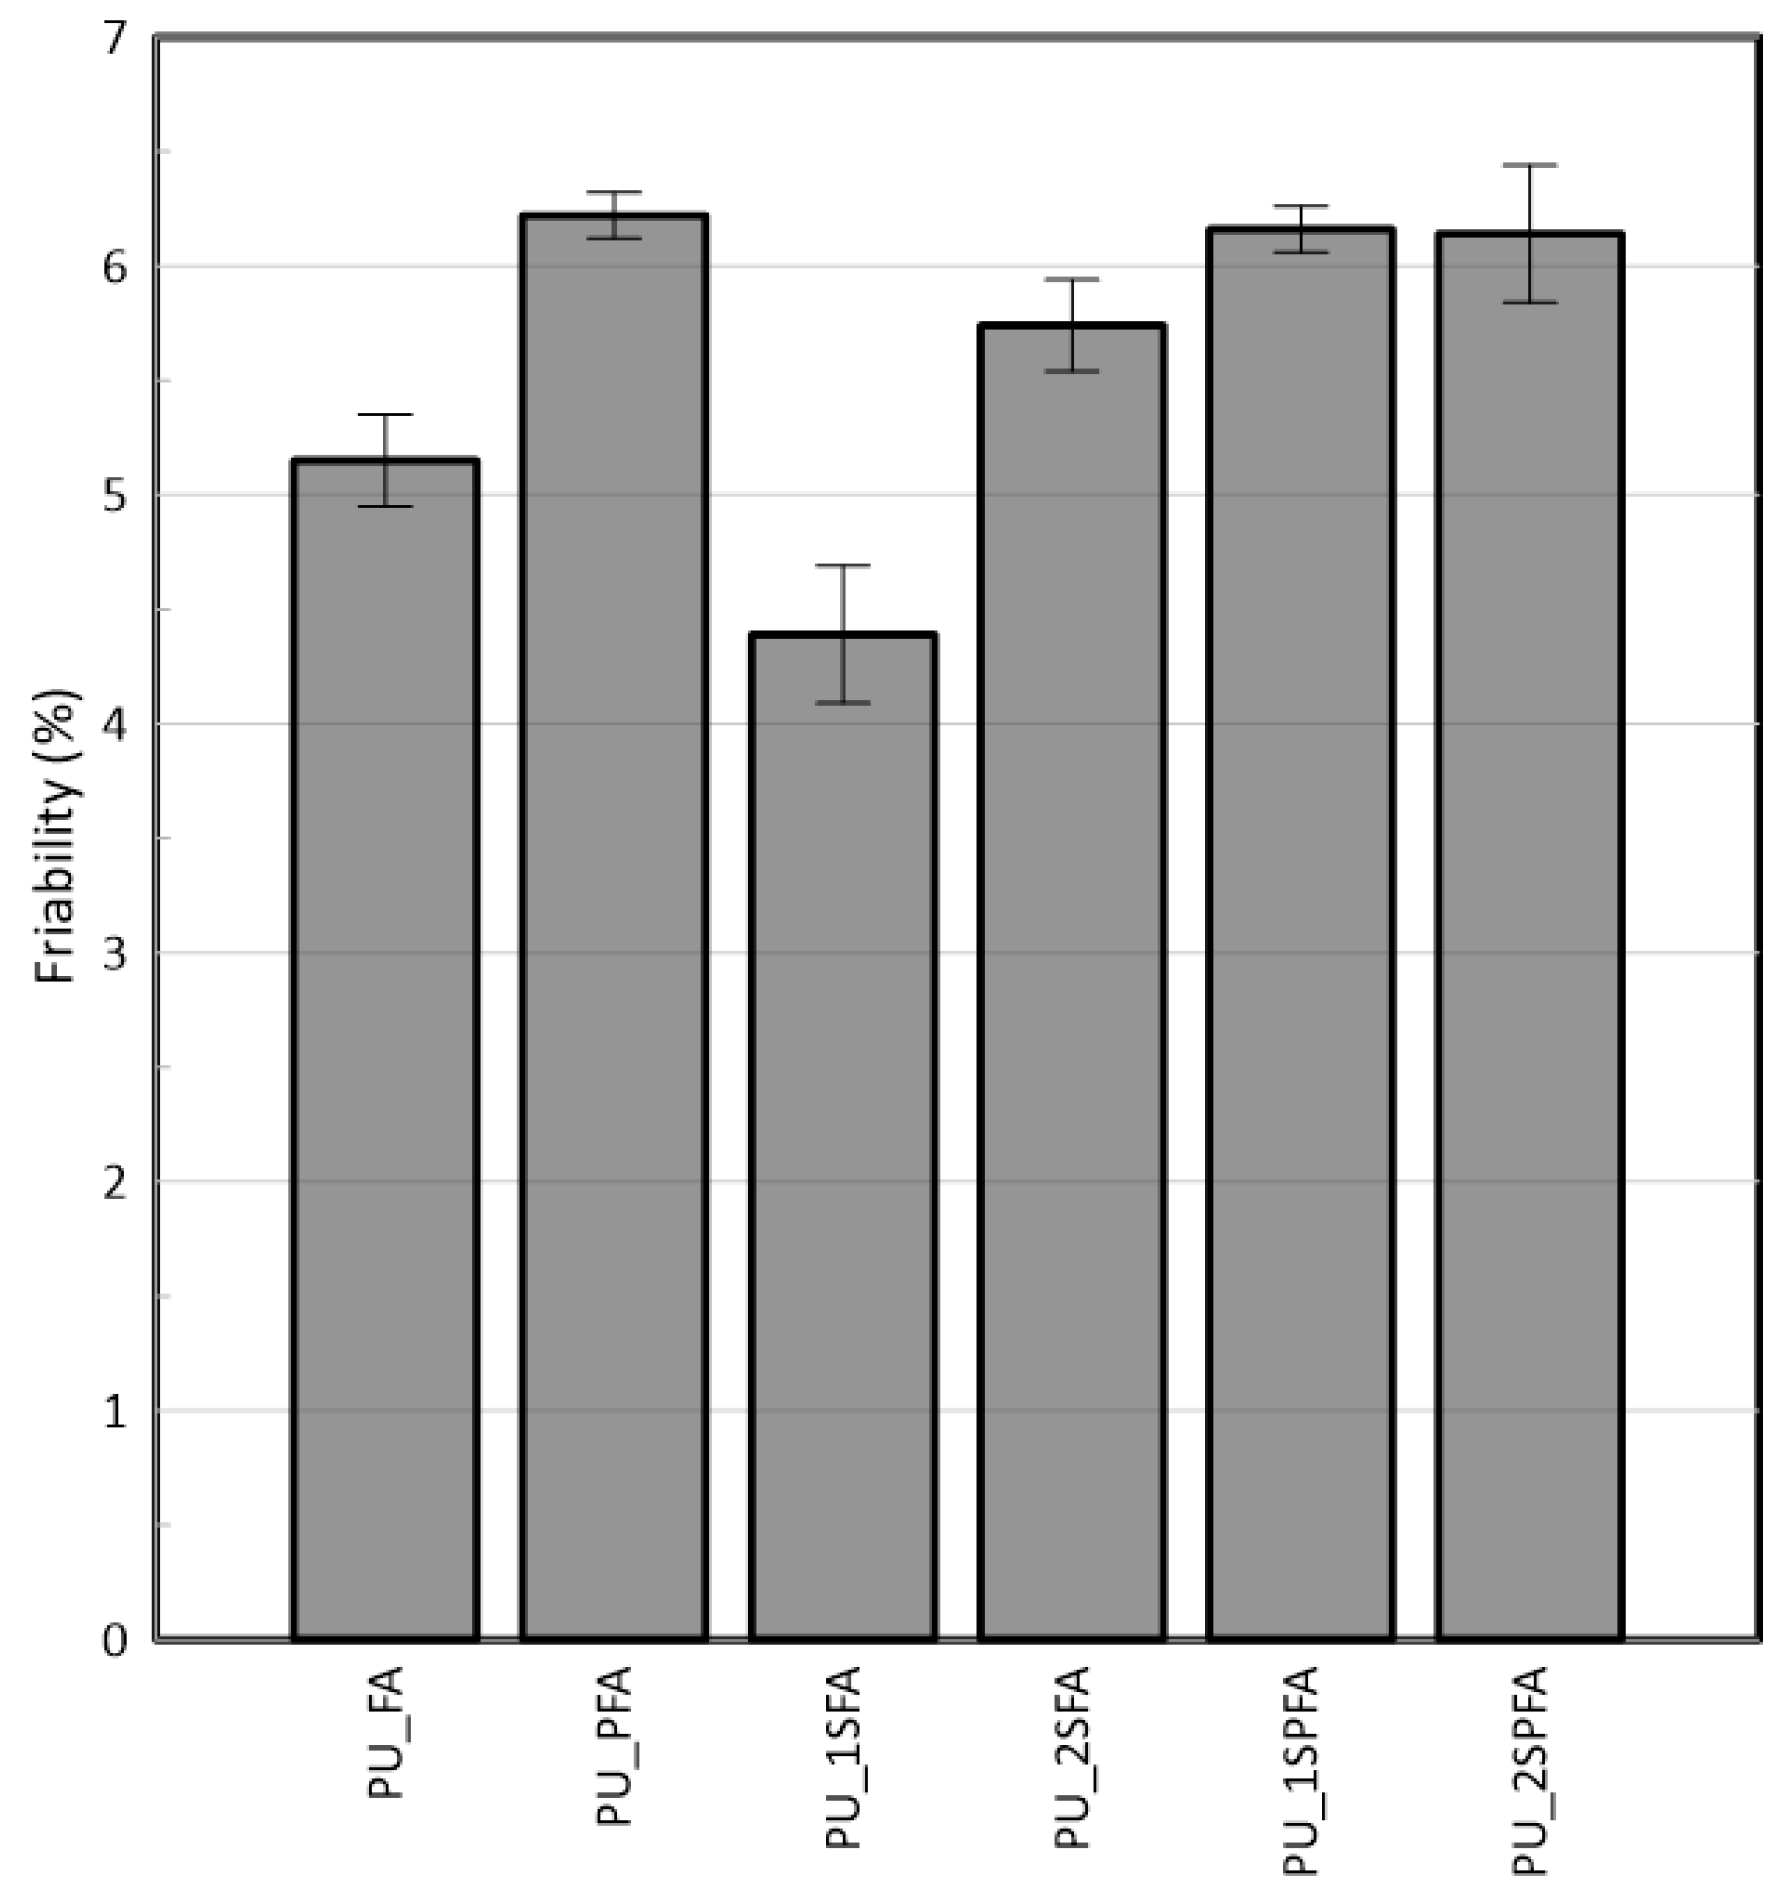
3.2. Properties of Polyurethane Composites
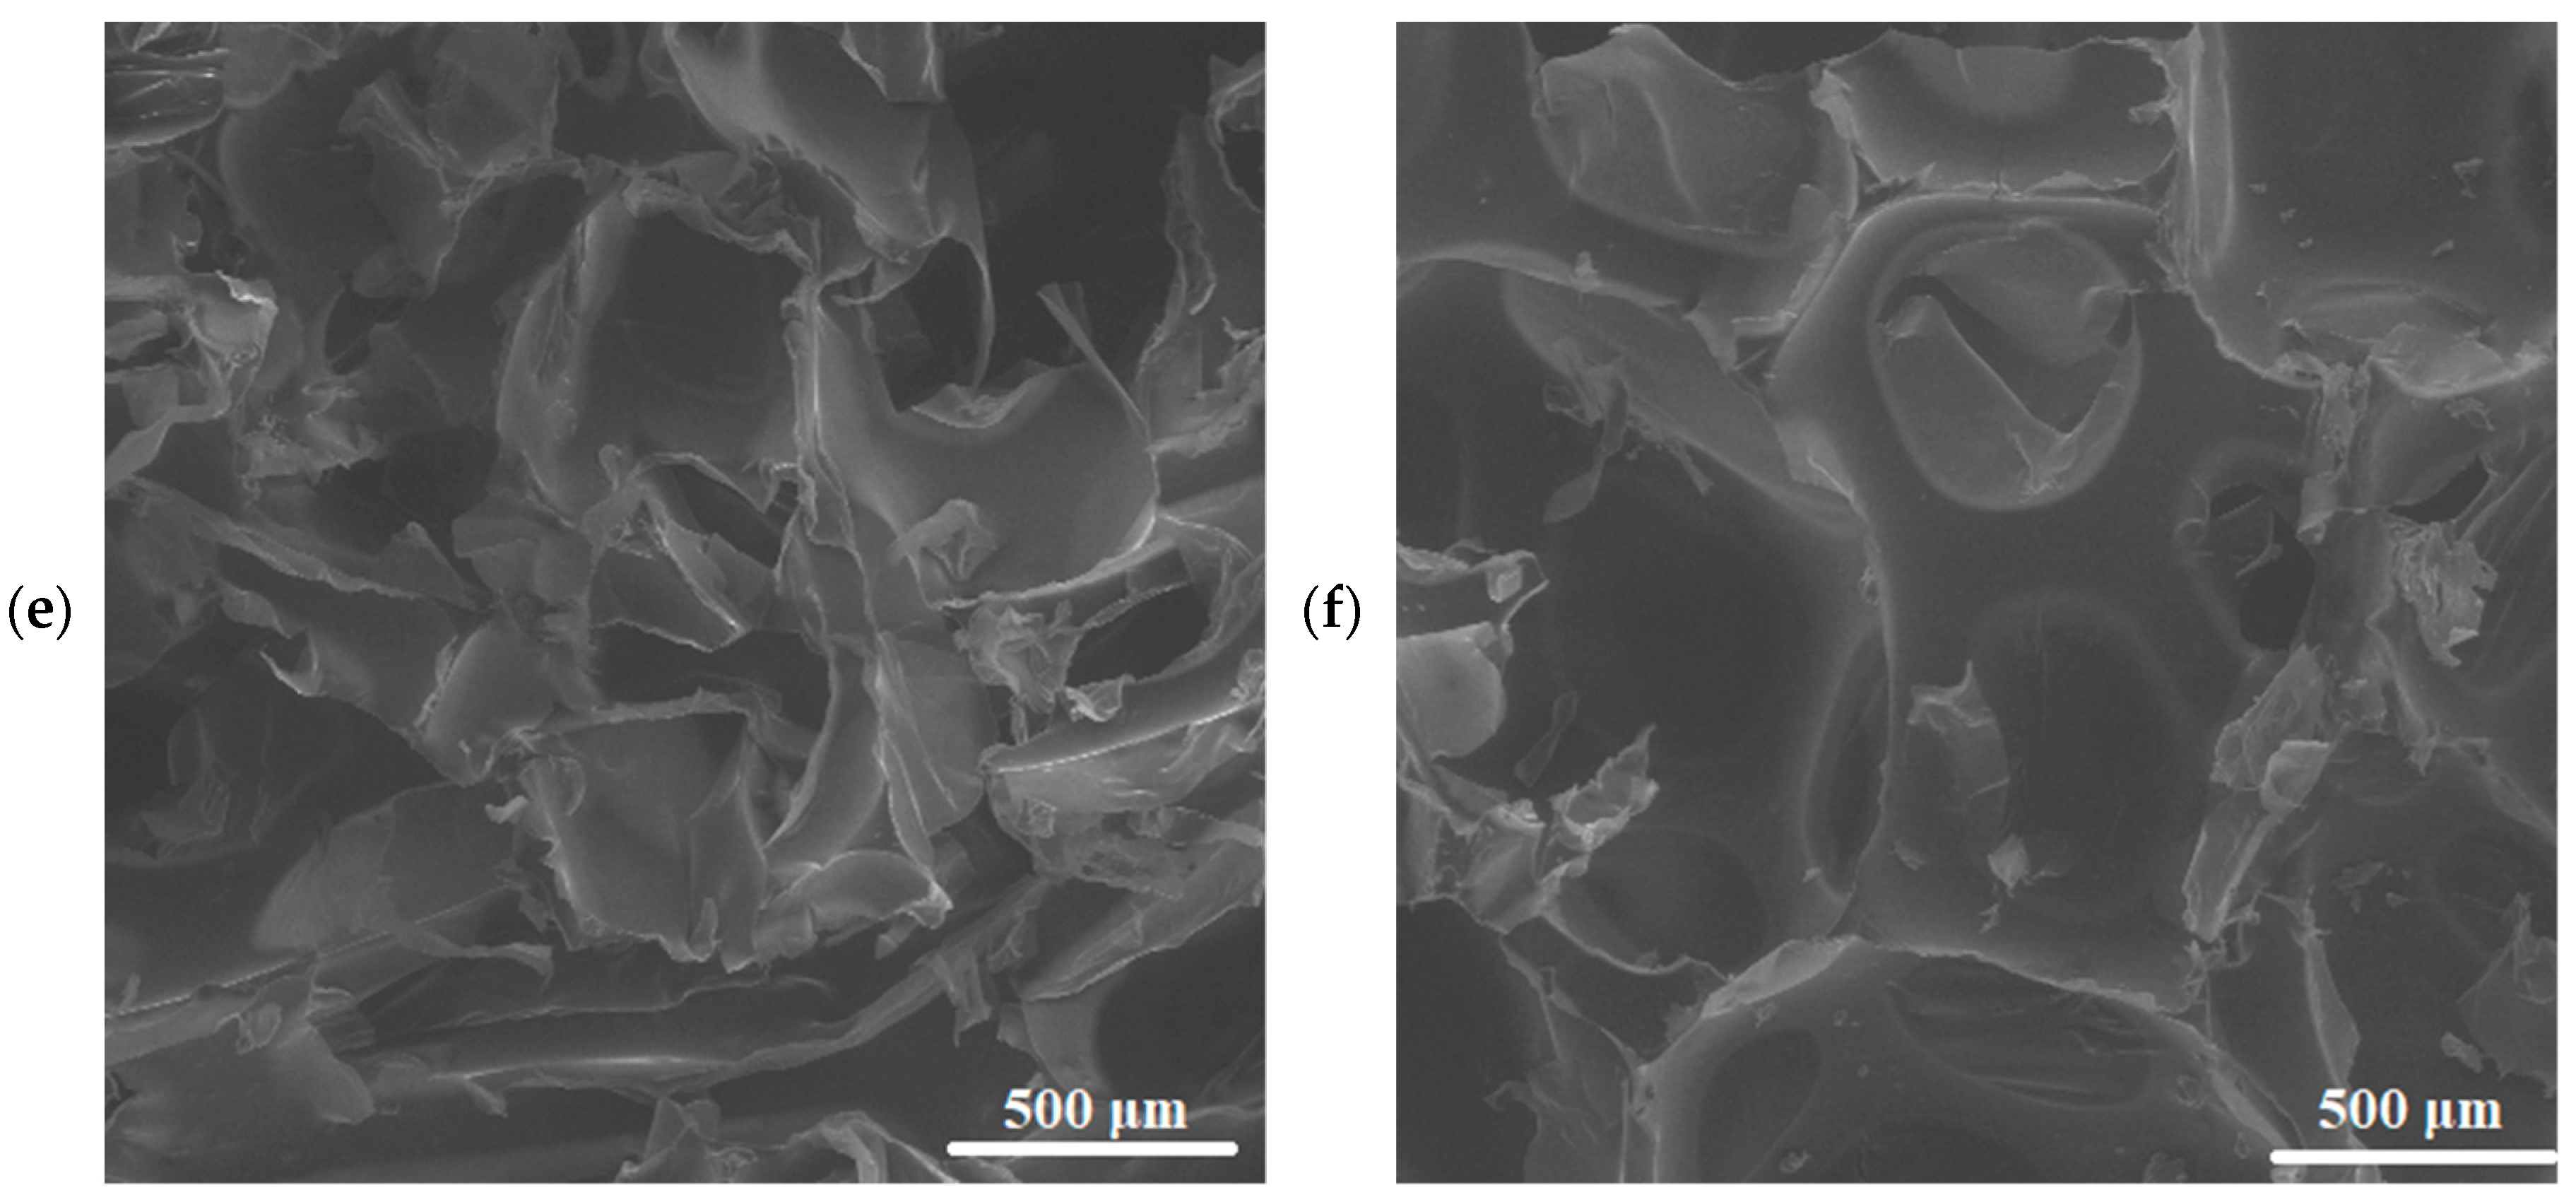
3.3. Microstructure Analysis of Polyurethane Composites
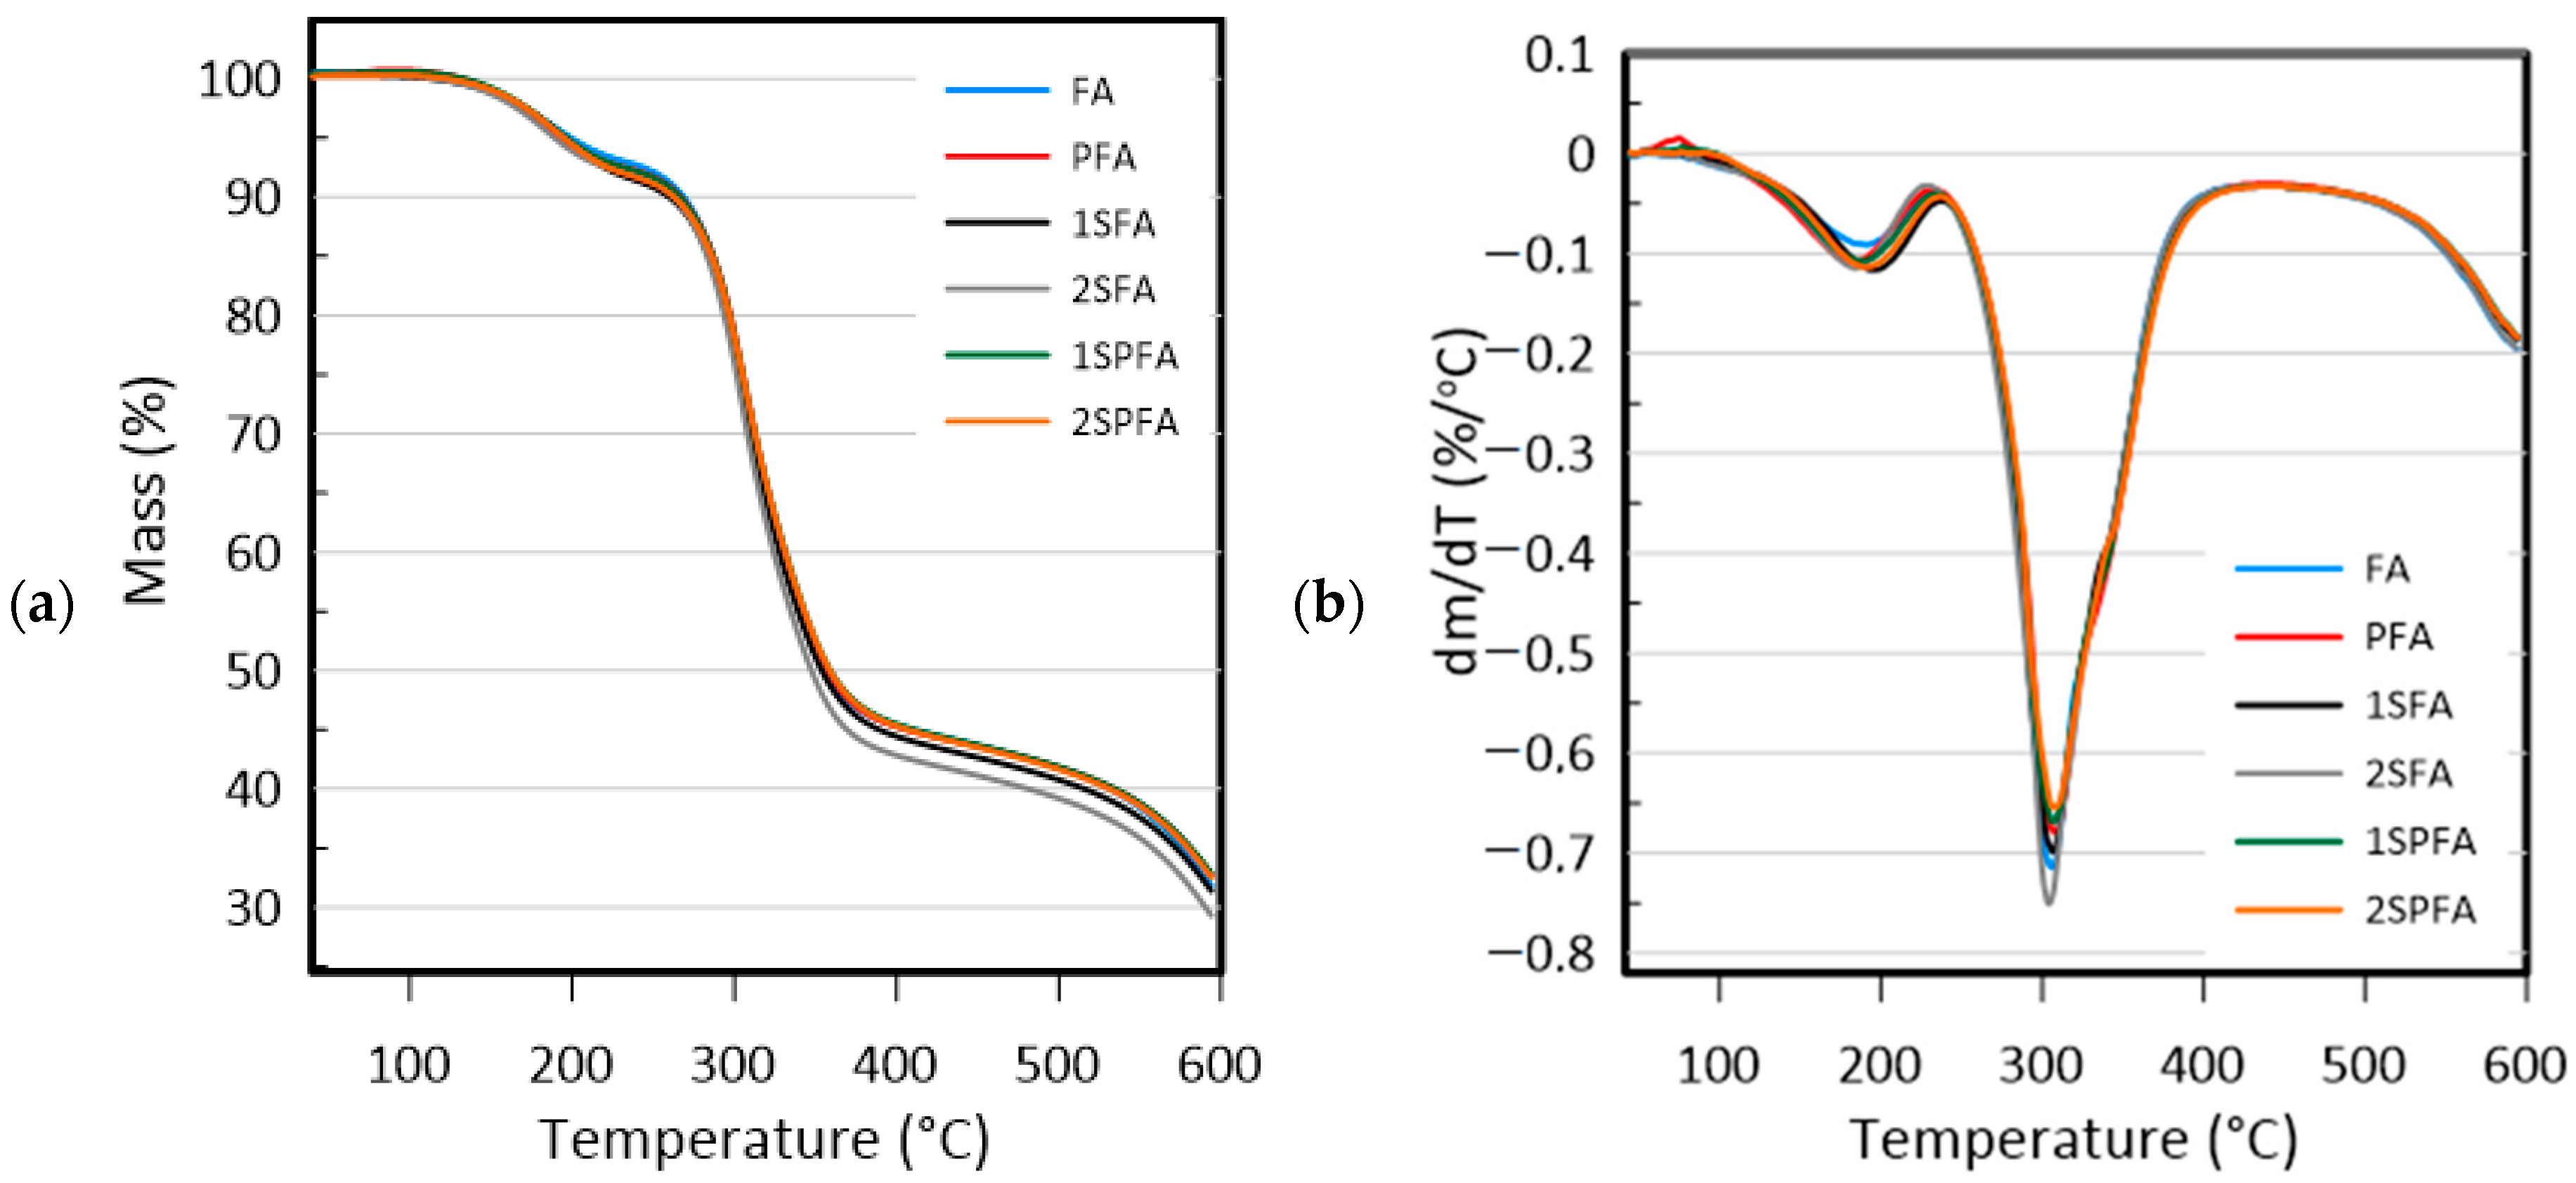
3.4. Thermal Properties of Polyurethane Composites
3.5. Flammability
4. Conclusions
Author Contributions
Funding
Institutional Review Board Statement
Informed Consent Statement
Data Availability Statement
Conflicts of Interest
References
- Hassan, A.A.; Formela, K.; Wang, S. Enhanced interfacial and mechanical performance of styrene-butadiene rubber/silica composites compatibilized by soybean oil derived silanized plasticization. Compos. Sci. Technol. 2020, 197, 108271. [Google Scholar] [CrossRef]
- Masłowski, M.; Miedzianowska, J.; Strzelec, K. Silanized cereal straw as a novel, functional filler of natural rubber biocomposites. Cellulose 2019, 26, 1025–1040. [Google Scholar] [CrossRef] [Green Version]
- Dharmalingam, S.; Meenakshisundaram, O.; Kugarajah, V. Effect of degree of silanization of luffa on the properties of luffa-epoxy composites. Colloids Surf. A Physicochem. Eng. Asp. 2020, 603, 25273. [Google Scholar] [CrossRef]
- Lewis, S.H.; Fugolin, A.P.P.; Lam, S.; Scanlon, C.; Ferracane, J.L.; Pfeifer, C.S. Effects of systematically varied thiourethane-functionalized filler concentration on polymerization behavior and relevant clinical properties of dental composites. Mater. Des. 2021, 197, 109249. [Google Scholar] [CrossRef] [PubMed]
- Cisneros-Pineda, O.G.; Herrera Kao, W.; Loría-Bastarrachea, M.I.; Veranes-Pantoja, Y.; Cauich-Rodríguez, J.V.; Cervantes-Uc, J.M. Towards optimization of the silanization process of hydroxyapatite for its use in bone cement formulations. Mater. Sci. Eng. C 2014, 40, 157–163. [Google Scholar] [CrossRef] [PubMed]
- Karakoy, M.; Gultepe, E.; Pandey, S.; Khashab, M.A.; Gracias, D.H. Silane surface modification for improved bioadhesion of esophageal stents. Appl. Surf. Sci. 2014, 311, 684–689. [Google Scholar] [CrossRef] [PubMed] [Green Version]
- Lung, C.Y.K.; Sarfraz, Z.; Habib, A.; Khan, A.S.; Matinlinna, J.P. Effect of silanization of hydroxyapatite fillers on physical and mechanical properties of a bis-GMA based resin composite. J. Mech. Behav. Biomed. Mater. 2016, 54, 283–294. [Google Scholar] [CrossRef] [PubMed]
- Lee, J.H.; Shin, H.; Rhee, K.Y. Surface functionalization of boron nitride platelets via a catalytic oxidation/silanization process and thermomechanical properties of boron nitride-epoxy composites. Compos. Part B Eng. 2019, 157, 276–282. [Google Scholar] [CrossRef]
- Jiang, S.; Li, Q.; Zhao, Y.; Wang, J.; Kang, M. Effect of surface silanization of carbon fiber on mechanical properties of carbon fiber reinforced polyurethane composites. Compos. Sci. Technol. 2015, 110, 87–94. [Google Scholar] [CrossRef]
- Yaghoubi, A.; Alavi Nikje, M.M. Silanization of multi-walled carbon nanotubes and the study of its effects on the properties of polyurethane rigid foam nanocomposites. Compos. Part A Appl. Sci. Manuf. 2018, 109, 338–344. [Google Scholar] [CrossRef]
- Barczewski, M.; Matykiewicz, D.; Szostak, M. The effect of two-step surface treatment by hydrogen peroxide and silanization of flax/cotton fabrics on epoxy-based laminates thermomechanical properties and structure. J. Mater. Res. Technol. 2020, 9, 13813–13824. [Google Scholar] [CrossRef]
- Goh, C.K.; Valavan, S.E.; Low, T.K.; Tang, L.H. Effects of different surface modification and contents on municipal solid waste incineration fly ash/epoxy composites. Waste Manag. 2016, 58, 309–315. [Google Scholar] [CrossRef] [PubMed]
- En, S.; Nugay, N. Tuning of final performances of unsaturated polyester composites with inorganic microsphere/platelet hybrid reinforcers. Eur. Polym. J. 2021, 37, 2047–2053. [Google Scholar] [CrossRef]
- Gohatre, O.K.; Biswal, M.; Mohanty, S.; Nayak, S.K. Effect of silane treated fly ash on physico-mechanical, morphological, and thermal properties of recycled poly(vinyl chloride) composites. J. Appl. Polym. Sci. 2021, 138, 50387. [Google Scholar] [CrossRef]
- Xue, X.; Liu, Y.L.; Dai, J.G.; Poon, C.S.; Zhang, W.D.; Zhang, P. Inhibiting efflorescence formation on fly ash–based geopolymer via silane surface modification. Cem. Concr. Compos. 2018, 94, 43–52. [Google Scholar] [CrossRef]
- Członka, S.; Sienkiewicz, N.; Strąkowska, A.; Strzelec, K. Keratin feathers as a filler for rigid polyurethane foams on the basis of soybean oil polyol. Polym. Test. 2018, 72, 32–45. [Google Scholar] [CrossRef]
- Tan, S.; Abraham, T.; Ference, D.; MacOsko, C.W. Rigid polyurethane foams from a soybean oil-based Polyol. Polymer 2011, 52, 2840–2846. [Google Scholar] [CrossRef]
- Bo, G.; Xu, X.; Tian, X.; Wu, J.; He, X.; Yan, Y. Synthesis and characterization of flame-retardant rigid polyurethane foams derived from gutter oil biodiesel. Eur. Polym. J. 2021, 147, 110329. [Google Scholar] [CrossRef]
- Xi, W.; Qian, L.; Huang, Z.; Cao, Y.; Li, L. Continuous flame-retardant actions of two phosphate esters with expandable graphite in rigid polyurethane foams. Polym. Degrad. Stab. 2016, 130, 97–102. [Google Scholar] [CrossRef]
- Qian, L.; Li, L.; Chen, Y.; Xu, B.; Qiu, Y. Quickly self-extinguishing flame retardant behavior of rigid polyurethane foams linked with phosphaphenanthrene groups. Compos. Part B Eng. 2019, 175, 107186. [Google Scholar] [CrossRef]
- Gupta, A.; Badr, Y.; Negahban, A.; Qiu, R.G. Energy-efficient heating control for smart buildings with deep reinforcement learning. J. Build. Eng. 2020, 34, 101739. [Google Scholar] [CrossRef]
- Członka, S.; Strąkowska, A.; Kairytė, A.; Kremensas, A. Nutmeg filler as a natural compound for the production of polyurethane composite foams with antibacterial and anti-aging properties. Polym. Test. 2020, 86, 106479. [Google Scholar] [CrossRef]
- Członka, S.; Strąkowska, A.; Strzelec, K.; Kairytė, A.; Vaitkus, S. Composites of rigid polyurethane foams and silica powder filler enhanced with ionic liquid. Polym. Test. 2019, 75, 12–15. [Google Scholar] [CrossRef]
- Bo, G.; Xu, X.; Tian, x.; Wu, J.; He, X.; Xu, L.; Yan, Y. Enhancing the flame retardancy for castor oil-based rigid polyurethane foams via silica aerogel. J. Non. Cryst. Solids 2021, 562, 120783. [Google Scholar] [CrossRef]
- Acuña, P.; Lin, X.; Calvo, M.S.; Shao, Z.; Pérez, N.; Villafañe, F.; Rodríguez-Pérez, M.Á.; Wang, D.-Y. Synergistic effect of expandable graphite and phenylphosphonic-aniline salt on flame retardancy of rigid polyurethane foam. Polym. Degrad. Stab. 2020, 179, 109274. [Google Scholar] [CrossRef]
- De Mello, D.; Pezzin, S.H.; Amico, S.C. The effect of post-consumer PET particles on the performance of flexible polyurethane foams. Polym. Test. 2009, 28, 702–708. [Google Scholar] [CrossRef]
- Harikrishnan, G.; Singh, S.N.; Kiesel, E.; Macosko, C.W. Nanodispersions of carbon nanofiber for polyurethane foaming. Polymer 2010, 51, 3349–3353. [Google Scholar] [CrossRef]
- Qi, Y.L.X.; Zhang, Y.; Chang, C.; Luo, X. Thermal, mechanical, and morphological properties of rigid crude glycerol-based polyurethane foams reinforced with nanoclay and microcrystalline cellulose. Eur. J. Lipid Sci. Technol. 2018, 120, 1700413. [Google Scholar] [CrossRef]
- Sung, G.; Kim, J.H. Influence of filler surface characteristics on morphological, physical, acoustic properties of polyurethane composite foams filled with inorganic fillers. Compos. Sci. Technol. 2017, 146, 147–154. [Google Scholar] [CrossRef]
- Zhou, X.; Sethi, J.; Geng, S.; Berglund, L.; Frisk, N.; Aitomäki, Y.; Sain, M.M.; Oksman, K. Dispersion and reinforcing effect of carrot nanofibers on biopolyurethane foams. Mater. Des. 2016, 110, 526–531. [Google Scholar] [CrossRef]
- Husainie, S.M.; Deng, X.; Ghalia, M.A.; Robinson, J.; Naguib, H.E. Natural fillers as reinforcement for closed-molded polyurethane foam plaques: Mechanical, morphological, and thermal properties. Mater. Today Commun. 2020, 27, 102187. [Google Scholar] [CrossRef]
- Kuźnia, M.; Magiera, A.; Jerzak, W.; Ziąbka, M.; Lach, R. Study on chemical composition of fly ash from fluidized-bed and convetional coal combustion. Przemysł Chem. 2017, 96, 1699–1703. [Google Scholar] [CrossRef]
- Kuźnia, M.; Magiera, A.; Jerzak, W.; Ziąbka, M.; Zygmunt-Kowalska, B.; Kaczorek-Chrobak, K.; Pielichowska, K.; Szatkowski, P.; Benko, A.; Ziąbka, M.; et al. Fly Ash as an Eco-Friendly Filler for Rigid Polyurethane Foams Modification. Materials 2021, 14, 6604. [Google Scholar] [CrossRef] [PubMed]
- Kuźnia, M. Reusing of fly ash from coal combustion in technology of polyurethane materials. Przemysł Chem. 2021, 100, 816–818. [Google Scholar] [CrossRef]
- Sroka, J.; Rybak, A.; Sekula, R.; Sitarz, M. An Investigation into the Influence of Filler Silanization Conditions on Mechanical and Thermal Parameters of Epoxy Resin-Fly Ash Composites. J. Polym. Environ. 2016, 24, 298–308. [Google Scholar] [CrossRef]
- Park, S.J.; Cho, S.H.; Seo, H.W.; Do Nam, J.; Suhr, J. Natural cork agglomerate enabled mechanically robust rigid polyurethane foams with outstanding viscoelastic damping properties. Polymer 2021, 217, 123437. [Google Scholar] [CrossRef]
- Borowicz, M.; Paciorek-Sadowska, J.; Lubczak, J.; Czupryński, B. Biodegradable, flame-retardant, and bio-based rigid polyurethane/polyisocyanurate foams for thermal insulation application. Polymers 2019, 11, 1816. [Google Scholar] [CrossRef] [PubMed] [Green Version]
- Członka, S.; Strąkowska, A.; Kairytė, A. Effect of walnut shells and silanized walnut shells on the mechanical and thermal properties of rigid polyurethane foams. Polym. Test. 2020, 87, 106534. [Google Scholar] [CrossRef]
- Prociak, A.; Rokicki, G.; Ryszkowska, J. Materiały Poliuretanowe; PWN: Warsaw, Poland, 2016. [Google Scholar]
- Badri, S.Z.K.H.; Ahmad, S.H. Production of a High-Functionality RBD Palm Kernel Oil-Based Polyester Polyol. Appl. Polim. Sci. 2001, 81, 384–389. [Google Scholar] [CrossRef]
- Wolska, A.; Goździkiewicz, M.; Ryszkowska, J. Thermal and mechanical behaviour of flexible polyurethane foams modified with graphite and phosphorous fillers. J. Mater. Sci. 2012, 47, 5627–5634. [Google Scholar] [CrossRef] [Green Version]
- Kairytė, A.; Kizinievič, O.; Kizinievič, V.; Kremensas, A. Synthesis of biomass-derived bottom waste ash based rigid biopolyurethane composite foams: Rheological behaviour, structure and performance characteristics. Compos. Part A Appl. Sci. Manuf. 2019, 117, 193–201. [Google Scholar] [CrossRef]
- Mosiewicki, M.A.; Casado, U.; Marcovich, N.E.; Aranguren, M.I. Polyurethanes from tung oil: Polymer characterization and composites. Polym. Eng. Sci. 2009, 49, 685–692. [Google Scholar] [CrossRef]
- Barczewski, M.; Kurańska, M.; Sałasińska, K.; Michałowski, K.; Prociak, A.; Uram, K.; Lewandowski, K. Rigid polyurethane foams modified with thermoset polyester-glass fiber composite waste. Polym. Test. 2020, 81, 106190. [Google Scholar] [CrossRef]
- Jiao, L.; Xiao, H.; Wang, Q.; Sun, J. Thermal degradation characteristics of rigid polyurethane foam and the volatile products analysis with TG-FTIR-MS. Polym. Degrad. Stab. 2013, 98, 2687–2696. [Google Scholar] [CrossRef]
- Kuźnia, M.; Magiera, A.; Pielichowska, K.; Ziąbka, M.; Benko, A.; Szatkowski, P.; Jerzak, W. Fluidized bed combustion fly ash as filler in composite polyurethane materials. Waste Manag. 2019, 92, 115–123. [Google Scholar] [CrossRef] [PubMed]
- Duan, B.; Wang, Q.; Wang, X.; Li, Y.; Zhang, M.; Diao, S. Flame retardance of leather with flame retardant added in retanning process. Results Phys. 2019, 15, 102717. [Google Scholar] [CrossRef]
- Cao, Z.J.; Dong, X.; Fu, T.; Deng, S.B.; Liao, W.; Wang, Y.Z. Coated vs. naked red phosphorus: A comparative study on their fire retardancy and smoke suppression for rigid polyurethane foams. Polym. Degrad. Stab. 2017, 136, 103–111. [Google Scholar] [CrossRef]


| Filler | Description | C (%) | H (%) | N (%) | SSA (m2/g) |
|---|---|---|---|---|---|
| FA | unmodified fly ash | 9.46 | 0.00 | 0.19 | 5.47 |
| PFA | sifted fly ash | 6.93 | 0.02 | 0.17 | 3.23 |
| 1SFA | fly ash silanized with 1% silane solution | 9.95 | 0.15 | 0.30 | 2.24 |
| 2SFA | fly ash silanized with 2% silane solution | 10.47 | 0.19 | 0.49 | 0.95 |
| 1SPFA | sifted fly ash silanized with 1% silane solution | 6.52 | 0.08 | 0.27 | 1.09 |
| 2SPFA | sifted fly ash silanized with 2% silane solution | 6.42 | 0.04 | 0.21 | 2.21 |
| Foam Code | Cream Time (s) | Rise Time (s) | Tack Free Time (s) |
|---|---|---|---|
| PU_FA | 45 | 236 | 350 |
| PU_PFA | 51 | 251 | 330 |
| PU_1SFA | 42 | 281 | 310 |
| PU_2SFA | 45 | 284 | 310 |
| PU_1SPFA | 49 | 266 | 305 |
| PU_2SPFA | 50 | 259 | 300 |
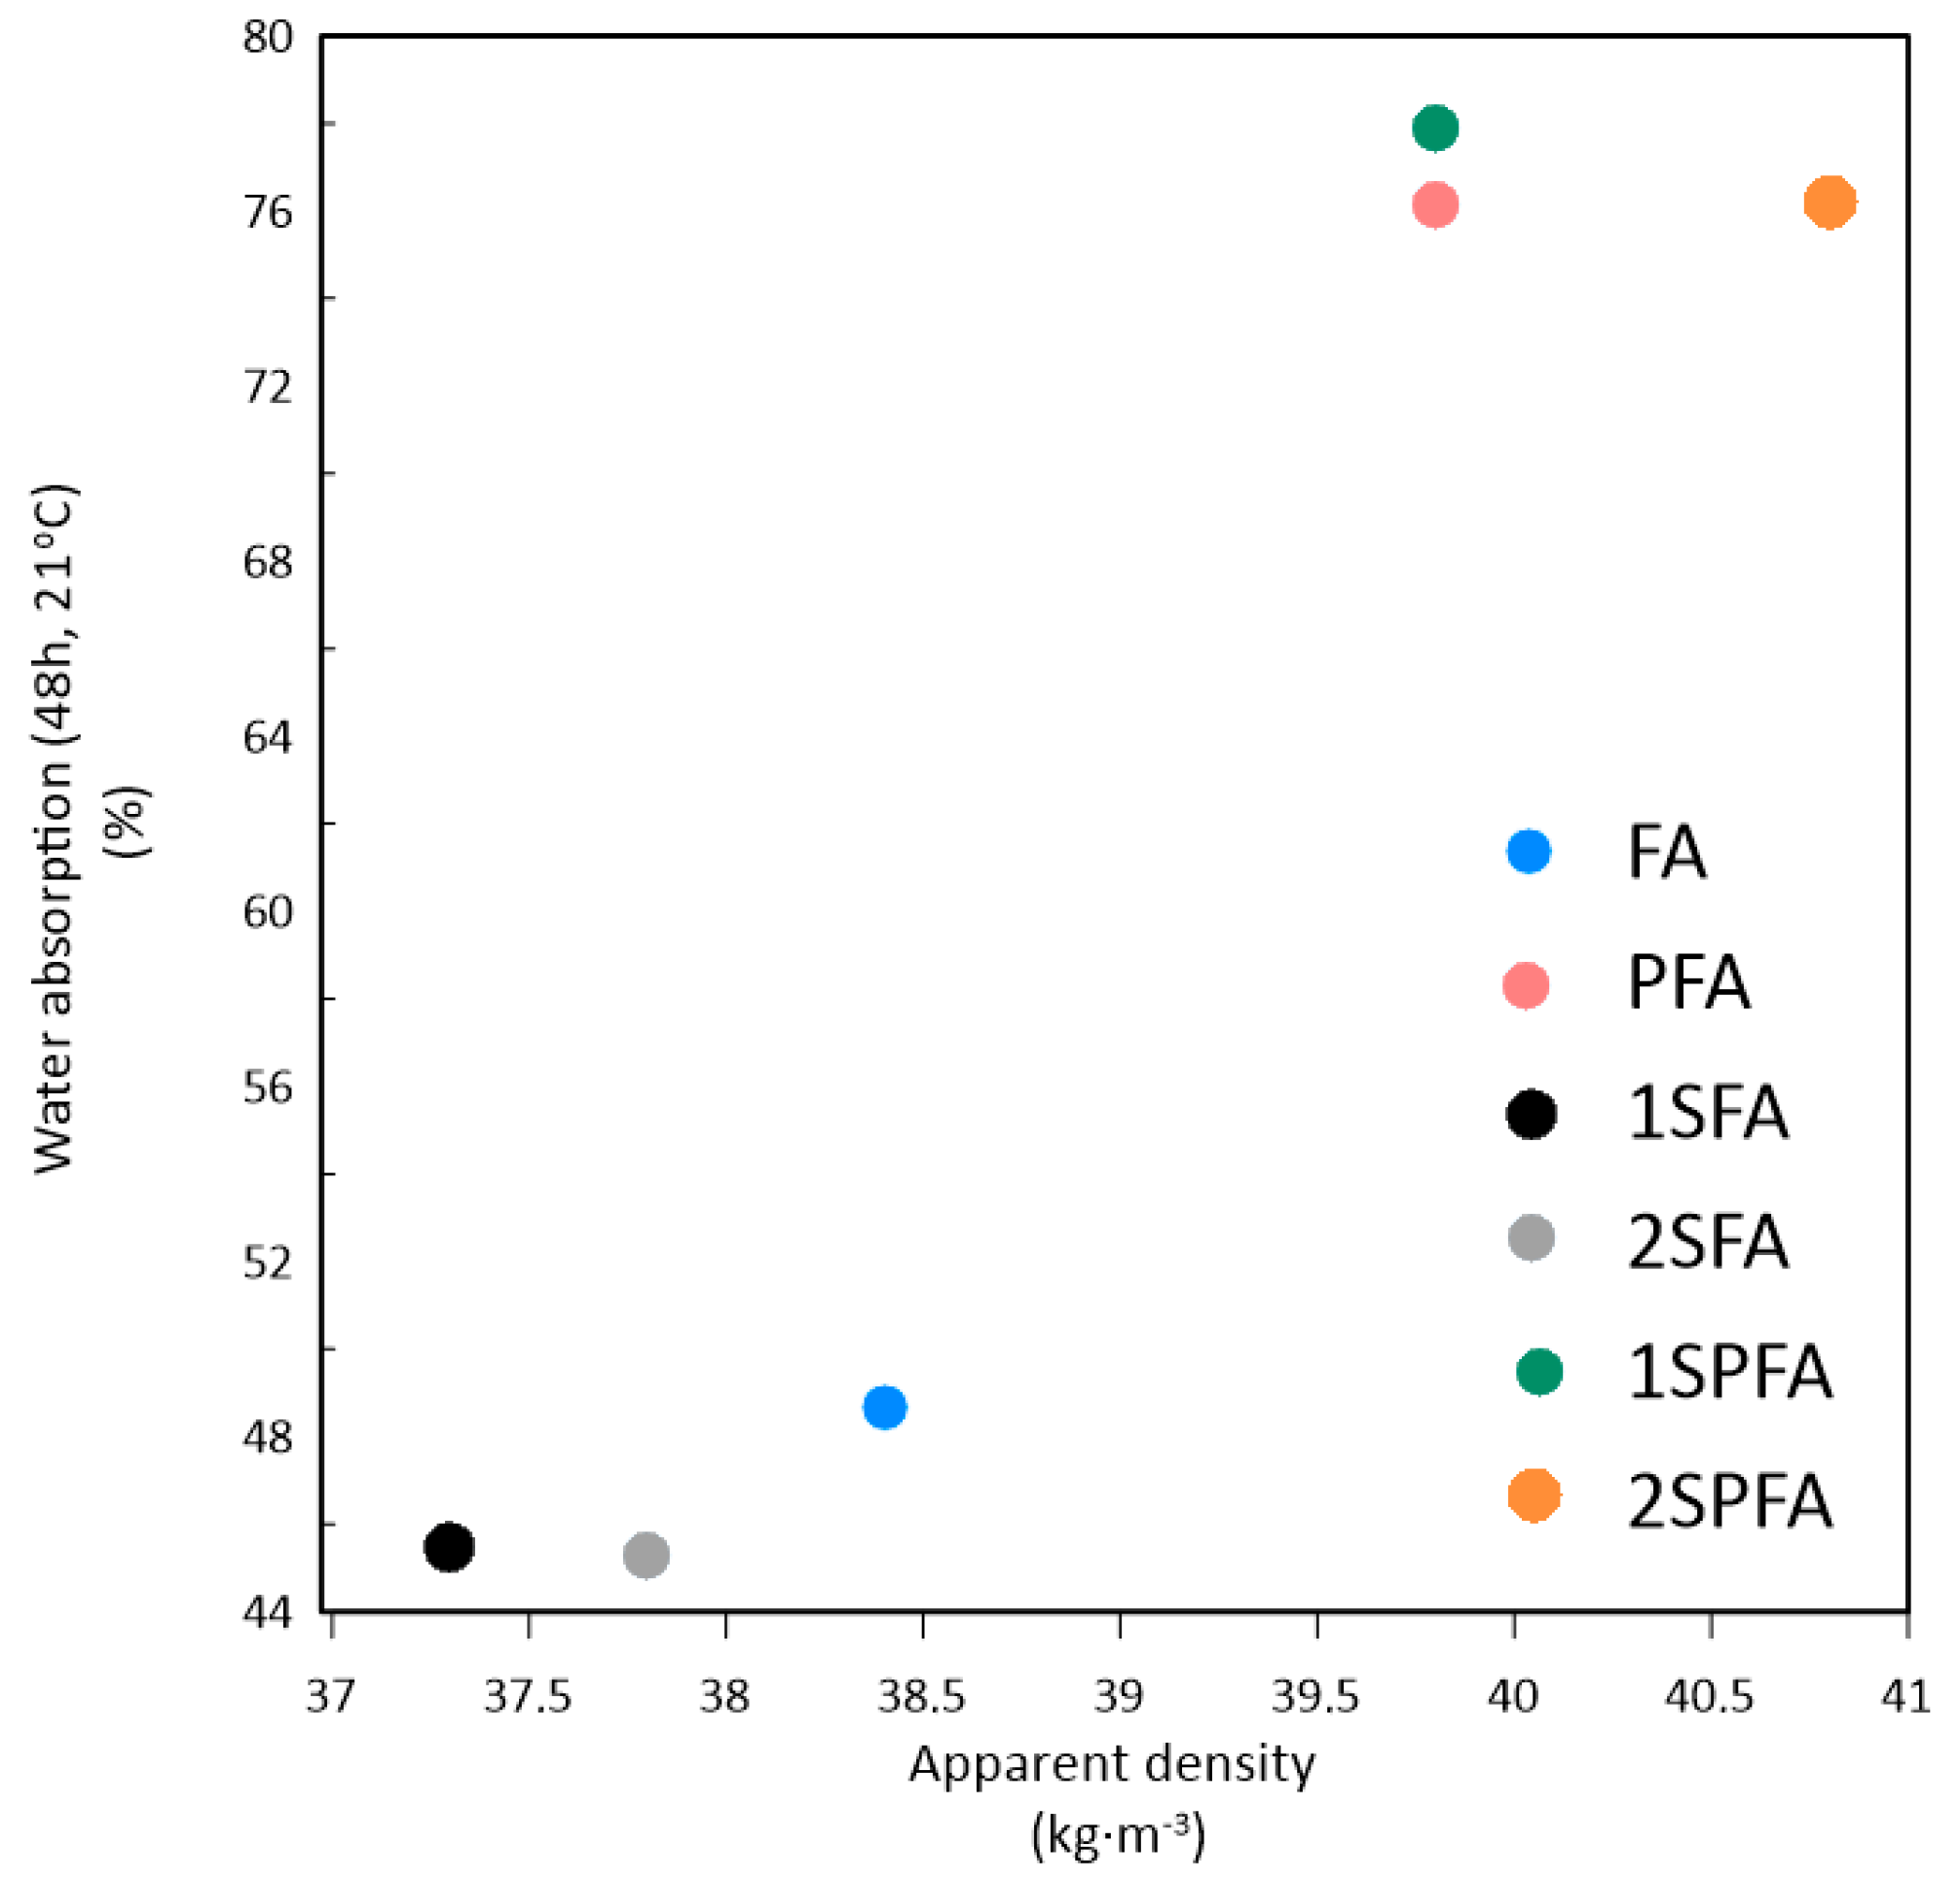
| Sample | Apparent Density (kg⋅m−3) | Dimensional Stability (Δl, 48 h, 70 °C) (%) | Loss in Mass (Δm, 48 h, 70 °C) (%) | Water Absorption (48 h, 21 °C) (%) |
|---|---|---|---|---|
| PU_FA | 38.4 | 1.20 | 0.45 | 48.68 |
| PU_PFA | 39.8 | 0.40 | 0.55 | 76.16 |
| PU_1SFA | 37.3 | 1.40 | 0.43 | 45.45 |
| PU_2SFA | 37.8 | 0.70 | 0.41 | 45.29 |
| PU_1SPFA | 39.8 | 0.40 | 0.50 | 77.92 |
| PU_2SPFA | 40.8 | 0.45 | 0.54 | 76.23 |
| Sample | T1% (°C) | T5% (°C) | T10% (°C) | T50% (°C) | TDTGmax (°C) | Residue at 600 °C (%) |
|---|---|---|---|---|---|---|
| PU_FA | 250 | 276 | 290 | 378 | 305 | 32.0 |
| PU_PFA | 250 | 277 | 291 | 382 | 308 | 32.9 |
| PU_1SFA | 251 | 277 | 291 | 379 | 306 | 31.7 |
| PU_2SFA | 248 | 274 | 288 | 372 | 303 | 29.6 |
| PU_1SPFA | 250 | 277 | 291 | 386 | 308 | 33.0 |
| PU_2SPFA | 251 | 278 | 292 | 388 | 307 | 32.7 |
| Sample | Gross Calorific Value (MJ·kg−1) | LOI (%) | UL94 |
|---|---|---|---|
| PU_FA | 24.4 | 22.0 | N.R. |
| PU_PFA | 23.5 | 21.8 | N.R. |
| PU_1SFA | 23.2 | 21.8 | N.R. |
| PU_2SFA | 23.5 | 21.9 | N.R. |
| PU_1SPFA | 23.7 | 22.0 | N.R. |
| PU_2SPFA | 23.7 | 22.0 | N.R. |
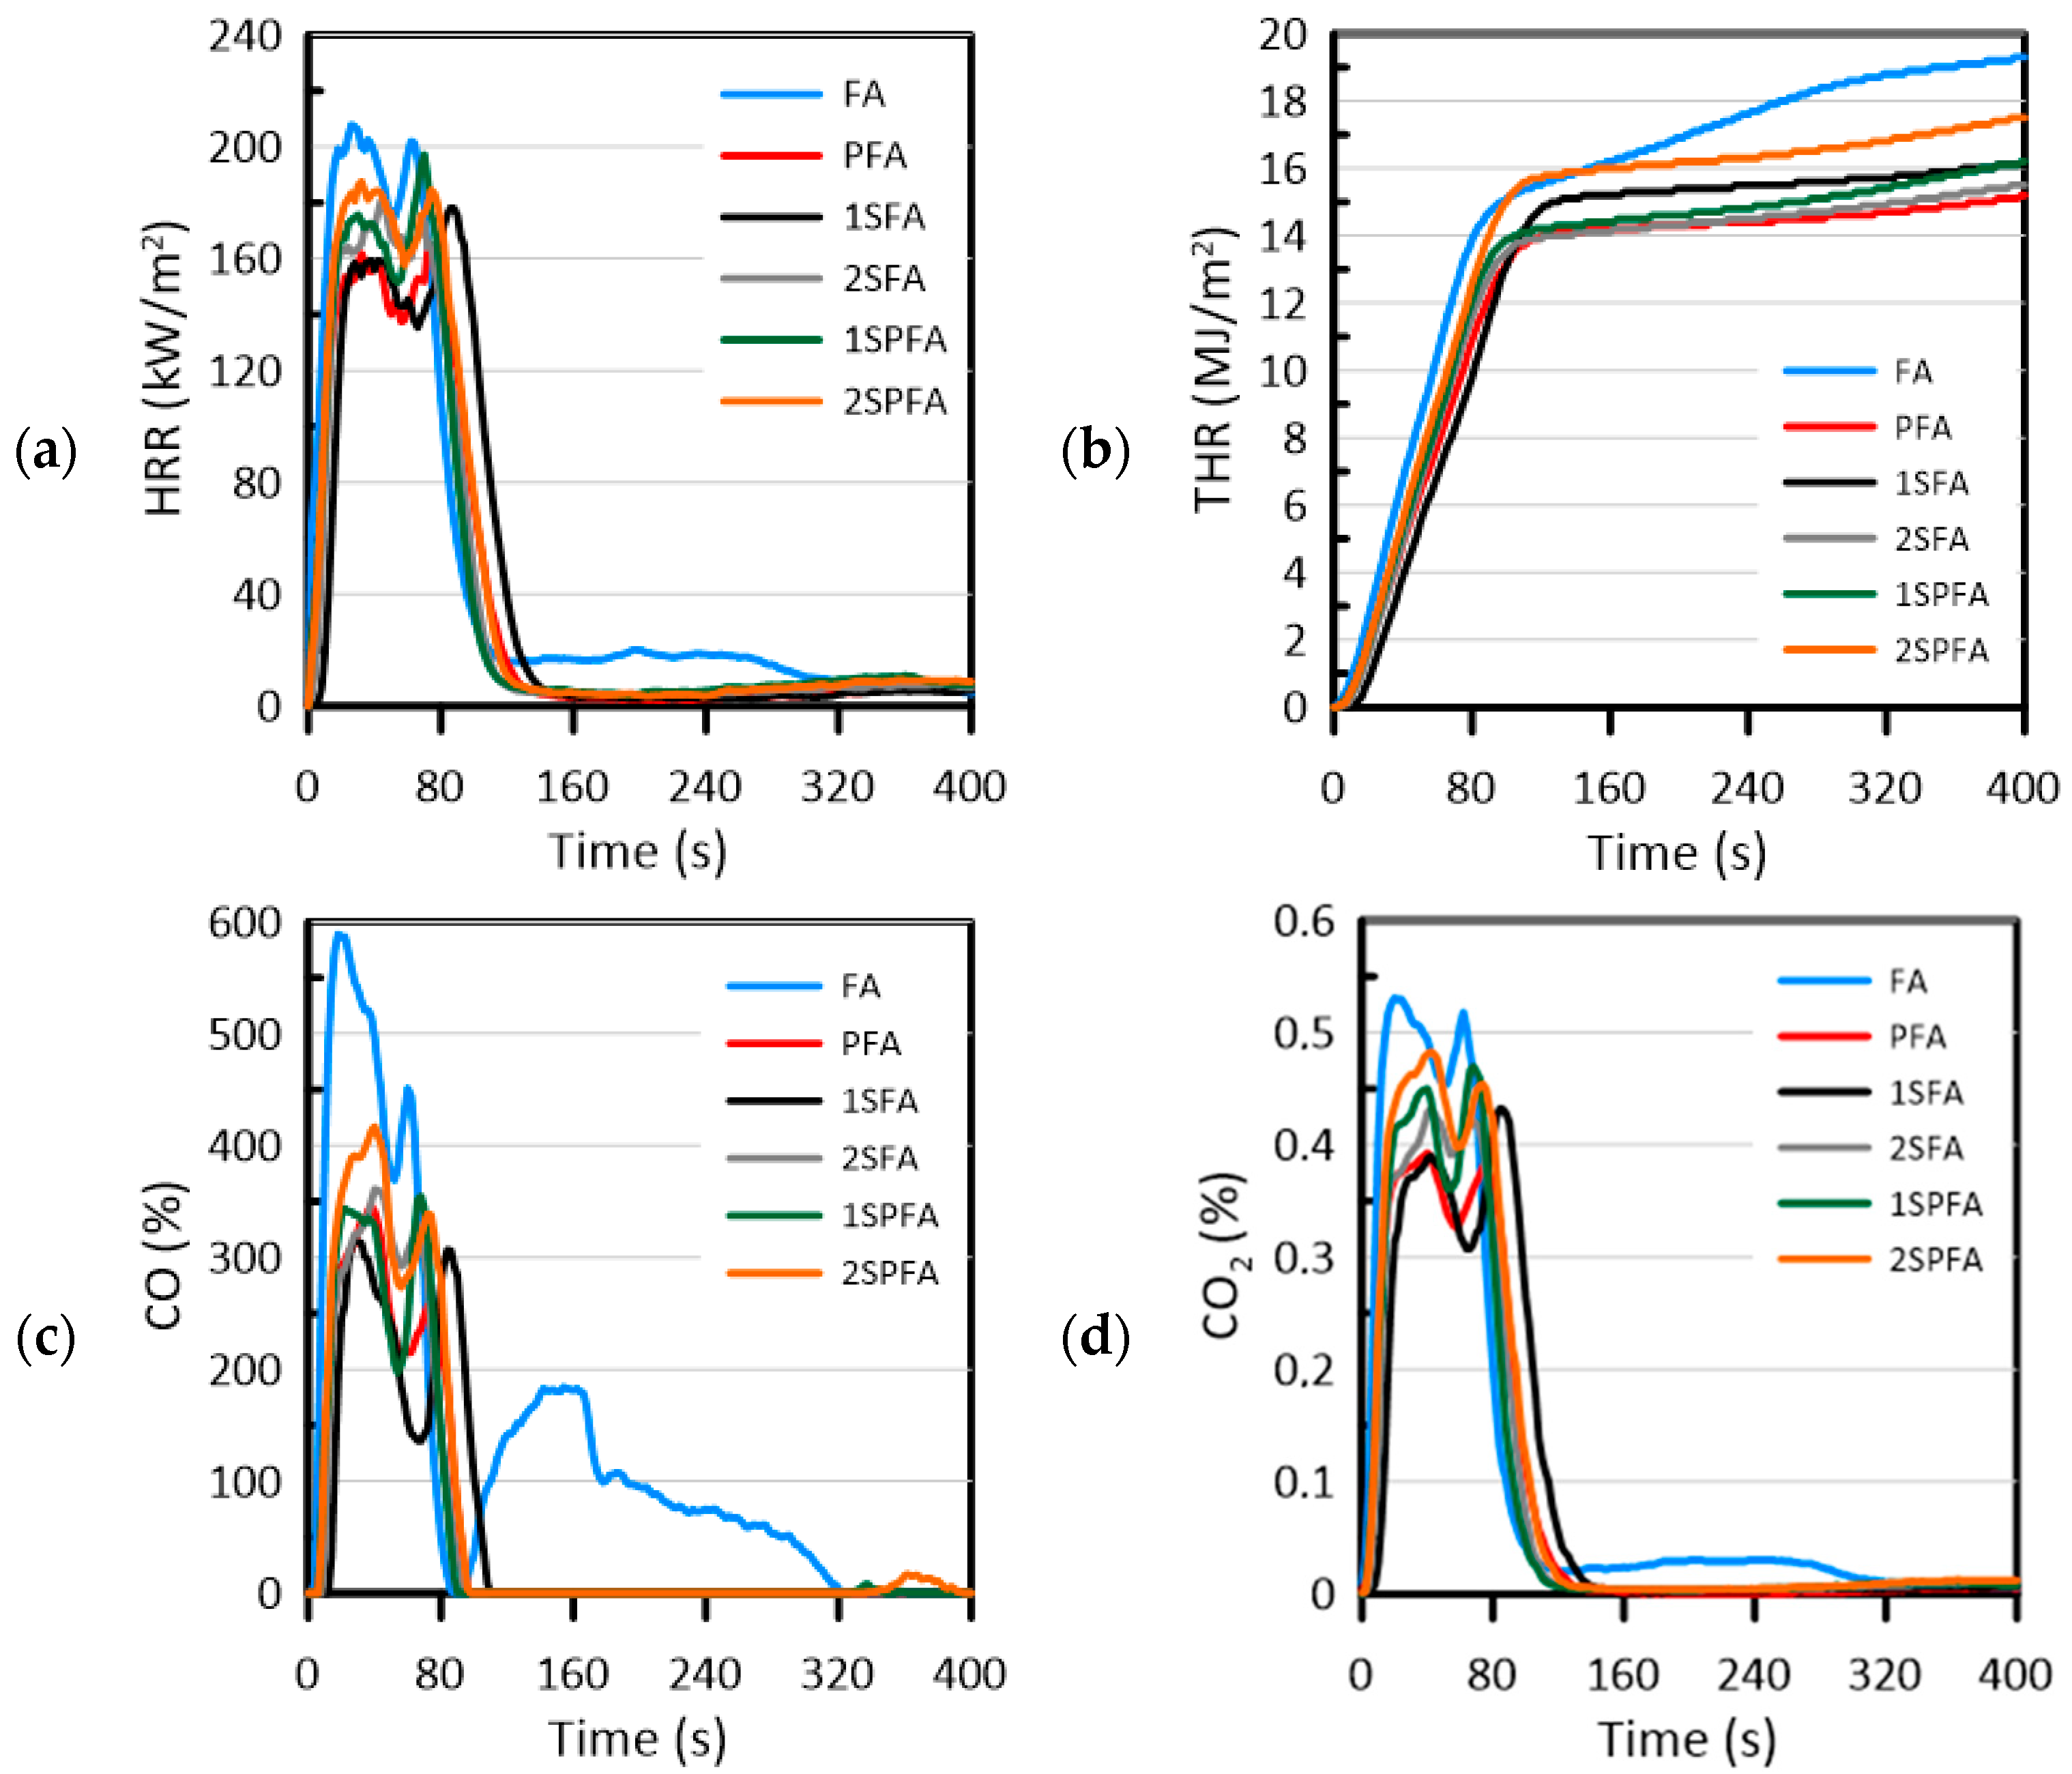
| Sample | TTI (s) | AEHC (MJ/kg) | pHRR (kW/m2) | T-pHRR (s) | FIGRA (kW/m2s) | MARHE (kW/m2) | TSR (m2/m2) |
|---|---|---|---|---|---|---|---|
| PU_FA | 2 | 28.1 | 207.8 | 26 | 7.99 | 177.16 | 679.9 |
| PU_PFA | 6 | 18.1 | 164.1 | 32 | 5.13 | 136.52 | 579.5 |
| PU_1SFA | 6 | 19.3 | 178.2 | 86 | 2.07 | 131.35 | 571.2 |
| PU_2SFA | 6 | 19.0 | 180.9 | 44 | 4.11 | 144.95 | 555.9 |
| PU_1SPFA | 4 | 20.6 | 197.2 | 70 | 2.82 | 151.63 | 544.5 |
| PU_2SPFA | 4 | 21.8 | 187.6 | 32 | 5.86 | 157.24 | 552.2 |
Publisher’s Note: MDPI stays neutral with regard to jurisdictional claims in published maps and institutional affiliations. |
© 2022 by the authors. Licensee MDPI, Basel, Switzerland. This article is an open access article distributed under the terms and conditions of the Creative Commons Attribution (CC BY) license (https://creativecommons.org/licenses/by/4.0/).
Share and Cite
Zygmunt-Kowalska, B.; Pielichowska, K.; Trestka, P.; Ziąbka, M.; Kuźnia, M. The Effect of Ash Silanization on the Selected Properties of Rigid Polyurethane Foam/Coal Fly Ash Composites. Energies 2022, 15, 2014. https://doi.org/10.3390/en15062014
Zygmunt-Kowalska B, Pielichowska K, Trestka P, Ziąbka M, Kuźnia M. The Effect of Ash Silanization on the Selected Properties of Rigid Polyurethane Foam/Coal Fly Ash Composites. Energies. 2022; 15(6):2014. https://doi.org/10.3390/en15062014
Chicago/Turabian StyleZygmunt-Kowalska, Beata, Kinga Pielichowska, Patrycja Trestka, Magdalena Ziąbka, and Monika Kuźnia. 2022. "The Effect of Ash Silanization on the Selected Properties of Rigid Polyurethane Foam/Coal Fly Ash Composites" Energies 15, no. 6: 2014. https://doi.org/10.3390/en15062014