
Thermodynamic Analysis of a Regenerative Brayton Cycle Using H2, CH4 and H2/CH4 Blends as Fuel


1
Ikerlan Technology Research Centre, Basque Research and Technology Alliance (BRTA), P.º J.M. Arizmendiarrieta, 2, 20500 Arrasate, Spain
2
AZTI, Marine Research, Basque Research and Technology Alliance (BRTA), Txatxarramendi Ugartea, 48395 Sukarrieta, Spain
3
Energy Engineering Department, School of Engineering, Building I, University of the Basque Country, UPV/EHU, Plaza Ingeniero Torres Quevedo s/n, 48013 Bilbao, Spain
*
Author to whom correspondence should be addressed.
Energies 2022, 15(4), 1508; https://doi.org/10.3390/en15041508
Submission received: 17 January 2022
/
Revised: 13 February 2022
/
Accepted: 15 February 2022
/
Published: 17 February 2022
(This article belongs to the Special Issue Transition to a Low-Carbon Economy and Climate Change Mitigation)
Abstract
:Considering a simple regenerative Brayton cycle, the impact of using different fuel blends containing a variable volumetric percentage of hydrogen in methane was analysed. Due to the potential of hydrogen combustion in gas turbines to reduce the overall CO emissions and the dependency on natural gas, further research is needed to understand the impact on the overall thermodynamic cycle. For that purpose, a qualitative thermodynamic analysis was carried out to assess the exergetic and energetic efficiencies of the cycle as well as the irreversibilities associated to a subsystem. A single step reaction was considered in the hypothesis of complete combustion of a generic H/CH mixture, where the volumetric H percentage was represented by , which was varied from 0 to 1, defining the amount of hydrogen in the fuel mixture. Energy and entropy balances were solved through the Engineering Equation Solver (EES) code. Results showed that global exergetic and energetic efficiencies increased by 5% and 2%, respectively, varying from 0 to 1. Higher hydrogen percentages resulted in lower exergy destruction in the chamber despite the higher air-excess levels. It was also observed that higher values of led to lower fuel mass flow rates in the chamber, showing that hydrogen can still be competitive even though its cost per unit mass is twice that of natural gas.
1. Introduction
New solutions for the efficient generation of carbon-neutral electricity are essential to curb the climate crisis. In the framework of renewable energies, it is well known that the energy supplied by wind or solar renewable power plants presents peaks and valleys due to the weather variability [1]. In order to face up this variable generation and following the so-called “Power to gas” (P2G) concept, hydrogen can be produced by electrolysis of water during the generation peaks [2,3]. Green hydrogen is then stored and distributed for a wide range of end uses (hydrogen to power). Different cost-benefit studies have concluded that green hydrogen will be a feasible and competitive energy carrier in the coming years, optimising the use of natural resources [4,5,6].
One of the alternatives relies on using the generated green hydrogen for electric generation in electric power plants, as it has already been done in several projects [5,7,8]. The technical report of ENT Global [9] summarises the recent advances in different gas turbine technologies and current capabilities of gas turbines using hydrogen as fuel. However, hydrogen is a very challenging fuel due to its combustion properties and differences with respect to conventional fuels such as natural gas, propane or kerosene. The current literature shows several investigations related to the behaviour of hydrogen flames focused on the flashback phenomena, as well as the thermal NO formation [10,11,12,13].
However, from a broader view, it would be necessary to analyse the impact of replacing hydrogen or hydrogen–natural gas mixtures in current power plants. These types of studies could be carried out through thermal engineering principles and system analysis. Recently M. Pyo et al. [14] developed a comparative study integrating the P2G process in a combined cycle power plant (CCPP). The considered scenarios focus on hydrogen produced using a P2G process and using it directly as fuel for the CCPP. In the second case, hydrogen was converted into synthetic natural gas by capturing carbon dioxide from the exhaust gases. Projecting the cost data for 2030, their economic feasibility analysis demonstrated that the direct use of hydrogen in the CCPP would be a promising option.
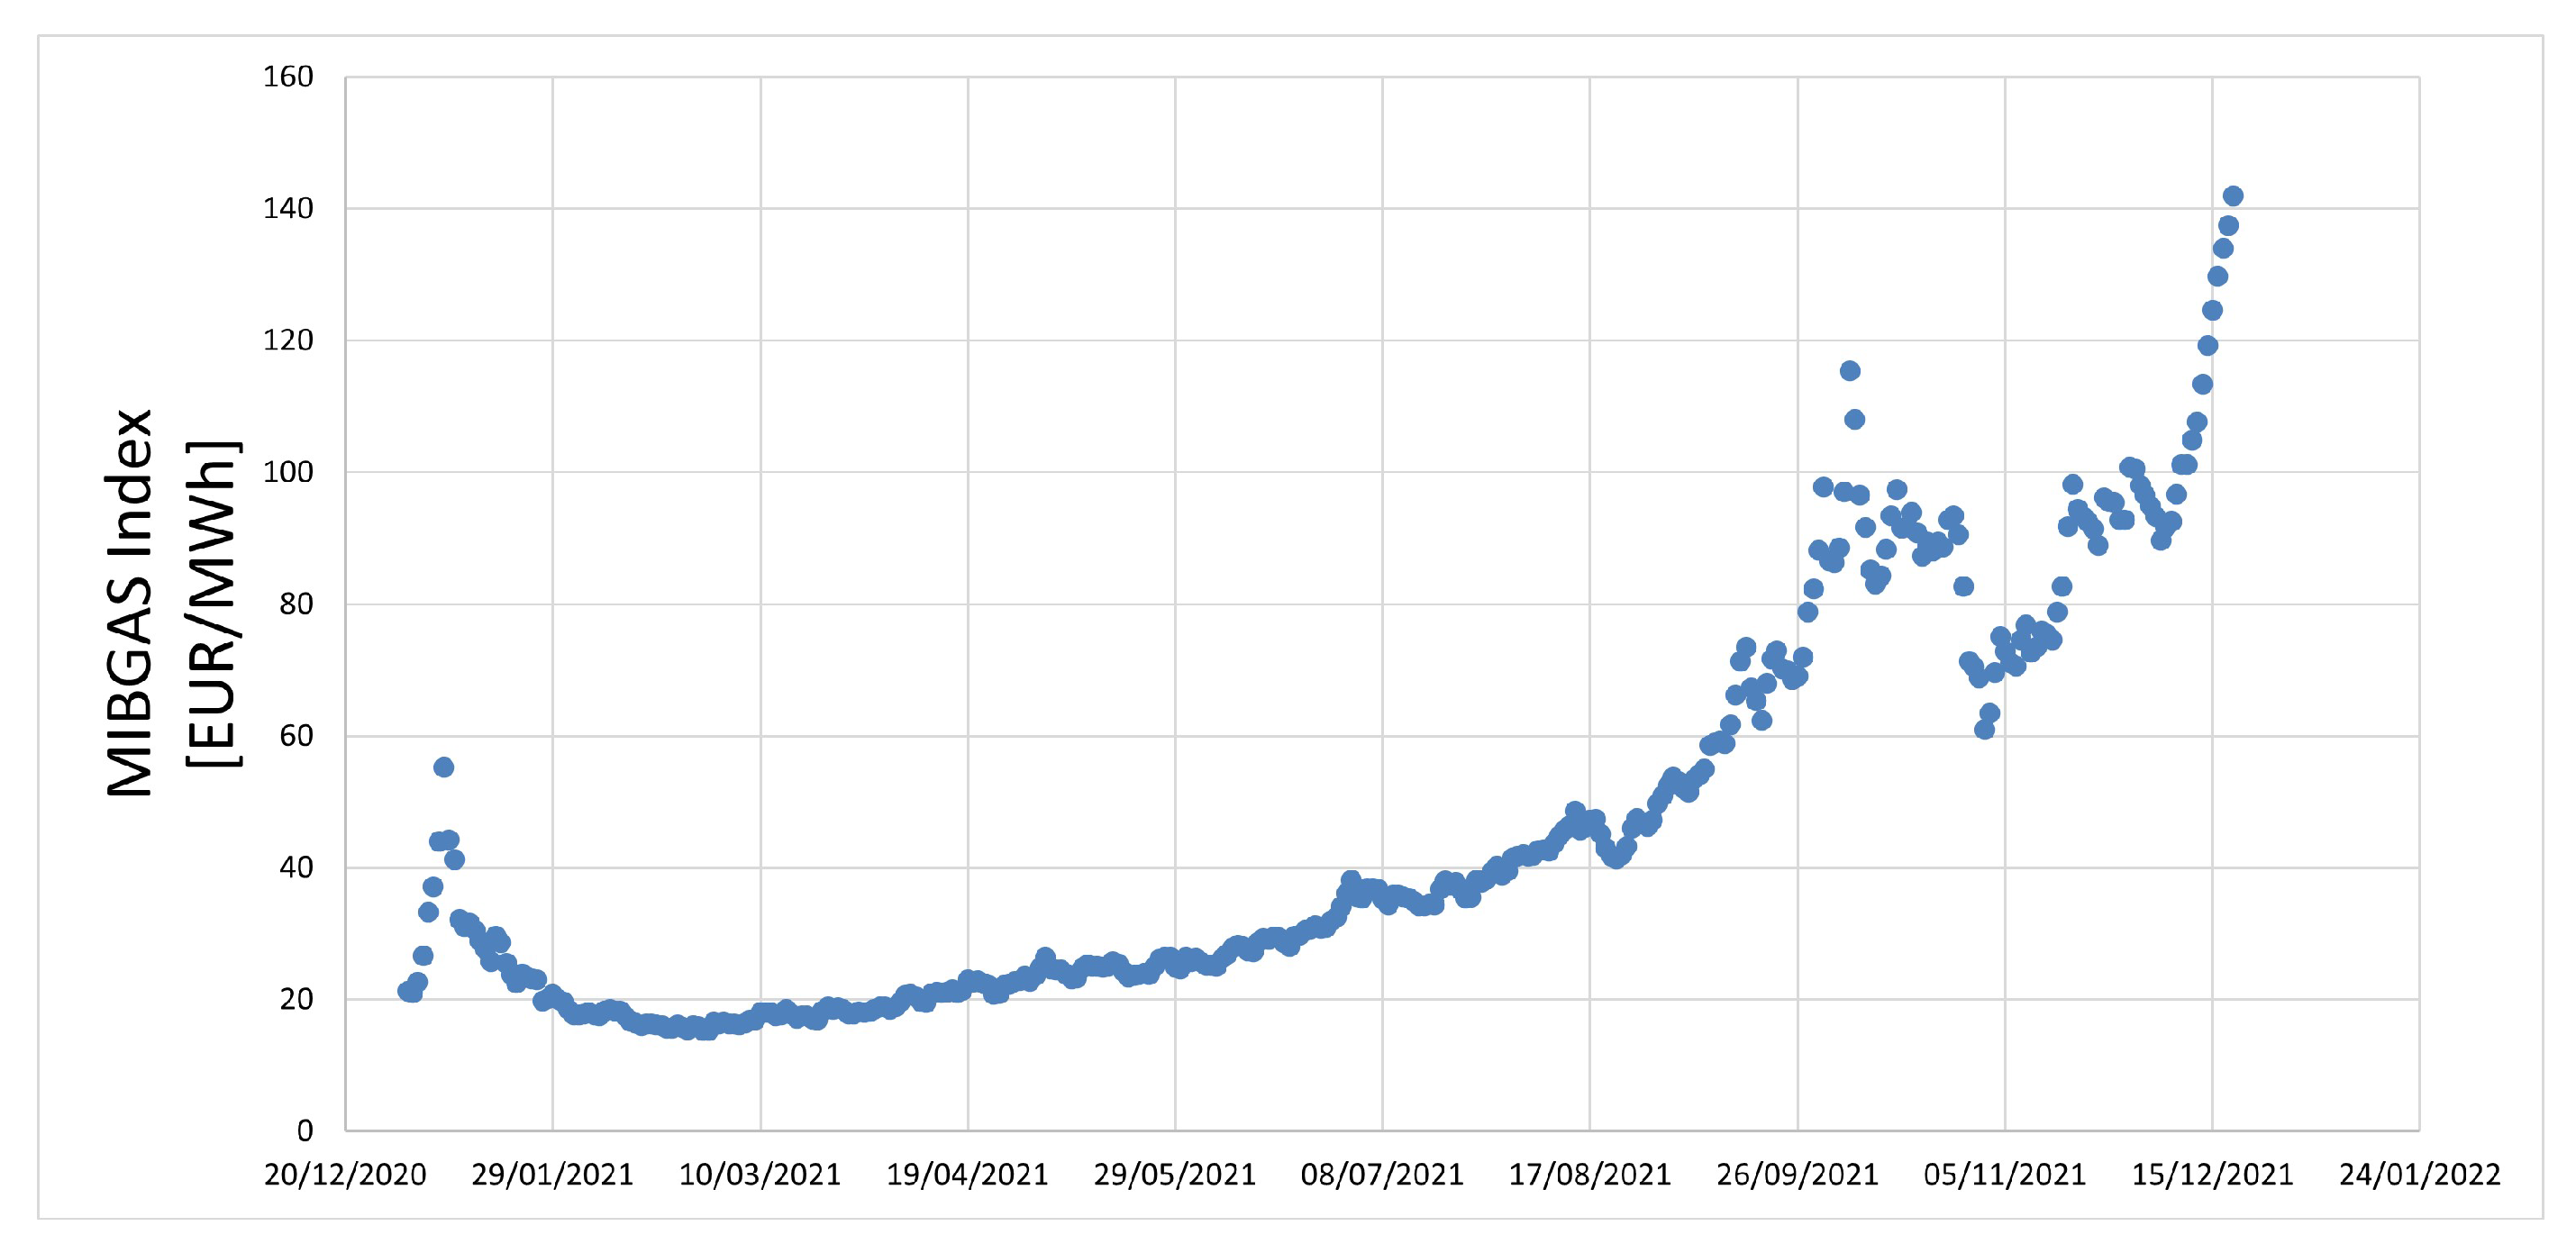
The strong impact of the COVID-19 pandemic in the energy system, together with the extraordinary increase of the price of natural gas in the last few months of 2021 as shown in Figure 1, would further support the idea of using hydrogen or natural gas/hydrogen mixtures instead of pure natural gas [15,16]. Furthermore, the use of carbon-free fuels would eliminate the CO taxes, also supporting the use of hydrogen for industrial-scale combustion systems and making it a more competitive alternative.
Additionally, combustion irreversibilities should be further analysed considering detailed calculations. In that sense, K. Nishida et al. [17] compared the entropy generation and exergy losses for premixed and diffusion flames using hydrogen and methane as fuels, considering separately the different entropy generation mechanisms by heat conduction, chemical reaction, mass diffusion and viscous dissipation. Such type of calculations could be used to feed the thermodynamic analysis, combining CFD simulations with a system analysis approach.
In this context, the present study focuses on the use of hydrogen–methane blends as fuel in a regenerative Brayton cycle, aiming to qualitatively assess the global unsteady state such as the energetic and exergetic efficiencies of the cycle and the irreversibilities of each subsystem. For this purpose, a case study was defined using real operating parameters taken from the datasheet of the industrial natural gas turbine Siemens SGT-100 [18]. The study was implemented using a thermodynamic system analysis approach, treating the components of the system as black boxes and solving the governing equations based on energy and entropy balances. It is worth noting that although this study was carried out considering the operating conditions of a particular industrial natural gas turbine, the present results and conclusions can be extended to any other type of gas turbine.
2. Objectives and Methodology
The main purpose of the present study was to analyse the impact of using different hydrogen/methane mixtures as a thermal source in a simple regenerative Brayton cycle, represented as a set of subsystems (compressor, combustion chamber, turbine and regenerator). A thermodynamic analysis was carried out to solve the energy and entropy balances in each subsystem, obtaining the global energy and exergy efficiencies in terms of the hydrogen content in natural gas, represented by , which defines the volumetric percentage of H in the fuel mixture varying from 0 to 1. The net power of the cycle, the pressure ratio in the compressor and the temperature of the combustion products and exhaust gases were fixed as design constraints on the basis of the industrial natural gas turbine Siemens SGT-100 datasheet [18].
The chemical reactions in the combustion chamber were defined following the hypothesis of complete combustion by a single-step reaction between a hydrogen–methane mixture and air. The ideal gas assumption was used to specify the properties of the working fluids, considering air passing through the compressor and the regenerator, hydrogen and methane as fuels in the combustion chamber and the resulting mixture in the combustion products (present in the turbine and regenerator).
Once the I/O conditions were fixed at each subsystem, the equations were solved through the Engineering Equation Solver (EES) code [19] for different values of .
3. Problem Statement
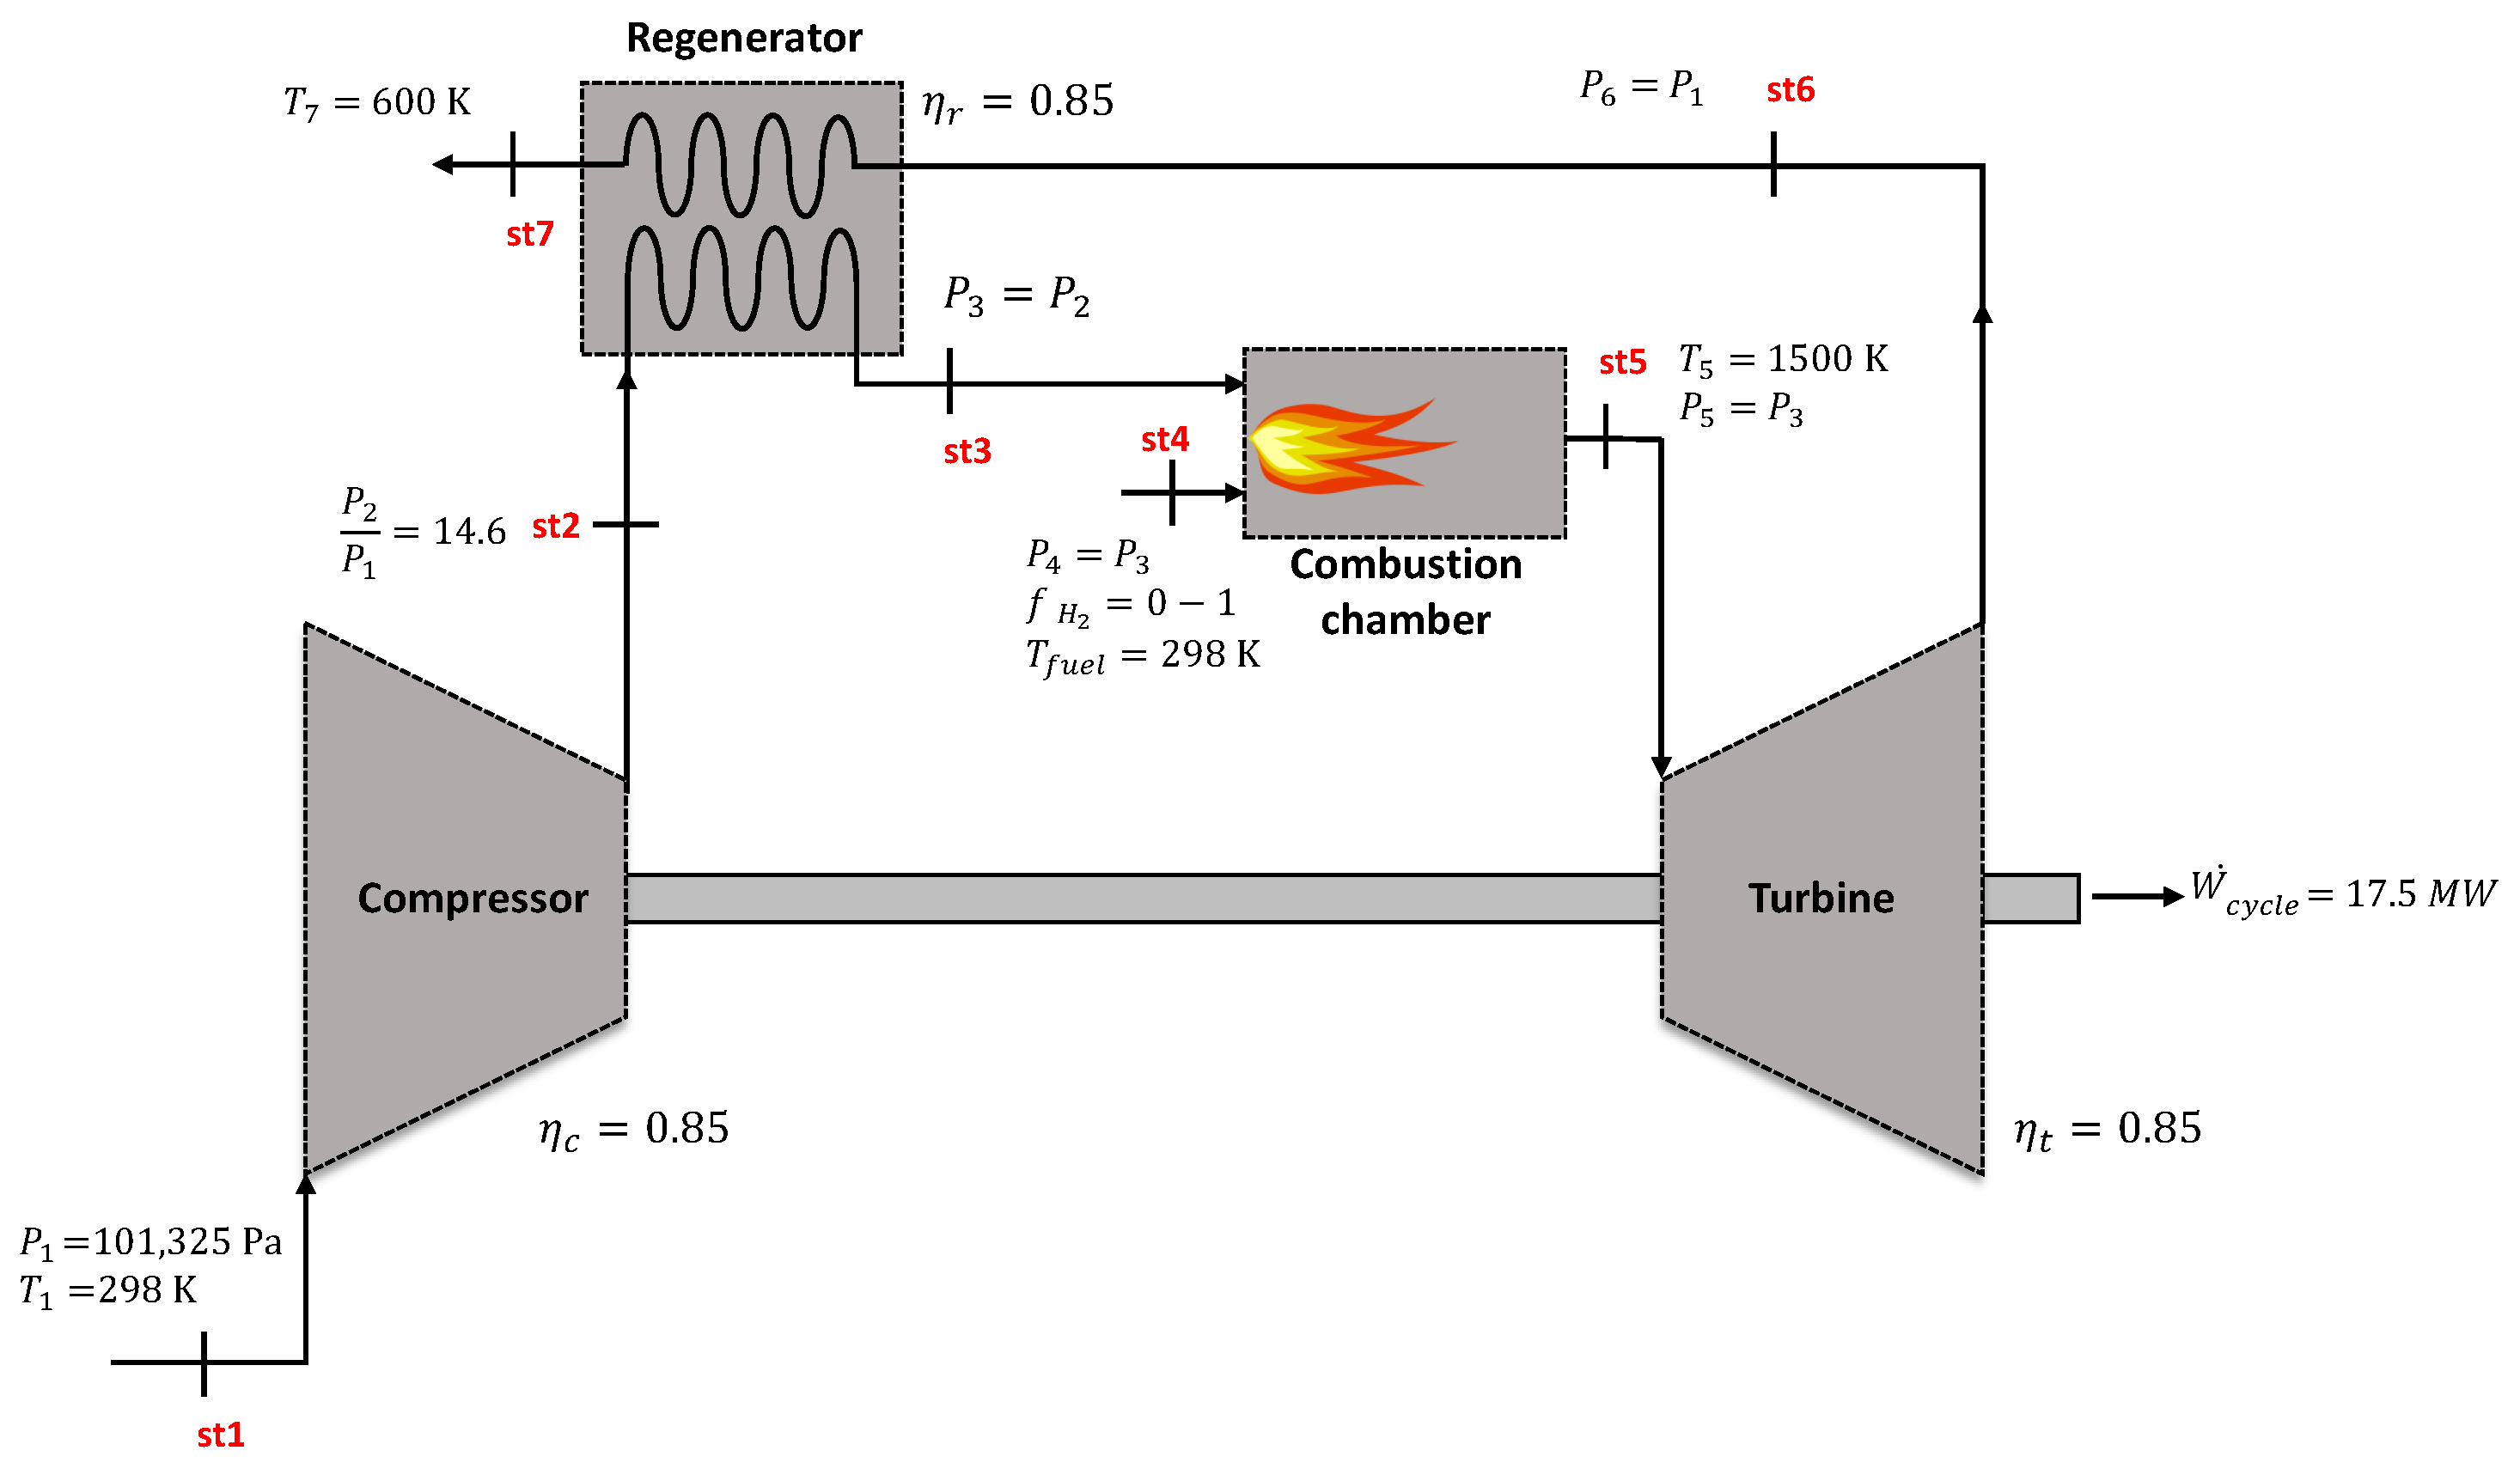
In order to approximate the present calculations to real industrial gas turbine conditions, the datasheet of the industrial natural gas turbine Siemens SGT-100 [18] was taken as reference, characterised by a net electrical power output of 5.1 MW, exhausts temperature of 818 K and a pressure ratio of 14:1 in the compressor. Those values were fixed as well as the inlet temperature in the gas turbine at T = 1500 K. As stated by [20], such temperatures may not exceed the 1700 K for reliable designs. The schematic view of the considered regenerative Brayton cycle is shown in Figure 2 including the mentioned design values.
Air is drawn into the compressor at ambient conditions, the pressure is increased up to with a pressure ratio of 14:1 and it is heated in the regenerator using the remaining energy in the exhaust gas mixture. The preheated air is then introduced into the combustion chamber together with the gaseous fuel, which is introduced at 298 K. The hydrogen fraction () was varied from 0 to 1 representing pure methane and pure hydrogen fuels, respectively. The combustion products expand in the gas turbine producing the net mechanical power of the cycle = 5.6 MW (assuming an efficiency of 90% between the turbine and the electric generator [21]), which is the difference between the power produced in the turbine and consumed by the compressor. The isentropic efficiencies in the compressor and turbine as well as the efficiency of the regenerator were fixed at 0.85 without loss of generality. Further information about the regenerative Brayton cycle and the T-s diagram of the process can be found in the literature [22,23].
Once the cycle is defined, the fact of having set the net power of the cycle, the temperature of the combustion products and the exhaust temperature results in different values for the main variables at each state for different values of , as shown next.
4. Governing Equations
Defining the enthalpy and entropies at each state highlighted in red in Figure 2 (from st1 to st7), the energy and entropy balances were solved at each subsystem. States (st1-st2-st3) were defined considering air as an ideal gas. The state (st4) accounts for an ideal gas mixture of H and CH and states (st5-st6-st7) were defined by an ideal gas mixture of CO, HO, N and O (combustion products).
A single-step reaction between H0–CH (st4) and air (st3) was considered [24]:
The fraction and represent the hydrogen volume fraction in the fuel mixture and the air-excess or air–fuel equivalence ratio, respectively. Hence, the relation between the air and fuel volumes (air–fuel ratio or AFR) can be defined as [24]:
This value was used to relate the volumetric air and fuel fluxes through Equation (3). It can be noted that the volumetric air flow depends on the values of and f. As shown below, such relation had a significant impact on the final results.
Expressing the single-step reaction depending on and , it is possible to define the mole fractions of the species in terms of such parameters [24]:
Thus, enthalpies and entropies at each state were defined using the mole fractions:
The EES code was used to calculate and for individual species j in terms of the temperature for the former and pressure and temperature for the latter [19,22]:
where and represent the specific heat of species j and the ideal gas constant, respectively. Here represents the reference pressure (101,325 Pa). It is worth to mention that (kJ/kmol) and (kJ/kmol K) units were used for enthalpies and entropies, respectively. Once the properties at each state were defined, the governing equations for the global system and each subsystem were solved.
4.1. Global System
Taking into account the global system, the net power of the cycle (5.6 MW), the energetic and exergetic efficiencies were defined as:
where and represent the net thermal power and the net exergy flux introduced to the combustion chamber, respectively. Temperature and pressure for the reference environment were defined as = 101,325 Pa and = 298 K.
4.2. Subsystems
The governing equations for each subsystem are summarised below, which complete the system of equations to be solved:
- Compressor:Isentropic expansion:Isentropic efficiency:Exergy destruction:Net power consumption:
- Regenerator:Efficiency:Exergy destruction:
- Combustion chamber:Net thermal power:Low heating value of the fuel ():Mass balance:Energy balance:Exergy destruction:Chemical exergy:
- Turbine:Isentropic expansion:Isentropic efficiency:Exergy destruction:Net power:
Those equations define the thermodynamic behaviour of the regenerative Brayton cycle considering ideal gases and the combustion process in the chamber.
It must be noted that the specific chemical exergies for hydrogen and methane ( and ) were taken from [22]. The equations system was solved through a parametric table for 20 values of ranging from 0 to 1.
5. Results
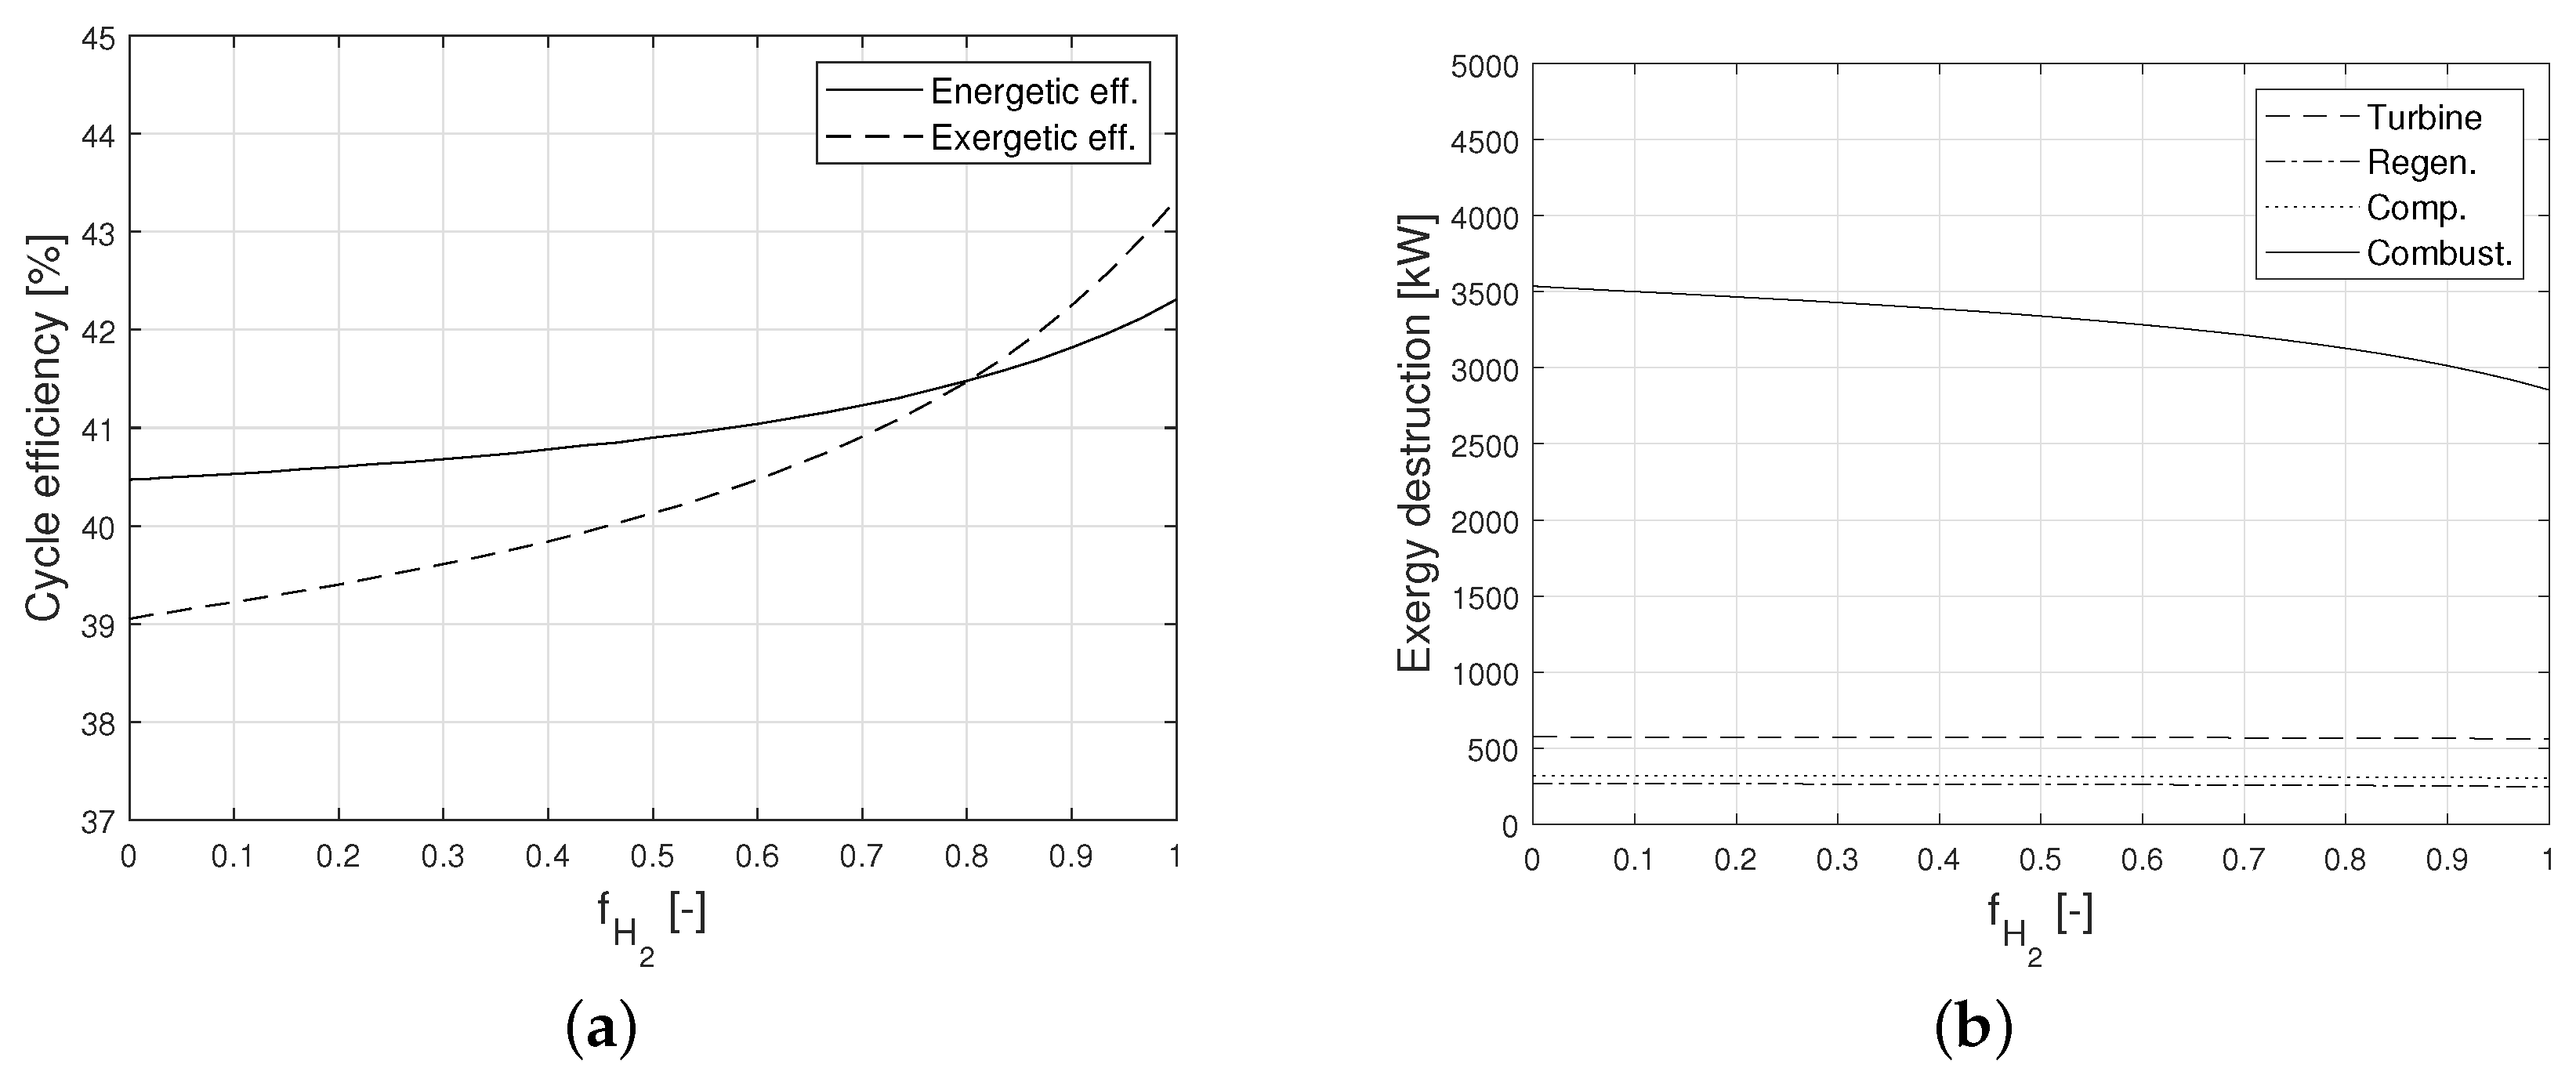
Results from Figure 3a demonstrate that both energetic and exergetic efficiencies increased while increasing . Despite the small differences of approximately 2–4%, higher efficiencies using pure hydrogen instead of pure methane were addressed, which may be important for cost reduction in large-scale power plants for long periods. The observed higher exergetic efficiencies for an increasing hydrogen content means that the higher the hydrogen content, the greater the fuel performance in terms of work production.
The main reason for the trend in Figure 3a can be explained by the exergy destruction rates from Figure 3b. Exergy destruction rates at the compressor, regenerator and turbine remained almost constant. Nevertheless, exergy destruction in the combustion chamber, which was the main source of irrevesibilities in the cycle (representing approximately the 25% of the introduced chemical exergy), decreased for higher values of .
Considering Equation (29), this trend for can be explained through the trends of the fuel, air and product entropies, which define the entropy destruction in the combustion chamber. This equation can also be expressed in terms of exergy destruction:
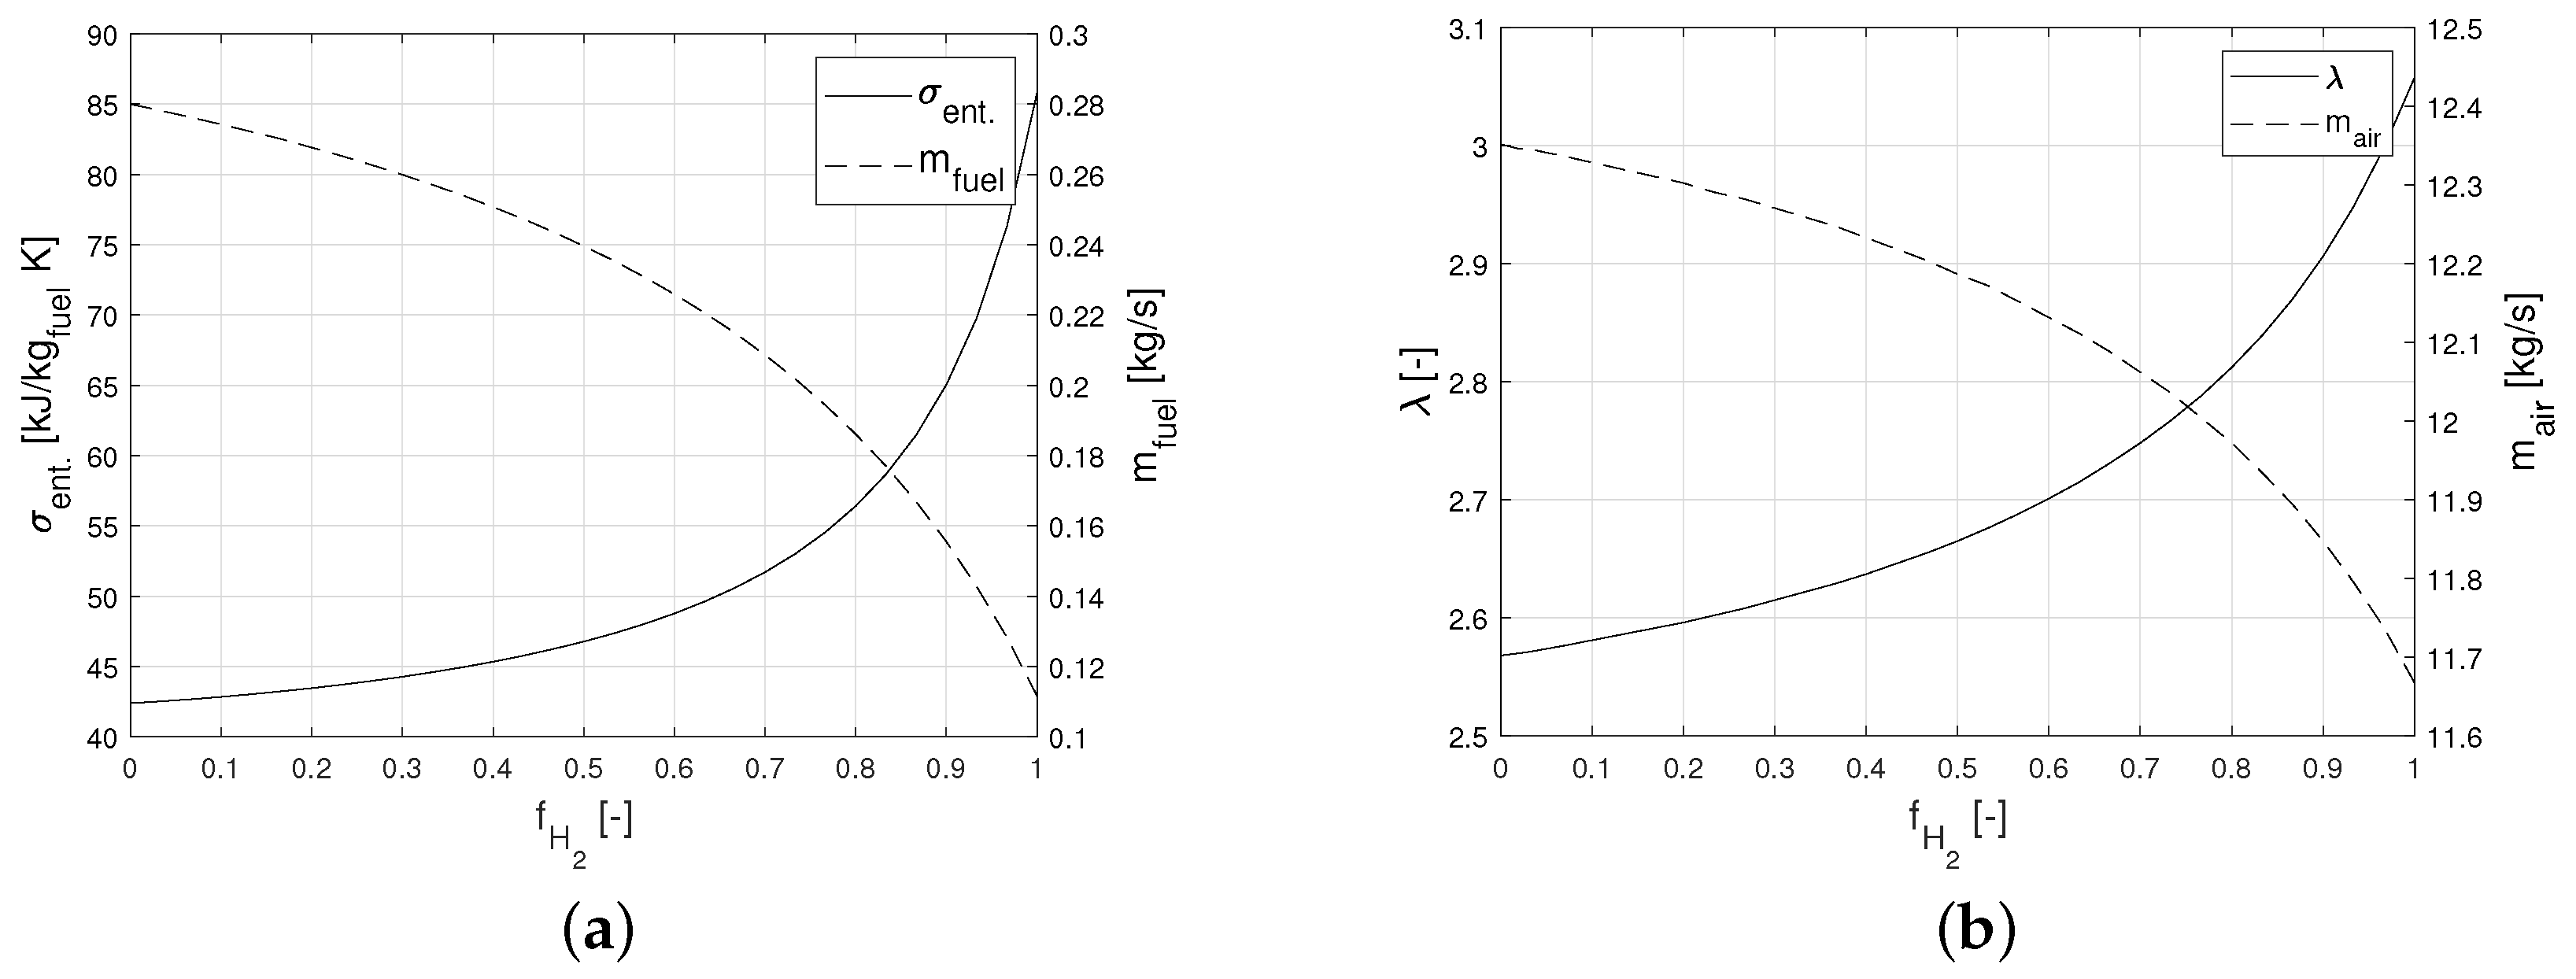
Defining the entropy destruction per unit fuel mass, Figure 4a demonstrates that the lower exergy destruction in the chamber is related to the lower fuel mass rate for increasing , despite the higher entropy destruction per unit of fuel mass.
It is also worth to mention that the higher the hydrogen content in the fuel, the higher the expected product temperatures due to the higher adiabatic temperature of hydrogen. Thus, since was fixed at 1500 K, air excess was increased for higher to maintain constant product temperatures as shown in Figure 4b. Accordingly, it is interesting to note that exergy destruction still remained lower for higher despite the higher values of .
Figure 4b also demonstrates that the air mass flux was lower for higher despite the higher values of . This could be explained through the governing one-step reaction from Equation (1). Considering pure methane ( = 0) and pure hydrogen ( = 1) at stoichiometric conditions ( = 1), one can conclude that hydrogen needs less air to be completely burnt compared to methane. This fact should be considered for the selection and sizing of the compressor.
The lower mass fuel rate for higher observed in Figure 4a is related to several parameters. Combining Equations (2) and (3) with Equation (14), an expression for can be derived in terms of the AFR:
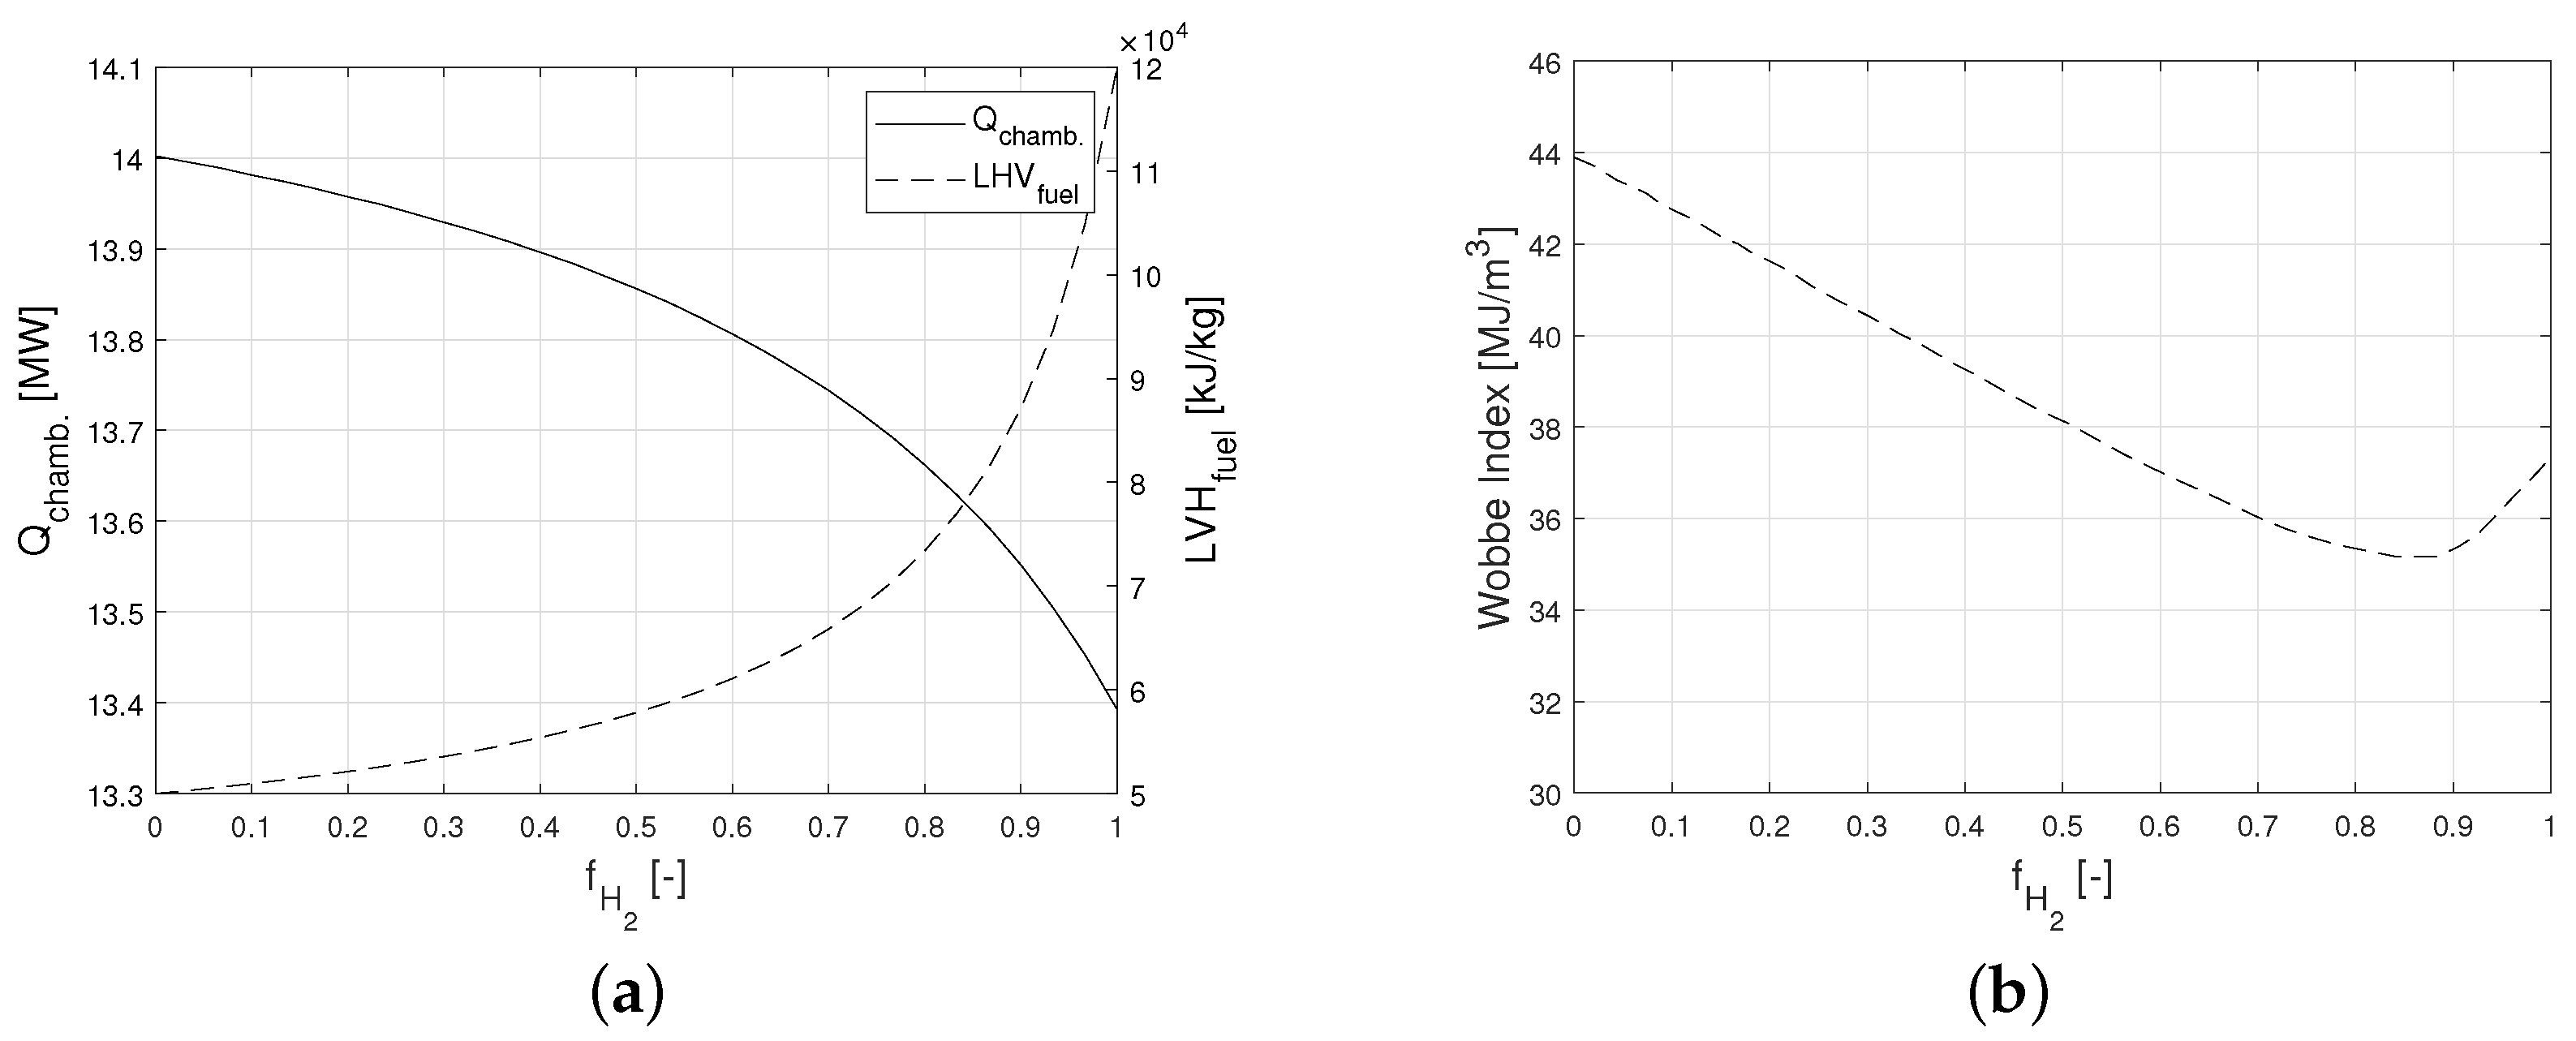
This property and the trend of led to a lower thermal power in the combustion chamber as depicted in Figure 5a. Hence, the same mechanical power of the cycle ( = 5.6 MW) was achieved with a lower thermal power output in the combustion chamber and a lower fuel mass consumption for increasing values of . It can be noted that the fuel consumption was reduced by almost 60% at = 1. Since the fuel costs were fixed per unit mass, this results qualitatively demonstrated that hydrogen can still be competitive even though its unitary cost is more than twice that of natural gas.
The obtained results may be complemented with the so-called Wobbe index (WI) for different values of . The WI is commonly used to measure the interchangeability of gaseous fuels and compares the thermal output of different fuels for a given combustion chamber or burner geometry. Two fuels with the same WI would have the same thermal power output for a constant chamber geometry, pressure and temperature conditions. It is expressed in terms of the high heating values (HHV) and densities of the considered fuels and the density of air [25]:
As shown in Figure 5b, for > 0.6 the WI reaches a minimum at 0.85 and returns to the value it had at 0.6 when reaching = 1. This fact indicates that the WI value is well bounded for > 0.6, showing that the changes it undergoes are minimal compared to the decreasing trend from = 0 up to 0.6. Thus, a good interchangeability can be expected at > 0.6. However, for methane rich mixtures at < 0.6 the WI increased, concluding that for a given combustion chamber or burner geometry the value of should be precisely defined. As stated by Y. Zhao et al. [25], the WI cannot be used as the only parameter to measure the interchangeability between hydrogen and methane due to the different combustion characteristics mainly related to the flammability limits, flame speeds and temperatures.
Taking into account the present results, a similar thermal output () could be expected for > 0.6. However, the obtained from Figure 5a showed a decreasing trend since the products temperature was fixed at 1500 K and varied with to meet such a temperature target. Therefore, it can also be said that not only the WI or the combustion characteristics should be taken into account to assess the interchangeability of hydrogen and methane in a given combustion system, but also the overall behaviour of the thermodynamic cycle.
6. Conclusions
Considering a Brayton regenerative cycle corresponding to a particular industrial natural gas turbine, a qualitative thermodynamic analysis was performed varying the hydrogen fraction in methane () up to 100% H (vol %). A system analysis was carried out so as to assess the evolution of the global energetic and exergetic efficiencies as well as the impact on the cycle behaviour. The thermodynamic analysis treated the subsystems of the gas turbine as black boxes rather than going into the details of the individual components that make one turbine different from another. This fact makes it possible to generalise the conclusions of this study to other gas turbines with similar operating conditions.
Results demonstrated that the global exergetic efficiency increased by 5% from = 0 to 1 while the thermal efficiency increased by 2%. Such a difference may be related to the higher nonlinear behaviour of the irreversibilities (second law) compared to the differences related to the energy conservation (first law).
As expected, the combustion chamber presented the highest exergy destruction rates (3500–2700 kW), which were reduced for higher values of . Such a reduction was related to the lower fuel mass consumption rate and therefore the lower thermal power in the combustion chamber when varying from 0 to 1. This fact qualitatively showed that hydrogen can still be competitive even though its cost per unit mass is more than twice that of natural gas.
Although the present study served to draw initial qualitative results with interesting conclusions, a further analysis is needed, considering more detailed equations for the turbine and compressor based on turbomachinery theory and design, and considering the different compression and expansion stages, the velocity diagrams and stator and rotor losses, among others.
Author Contributions
Conceptualization, G.L.-R. and J.M.B.-I.; methodology, G.L.-R.; software, G.L.-R. and J.C.-L.; formal analysis, G.L.-R. and J.C.-L.; writing—original draft preparation, G.L.-R.; writing—review and editing, J.C.-L. and J.M.B.-I. All authors have read and agreed to the published version of the manuscript.
Funding
This research received no external funding.
Acknowledgments
The authors would like to thank the University of the Basque Country through the research group (GIU19/029), (IT1314-19).
Conflicts of Interest
The authors declare no conflict of interest.
Nomenclature
| Abbreviations | |
| AFR | Air–fuel ratio |
| CCPP | Combined cycle power plant |
| CFD | Computational fluid dynamics |
| EES | Engineering Equation Solver |
| HHV | High heating value |
| LHV | Low heating value |
| MW | Molecular weight |
| P2G | Power to gas |
| WI | Wobbe index |
| Latin symbols | |
| specific heat (kJ/kmol K) | |
| Flow exergy (kJ/kmol) | |
| Volumetric hydrogen fraction (-) | |
| Enthaply of individual species j (kJ/kmol) | |
| Mass flow rate (kg/s) | |
| Volumetric flow rate (kmol/s) | |
| P | Pressure (Pa) |
| Thermal power (kW) | |
| Ideal gas constant (kJ/K kmol) | |
| Entropy of individual species j (kJ/kmol K) | |
| Specific entropy of individual species j (kJ/kmol K) | |
| T | Temperature (K) |
| W | Power (kW) |
| i Species mole fraction (-) | |
| Greek symbols | |
| Efficiencies (-) | |
| Air excess (-) | |
| Density (kg/m) | |
| Entropy destruction (kJ/kmol K) |
References
- Ivanova, A.; Domínguez-García, J.L.; Corchero, C. Frequency Support Markets and Wind Power Integration. Energies 2021, 14, 7450. [Google Scholar] [CrossRef]
- Olabi, A.G.; Onumaegbu, C.; Wilberforce, T.; Ramadan, M.; Abdelkareem, M.A.; Al-Alami, A.H. Critical review of energy storage systems. Energy 2021, 214, 118987. [Google Scholar] [CrossRef]
- AlShafi, M.; Bicer, Y. Thermodynamic performance comparison of various energy storage systems from source-to-electricity for renewable energy resources. Energy 2021, 219, 119626. [Google Scholar] [CrossRef]
- Kopp, M.; Coleman, D.; Stiller, C.; Scheffer, K.; Aichinger, J.; Scheppat, B. Energiepark Mainz: Technical and economic analysis of the worldwide largest Power-to-Gas plant with PEM electrolysis. Int. J. Hydrogen Energy 2017, 42, 13311–13320. [Google Scholar] [CrossRef]
- Hou, P.; Enevoldsen, P.; Eichman, J.; Hu, W.; Jacobson, M.Z.; Chen, Z. Optimizing investments in coupled offshore wind-electrolytic hydrogen storage systems in Denmark. J. Power Sources 2017, 359, 186–197. [Google Scholar] [CrossRef]
- Thema, M.; Sterner, M.; Lenck, T.; Götz, P. Necessity and Impact of Power-to-gas on Energy Transition in Germany. Energy Procedia 2016, 99, 392–400. [Google Scholar] [CrossRef] [Green Version]
- Proyecto BenortH2. Available online: https://www.benorth2.com/en/ (accessed on 21 July 2021).
- Tekin, N.; Ashikaga, M.; Horikawa, A.; Funke, D.I.H. Enhancement of fuel flexibility of industrial gas turbines by development of innovative hydrogen combustion systems. Gas Energy 2019, 2, 1–6. [Google Scholar]
- ENT. ETN GLOBAL, The Path towards a Zero-Carbon Gas Turbine. Technical Report. 2021. Available online: https://etn.global/wp-content/uploads/2020/01/ETN-Hydrogen-Gas-Turbines-report.pdf (accessed on 20 October 2021).
- Xin, Y.; Wang, K.; Zhang, Y.; Zeng, F.; He, X.; Takyi, S.A.; Tontiwachwuthikul, P. Numerical Simulation of Combustion of Natural Gas Mixed with Hydrogen in Gas Boilers. Energies 2021, 14, 6883. [Google Scholar] [CrossRef]
- Lopez-Ruiz, G.; Alava, I.; Urresti, I.; Blanco, J.M.; Naud, B. Experimental and numerical study of NOx formation in a domestic H2/air coaxial burner at low Reynolds number. Energy 2021, 221, 119768. [Google Scholar] [CrossRef]
- Lopez-Ruiz, G.; Alava, I.; Blanco, J. Study on the feasibility of the micromix combustion principle in low NOx H2 burners for domestic and industrial boilers: A numerical approach. Energy 2021, 236, 121456. [Google Scholar] [CrossRef]
- Ranjan, R.; Clemens, N.T. Insights into flashback-to-flameholding transition of hydrogen-rich stratified swirl flames. Proc. Combust. Inst. 2021, 38, 6289–6297. [Google Scholar] [CrossRef]
- Pyo, M.J.; Moon, S.W.; Kim, T.S. A Comparative Feasibility Study of the Use of Hydrogen Produced from Surplus Wind Power for a Gas Turbine Combined Cycle Power Plant. Energies 2021, 14, 8342. [Google Scholar] [CrossRef]
- Abadie, L.M. Energy Market Prices in Times of COVID-19: The Case of Electricity and Natural Gas in Spain. Energies 2021, 14, 1632. [Google Scholar] [CrossRef]
- Iberian Gas Market. Annual Results 2021. Available online: https://www.mibgas.es/en (accessed on 21 July 2021).
- Nishida, K.; Takagi, T.; Kinoshita, S. Analysis of entropy generation and exergy loss during combustion. Proc. Combust. Inst. 2002, 29, 869–874. [Google Scholar] [CrossRef]
- Siemens Gas Turbine Portfolio. Data-Sheet SGT-100 Industrial Turbine. Technical Report. 2021. Available online: http://www.soar.hk/pdf/Siemens.GT.SGT100.pdf (accessed on 4 November 2021).
- Klein, S.A. EES—Engineering Equation Solver, 2020 F-Chart Software. Available online: http://fchart.com (accessed on 5 December 2021).
- Álvarez Tejedor, T. 9—Gas turbine materials selection, life management and performance improvement. In Power Plant Life Management and Performance Improvement; Oakey, J.E., Ed.; Woodhead Publishing Series in Energy; Woodhead Publishing: Sawston, UK, 2011; pp. 330–419. [Google Scholar] [CrossRef]
- Vera, D.; Jurado, F.; de Mena, B.; Schories, G. Comparison between externally fired gas turbine and gasifier-gas turbine system for the olive oil industry. Energy 2011, 36, 6720–6730. [Google Scholar] [CrossRef]
- Moran, M.; Shapiro, H.; Boettner, D.; Bailey, M. Fundamentals of Engineering Thermodynamics, 8th ed.; Wiley: Hoboken, NJ, USA, 2014. [Google Scholar]
- Regenerative Brayton Cycle. Available online: https://www.sciencedirect.com/topics/engineering/regenerative-brayton-cycle (accessed on 5 January 2022).
- Schiro, F.; Stoppato, A.; Benato, A. Modelling and analyzing the impact of hydrogen enriched natural gas on domestic gas boilers in a decarbonization perspective. Carbon Resour. Convers. 2020, 3, 122–129. [Google Scholar] [CrossRef]
- Zhao, Y.; Mcdonell, V.; Samuelsen, S. Influence of hydrogen addition to pipeline natural gas on the combustion performance of a cooktop burner. Int. J. Hydrogen Energy 2019, 44, 12239–12253. [Google Scholar] [CrossRef]
Figure 1.
Monthly evolution of the average weighted price of natural gas for 2021 [16].
Figure 1.
Monthly evolution of the average weighted price of natural gas for 2021 [16].

Figure 2.
Schematic view of the regenerative Brayton cycle indicating the I/O conditions.

Figure 3.
(a) Energetic and exergetic efficiencies. (b) Exergy destruction at each subsystem depending on the hydrogen content.
Figure 3.
(a) Energetic and exergetic efficiencies. (b) Exergy destruction at each subsystem depending on the hydrogen content.

Figure 4.
(a) Specific entropy destruction and hydrogen flow rate. (b) Air excess and air flow rate, depending on the hydrogen content.
Figure 4.
(a) Specific entropy destruction and hydrogen flow rate. (b) Air excess and air flow rate, depending on the hydrogen content.

Figure 5.
(a) Thermal power and of the fuel mixture. (b) Wobbe index for H/CH mixtures.

Publisher’s Note: MDPI stays neutral with regard to jurisdictional claims in published maps and institutional affiliations. |
© 2022 by the authors. Licensee MDPI, Basel, Switzerland. This article is an open access article distributed under the terms and conditions of the Creative Commons Attribution (CC BY) license (https://creativecommons.org/licenses/by/4.0/).
Share and Cite
MDPI and ACS Style
Lopez-Ruiz, G.; Castresana-Larrauri, J.; Blanco-Ilzarbe, J.M. Thermodynamic Analysis of a Regenerative Brayton Cycle Using H2, CH4 and H2/CH4 Blends as Fuel. Energies 2022, 15, 1508. https://doi.org/10.3390/en15041508
AMA Style
Lopez-Ruiz G, Castresana-Larrauri J, Blanco-Ilzarbe JM. Thermodynamic Analysis of a Regenerative Brayton Cycle Using H2, CH4 and H2/CH4 Blends as Fuel. Energies. 2022; 15(4):1508. https://doi.org/10.3390/en15041508
Chicago/Turabian StyleLopez-Ruiz, Gontzal, Joseba Castresana-Larrauri, and Jesús María Blanco-Ilzarbe. 2022. "Thermodynamic Analysis of a Regenerative Brayton Cycle Using H2, CH4 and H2/CH4 Blends as Fuel" Energies 15, no. 4: 1508. https://doi.org/10.3390/en15041508
Note that from the first issue of 2016, this journal uses article numbers instead of page numbers. See further details here.