
Effect of Double-Sided 3D Patterned Cathode Catalyst Layers on Polymer Electrolyte Fuel Cell Performance


Department of Chemical Engineering, Faculty of Engineering, Kyushu University, 744 Motooka, Nishi-ku, Fukuoka 819-0395, Japan
*
Author to whom correspondence should be addressed.
Energies 2022, 15(3), 1179; https://doi.org/10.3390/en15031179
Submission received: 20 December 2021
/
Revised: 24 January 2022
/
Accepted: 1 February 2022
/
Published: 5 February 2022
(This article belongs to the Collection Batteries, Fuel Cells and Supercapacitors Technologies)
Abstract
:Optimization of the structure of cathode catalyst layers (CCLs) for promoting the transfer of reactants and products in polymer electrolyte fuel cells (PEFCs) is important for improving the cell performance. In this study, using theoretical equations, we confirmed that the shortened proton conduction path in the ionomer layer (IL) with a 3D-patterned structure, compared to that in the IL with a flat-patterned structure, can improve the cell performance. We experimentally investigated the effect of the IL with a 3D-patterned structure included in the CCLs on the cell performance. Based on the combination of the flat- or 3D-pattern of the IL and the catalyst layer (CL), the samples were categorized as Str. 1 (3D-patterned CL without IL), Str. 2 (flat-patterned IL and CL), Str. 3 (3D-patterned IL and flat-patterned CL), and Str. 4 (3D-patterned IL and CL). All of the samples had different morphologies. According to the I–V curves and impedance spectra data acquired at 80 °C and 40% relative humidity, Str. 4 showed superior cell performance relative to those of the other CCLs. These results indicate that the structure of Str. 4 enhanced the proton conductivity at a low humidity at which proton conduction is usually poor, thereby resulting in improved cell performance.
1. Introduction
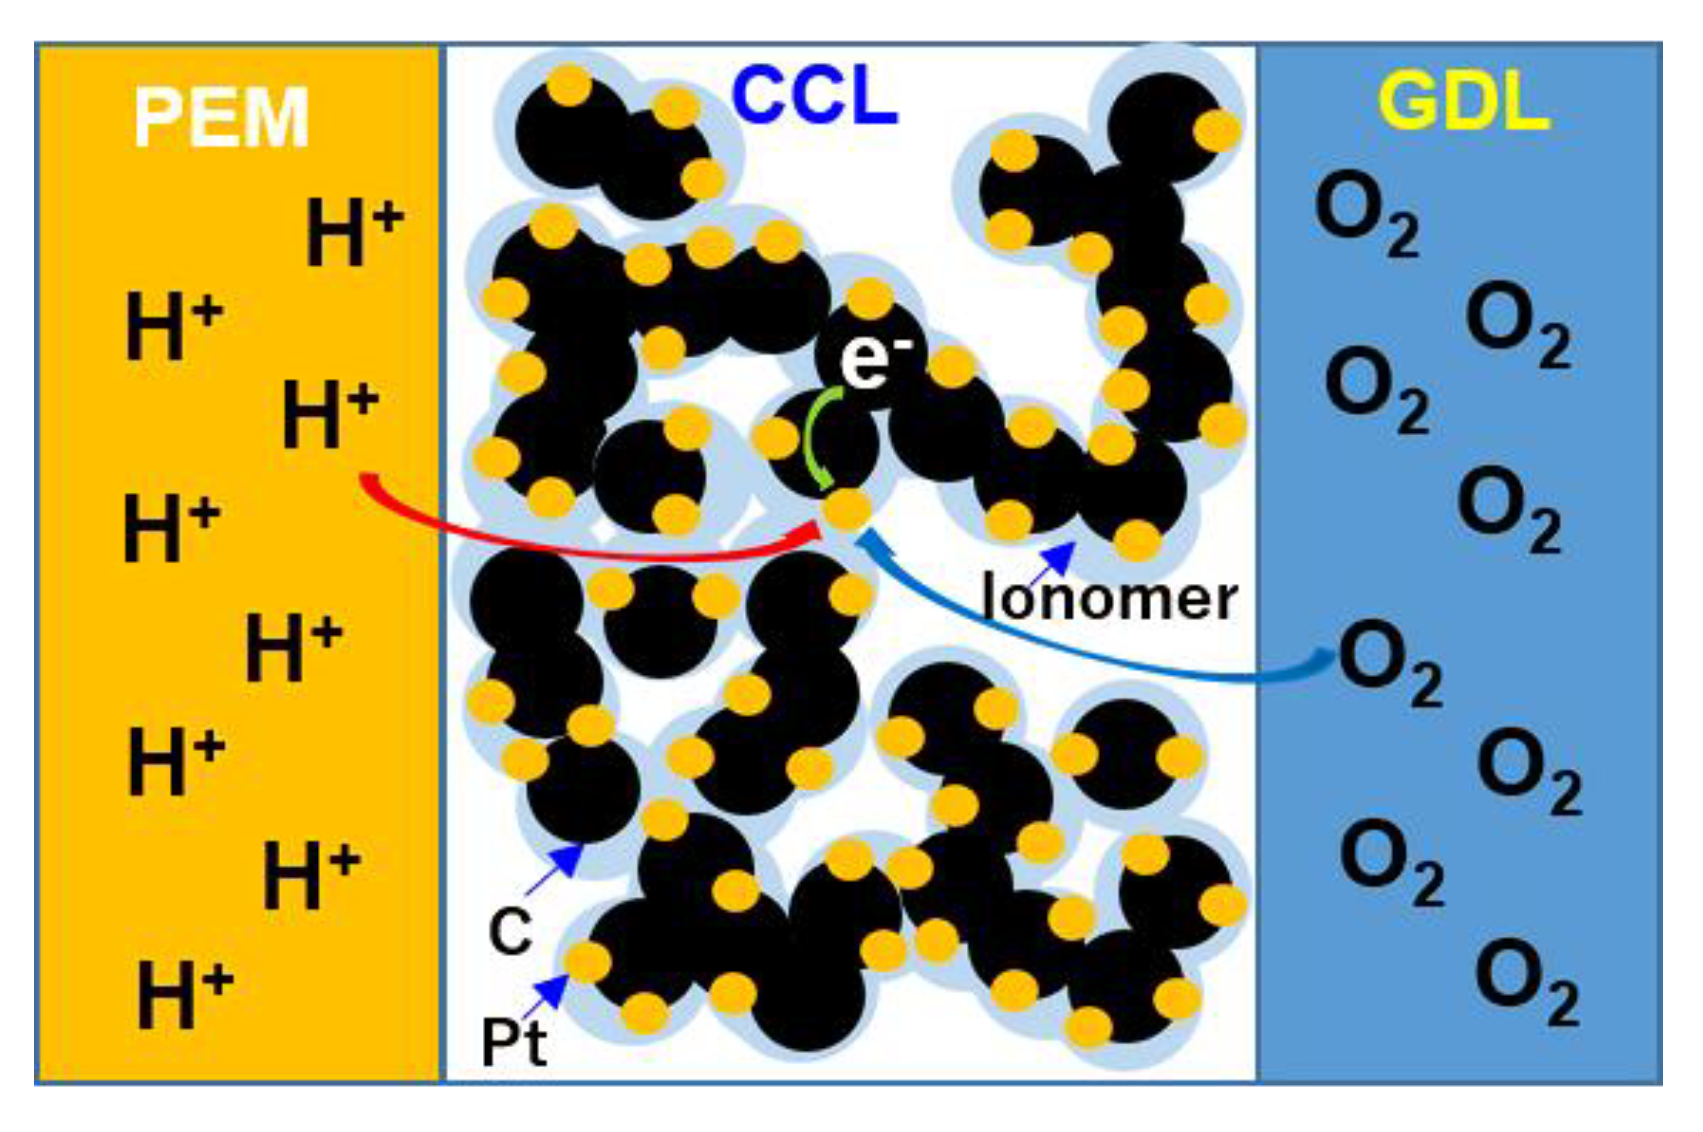
Polymer electrolyte fuel cells (PEFCs) are a promising and environmentally friendly alternative power source for achieving carbon neutrality. The current PEFC manufacturing technology typically requires either the maximum utilization of Pt catalysts for reducing the use of expensive Pt or the development of non-Pt catalysts. Moreover, PEFCs should exhibit superior performance to ensure their widespread application. The cell performance is related to the optimization of the membrane electrode assembly (MEA). The MEA consists of an anode catalyst layer (ACL), a cathode catalyst layer (CCL), and a polymer electrolyte membrane (PEM) that prevents the contact between the anode and the cathode as shown in Figure 1. Because the oxygen reduction reaction (ORR) at the cathode is slower than the hydrogen oxidation reaction at the anode, a large amount of Pt is wasted in the cathode. Thus, to improve the performance of PEFCs, it is important to optimize the structure of CCL in order to promote the transfer of reactants such as oxygen and proton and products such as water.
The electrons traverse the carbon materials that support the Pt nanoparticles in the CCLs, thereby helping to reduce the Pt usage by changing the morphology of the carbon. In addition, the protons pass through the PEM from the ACL and move to Pt particles through an ionomer included in the CCLs. Oxygen also reaches the Pt particles through the void spaces in the CCLs. If each reactant can smoothly reach the Pt particles, the ORR kinetics will be accelerated, resulting in improved cell performance. Thus, many studies have investigated catalyst inks containing carbon-supported Pt catalysts, solvents, and ionomers for influencing the ionomer distribution within the CCLs, which is expected to affect the cell performance [1,2,3]. Moreover, various methods, such as doctor blade coating, brush painting, spraying, and inkjet printing, have been used to fabricate CCLs [4,5,6,7]. In particular, inkjet printing is considered to be an economical and easily scalable technology for microscale patterning and fabrication of a variety of applications because it allows patterning with various inks. Additionally, it can reduce the processing time and lower the manufacturing cost [8]. Inkjet technology is very easy to use to produce patterned films, and as a result, unit cost and defect rate can be reduced, and there is flexibility in manufacturing. However, in a small amount, it becomes uniform, but in a large amount, there is a risk of ink aggregation in the nozzle head, so there is a limit to this. In addition, inkjet technology is valuable because it has the greatest advantage that it can be applied to various research regardless of fields. While other fuel cell technologies are applied in large quantities, inkjet technology can reduce the cost even more because only the relevant part is applied. Therefore, inkjet printing technology for producing 3D structures is used not only in the field of electrochemistry, but also in various other fields.
Because 3D inkjet printing technologies can be utilized to control the structural properties, improve the electrochemical performance, and increase the ionic conductivity, active area, and gas diffusion rate, they can be applied to various fields related to fuel cells during the last decade, as shown Table 1 [9,10,11,12,13,14,15,16,17,18,19,20,21,22,23]. For example, 3D printing technology can improve the characteristics of sintered ceramic molds [24]. For solid oxide fuel cells (SOFCs), 3D printing technology can circumvent the exhausting and time-consuming procedure for module production, render complex shapes more conveniently, and produce particles of various sizes and viscosities. It was used to prevent cracks and increase the heat transfer potential [25]. Due to its wide range of applications, 3D inkjet printing technology can be used to fabricate CCLs for high-performance PEFCs.
In our previous study [26], 3D-structural CCLs were fabricated using the inkjet printing method to increase the surface area of CCLs in order to decrease the oxygen transport resistance. Thus, the 3D-structural CCLs with improved performance at 100% relative humidity (RH) over the flat-structured CCLs were fabricated. However, because a low ionomer content was used (ionomer/carbon (I/C) ratio of 0.25), the cell performance was expected to deteriorate at low humidity. The proton conductivity of the Nafion film is strongly influenced by the amount of water present in the film, with the highest proton conductivity obtained when the film is completely saturated with water at high RH [27,28]. When PEFC is operated at low RH, membrane dehydration occurs, and proton conductivity decreases significantly. Therefore, to achieve higher cell performance, it is important to design effective ionomer structures that can facilitate high proton conduction even at a low RH.
In this study, we designed CCL structures with short proton conduction paths and supplemented them with sufficient ionomers by adding the ionomer layer (IL). First, using theoretical equations, we confirmed that the shortened path of proton conduction in the IL with a 3D-patterned structure compared to that in the IL with a flat-patterned structure can improve the cell performance. We experimentally investigated the effect of 3D-patterned ILs included in CCLs on the cell performance. To fabricate this structure, we coated the IL or catalyst layer (CL) with flat or 3D patterns using the inkjet printing method. Various CCL structures obtained by combining the IL and CL were analyzed and electrochemically evaluated at 80 °C and 100% and 40% RHs. Our study demonstrates that different morphologies of the CCLs have different effects on the cell performance.

Table 1.
Related works on inkjet printing in the last decade.
| Year | Material | Result | Ref |
|---|---|---|---|
| 2011–2015 | Ag/SPE/Pt atomic Catalyst ink MWCNT Lithium Nafion-Ultrathin film | Long cycle, stable, increased cell performance | [13,14,15,16,17,18] |
| 2016–2021 | Cellulose nano composite Catalyst ink Yttria-stabilized- zirconiaSolvent | Low cost, increased cell performance | [19,20,21,22,23] |
2. Theoretical Estimation
In a previous study [26], CLs with flat or 3D structures were theoretically analyzed. In this study, the IL of the proton channel was structured, and a theoretical equation was used to understand the effect of the 3D patterned structure. We converted the oxygen-related equations into the proton-related equations. The Butler–Volmer equation was converted into a first-order reaction with the assumption that the reaction was isothermal and limited by the oxygen diffusion in the CCL as follows.
where is the current density on the Pt surface, is Faraday’s constant, is the exchange current density, is the reference oxygen concentration, is the effective Pt surface area per local volume, n is the- number of electrons, is the charge transfer coefficient, is the gas constant, is the temperature, is the local overvoltage, is Henry’s coefficient, and is the oxygen concentration in the local pore space.
Here, is the first-order reaction coefficient of oxygen and introduced to the Thiele modulus’s equation. Thiele modulus is the ratio of the rate of reaction to the rate of diffusion of a reactant. When the coefficient is large, the reaction rate is controlled by diffusion, and the kinetically controlled reaction becomes insignificant. When the coefficient is small, the reaction rate is kinetically controlled, and the diffusion-controlled reaction is insignificant [29]. Herein, the Thiele modulus was used to estimate the effectiveness factor of the CCLs. The Thiele modulus is a dimensionless quantity and can be expressed in terms of and LD, as follows:
Next, Thiele modulus and diffusion length were introduced to explain the effect of CL on the cell performance. The diffusion lengths of the reactant on the CCLs (LD) were calculated using the following equation:
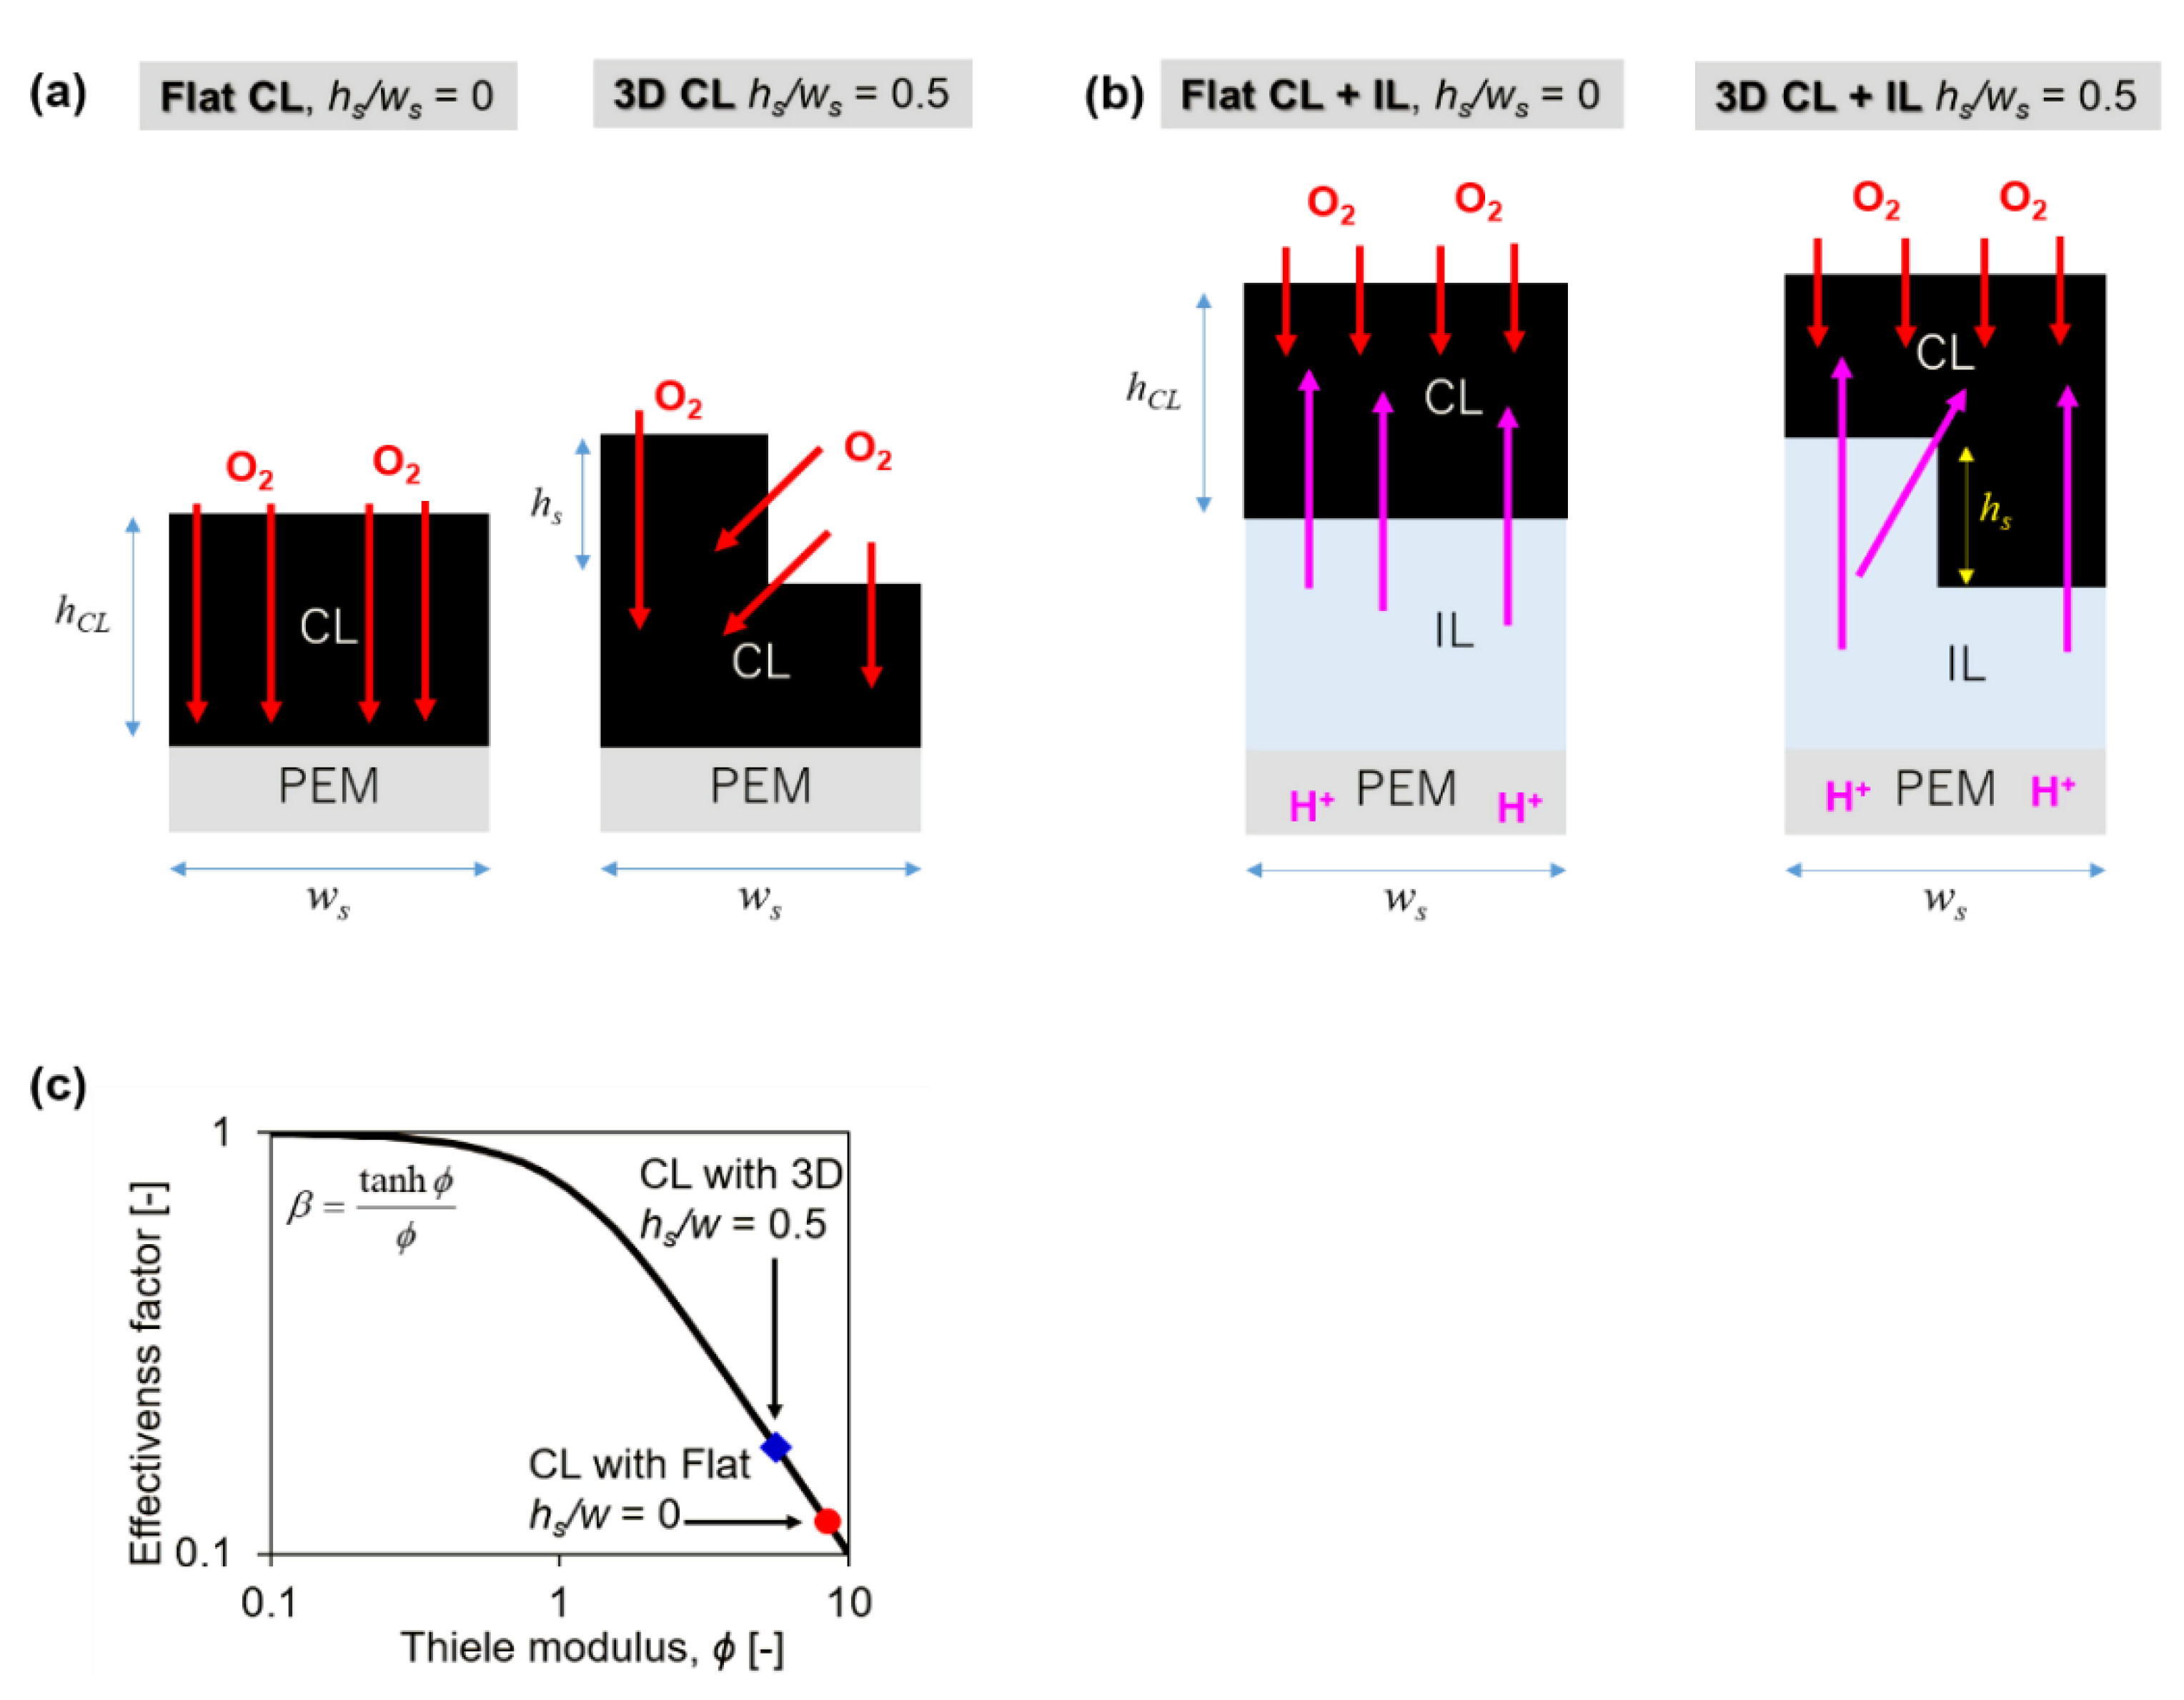
Here, ws is the gap width, ℎs is the gap height, and ℎCL is the thickness of the catalyst layer (Figure 2). The effective oxygen diffusion coefficient, was calculated using the following relation:
Here, is the bulk oxygen diffusion coefficient [30]. As mentioned above, the Thiele modulus was used to estimate the effectiveness factor of the CLs. An effectiveness factor in the range of 0–1 for isothermal conditions indicates the importance of diffusion and kinetic limitations and can also be considered as the number of reactants that penetrate the CL [31]. The effectiveness factor (β) is expressed as follows:
Relating the Butler–Volmer equation to the proton, was expressed by assuming that the reaction was isothermal and limited by proton conductivity in the IL as follows [31]:
The purpose of this study is to coat the IL, which is the path for the proton, in order to improve the proton conductivity. Thus, we consider the equations related to protons. Expressing Equation (7) as the Taylor equation, exp (x) ≒ 1 + x, we have,
where is the equilibrium potential, is proton potential, and is electron potential. The Butler–Volmer equation (Equation (9)) was converted into a first-order reaction by introducing Equation (10) with the assumption that the reaction was isothermal and limited by the oxygen diffusion in the CCL as follows:
Here, is the first-order reaction coefficient of the proton.
In the case of the IL being related to proton, the Thiele modulus could also be used to estimate the effectiveness factor of the CCLs. The Thiele modulus is a dimensionless quantity and can be expressed in terms of and LC,
as follows:
Next, Thiele modulus and diffusion length were introduced to explain the effect of CL on the cell performance. The diffusion lengths of the reactant on the CCLs (Lc) were calculated using the following equation:
is the relative proton conductivity, expressed as the following equation [32]:
where is the proton conductivity of the ionomer, is the ionomer and carbon weight ratio and is the volume ratio of the carbon black.
In Figure 2a, the CL with a 3D structure has a larger contact surface area with oxygen than that of a flat structure. When these structures were calculated based on the diffusion length of the reactants expressed in Equation (4), the diffusion length at the CL with the 3D structure is shorter than that of the flat structure. When calculated by applying the diffusion length of these structures to the Thiele modulus of Equation (3), the value of Thiele modulus is higher as the diffusion length is longer. Thus, the value of the CL with a 3D structure is smaller than that of the flat structure. As a result, in the graph of the relationship between the effectiveness factor and Thiele modulus shown in Figure 2c, it can be seen that the effectiveness factor of CL with 3D structure is higher than that of CL with the flat structure. This indicates that the 3D structure can lead to an improvement in the cell performance. On the other hand, IL with the 3D structure for shortening the proton conduction path and improving proton conductivity can be calculated as the Thiele modulus expressed in Equation (11). In Figure 2b, CL also has a 3D structure in the boundary structure between CL and IL with the 3D structure. Even if IL exists, the effectiveness factor depends on the 3D structure of CL because the reaction does not occur at IL. Thus, as the structure of CL changes, it corresponds to the effect of CL with the 3D structure on the cell performance shown in Figure 2c. In this study, we theoretically estimated the enhancement of proton conduction by the addition of IL with flat or 3D, and performed experiments to confirm the structural influence on the cell performance.
3. Experimental Section
3.1. Preparation of MEA
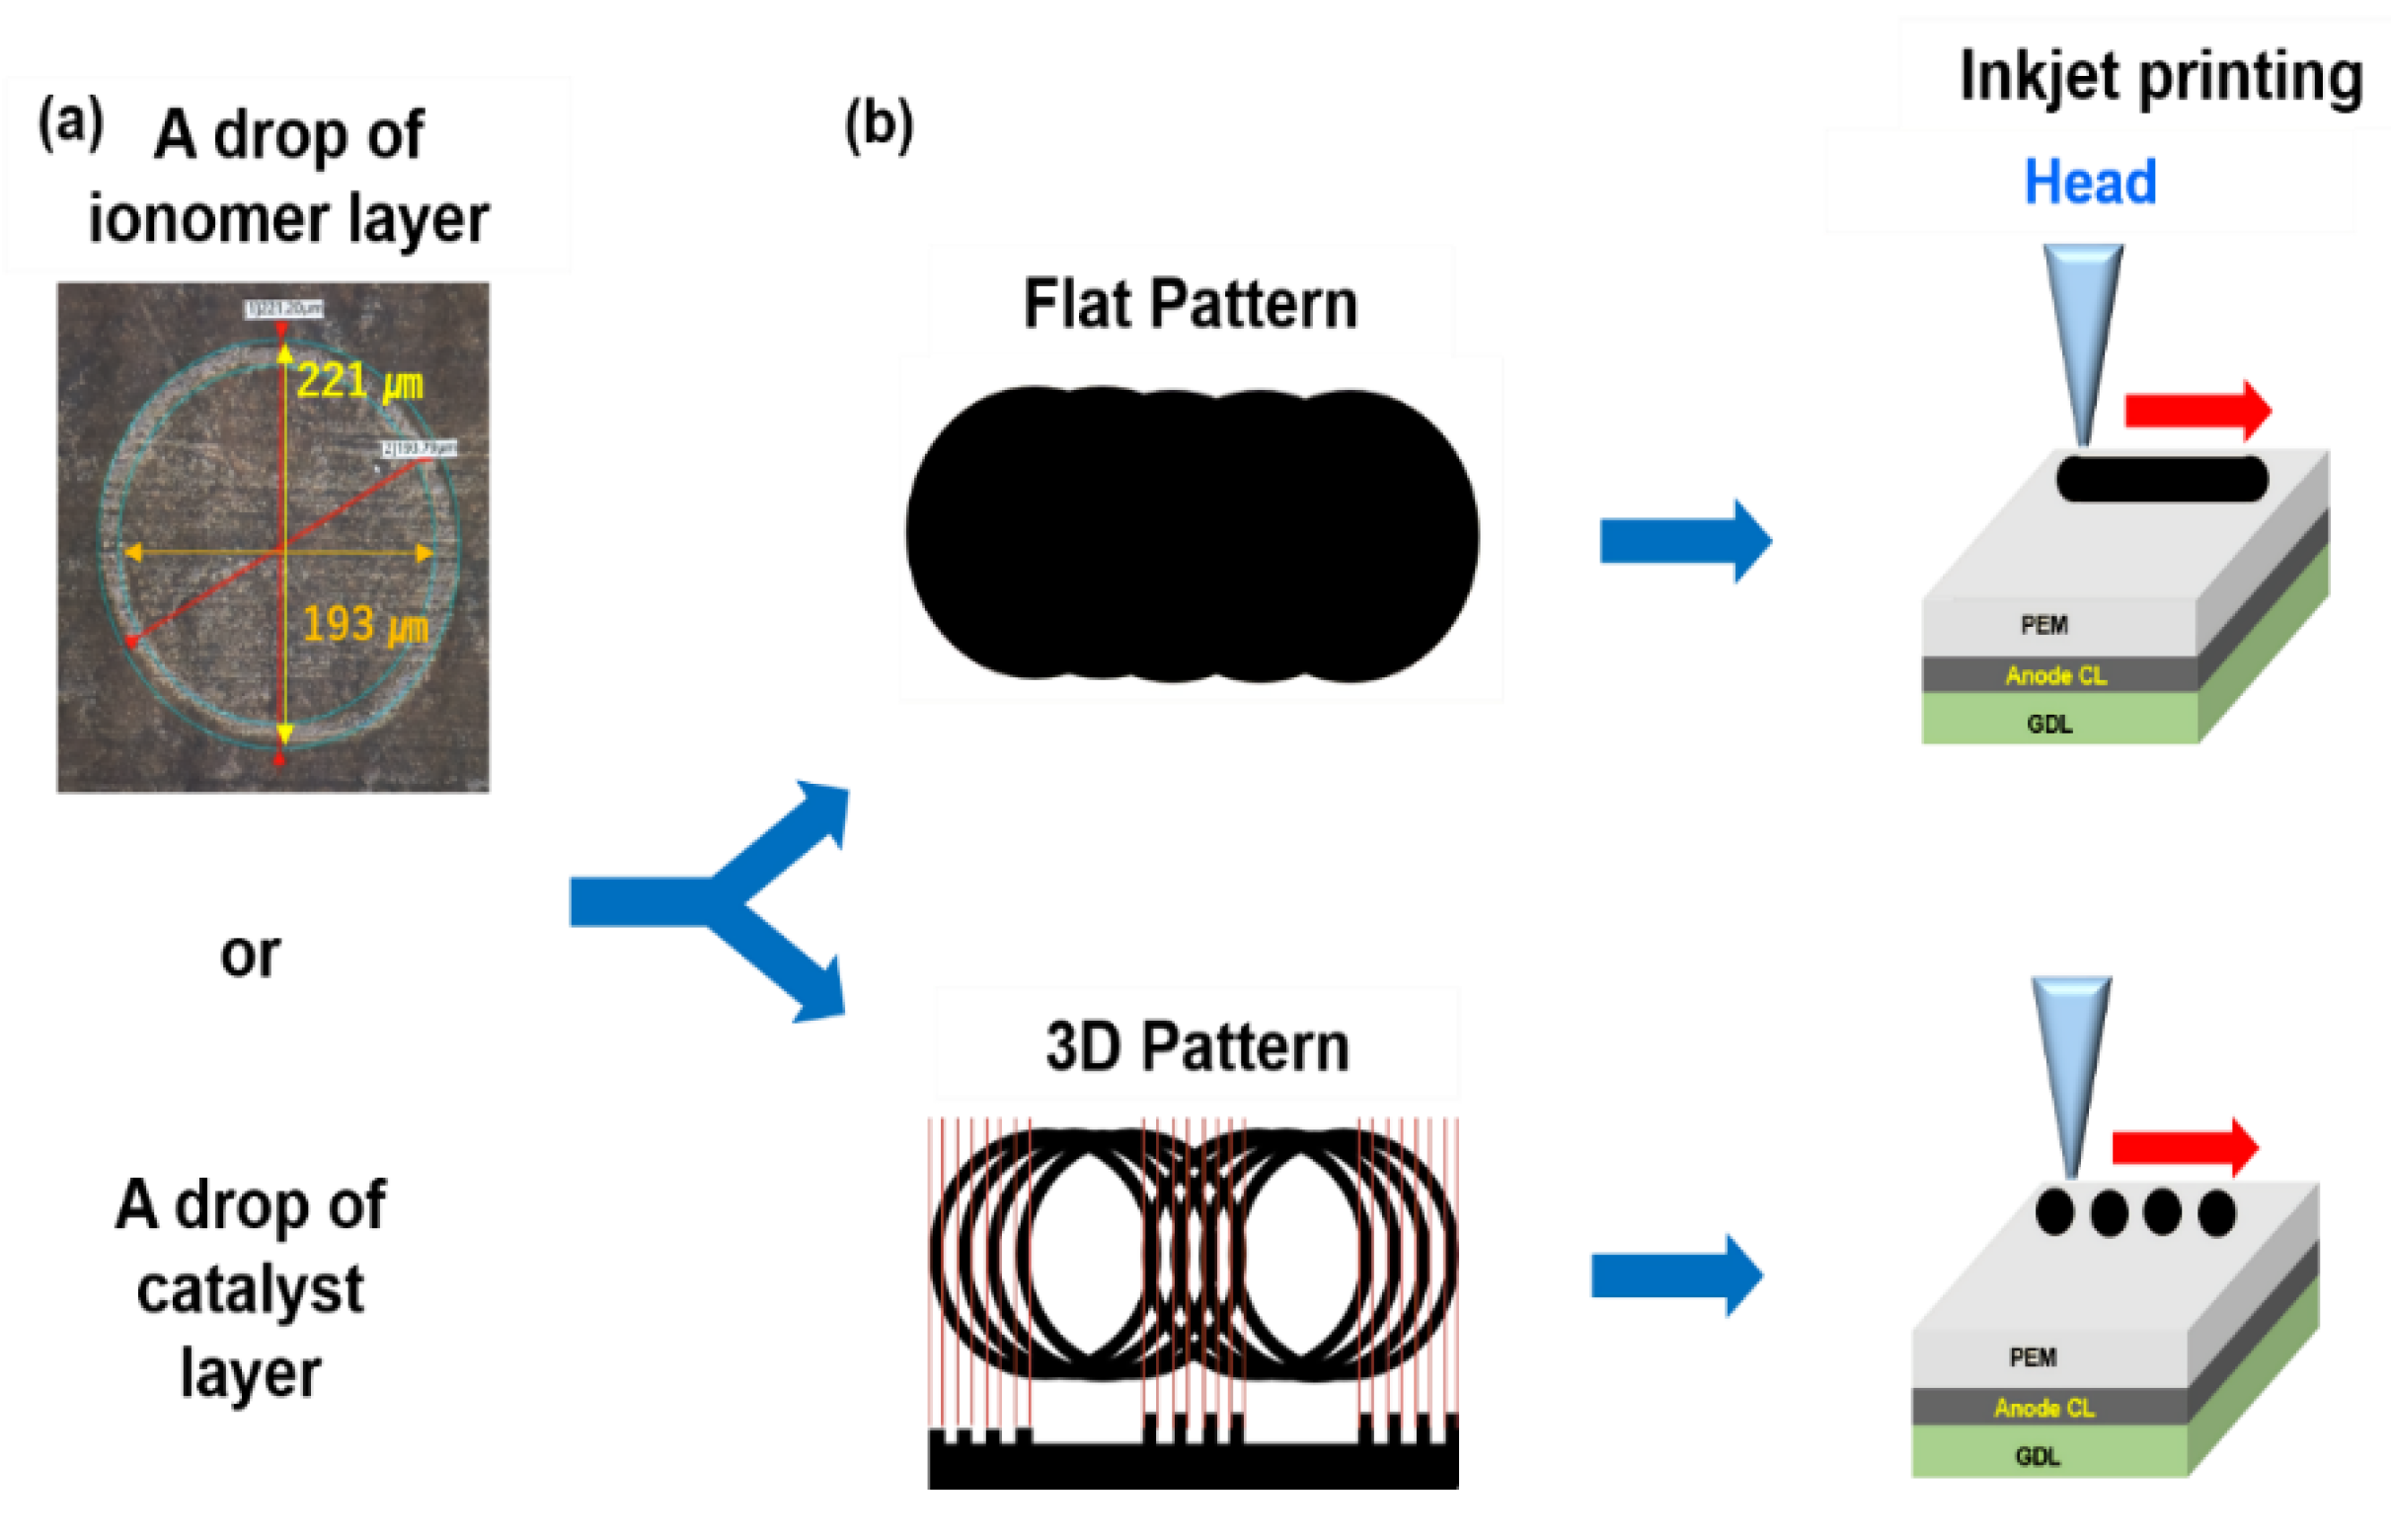
Catalyst ink for CCLs and carbon-supported Pt catalyst (TEC10V50E; Pt loading: 46.8%, 0.3 mg/cm2), purchased from Tanaka Kikinzoku Kogyo, were mixed with distilled water and 1-propanol (NPA). The slurry was dispersed using an ultrasonic homogenizer (Branson Digital sonicator 250 DA Branson ultrasonics corporation Danbury, CT, USA) for 20 min after the addition of the ionomer (5 mass% Nafion solution, Sigma-Aldrich Tokyo, Japan). The I/C mass ratio was adjusted to 0.25. In addition, the ionomer solution for the IL was prepared by ultrasonically mixing the ionomer and NPA (ionomer: NPA = 1:4) for 5 min. This catalyst ink and ionomer solution were used for the fabrication of CCLs. The CCLs were fabricated using the inkjet printing (LaboJet-600STDK, Microjet) method employed in our previous study [26]. Prior to coating the catalyst ink and ionomer solution on the CCLs, a Nafion membrane (NR-211, Chemours Wilmington, DE, USA) as a PEM and an ACL were hot-pressed at 413 K and 6 MPa for 4 min. Then, the ionomer solution was printed directly onto the Nafion membrane by the inkjet printing method. Subsequently, the catalyst ink was also coated using the same method. Figure 3 shows the procedure for the design and fabrication of the CCL structures with flat and 3D structures. First, a drop of the ionomer dried on the Nafion membrane was examined using a digital microscope to gather information regarding its external and internal diameters and height. Additionally, the information on the characteristics of the drop of catalyst ink is available in our previous report [26]. For a drop of the ionomer solution shown in Figure 3a, the ink concentration at the edge is higher than that in the interior because of the coffee ring effect, in which the liquid evaporating from the edge is replenished by the liquid from the interior [33]. In other words, the thickness at the edge is higher than that in the interior. This phenomenon could also be confirmed in a drop of the catalyst ink. Based on the information obtained from the ink or ionomer drops, we designed a 3D pattern by overlapping the edge, where the outer and inner diameters are different, at regular intervals. These 3D patterns were employed to fabricate the IL and CL constituting the CCL by the inkjet printing method. The ink droplets were ejected through the head of the inkjet printer, and for the 3D pattern, the droplets were overlapped as designed after drying the ionomer droplet solution or catalyst inks to maintain their shape. On the other hand, a flat pattern was formed by dropping the catalyst ink or ionomer solution until one layer was coated and then by drying them to prevent the shape formation. Samples were prepared to confirm the structure of each pattern in the IL or CL prepared using the ionomer solution or catalyst ink. After examining each patterned structure in the IL and CL, CCLs with four structures were fabricated using two patterns by inkjet printing. The Pt loading of the CCLs was 0.3 mg/cm2, while the I/C mass ratio was adjusted to 0.26, except for Str. 1 which consisted of only the 3D-patterned CL (I/C = 0.25). MEAs with an active area of 1 cm2 and composed of the ACL and CCL on either side of the Nafion film were fabricated. Gas diffusion layers (GDLs; Sigracet25BC, SGL Carbon) containing 5% PTFE and with a thickness of 235 µm were used at both the anode and cathode sides.
3.2. Characterization and Electrochemical Measurements of CCLs
Basic information on a drop of ionomer solution dried on the Nafion film was obtained using a digital microscope (KEYENCE, VHX-7000, Osaka, Japan). In addition, the surface morphology of the CCLs and their cross-sectional images were observed by FIB-SEM (Helios G4 UX, Thermo Fisher Scientific, Tokyo, Japan). After cutting out the center of the sample, it was fixed on the sample table, and the surface SEM was observed after the conductive treatment. Then, the cross section was prepared by cooling FIB processing, and the cross-section SEM was carried out with the acceleration voltage of 1 and 2 kV, observation image of secondary electron image and backscattered electron image, and a processing and observation temperature of −160 °C. Electrochemical measurements were carried out using a single cell (JARI, serpentine: 1 mm width, 1 mm depth) and evaluated measurements (compact type FC evaluation tester S160025, CHINO, Tokyo, Japan). For aging, pure H2 gas and 21% O2 with pure N2 were humidified and supplied to the anode and cathode, respectively. The aging was allowed to proceed while cycling the potential between the OCV and 0.3 V for 30 s until the current reached a constant value at 0.3 V. The polarization curves of the CCLs were obtained over the potential range of 0.9–0.2 V at a potential drop of 0.1 V. Each potential was maintained for 5 min until the current stabilized, and electrochemical impedance spectroscopy (EIS) was performed in the frequency range of 100 kHz–0.2 Hz. The measurement temperature was 80 °C and the relative humidity (RH) was 100% and 40%. The gas flow rates were 250 and 500 mL/min at the anode and cathode, respectively. The experiment requires approximately 11 h.
4. Results and Discussion
4.1. Structural Characterization
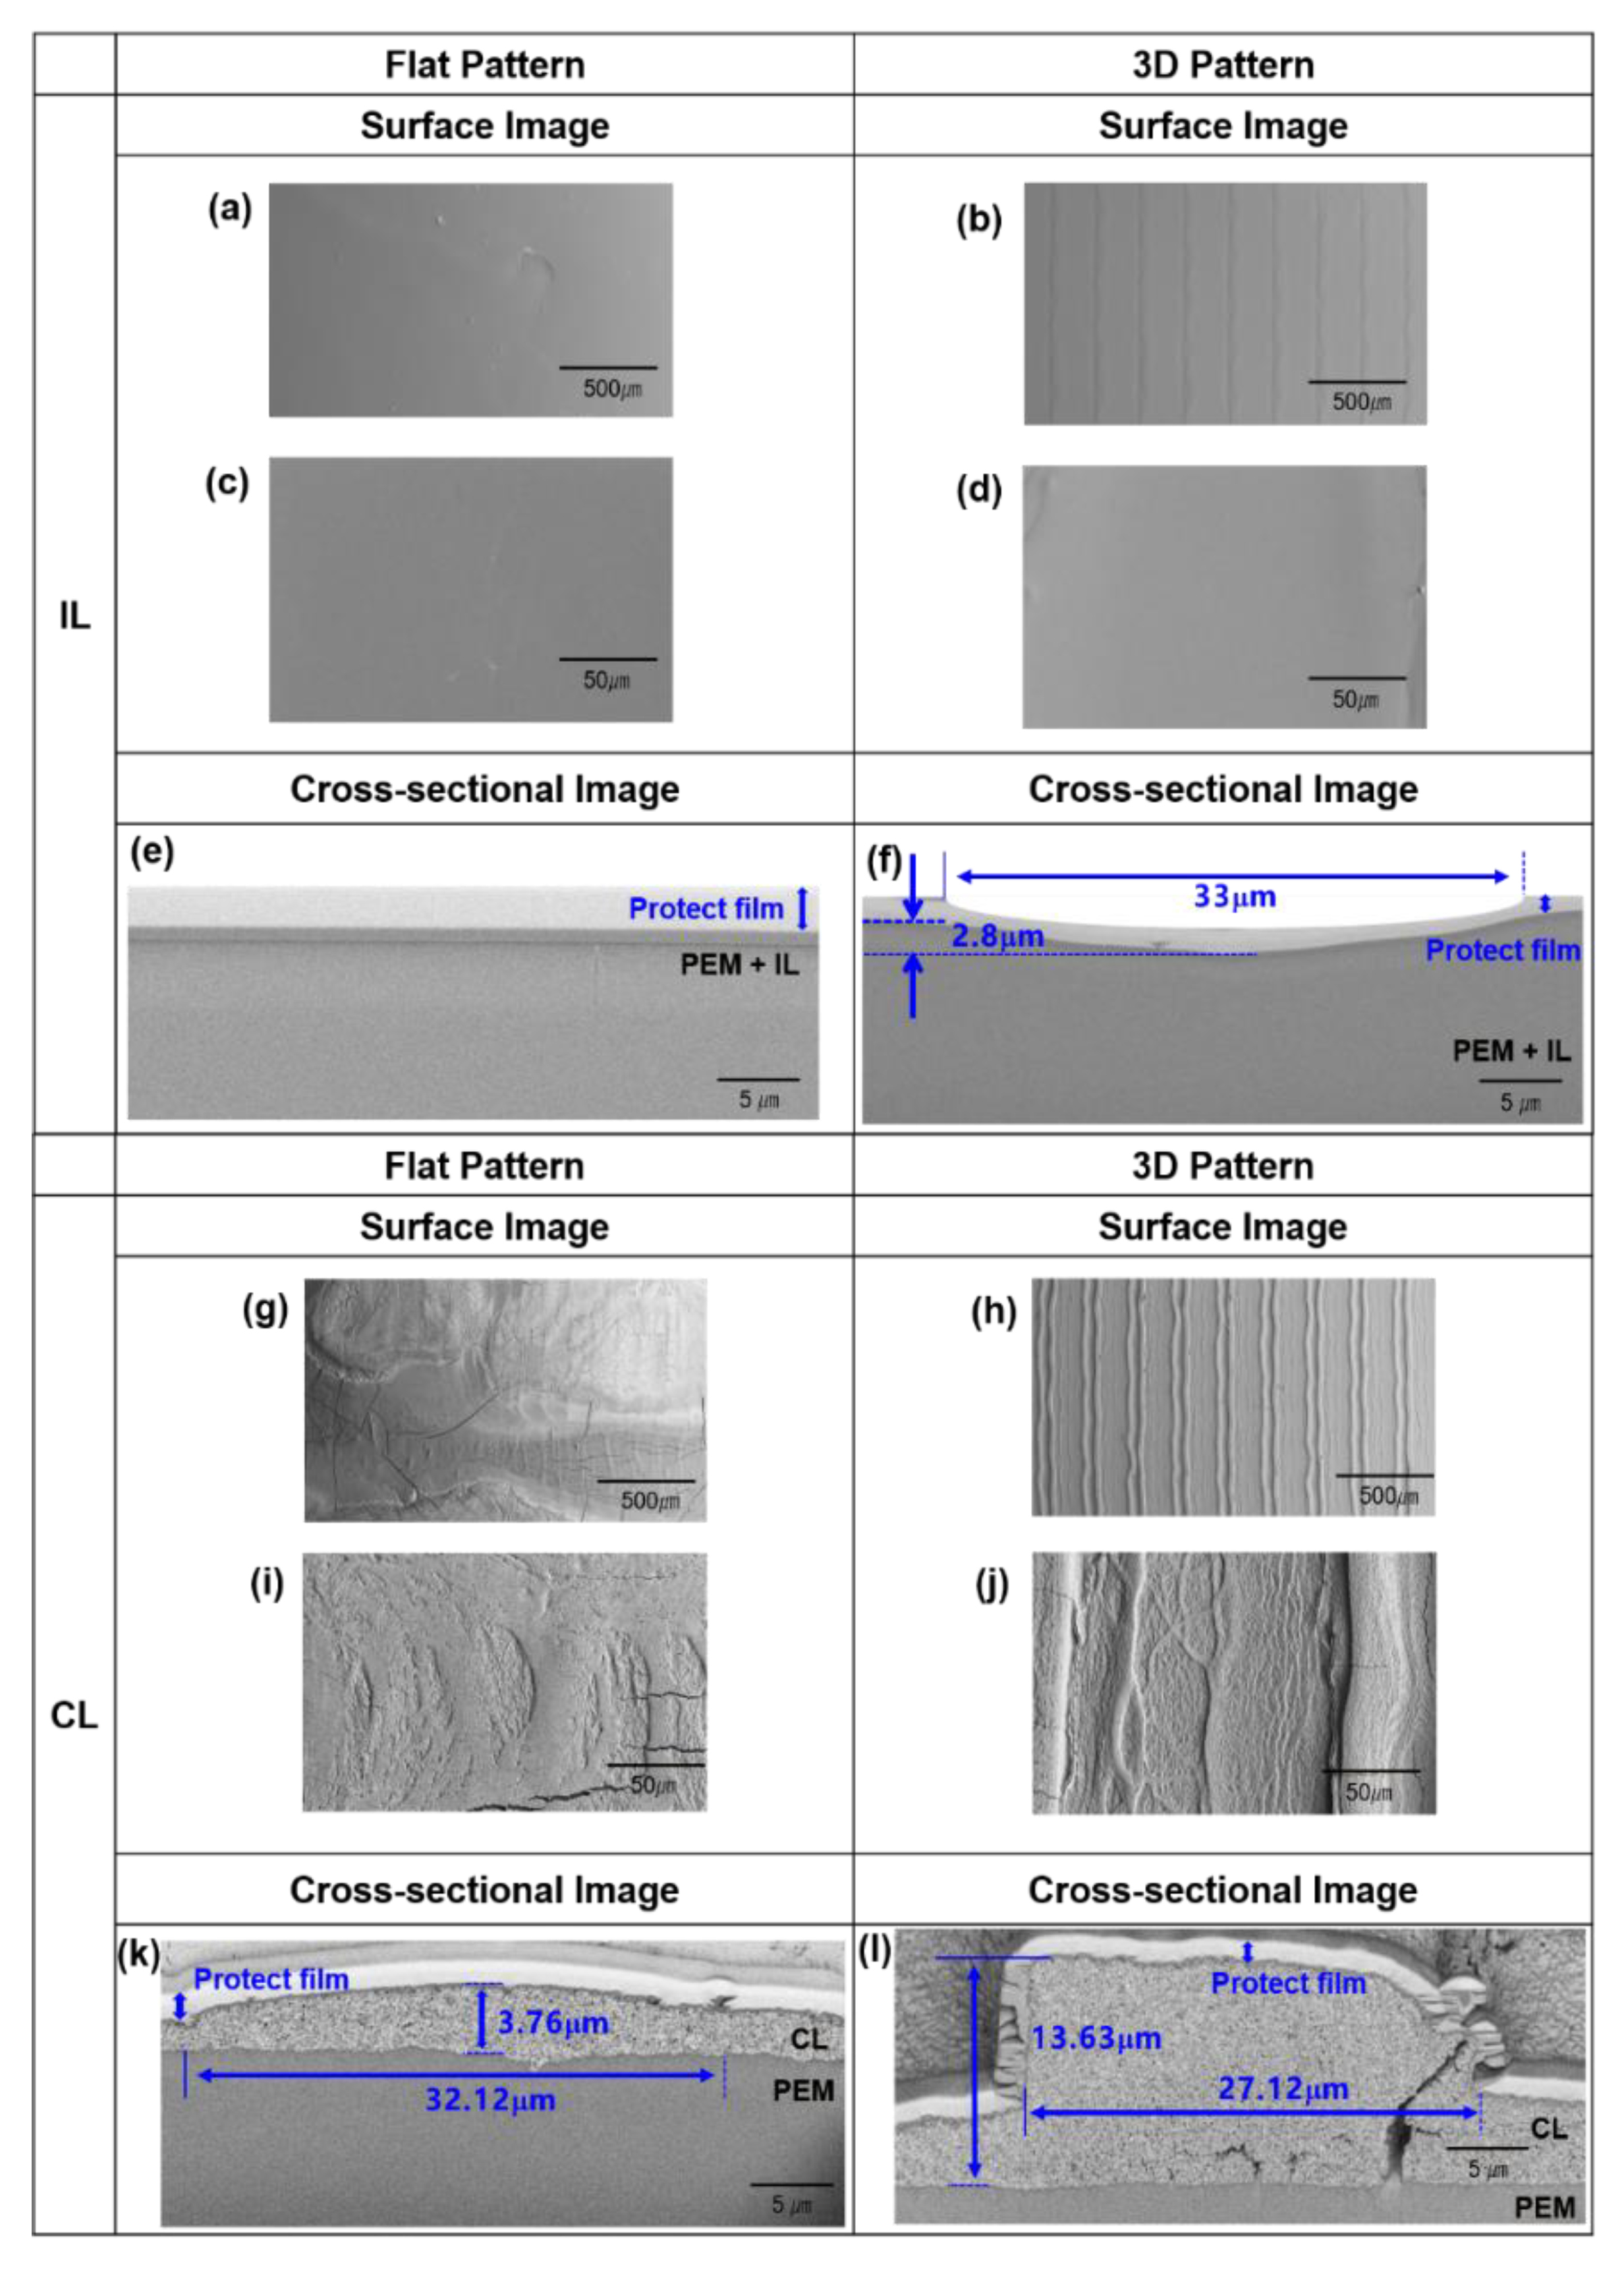
Figure 4 shows the SEM images of the flat- and 3D-patterned structures in each IL and CL at the 500 μm (a,b,g,h) and 50 μm (c,d,i,j) scales and the cross-sectional image (e,f,k,l). For the flat-patterned IL (Figure 4a,c), no pattern was observed on the surface (a), while the IL surface near the protect film (white color), seen in the upper part of the cross-sectional image (e), had a flat structure. However, it was difficult to distinguish between the Nafion film and the IL surface at the bottom because both of these have the same components. By contrast, for the 3D-patterned IL (shown in Figure 4b,d), a rough structural surface was observed in the cross-sectional image (f); the width and height of IL surfaces were about 33 μm and 2.8 μm per each. CLs with two types of patterns coated on the Nafion film are shown in Figure 4g–l. The flat pattern of the CL was observed (g,i), and the width and height of the surfaces was 32.12 μm and 3.76 μm, respectively. This indicates that even if the droplets are continuously printed without drying, the coffee ring effect is still present when a pattern is printed using an inkjet printer. Finally, for the 3D-patterned CL, uniform and distinct patterns were observed in the surface images (h,j). The width and height of surfaces was 27.12 μm and 13.63 μm, respectively, indicating a rough structure, as is evident from the cross-sectional image (l). Although the same flat or 3D patterns were coated on the Nafion film, their heights and shapes varied depending on the components of the solution. In this study, we fabricated CCL structures by combining flat- or 3D-patterned IL or CL. The four types of patterned CCLs investigated in this study are summarized in Table 2. Str. 1 consists only of 3D-patterned CL without IL and was fabricated for comparison because it showed excellent performance in our previous study [26]. Str. 2 includes the flat-patterned IL and CL, Str. 3 is composed of 3D-patterned IL and flat-patterned CL, and Str. 4 is composed of 3D-patterned IL and CL. Figure 5 shows the SEM images of the CCLs with various patterned structures. Str. 1 is the same as that shown in Figure 4h,j,l because only the 3D-patterned CL is included. Str. 2 exhibited a slightly uneven surface, which can be attributed to the 3D-patterned CL, as mentioned in Figure 4. The SEM image of Str. 3 showed amorphous heterogeneously agglomerated structures on the flat surface of the CCL. While coating the CL on the IL with the rough surface, particles agglomerated toward the IL surface with the lower height because the catalyst ink droplets are continuously printed without being dried. The height of the amorphous agglomerates, estimated using a digital microscope (VHX-7000), was approximately 9 μm higher than that of the flat surface. Hence, the coat of the flat surface was very thin while that of the amorphous agglomerate was very thick. The pattern of Str. 4 was different from those of Str. 2 and Str. 3. Str. 4 showed a wider rough pattern than Str. 1 due to the different morphologies of the surfaces of the IL and CL used for fabricating this structure. Thus, CCLs with various structures were successfully fabricated.
4.2. Electrochemical Analysis of the Two Structures
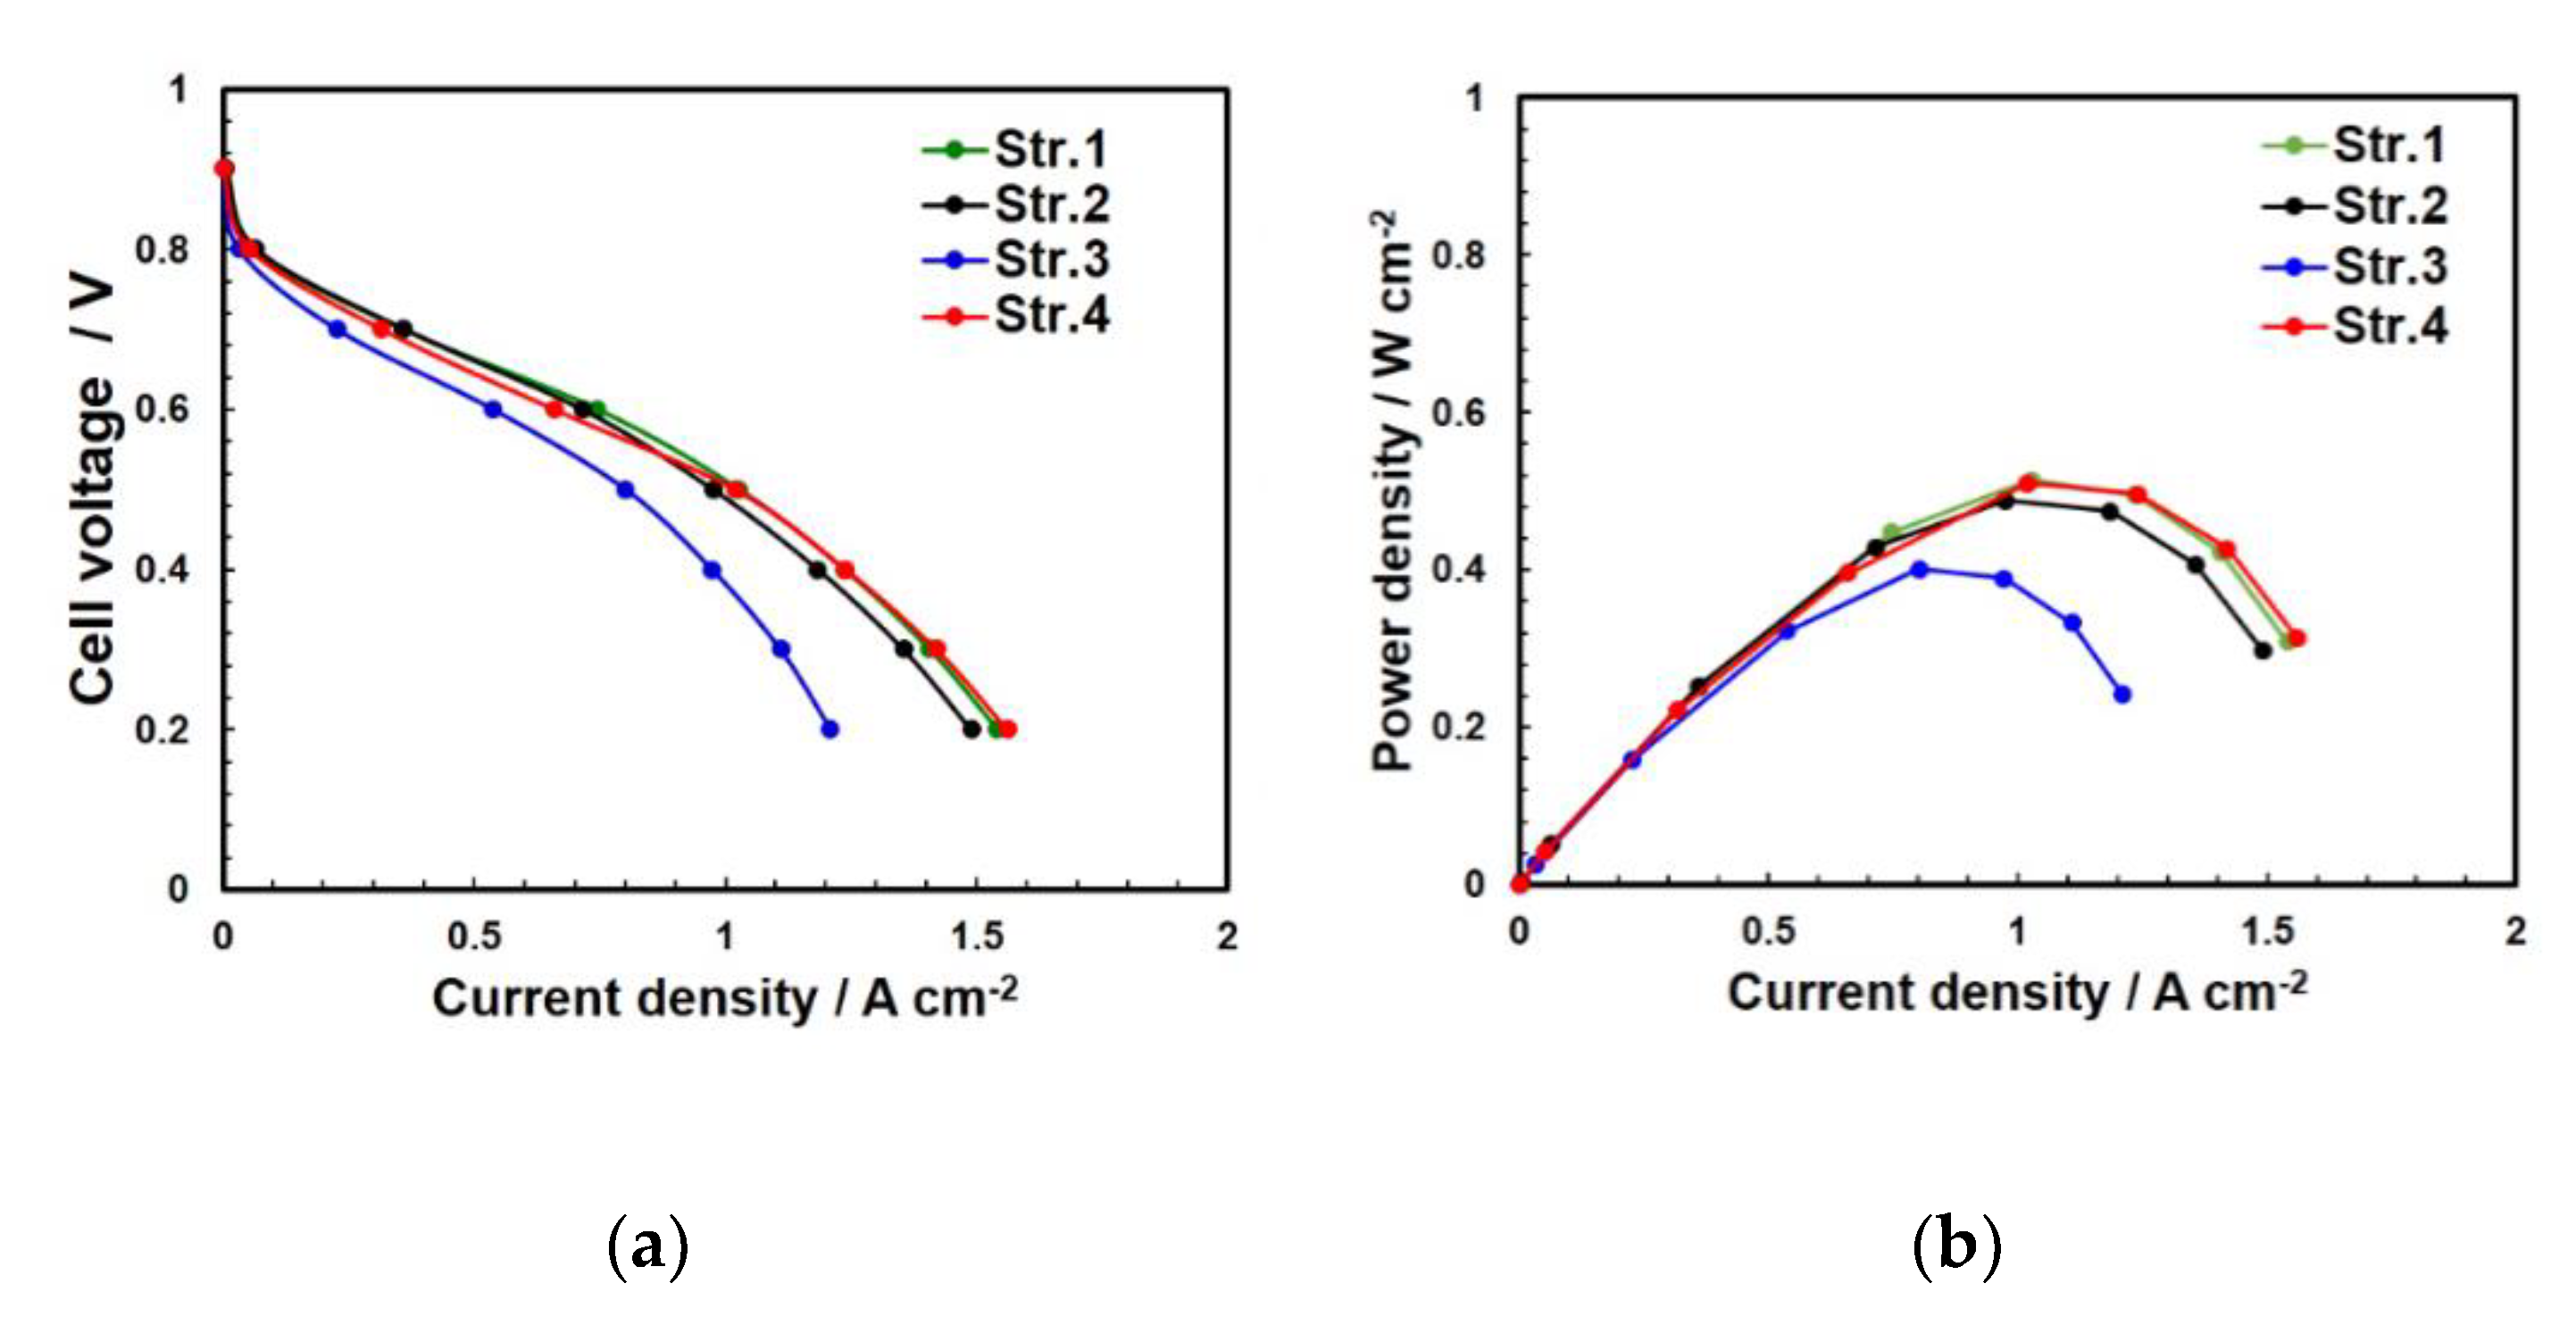
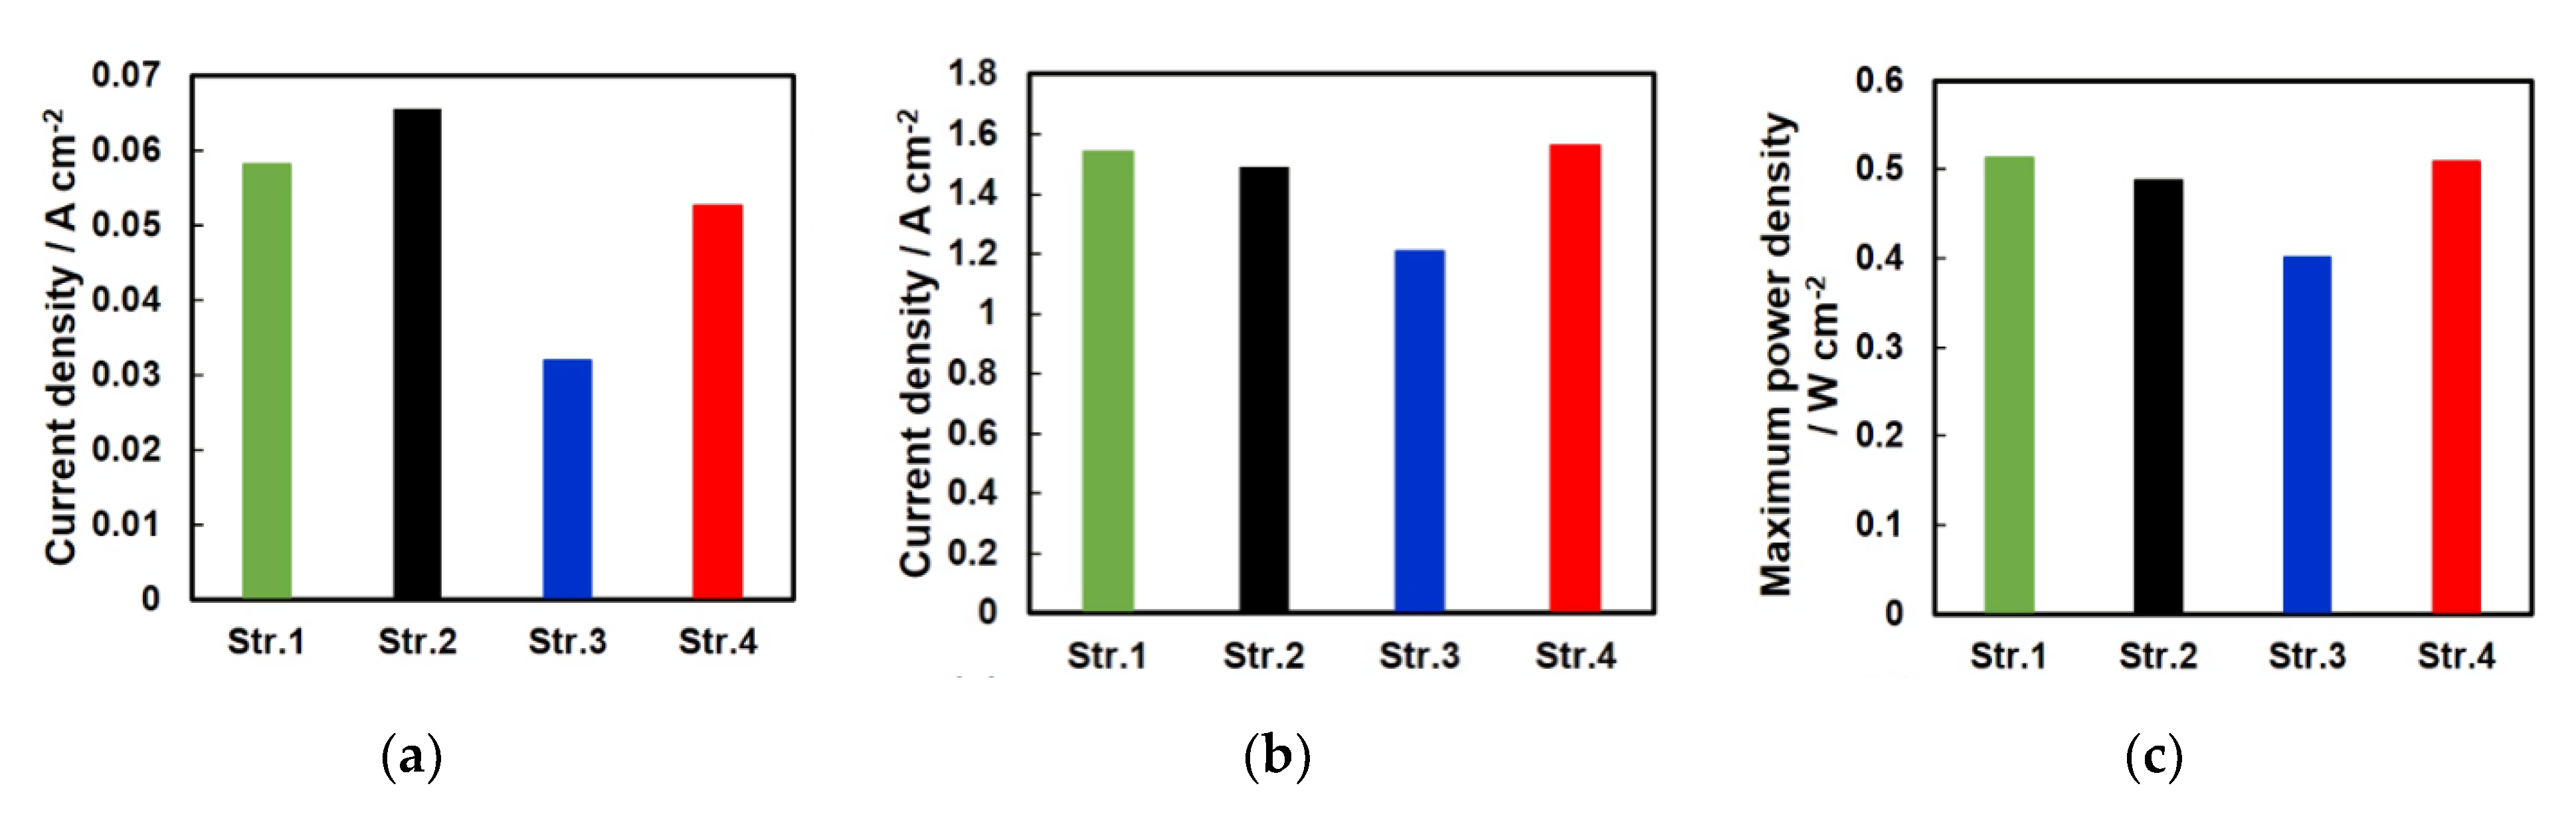
The electrochemical characterization of the CCLs with four types of structures was performed at 80 °C and 100% RH of Str. 3 was lower that than of the other structures. This indicates that the addition of the IL to the CCLs does not contribute to the improvement of cell performance at 100% and 40% RH. Figure 6 shows the polarization curves and power densities of the CCLs at 100% RH. Str. 1, Str. 2, and Str. 4 exhibited similar cell performance, while the performance RH with sufficient proton conduction. In particular, the cell performance of Str. 3 was rather lower than that of Str. 1 after the addition of the 3D-patterned IL. This could be attributed to the amorphous agglomerates distributed on the flat surface of Str. 3 (Figure 6). Due to the thick amorphous agglomerates, the mass transport resistance increases, resulting in a decrease in the cell performance. The power densities of the CCLs showed the same trend. The cell performance and maximum power density of the CCLs are summarized in Figure 7. Figure 7a shows a comparison of the cell performance of the CCLs at 0.6 V. The cell performance at 0.6 V, related to the ohmic resistance, increased in the order Str. 1 > Str. 2 > Str. 4 > Str. 3. On the other hand, the cell performance at 0.2 V, related to the mass transport such as oxygen transport, was almost same for Str. 1 and Str. 4 and decreased from Str. 2 to Str. 3. In addition, the maximum power density showed the same trend as the cell performance at 0.2 V.
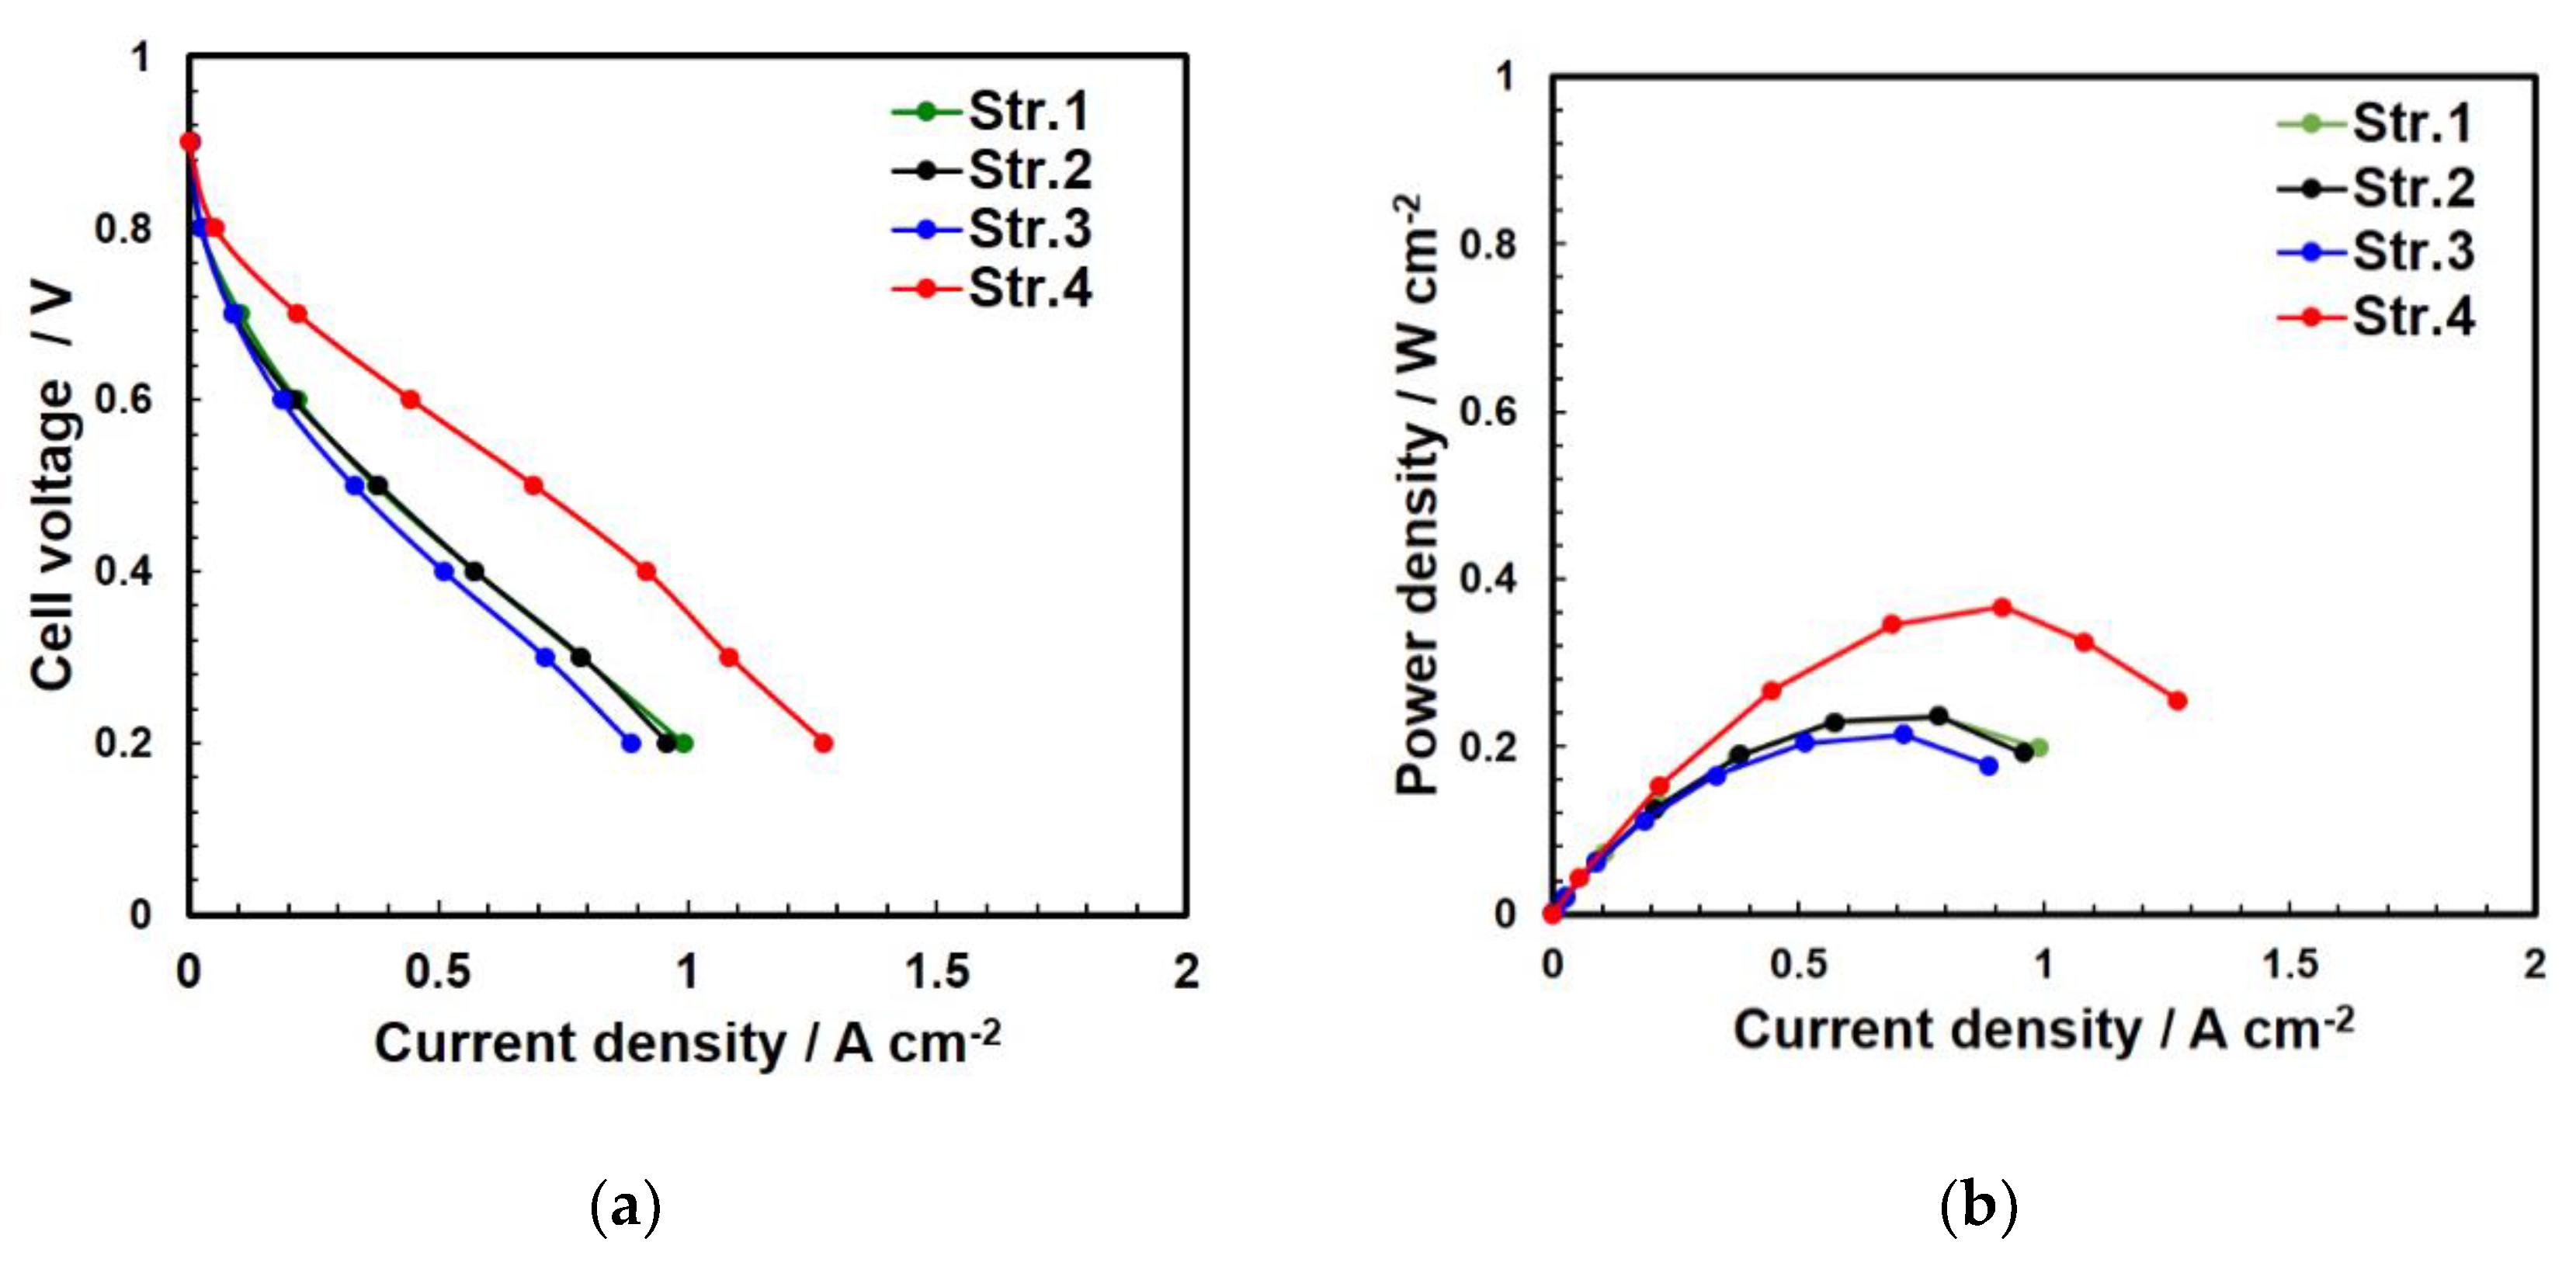
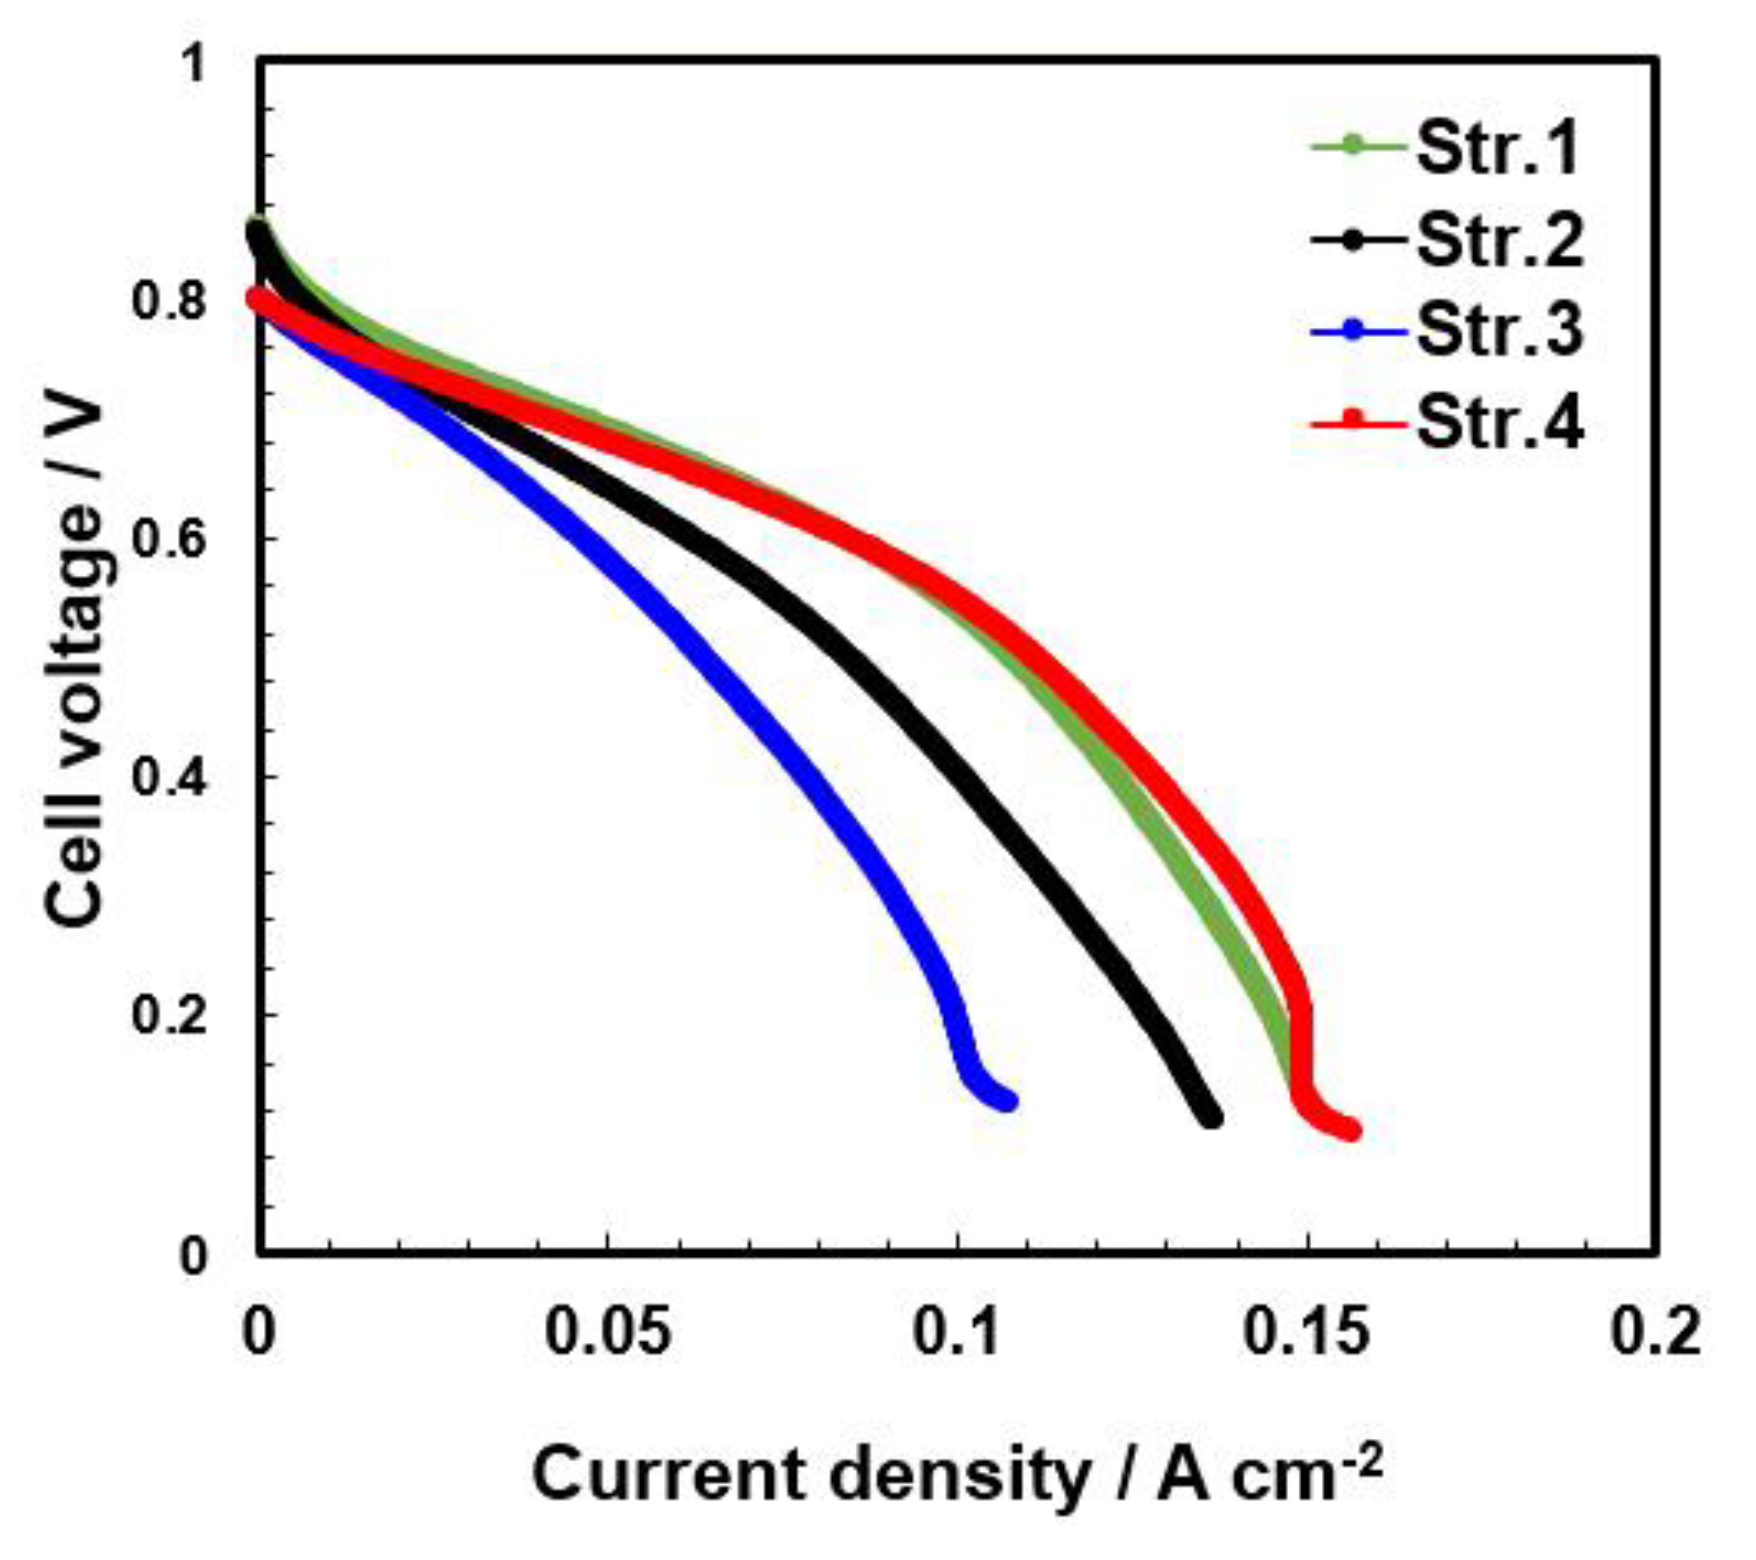
Figure 8 shows the polarization curve and power densities of the CCLs at 40% RH. The cell performance and maximum power density of Str. 4 were considerably higher compared to those of the other CCLs at 40% RH, for which proton conduction is usually poor. The cell performance at 0.6 and 0.2 V and the maximum power density of the CCLs were compared in detail (Figure 9). The cell performance at 0.6 V improved two-fold after the addition the 3D-patterned IL to Str. 1. Additionally, at 0.2 V, the cell performance of Str. 4 improved by approximately a factor of 1.3 compared to that of Str. 1. In addition, the maximum power density of Str. 4 also increased by a factor of at least 1.5 compared to those of the other CCLs. These results suggest that the proton path in the CL of Str. 4 is shortened because the surface of the uneven IL and the surface of the CL are alternately curved.
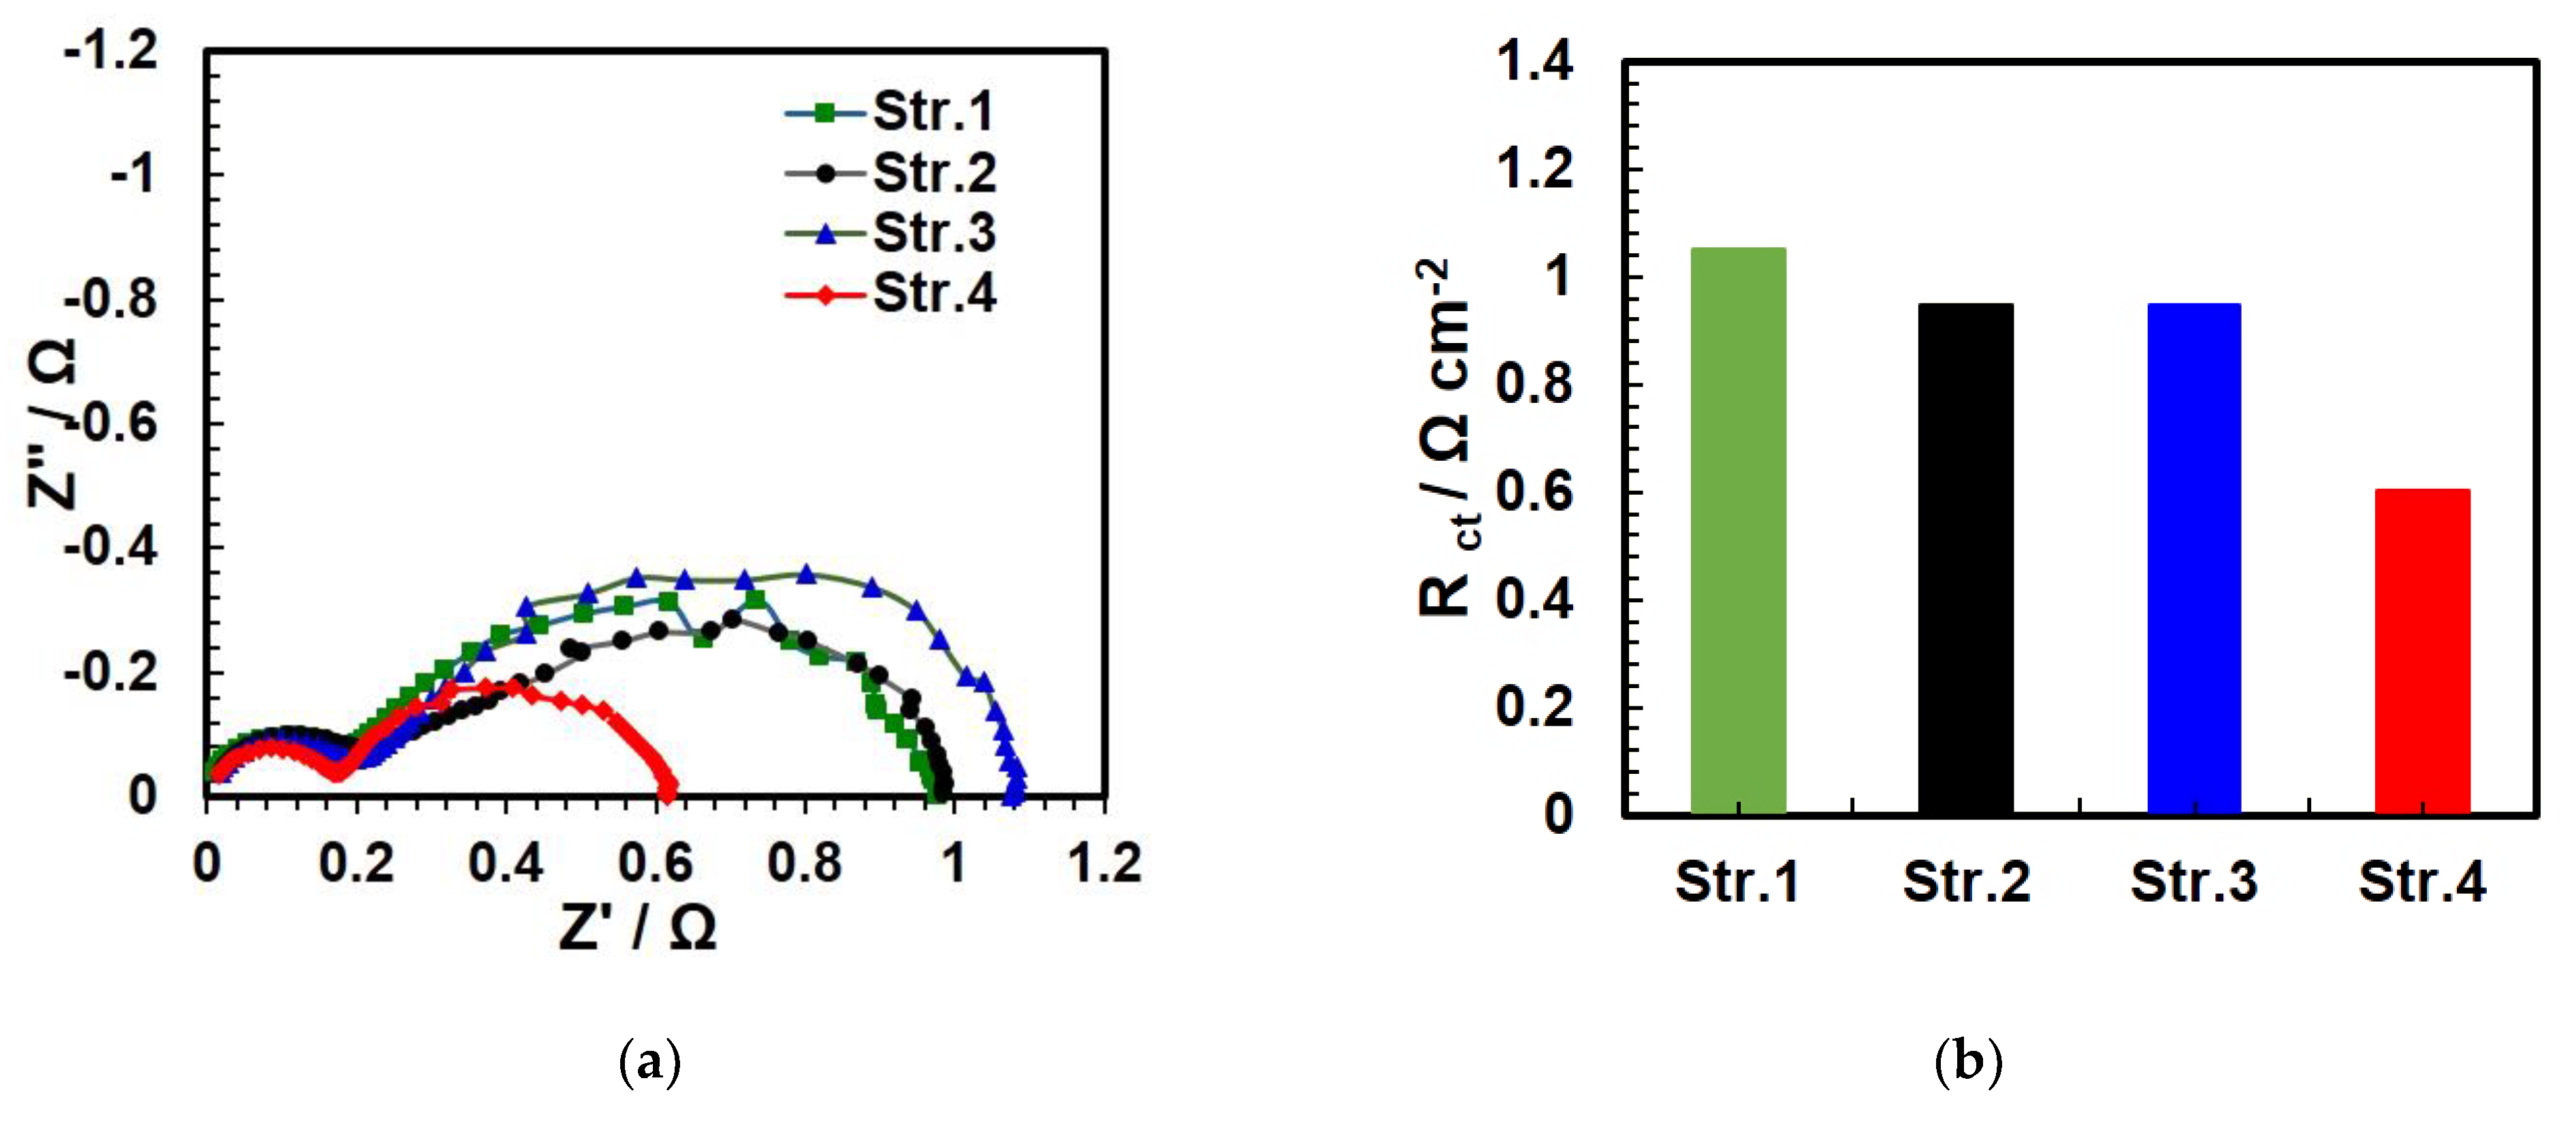
To quantitatively analyze the relationship between the patterned structures and the resistance of the CCLs, EIS was performed. Figure 10 shows the impedance spectra of the four CCLs. Two semicircles are observed in the Nyquist plots of the CCLs. The semicircle to the left is attributed to the resistance related to the electrolyte membrane. Generally, the ohmic resistance is approximately 0.02 at 100% RH, but is higher at 40% RH [34]. Thus, the ohmic resistance varies with RH [35]. In particular, at low RH, the ohmic resistance becomes very high. Compared to other structures, Str. 4 exhibits a very small resistance related to the electrolyte membrane, possibly indicating increased proton conduction in this structure. The semicircle to the right in the Nyquist plots of the CCLs represents the charge-transfer resistance at the cathode. A smaller diameter of the semicircle corresponds to a lower resistance of the CCL. The charge-transfer resistance at 0.6 V was the lowest for Str. 4 among all of the CCLs. In particular, the charge-transfer resistance of Str. 4 is 0.6 times that of Str. 1 (without IL). This is consistent with the performance of the CCLs.
To confirm the effect of the patterned structures included in the CCLs on the mass transport of oxygen, the limiting current densities were measured at 80 ℃ and 95% RH using 1% oxygen gas. Figure 11 shows the limiting current densities of the four CCLs. The oxygen-limiting current density was used to quantify the accessibility of oxygen to the catalyst. The limiting current densities of Str. 1 and Str. 4 were almost the same and higher than those of the other CCLs. This suggested that the CLs with 3D-patterned structures included in these two CCLs affected the oxygen diffusivity. The 3D-CL and 3D-IL affected performance. First, in the case of 3D-patterned CL without IL, it was confirmed that the oxygen diffusivity was improved compared to that of the flat-patterned CL based on the results for the limiting current density (shown in Figure 11). For the 3D-patterned IL, the IL shortened the proton path to the CL. However, the effect of 3D-IL depends on the pattern of CL. In the case of the CCL obtained by combining the 3D-IL and flat-CL, the cell performance decreased because the presence of agglomerates on the CL led to longer mass transport paths. By contrast, for both 3D-patterned IL and CL, the cell performance increased because of the shortened proton path to CL from IL due to the larger surface area in contact with protons obtained by the combination of the curves of 3D-IL and CL. Based on the above results, it can be concluded that Str. 4 exhibited excellent performance at a low humidity. Thus, an optimized structure with excellent proton conductivity and oxygen diffusivity, attributed to the curvature between the 3D surfaces of the IL and CL, was designed.
5. Conclusions
In this study, using theoretical equations, we confirmed that the shorter proton conduction path in an IL with a 3D-patterned structure, compared to that in the IL with a flat-patterned structure, can improve the cell performance. We experimentally investigated the effect of the IL with a 3D-patterned structure included in the CCLs on the cell performance. Str. 4 (IL 3D + CL 3D) showed excellent properties under 100% RH conditions. It was confirmed that the addition of IL to CCLs did not contribute to cell performance improvement under 100% RH conditions where sufficient proton conduction was possible. The cell performance of Str. 4 was superior to those of the others at 40% RH. These results indicated that the structure of Str. 4 enhanced the proton conductivity at a low humidity at which proton conduction is usually poor, thereby resulting in improved cell performance. Str. 4 exhibits a very small resistance related to the electrolyte membrane compared to the other structures, which can be correlated to its increased proton conduction. Thus, an optimized structure with excellent proton conductivity and excellent oxygen diffusivity, attributed to the curvature between the 3D surfaces of the IL and CL, was designed. In the future, we plan to numerically analyze these results and structures using our simulation techniques.
Author Contributions
Conceptualization, G.I. and K.P.; methodology, T.N.; formal analysis, R.G.; writing—original draft preparation, T.N.; writing—review and editing, G.I., N.K. and Y.T. All authors have read and agreed to the published version of the manuscript.
Funding
This research received no external funding.
Institutional Review Board Statement
Not applicable.
Informed Consent Statement
Not applicable.
Data Availability Statement
Not applicable.
Acknowledgments
This work was supported by Next-Generation Fuel Cell Research Center (NEXTFC) in Kyushu University of Japan and Nitto Analytical Techno-Center Co., Ltd. for using their FIB-SEM equipment.
Conflicts of Interest
The authors declare no conflict of interest.
References
- Fernández, R.; Ferreira-Aparicio, P.; Daza, L. PEMFC Electrode Preparation: Influence of the Solvent Composition and Evaporation Rate on the CatalytILayer Micropattern. J. Power Source 2005, 151, 18–24. [Google Scholar] [CrossRef]
- Ngo, T.T.; Yu, T.L.; Lin, H.L. Influence of the Composition of Isopropyl Alcohol/Water Mixture Solvents in Catalyst Ink Solutions on Proton Exchange Membrane Fuel Cell Performance. J. Power Source 2013, 225, 293–303. [Google Scholar] [CrossRef]
- So, M.; Ohnishi, T.; Park, K.; Ono, M.; Tsuge, Y.; Inoue, G. The Effect of Solvent and Ionomer on Agglomeration in Fuel Cell Catalyst Inks: Simulation by the Discrete Element Method. Int. J. Hydrogen Energy 2019, 44, 28984–28995. [Google Scholar] [CrossRef]
- Suzuki, T.; Tsushima, S.; Hirai, S. Fabrication and Performance Evaluation of Structurally-Controlled PEMFC Catalyst Layers by Blending Platinum-Supported and Stand-Alone Carbon Black. J. Power Source 2013, 233, 269–276. [Google Scholar] [CrossRef]
- Mao, Q.; Sun, G.; Wang, S.; Sun, H.; Wang, G.; Gao, Y.; Ye, A.; Tian, Y.; Xin, Q. Comparative Studies of Configurations and Preparation Methods for Direct Methanol Fuel Cell Electrodes. Electrochim. Acta 2007, 52, 6763–6770. [Google Scholar] [CrossRef]
- Kim, K.-H.; Lee, K.-Y.; Kim, H.-J.; Cho, E.; Lee, S.-Y.; Lim, T.-H.; Yoon, S.P.; Hwang, I.C.; Jang, J.H. The Effects of Nafion® Ionomer Content in PEMFC MEAs Prepared by a Catalyst-Coated Membrane (CCM) Spraying Method. Int. J. Hydrogen Energy 2010, 35, 2119–2126. [Google Scholar] [CrossRef]
- Chaparro, A.M.; Gallardo, B.; Folgado, M.A.; Martín, A.J.; Daza, L. PEMFC Electrode Preparation by Electrospray: Optimization of Catalyst Load and Ionomer Content. Catal. Today 2009, 143, 237–241. [Google Scholar] [CrossRef]
- Wang, Z.; Nagao, Y. Effects of Nafion Impregnation Using Inkjet Printing for Membrane Electrode Assemblies in Polymer Electrolyte Membrane Fuel Cells. Electrochim. Acta 2014, 129, 343–347. [Google Scholar] [CrossRef]
- Tai, X.Y.; Zhakeyev, A.; Wang, H.; Jiao, K.; Zhang, H.; Xuan, J. Accelerating Fuel Cell Development with Additive Manufacturing Technologies: State of the Art, Opportunities and Challenges. Fuel Cells 2019, 19, 636–650. [Google Scholar] [CrossRef]
- Cannio, M.; Righi, S.; Santangelo, P.E.; Romagnoli, M.; Pedicini, R.; Carbone, A.; Gatto, I. Smart Catalyst Deposition by 3D printing for Polymer Electrolyte Membrane Fuel Cell manufacturing. Renew. Energy 2021, 163, 414–422. [Google Scholar] [CrossRef]
- Breitwieser, M.; Klose, C.; Klingele, M.; Hartmann, A.; Erben, J.; Cho, H.; Kerres, J.; Zengerle, R.; Thiele, S. Simple Fabrication of 12 μm Thin Nanocomposite Fuel Cell Membranes by Direct Electrospinning and Printing. J. Power Source 2017, 337, 137–144. [Google Scholar] [CrossRef]
- Towne, S.; Viswanathan, V.; Holbery, J.; Rieke, P. Fabrication of Polymer Electrolyte Membrane Fuel Cell MEAs Utilizing Inkjet Print Technology. J. Power Source 2007, 171, 575–584. [Google Scholar] [CrossRef]
- Wong, K.V.; Hernandez, A. A Review of Additive Manufacturing. ISRN Mech. Eng. 2012, 208760. [Google Scholar] [CrossRef] [Green Version]
- Yazdanpour, M.; Esmaeilifar, A.; Rowshanzamir, S. Effects of hot pressing conditions on the performance of Nafion membranes coated by ink-jet printing of Pt/MWCNTs electrocatalyst for PEMFCs. Int. J. Hydrogen Energy 2012, 37, 11290–11298. [Google Scholar] [CrossRef]
- Mohapatra, S.R.; Tsuruoka, T.; Hasegawa, T.; Terabe, K.; Aono, M. Flexible resistive switching memory using inkjet printing of a solid polymer electrolyte. AIP Adv. 2012, 2, 022144. [Google Scholar] [CrossRef]
- Guo, Y.; Ono, Y.; Nagao, Y. Modification for Uniform Surface of Nafion Ultrathin Film Deposited by Inkjet Printing. Langmuir 2015, 31, 10137–10144. [Google Scholar] [CrossRef]
- Ferrari, S.; Loveridge, M.; Beattie, S.D.; Jahn, M.; Dashwood, R.J.; Bhagat, R. Latest advances in the manufacturing of 3D rechargeable lithium microbatteries. J. Power Source 2015, 286, 25–46. [Google Scholar] [CrossRef] [Green Version]
- Shukla, S.; Domican, K.; Karan, K.; Bhattacharjee, S.; Secanell, M. Analysis of low platinum loading thin polymer electrolyte fuel cell electrodes prepared by inkjet printing. Electrochim. Acta 2014, 156, 289–300. [Google Scholar] [CrossRef]
- Sharma, A.; Thakur, M.; Bhattacharya, M.; Mandal, T.; Goswami, S. Commercial application of cellulose nano-composites—A review. Biotechnol. Rep. 2019, 21, e00316. [Google Scholar] [CrossRef]
- Singh, M.; Haring, A.P.; Tong, Y.; Cesewski, E.; Ball, E.; Jasper, R.; Davis, E.M.; Johnson, B.N. Additive Manufacturing of Mechanically Isotropic Thin Films and Membranes via Microextrusion 3D Printing of Polymer Solutions. ACS Appl. Mater. Interfaces 2019, 11, 6652–6661. [Google Scholar] [CrossRef]
- Wei, L.; Zhang, J.; Yu, F.; Zhang, W.; Meng, X.; Yang, N.; Liu, S. A novel fabrication of yttria-stabilized-zirconia dense electrolyte for solid oxide fuel cells by 3D printing technique. Int. J. Hydrogen Energy 2019, 44, 6182–6191. [Google Scholar] [CrossRef]
- Sun, C.; Wang, Y.; McMurtrey, M.D.; Jerred, N.D.; Liou, F.; Li, J. Additive manufacturing for energy: A review. Appl. Energy 2021, 282, 116041. [Google Scholar] [CrossRef]
- Blyweert, P.; Nicolas, V.; Fierro, V.; Celzard, A. 3D printing of carbon-based materials: A review. Carbon N. Y. 2021, 183, 449–485. [Google Scholar] [CrossRef]
- Calvert, P. Inkjet Printing for Materials and Devices. Chem. Mater. 2001, 13, 3299–3305. [Google Scholar] [CrossRef]
- Farandos, N.M.; Kleiminger, L.; Li, T.; Hankin, A.; Kelsall, G.H. Three-dimensional Inkjet Printed Solid Oxide Electrochemical Reactors. I. Yttria-stabilized Zirconia Electrolyte. Electrochim. Acta 2016, 213, 324–331. [Google Scholar] [CrossRef] [Green Version]
- Park, K.; Wei, Y.; So, M.; Noh, T.H.; Kimura, N.; Tsuge, Y.; Inoue, G. Influence of Surface Structure on Performance of Inkjet Printed Cathode Catalyst Layers for Polymer Electrolyte Fuel Cells. J. Electrochem. Energy Convers. Storage 2022, 19, 010910. [Google Scholar] [CrossRef]
- He, G.; Li, Z.; Li, Y.; Li, Z.; Wu, H.; Yang, X.; Jiang, Z. Zwitterionic Microcapsules as Water Reservoirs and Proton Carriers within a Nafion Membrane to Confer High Proton Conductivity under Low Humidity. ACS Appl. Mater. Interfaces 2014, 6, 5362–5366. [Google Scholar] [CrossRef]
- Li, Z.; He, G.; Zhang, B.; Cao, Y.; Wu, H.; Jiang, Z.; Tiantian, Z. Enhanced Proton Conductivity of Nafion Hybrid Membrane under Different Humidities by Incorporating Metal–Organic Frameworks with High Phytic Acid Loading. ACS Appl. Mater. Interfaces 2014, 6, 9799–9807. [Google Scholar] [CrossRef]
- Faulkner, L.R.; Bard, A.J. Electrochemical Methods: Fundamentals and Applications; John Wiley and Sons: New York, NY, USA, 2002. [Google Scholar]
- Inoue, G.; Yokoyama, K.; Ooyama, J.; Terao, T.; Tokunaga, T.; Kubo, N.; Kawase, M. Theoretical Examination of Effective Oxygen Diffusion Coefficient and Electrical Conductivity of Polymer Electrolyte Fuel Cell Porous Components. J. Power Sources 2016, 327, 610–621. [Google Scholar] [CrossRef]
- O’Neil, K.; Meyers, J.P.; Darling, R.M.; Perry, M.L. Oxygen Gain Analysis for Proton Exchange Membrane Fuel Cells. Int. J. Hydrogen Energy 2012, 37, 373–382. [Google Scholar] [CrossRef]
- Inoue, G.; Ohnishi, T.; So, M.; Park, K.; Ono, M.; Tsuge, Y. Simulation of carbon black aggregate and evaluation of ionomer structure on carbon in catalyst layer of polymer electrolyte fuel cell. J. Power Source 2019, 439, 227060. [Google Scholar] [CrossRef]
- Choi, S.; Stassi, S.; Pisano, A.P.; Zohdi, T.I. Coffee-Ring Effect-Based Three Dimensional Patterning of Micro/Nanoparticle Assembly with a Single Droplet. Langmuir 2010, 26, 11690–11698. [Google Scholar] [CrossRef] [PubMed]
- Qayyum, H.; Tseng, C.J.; Huang, T.W.; Chen, S.Y. Pulsed Laser Deposition of Platinum Nanoparticles as a Catalyst for High-Performance PEM Fuel Cells. Catalysts 2016, 6, 180. [Google Scholar] [CrossRef] [Green Version]
- Sabarirajan, D.C.; Liu, J.; Qi, Y.; Perego, A.; Haug, A.T.; Zenyuk, I.V. Determining Proton Transport in Pseudo Catalyst Layers Using Hydrogen Pump DC and AC Techniques. J. Electrochem. Soc. 2020, 167, 084521. [Google Scholar] [CrossRef]
Figure 1.
Schematic of the CCL.

Figure 2.
Calculation of (a) the diffusion length of oxygen, (b) the diffusion length of proton and (c) the relationship between the effectiveness factor and the Thiele modulus of the CCLs with flat and 3D structures. Calculation of the conduction length of flat- or 3D-patterned IL structures.
Figure 2.
Calculation of (a) the diffusion length of oxygen, (b) the diffusion length of proton and (c) the relationship between the effectiveness factor and the Thiele modulus of the CCLs with flat and 3D structures. Calculation of the conduction length of flat- or 3D-patterned IL structures.

Figure 3.
(a) Photographs of the (a) printed ionomer or catalyst layers on the Nafion film. (b) Schematic of the design and fabrication of CCL structures with flat and 3D patterns.
Figure 3.
(a) Photographs of the (a) printed ionomer or catalyst layers on the Nafion film. (b) Schematic of the design and fabrication of CCL structures with flat and 3D patterns.

Figure 4.
Surface SEM images at the 500 μm (a,b,g,h) and 50 μm (c,d,i,j) scales and cross-sectional (e,f,k,l) SEM images of the flat- and 3D-patterned structures in each IL and CL.
Figure 4.
Surface SEM images at the 500 μm (a,b,g,h) and 50 μm (c,d,i,j) scales and cross-sectional (e,f,k,l) SEM images of the flat- and 3D-patterned structures in each IL and CL.

Figure 5.
SEM images of the four types of 3D-patterned and flat-patterned structures fabricated using ionomer solution and catalyst ink.
Figure 5.
SEM images of the four types of 3D-patterned and flat-patterned structures fabricated using ionomer solution and catalyst ink.

Figure 6.
(a) Polarization curves and (b) power densities of the four samples at 100% RH.

Figure 7.
Performance of the four CCLs at (a) 0.6 V and (b) 0.2 V and the (c) maximum power density at 100% RH.
Figure 7.
Performance of the four CCLs at (a) 0.6 V and (b) 0.2 V and the (c) maximum power density at 100% RH.

Figure 8.
(a) Polarization curves and (b) power densities of the four samples at 40% RH.

Figure 9.
Performance of the four CCLs at (a) 0.6 V and (b) 0.2 V and the (c) maximum power density at 40% RH.
Figure 9.
Performance of the four CCLs at (a) 0.6 V and (b) 0.2 V and the (c) maximum power density at 40% RH.

Figure 10.
(a) Impedance spectra and (b) charge transfer resistances of the four CCLs at 0.6 V, 80 °C, and 40% RH.
Figure 10.
(a) Impedance spectra and (b) charge transfer resistances of the four CCLs at 0.6 V, 80 °C, and 40% RH.

Figure 11.
Limiting current densities of the four CCLs using 1% oxygen gas at 80 ℃ and 95% RH.

Table 2.
CCLs with flat and 3D patterns at the CL and IL.
| Pattern | IL | CL |
|---|---|---|
| Str.1 (IL W/O + CL 3D) | - | 3D |
| Str.2 (IL Flat + CL Flat) | Flat | Flat |
| Str.3 (IL 3D + CL Flat) | 3D | Flat |
| Str.4 (IL 3D + CL 3D) | 3D | 3D |
Publisher’s Note: MDPI stays neutral with regard to jurisdictional claims in published maps and institutional affiliations. |
© 2022 by the authors. Licensee MDPI, Basel, Switzerland. This article is an open access article distributed under the terms and conditions of the Creative Commons Attribution (CC BY) license (https://creativecommons.org/licenses/by/4.0/).
Share and Cite
MDPI and ACS Style
Noh, T.; Park, K.; Gao, R.; Kimura, N.; Inoue, G.; Tsuge, Y. Effect of Double-Sided 3D Patterned Cathode Catalyst Layers on Polymer Electrolyte Fuel Cell Performance. Energies 2022, 15, 1179. https://doi.org/10.3390/en15031179
AMA Style
Noh T, Park K, Gao R, Kimura N, Inoue G, Tsuge Y. Effect of Double-Sided 3D Patterned Cathode Catalyst Layers on Polymer Electrolyte Fuel Cell Performance. Energies. 2022; 15(3):1179. https://doi.org/10.3390/en15031179
Chicago/Turabian StyleNoh, Taehyoung, Kayoung Park, Ruijing Gao, Naoki Kimura, Gen Inoue, and Yoshifumi Tsuge. 2022. "Effect of Double-Sided 3D Patterned Cathode Catalyst Layers on Polymer Electrolyte Fuel Cell Performance" Energies 15, no. 3: 1179. https://doi.org/10.3390/en15031179
Note that from the first issue of 2016, this journal uses article numbers instead of page numbers. See further details here.