
The Effect of Intake Valve Timing on Spark-Ignition Engine Performances Fueled by Natural Gas at Low Power
by
 , and
, and
Alfredas Rimkus
1,2 ,
,
Tadas Vipartas
1,2,
Donatas Kriaučiūnas
1,2,
Jonas Matijošius
1,2,* and
Tadas Ragauskas
1,2 1
Department of Automobile Transport Engineering, Technical Faculty, Vilnius College of Technologies and Design, Olandu Str. 16, LT-01100 Vilnius, Lithuania
2
Department of Automobile Engineering, Faculty of Transport Engineering, Vilnius Gediminas Technical University, J. Basanavičiaus Str. 28, LT-03224 Vilnius, Lithuania
*
Author to whom correspondence should be addressed.
Energies 2022, 15(2), 398; https://doi.org/10.3390/en15020398
Submission received: 11 November 2021
/
Revised: 2 January 2022
/
Accepted: 4 January 2022
/
Published: 6 January 2022
(This article belongs to the Special Issue Development of Efficient Internal Combustion Engines and Vehicle Powertrains)
Abstract
:To reduce the greenhouse effect, it is important to reduce not only carbon dioxide but also methane emissions. Methane gas can be not only a fossil fuel (natural gas) but also a renewable energy source when it is extracted from biomass. After biogas has been purified, its properties become closer to those of natural gas or methane. Natural gas is an alternative energy source that can be used for spark-ignition engines, but its physicochemical properties are different from those of gasoline, and the spark-ignition engine control parameters need to be adjusted. This article presents the results of a study that considers a spark-ignition engine operating at different speeds (2000 rpm, 2500 rpm, and 3000 rpm) and the regulation of the timing of intake valve closure when the throttle is partially open (15%), allowing the engine to maintain the stoichiometric air–fuel mixture and constant spark timing. Studies have shown a reduction in engine break torque when petrol was replaced by natural gas, but break thermal efficiency has increased and specific emissions of pollutants (NOx, HC, CO2 (g/kWh)) have decreased. The analysis of the combustion process by the AVL BOOST program revealed different results when the engine ran on gasoline as opposed to when it ran on natural gas when the timing of intake valve closure changed. The volumetric efficiency of the engine and the speed of the combustion process, which are significant for engine performance due to the different properties of gasoline and natural gas fuels, can be partially offset by adjusting the spark timing and timing of intake valve closure. The effect of intake valve timing on engine fueled by natural gas more noticeable at lower engine speeds when the engine load is low.
1. Introduction
Climate change is driving the development of the EU transport sector based on the two key criteria that have been set out in the Transport White Paper [1]: the rational use of existing resources in transport and the improvement of ecological transport characteristics in order to achieve climate-neutral greenhouse gas emissions. This is very important for the assessment of individual emission groups, where the hazard criterion can be assessed through the prism of recalculated CO2 emissions [2]. The first problem can be solved using renewable and/or alternatives to fossil fuels as energy sources [3,4]. The use of such resources is based on the use of biofuels [5,6,7] and electrification strategies [8,9]. It is clear that the development of an electric vehicle that does not emit emissions is the ultimate goal for the final stages of the switch to greener sources of energy, [10,11], but there are some existing problems that slow down the use of vehicles, such as the still underdeveloped charging stations network [12,13] as well as expensive and technologically sophisticated battery recycling technologies [14], and it should also be noted that the energy infrastructure resources that are currently available for electric vehicles are insufficient, although they continue to develop at an adequate rate. Additionally, judging by the prism of “green energy”, it can be said that its share now accounts for a small share of total energy production [15,16,17]. In this situation, with a rational assessment of the existing resources, the internal combustion engines that are already on the market are being improved [18,19,20,21] in order to ensure that the transport sector is able to undergo a smooth transition towards the climate-neutral emission targets that have been set [22,23]. Several development scenarios are possible for this purpose to be achieved, from the use of alternative fuels to the optimization of engine design/control parameters [24,25]. The complex synergy within these solutions allows for the issues surrounding increasing the efficiency of engine operation processes and controlling the exhaust emissions that result from these processes to be solved in an optimized way, which ensures the practical realization of the second task.
SI engines use valve timing control to increase volume efficiency by an average of ~5% over the speed range that a vehicle can travel [26]. However, this is more effective when it is combined with partial-cylinder disconnection at low speeds, where fuel economy of up to 17% can be achieved [27]. However, making specialized modifications to the camshaft mechanism can increase the volumetric efficiency by up to 7% at high speeds [28]. As the residual gas fractions and the effective degree of compression decrease, a drop in gas temperature and pressure can occur. This is the main reason why worse combustion can be observed during valve timing [29]. With the use of a turbocharger in the SI engine and with the optimization of valve timing angles, an instantaneous increase in turbine operating efficiency can be observed due to the higher amount of exhaust energy that is entering the turbine [30]. A Miller cycle and different profile cams are used during this process and are distributed for use for both full and part load modes. The overall engine efficiency of both methods increases by approximately 1% [31]. Consequently, the use of a hydraulic valve timing device can improve the engine power parameters by up to 13.5% and can reduce fuel consumption by 16.1 g/kWh during the Otto–Atkinson mixed cycle [32]. Ericsson timing has improved the engine power and thermal efficiency in engines with a gas-to-gas heat exchanger [33]. Atkinson cycle engines with variable valve timing (VVT) technology are widely used in hybrid electric vehicles (HEVs), and this delays the closing of the intake valve and results fuel consumption that is lower by up to 30% [34].
Spark-ignition (SI) engines that use natural gas (NG) as a fuel source are characterized by lean combustion, which causes variations in the optimal air-to-fuel ratio when the engine load and fuel composition change. This results in lower combustion temperatures, slower methane compound oxidation processes, and higher hydrocarbon (HC) emissions [19]. Another emerging problem is that the natural gas is injected into the intake manifold when it is in a gaseous state, which reduces the vaporization heat while simultaneously reducing the volumetric efficiency to 3% [35]. The use of natural gas and valve timing techniques together allows each method to cancel out the disadvantages of the other. However, it should be emphasized that optimal values should be established for each speed and load range in order to ensure that the resulting emissions fall within the EURO 6 standard [36]. The use of natural gas and the Miller cycle can provide additional thermal efficiency gains of up to 5.5% despite an average effective pressure drop of up to 3% [37]. Engine exhaust using the valve timing and skip cycle strategy can be reduced in both the 1200 rpm and 1800 rpm categories. In previous studies, the reductions in nitrogen oxides were shown to range from 35% to 28%, and the engine exhaust from hydrocarbons was shown to range from 54% to 47% in the 1200 rpm and 1800 rpm categories, respectively. [38]. The influence of exhaust gas residuals (ExR) in the cylinder on the indicated specific fuel consumption (ISFC) and on engine pollutant emissions in a methane-fueled SI engine by changing the exhaust valve timing were investigated. NOx emissions decreased significantly (from 1800 to 600 ppm) when the ExR increased at 1250 rpm, while the NOx dropped from ~1100 ppm to ~500 ppm. However, carbon monoxide (CO) and total hydrocarbons (THC) increased by ~75% [39].
The purpose of this study was to determine the ability of the intake valve close (IVC) timing effect to change the energy and ecological performance of an engine after replacing gasoline (G) with natural gas at different engine speeds. It is important to evaluate the influence of IVC time on engine parameters, as many vehicles use an adjustable IVC timing system or may operate using Atkinson cycle engines (e.g., hybrid vehicles), so the effects of different fuels should be evaluated at different IVC times. In the test, the engine throttle opened by a small percentage (15%), allowing the evaluation of NG flow inertia and volumetric efficiency at a low engine load.
2. Materials and Methods
The technical data for the NISSAN HR16DE spark-ignition engine, the engine that was used in the present research, are presented in Table 1. The engine is equipped with a gasoline fueling system (fuel injection into the intake manifold, provided by the NISSAN (Yokohama, Japan) and an alternative gas injection system through which natural gas can be supplied. The opening and closing times (IVO and IVC) of the engine intake valves are controlled by a hydraulic variable valve timing (VVT) actuator that is controlled by an engine control unit (ECU). During the test, the engine control unit (ECU) was replaced with a MOTEC M800 programmable controller, which allowed the intake valve close (IVC) timing and the spark timing (ST) to be adjusted. The fuel injection quantity was regulated based on the information from the wideband oxygen (O2) sensor, the BOSCH LSU 4.9. This allowed for the excess air ration (lambda) to be controlled.
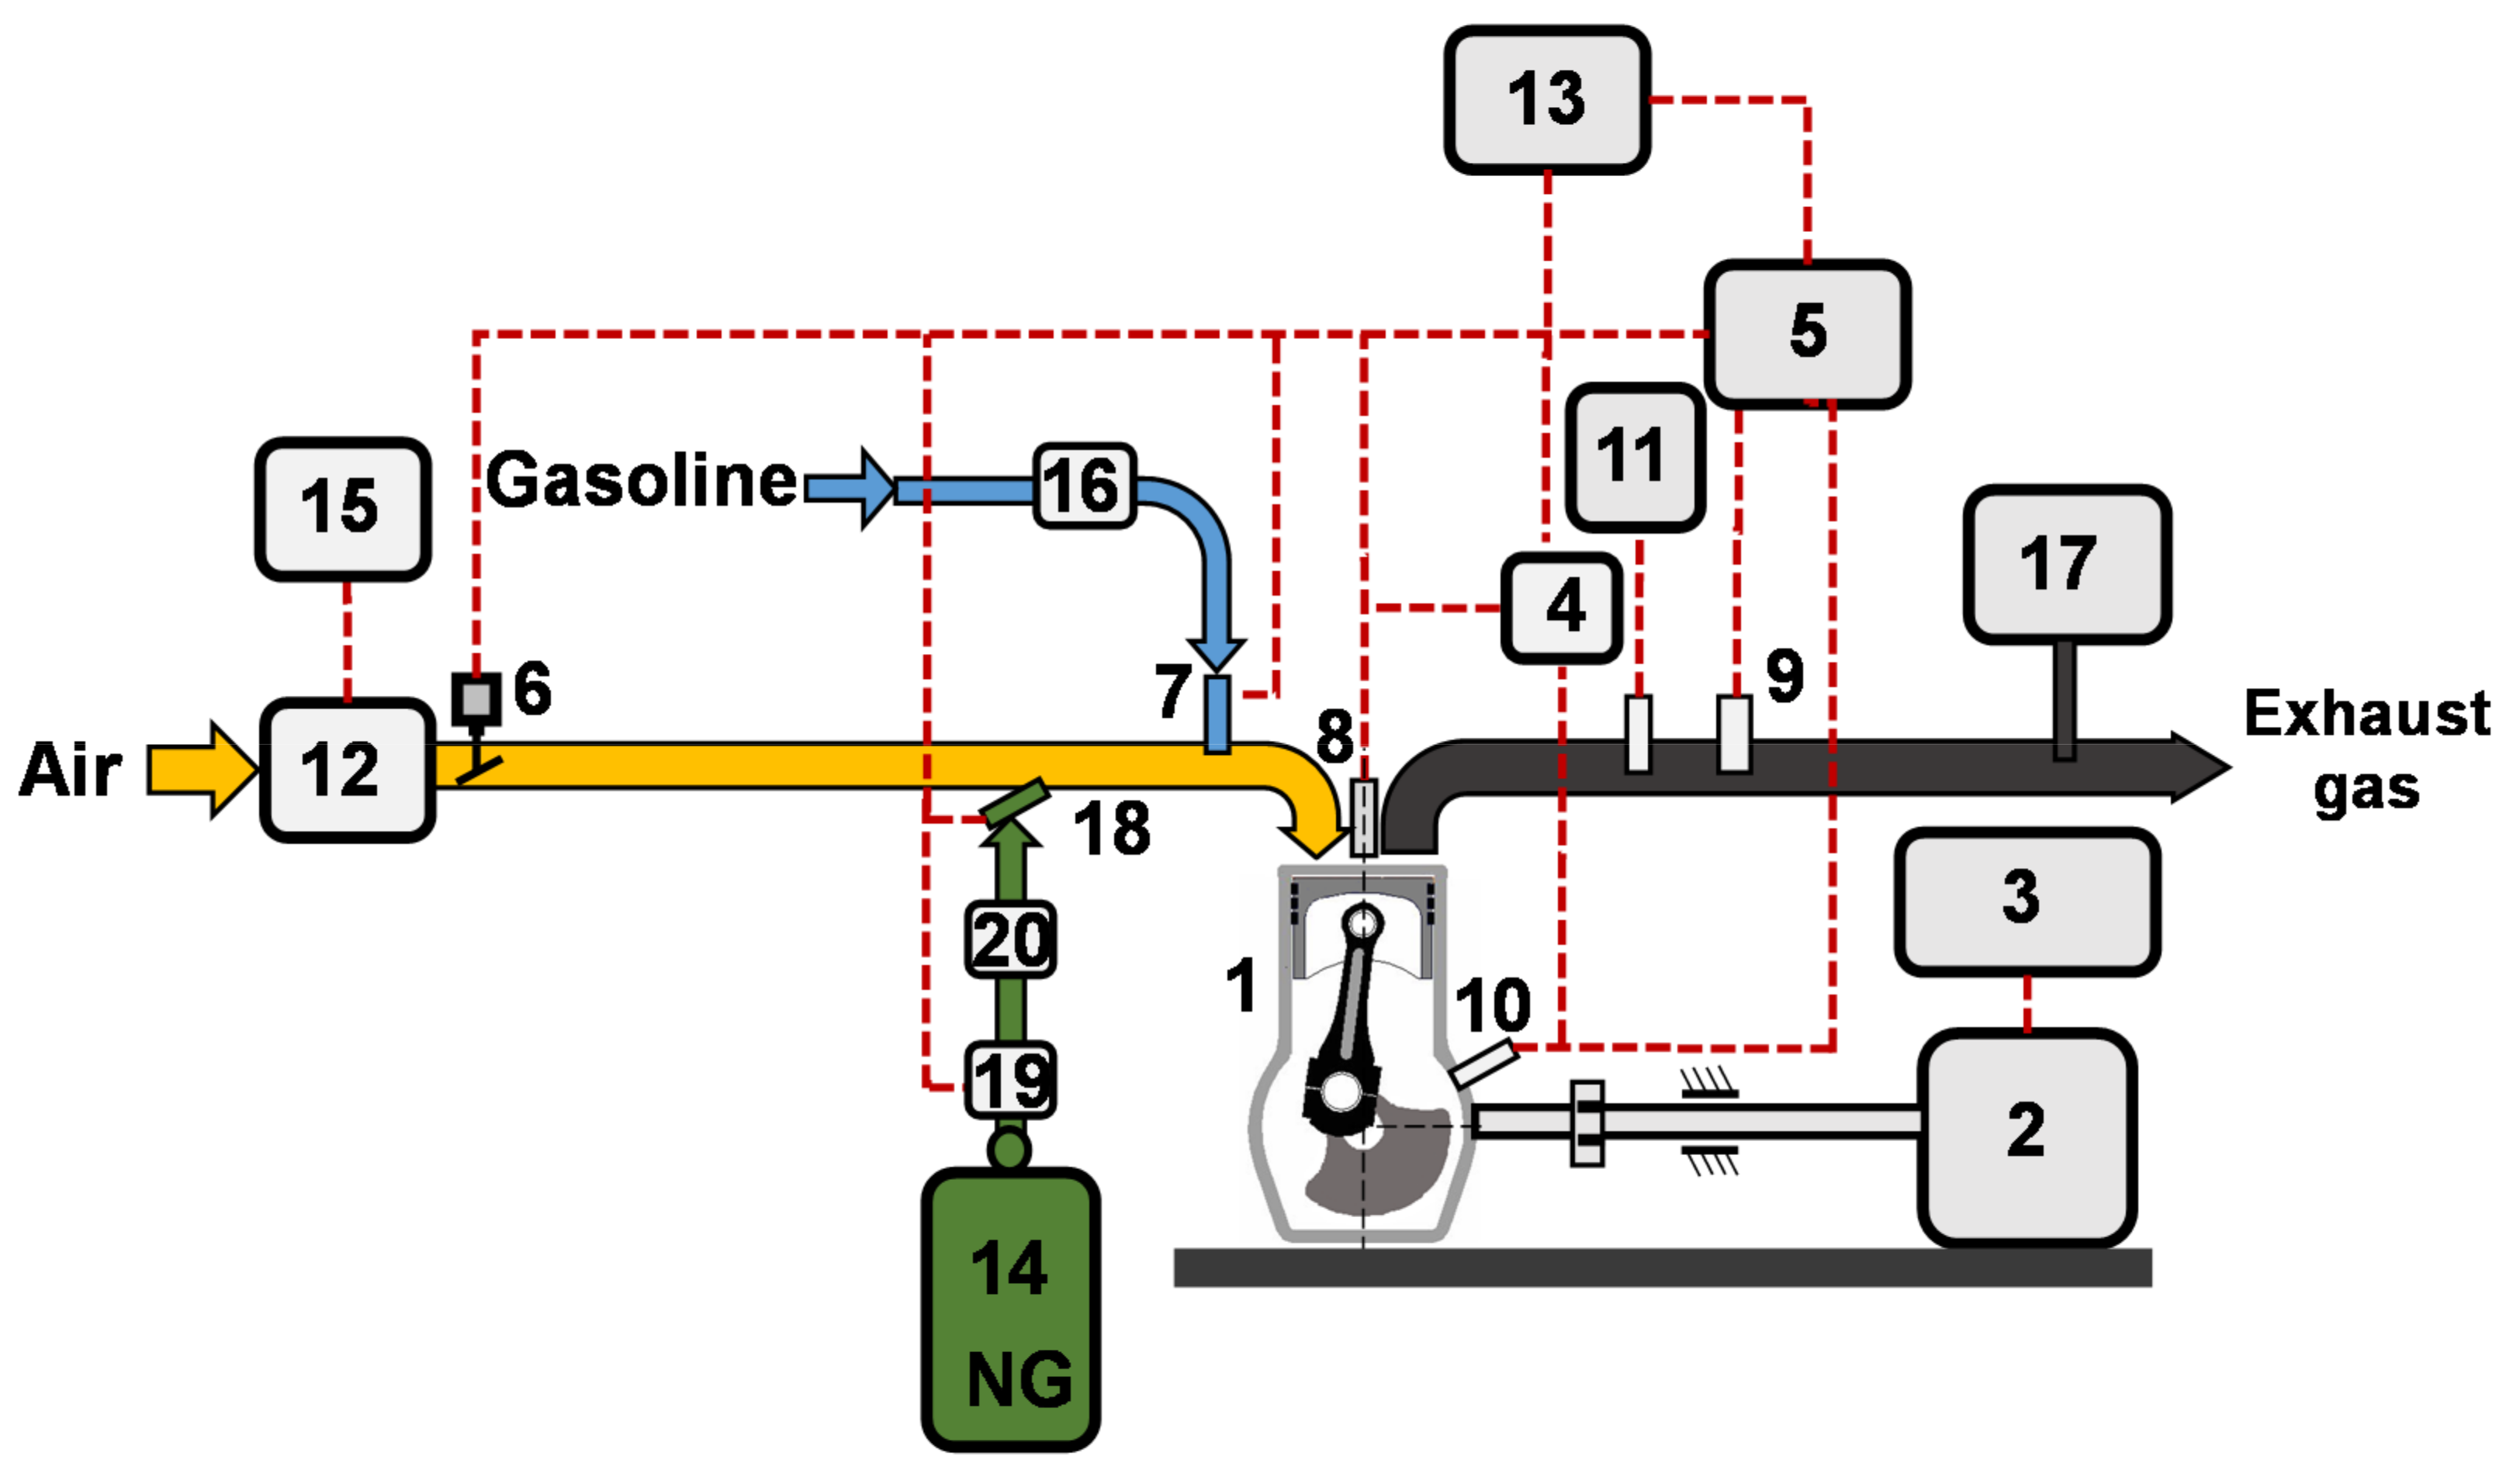
An eddy current-type engine load stand was used to set the brake torque (MB), specification is in Table 2. To maintain a stable operating temperature, the engine and the load bench were cooled using a plate heat exchanger throughout all the experiments. Gaseous fuel consumption was measured using the Coriolis type mass flowmeter, the intake air mass of the engine was measured with an HFM 5 m, and the temperature of the exhaust gas was measured using a K-type thermocouple. The piezoelectric pressure sensor that was integrated into the spark plug was used to measure the in-cylinder pressure, and the photoelectric encoder was used to determine the position of the crankshaft. The output signals from the pressure and encoder sensors were processed and recorded (100 cycles) with the LabView Real Time module. The composition of the exhaust gas (volume concentration of the individual components) was determined using a gas analyzer. Experiment test bench scheme is presented in Figure 1.
Experimental engine tests were performed at a fixed throttle position where the throttle was opened to 15%; at a fixed-ignition spark timing of ST = 22 CAD bTDC; and at a fixed excess air ratio of λ = 1. These fixed engine control parameters enabled the IVC time to influence the changes in the fuel energy flow to the cylinders, the combustion parameters, and the engine performance, allowing them to be evaluated. The engine ran at three different speeds: n = 2000 rpm, n = 2500 rpm, and n = 3000 rpm. With the engine running at medium speed when the throttle opened 15% the engine power is sufficient to drive in the city at a car speed of 50–60 km/h [40] The experiments used E95 summer gasoline fuel that had been labeled for the different engine speeds as G_2000, G_2500, and G_3000 and natural gas that had been labeled as NG_2000, NG_2500, and NG_3000. The main fuel properties are given in Table 3. The analysis of chemical kinematics was not evaluated in this study, because the subject of the study was related to the valve timing effect of converting gasoline to NG fuel.
The MOTEC M800 engine control unit changes the intake valve phase 6 times every 5 CAD by delaying the intake valve closing time (IVC) from 24 CAD aBDC to 54 CAD aBDC (for gasoline labelled as G_IVC24, G_ IVC29, G_ IVC34, G_ IVC44, G_ IVC49, and G_ IVC54 and for natural gas labelled as NG_ IVC24, NG_ IVC29, NG_ IVC34, NG_ IVC44, NG_ IVC49, and NG_ IVC54). For every measurement point, each experiment was repeated twice, and the intake valve closing time (IVC) was changed from 24 CAD aBDC to 54 CAD aBDC and vice versa (from 54 CAD aBDC to 24 CAD aBDC). Every parameter was measured 8 times, so after each experiment had been repeated, all the parameters had been measured 16 times.
Fuel supply is estimated by calculating the mass of fuel per cycle per cylinder, mg/cycl:
where: Bf—hourly fuel consumption, kg/h; τ—the number of strokes per cycle, τ = 4; n—engine speed, rpm; and i—the number of cylinders in the engine, i = 4.
Supply of energy per cycle to the cylinder, J/cycl:
where: LHV—lower heating value of fuel, MJ/kg.
The combustion process in the engine cylinder was analyzed in the AVL BOOST program by creating a numerical model of the engine that was being tested [41] and by using the BURN subroutine. The experimentally measured data were used for the analysis of the combustion process: in-cylinder pressure, fuel consumption, air consumption, and fuel properties, among others. Numerical analysis determined the rate of heat release (ROHR) (J/CAD), in-cylinder temperature (K) and temperature rise (K/CAD), in-cylinder pressure rise (MPa/CAD), and the rate at which the fuel mass fraction burned during the entire engine cycle. The results of the experimental research and of the numerical analysis of the combustion process provide an opportunity to comprehensively evaluate the effect of the intake valve timing of spark-ignition engine gasoline fuel changes on a natural gas.
3. Results and Analysis
3.1. Analysis of the Energy Performance
The energy performance of the engine was measured when the engine was running on conventional gasoline fuel (G). The engine throttle was open at 15%, and the excess air ratio λ = 1. The changes in the engine performance at various engine speeds and that were obtained by changing the intake valve closing (IVC) timing were studied.
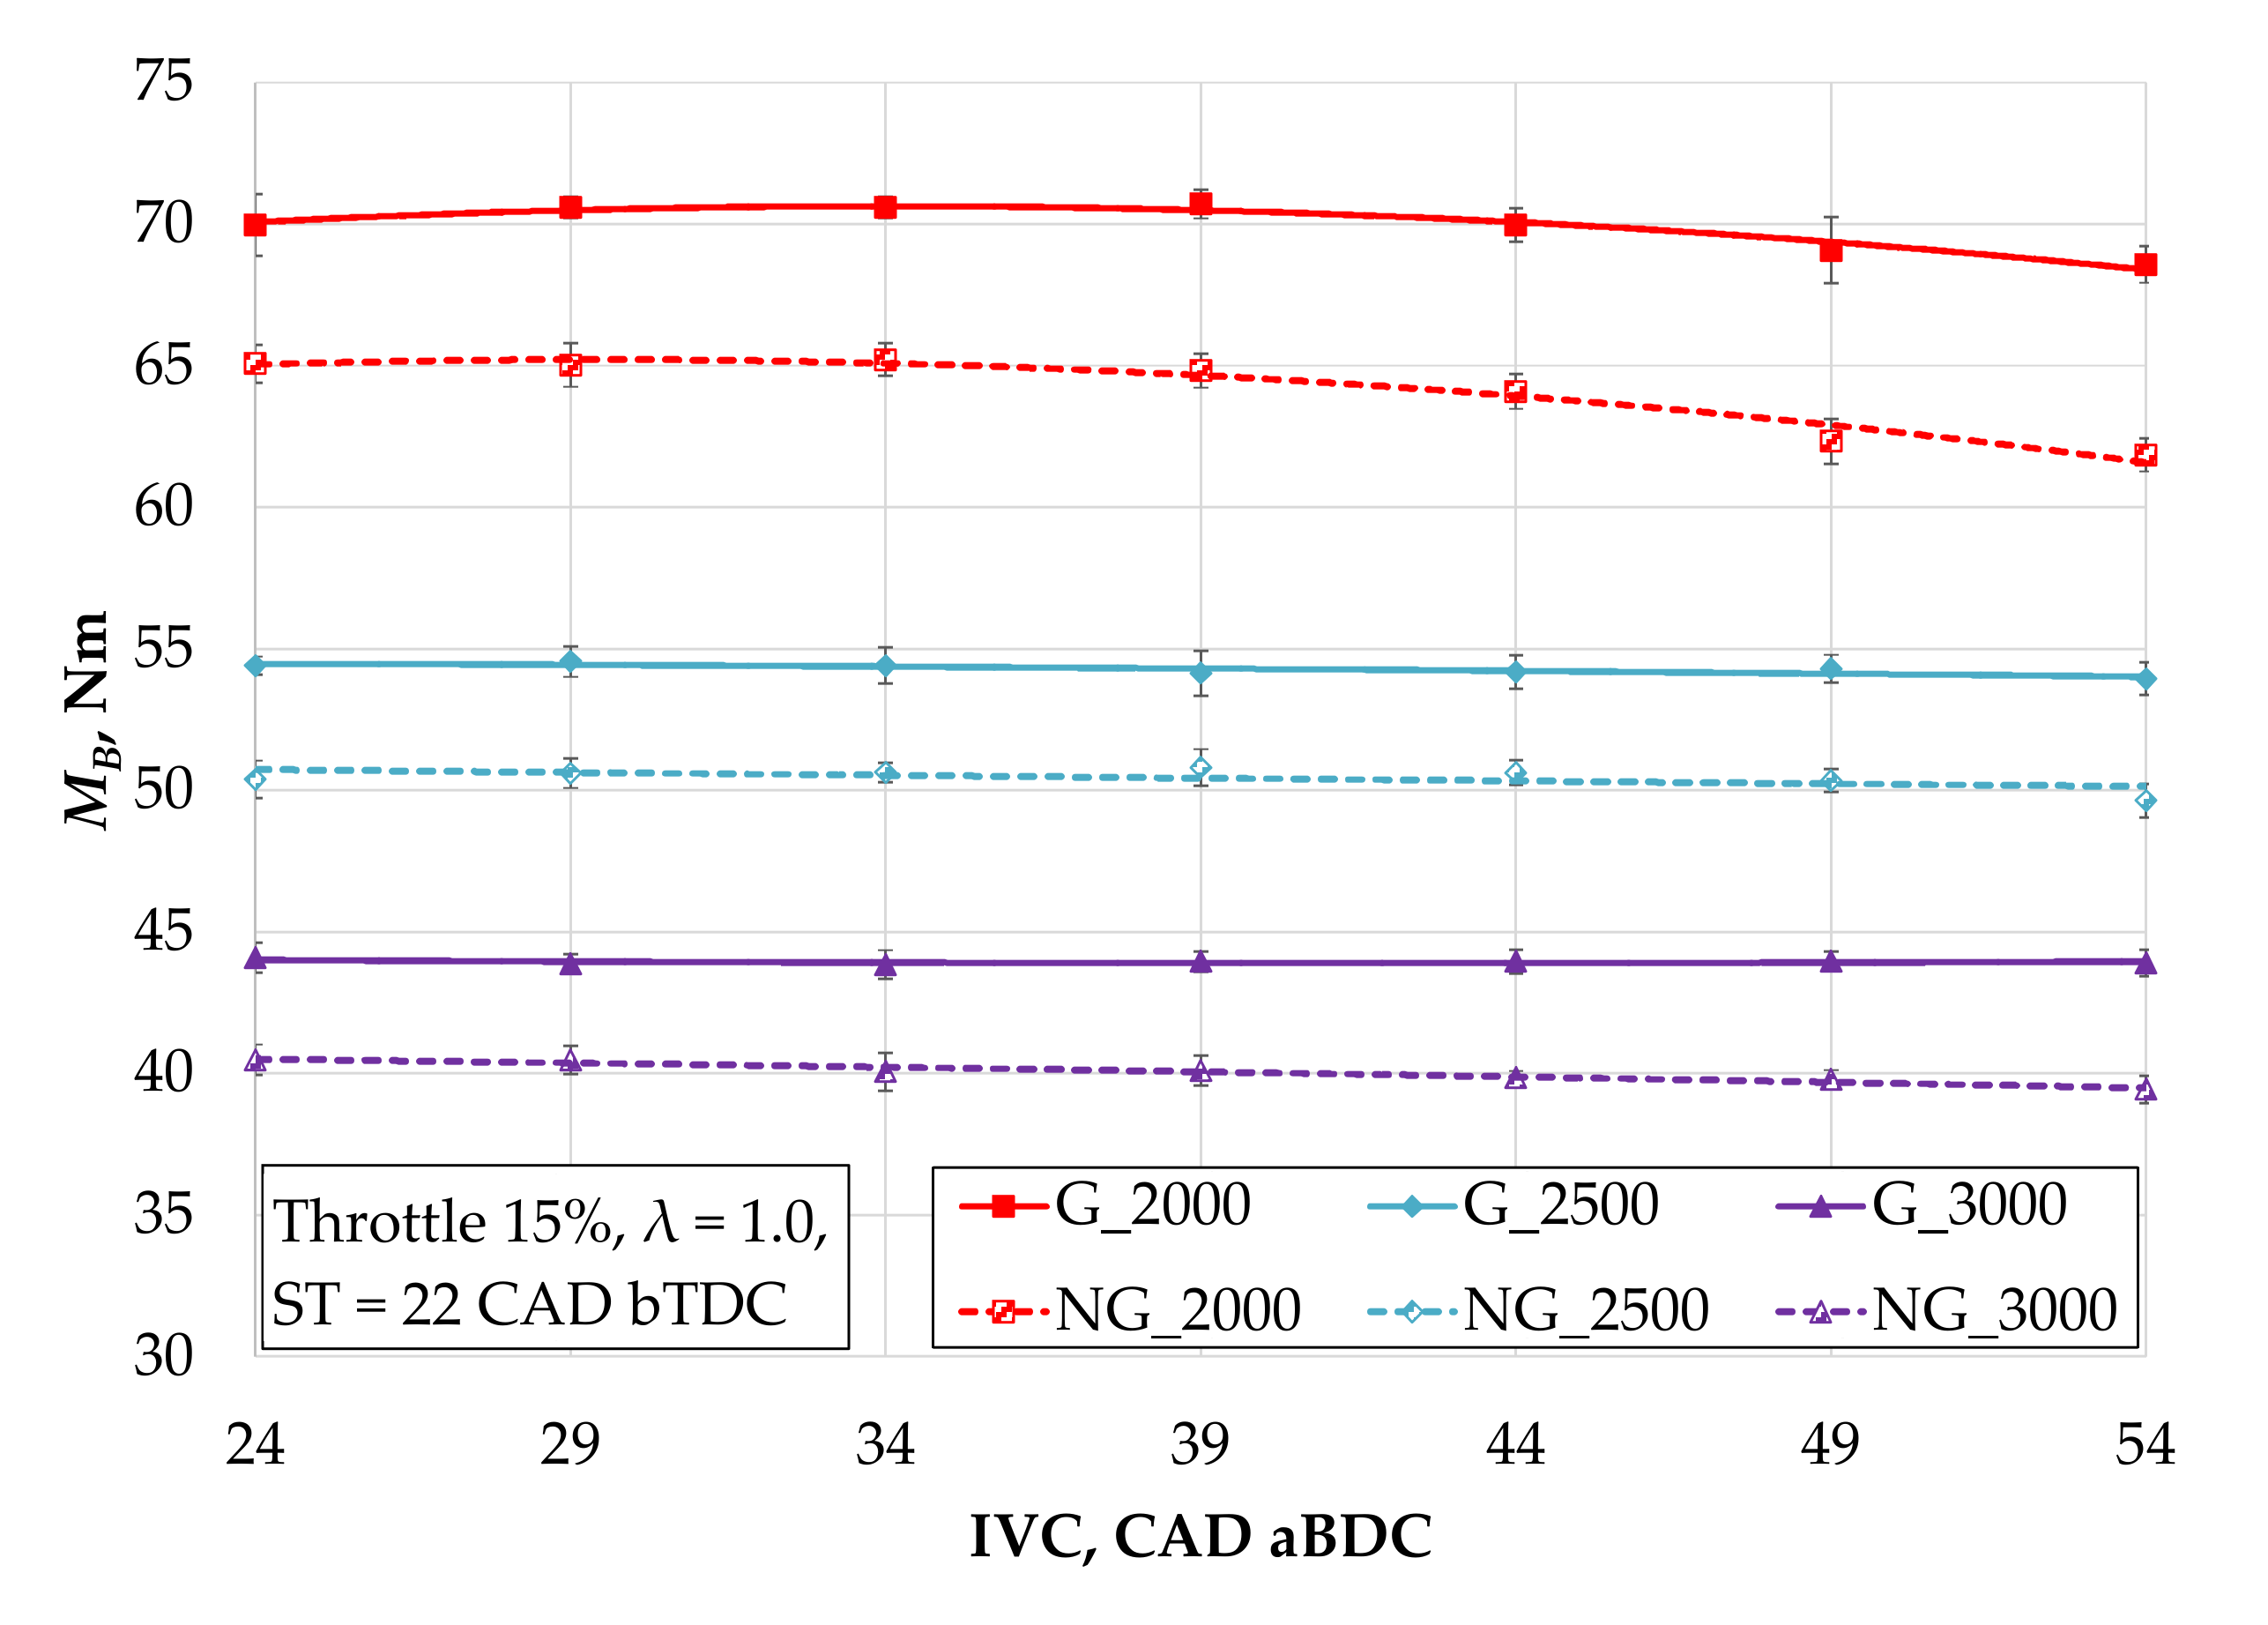
The maximum brake torque MB was reached when the engine was running on gasoline (G_2000) with an IVC timing of 39 CAD aBDC and MB = 70.7 Nm (Figure 2). When the IVC timing was advanced from 39 to 24 aBDC, the brake torque MB reduced by ~1% due to the unused inertia of the intake gas mixture. Delaying the IVC timing from 39 to 54 CAD aBDC MB reduced it by ~3% due to the air–fuel mixture partially returning to the intake manifold. Due to the low velocity of the engine, the flow inertia of the gas mixture was low, and the volumetric efficiency of the engine decreased when the IVC timing was delayed. Increasing the engine speed to G_2500 and G_3000 MB reduced the volumetric efficiency by an average of 22% and 37% compared to G_2000, which was likely due to the hydraulic resistance in the throttle (opened at 15%). The decrease in MB was also affected by the increasing mechanical losses of the engine. At engine speeds of 2500 and 3000 rpm, the change in IVC timing is negligible, as the increased inertia of the intake air–fuel mixture is inhibited by the throttle. When the engine was running on natural gas (NG_2000), the MB reduced by ~8% compared to when G_2000 was used due to the lower fuel mass that was entering the cylinder per cycle, decreasing the volumetric efficiency.
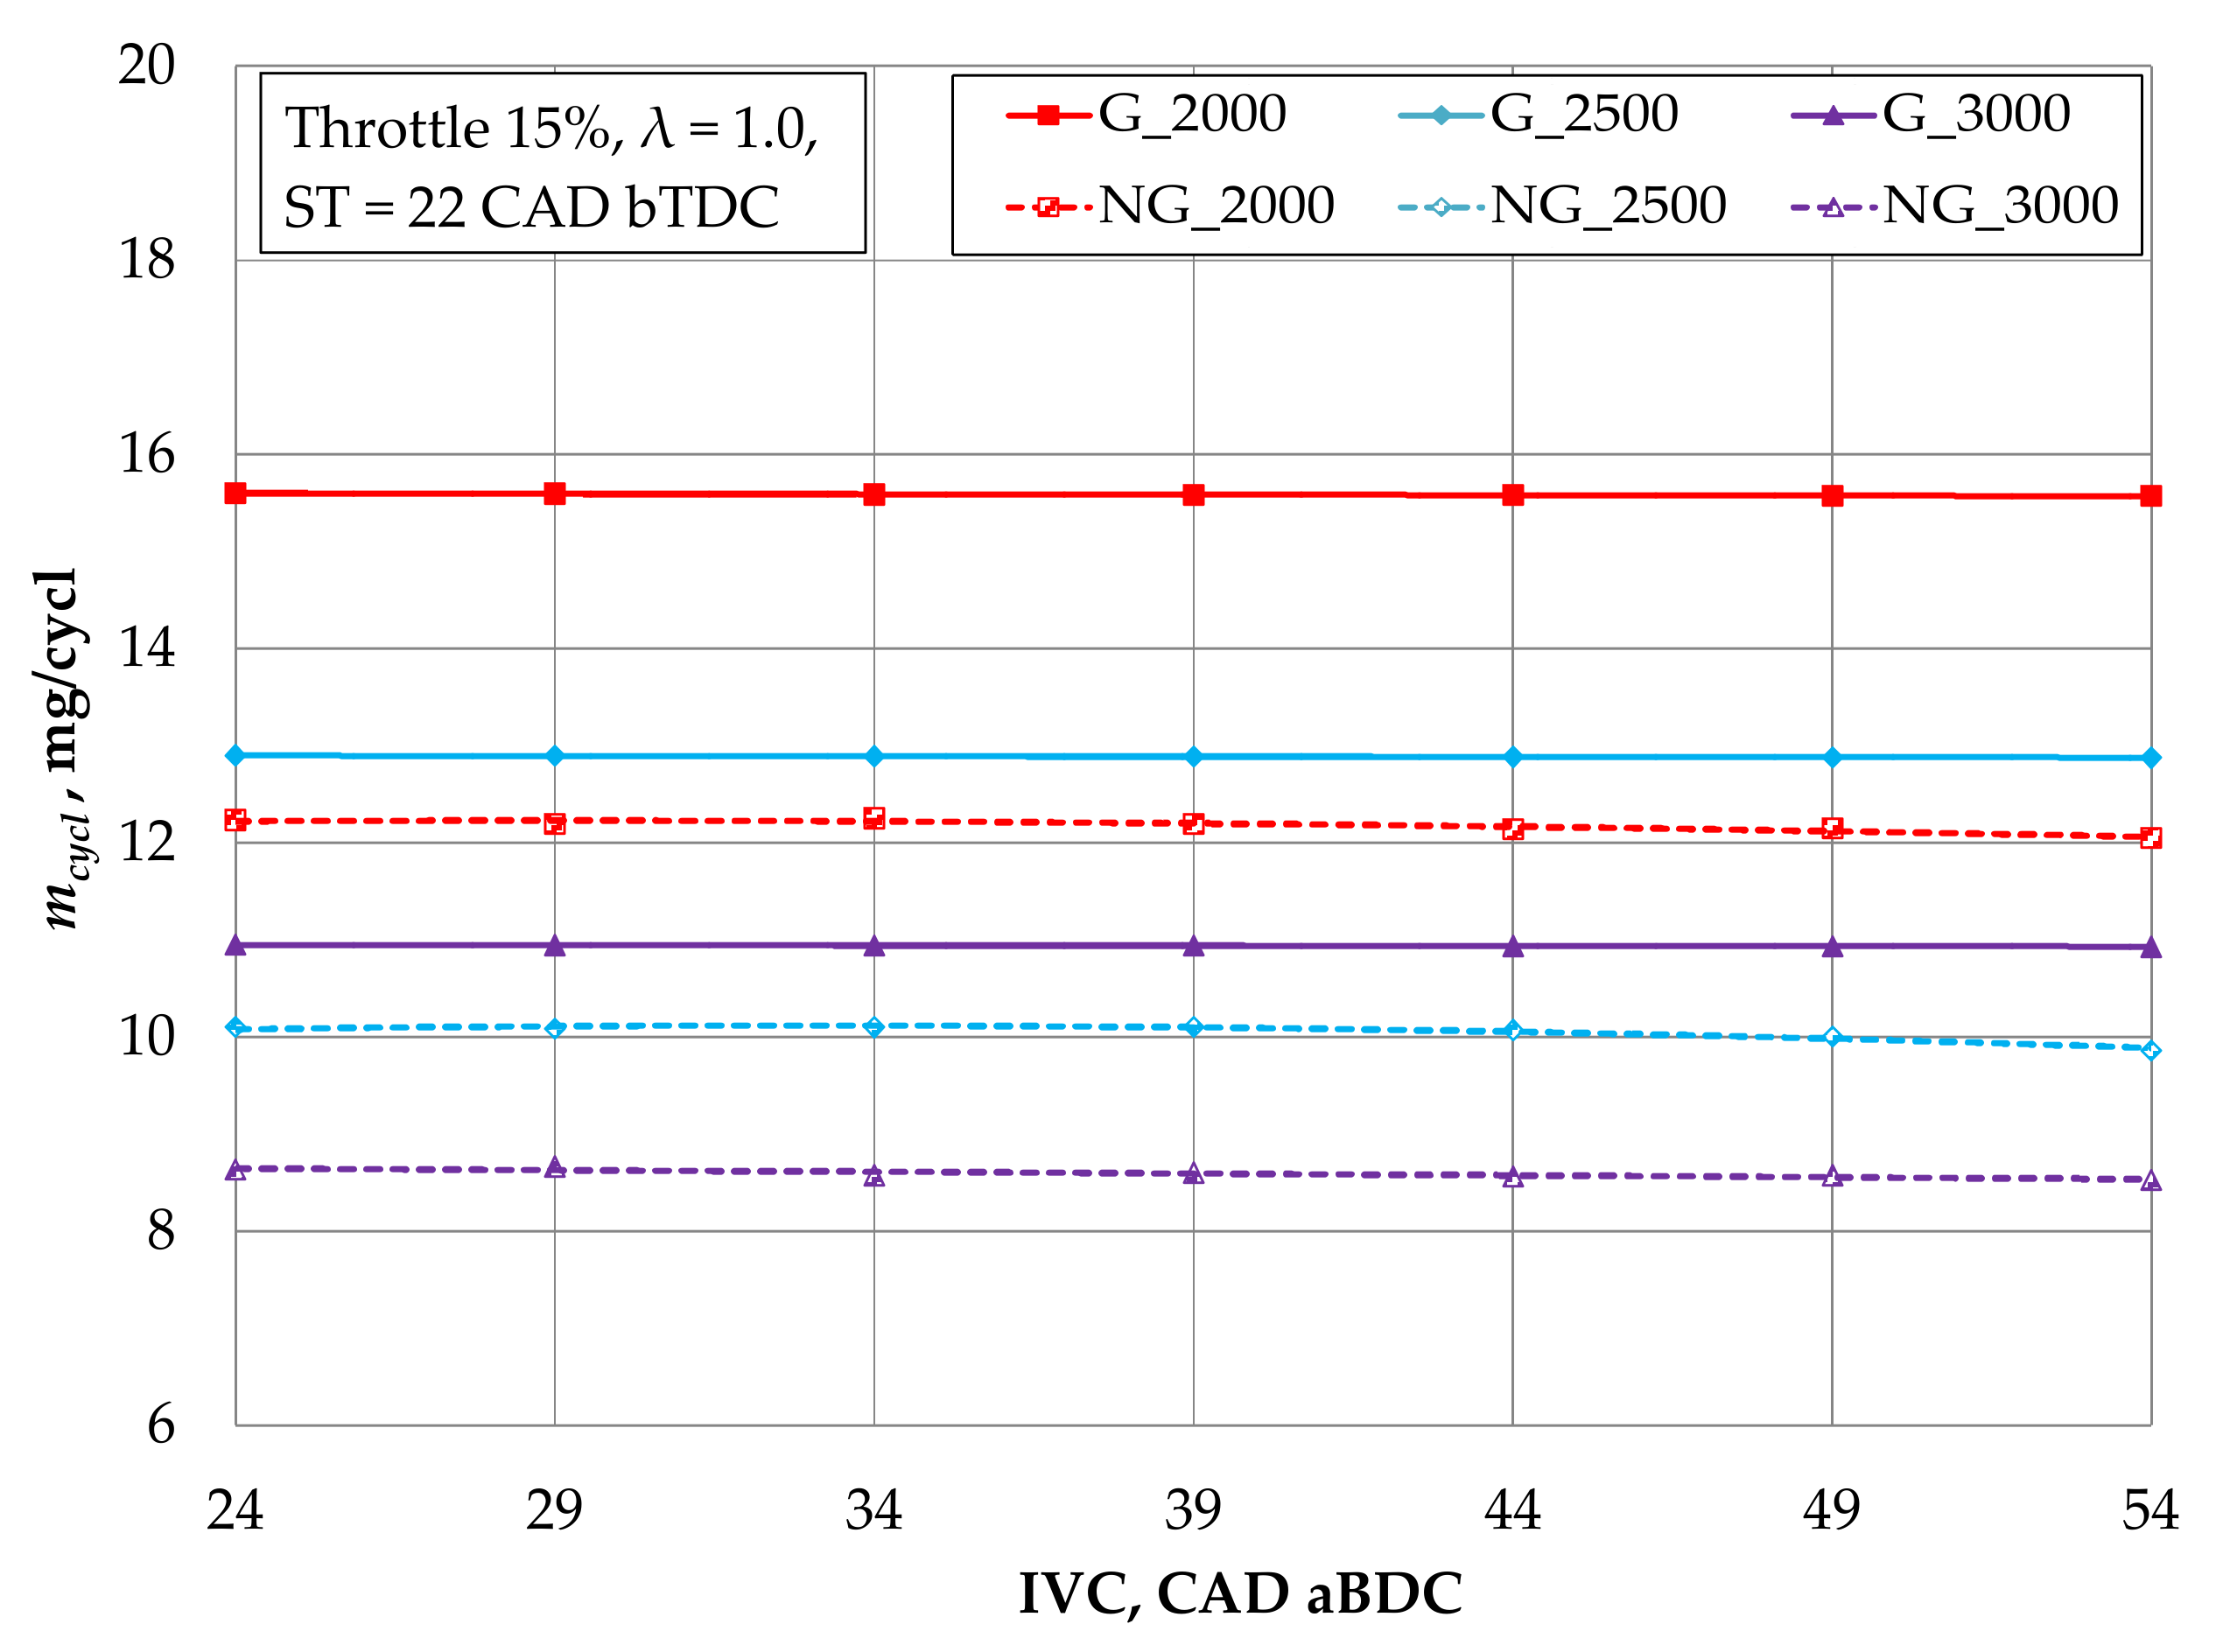
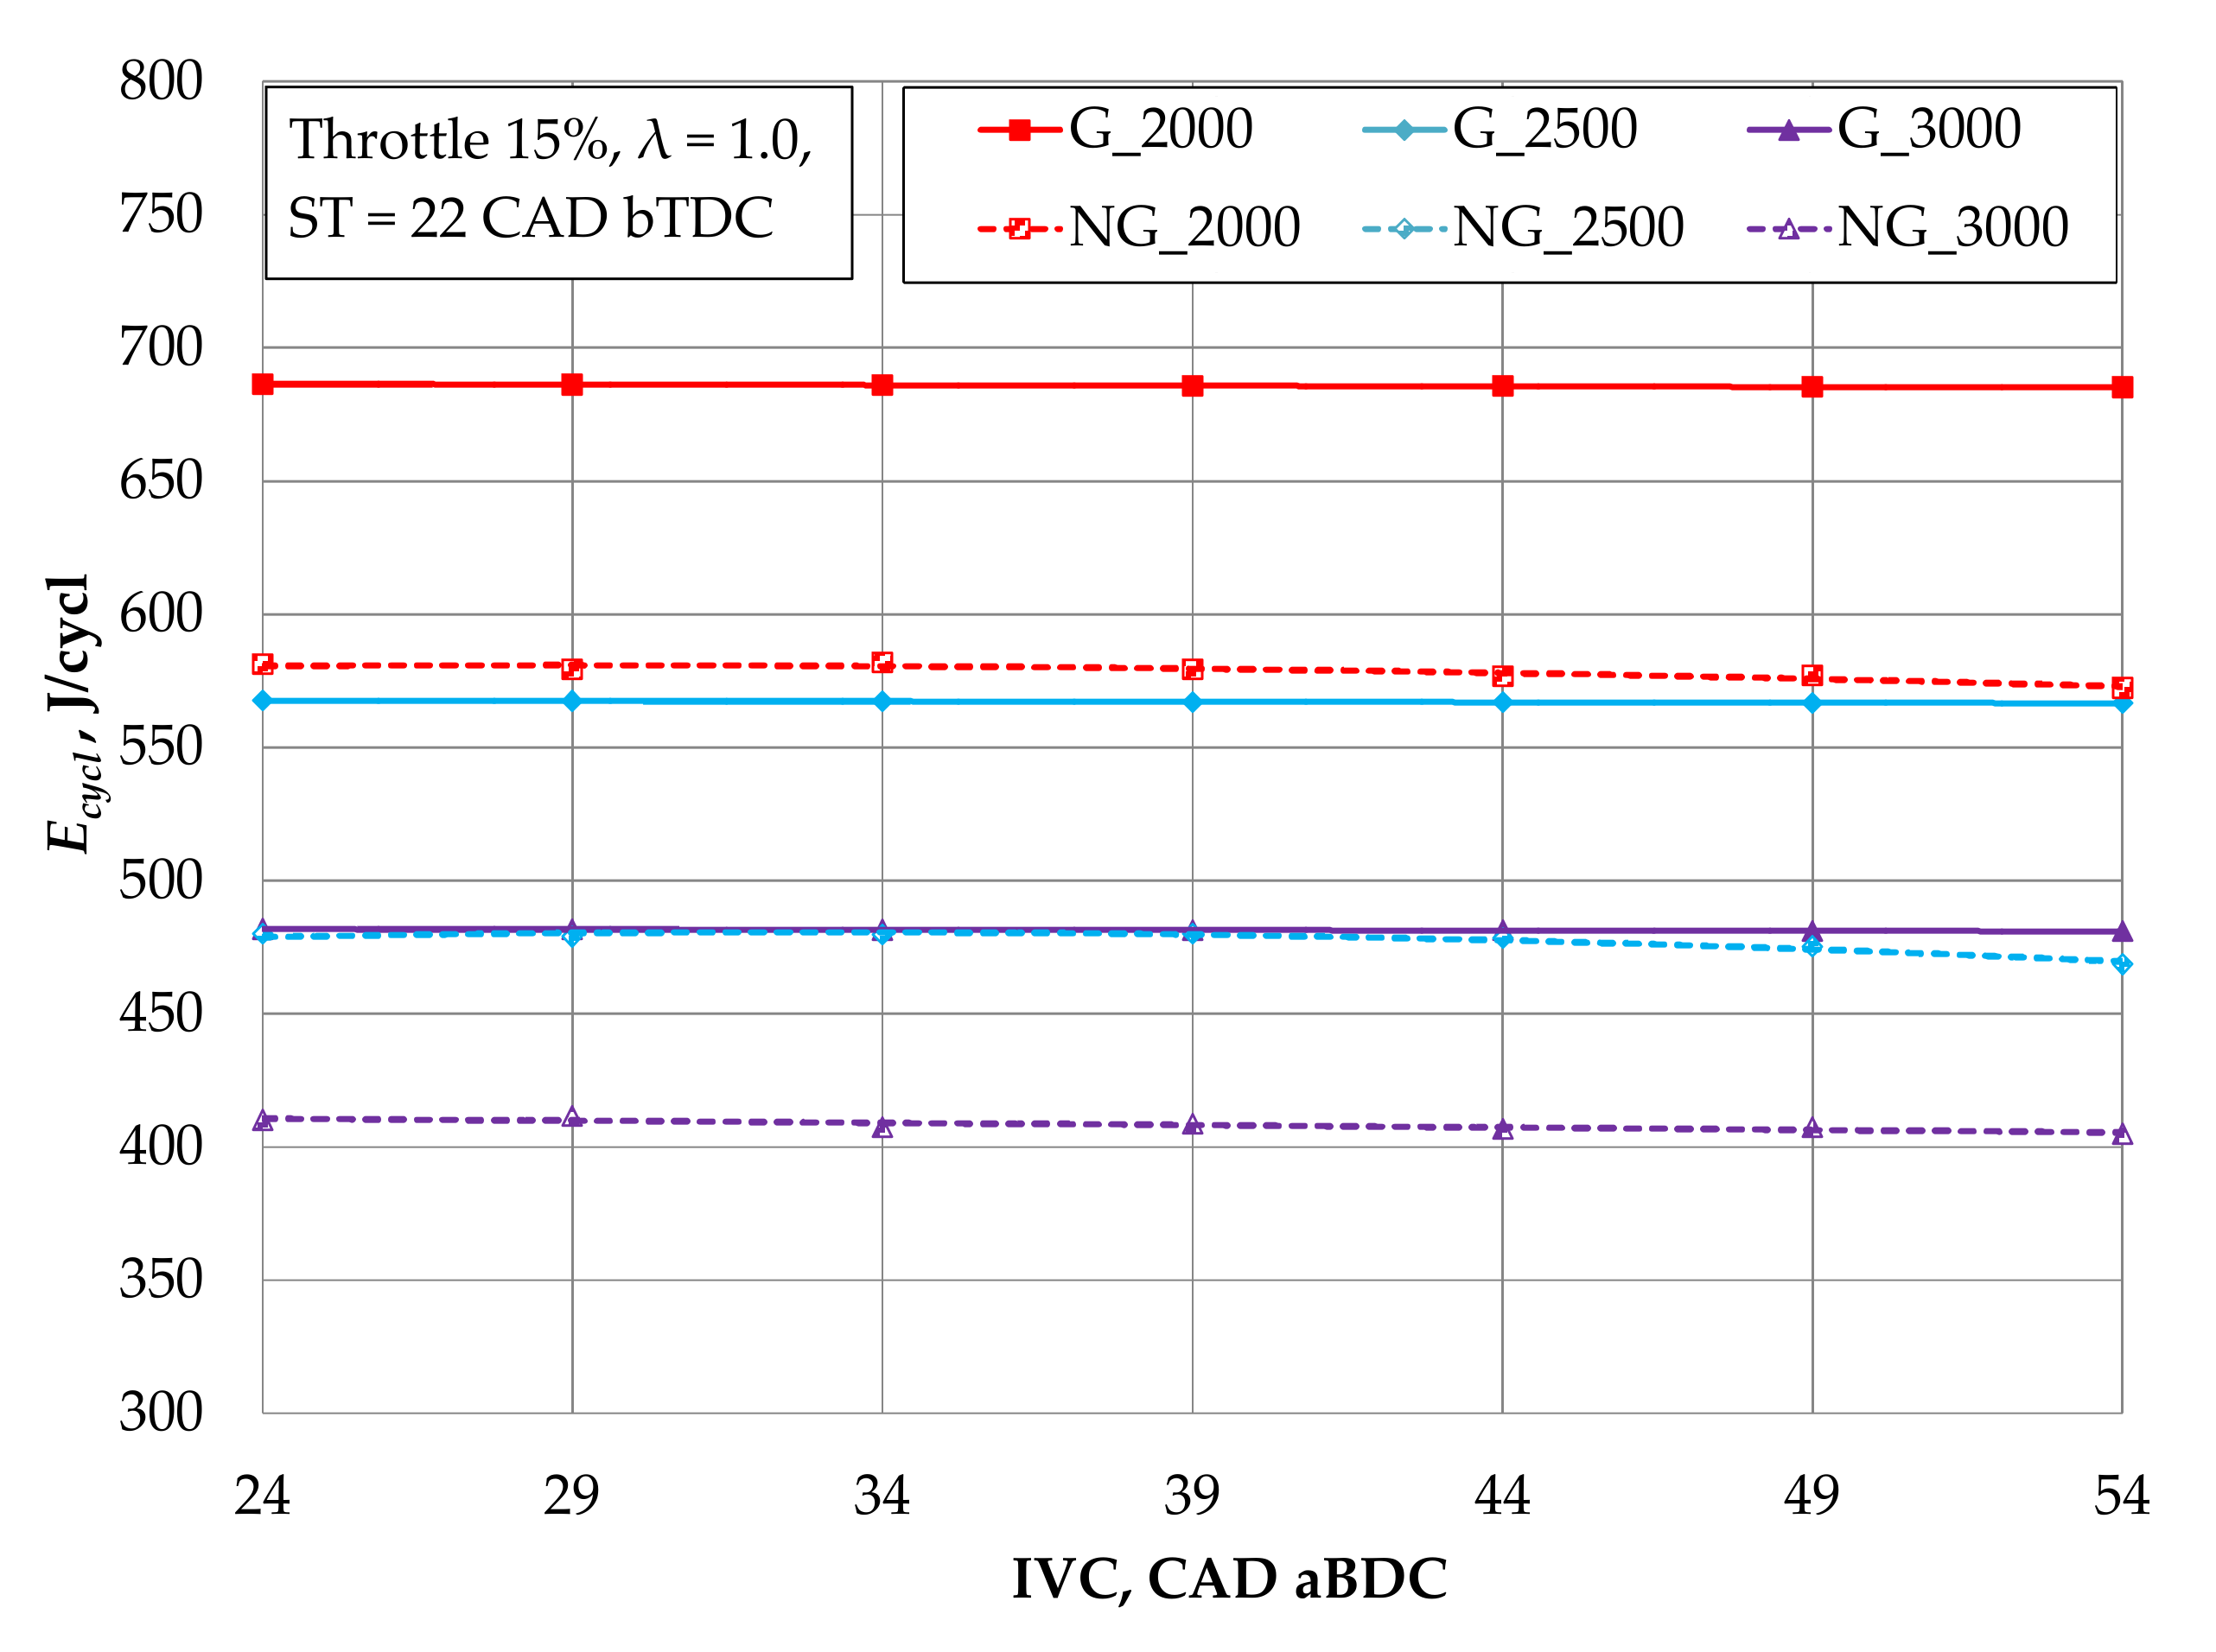
With NG, the fuel mass per cycle (mcycl) decreased (Figure 3). One of the reasons for this was the different air mass that is required for a stoichiometric NG–air mixture (λ = 1), which has ~16% more air mass (17.2 kg) per kilogram of gas compared to gasoline (14.7 kg) (Table 2). The second reason is that natural gas has a lower density, which means that the same fuel mass requires a larger cylinder volume compared to petrol. The third reason is the decreased inertia of the air/NG mixture. Although the lower heating value of NG (LHV) is ~8% higher (47.5 MJ/kg) compared to gasoline (44.0 MJ/kg), it does not compensate for the ~22% less mass of NG per cycle (Figure 3). NG supplies ~15.5% less energy to the cylinder per cycle (Ecycl) (Figure 4). During engine operation, the NG_2000 and IVC timing were delayed from 24 to 34 CAD aBDC, and the brake torque MB increased insignificantly (up to 0.2%), but with further IVC timing delays (up to 54 CAD aBDC), the MB decreased significantly, approximately 5%, due to the lower NG density and inertia, which decreased the mass and energy of the fuel entering the cylinder. During engine operation, NG_2500 and NG_3000 MB were reduced by ~8% compared to G_2500 and G_3000, and a more significant effect of IVC timing on the mass and energy of the NG entering the cylinder was observed compared to gasoline.
The graphs of the indicator cylinder pressure (Figure 5) correlate with fuel energy that is transferred to the cylinder per cycle and confirm the reasons for the changes in the brake torque. The maximum brake torque MB is generated at G_2000 and at an IVC timing of 39 CAD aBDC (Figure 2). In this mode, the maximum pressure in the engine cylinder (Figure 5a) is able to be reached due to the increased volumetric efficiency. Delaying the IVC timing, the maximum in-cylinder pressure decreased significantly due to the engine’s lower volumetric efficiency. Increasing the engine speed (G_2500, G_3000) prevents the cylinder from filling with a fresh flammable mixture (because the throttle is only 15% open), which reduces the maximum in-cylinder pressure (Figure 5b,c). However, at higher engine speeds, the intake valve control has little effect on the maximum in-cylinder pressure. When the throttle is 15% open, it damps the increase that is in seen in the gas flow inertia, and there is little variation in the engine’s volumetric efficiency.
When the engine was running on natural gas (NG_2000), the maximum in-cylinder pressure was significantly reduced (Figure 5a) compared to gasoline, as NG degraded the engine’s volumetric efficiency by introducing less energy to the cylinder. The maximum in-cylinder pressure also decreased when the IVC timing was 54 CAD aBDC. Increasing the engine speed (NG_2500, NG_3000) also resulted in a significantly lower maximum in-cylinder pressure compared to gasoline (Figure 5b,c). The effect of IVC timing on the in-cylinder pressure during gas-induced operation is visible, but no significant variations can be seen.
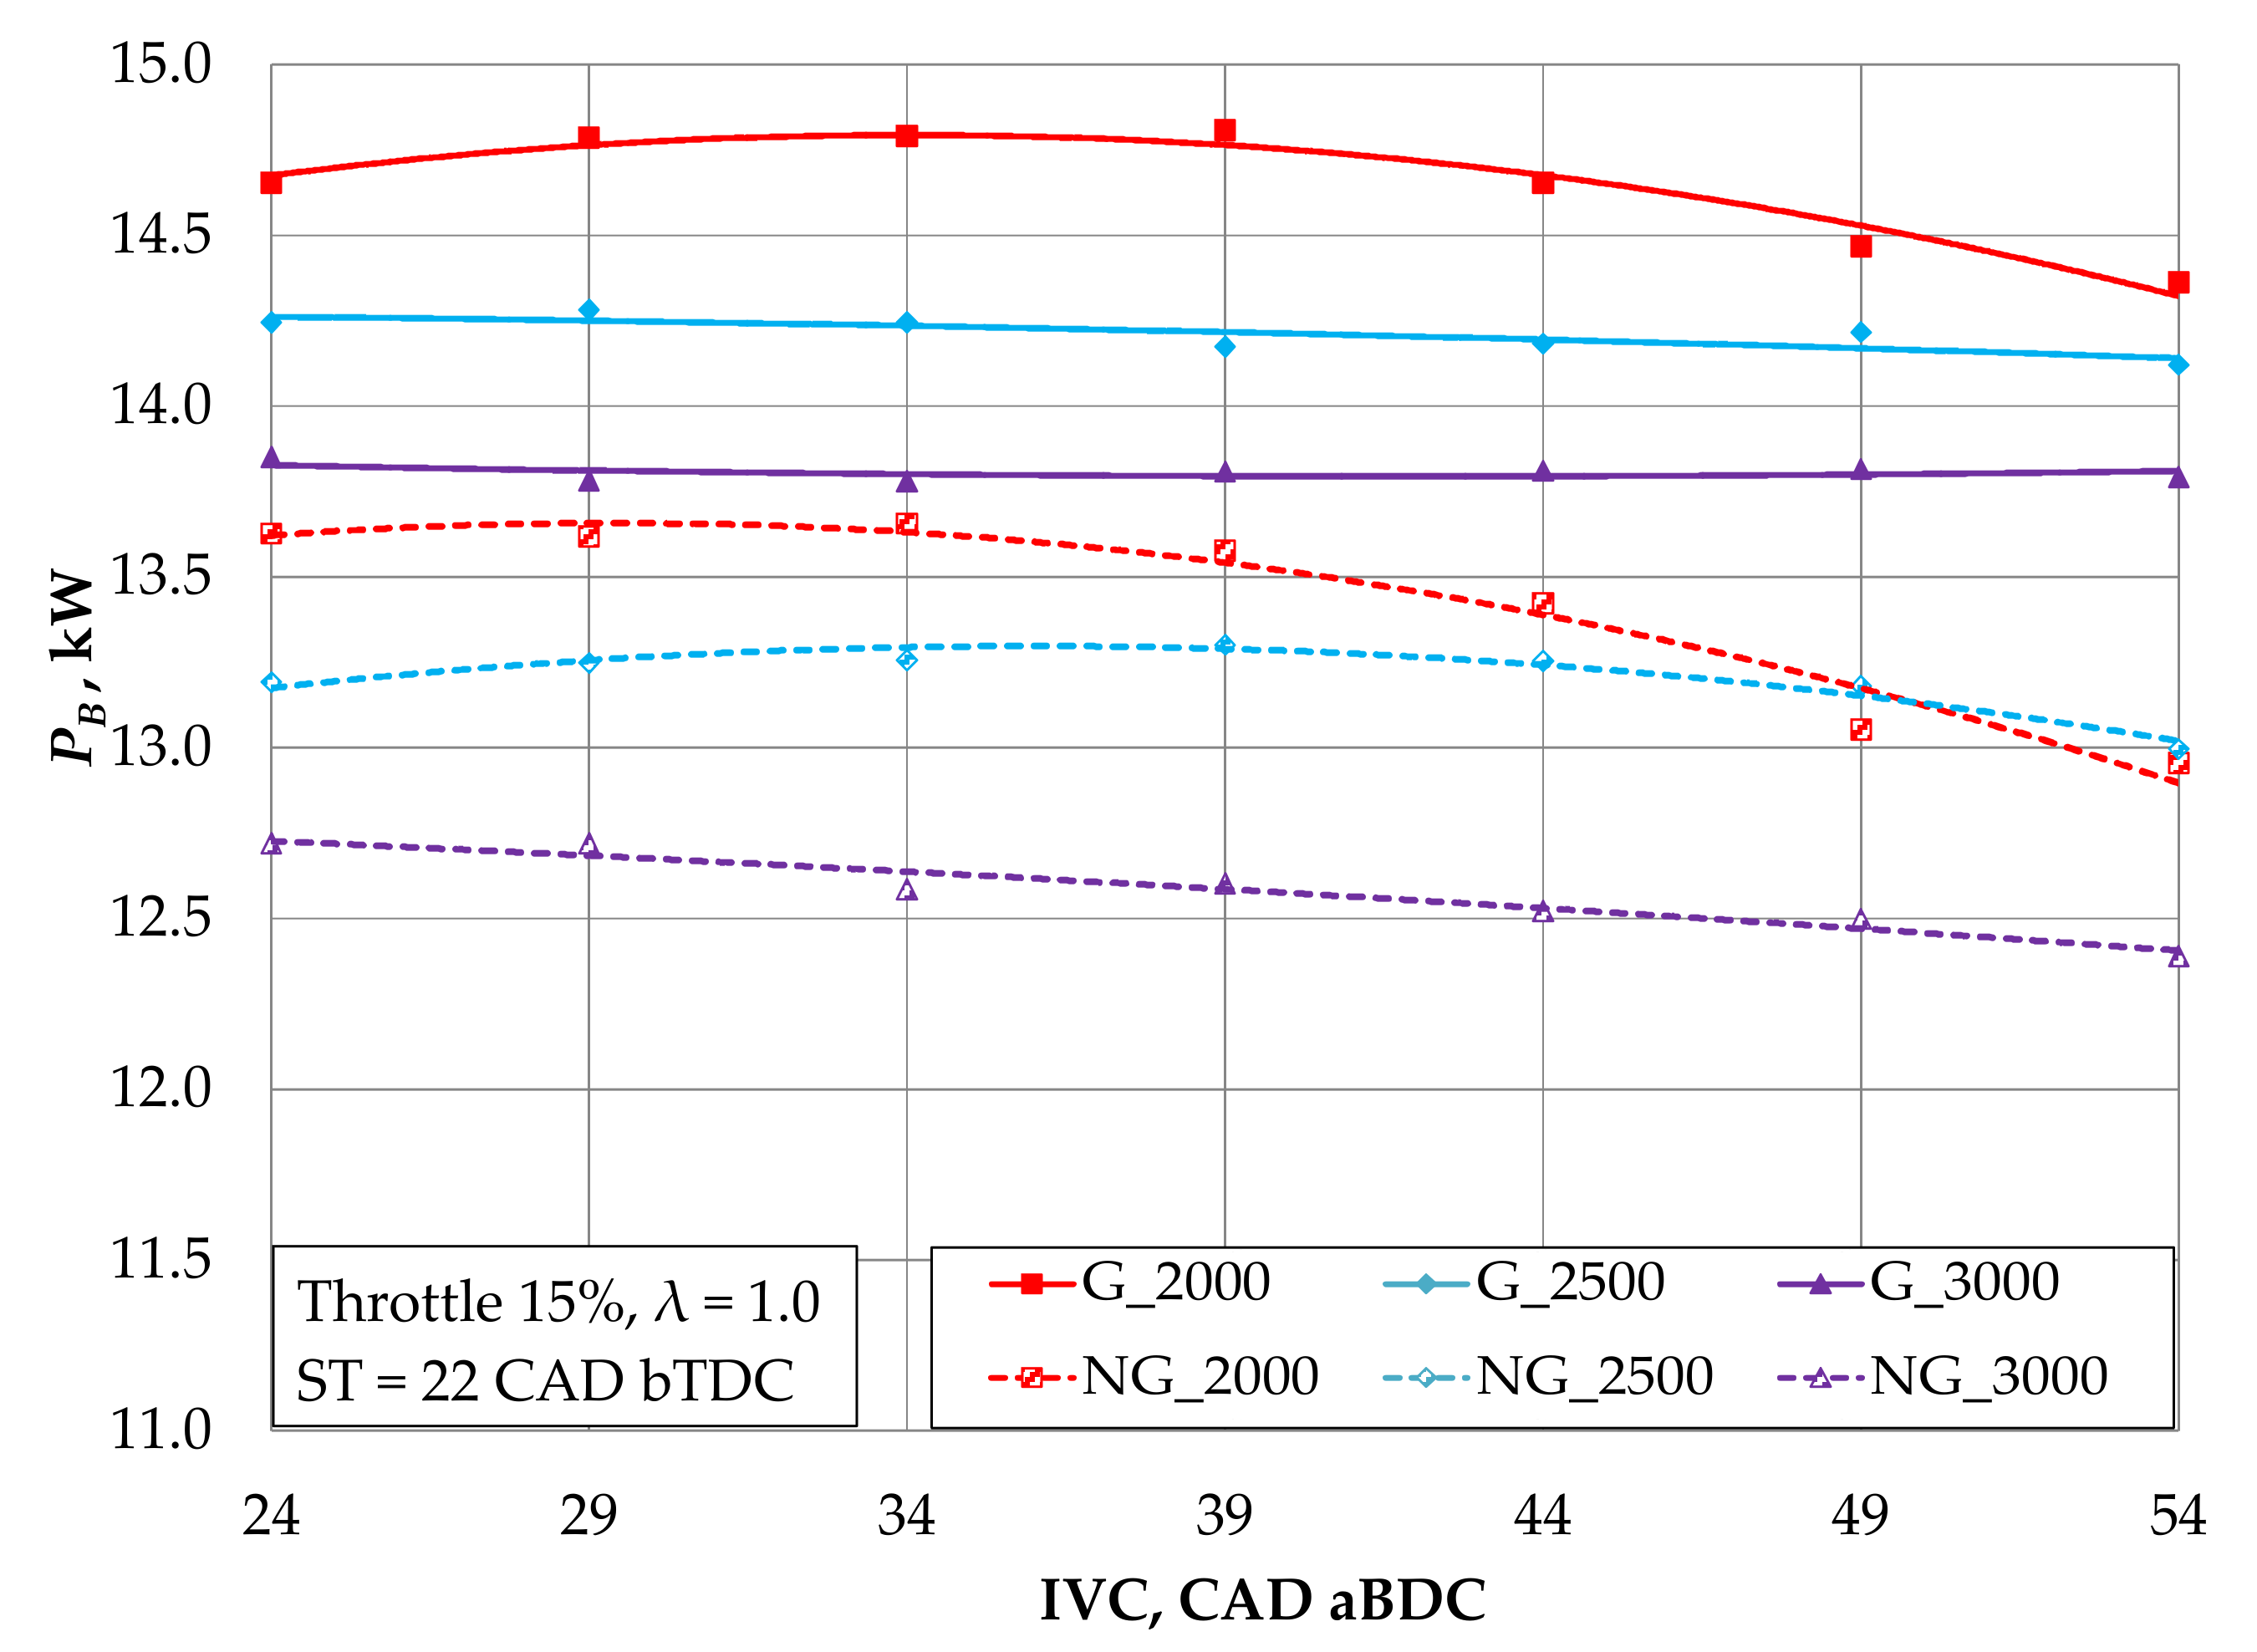
Although the engine power not only depends on the engine brake torque but also on the engine speed, we are able to see that maximum power (14.8 kW) was reached when the engine was running at G_2000 and when the IVC timing was 39 CAD aBDC (Figure 6). After advancing the IVC timing to 24 CAD aBDC, the engine power decreased by ~1%, and when it was delayed to 54 CAD aBDC, the power decreased by ~3%. Increasing the engine speed (G_2500 and G_3000) reduced the engine power by an average of 3% and 5.7%, but the MB decreased by an average of 22% and 37% compared to when the engine was running at G_2000 (Figure 2). The effect of IVC timing is less pronounced when the engine speed is increased. Although delayed IVC timing usually has a positive effect on an engine’s volumetric efficiency as the intake air–fuel mixture rate increases, this positive effect does not occur when the throttle is only 15% open. Studies by other researchers have shown a positive effect when the intake valve is closed late when there is an average engine load [42].
The replacement of gasoline with natural gas reduced engine power by 7–9% throughout the study. A more significant effect of IVC timing on engine power can be seen. The engine power increased slightly during NG_2000 and when the IVC timing was delayed from 24 to 39 CAD aBDC, but the power decreased by 5% when the IVC timing was delayed further. During engine operation at NG_2500 and NG_3000 in the IVC timing range from 24 to 39 CAD aBDC, the power varied little, but when the ICV timing experienced the largest possible delay (54 CAD aBDC), the power decreased by 2.5%.
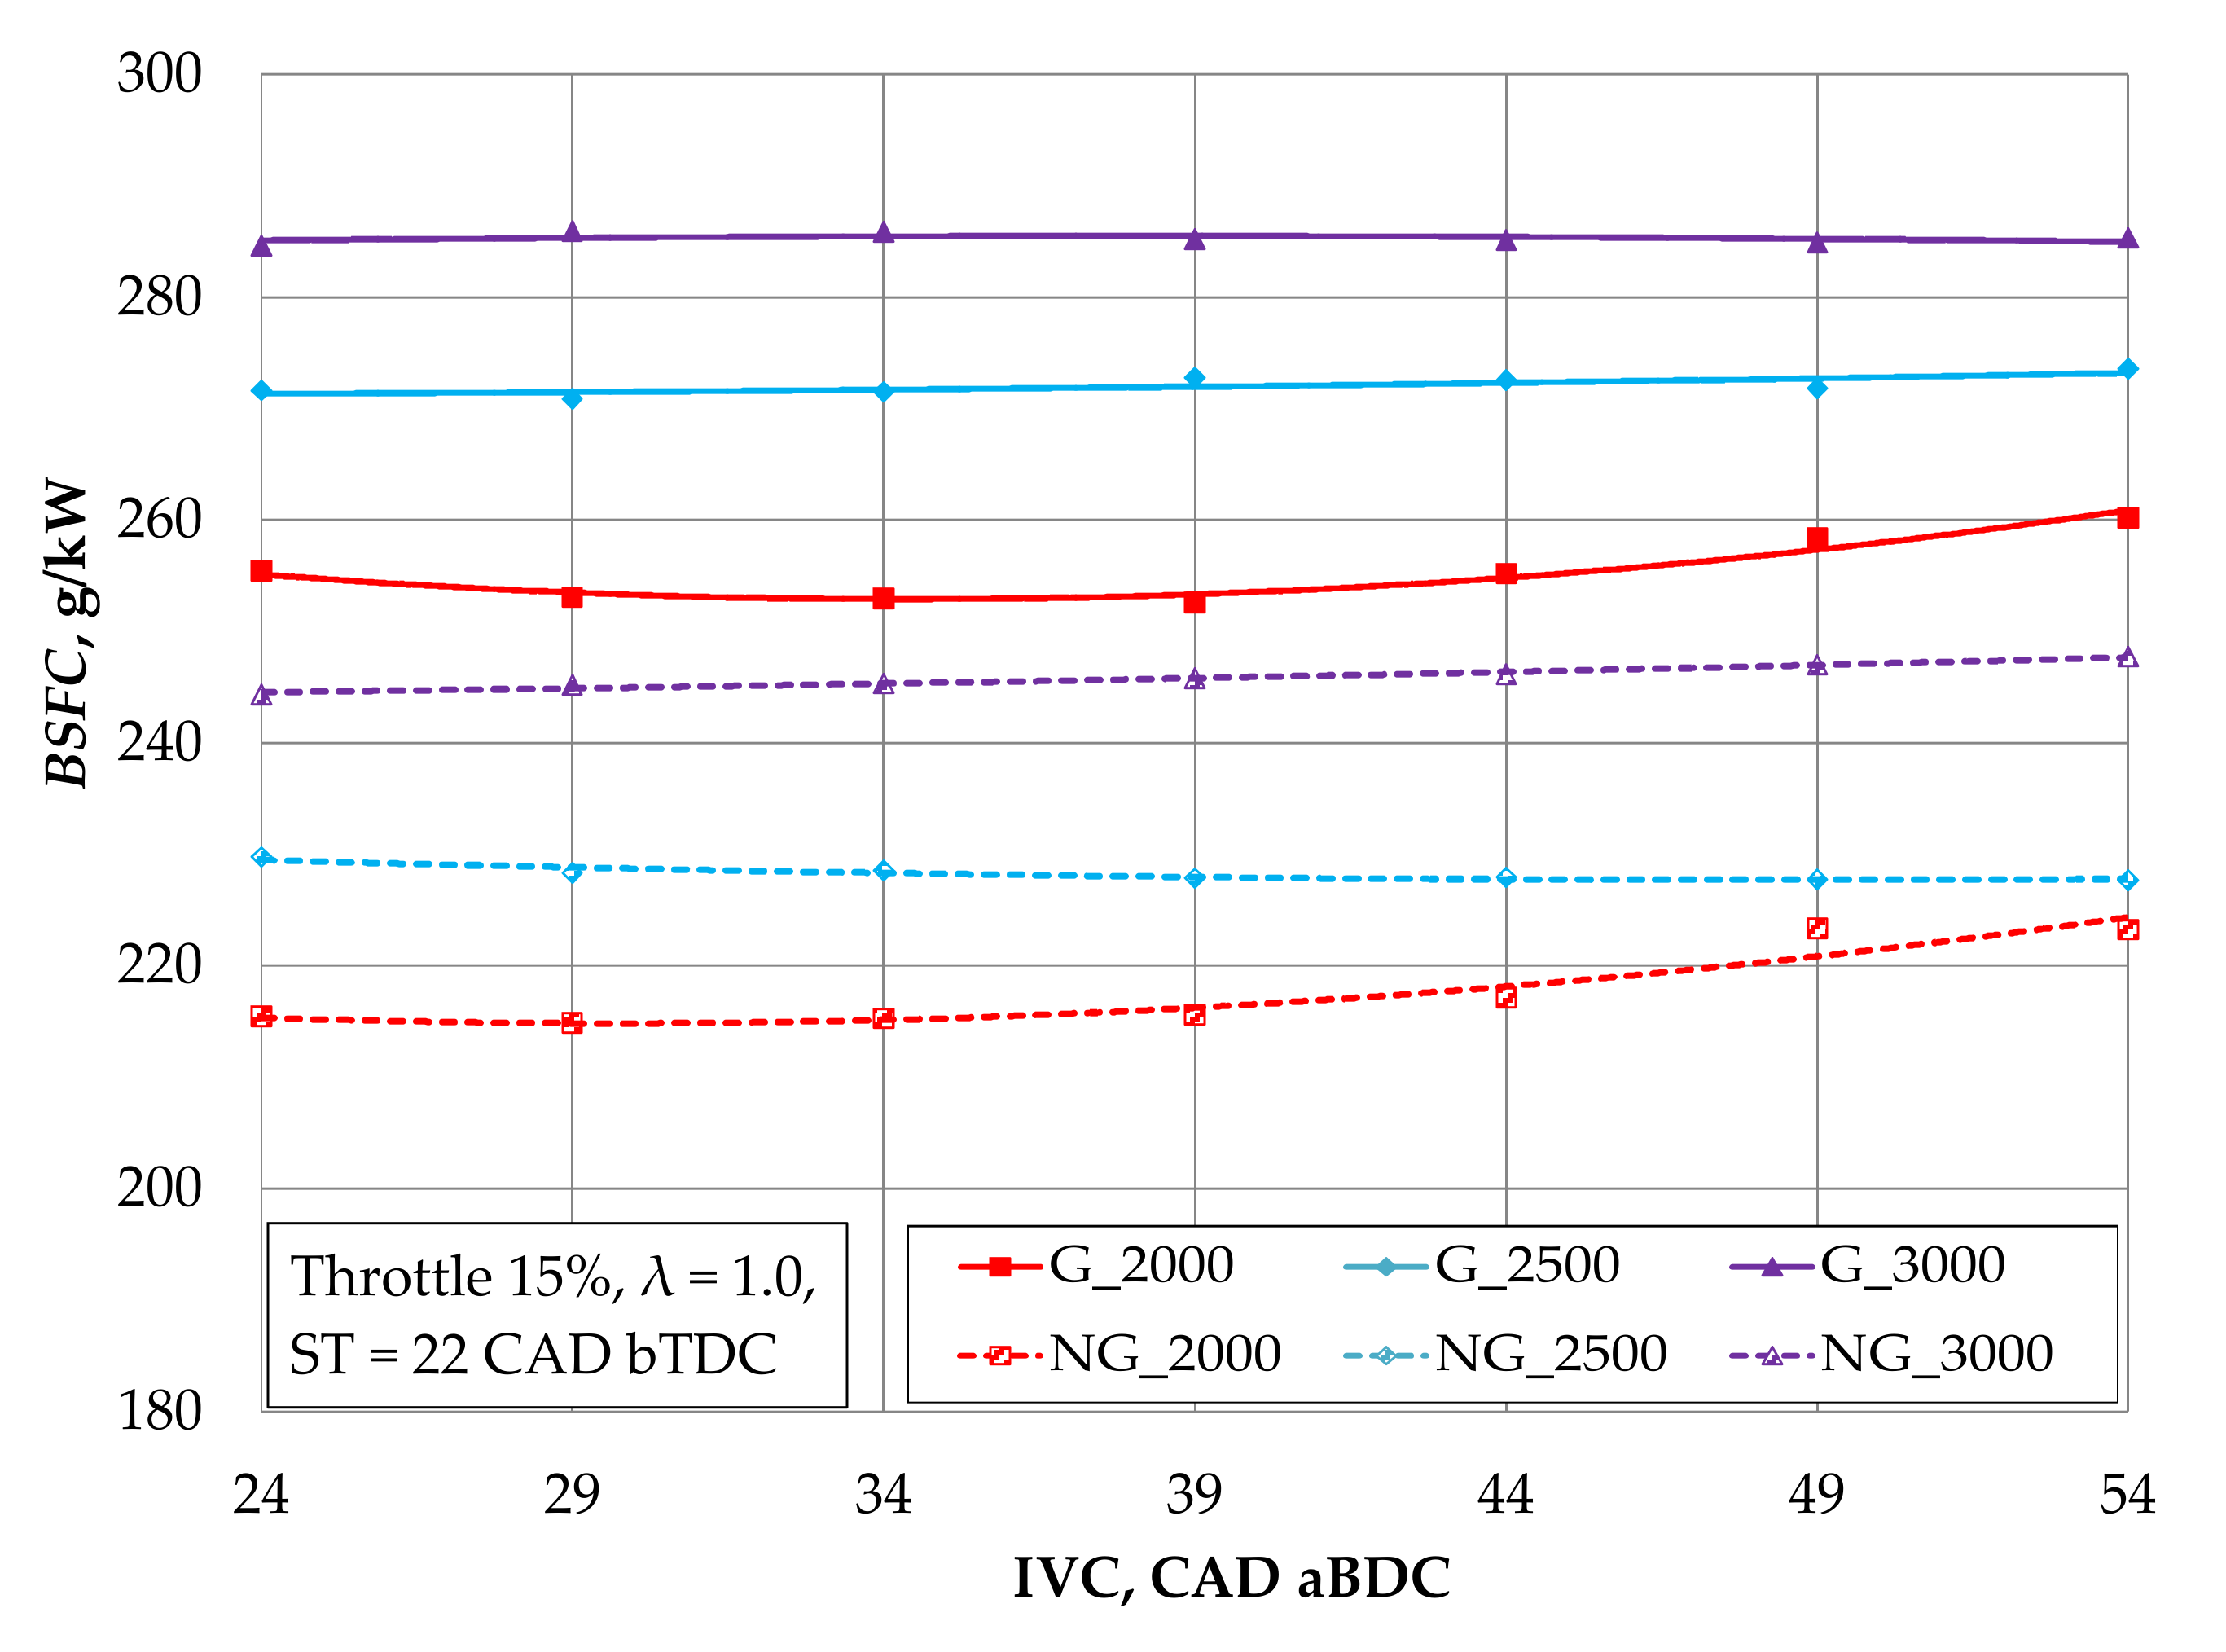
When the engine speed increased from 2000 rpm to 2500 rpm and from 2500 rpm to 3000 rpm when the engine was running on gasoline, the brake-specific fuel consumption (BSFC) increased by ~7% and ~12% from 252.6 g/kWh, respectively (Figure 7). This is mainly due to the increasing mechanical and hydraulic losses of the engine and the decreasing engine power (Figure 6). When the engine was running at G_2000, the minimum BSFC was reached when the IVC timing was 39 CAD aBDC. Advancing the IVC timing to 24 CAD aBDC BSFC increased the BSFC by ~1%, and delaying it to 54 CAD aBDC increased the BSFC by ~3% due to the increased engine power and fuel consumption. When the engine was working on gasoline at 2500 and 3000 rpm and at a throttle of 15%, the IVC timing had little effect on the BSFC.
Throughout the study range, the replacement of gasoline with natural gas reduced the BSFC in the range of 13–16% because the lower heating value (LHV) of natural gas is ~8% higher. Moreover, natural gas burns more efficiently due to its simpler molecular structure. The minimum BSFC was set to NG_2000 when the IVC timing was 34 CAD aBDC. Delaying the IVC timing to 54 CAD aBDC increased the BSFC by 3.4%. When the engine was running on gas and when the engine speed increased from 2000 rpm to 2500 rpm and from 2500 rpm to 3000 rpm, the BSFC increased by ~6% and ~12%. However, changing the IVC timing control from 24 to 54 CAD aBDC had no significant effect on fuel consumption.
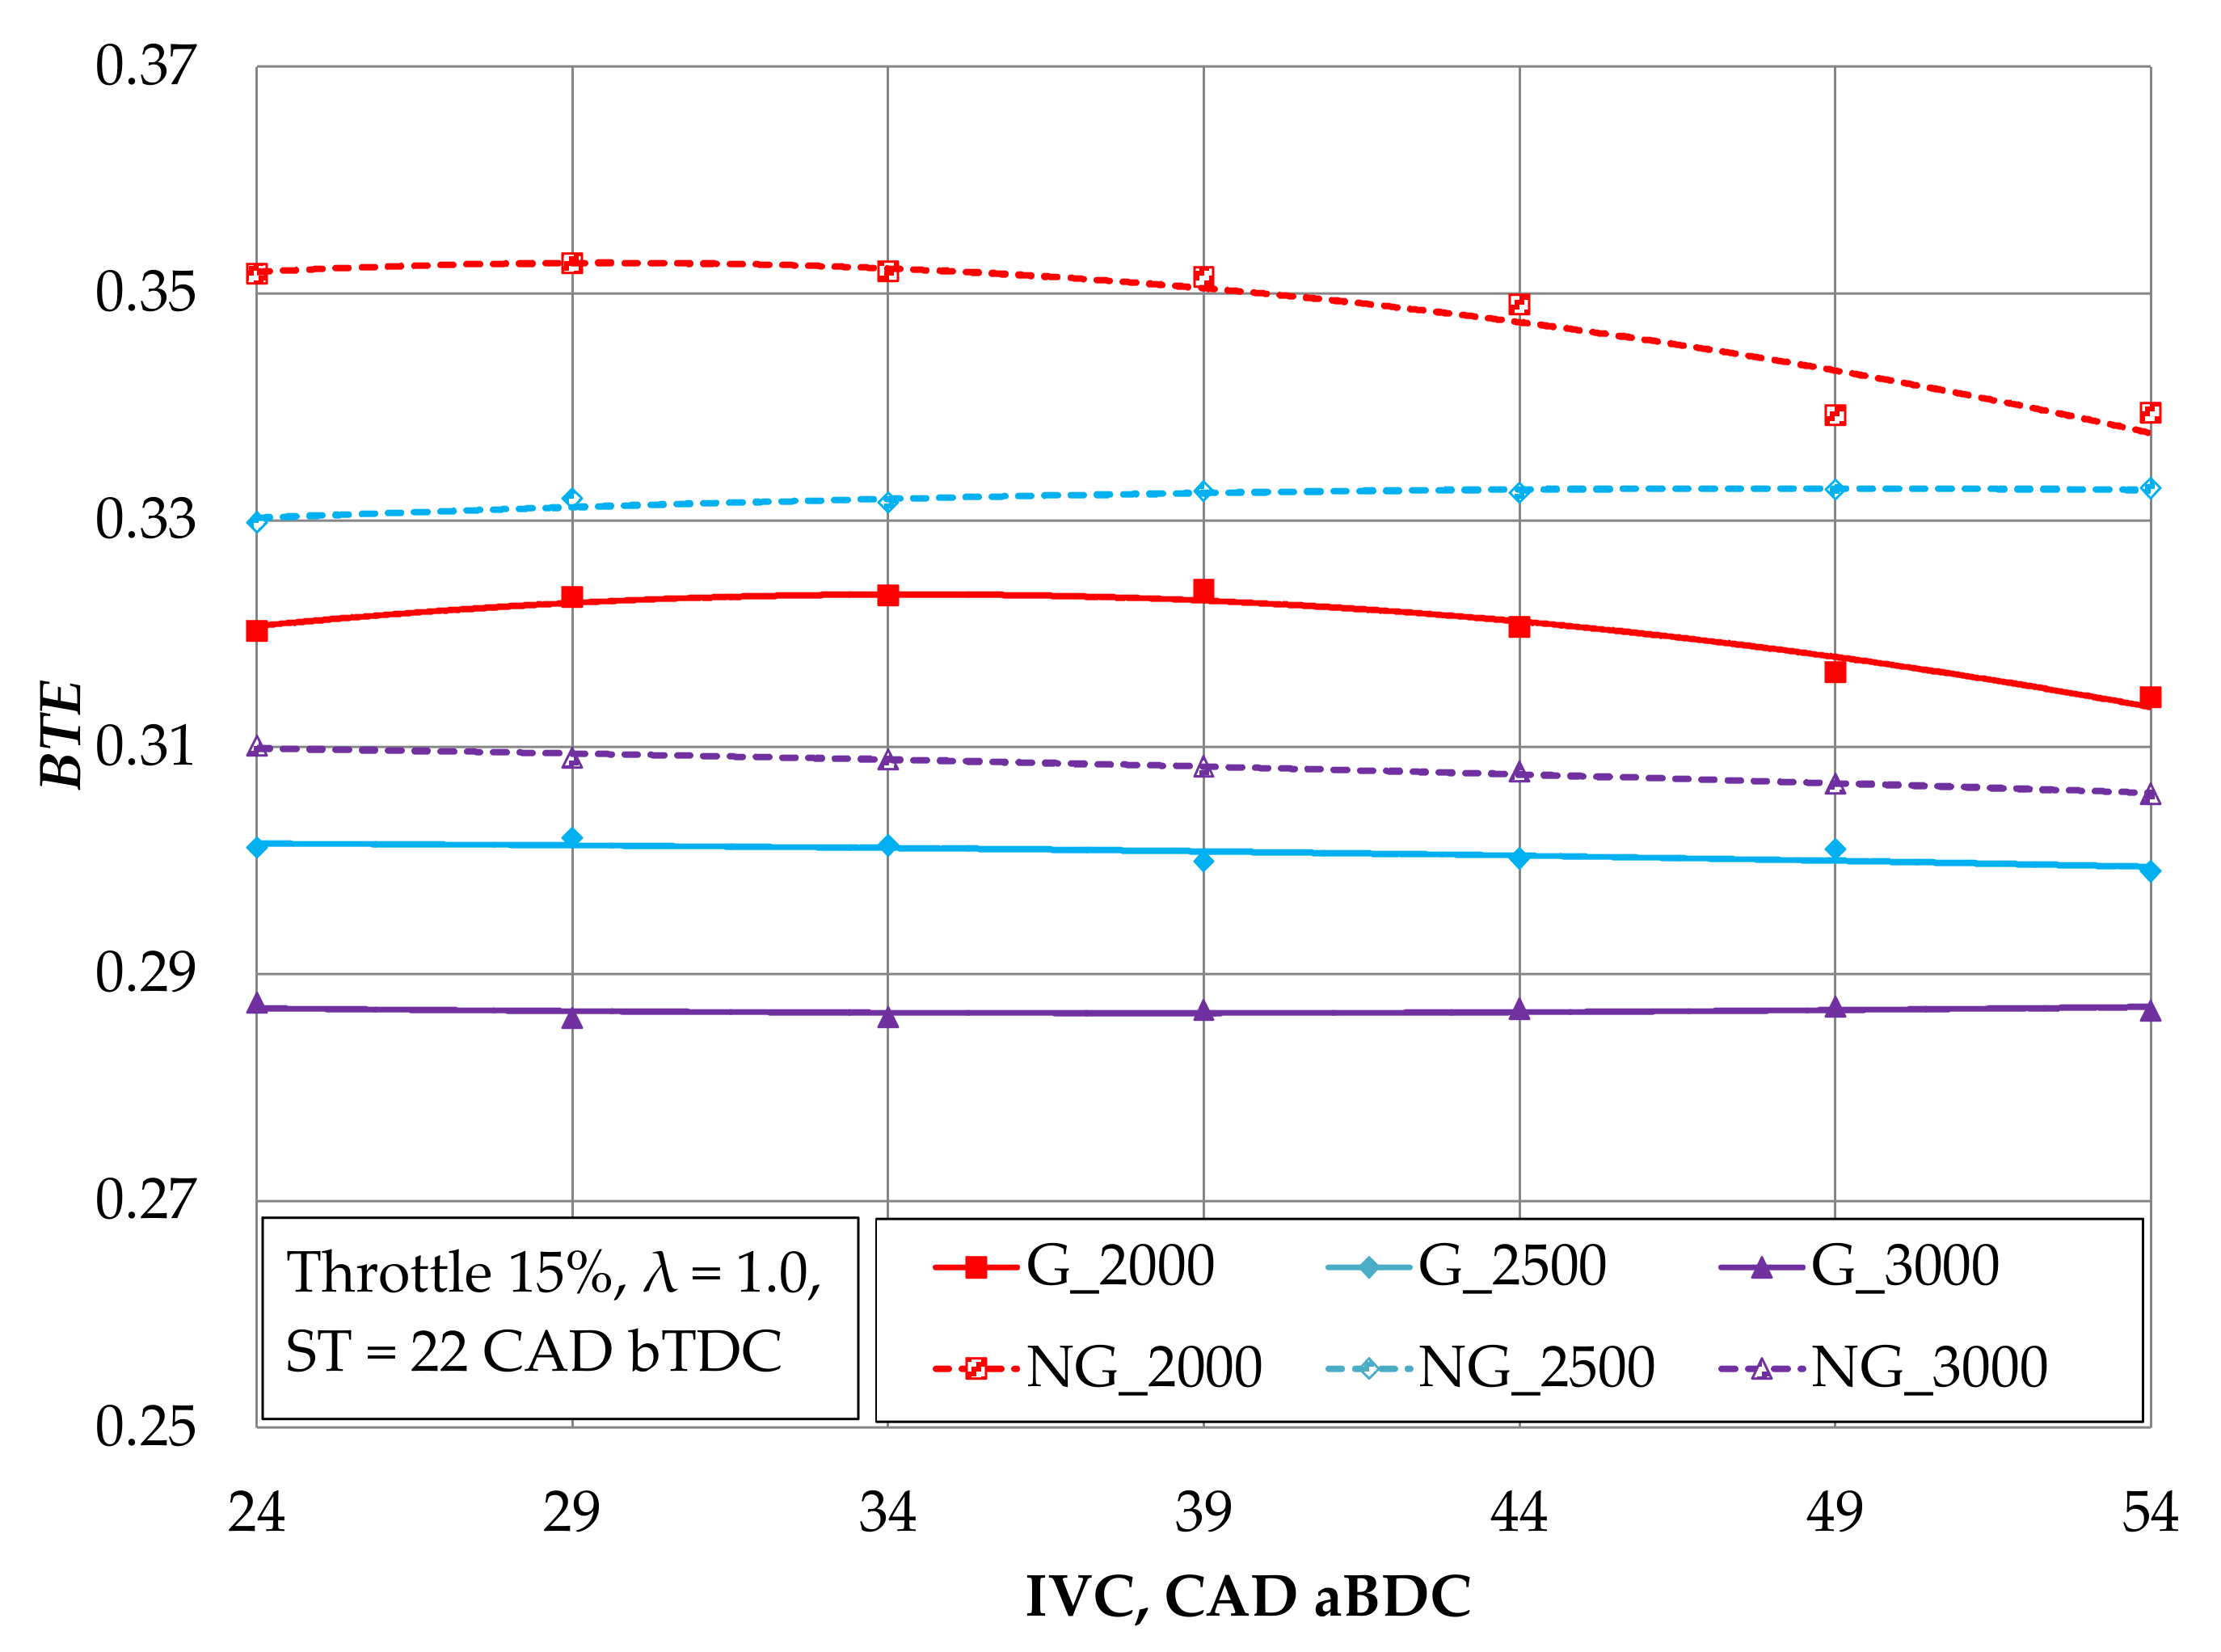
With the engine running at G_2000, the maximum break thermal efficiency (BTE) was reached when the IVC timing was 39 CAD aBDC, resulting in the BTE = 0.324 (Figure 8). When the IVC timing advanced to 24 CAD aBDC, the BTE decreased by ~1%, and when it was delayed to 59 CAD aBDC, the BTE decreased by ~3%. Increasing the speed to 2500 and 3000 rpm reduced the BTE by ~7% and ~11% as the mechanical and hydraulic losses of the engine increased. IVC timing regulation in the range of 24…54 CAD aBDC at engine speeds of 2500 and 3000 rpm was inefficient because when the throttle is 15% open, it damps the air–fuel mixture inertia.
Replacing gasoline with natural gas at the engine speeds of 2000 rpm, 2500 rpm, and 3000 rpm increased the BTE by ~9%, ~10%, and ~8%, respectively. When the engine was running at NG_2000, the IVC timing of 34 CAD aBDC achieved a maximum thermal efficiency of BTE = 0.352. Increasing the IVC timing to 54 CAD aBDC reduced the BTE by ~4%. At engine speeds of 2500 rpm and 3000 rpm, the IVC timing is of little significance.
3.2. Numerical Analysis of the Combustion Process
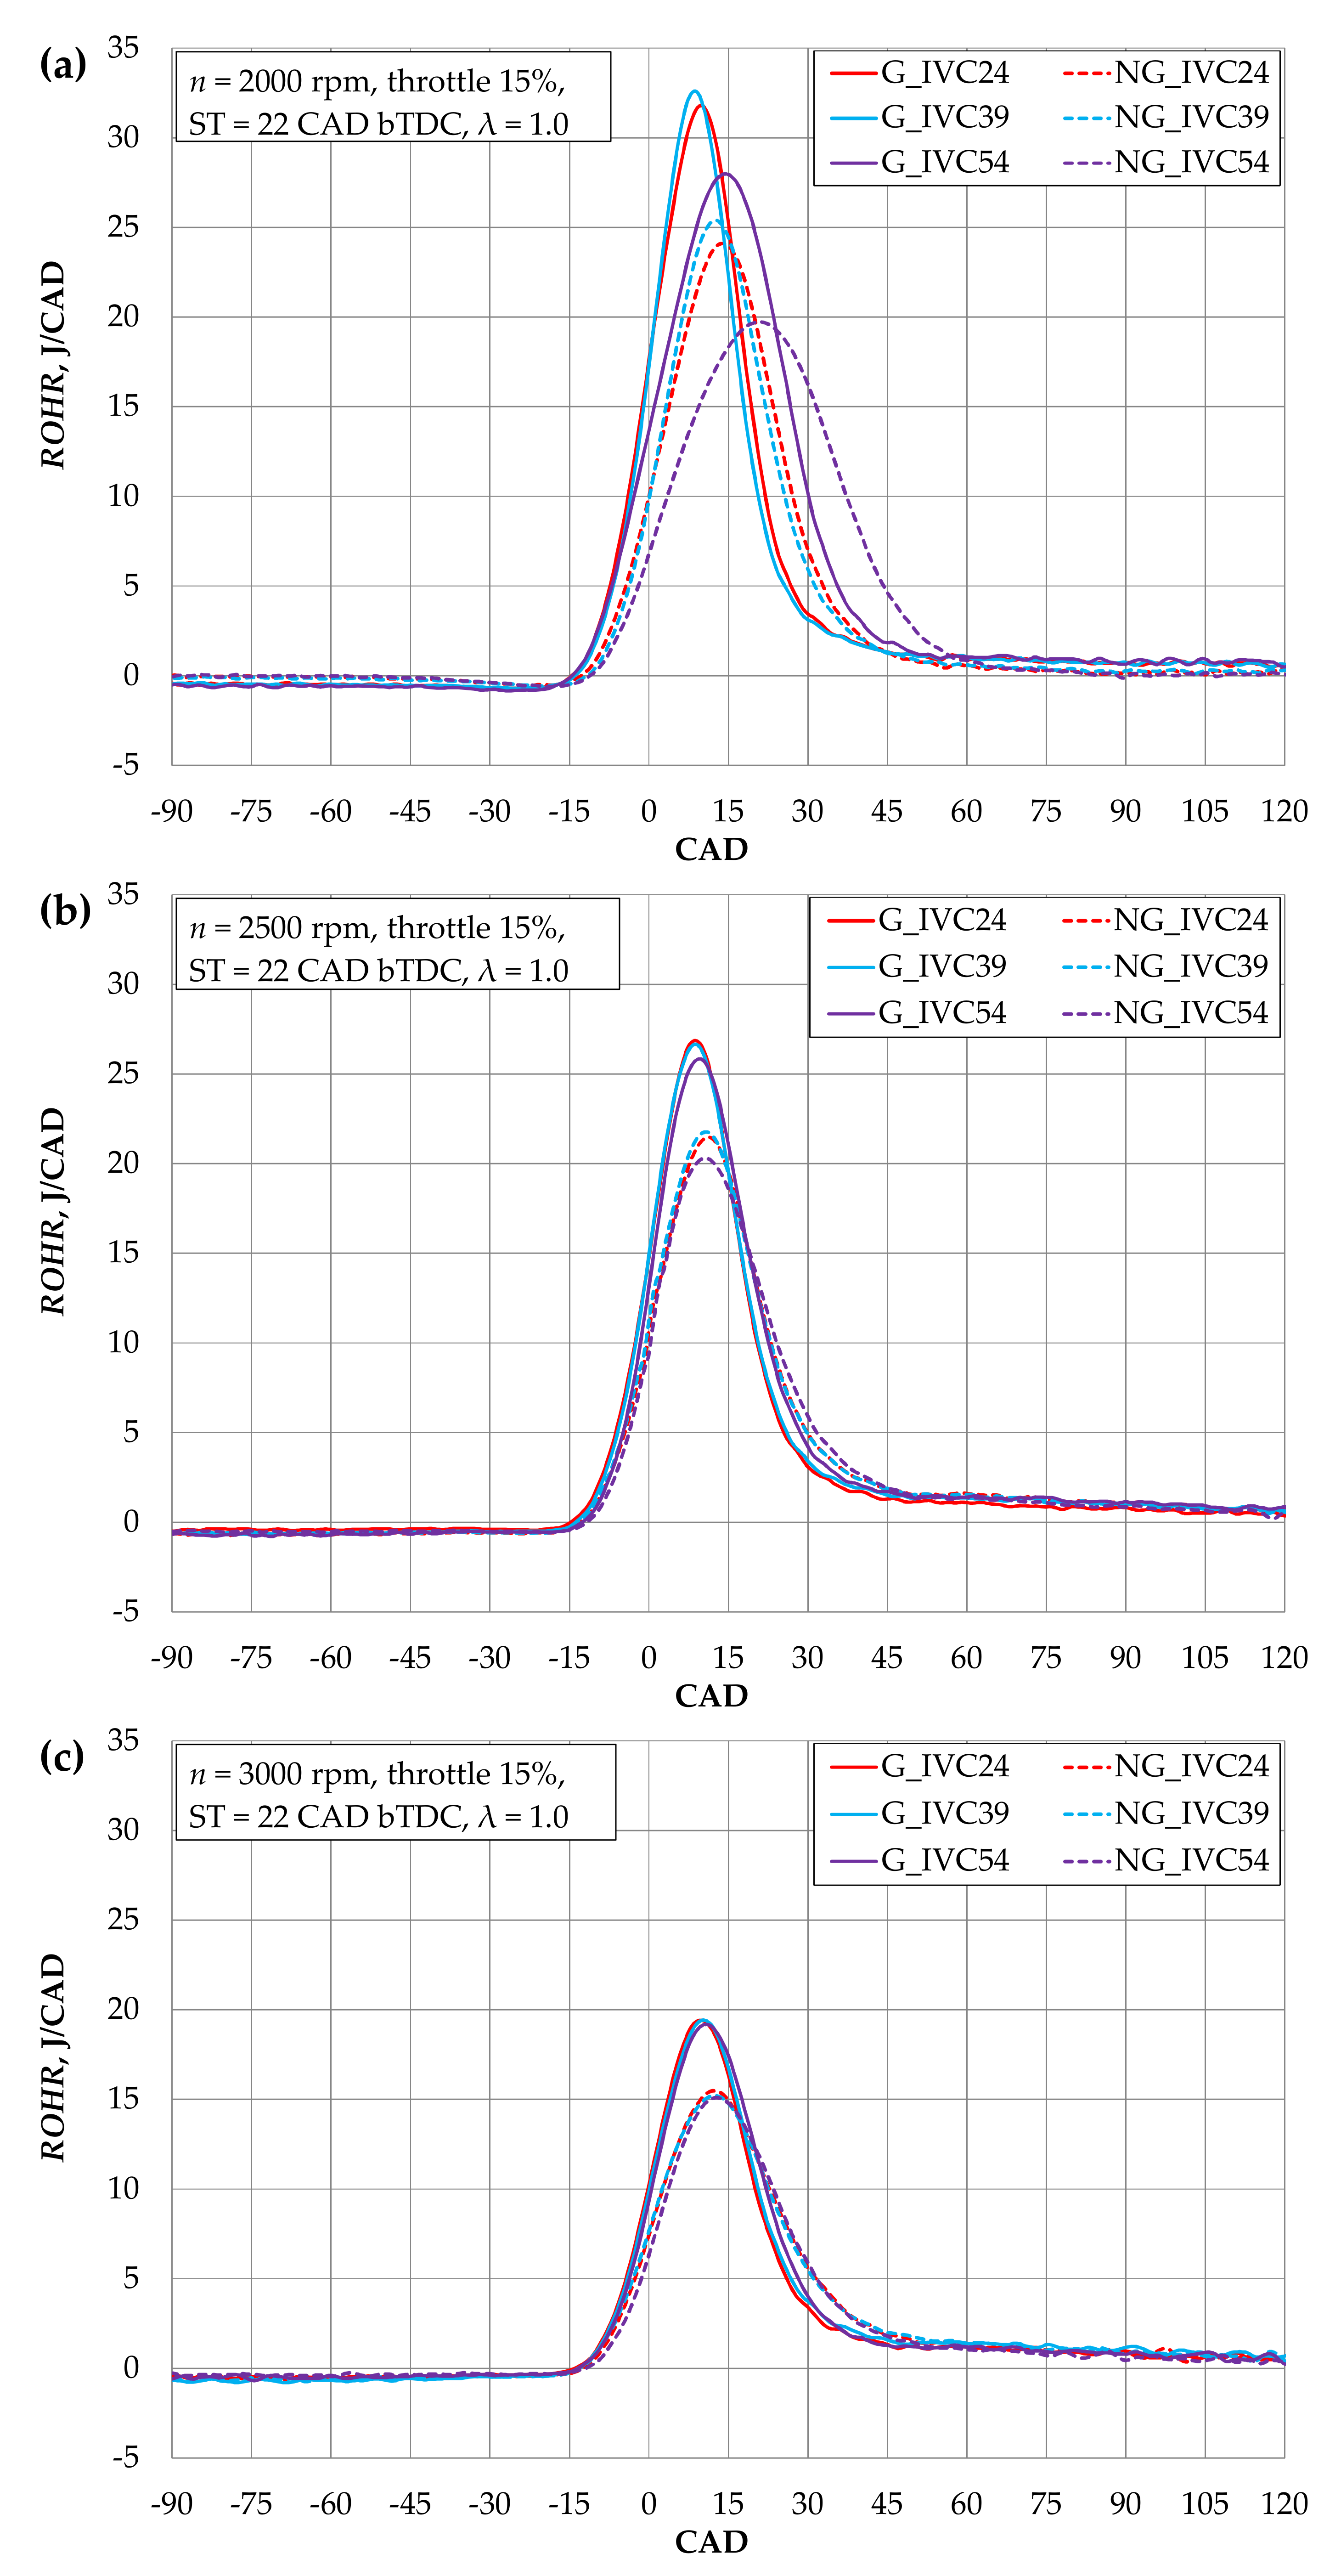
In the AVL BOOST program, the rate of heat release (ROHR) per cylinder was determined via the numerical analysis of the combustion process in the engine (Figure 9). Calculations were performed with the engine running on gasoline and on natural gases at IVC timings of 24, 39, and 54 CAD aBDC. The correlation of ROHR with the fuel energy that was transferred to the cylinder per cycle, the in-cylinder pressure (Figure 5), and the brake torque (Figure 2) is visible in all the engine operating modes. The maximum ROHR was achieved when the engine was running at G_2000 (Figure 9a) and when the IVC timing was 39 CAD aBDC due to good engine volumetric efficiency and maximum fuel input to the cylinder (Figure 4). When the IVC timing was advanced (24 CAD aBDC), the ROHR decreased because the engine had lower volumetric efficiency. When the IVC timing was delayed (54 CAD aBDC), the ROHR decreased and shifted towards the exhaust side. This adversely affected the engine’s BTE (Figure 8). When the engine speed was increased while it was running on gasoline (2500 rpm and 3000 rpm), the maximum ROHR decreased significantly due to the engine having lower volumetric efficiency, but the effect of IVC timing became less significant (Figure 9b,c).
ROHR was significantly reduced compared to gasoline at different engine speeds and with natural gas, as NG deteriorated the volumetric efficiency (Figure 9). The very significant effect of IVC timing on ROHR can be seen when the engine was running at NG_2000. With a delay in the IVC timing from 24 to 39 CAD aBDC, the maximum ROHR increased; when the IVC was delayed by up to 54 CAD aBDC, it decreased significantly because the combustion process had shifted significantly towards the exhaust stroke (Figure 9a). The effect of IVC timing on the maximum ROHR at NG_2500 and NG_3000 was reduced (Figure 9b,c). A comparison of natural gas with gasoline shows a slower intensity and longer ROHR in the study range due to the lower gas burning rate (Table 3).
In order to maintain the same amount of energy in the cylinder per cycle (Ecycl), after changing gasoline to natural gas, the throttle should be opened wider in order to increase the fuel flow and the volumetric efficiency. As natural gas has a lower combustion speed, the ST adjustment should also be considered and should be more advanced in order to obtain the maximum ROHR value simultaneously. In that case, the ROHR, in-cylinder pressure, MB, and PB difference would be insignificant. Additionally, opening the throttle wider would increase the speed and inertia of the air/NG mixture intake; in this case, adjusting the IVC timing would have a greater impact on the engine’s volumetric efficiency.
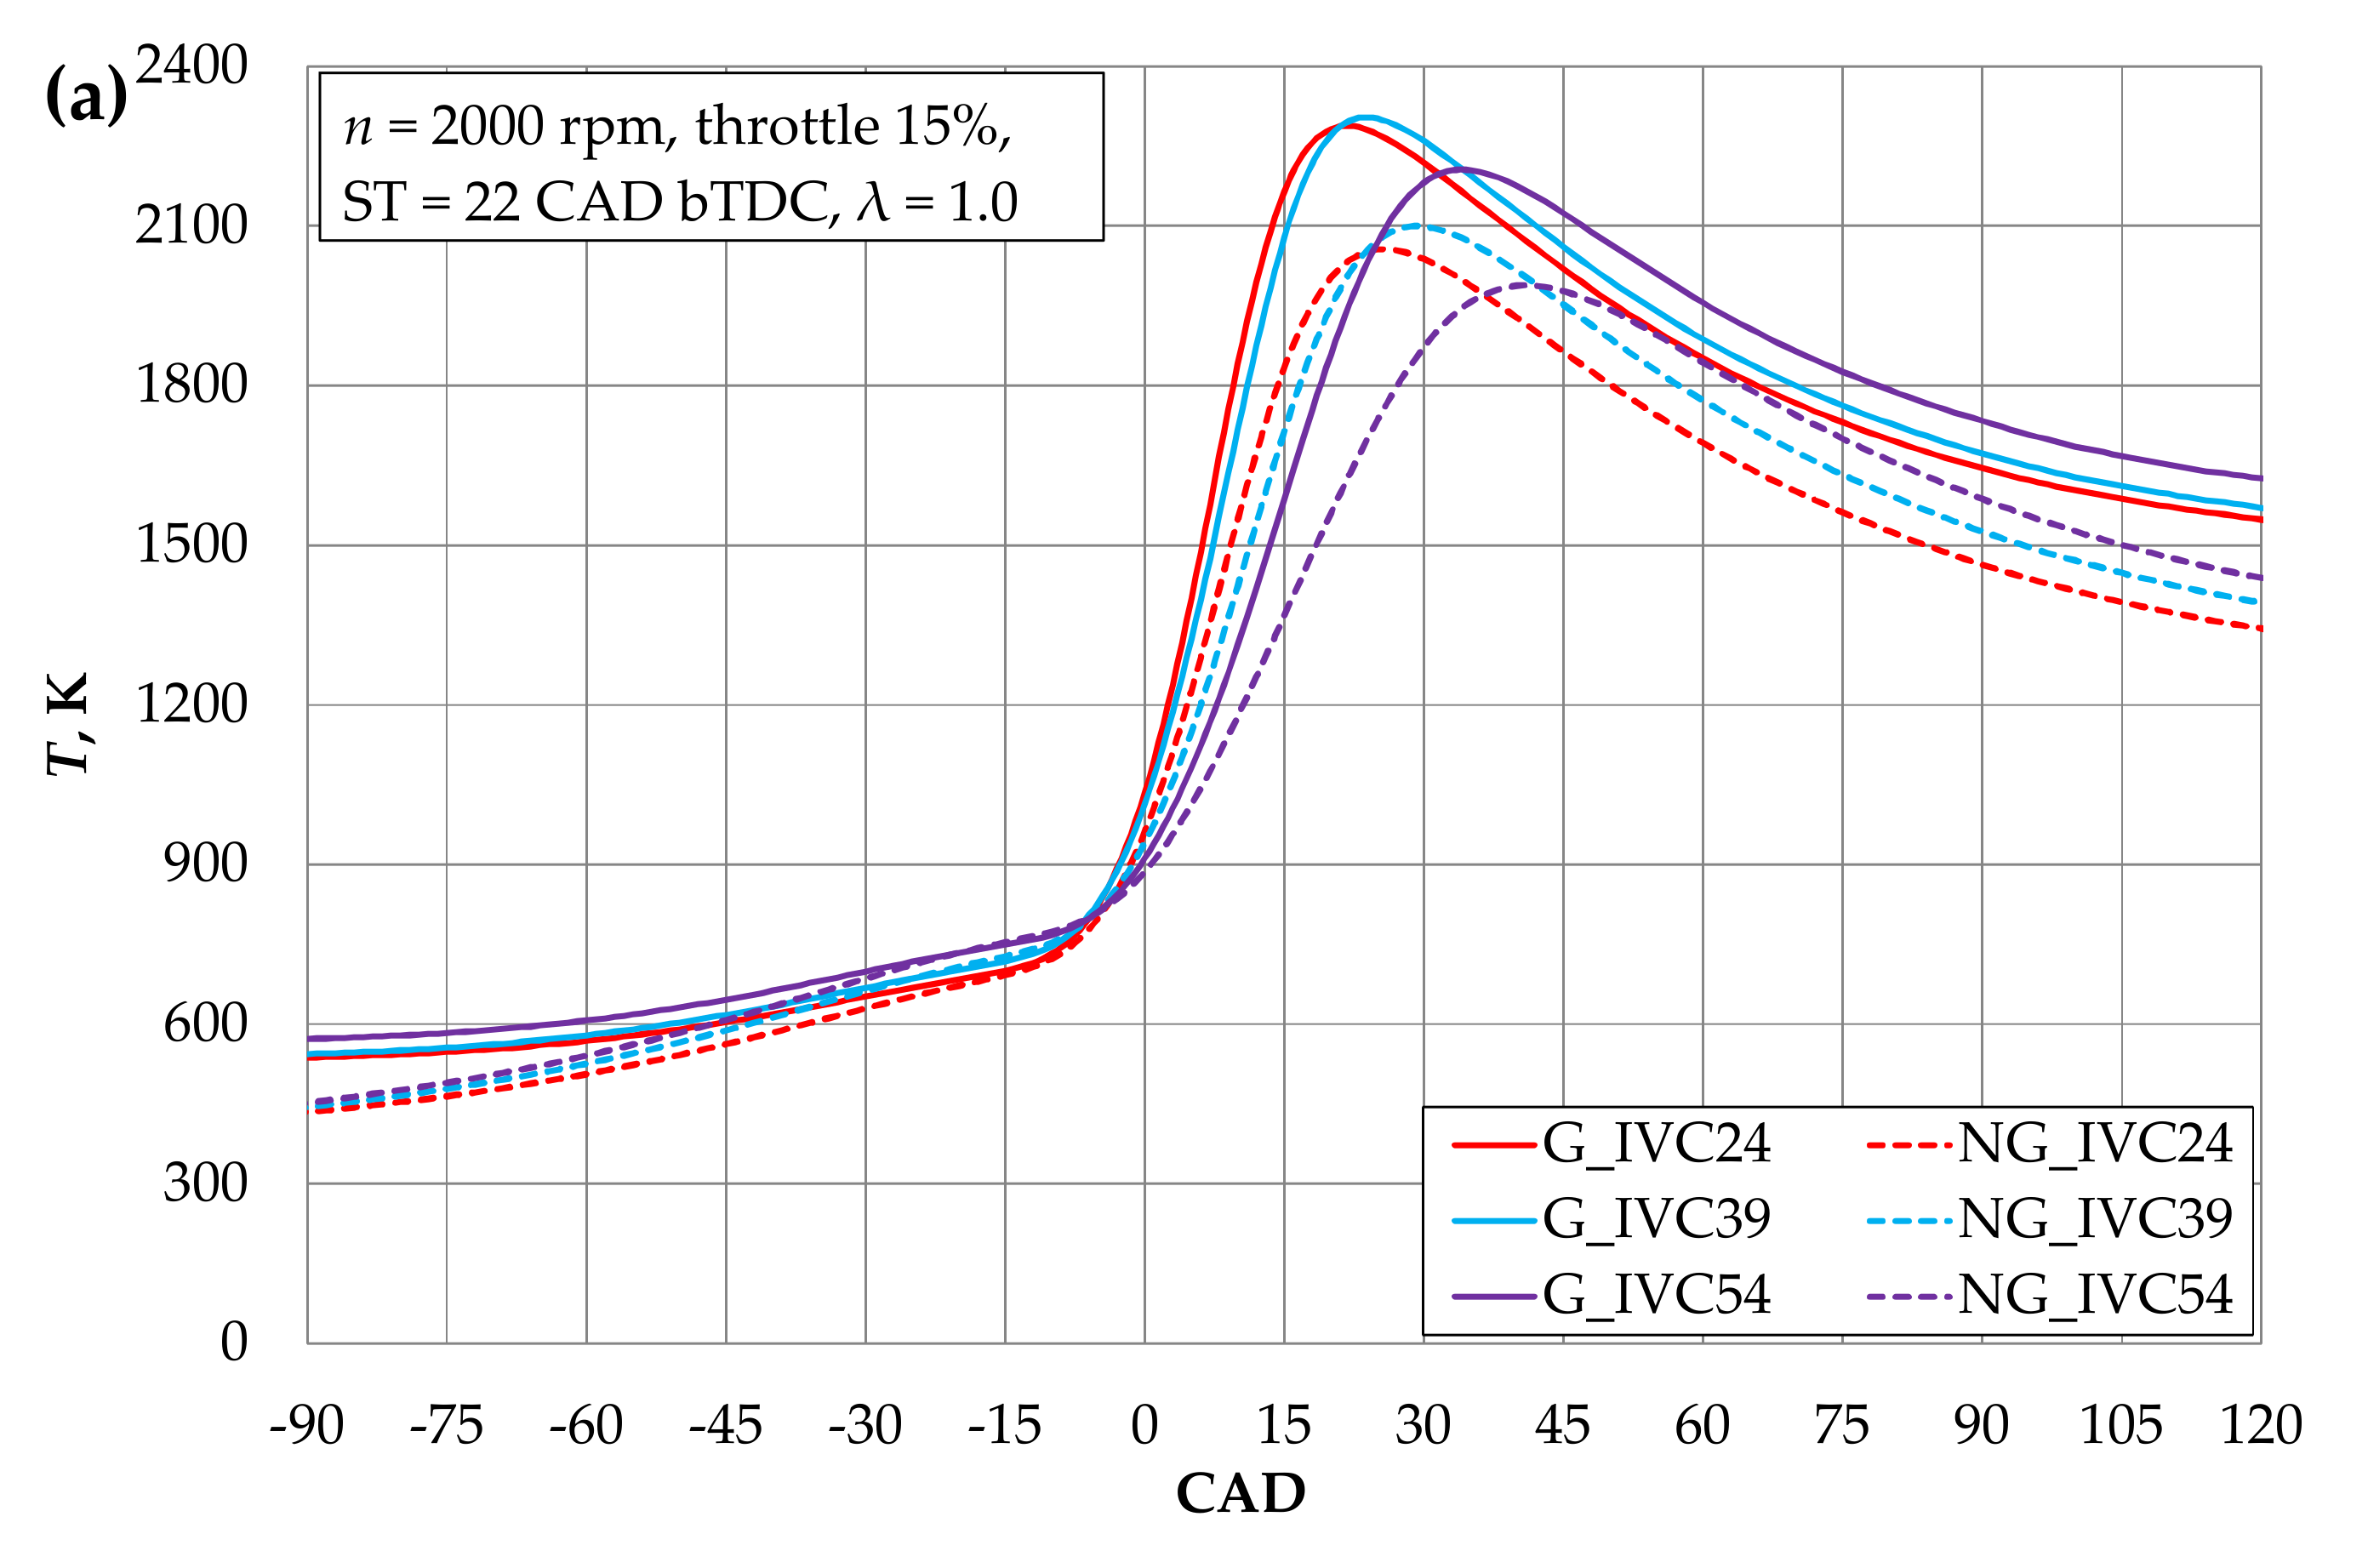
The temperature in the cylinder as determined by the numerical analysis of the combustion process is shown in Figure 10. When the engine was running at G_2000, a maximum combustion temperature of 2304 K (24 CAD aTDC) was reached when the IVC timing was 39 CAD aBDC. This is due to the amount of energy that was brought into the cylinder by the fuel and the efficient combustion process. When the IVC timing was 54 CAD aBDC, the volumetric efficiency of the engine deteriorated, and a maximum temperature of 2206 K (−4.3%) was reached 10 CAD later due to slower combustion (Figure 10a). With the engine speeds of 2500 rpm and 3000 rpm at 39 CAD aBDC IVC, the maximum combustion temperature varied slightly (2257 K (−2%) at 24 CAD aTDC and 2322 K (+1%) at 24 CAD aTDC) (Figure 10a,b), because the decreased volumetric efficiency and ROHR were compensated for by faster combustion processes taking place in the cylinder, resulting in lower amount of heat being transferred to the cooling system. The regulation of IVC timing has no significant effect in the study range because cylinder filling is limited by a throttle of 15%.
When the engine was running at NG_2000, a maximum combustion temperature of 2100 K was reached when the IVC timing was 39 CAD aTDC. The combustion temperature decreased by 8.8% compared to G_2000 and peaked 5 CAD later. When the engine was running NG_2500 and NG_3000, and when the IVC timing was 39 CAD aBDC, the maximum combustion temperature decreased by 3.8% and 1%, respectively, compared to at NG_2000 (Figure 10).
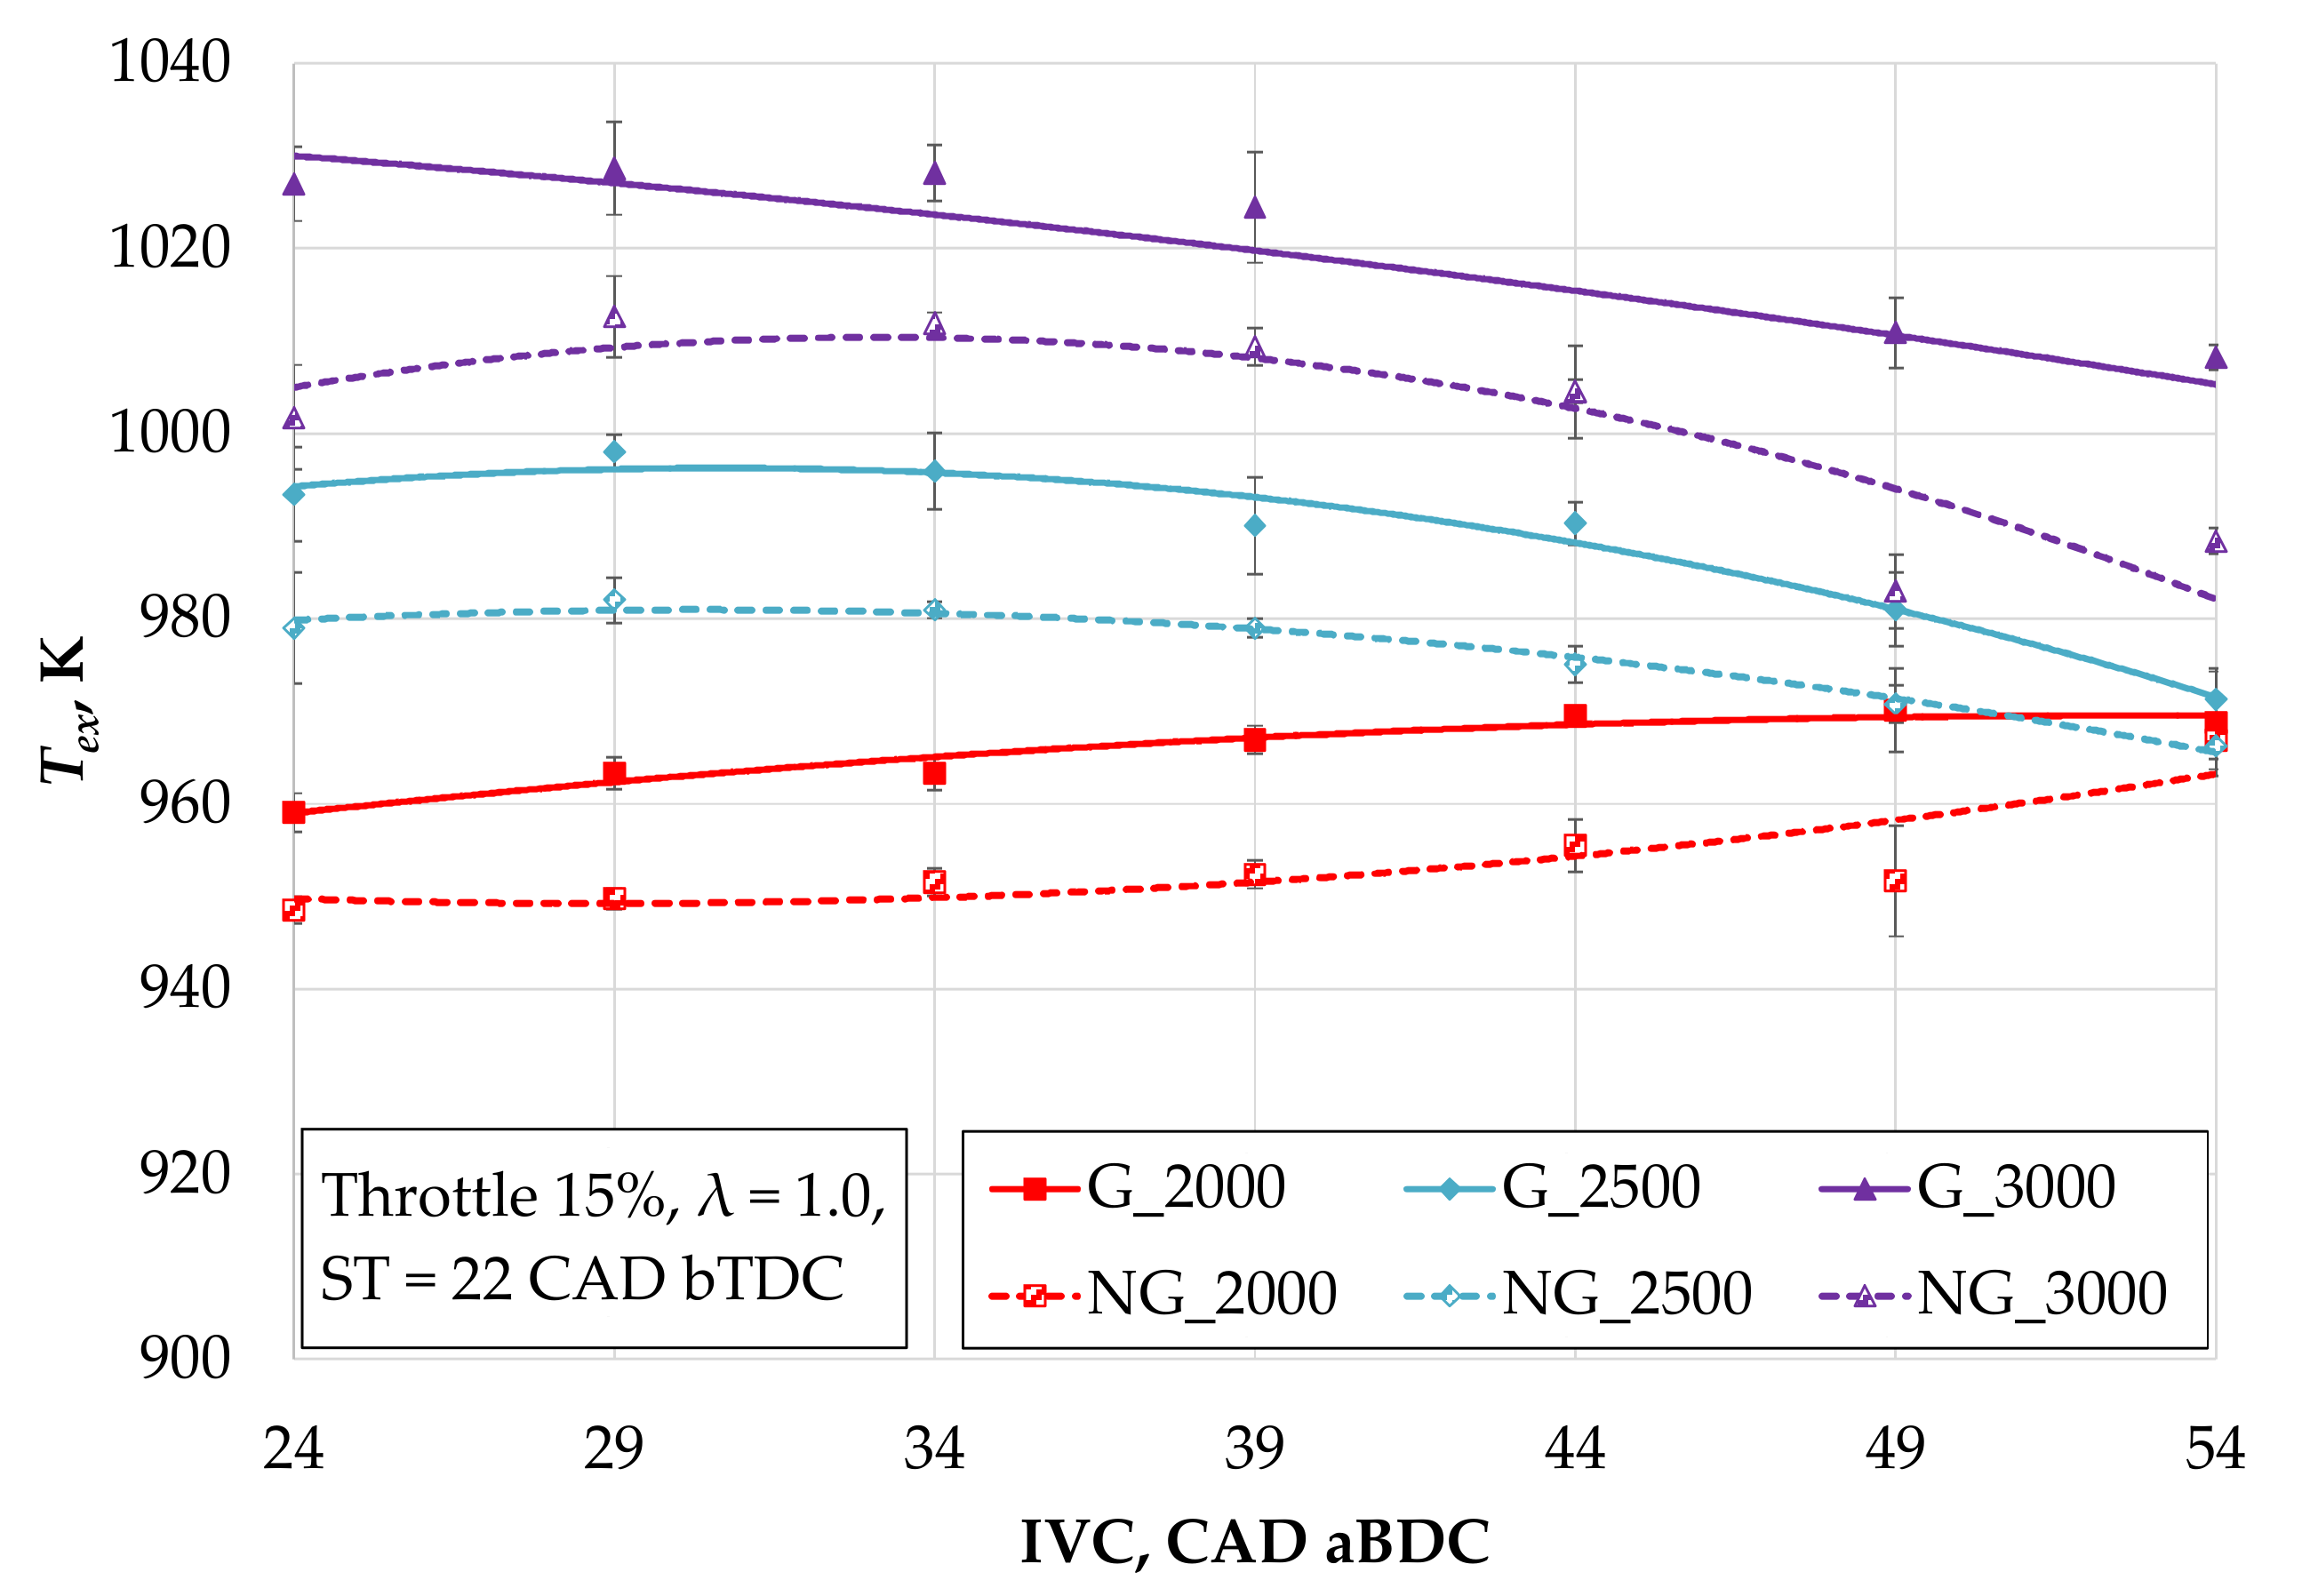
The exhaust gas temperature decreased at all the engine speeds that were measured (Figure 11) as the fuel changed from gasoline to natural gas. The exhaust gas temperature was affected by the decreased combustion temperature (Figure 10). At same moment of IVC (29 CAD aBDC), the exhaust gas temperature decreased by 1.5% for G_2000 and NG_2000, 1.6% for G_2500 and NG_2500, and 1.4% for G_3000 and NG_3000. When the engine was running at G_2000 and NG_2000, and when the moment at which IVC occurred was delayed, the exhaust gas temperature increased. The G_2000 exhaust gas temperature increased by 0.7% and by 0.6% for NG_2000 when the moment at which IVC occurred changed from 29 to 44 CAD aBDC. The increase that can be observed in the exhaust temperature is due to the higher volumetric efficiency and the increased amount of fuel in the cylinder when the engine speed is lower (Figure 5), leading to an increase in the cylinder and exhaust temperature. Further increasing engine speed reduced the exhaust gas temperature, while the moment at which IVC occurred was delayed due to the reduced volumetric efficiency and the decreased combustion temperature.
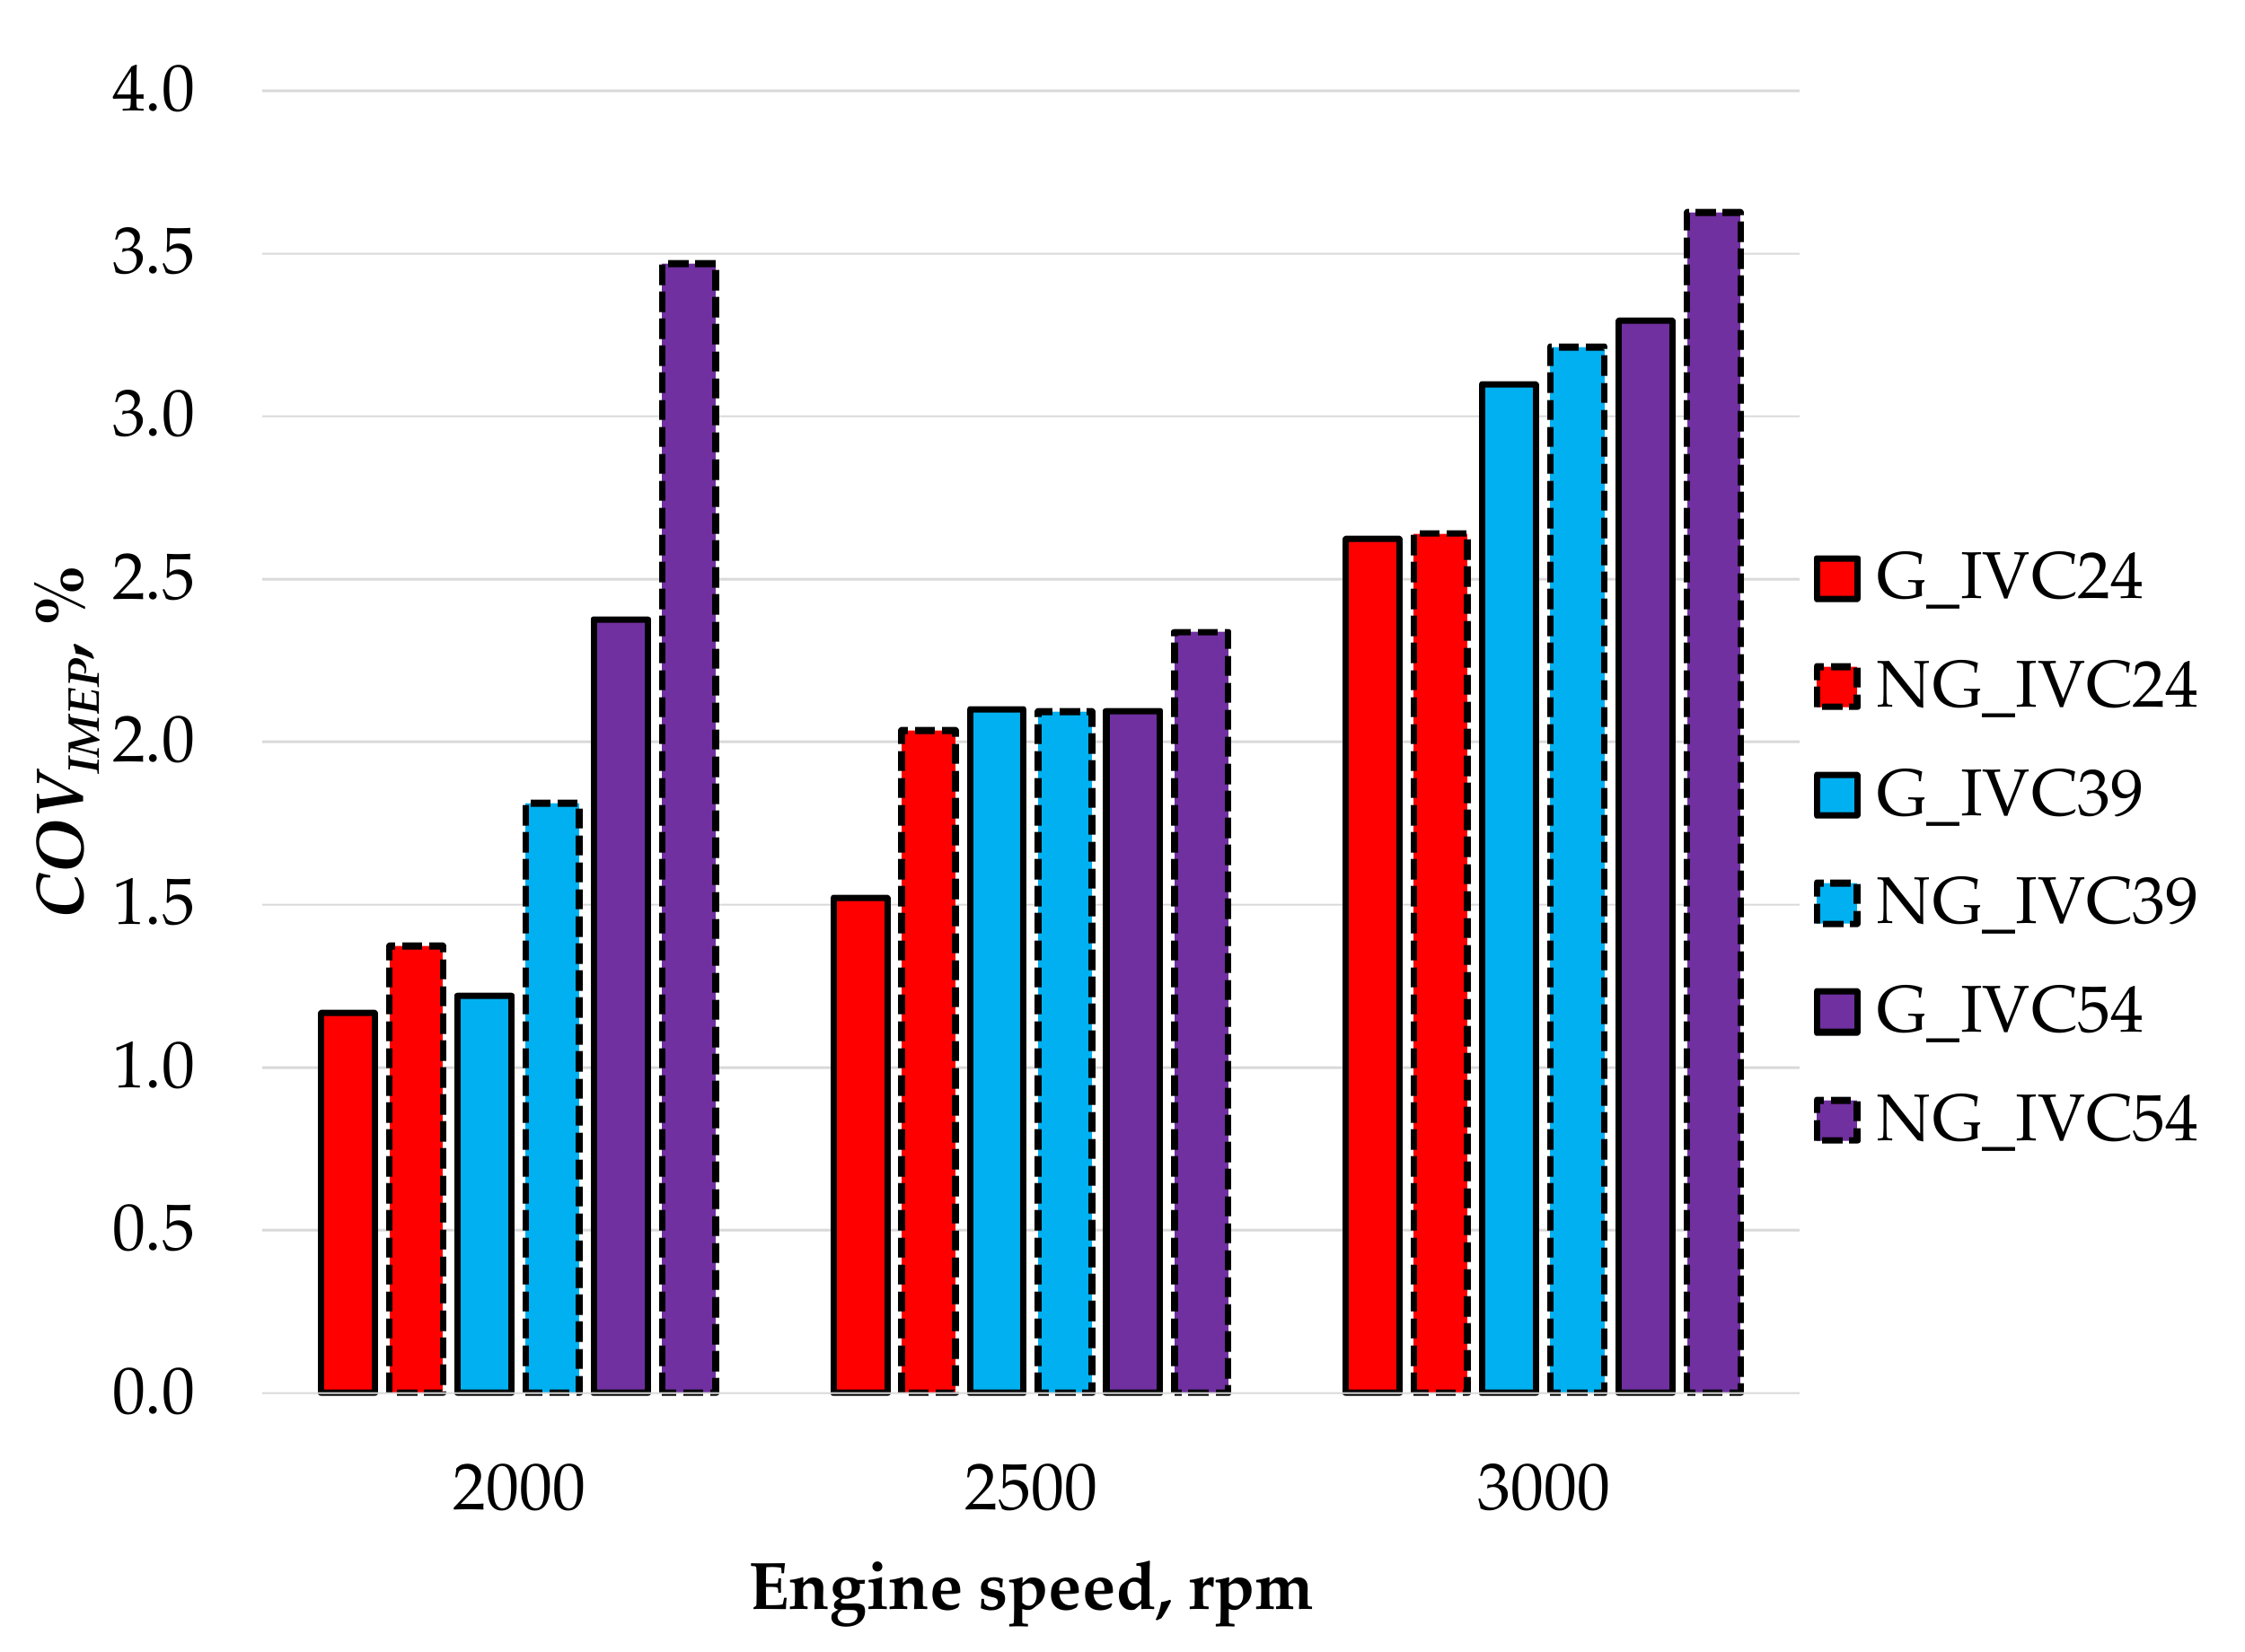
Delaying IVC decreases the stability of the combustion process and increases the indicated mean effective pressure (IMEP) and cycle-to-cycle variation COVIMEP (Figure 12). At the lower engine speed of 2000 rpm, the IMEP variation increased by 4.6 and 103.7% when the engine was running on gasoline and when IVC was delayed from 24 to 39 and to 54 CAD aBDC. The change from gasoline to natural gas increased the COVIMEP by 17.6% between G_24 and NG_24, by 48.4% between G_39 and NG_39, and 45.9% between G_54 and NG_54. Delaying the IVC resulted in an increase in the cycle-to-cycle variation, as retarding the IVC reduced the amount of air and fuel that could enter the cylinder, decreasing the maximum values of ROHR, combustion speed, and stability.
The experimental results that were obtained while testing the performance of an SI engine fueled by natural gas and at a low power correlate the data that were generated by other researchers. Changing gasoline to natural gas decreased the volumetric efficiency, the generated power, and the torque; however, the BTE increased [36,43,44]. The results obtained by other researchers show that increasing the IMEP and opening the throttle wider while an engine is running on natural gas will generate a BTE that is similar to the one that is generated when the engine is running on gasoline. Additionally, it is likely that the higher intake speed for an air/NG mixture with higher inertia would have greater influence on the engine’s volumetric efficiency at different IVC timings. However, in the presence of a low air/NG speed and a partially open throttle, in order to maintain better engine performance, it is recommended to combine an internal combustion engine running on NG with a hybrid powertrain [45].
3.3. Ecological Indicators
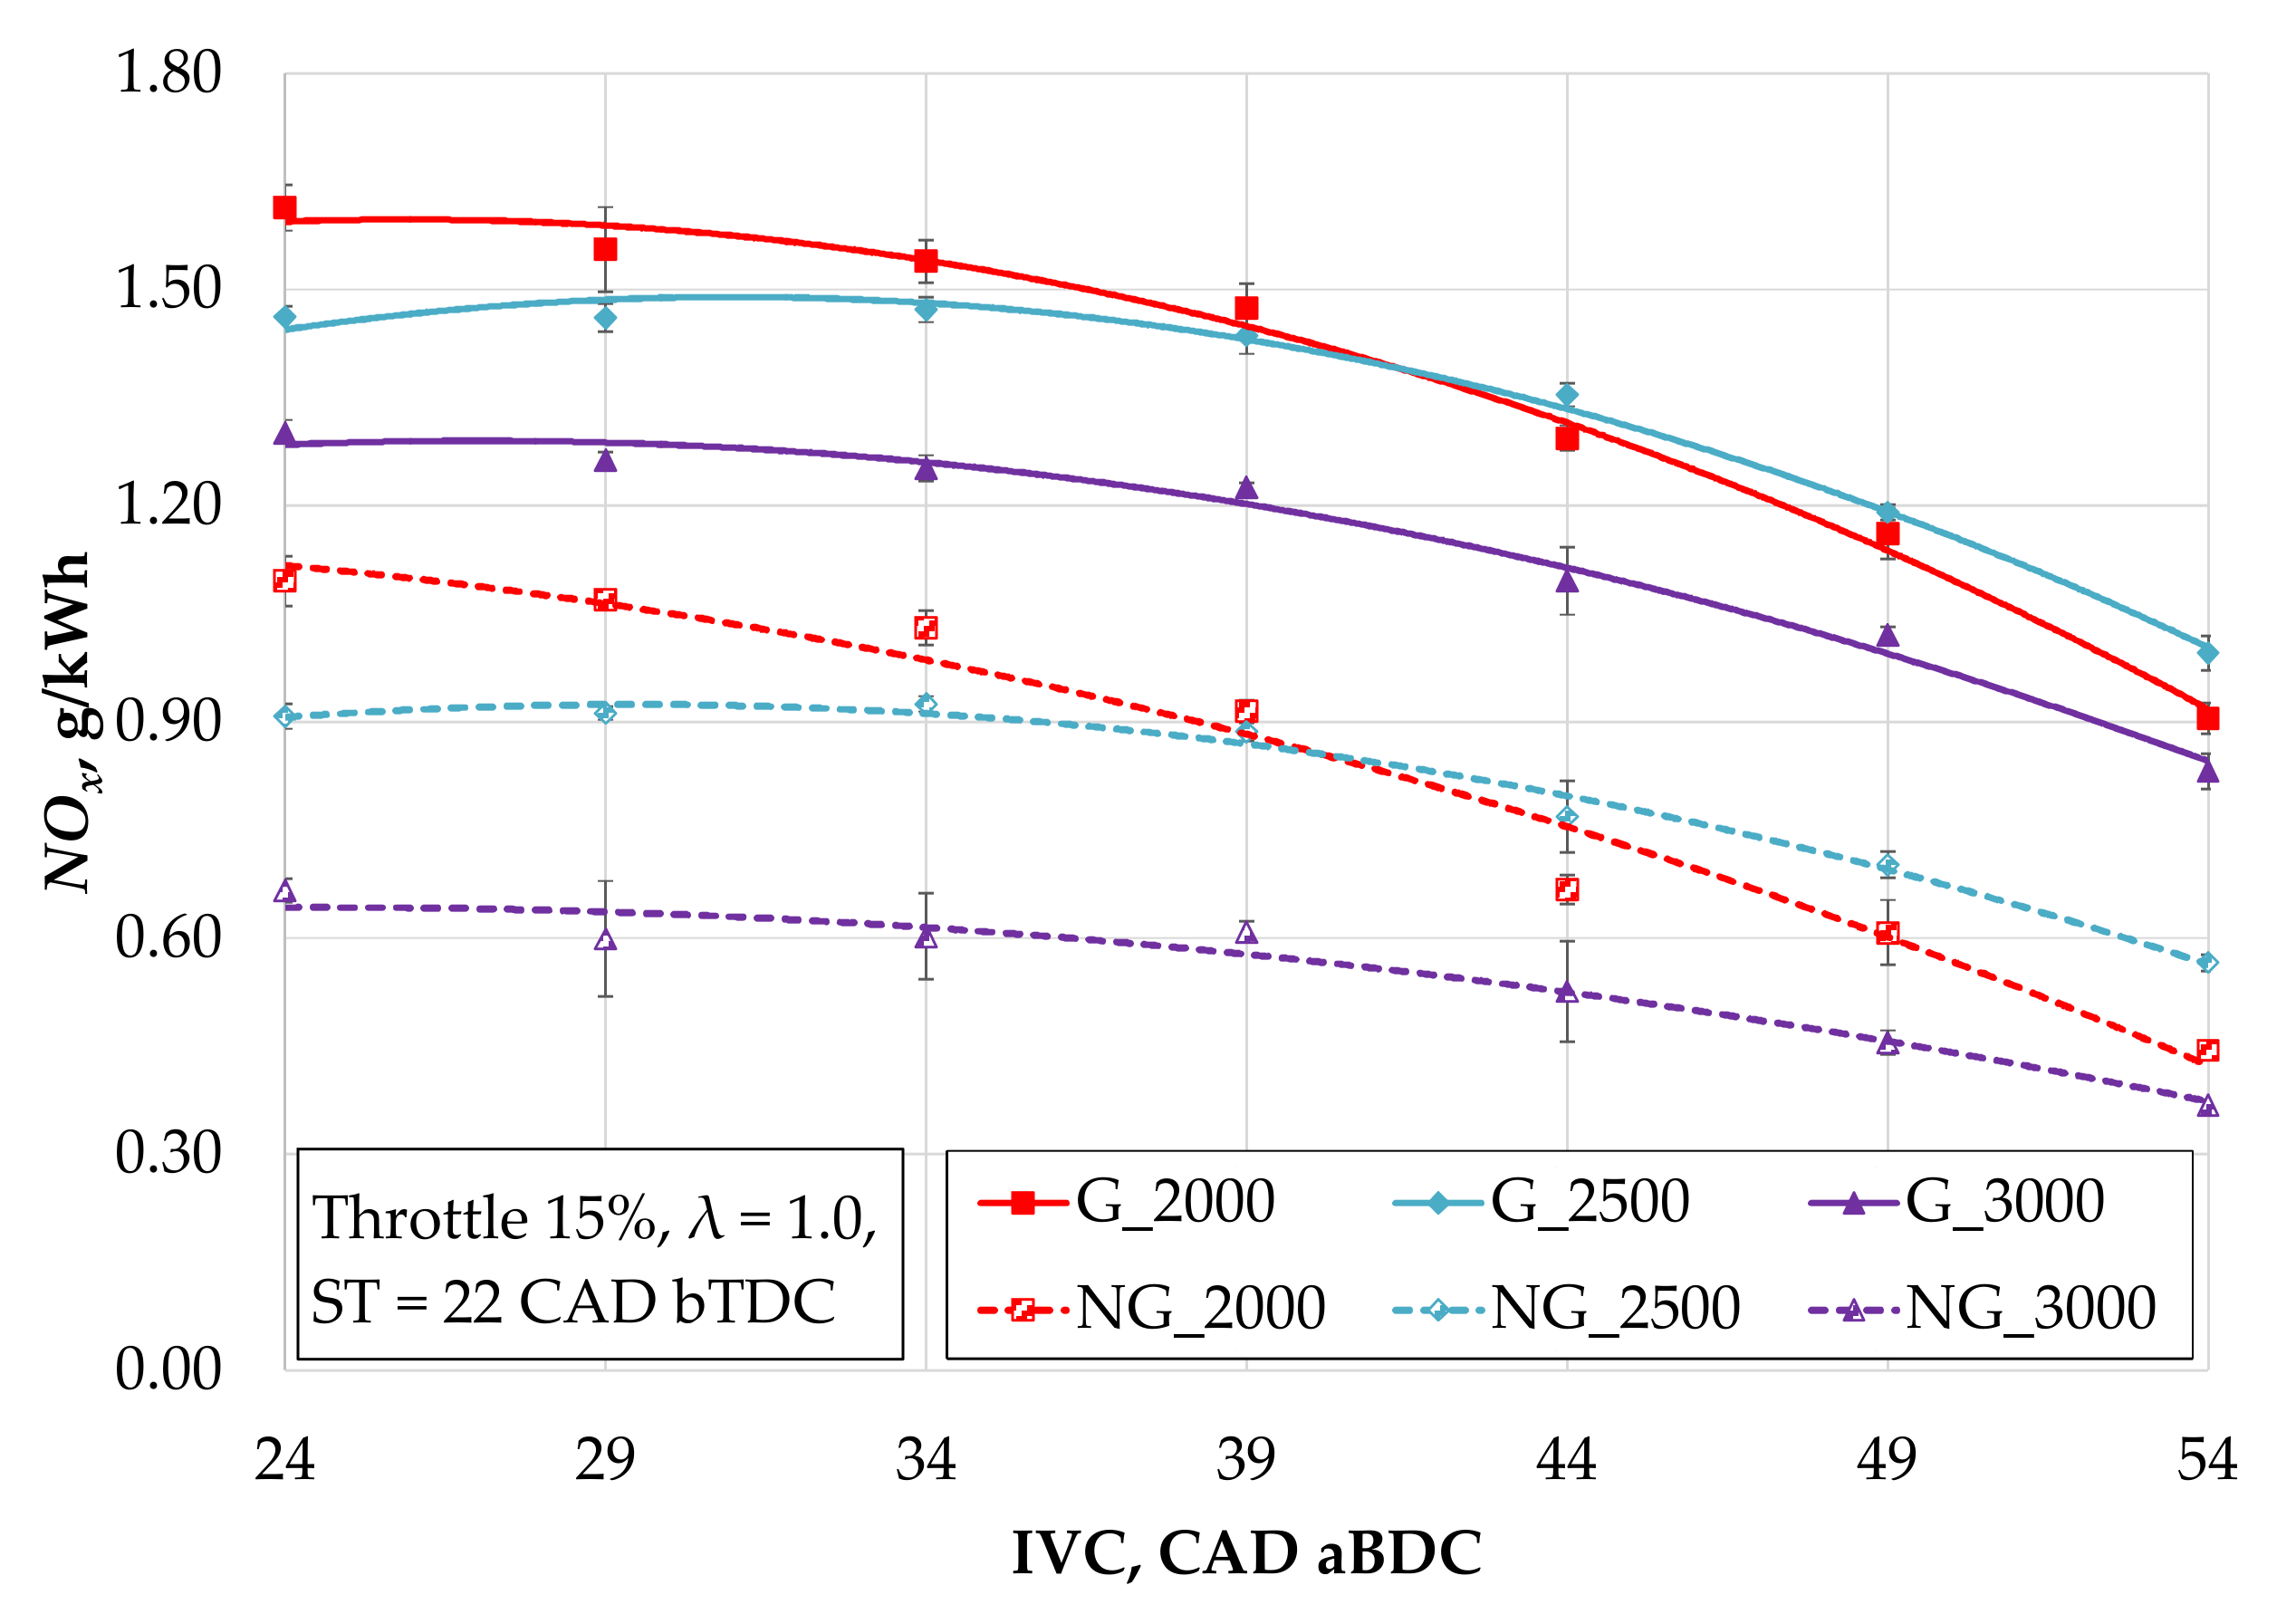
The results of the ecological indicators that are presented were obtained when the throttle was partially open (15%). Using different fuels, changing the engine speed, adjusting IVC timing the volumetric efficiency of the engine is changing. The mcycle and the Ecycle of the fuel changes and the engine creates a different MB and PB. Specific emissions (g/kWh) were analyzed to better estimate ecological indicators of the engine. The highest e NOx (1.61 g/kWh) emissions are visible when the engine is running at G_2000 and when the IVC is 24 CAD aBDC (Figure 13), which is also the case when the intake valve closes as it normally would (without delay), resulting in the minimum quantity of air and fuel being returned to the intake manifold. Additionally, at a lower engine speed, a longer amount of time is required to fill the cylinders; therefore, the volumetric efficiency of the engine increases. This also results in increased an in-cylinder pressure (Figure 5) and combustion temperature as well as the increased formation of NOx. Delaying the moment at which the intake valve closes reduced NOx emissions by 28.7% when the engine was running at G_2000 and when the IVC changed from 29 to 49 CAD aBDC. When the engine was running at NG_2000, the NOx emissions decreased by 31.3% compared to when it was running at G_2000 at 29 CAD aBDC IVC, where a decrease in the combustion temperature was observed (Figure 10) as well as the reduced formation of NOx. The combustion temperature decreased due to less Ecycl and slower gas combustion. Delaying the IVC time further decreased NOx emissions by 43.2% compared to when the IVC was 29 and 49 CAD aBDC. A similar tendency is also visible when the engine rpm increases, as delaying the IVC allows part of the air–fuel mixture to be returned back to the intake manifold and reduces the end pressure of the compression stroke, combustion temperature, and in-cylinder pressure.
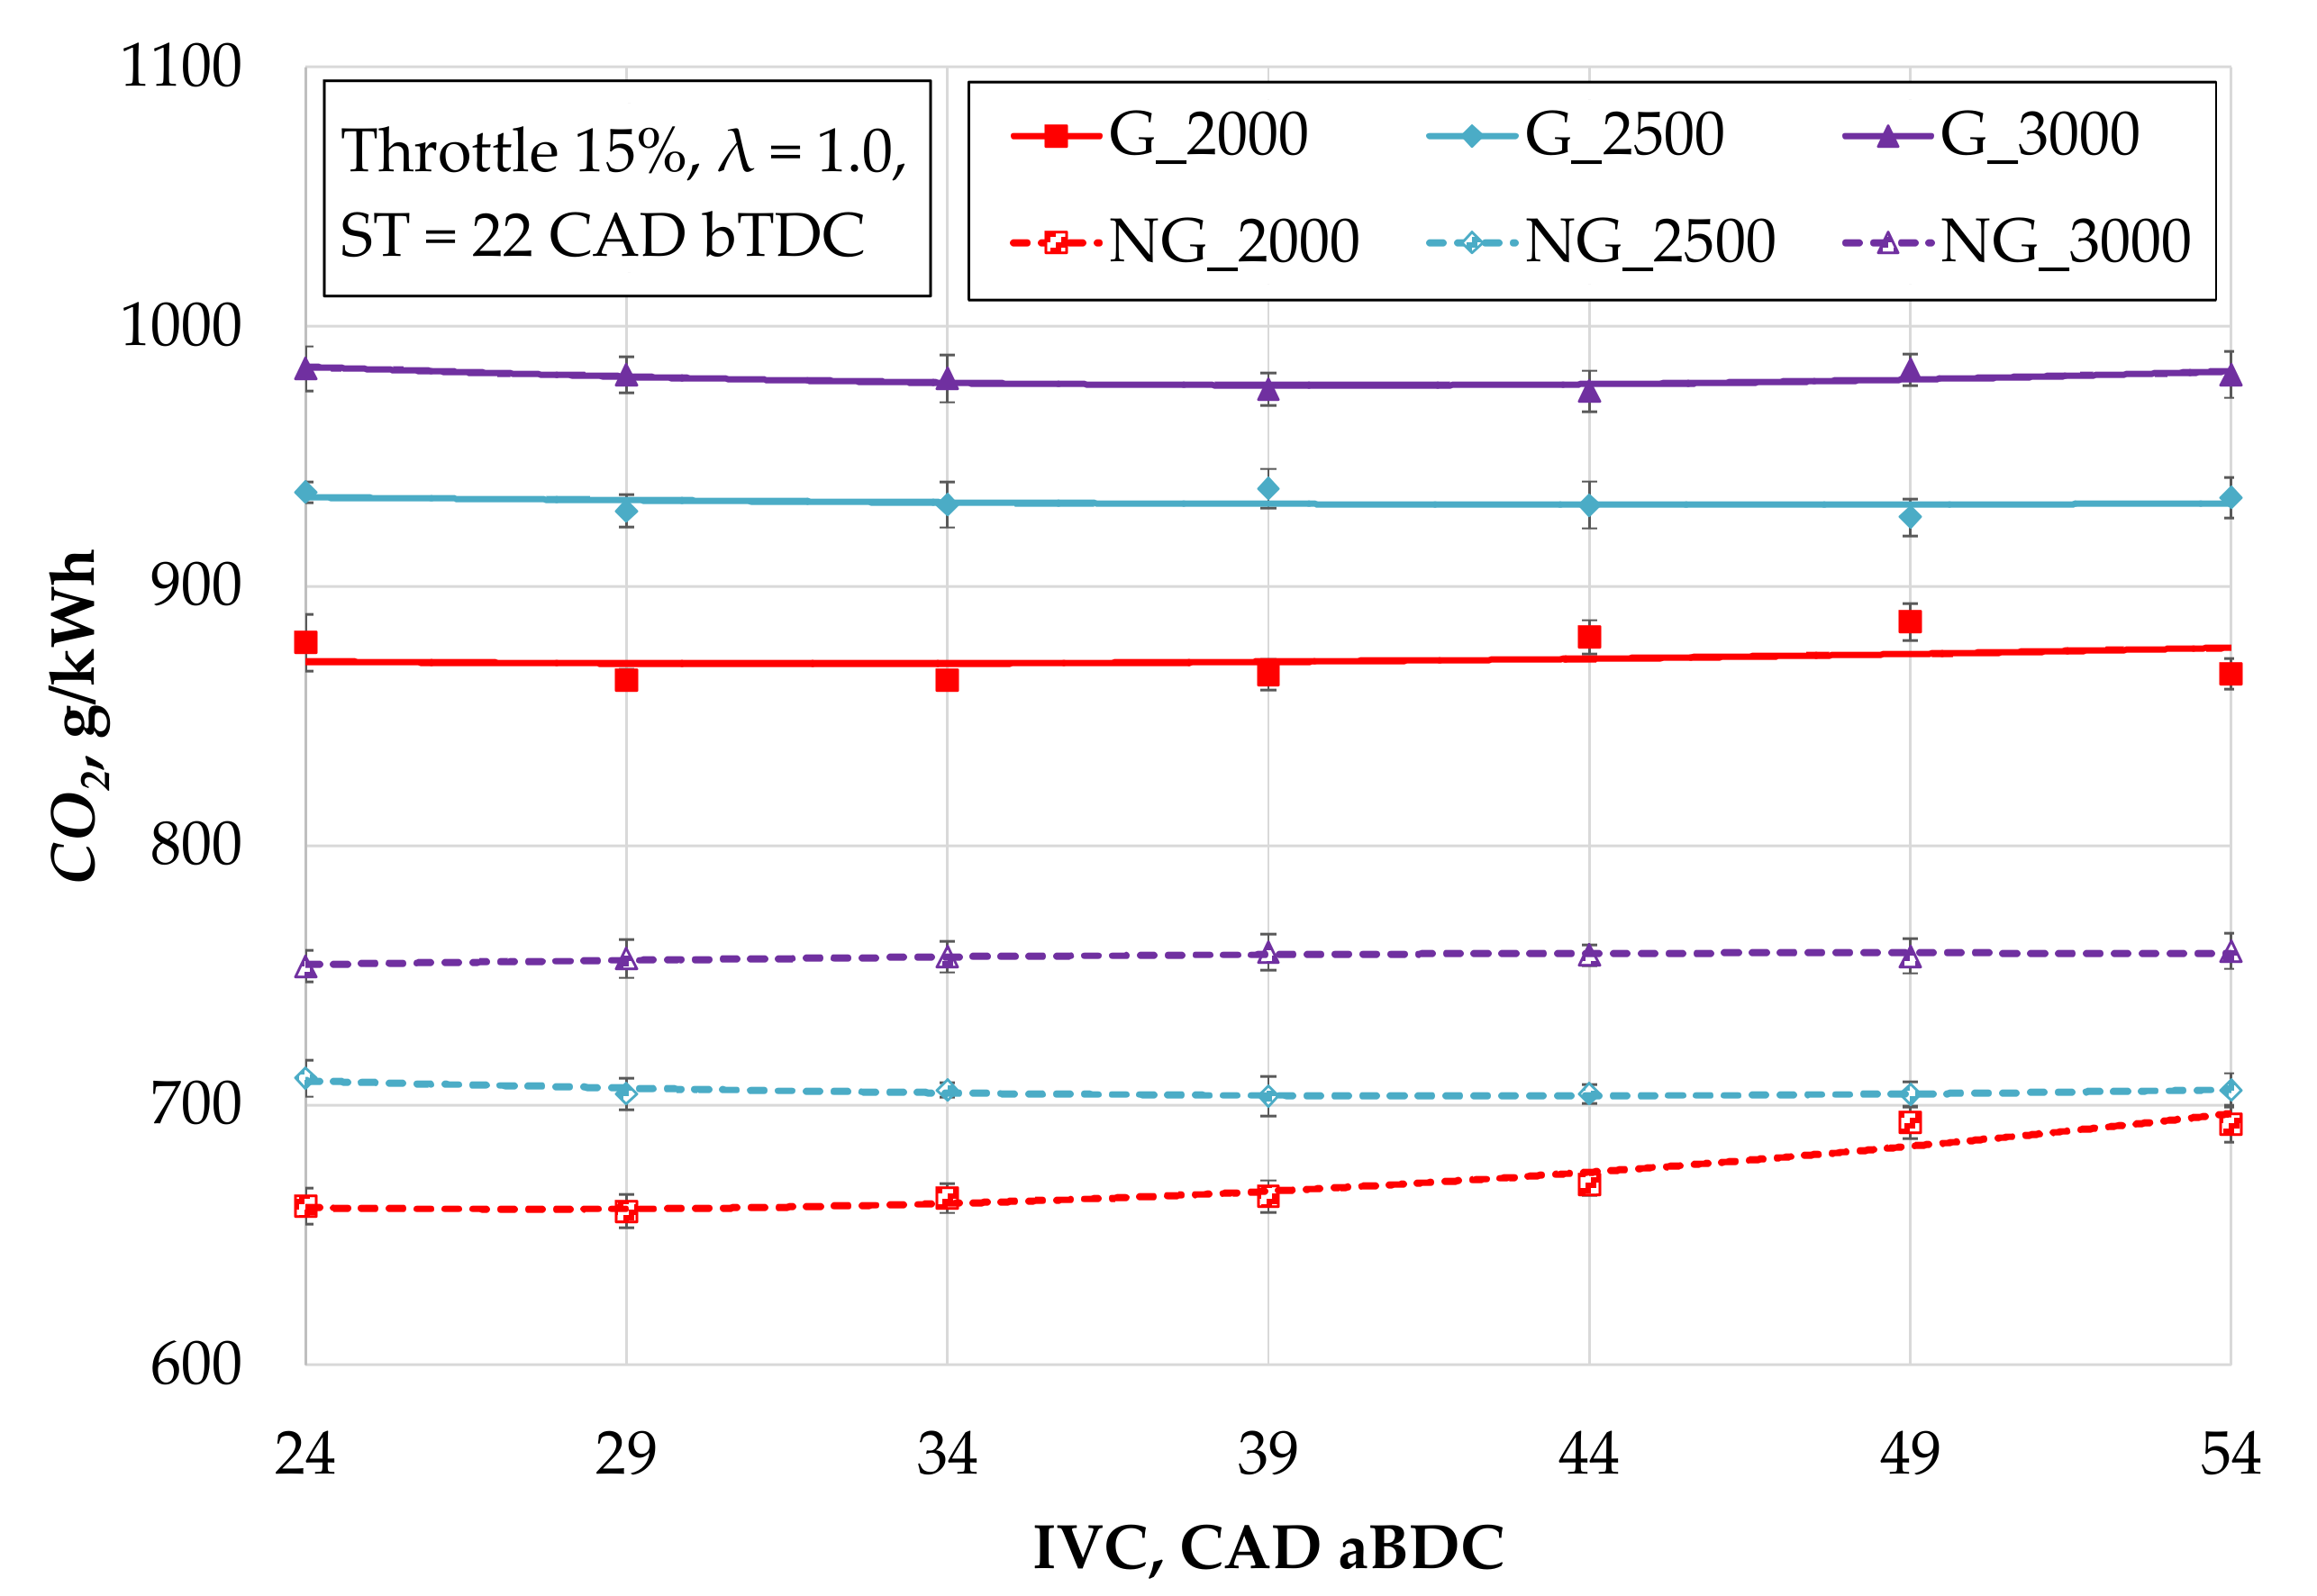
At all the measurement points, larger carbon dioxide (CO2) emissions were found in the exhaust gases from the engine when it was running on gasoline (Figure 14). Comparing the CO2 emissions from G_2000 and NG_2000 CO2, a decrease of 23.7% is observed at 29 CAD aBDC IVC when the fuel changed from gasoline to natural gas. NG comprises a simpler hydrocarbons structure and less carbon molecules, resulting in the reduced formation of CO2. Significantly lower BSFC of gas (Figure 7) and higher BTE (Figure 8) also have a positive effect. Delaying the moment of IVC to 49 CAD aBDC increased the amount of CO2 emissions that were present in the exhaust gas by 2.6% (NG_2000) and 1.5% (G_2000). At a lower engine rpm, and when the IVC was delayed, the amount of fuel in the cylinder decreased (Figure 7), and the combustion duration was prolonged, resulting in an increased exhaust gas temperature (Figure 11) and increased CO2 emissions. Increasing the engine speed also increased CO2 emissions. When the engine was powered by gasoline, the amount of CO2 emissions increased by 7.6% and 13.6% when the IVC was 29 CAD aBDC and when the engine speed increased from 2000 rpm to 2500 rpm and from 2500 rpm to 3000 rpm, respectively. At same comparison points, the CO2 emissions increased by 6.9% and 14.8% when the engine was being powered by NG. The specific CO2 emissions increased due to the decreased engine power, but the CO2 concentration in the exhaust gas varied insignificantly.
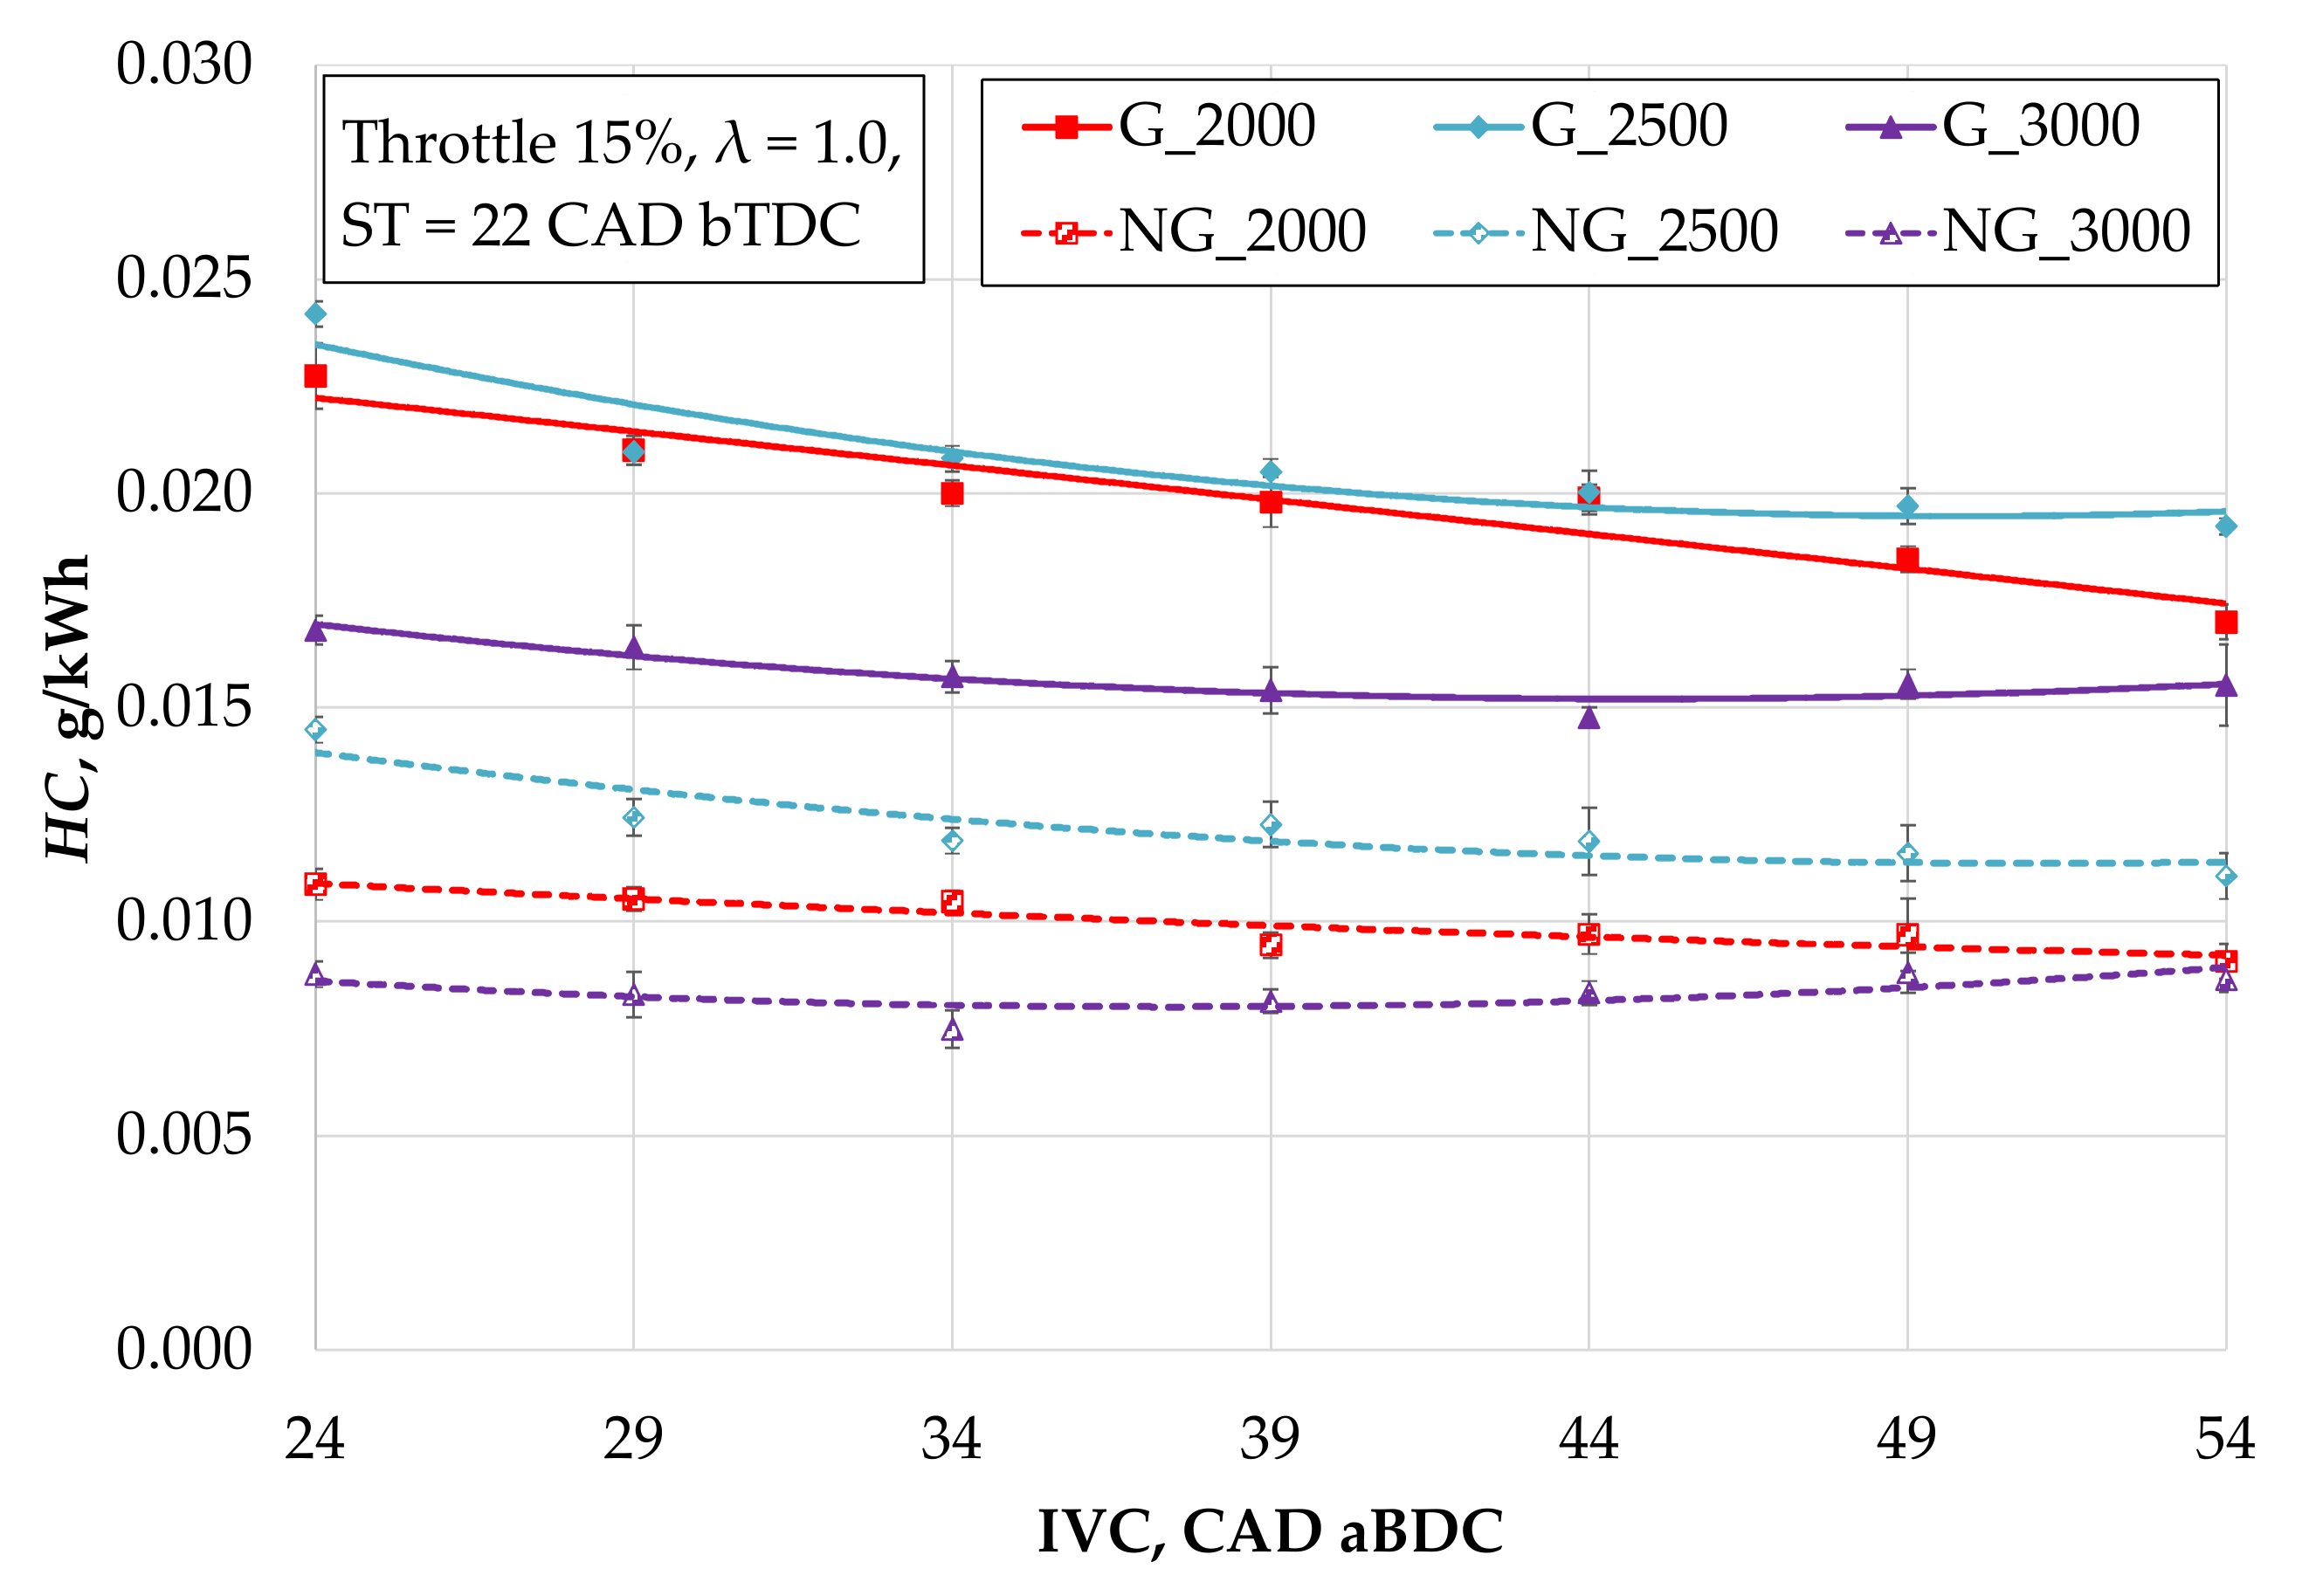
Changing the fuel from gasoline to natural gas reduced the amount of HC emissions in the exhaust gas (Figure 15). When IVC occurred (29 CAD aBDC), HC emissions decreased by 49.8% between G_2000 and NG_2000, by 40.7% between G_2500 and NG_2500, and by 49.4% between G_3000 and NG_3000. This decrease occurred due to the reduced amount of carbon molecules entering the cylinder, as NG has a lower C/H ratio than gasoline does (Table 3). Increasing the engine speed to 3000 rpm led to a decrease in the HC emissions as the exhaust gas temperature rose and an increase in the oxidation rate of the unburnt fuel in the exhaust manifold.
Specific emissions of pollutions have been reduced with NG, but more accurate environmental performance can be assessed with additional tests when the engine develops the same torque using different fuels. However, based on the available results, it can be predicted that using NG will generate significantly less maximum torque.
4. Conclusions
The energy performance and ecological effect of adjusting the IVC time after replacing gasoline with natural gas was investigated using a spark-ignition engine with a variable valve timing system. With the engine running at various speeds, the following results were obtained while recreating a low-speed city drive with a partially opened throttle (15%), a constant spark timing of 22 CAD bTDC, and an excess air ratio λ = 1:
- When the engine was running on natural gas in the medium engine speed range, the MB was reduced by ~8% compared with gasoline. Although LHV of NG is ~8% higher compared with gasoline, the energy content in the cylinder was reduced by ~15.5%, because an NG reduces the amount of air in the cylinder (decreases volumetric efficiency), and stoichiometric mixture requires ~16% less fuel mass for the same amount of air. As a result, mcycl of NG was ~22% less. IVC timing adjustment had different effects on engine performance at different fuels and engine speeds.
- The closure timing control of the intake valve has a significant effect on the energy performance of the engine at a moderate (2000 rpm) speed at partially opening throttle when using both gasoline and NG. Using gasoline (G_2000), maximum brake torque and power and minimum BSFC were achieved when the IVC timing was 39 CAD aBDC. Advancing the IVC time to 24 CAD aBDC, the brake torque was reduced by ~1%. Delaying the IVC time to 54 CAD aBDC resulted in MB being reduced by 3%. NG occupies a certain volume and reduces the density of the intake mixture that is allowed into the cylinder; the mixture has less inertia, and when the IVC is delayed for longer, part of the NG is pushed back into the intake manifold due to lower inertia, and it reduces the volumetric efficiency of the engine. The negative effect of the IVC timing delaying on energy performance is more pronounced in the case of NG_2500 and NG_3000, because partially opening the throttle (15%) reduces gas velocity and inertia.
- When the engine was running at G_2000, the maximum ROHR, pressure, and temperature (2304 K) in the cylinder were reached when the IVC timing was 39 CAD aBDC. By further delaying the IVC timing to 54 CAD aBDC due to the reduced fuel energy per cycle in the cylinder, the maximum temperature of the ROHR and the pressure decreased by 4.3%. In the case of NG_2000, the maximum in-cylinder pressure was reached when the intake valve closed at same time—39 CAD aBDC. Due to a decrease in the burning rate of NG and slower ROHR reduced the maximum burning temperature by 8.8%, with the maximum value being 5 CAD later than it was at G_2000. The trend of slower natural gas combustion persists with increasing engine speeds to 3000 rpm. Changing gasoline to natural gas increased the cycle-to-cycle variation due to the fact that IVC was delayed, as delaying the IVC reduces the amount of air and fuel entering the cylinder, decreasing the maximum values of ROHR, combustion speed, and stability. The engine performance (fueled by NG) could be improved by opening the throttle wider and by creating a higher IMEP in the cylinder. Slower gas burning requires early spark timing.
- Using NG in the engine, specific emissions of NOx are ~30% lower than gasoline due to slower combustion ant lower combustion temperatures. Increasing the engine speed and maximum delay of IVC reduced the specific emissions of NOx, because the NOx concentration decreased more intensely, due to poorer volumetric efficiency, compared to the change in engine power. After switching from gasoline to NG emissions of CO2 decreased ~23%. The CO2 specific emissions for NG and gasoline at 2000 rpm are the lowest at IVC timing to 29–34 CAD aBDC as maximum BTE is achieved. Delaying the IVC to the maximum reduces BTE, and the combustion process is prolonged; therefore, the exhaust gas temperature increases. Increasing engine speed to 3000 rpm with throttle 15% due to poorer volumetric efficiency reduces BTE and increases CO2 emissions. At this engine speed, IVC timing adjustment has a negligible effect, because the throttle does not allow to improve volumetric efficiency.
- Low engine speeds are sufficient to ensure high BTE and low emissions of the engine at low power. Adjusting IVC timing and spark timing can further improve engine performance, but engine torque using NG will be lower. The lower torque of engine powered by NG can be significantly increased by increasing the throttle, opening percentage, in conjunction with IVC timing and ST regulation and thus improving the volumetric efficiency and BTE of the engine.
Author Contributions
Conceptualization, D.K. and A.R.; methodology, A.R., T.V., D.K. and J.M.; software, A.R. and D.K.; validation, A.R. and J.M.; formal analysis, T.V. and J.M.; investigation, A.R., D.K. and T.R.; resources, A.R., D.K. and T.V.; data curation, A.R., T.R. and J.M.; writing—original draft preparation, A.R., D.K., T.V. and J.M.; writing—review and editing, A.R., J.M., D.K. and T.V.; visualization, A.R., D.K. and J.M.; supervision, A.R. and J.M.; project administration, A.R. and J.M.; funding acquisition, T.V. and A.R. All authors have read and agreed to the published version of the manuscript.
Funding
This research received no external funding.
Institutional Review Board Statement
Not applicable.
Informed Consent Statement
Not applicable.
Data Availability Statement
Not applicable.
Acknowledgments
The authors thank the AVL company for the opportunity to use the engine simulation tool AVL BOOST, which was used to analyze the combustion process and to present the results. A cooperation agreement has been concluded between the Faculty of Transport Engineering of Vilnius Gediminas Technical University and AVL Advanced Simulation Technologies.
Conflicts of Interest
The authors declare no conflict of interest.
References
- Kallas, S. White Paper on Transport: Roadmap to a Single European Transport Area: Towards a Competitive and Resource-Efficient Transport System; Publications Office of the European Union: Luxembourg, 2011; ISBN 978-92-79-18270-9. [Google Scholar]
- Mahdiloo, M.; Ngwenyama, O.; Scheepers, R.; Tamaddoni, A. Managing Emissions Allowances of Electricity Producers to Maximize CO2 Abatement: DEA Models for Analyzing Emissions and Allocating Emissions Allowances. Int. J. Prod. Econ. 2018, 205, 244–255. [Google Scholar] [CrossRef]
- Baz, K.; Cheng, J.; Xu, D.; Abbas, K.; Ali, I.; Ali, H.; Fang, C. Asymmetric Impact of Fossil Fuel and Renewable Energy Consumption on Economic Growth: A Nonlinear Technique. Energy 2021, 226, 120357. [Google Scholar] [CrossRef]
- CHWIST, M.; Al, E. Bio-Oil Blended Butanol as a Fuel to the Spark Ignition Internal Combustion Reciprocating Engine. Combust. Engines 2017, 56, 93–96. [Google Scholar] [CrossRef]
- Panoutsou, C.; Germer, S.; Karka, P.; Papadokostantakis, S.; Kroyan, Y.; Wojcieszyk, M.; Maniatis, K.; Marchand, P.; Landalv, I. Advanced Biofuels to Decarbonise European Transport by 2030: Markets, Challenges, and Policies That Impact Their Successful Market Uptake. Energy Strategy Rev. 2021, 34, 100633. [Google Scholar] [CrossRef]
- Chiaramonti, D.; Talluri, G.; Scarlat, N.; Prussi, M. The Challenge of Forecasting the Role of Biofuel in EU Transport Decarbonisation at 2050: A Meta-Analysis Review of Published Scenarios. Renew. Sustain. Energy Rev. 2021, 139, 110715. [Google Scholar] [CrossRef]
- Hotta, S.K.; Sahoo, N.; Mohanty, K. Comparative Assessment of a Spark Ignition Engine Fueled with Gasoline and Raw Biogas. Renew. Energy 2019, 134, 1307–1319. [Google Scholar] [CrossRef]
- Lijewski, P.; Kozak, M.; Fuc, P.; Rymaniak, L.; Ziolkowski, A. Exhaust Emissions Generated under Actual Operating Conditions from a Hybrid Vehicle and an Electric One Fitted with a Range Extender. Transp. Res. Part D-Transp. Environ. 2020, 78, 102183. [Google Scholar] [CrossRef]
- Rottoli, M.; Dirnaichner, A.; Pietzcker, R.; Schreyer, F.; Luderer, G. Alternative Electrification Pathways for Light-Duty Vehicles in the European Transport Sector. Transp. Res. Part D Transp. Environ. 2021, 99, 103005. [Google Scholar] [CrossRef]
- Long, A.; Murphy, J.D. Can Green Gas Certificates Allow for the Accurate Quantification of the Energy Supply and Sustainability of Biomethane from a Range of Sources for Renewable Heat and or Transport? Renew. Sustain. Energy Rev. 2019, 115, 109347. [Google Scholar] [CrossRef]
- Zhao, J.; Patwary, A.K.; Qayyum, A.; Alharthi, M.; Bashir, F.; Mohsin, M.; Hanif, I.; Abbas, Q. The Determinants of Renewable Energy Sources for the Fueling of Green and Sustainable Economy. Energy 2022, 238, 122029. [Google Scholar] [CrossRef]
- Arias, M.B.; Kim, M.; Bae, S. Prediction of Electric Vehicle Charging-Power Demand in Realistic Urban Traffic Networks. Appl. Energy 2017, 195, 738–753. [Google Scholar] [CrossRef]
- Gkatzoflias, D.; Drossinos, Y.; Zubaryeva, A.; Zambelli, P.; Dilara, P.; Thiel, C. Optimal Allocation of Electric Vehicle Charging Infrastructure in Cities and Regions. Available online: https://publications.jrc.ec.europa.eu/repository/bitstream/JRC101040/allocatechargingpoints_sciencepolreport_eurreport_online.pdf (accessed on 1 January 2020).
- Schismenos, S.; Chalaris, M.; Stevens, G. Battery Hazards and Safety: A Scoping Review for Lead Acid and Silver-Zinc Batteries. Saf. Sci. 2021, 140, 105290. [Google Scholar] [CrossRef]
- Commission of The European Communities Green Paper—A European Strategy for Sustainable, Competitive and Secure Energy. Available online: https://europa.eu/documents/comm/green_papers/pdf/com2006_105_en.pdf (accessed on 16 November 2021).
- Abd Alla, S.; Bianco, V.; Tagliafico, L.A.; Scarpa, F. Pathways to Electric Mobility Integration in the Italian Automotive Sector. Energy 2021, 221, 119882. [Google Scholar] [CrossRef]
- Brown, M.A.; Soni, A. Expert Perceptions of Enhancing Grid Resilience with Electric Vehicles in the United States. Energy Res. Soc. Sci. 2019, 57, 101241. [Google Scholar] [CrossRef]
- Kukharonak, H.; Ivashko, V.; Pukalskas, S.; Rimkus, A.; Matijošius, J. Operation of a Spark-Ignition Engine on Mixtures of Petrol and N-Butanol. Procedia Eng. 2017, 187, 588–598. [Google Scholar] [CrossRef]
- Cho, H.M.; He, B.-Q. Spark Ignition Natural Gas Engines—A Review. Energy Convers. Manag. 2007, 48, 608–618. [Google Scholar] [CrossRef]
- Karagöz, M.; Sarıdemir, S.; Deniz, E.; Çiftçi, B. The Effect of the CO2 Ratio in Biogas on the Vibration and Performance of a Spark Ignited Engine. Fuel 2018, 214, 634–639. [Google Scholar] [CrossRef]
- Abdelkareem, M.A.A.; Xu, L.; Ali, M.K.A.; Elagouz, A.; Mi, J.; Guo, S.; Liu, Y.; Zuo, L. Vibration Energy Harvesting in Automotive Suspension System: A Detailed Review. Appl. Energy 2018, 229, 672–699. [Google Scholar] [CrossRef]
- Kuramochi, T.; Nascimento, L.; Moisio, M.; den Elzen, M.; Forsell, N.; van Soest, H.; Tanguy, P.; Gonzales, S.; Hans, F.; Jeffery, M.L.; et al. Greenhouse Gas Emission Scenarios in Nine Key Non-G20 Countries: An Assessment of Progress toward 2030 Climate Targets. Environ. Sci. Policy 2021, 123, 67–81. [Google Scholar] [CrossRef]
- Fragkos, P.; Fragkiadakis, K.; Sovacool, B.; Paroussos, L.; Vrontisi, Z.; Charalampidis, I. Equity Implications of Climate Policy: Assessing the Social and Distributional Impacts of Emission Reduction Targets in the European Union. Energy 2021, 237, 121591. [Google Scholar] [CrossRef]
- Chandrasekar, K.; Sudhakar, S.; Rajappan, R.; Senthil, S.; Balu, P. Present Developments and the Reach of Alternative Fuel: A Review. Mater. Today Proc. 2021. Available online: https://doi.org/10.1016/j.matpr.2021.04.505 (accessed on 10 November 2021).
- Kalghatgi, G. Development of Fuel/Engine Systems—The Way Forward to Sustainable Transport. Engineering 2019, 5, 510–518. [Google Scholar] [CrossRef]
- Bari, S.; Sawant, P. Improvement of Performance by 2-Step Variations of Intake Runner Length and Intake Valve Timing in the Induction System of a SI Engine. Energy Procedia 2019, 160, 108–115. [Google Scholar] [CrossRef]
- Zhao, J.; Xi, Q.; Wang, S.; Wang, S. Improving the Partial-Load Fuel Economy of 4-Cylinder SI Engines by Combining Variable Valve Timing and Cylinder-Deactivation through Double Intake Manifolds. Appl. Therm. Eng. 2018, 141, 245–256. [Google Scholar] [CrossRef]
- Demir, U.; Coskun, G.; Soyhan, H.S.; Turkcan, A.; Alptekin, E.; Canakci, M. Effects of Variable Valve Timing on the Air Flow Parameters in an Electromechanical Valve Mechanism—A Cfd Study. Fuel 2022, 308, 121956. [Google Scholar] [CrossRef]
- Nagumo, S.; Hara, S. Study of Fuel Economy Improvement through Control of Intake Valve Closing Timing: Cause of Combustion Deterioration and Improvement. JSAE Rev. 1995, 16, 13–19. [Google Scholar] [CrossRef]
- Park, C.; Ebisu, M.; Bae, C. Improvement of Instantaneous Turbine Efficiency through Late Intake Valve Phase (LIVP) in a Turbocharged-Gasoline Direct Injection (T-GDI) Engine. Appl. Therm. Eng. 2020, 181, 115976. [Google Scholar] [CrossRef]
- Perceau, M.; Guibert, P.; Guilain, S. Zero-Dimensional Turbulence Modeling of a Spark Ignition Engine in a Miller Cycle «Dethrottling» Approach Using a Variable Valve Timing System. Appl. Therm. Eng. 2021, 199, 117535. [Google Scholar] [CrossRef]
- Li, Y.; Khajepour, A.; Devaud, C. Realization of Variable Otto-Atkinson Cycle Using Variable Timing Hydraulic Actuated Valve Train for Performance and Efficiency Improvements in Unthrottled Gasoline Engines. Appl. Energy 2018, 222, 199–215. [Google Scholar] [CrossRef]
- Komninos, N.P.; Rogdakis, E.D. Numerical Investigation into the Effect of Compressor and Expander Valve Timings on the Performance of an Ericsson Engine Equipped with a Gas-to-Gas Heat Exchanger. Energy 2018, 163, 1077–1092. [Google Scholar] [CrossRef]
- Takahashi, D.; Nakata, K.; Yoshihara, Y.; Ohta, Y.; Nishiura, H. Combustion Development to Achieve Engine Thermal Efficiency of 40% for Hybrid Vehicles; Society of Automotive Engineers: Warrendale, PA, USA, 2015; pp. 1–9. [Google Scholar]
- Kato, K.; Igarashi, K.; Masuda, M.; Otsubo, K.; Yasuda, A.; Takeda, K.; Sato, T. Development of Engine for Natural Gas Vehicle; SAE: Warrendale, PN, USA, 1999; pp. 1–11. [Google Scholar]
- Kim, S.; Park, C.; Jang, H.; Kim, C.; Kim, Y. Effect of Boosting on a Performance and Emissions in a Port Fuel Injection Natural Gas Engine with Variable Intake and Exhaust Valve Timing. Energy Rep. 2021, 7, 4941–4950. [Google Scholar] [CrossRef]
- Wang, J.; Duan, X.; Wang, W.; Guan, J.; Li, Y.; Liu, J. Effects of the Continuous Variable Valve Lift System and Miller Cycle Strategy on the Performance Behavior of the Lean-Burn Natural Gas Spark Ignition Engine. Fuel 2021, 297, 120762. [Google Scholar] [CrossRef]
- Dogru, B.; Lot, R.; Ranga Dinesh, K.K.J. Valve Timing Optimisation of a Spark Ignition Engine with Skip Cycle Strategy. Energy Convers. Manag. 2018, 173, 95–112. [Google Scholar] [CrossRef] [Green Version]
- Szwaja, S.; Ansari, E.; Rao, S.; Szwaja, M.; Grab-Rogalinski, K.; Naber, J.D.; Pyrc, M. Influence of Exhaust Residuals on Combustion Phases, Exhaust Toxic Emission and Fuel Consumption from a Natural Gas Fueled Spark-Ignition Engine. Energy Convers. Manag. 2018, 165, 440–446. [Google Scholar] [CrossRef]
- Melaika, M. Research of a Combustion Process in a Spark Ignition Engine, Fuelled With Gaseous Fuel Mixtures; Vilnius Gediminas Technical University: Vilnius, Lithuania, 2016; ISBN 978-609-457-996-7. [Google Scholar]
- Sendzikiene, E.; Rimkus, A.; Melaika, M.; Makareviciene, V.; Pukalskas, S. Impact of Biomethane Gas on Energy and Emission Characteristics of a Spark Ignition Engine Fuelled with a Stoichiometric Mixture at Various Ignition Advance Angles. Fuel 2015, 162, 194–201. [Google Scholar] [CrossRef]
- Lecuona, A.; Nogueira, J.I.; Famiglietti, A. Open Dual Cycle with Composition Change and Limited Pressure for Prediction of Miller Engines Performance and Its Turbine Temperature. Energies 2021, 14, 2870. [Google Scholar] [CrossRef]
- Melaika, M.; Herbillon, G.; Dahlander, P. Spark Ignition Engine Performance, Standard Emissions and Particulates Using GDI, PFI-CNG and DI-CNG Systems. Fuel 2021, 293, 120454. [Google Scholar] [CrossRef]
- Nguyen Duc, K.; Nguyen Duy, V.; Hoang-Dinh, L.; Nguyen Viet, T.; Le-Anh, T. Performance and Emission Characteristics of a Port Fuel Injected, Spark Ignition Engine Fueled by Compressed Natural Gas. Sustain. Energy Technol. Assess. 2019, 31, 383–389. [Google Scholar] [CrossRef]
- Li, Y.; Wang, S.; Duan, X.; Liu, S.; Liu, J.; Hu, S. Multi-Objective Energy Management for Atkinson Cycle Engine and Series Hybrid Electric Vehicle Based on Evolutionary NSGA-II Algorithm Using Digital Twins. Energy Convers. Manag. 2021, 230, 113788. [Google Scholar] [CrossRef]
Figure 1.
SI engine NISSAN HR16DE test scheme: 1—engine; 2—load stand AMX200/100; 3—load bench control unit; 4—in-cylinder pressure measuring equipment AVL DiTEST DPM 800; 5—ECU MOTEC M800; 6—throttle control mechanism; 7—fuel injector; 8—spark plug with in-cylinder pressure sensor AVL ZI31; 9—oxygen sensor; 10—crankshaft position sensor; 11—exhaust gas temperature sensor; 12—air mass meter; 13—control computer; 14—NG cylinder; 15—air mass meter indicator; 16—fuel consumption meter; 17—AVL DiCom 4000 exhaust gas analyzer; 18—gas injector; 19—mass flow meter RHEONIK RHM015; 20—high-pressure gas reducer.

Figure 2.
Brake torque when running on gasoline and natural gas and changing intake valve close timing.
Figure 2.
Brake torque when running on gasoline and natural gas and changing intake valve close timing.

Figure 3.
Fuel mass entering the cylinder over the cycle with gasoline and natural gas and while changing the intake valve close timing.
Figure 3.
Fuel mass entering the cylinder over the cycle with gasoline and natural gas and while changing the intake valve close timing.

Figure 4.
Fuel energy entering the cylinder during the cycle with the engine running on gasoline and natural gas and while changing the intake valve close timing.
Figure 4.
Fuel energy entering the cylinder during the cycle with the engine running on gasoline and natural gas and while changing the intake valve close timing.

Figure 5.
Changes in in-cylinder pressure with the engine running on gasoline and natural gas and while changing the intake valve close timing: (a) 2000 rpm; (b) 2500 rpm; and (c) 3000 rpm.
Figure 5.
Changes in in-cylinder pressure with the engine running on gasoline and natural gas and while changing the intake valve close timing: (a) 2000 rpm; (b) 2500 rpm; and (c) 3000 rpm.

Figure 6.
Engine power with gasoline and natural gas and intake valve close timing.

Figure 7.
Brake-specific fuel consumption when the engine was running on gasoline and natural gas and while changing the intake valve close timing.
Figure 7.
Brake-specific fuel consumption when the engine was running on gasoline and natural gas and while changing the intake valve close timing.

Figure 8.
Brake thermal efficiency while running on gasoline and natural gas and while changing the intake valve close timing.
Figure 8.
Brake thermal efficiency while running on gasoline and natural gas and while changing the intake valve close timing.

Figure 9.
The rate of heat release when the engine is running on gasoline and natural gas and while changing the intake valve close timing: (a) 2000 rpm; (b) 2500 rpm; and (c) 3000 rpm.
Figure 9.
The rate of heat release when the engine is running on gasoline and natural gas and while changing the intake valve close timing: (a) 2000 rpm; (b) 2500 rpm; and (c) 3000 rpm.

Figure 10.
Combustion temperature in the cylinder with the engine running on gasoline and natural gas and while changing the intake valve close timing: (a) 2000 rpm; (b) 2500 rpm; and (c) 3000 rpm.
Figure 10.
Combustion temperature in the cylinder with the engine running on gasoline and natural gas and while changing the intake valve close timing: (a) 2000 rpm; (b) 2500 rpm; and (c) 3000 rpm.


Figure 11.
Exhaust temperature of the engine running on gasoline and natural gas and while changing the intake valve close timing.
Figure 11.
Exhaust temperature of the engine running on gasoline and natural gas and while changing the intake valve close timing.

Figure 12.
Indicated mean effective pressure variation engine running on gasoline and natural gas and while changing the intake valve close timing.
Figure 12.
Indicated mean effective pressure variation engine running on gasoline and natural gas and while changing the intake valve close timing.

Figure 13.
Changes in the specific NOx emissions from an engine running on gasoline and natural gas and while changing the intake valve close timing.
Figure 13.
Changes in the specific NOx emissions from an engine running on gasoline and natural gas and while changing the intake valve close timing.

Figure 14.
Change of the specific carbon dioxide emissions from an engine running on gasoline and natural gas and while changing the intake valve close timing.
Figure 14.
Change of the specific carbon dioxide emissions from an engine running on gasoline and natural gas and while changing the intake valve close timing.

Figure 15.
Change of the specific HC emissions from an engine running on gasoline and natural gas and while changing the intake valve close timing.
Figure 15.
Change of the specific HC emissions from an engine running on gasoline and natural gas and while changing the intake valve close timing.


Table 1.
Technical characteristics of engine HR16DE.
| Parameter | The Units | Value |
|---|---|---|
| Engine type | Spark ignition | |
| Cylinder arrangement | In-line 4 | |
| Cooling | Water | |
| Displacement | dm3 | 1.598 |
| Cylinder bore and stroke | mm | 78.0 × 83.6 |
| Maximum power | kW (at rpm) | 84 (6000) |
| Maximum torque | Nm (at rpm) | 156 (4400) |
| Compression ratio | 10.7 | |
| Number of valves | 16 (DOHC) | |
| Intake valve open (IVO) | CAD bTDC 1 | 24 … −11 (VVT) |
| Intake valve close (IVC) | CAD aBDC 2 | 24 … 59 (VVT) |
| Intake valve duration (IVD) | CAD | 228 |
| Exhaust valve open (EVO) | CAD bBDC 3 | 24 |
| Exhaust valve close (EVC) | CAD aTDC 4 | 4 |
| Exhaust valve duration (EVD) | CAD | 208 |
1 CAD bTDC—crank angle degrees before top dead center. 2 CAD aBDC—crank angle degrees after bottom dead center. 3 CAD bBDC—crank angle degrees before bottom dead center. 4 CAD aTDC—crank angle degrees after top dead center.
Table 2.
The main specifications of the instruments and equipment.
| Equipment | Type | Specifications | Error |
|---|---|---|---|
| Engine load stand | Eddy current type | Maximum speed 6000 rpm, maximum brake torque 480 Nm | Torque: ±0.9 Nm |
| AMX200/100 | |||
| Coriolis mass flowmeter | RHEONIK RHM 015 | Measuring range | ±0.10% |
| 0.004… 0.6 kg/min | |||
| Intake air mass meter | BOSCH HFM 5 | Measuring range | ±2% |
| 8… 370 kg/h | |||
| Exhaust gas temperature sensor | K-type thermocouple | Measuring range | ±0.5% |
| 0… +1250 °C | |||
| Cylinder pressure sensor | AVL ZI31_Y7S | Measuring range | Sensitivity 11.62 pC/bar |
| 0… 200 bar | |||
| Crankshaft position sensor | Photoelectric encoder | Signal repeatability | - |
| A58M-F | 0.1758 CAD | ||
| Exhaust gas analyzer | AVL DiCom 4000 | Measuring range: | |
| CO2–0… 20% | ±0.1% | ||
| CO–0… 10% | ±0.01% | ||
| HC–0… 20,000 ppm | ±1 ppm | ||
| NOx–0… 5000 ppm | ±1 ppm | ||
| O2–0… 25% | ±0.01% |
Table 3.
Fuel properties.
| Parameter | The Units | Gasoline (G) | Natural Gas (NG) |
|---|---|---|---|
| Density | kg/m3 | 740 * | ~0.74 ** |
| Octane number | 95 | ~120 | |
| Lower heating value (LHV) | MJ/kg | ~44.0 | ~47.5 |
| Stoichiometric mixture (A/F) | kg/kg | ~14.7/1 | ~17.2/1 |
| Boiling temperature | °C | 25–215 *** | −162*,** |
| Specific heat of vaporization | kJ/kg | ~380 | ~550 |
| Freezing point | °C | −40 *** | −162 *** |
| Auto-ignition temperature | °C | ~400 | ~540 |
| Adiabatic flame temperature | °C | ~2150 | ~1890 |
| Flame spread rate | m/s | ~0.5 | ~0.41 |
| H/C ratio | ~0.163 | ~0.316 | |
| Chemical element/component | % (mass) | Carbon: ~0.836 | Methane: 91.97 |
| Hydrogen: ~0.139 | Ethane: 5.75 | ||
| Oxygen: ~0.025 | Propane: 1.30 | ||
| Butane: 0.281 | |||
| Nitrogen: 0.562 | |||
| Carbon dioxide: 0.0 |
* at 20 °C. ** at 0 °C and 101.3 kPa pressure. *** at 101.3 kPa pressure.
Publisher’s Note: MDPI stays neutral with regard to jurisdictional claims in published maps and institutional affiliations. |
© 2022 by the authors. Licensee MDPI, Basel, Switzerland. This article is an open access article distributed under the terms and conditions of the Creative Commons Attribution (CC BY) license (https://creativecommons.org/licenses/by/4.0/).
Share and Cite
MDPI and ACS Style
Rimkus, A.; Vipartas, T.; Kriaučiūnas, D.; Matijošius, J.; Ragauskas, T. The Effect of Intake Valve Timing on Spark-Ignition Engine Performances Fueled by Natural Gas at Low Power. Energies 2022, 15, 398. https://doi.org/10.3390/en15020398
AMA Style
Rimkus A, Vipartas T, Kriaučiūnas D, Matijošius J, Ragauskas T. The Effect of Intake Valve Timing on Spark-Ignition Engine Performances Fueled by Natural Gas at Low Power. Energies. 2022; 15(2):398. https://doi.org/10.3390/en15020398
Chicago/Turabian StyleRimkus, Alfredas, Tadas Vipartas, Donatas Kriaučiūnas, Jonas Matijošius, and Tadas Ragauskas. 2022. "The Effect of Intake Valve Timing on Spark-Ignition Engine Performances Fueled by Natural Gas at Low Power" Energies 15, no. 2: 398. https://doi.org/10.3390/en15020398
Note that from the first issue of 2016, this journal uses article numbers instead of page numbers. See further details here.