
Model of the Floating Bearing Bushing Movement in an External Gear Pump and the Relation to Its Parameterization


Campus Terrassa, Department of Fluid Mechanics, CATMech, Universitat Politécnica de Catalunya, Colom 7, 08222 Terrassa, Spain
*
Author to whom correspondence should be addressed.
Energies 2021, 14(24), 8553; https://doi.org/10.3390/en14248553
Submission received: 10 November 2021
/
Revised: 10 December 2021
/
Accepted: 14 December 2021
/
Published: 18 December 2021
(This article belongs to the Special Issue Gear Pumps and Motors)
Abstract
:This article presents the modeling, simulation and experimental validation of the movement of the floating bearing bushing in an external gear pump. As a starting point, a complete pump parameterization was carried out through standard tests, and these parameters were used in a first bond graph model in order to simulate the gear pump behavior. This model was experimentally validated under working conditions in field tests. Then, a sophisticated bond graph model of the movement of the floating bushing was developed from the equations that define its lubrication. Finally, as a result, both models were merged by integrating the dynamics of the floating bushing bearing with the variation of the characteristic parameters (loss coefficients). Finally, the final model was experimentally validated both in laboratory and field tests by assembling the pump in a drilling machine to drive the auxiliary movements. The novelty of this article is the conception and construction of a simple and experimentally validated tool for the study of a gear pump, which relates its macroscopic behavior as a black box (defined by the loss coefficients) to the internal changes of the unit (defined by its internal lubrication).
1. Introduction
The fluid dynamic characterization of hydrostatic machines, and in particular of external gear pumps, has been widely discussed. These studies have been carried out from two points of view. The first considers the pump as a flow generator characterized by parameters that define its operation both in steady and unsteady conditions. The characterization of the parameters related to the behavior in a steady state—that is, those that define the flow losses due to leakage and torque losses owing to friction—began with Wilson [1], and were subsequently treated by other authors, such as Toet [2] and Schlosser [3]. Dorey [4] introduced different parameters depending on the complexity of the model. Leakage and frictional losses are also related to wear degradation, as has lately been identified by Guo et al. [5] in a verified method by testing four external gear pumps. Regarding the characterization of the parameters involved in the pulsating behavior of the unit, that is, that define its potential as a noise generator, we can cite the works of Edge and Johnston [6], and Kojima [7], research that led to standardized tests ISO 10767-1:1996 and 2015. In summary, from a “black box” point of view, a positive displacement pump can be characterized by the following parameters: the volumetric displacement (D), the coefficients of laminar (Cs) and turbulent (Cst) leaks, the coefficients of viscous (Cv) and coulombian (Cf) friction, the pulsating flow (Qs) and the impedance of the pump (Zs). In effect, the source impedance in an external gear pump influences the flow ripple, and depends, amongst other parameters, on the bulk modulus and volume (Nakagawa et al. [8]). Zhao and Vacca [9] proposed an inspired and novel model approach for the analysis of the ripple source of a gear pump based on decomposition into a kinematic component and a pressurization component. Their results, based on a detailed lumped-parameter simulation model, show its validity. More recently, Corvaglia et al. [10] presented a new three-dimensional model of an algorithm for the measurement of the pulsating flow of an external gear pump in hydraulic pipes. As a result of the experimental evaluation, the authors proposed a novel flow meter, which was reliable in the assessment of the pulsating flow under various working conditions.
The second point of view from which a hydrostatic unit can be studied is based on their internal geometry and manufacturing tolerances. Several researchers have contributed significantly in the fields of lubrication and performance, working with complex simulations using CFD (Computer Fluid Dynamics), such as Zardin [11] et al., Thiagarajan and Vacca [12], Fronsina et al. [13], and Borgui and Zardin [14]. Regarding the prediction of the cavitation and complete filling in external gear pumps, Mithun et al. [15] concentrated their work on the effect of non-condensable gas in cavitation. Corvaglia et al. [16] presented a completed 3D-CFD simulation validated with experimental work to test the capability of the model to evaluate the minimum inlet pressure for complete filling, overcoming the limitation of the fixed positions of the gear axes and of the floating bearing bushing. In the field of noise emission, and specifically in external gear pumps, Marinaro et al. [17] used a three-dimensional CFD model to predict the flow ripple generation, propounding an innovative solution to minimize noise emission called Alternative Capacitive Volumes (ACV).
Lumped-parameter models are extensively used, and bond graph formalism is effective given its ability to graphically represent multi-physical dynamic systems, as shown by Mkadara et al. [18] in their work on the failure simulation of a pressure-compensated axial piston pump that supplies the flight control actuators in a helicopter. The authors of this article, Torrent et al. [19], created the first conceptual model using a bond graph diagram of an external gear pump (manufactured by Roquet Group, with a derived capacity of 14.6 cm3), in which the volumetric and hydro-mechanical losses are characterized by several parameters (loss coefficients). This parameterization was carried out using the results of the ISO 4409 test [20], and later an experimental in-field study was performed to verify the goodness of the model in a real working cycle. The pump was installed in a drilling machine, studying its behavior in the driving of auxiliary movements and comparing the measured flow with the simulated one. This correlation was reasonably accurate, and therefore it could be concluded that laboratory tests under stable conditions could be used to model the pump and simulate its operation under quasi-steady conditions. The limitations of this model for the simulation of unsteady movements were mainly attributable to two causes. The first was that the model did not take into account the response time of the internal lubrication of the unit. A variation in the working pressure leads to an instantaneous variation in the loss coefficients, while the experimental data show a delay in the response. The second was the non-appearance in the simulation of measured flow peaks when the pressure suddenly decreased.
In order to improve this previous model, a specific study of these phenomena needs to analyze the pressure compensation system that defines the lubricating gap at the lateral side of the gears (indicated in Figure 1a), and the best way to do that is to create a bond graph model of the floating bushing that can be integrated into the general model of the pump. In this way, the behavior of the lateral gap of the gears can be related to loss coefficients.
Few references can be cited on the use of a bond graph as a modeling technique in the study of lubrication in positive displacement machines. Rundo [21], in his large review of different models of gear pump flow, only cited the work of Gámez et al. [22] as examples of the use of bond graph diagrams, although in this case it was an internal gear pump with a trochoid profile. Bryant [23] developed a lumped parameter model for hydrodynamically lubricated bearings using bond graph diagrams. The examples in this work applied these techniques to generic thrust and journal bearings, without treating the gear–bushing interface as a complex geometry, as we did in this research.
In order to consider the hydrodynamic forces involved in the balance of the floating bushing, the analytical solutions of a fixed-incline slide bearing and parallel-surface squeeze film bearing were taken into account in the model. Given the substantial difference from the studied interface, the expressions were adjusted and validated by comparing the results of the experimental tests in the laboratory with the numerical simulation results. In this way, the final model was made ready to simulate simultaneously the flow rate, torque and gear–floating bushing interface gap under any operating conditions (system impedance, rotation speed, type of oil and temperature). The model presented in this article includes the simulation of the normal motion of the bushing, not including the tilting movement. In addition to the balance of forces studied in this research, this tilt also depends on the adjustment of the bushing in the housing of the pump, and on the behavior of the hydrodynamic journal bearings of the shaft.
Regarding the thickness measurement of the gear–bushing interface, the pioneering work by Hooke and Koç [24] used a capacitive transducer installed in a tooth to measure the clearance between the gear and the lateral plate. In the Fluid Mechanics Laboratory-UPC, laser transducers are used to measure hydrodynamic film clearances, inserting small rods in the shaft and the bearing bushing. This method, developed by Gutés [25] and Castilla et al. [26] for the measurement of journal bearing clearances, was adapted for lateral gap measurement.
In summary, the purpose of this work is to expand the simulation tool created by Torrent et al. [19] from the experimental parameterization of the pump to a method that integrates the floating bearing bushing motion. The originality of this integration is the adaptation of the analytical solutions of certain cases of hydrodynamic lubrication by means of experimental measurements of the gear–bushing gap, and the main advantages of the developed method are its simplicity and its expandability. This bond graph model allows us to predict the performance of the pump quickly and precisely, without a very powerful calculation computer, and, very importantly, during long work cycles. This characteristic is very useful for the simulation of the behavior of the pump when it is integrated in a complex machine. The movement of the floating bearing bushing was integrated into the pump model, and other internal phenomena can be treated in the same way, as will be described throughout this paper. Finally, the methodology used is applicable to any type of positive volumetric displacement machine. All that is required is to make the “black box” transparent.
2. Balancing Forces on the Floating Bushing
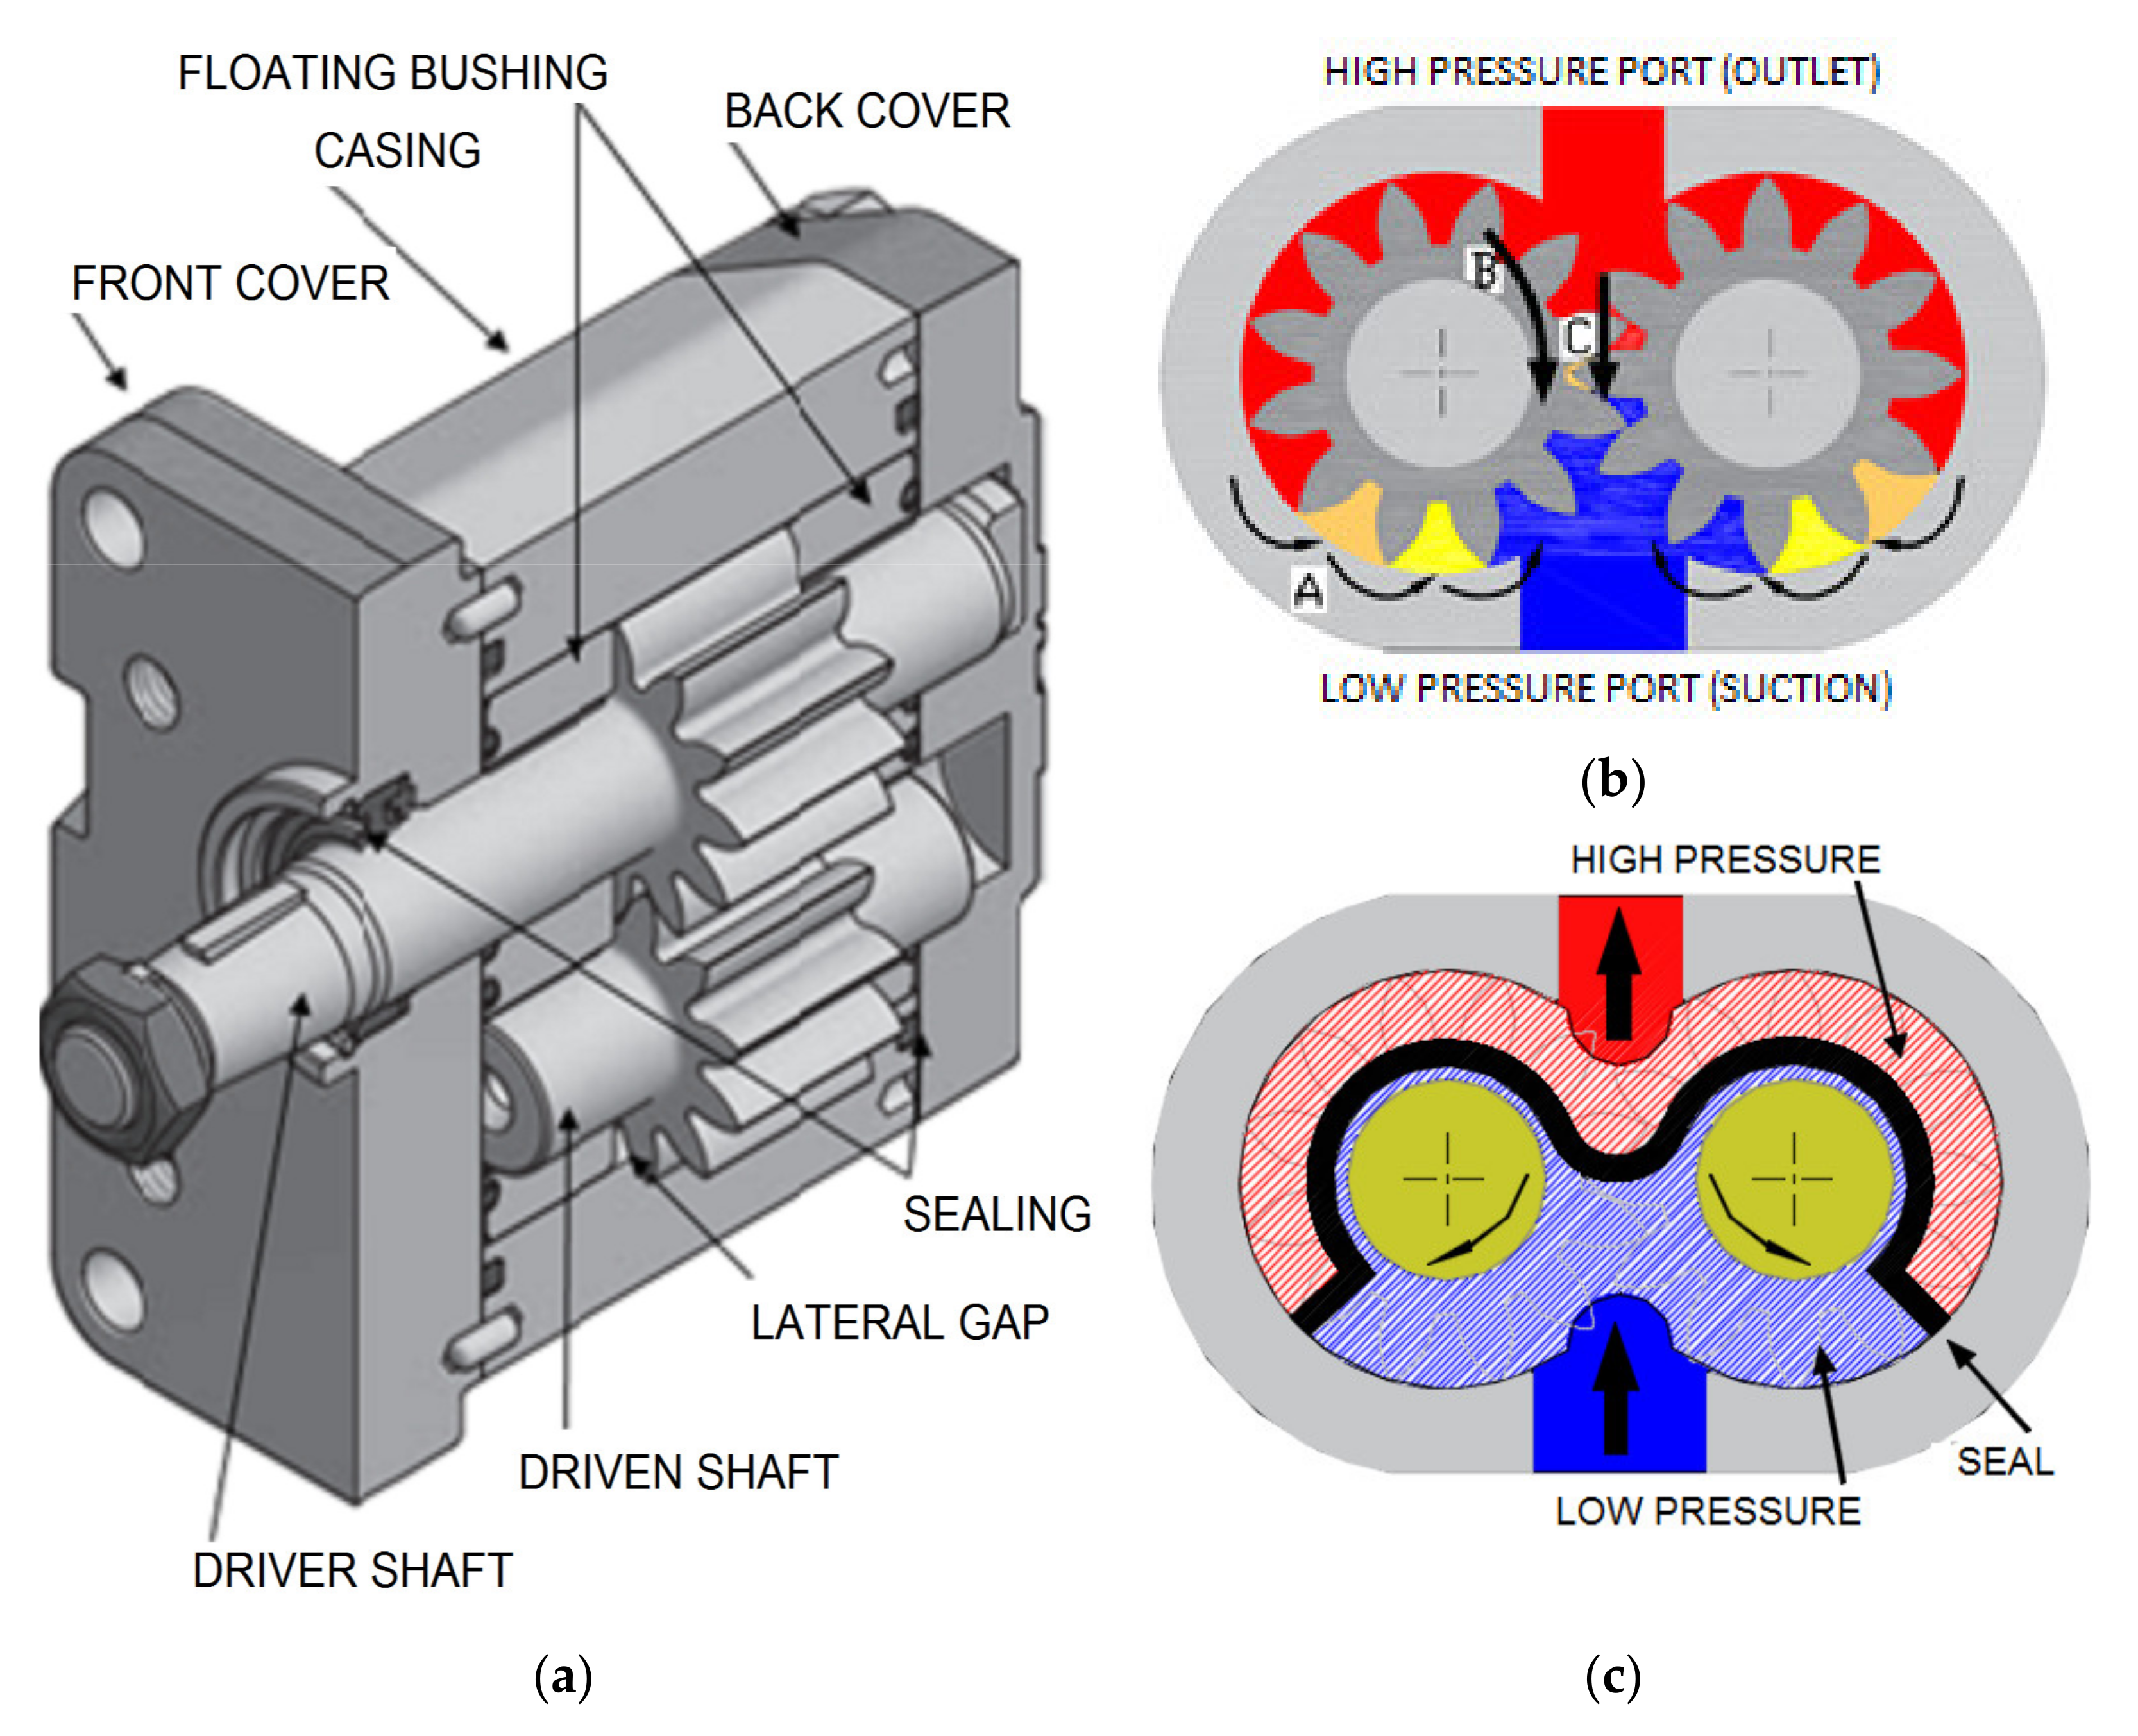
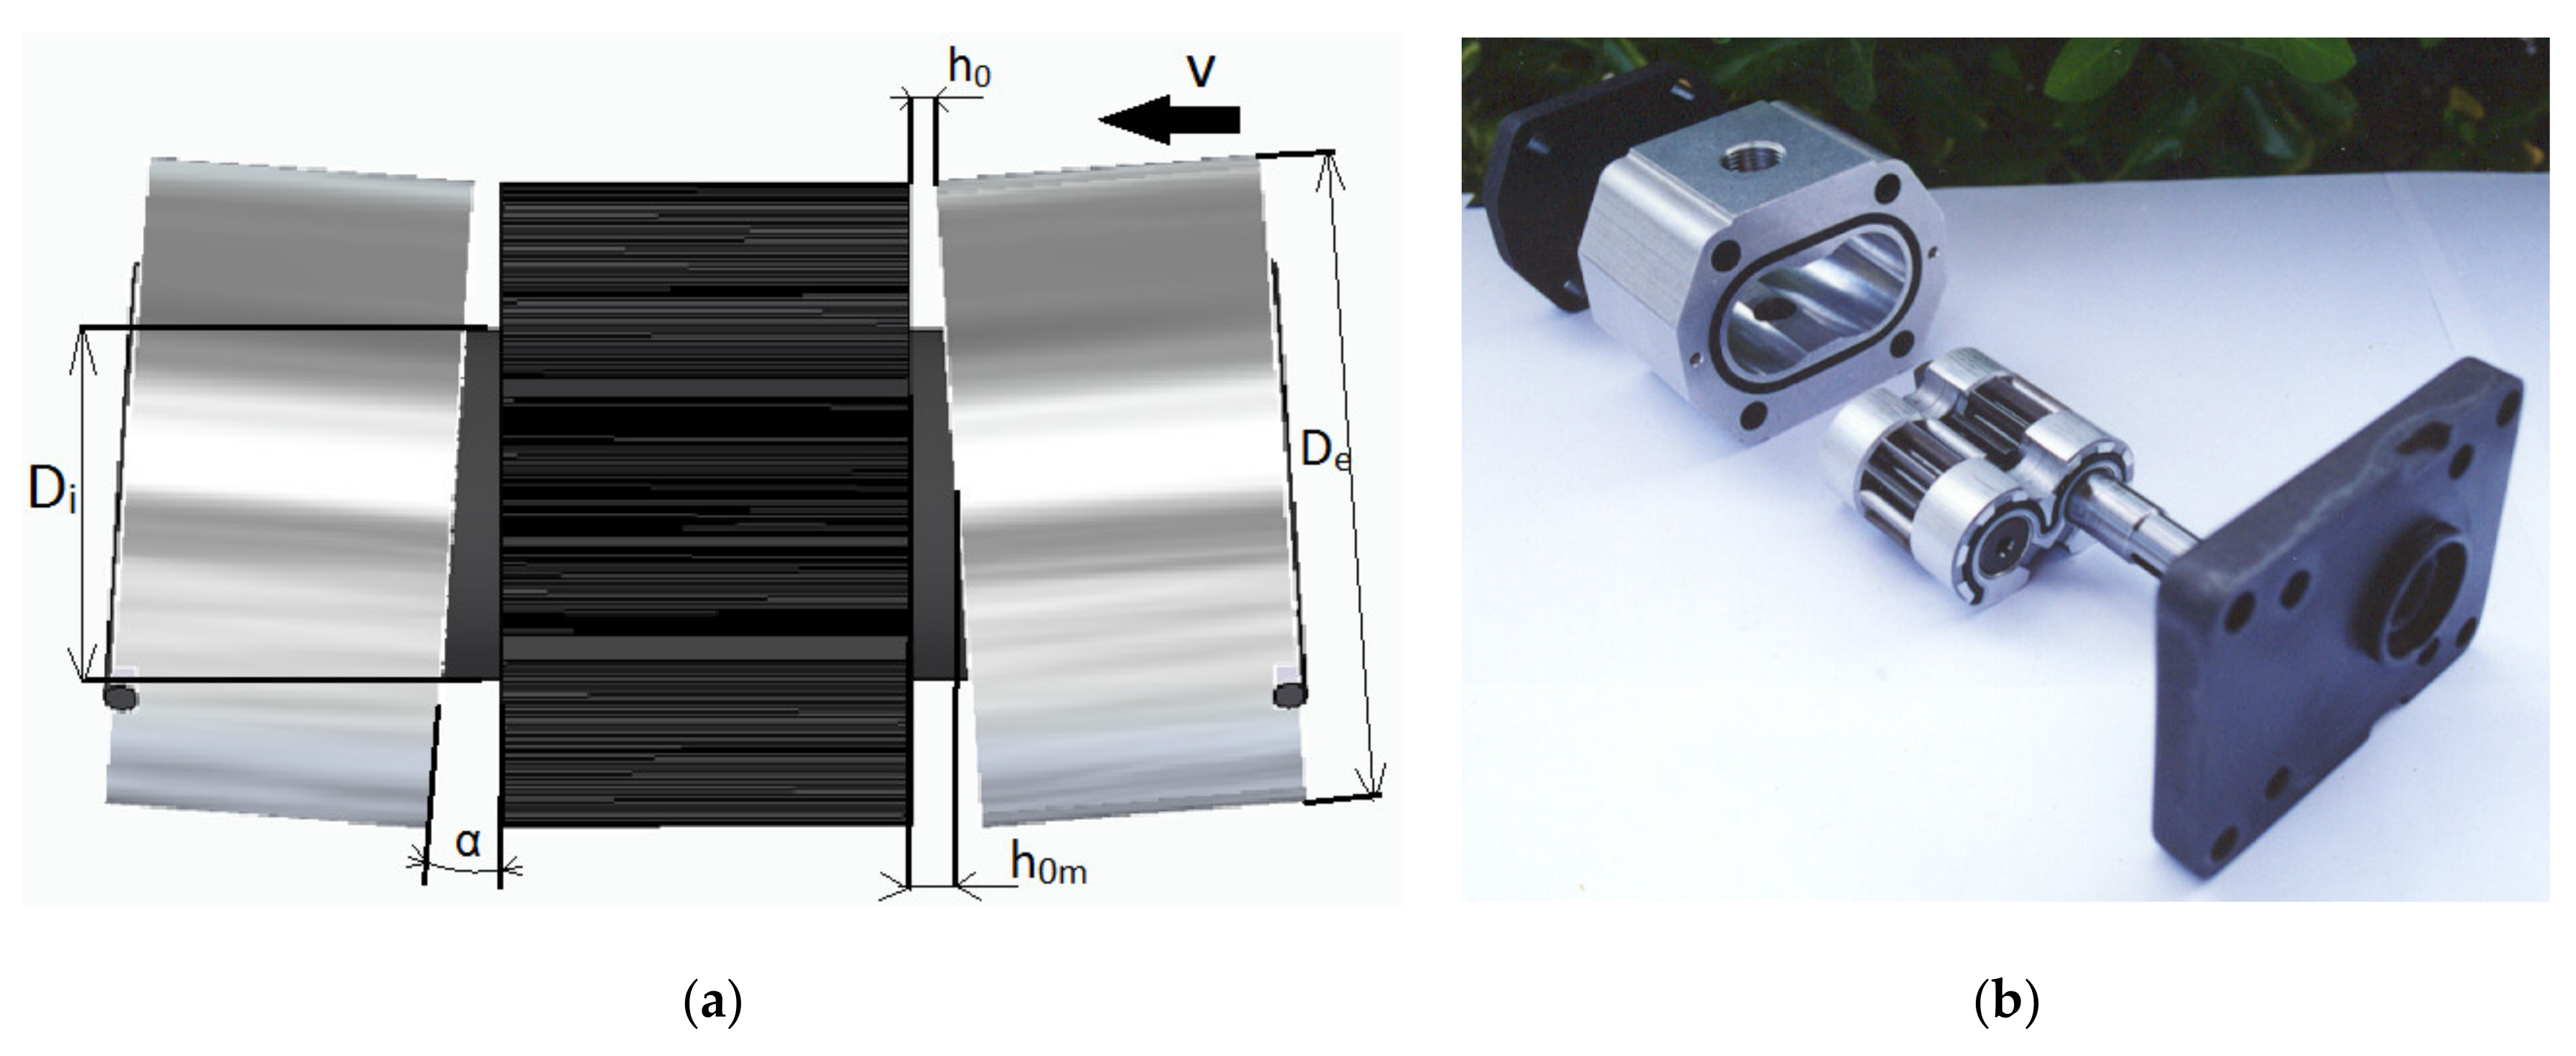
A high-pressure gear pump includes a pressure compensation system that operates by means of axial balancing elements (lateral plates), which are used to reduce the lubrication gap at the lateral side of the gear. This system was proven to be an effective way to achieve high efficiency, and when it integrates the journal bearing supporting the gears, this is referred to as a floating bushing. An exploded view of this design can be seen in Figure 1a. This compensation mechanism implies that the back side of the floating bushing is subject to the action of the outlet pressure, which equilibrates the force of the oil pressure in the side of the bushing against the gear, and this moves the floating elements, thereby increasing the lateral gap between them.
Figure 1b shows that the oil can leak from the pressure zone to the suction port via three paths: between the tip of the teeth and the housing (A), between the floating bushing and the gear (B), and in the meshing zone (C). On the other hand, it is desirable to have a low fluid film thickness in the lateral gaps between the gears and bushings so as to preclude the main leakage path from the high-pressure to the low-pressure port, but on the other hand, the film thicknesses in these interfaces need to be sufficiently high to prevent the wear and deterioration of the thrust faces on the bearings. The gear-side surface of the bushing has very low roughness, while on the back side an O-ring with an anti-extrusion element separates the high- from the low-pressure zone, as can be seen in Figure 1c.
The oil that drains from the high-pressure to the low-pressure port maintains a flow between the lateral face of the gear and the floating bushing, through the journal bearings, forming a hydrodynamic film. An increase in working pressure separates the plate from the gear when it impacts the gear–bushing interface, but at the same time, the lubricating gap decreases when acting on the pressure zone of the back side of the bushing. This axial compensation mechanism can be seen in Figure 2, and it allows for low variation in the volumetric efficiency, increasing the working pressure.
The solution of the Reynolds equations [27] in this interface should illustrate the lubricating gap and inclination between both surfaces, but it is highly complicated to integrate this into a bond graph diagram, as intended in this research, because it is a method for the modeling of concentrated parameter systems. In addition, small gaps at high pressures can be of the order of magnitude of some microns, and relate to the elastic deformation of the plate, its roughness, and changes in density and viscosity. Hence, an ideal model also has to take into account the mixed lubrication effects. For instance, Thiagarajan and Vacca [12] showed the relevance of the effects of different bearing surface roughness features on the behavior of the lubricating gap film. In this context, Battarra and Mucchi [28] presented an extended experimental campaign of 280 tests, based on 14 different working conditions, indicating that the real clearance values at the end of the production process need to be included in any model of high-fidelity gear pump performance estimation.
Accordingly, a reliable integral resolution requires powerful CFD simulations, such as those integrated in HYGEsim (hydraulic gear machines simulator, Rituraj et al. [29] and Vacca and Guidetti [30]), a remarkable piece of software developed at PURDUE University. As a result of several investigations, most of the phenomena that take place inside a gear pump are taken into account, as it is necessary to determine precisely the internal geometry and manufacturing tolerances of the unit. However, this is not the best way to create a simple, fast and efficient model to study the dynamics of the plate and the pump performance in a real work cycle.
Therefore, an original approach to the phenomenon is presented here, which is easily expandable and does not require sophisticated numerical techniques. Figure 2 shows the following static forces acting on the plate, decreasing the lubricating gap on the back side of the bushing, the working pressure in the high-pressure zone S1, and the force due to O-ring compression during the pump assembly (Fj). When increasing the lubricating gap, high pressure is applied in the space between the teeth in zones S2, S3 and S4. It is very important that the chamfer acts on the perimeter of the bushing, such that the pressure gradient of the pump can occur in the initial section of the oil as it travels from the suction to the pressure port, in order to minimize the radial forces on the journal bearings. On the other hand, the bushing has inertia (I) in the same way that the oil film between the bushing and gear has compressibility (C), which was not taken into account in the developed model due to the small volume trapped in this area. Finally, the motion is subjected to friction between the bushing and the pump housing, as determined by the clearance between both components (R). In this context, the research by Thiagarajan et al. [31] on the frictional force in the bushing–housing interface is remarkably informative. One of the main conclusions of this work is that the presence of these forces produces hysteresis in the axial balance system, such that the lubricating gaps developed within the pump at certain operating conditions depend on the previous operating state. This force is related to the outlet pressure acting on the top side of the bushing, as well as the pressure that develops within the journal bearings, which supports the gear shafts. The effect of frictional forces on the axial balance mechanism of a pressure-compensated external gear pump was also introduced in this research, which helps to explain the hysteresis of bushing dynamics, and therefore the pump’s performance.
The hydrodynamic forces that help to achieve balance—one generated by a hydrodynamic wedge via the relative movement of a flat surface with respect to another tilted one (Fhd), and another generated by the normal relative movement between two flat surfaces (Fth)—were considered. The equilibrium of this set of forces defines the velocity of the plate approaching the gear (v) and the rotational speed of the tilting (ω), and consequently, the minimum gap between the plate and gear (h0) and the angle between both surfaces (α) can be determined. In this article, the bond graph only considers the dynamics of the gear–bushing interface, and this can be expanded in the future with a journal bearing system.
2.1. Static Forces
2.1.1. Hydrostatic Force (Fp)
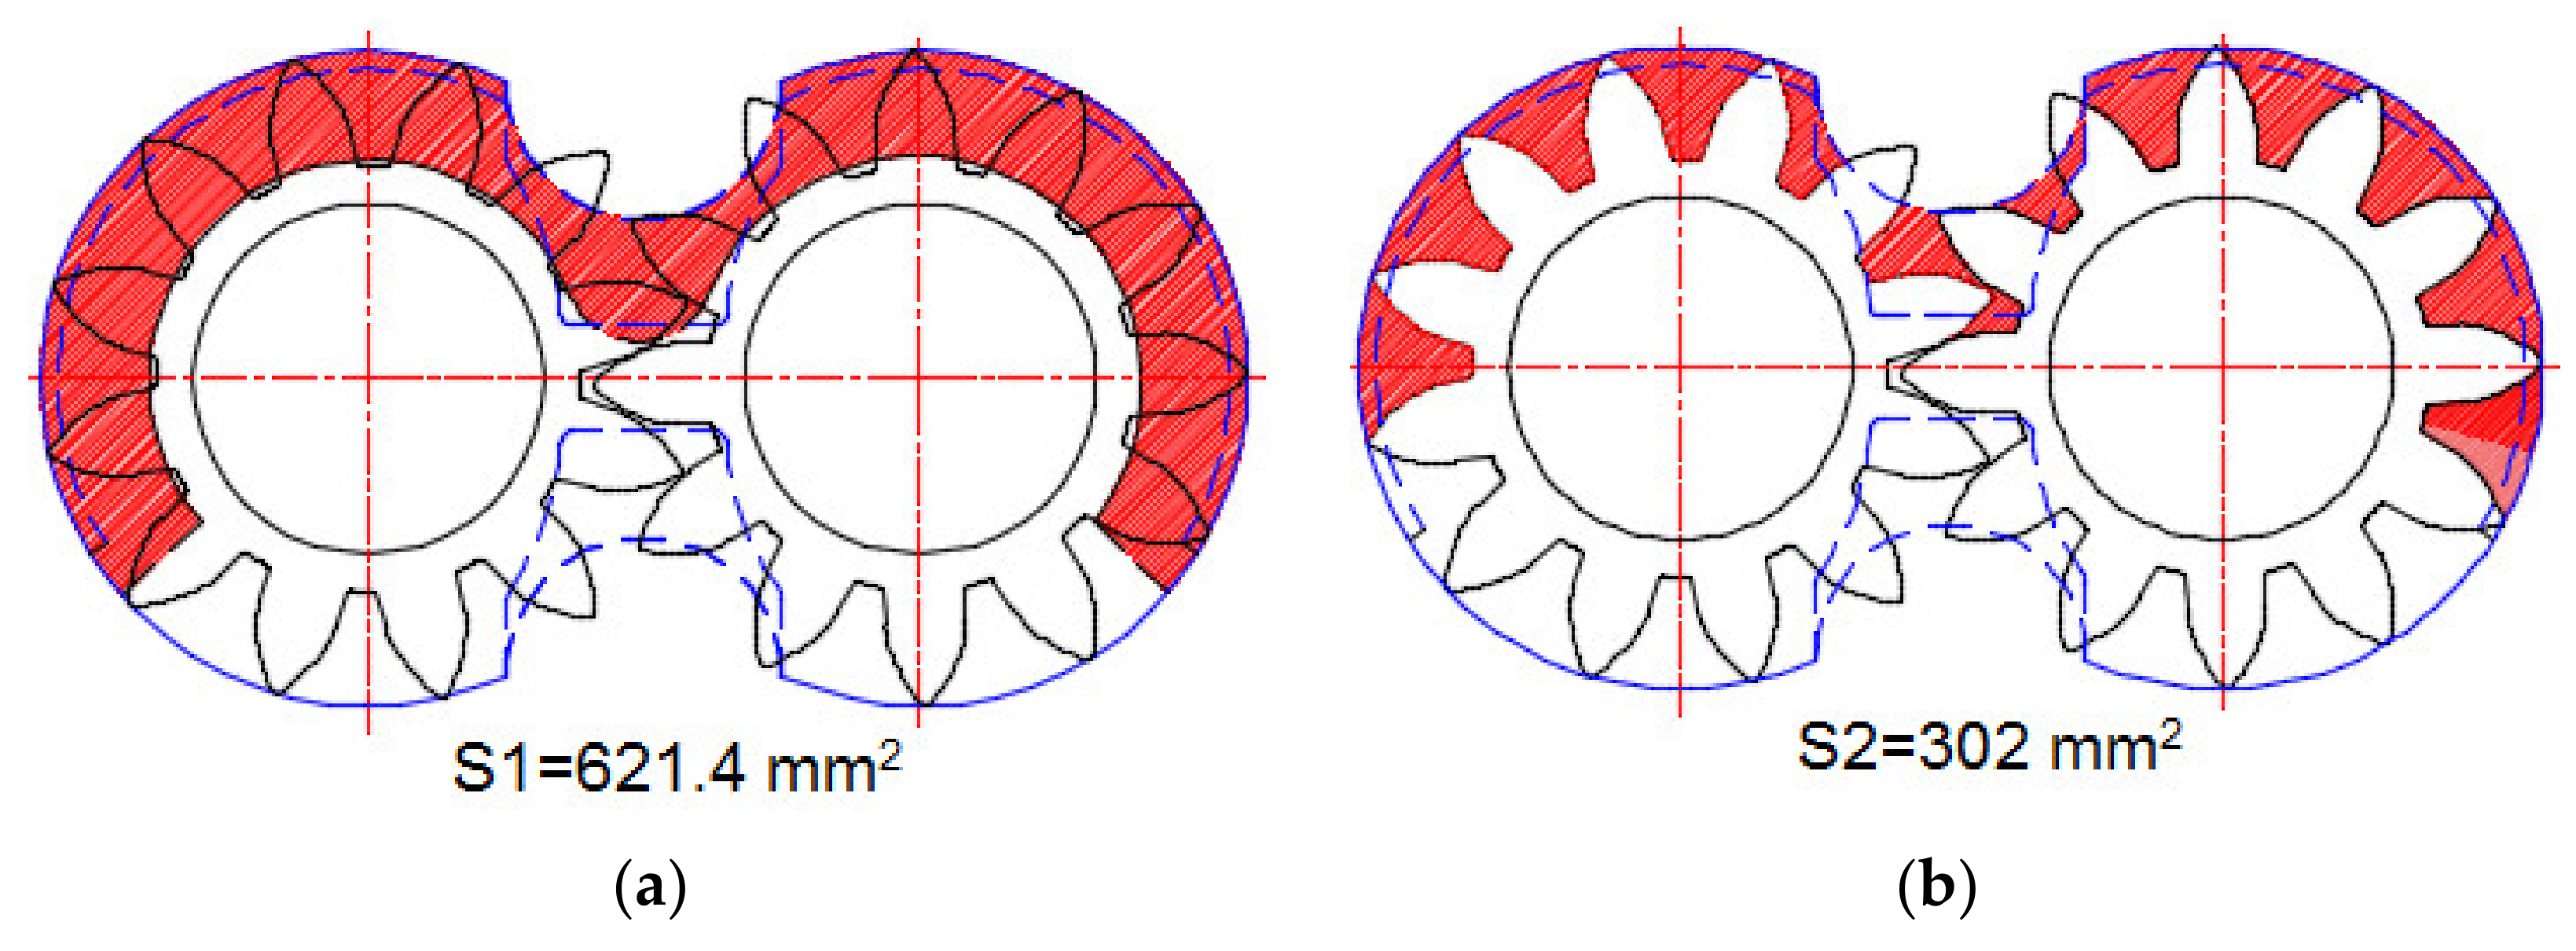
In order to calculate the force with which the working pressure is pressing the floating bushing against the gears, the effective area (Ae) has to be defined. The following areas marked in red are considered:
- The pressured area in the back side of the bushing, delimited by the O-ring that defines the area under the high-pressure S1, is illustrated in Figure 3a. The result of its graphical calculation is 621.4 mm2.
- The pressured area between teeth S2, illustrated in Figure 3b. The result of its graphical calculation is 302 mm2.
- The area between the teeth subjected to the pressure gradient between the suction and outlet port S3, as illustrated in Figure 3c. The mean pressure acting in this area was considered to be half the working pressure. The result of its graphical calculation is 117.5 mm2.
- The lateral area of the gear against the bushing subjected to the pressure gradient between the suction and outlet port S4, as illustrated in Figure 3d. The mean hydrostatic pressure in this area is difficult to evaluate. In any case, simulations carried out by Gutes [18] suggest that this area is approximately 1/4 of the working pressure. The result of its graphical calculation is 810.8 mm2.
Therefore, considering the forces that cause the surfaces to approach as positive and those that produce a separation as negative, the resultant forces on the bushing due to the working pressure and the effective area are
2.1.2. O-Ring Force (Fj)
This force was considered to be a constant because the bushing movement is much smaller than the O-ring compression during the assembly of the pump. This is a 2.62 mm-diameter O-ring with a length of 109.4 mm. Considering a hardness of 72 Shore A and a compression during assembly of 18 N/cm, this force has a value of 196 N.
2.1.3. Inertia (I)
Both the mass and moment of inertia of the bushing were calculated from a 3D design. Taking into account a density of aluminum of 2600 kg/m3, the mass is 0.076 kg.
2.1.4. Resistance (R)
In order to calculate the viscous friction force on the bushing due to the motion inside the housing, a measured average tolerance of 0.015 mm was inferred. The adjacent perimeter has a value of 150.14 mm, which, when multiplied by the bushing width of 20 mm, gives us a peripheral friction surface of 3002.8 mm2. Consequently,
where
It is noticeable that the phenomenon was greatly simplified. An increase in working pressure pushes the bushing against the suction port, such that the tolerance of the housing is not uniform. The oil film can be broken in this zone, causing this friction force to suddenly increase, which has a great influence on the movement, consequently affecting the lubrication in the gear–bushing interface. This will always fall into one of the three categories of lubrication: full film, boundary or mixed; taking into account both dynamics in the same model is also a goal in future extensions of the model.
2.2. Hydrodynamic Forces
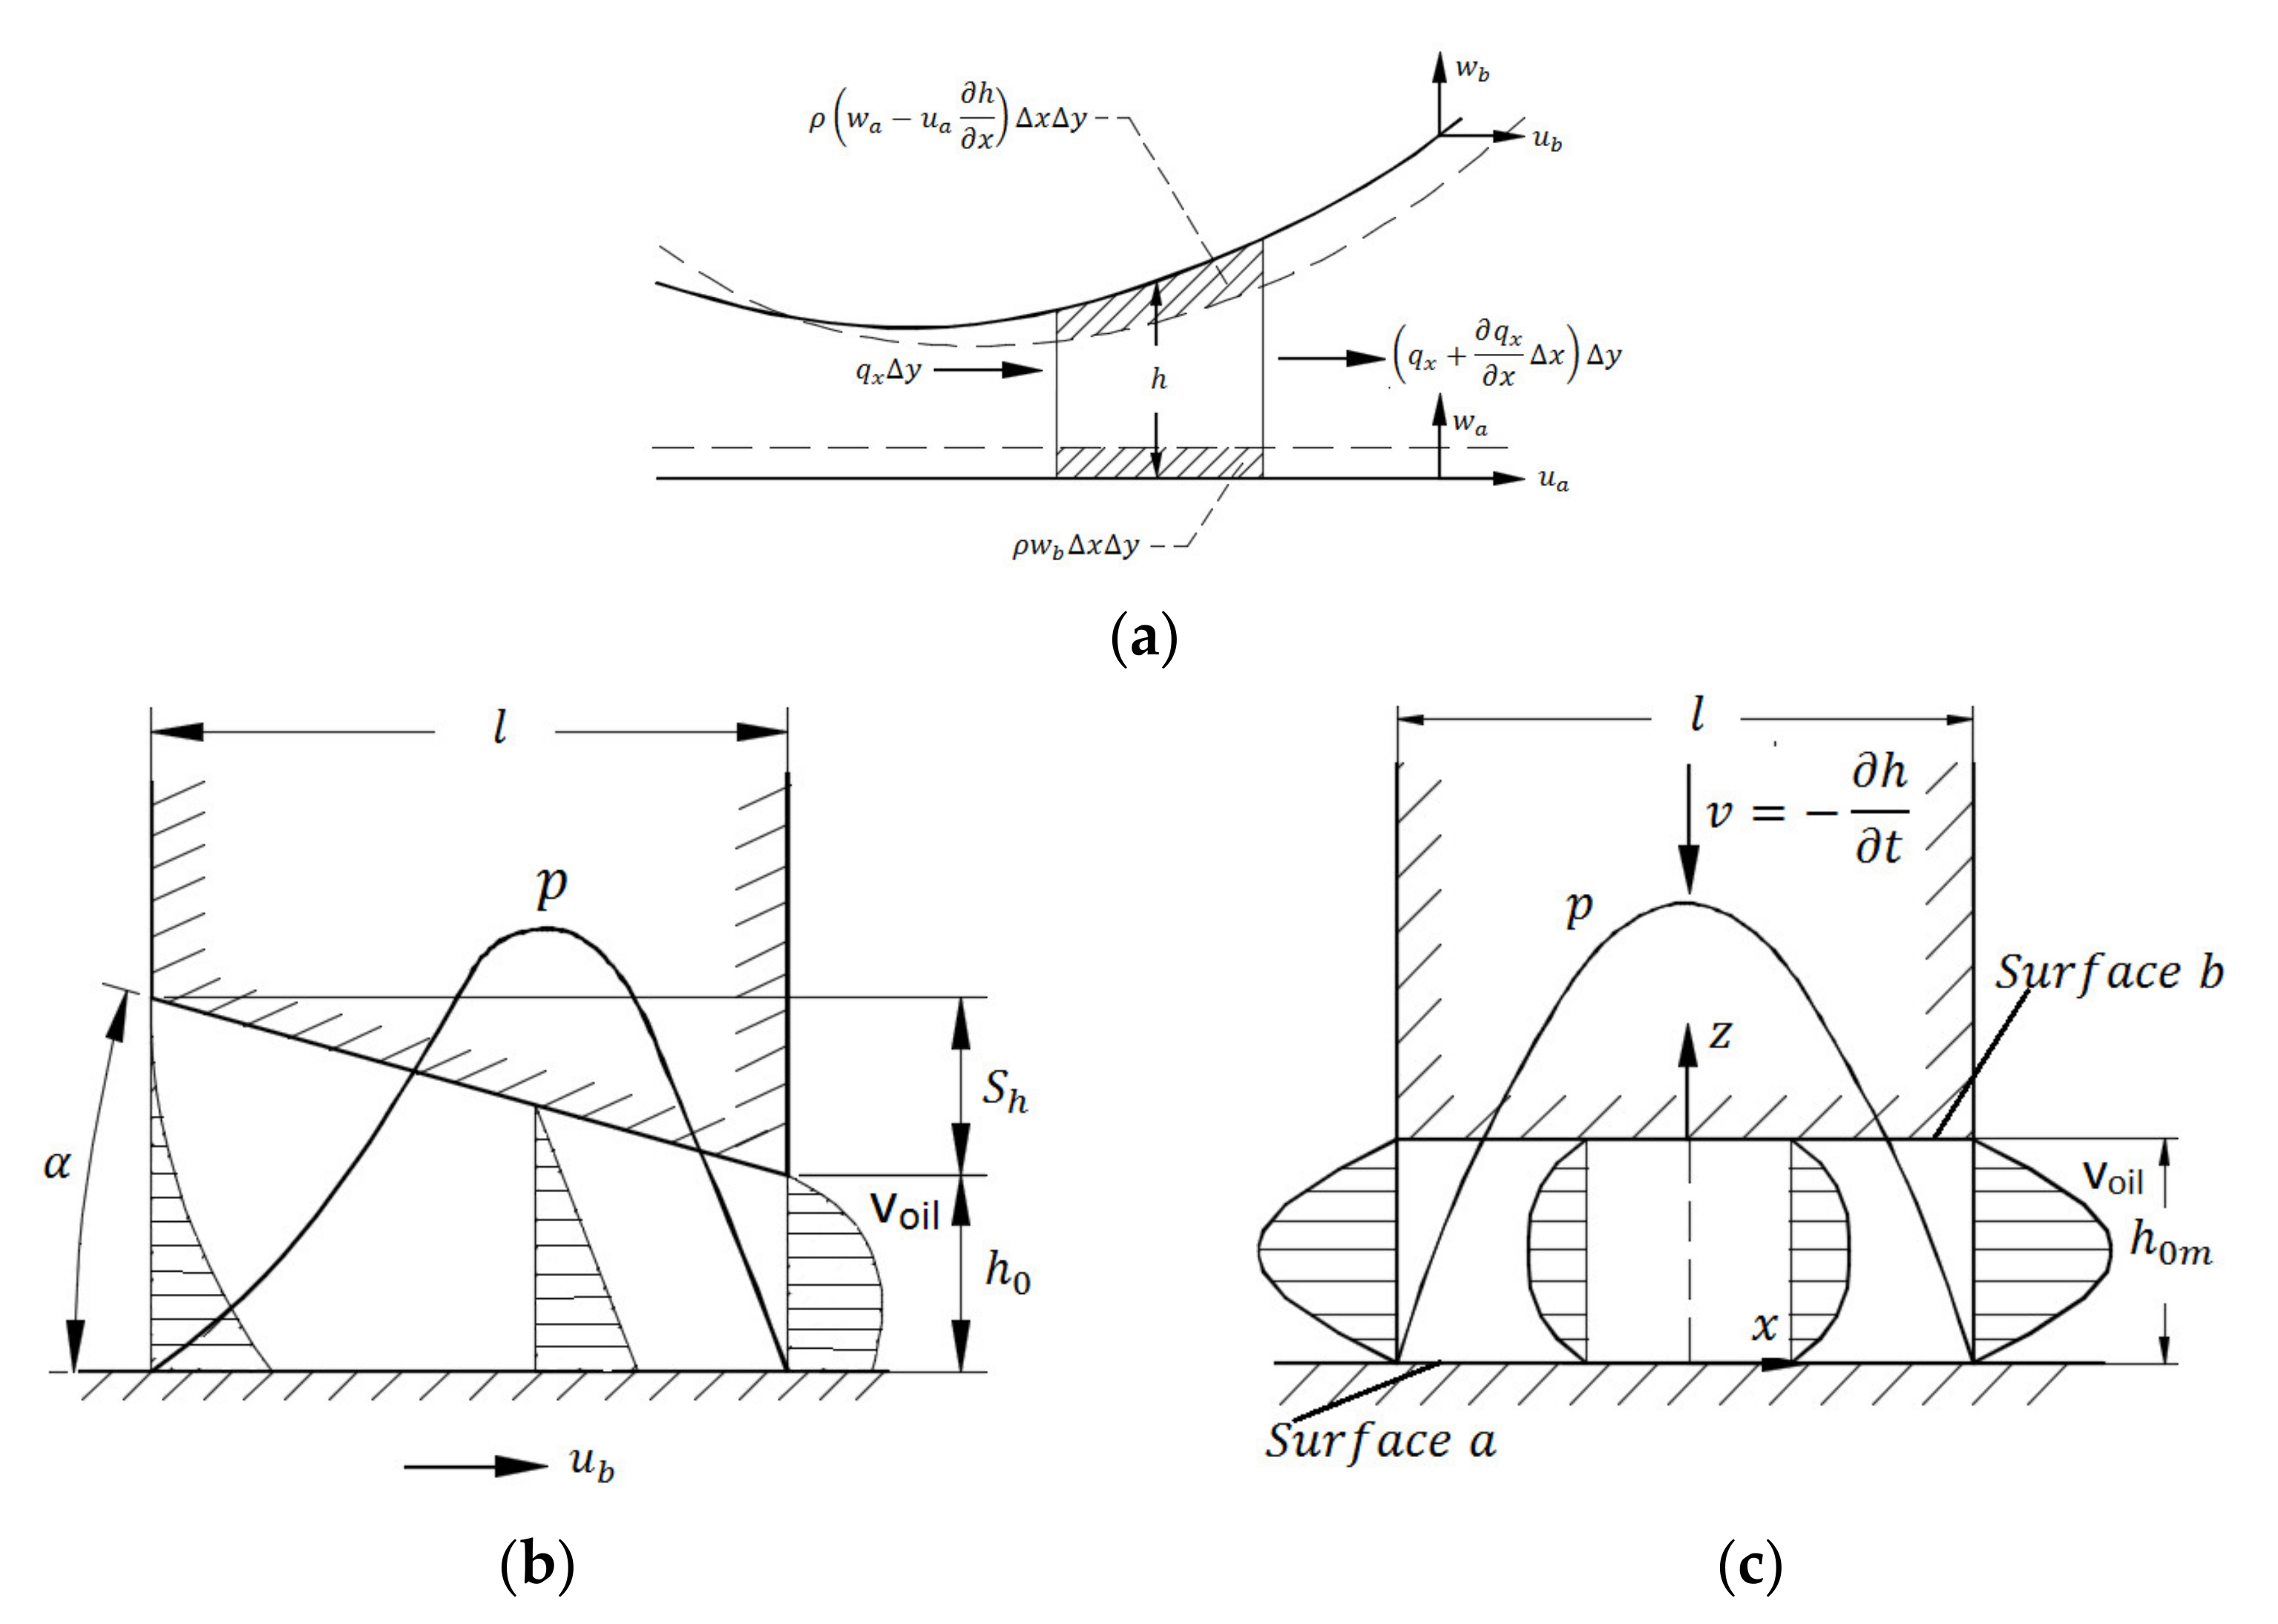
The hydrodynamic mechanisms of pressure generation inside an oil film affect the motion of the floating bushing, and consequently, load-carrying capacity generation. These mechanisms are widely studied in cases where there are no deformations of the lubricated surfaces, as is the case in this investigation, using the Reynolds equations. Figure 4a shows the two-dimensional movement of a tilted surface with respect to a plane. In a 2D analysis, neglecting the flow perpendicular to the plane of the paper and accepting zero leaks, the Reynolds equation is expressed according to Equation (6).
A good explanation of these mechanisms can be found in Hamrock [32]. Basically, the pressure increments inside the film are necessary to maintain the continuity of the flow. In this article, an analogy between the flat and inclined surfaces of Figure 4a and the lateral gear side and bushing surfaces, respectively, was considered. In this case, the speed of the tilted surface is zero. Besides this, the terms of the density wedge and local expansion in Equation (5) were not taken into account, as the density is considered constant. Nevertheless, the temperature variation inside the film is taken into account for the calculation of the viscosity. When considering rigid solids, there are no changes in the relative velocity of one surface with respect to the other, and therefore the stretch term is not considered either. Hence, the analogy indicates that the dominant lubrication mechanism in the gear–bushing interface is related to the motion of a flat face with respect to an inclined one (physical wedge), and to the normal motion of both faces (the normal squeeze term). Both cases have analytical solutions denominated by fixed-incline slider bearings (Figure 4b) and parallel-surface squeeze film bearings (Figure 4c), which will be integrated into the developed model.

2.2.1. Load-Carrying Capacity as a Fixed-Incline Slide Bearing
An analytical solution is available for a hydrodynamic sliding bearing between two non-parallel flat surfaces separated by a lubricant film. A pressure profile is created between both surfaces that keeps them separated and supports a normal load, such as the force exerted by the working pressure on the effective area Ae. Considering only this physical wedge in the Reynolds equation (Equation (5)), we obtain
where hm is the film thickness at the point where . The film thickness can be written as
In order to compare the results with other experimental correlations, the following dimensionless terms are defined:
and Equation (6) becomes
where
The integration of Equation (10)—taking as boundary conditions P = 0 when X = 0 and H = H0 + 1, and P = 0 when X = 1 and H = H0—gives us the distribution of pressures inside the film:
The normal force per unit width for insertion into the model is determined by
which, written in dimensionless form, becomes
Taking into account that dH/dX = −1, this becomes
The integration of this expression gives us the dimensionless normal force that will be introduced in the model:
The analytical solution also allows for the calculation of the central pressures of the hydrodynamic force that is generated, which could be used to model the tilting motion of the floating bushing. The center of the pressures is defined by
This expression can be made dimensionless by dividing it by the length of the bearing:
and by including Equation (15) in this equation and integrating, we derive
Another phenomenon that can be included in the modeling is the increase in the temperature of the oil as it slides through the lubricating film due to viscous friction. Assuming that all of the dissipated power is absorbed by the fluid under adiabatic conditions, Hamrock [32] deduces the dimensionless temperature increase as
Therefore, the model considers an increase in temperature in the oil film by means of the following expression, which is used to calculate the oil viscosity:
2.2.2. Load-Carrying Capacity as a Parallel-Surface Squeeze Film Bearing
The other hydrodynamic force that was considered is the load-carrying capacity relates to the pressure generated when the oil slides between approaching parallel faces. Although this disappears in the equilibrium state, it can have significant effects on the dynamics of the bushing, mainly in terms of the time of response to sudden changes in the working pressure of the pump. Due to the low inclination of the bushing with respect to the gear, the analogy is made with a parallel-surface squeeze film bearing. Taking into account Figure 4c, but not the lateral leakage, the following expression with an analytical solution of the Reynolds equation can be obtained:
By integrating, the pressure distribution in the film is obtained:
The load-carrying capacity for the model will be
3. Experimental Procedure
The experimental tests carried out had two goals. The first goal was to use laboratory tests to determine the displacement and tilt of the bushing, and thus validate the model; the second goal was to use field tests to obtain data for the simultaneous simulation of the behavior of the leakage coefficients and the floating bushing motion.
3.1. Laboratory Test Bench
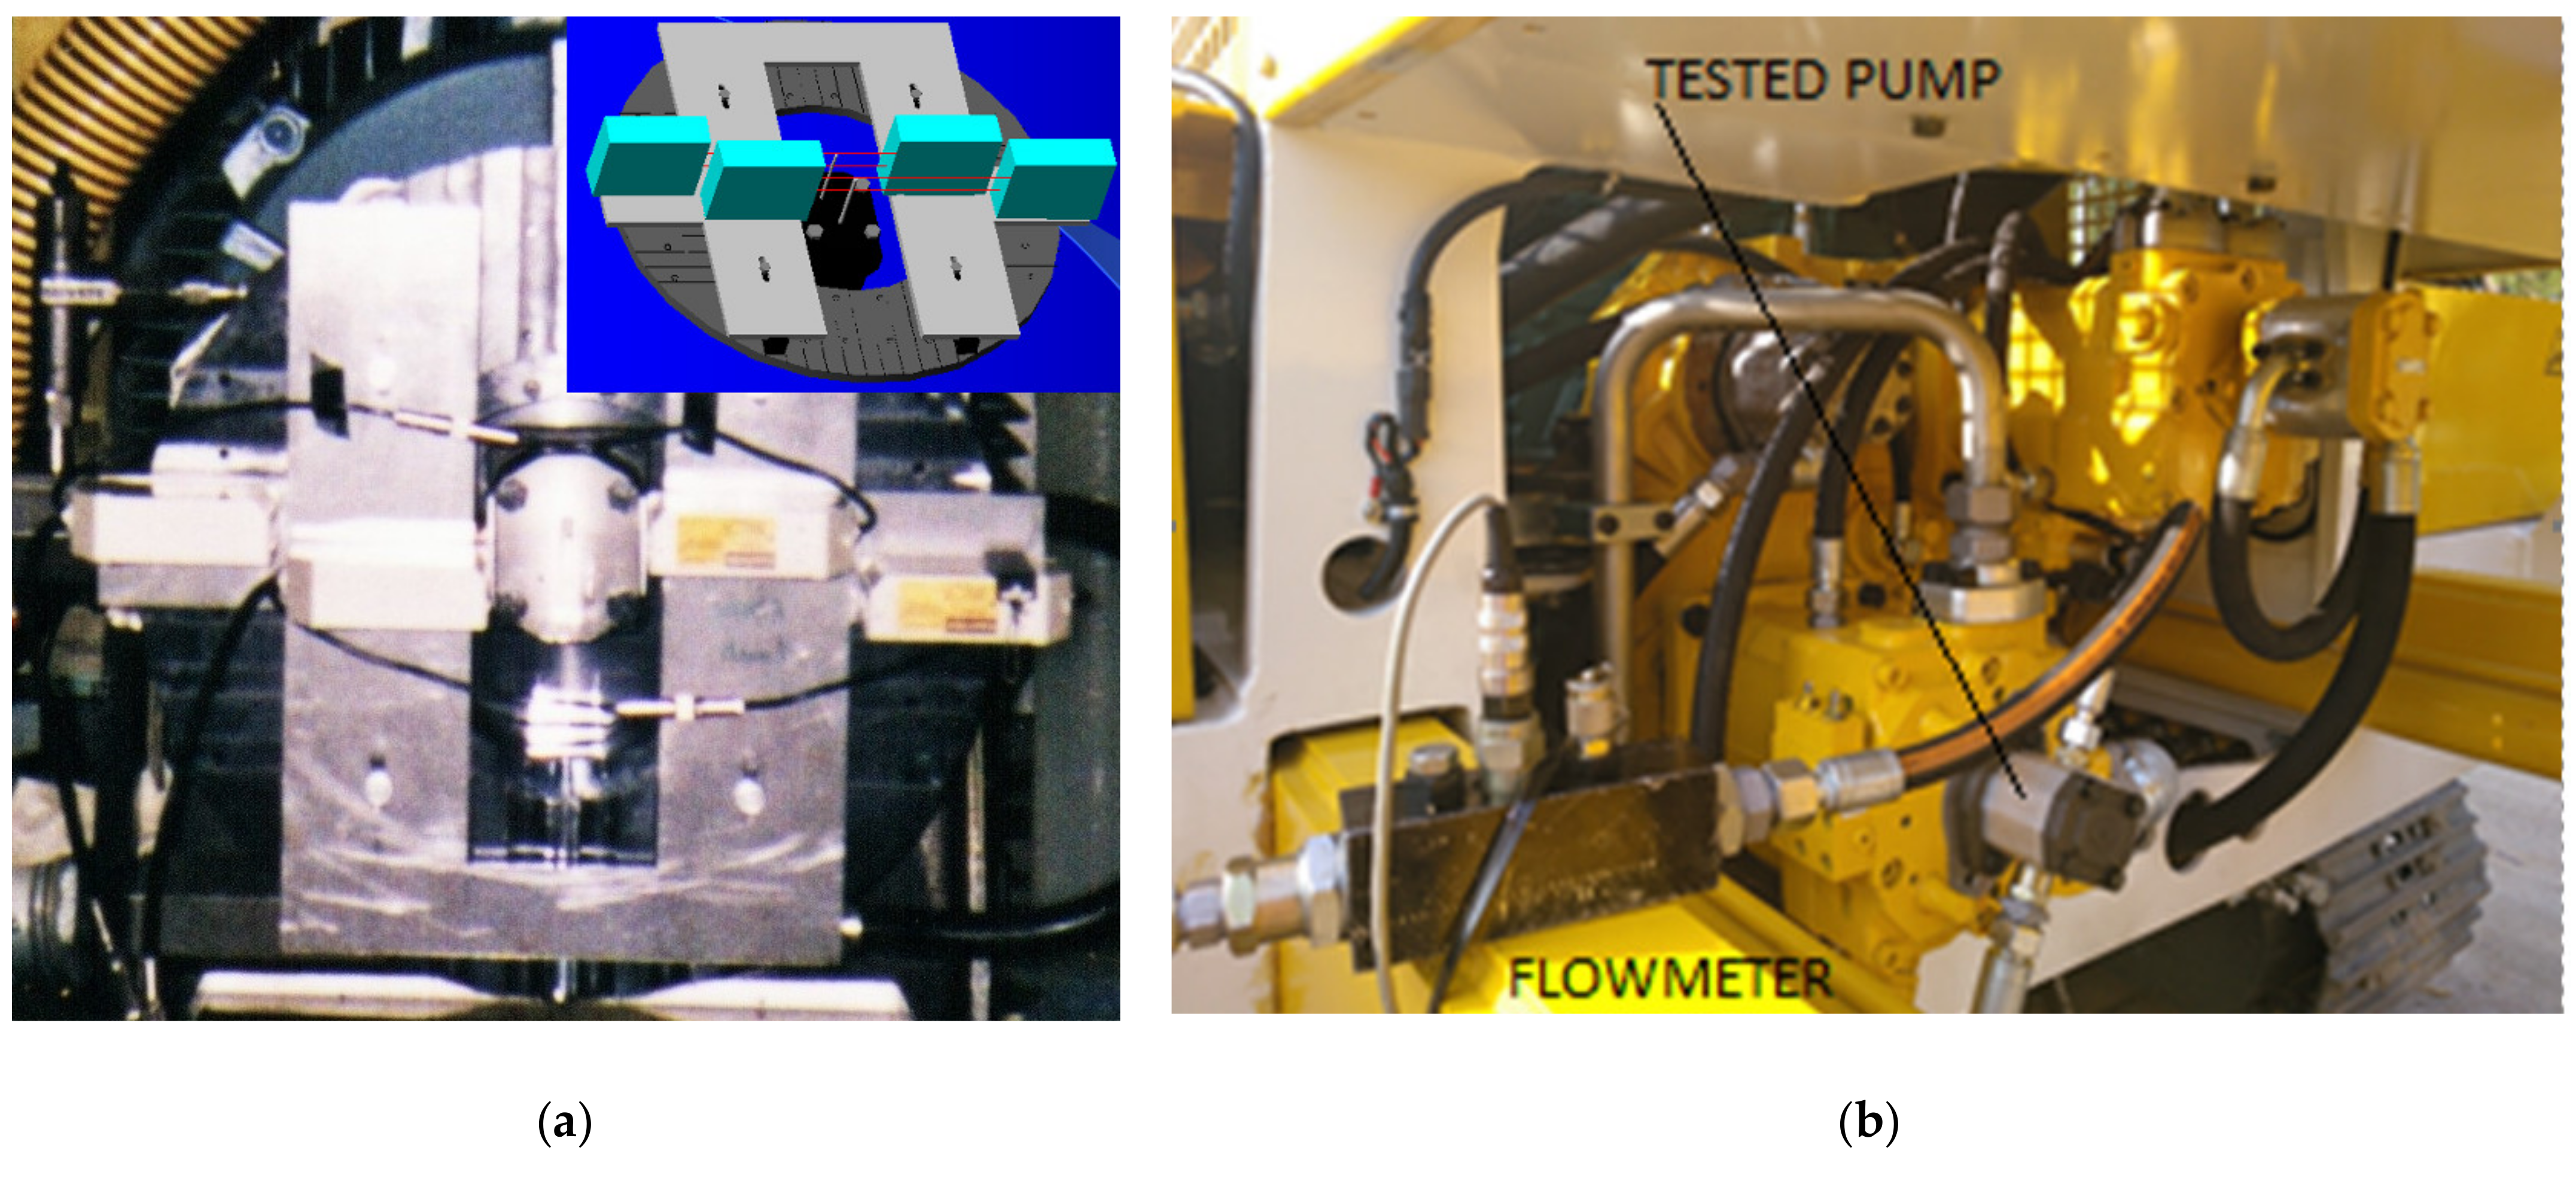
The measurement of the motion of the floating bushing was carried out on a bench prepared for the ISO 4409 test, which has previously been used to determine the steady-state characteristics of the pump: the variation in the loss coefficients as a function of the pressure and rotational speed of the pump. The experiments were conducted by successively varying the outlet pressure in normalized steps at a constant operating rotational speed by tracing a sequential path: first, starting at the lowest outlet pressure and increasing to the highest pressure, and then following the experimental path from the highest to the lowest outlet pressure. The operating conditions were from 500 to 2000 rpm, in steps of 250 rpm. Once the speed of rotation was established, the pressure was increased from 0 to 150 bar, in steps of 10 bar. Once the maximum test pressure was reached, the same acquisition was carried out by decreasing the pressure in order to analyze the hysteresis within the bushing motion. The tests were carried out at 20 °C and 50 °C, and Figure 5a shows this installation.
The acquisition of this movement was carried out by means of a device made of two KEYENCE LS-5041 [33] laser sensors, which give displacement readings with a precision of ±0.2 µm. This equipment operates through the treatment of the shadow generated in the receiver of the beam from the emitter as a consequence of the interference of an object—in this case, two small rods of which the tip movements are captured, with one attached to the pump shaft and the other to the bushing. Previously, using a pump without oil, the equipment was calibrated, bringing the bushing against the gear and establishing the null displacement and tilt conditions. The closing cover of the pump was machined, making two holes for the installation of the rods in the shaft and in the bushing. Therefore, the clearance between the rod and the hole drains a small amount of oil when the testing takes place. As the tank is elevated approximately 2 m above the level of the pump, the air does not enter the pump, as the suction is kept slightly pressurized.
3.2. In-Field Tests
The tests performed on a real machine are detailed in Torrent et al. [19]. These used a LLAMADA P140 [34] drilling rig in which the gear pump was installed, as shown in Figure 5b, to drive auxiliary movements that allow for the monitoring of the behavior in stationary and non-stationary conditions (the cylinders of the mast foot and jib). With a sample rate of 30 ms, the flow and pressure were monitored during the working cycles of the actuator, comparing the flow measures with the simulation via the bond graph model of the pump. The tests were carried out at different rotation speeds (1030, 1467 and 1961 rpm), with ideal system conditions (with variations in the resistive, inductive and capacitive impedances) to validate the model created from the experimental loss coefficients determined in the laboratory.
4. System Bond Graph Model Simulation
4.1. Movement of the Floating Bushing
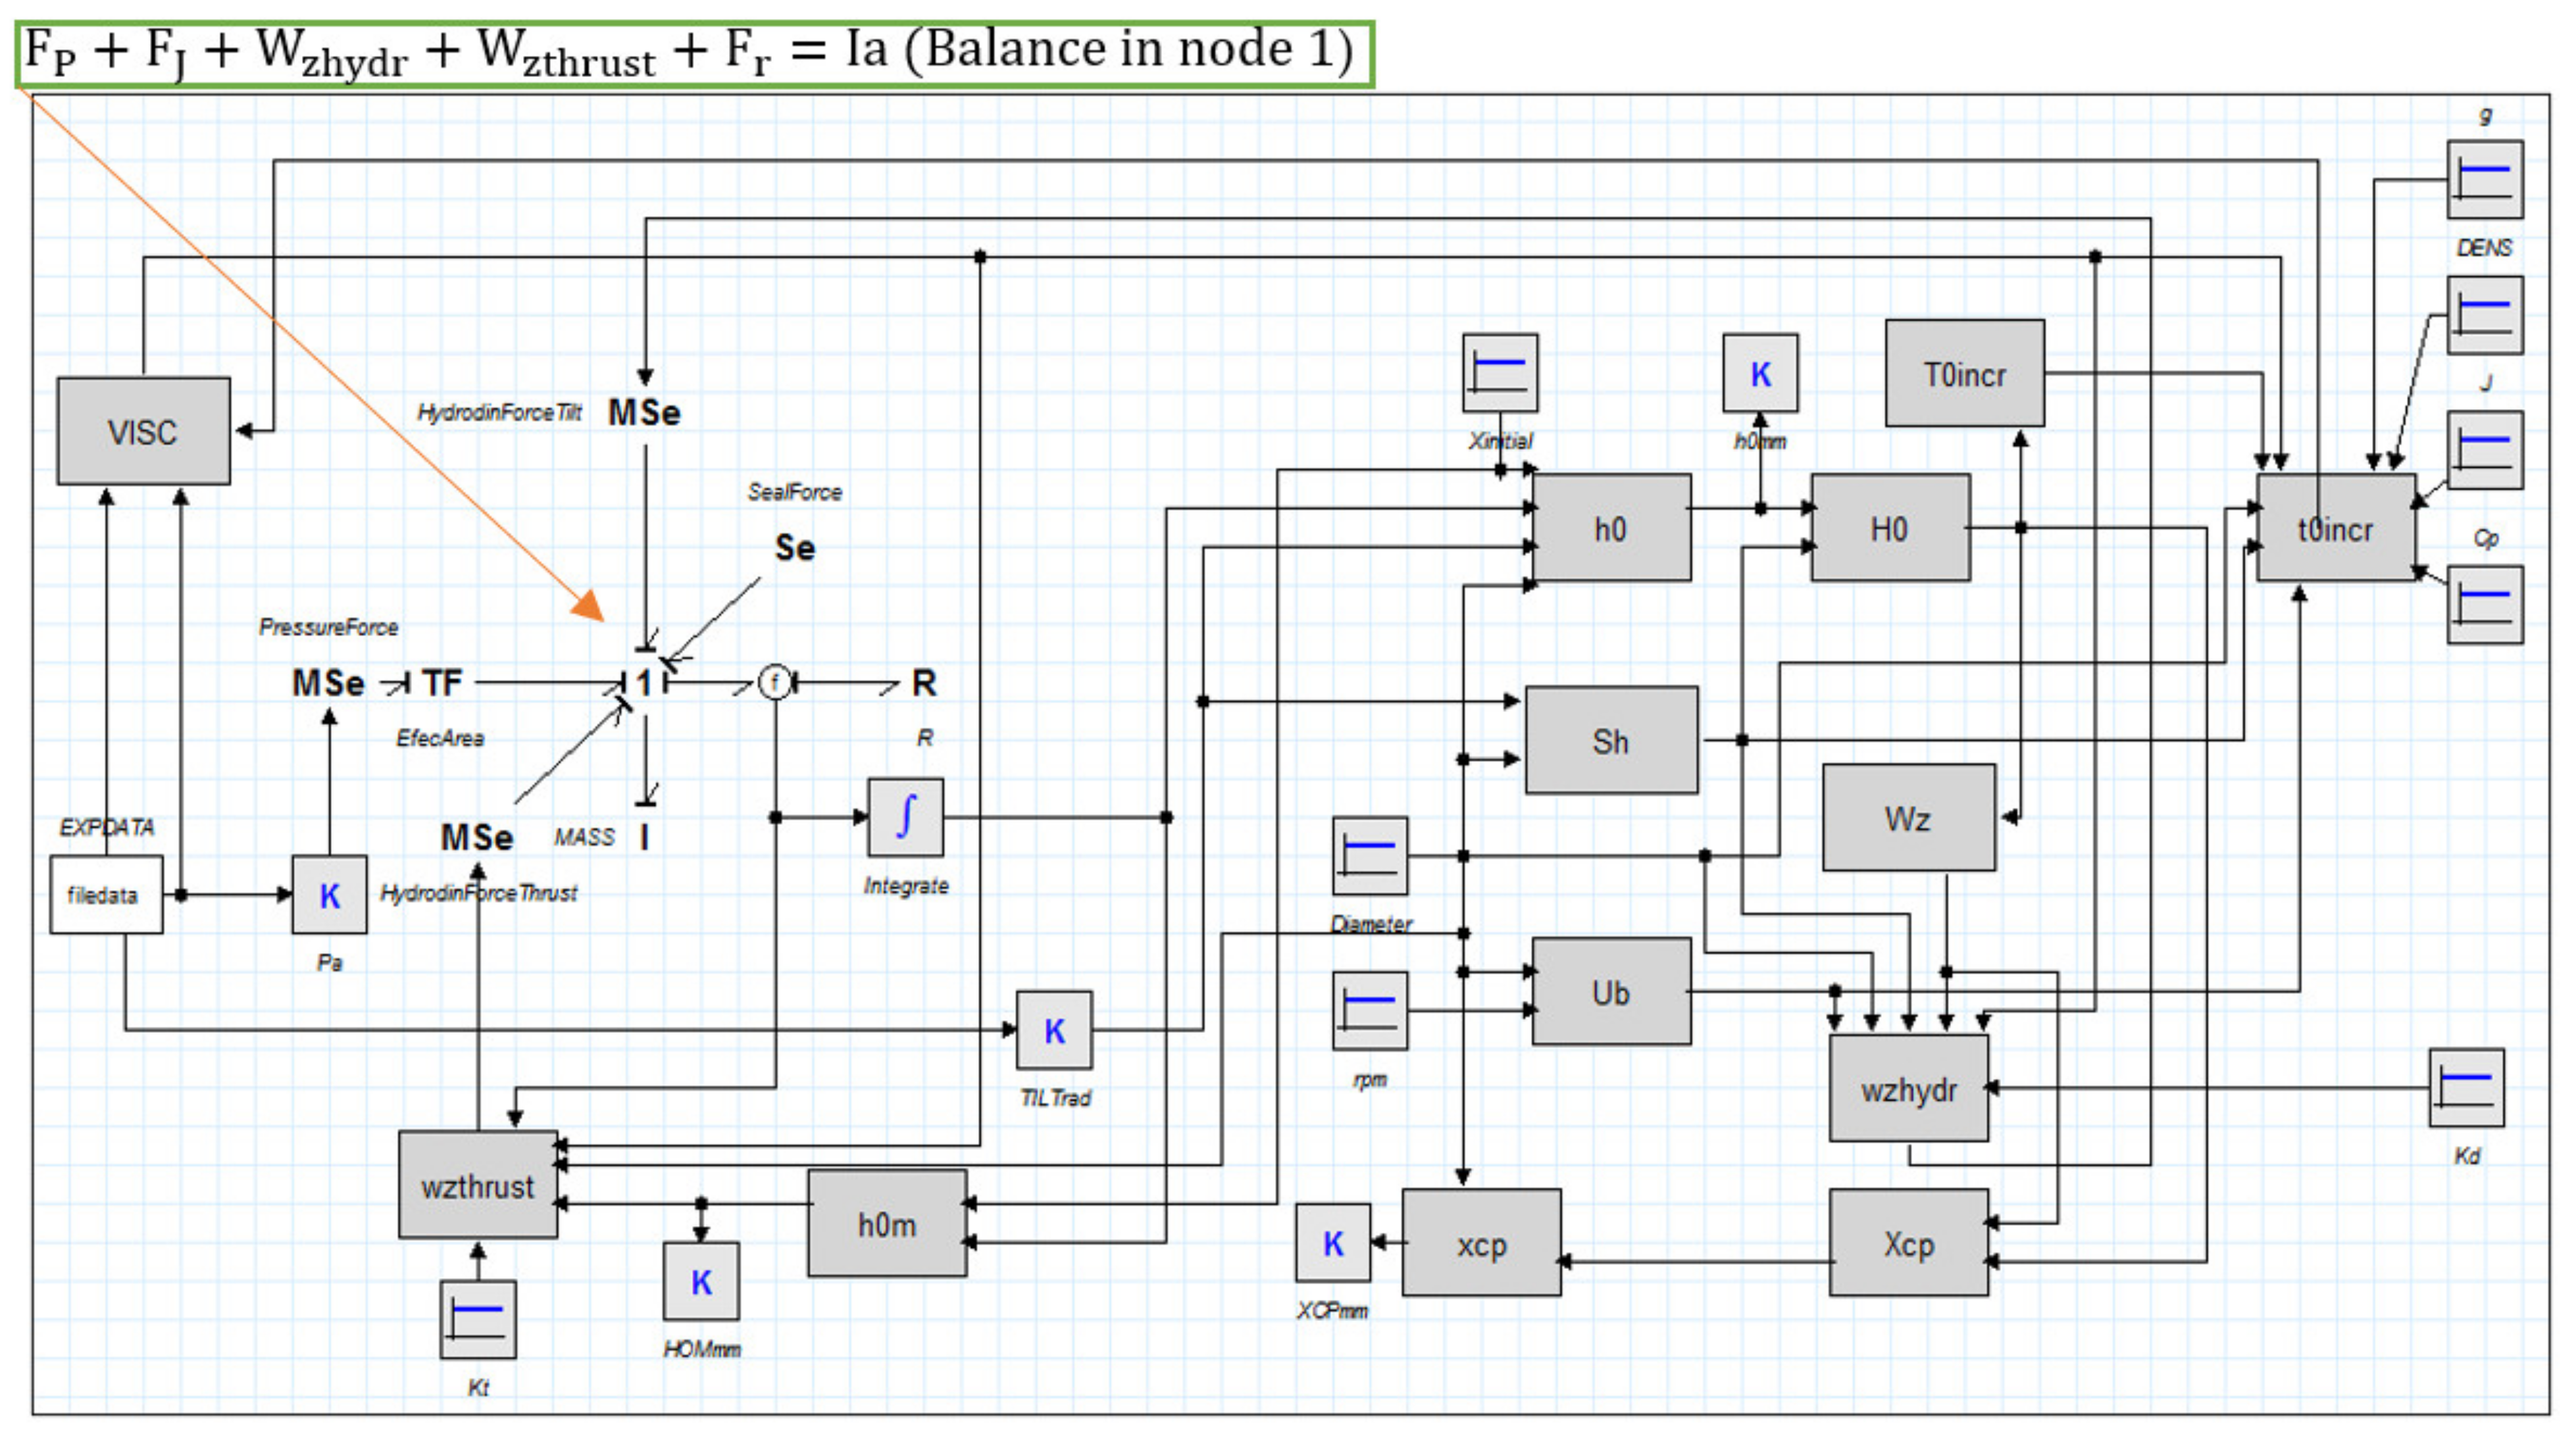
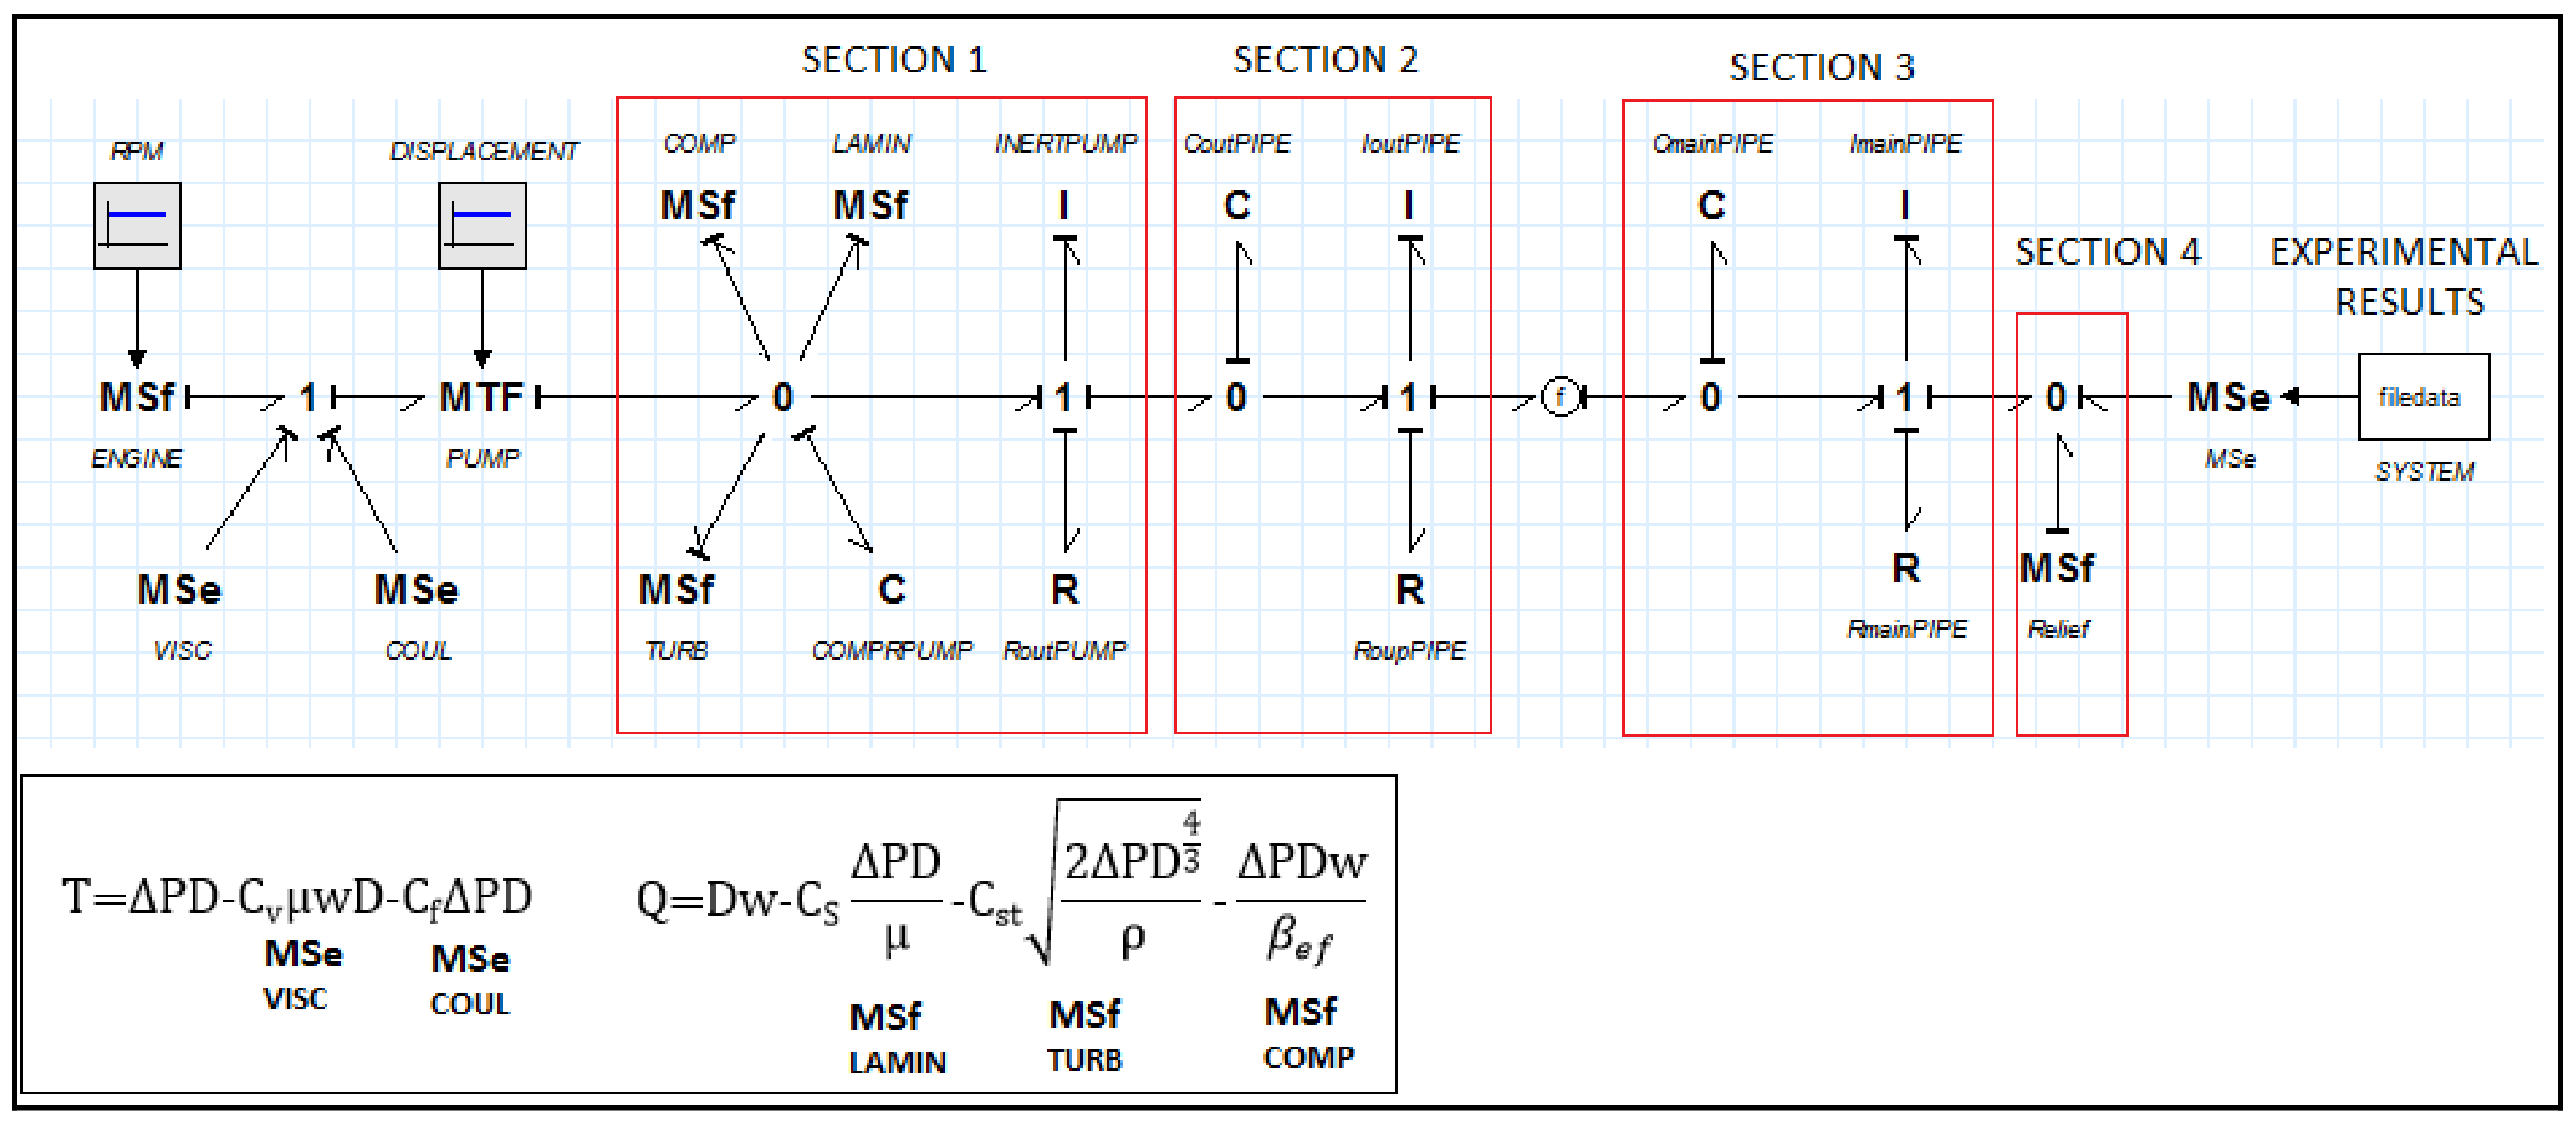
Once the forces to be considered in the floating bushing dynamics were studied, a bond graph diagram was used to model the behavior. This modeling method is commonly used in the simulation of oil hydraulic and mechanical systems, and we used the 20-SIM [35] software for the processing due to the versatility it offers in being able to work simultaneously with bond graph and block diagrams. The setup used is shown in Figure 6, and its most relevant characteristics are described in the following section.
The data file EXPDATA was used to determine the duty cycle. These experimental data include the working pressure, oil temperature, minimum gap and bushing tilting versus the time. In this way, the minimum gap resulting from the model can be plotted simultaneously with the experimental one. The structure was similar to that used by Torrent et al. [19], such that the motion of the floating bushing and the behavior of the parameterized pump could be simulated simultaneously. The EXPDATA file contains data corresponding to both laboratory testing and a real cycle of the machine.
The working pressure acts on the bushing according to Equation (1). The transformation of this effort, in the form of pressure (Pa) into force (N), occurs by means of a transformer element (TF EfectArea). In order to calculate the module of this transformer, the effective area calculated in Equation (2) was taken into account. The balance of the bushing was established at node 1, including the force of the O-ring (Se Seal Force), the mass of the bushing (I Mass), the friction between the bushing and the housing (R), and the hydrodynamic forces due to fixed-incline sliding (MSe HydrodinForce Tilt) and parallel-surface squeeze (MSe HydrodinForce Thrust). These latter two are calculated based on the minimum gap between the floating bushing and the gear in the first case (h0), and the mean gap in the second (h0m). Figure 7 illustrates these dimensions, and the integration of the bushing speed gives us the distance displaced from the initial position Xi. With this value and the experimental values of the bushing tilt, the minimum and mean gap can be calculated:
Next, for the sake of completeness, the modeling of the oil and the adaptation of the analytical solutions to the geometry of the gear pump are explained in more detail.
4.1.1. Adequacy of the Analytical Expressions
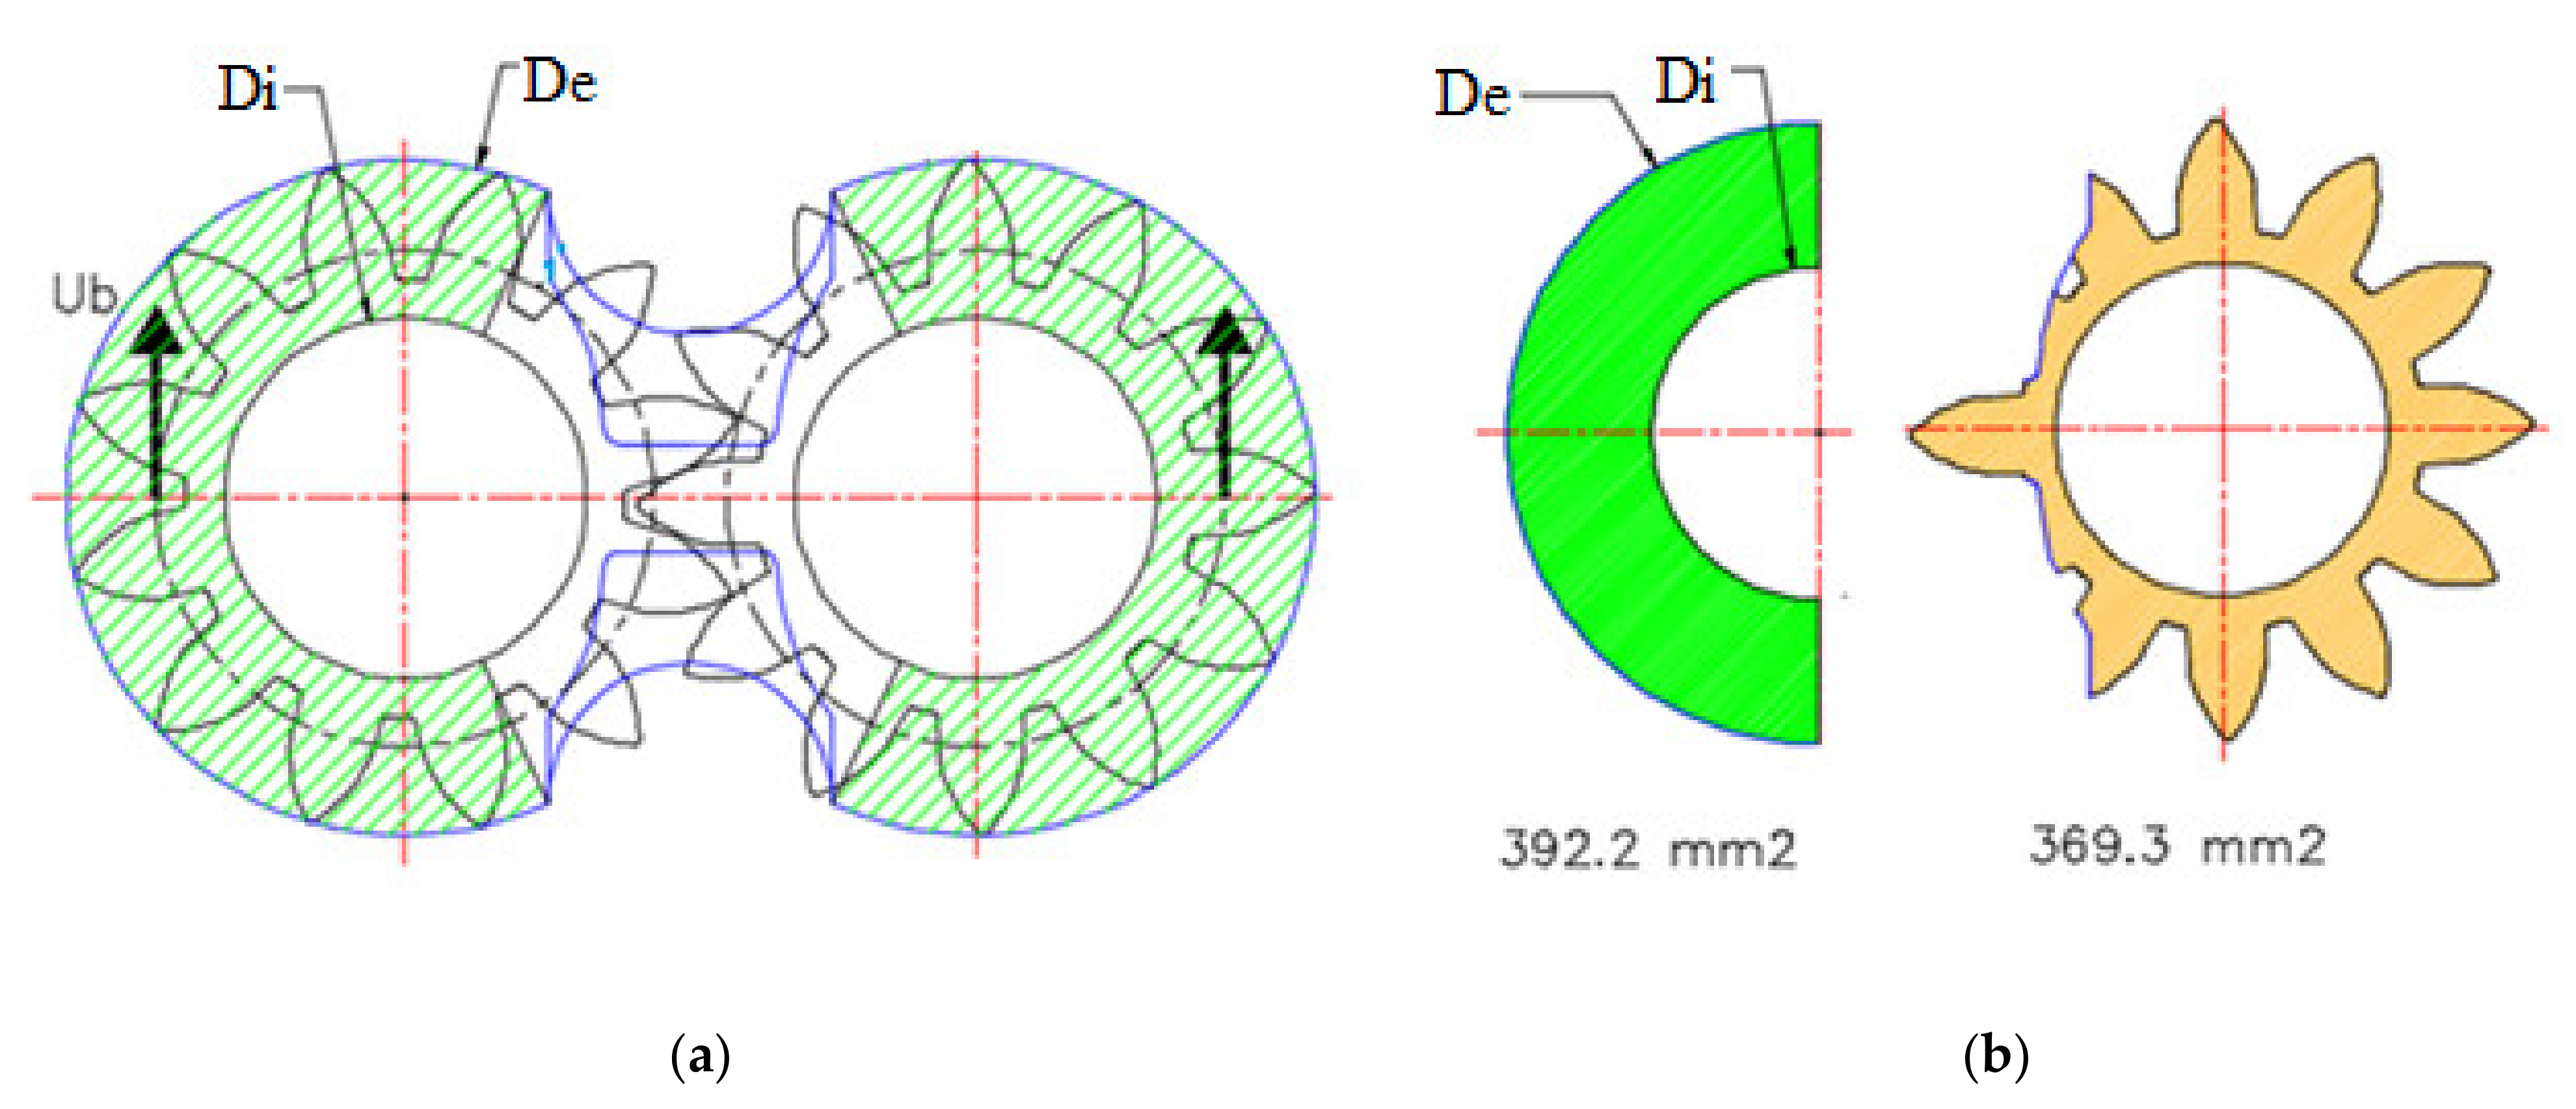
Due to the complexity of the analyzed domain, the proposed model does not include all of the phenomena that take part in the balance of the floating bushing, but as was already mentioned, it is simply looking for a simple, easy-to-use and expandable model to relate the “macroscopic” behavior of the pump to its internal geometric changes. In any case, certain magnitudes of the analytical expressions can be treated in detail. From Equation (13), with the shape factor Kd, the load-carrying capacity of the two fixed-incline slide bearings of width b can be determined, as indicated in Figure 8a.
with the width of the bearing being
The height of the wedge can be calculated as
Having obtained the bearing length and the velocity of the movable surface within the mean distance between the outside of the gear and the pump shaft, we then obtain
Finally, the shape factor Kd can be used to evaluate phenomena such as the loss of the load-carrying capacity of the bearing, the lateral side of the gear not being a continuous surface, the presence of lateral leaks in the slider bearing, the effect of the teeth when returning to the suction zone through the bushing grooves, or the fact that the length of the slider bearing considered is not exactly half of the circumference.
Regarding Equation (25), which expresses a parallel-surface squeeze film bearing, similar considerations can be made via
The shape factor Kt is determined by the ratio between the real bearing surface (the area of the lateral side of the gear against the bushing, calculated geometrically) and the surface of the bearing used in the model, as represented in Figure 8b.
4.1.2. Oil Treatment
Similar to the pump model presented in Torrent et al. [19], this tool must be valid for any type of hydraulic oil; thus, the variation in viscosity with temperature and pressure must be taken into account. The laboratory data used to validate the model were obtained with a Fuchs Renolin B10 HM32 [36], while the machine used to test the real cycle used a Shell Tellus SI HV46 [37]. The inversely proportional relationship of viscosity to temperature was obtained from technical documentation, but it is more difficult to find data on the relationship of viscosity to pressure. Hence, the Barus formula [38], which is suitable under isothermal conditions, is a good expression to introduce into the model in the first approximation:
Incorporating the variation in viscosity with temperature,
The constants A and B are obtained from the regression of the abovementioned data of viscosity versus temperature, which were obtained from the technical oil documentation, and the constant C from the data provided by WEBTEC [39]. The obtained correlations, which are introduced into VISC, are for an HM32 oil:
while for HV 46 oil, the correlation is
The units of pressure and temperature in these expressions have to be introduced in bar and °C, respectively, providing errors of less than 5% in the working pressure range from 0 to 250 bar and the temperature range from 20 to 60 °C.
4.2. Integral Pump Model
The pump model that was created is described in detail in the article by Torrent et al. [19]. This shows the bond graph modeling of the gear pump from the loss coefficients (parameterization) previously obtained experimentally by performing the ISO 4409 test at different temperatures. Figure 9 shows a simplified bond graph, and the expressions of the flow delivered by the pump at different pressures, rotational speeds and viscosities. The correlations of the loss coefficients with the operating conditions were introduced into the bond graph model, and their values are related to the internal geometry of the unit. In order to establish this relationship, a simultaneous simulation of both models with 20-SIM was carried out under the same real work cycle. This article only deals with the relationship between the motion of the bushing and the parameters that define its volumetric behavior, that is, the coefficient of laminar (Cs) and turbulent (Cst) leaks. As was already mentioned, this is the main objective of this research, and the inclusion of hydromechanical losses into the model, defined by the viscous (Cv) and coulombian (Cst) friction coefficients, will be taken into account in future extensions of the model.
5. Results and Discussion
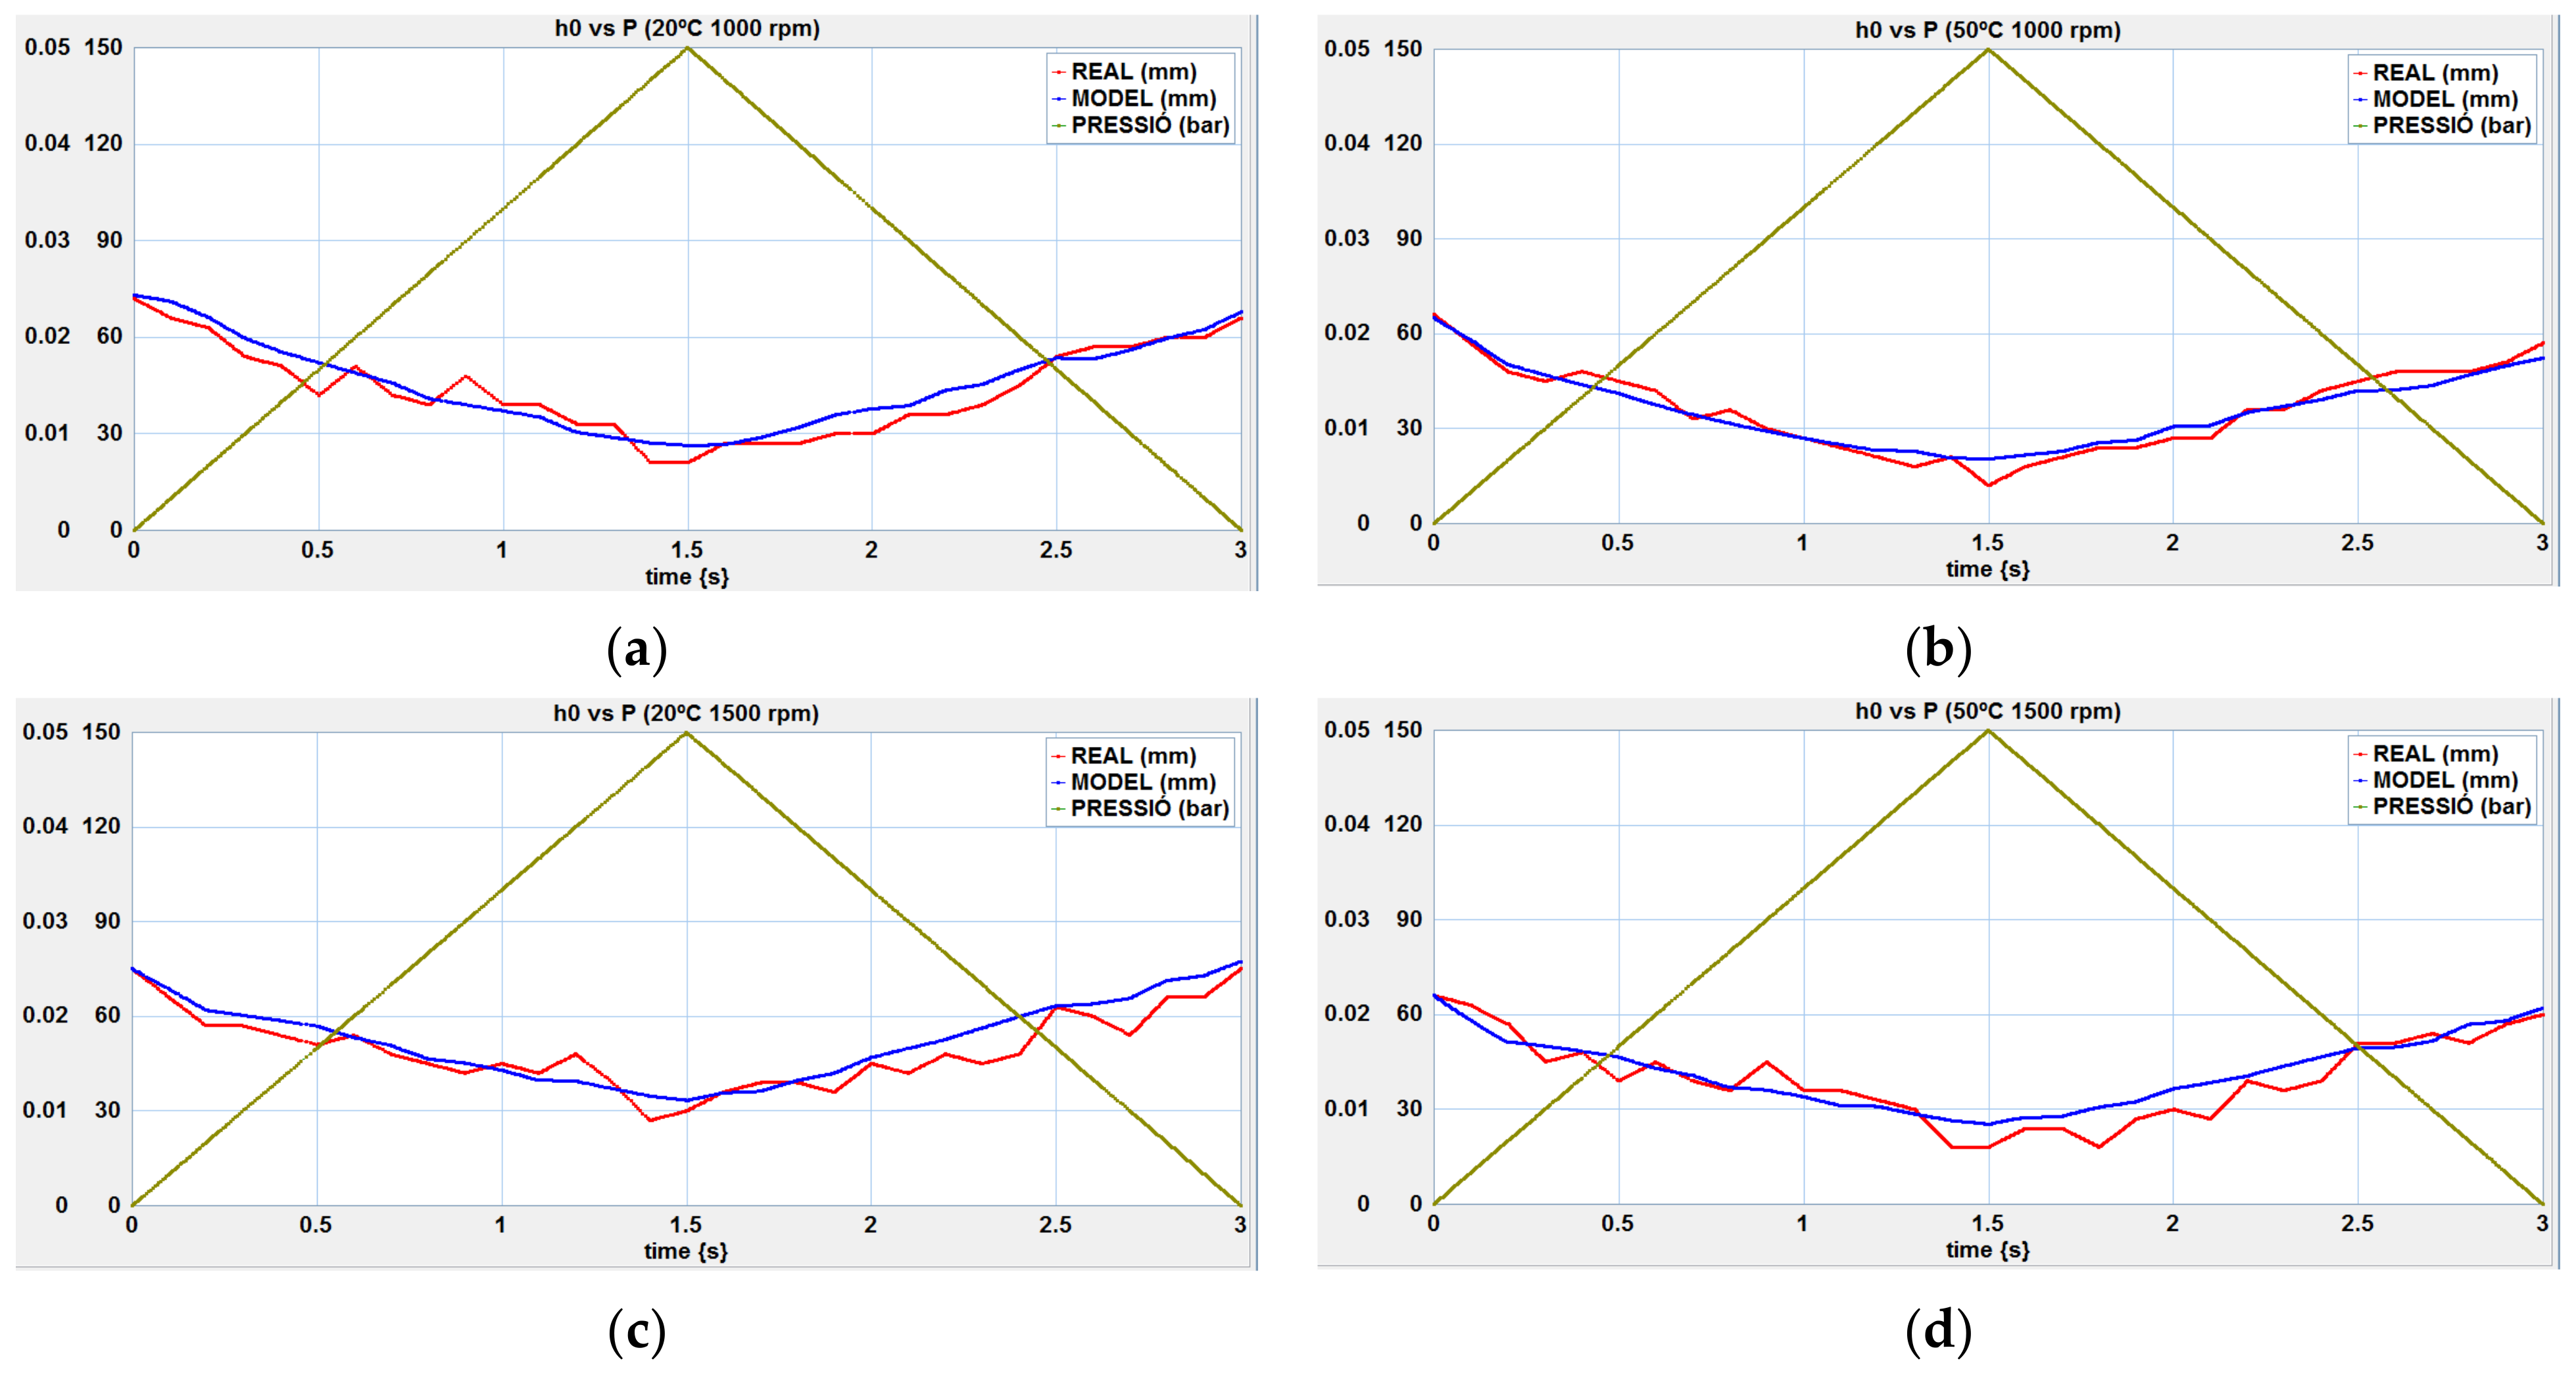
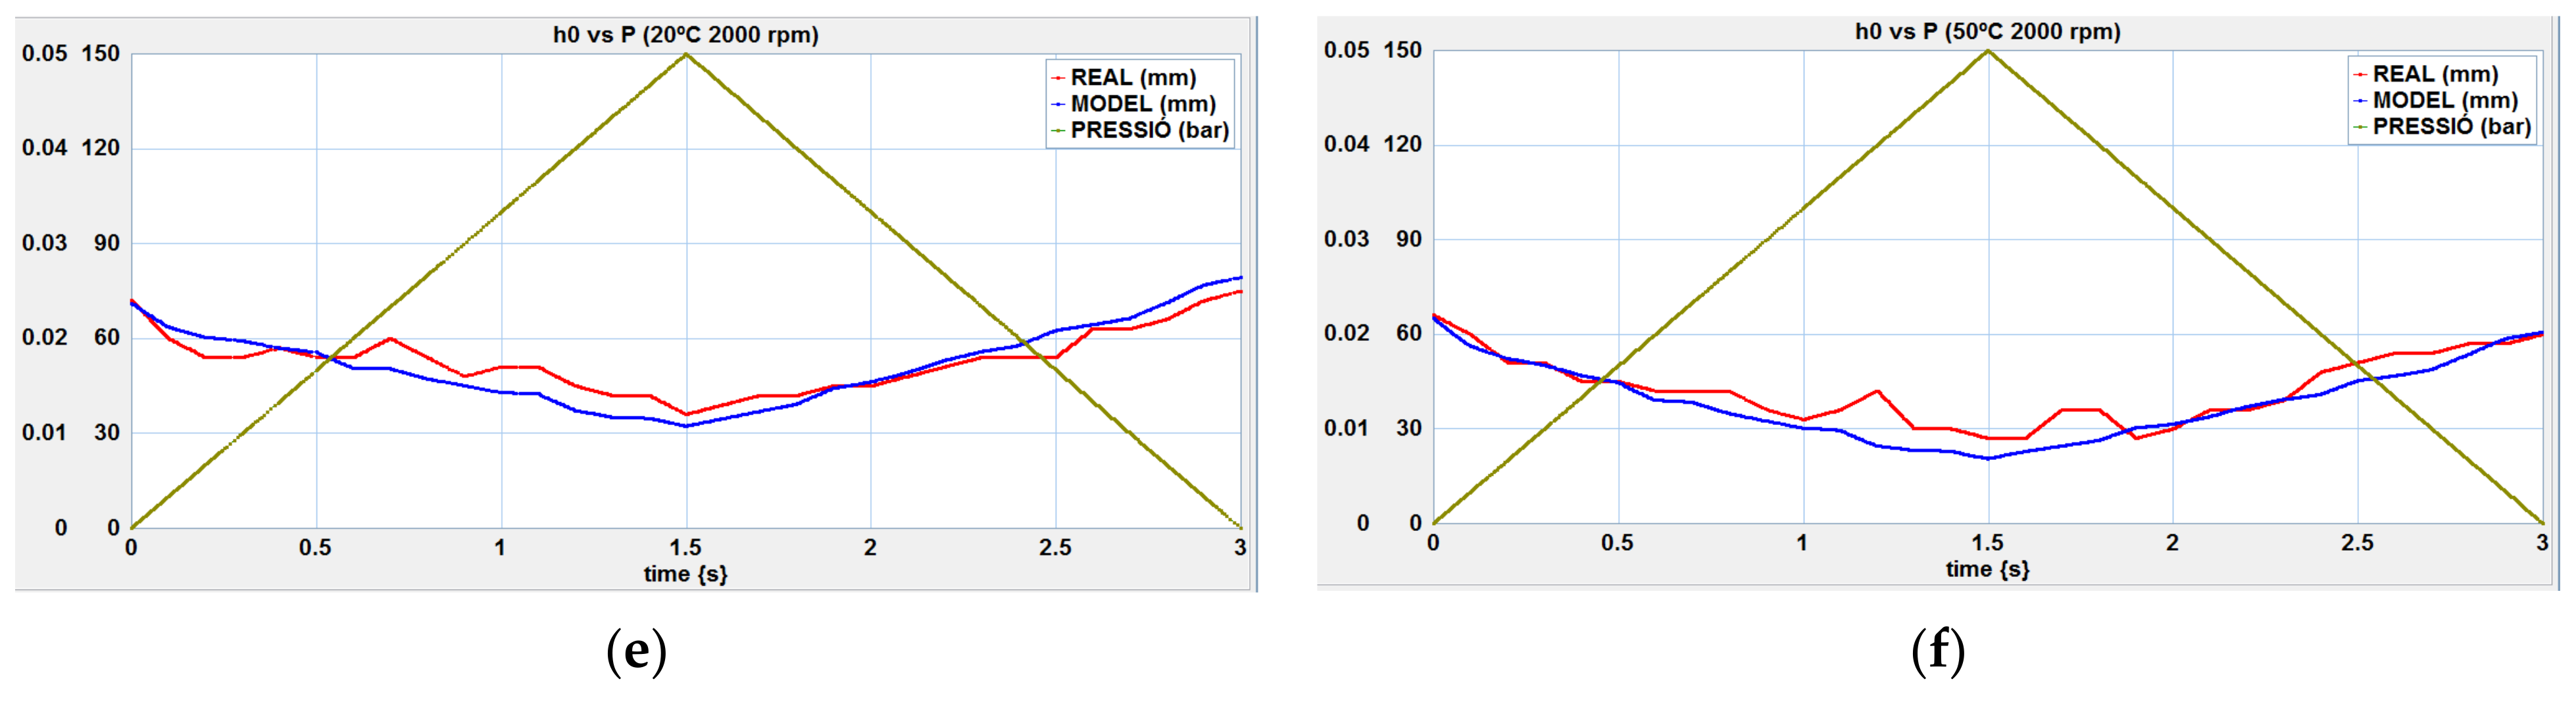
Figure 10 shows a comparison between the results of the experimental laboratory tests (red line) and the simulations (blue line) of the minimum gap between the bushing and the gear (h0). The duration of the test was set at 3 s. During the first 1.5 s, the pressure was increased from 0 to 150 bar, and during the next 1.5 s it decreased from 150 to 0 bar. Although the experimental data were not collected in exactly the same way as in the simulation (the pressure was increased in steps of 10 bar once the signal from the transducers had stabilized), a time of 0.1 s is considered quite similar to the operating time of the relief valve required to obtain a step of 10 bar. If staggered pressure steps are used instead of ramping, the evolution of the movement of the bushing is the same, giving rise to transients that lead to a distorted signal. A duration of 0.1 s to reach each pressure step is sufficient for bushing motion stabilization.
In order to adapt the model obtained from the analytical solutions of singular cases of hydrodynamic lubrication to a complex geometry, only two shape factors were used. The shape factor Kt (corresponding to an analogy with a parallel-surface squeeze film bearing) remained constant in all of the tests at 0.94. The equilibrium position of the bushing did not depend on this force, but greatly depended on the response time. Regarding the shape factor Kd (corresponding to the analogy with a fixed-incline slide bearing), the optimal values that effectively adapt the experimental and simulated results range between 0.1 and 0.3, increasing with the rotational speed and temperature. That is, the analogy between a continuous slide bearing and the real discontinuous complex geometry of the gears is better with high rotational speeds and smaller lubricating gaps. In fact, Equation (26) indicates a proportionality between the slide speed and the load-carrying capacity, and we used directly proportional dependence (as the analytical solution) instead of another kind of dependence without any physical justification. When introducing the model into the real machine cycle, a shape factor of 0.2 was used because this value worked quite well in all of the simulations of the laboratory test. This means that the load-carrying capacity of the real complex geometry is 20% of that generated in an ideal fixed-incline slide bearing.
The goodness of the model is confirmed by the good correlation between the measured and simulated values of the clearance, which vary with the operating conditions (pressure, rotational speed and temperature) when setting a fixed shape factor Kd. Different Kd values manifest an offset between the experimental and simulated values, but this remained approximately constant under all of the operating conditions.
Our results are comparable with those of other authors, although it must be taken into account that pumps are not always of a similar size, and the same type of fluid is not always used. The order of magnitude of the minimum gap is approximately the same (a minimum thickness of 6–12 µm, depending on operating conditions), but the lowest film thickness was found in the pressure zone, while similar studies, for example those by Borgui and Zardin [14] or Thiagarajan et al. [31], located it in the suction zone. It has already been stated that simulations of the tilting have not been carried out, and experimental values were used in the model to calculate the minimal lubricating gap, coinciding in terms of magnitude and rotation direction with the work of Koç [24]. Borgui and Zardin [14] already noticed the need to overbalance the floating bushing to minimize the inclination towards the suction zone. In the pump which was analyzed, while increasing the pressure and decreasing the film thickness (Figure 10), there was progressive tilting, which increased the load-carrying capacity. It can be concluded that minimal thicknesses are not required with high pressures because there is greater inclination, and at low pressures the system works almost parallel to the lateral side of the gear.
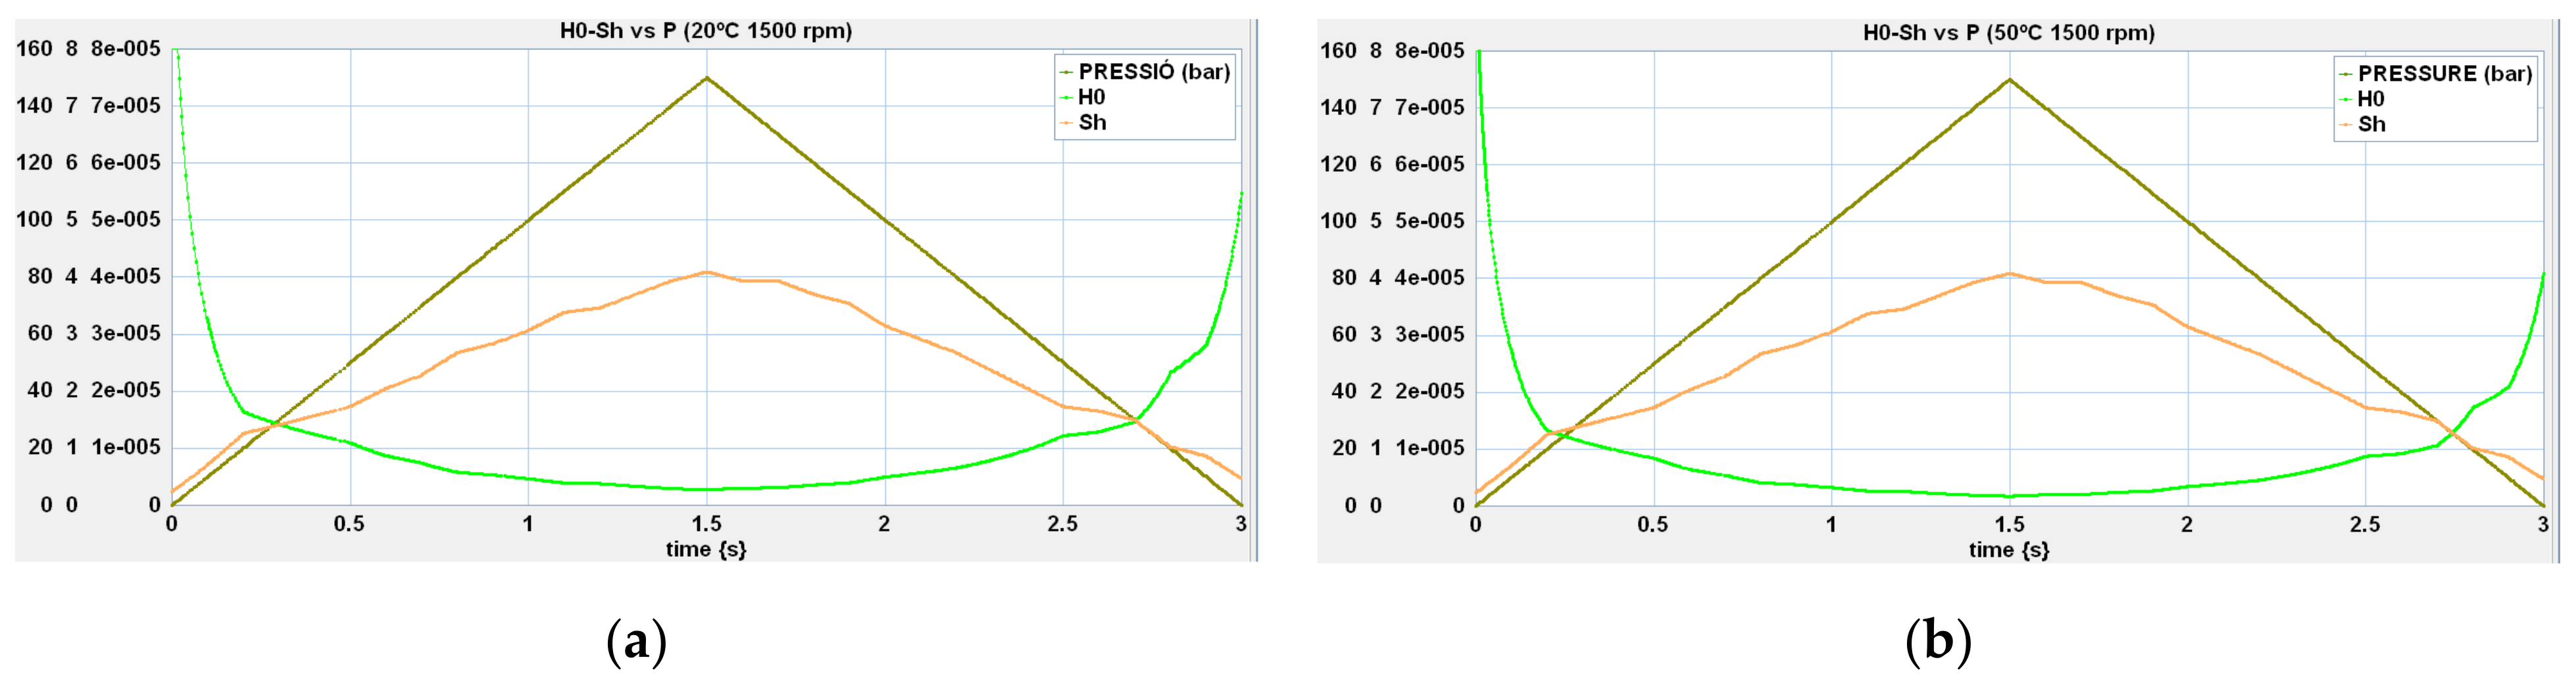
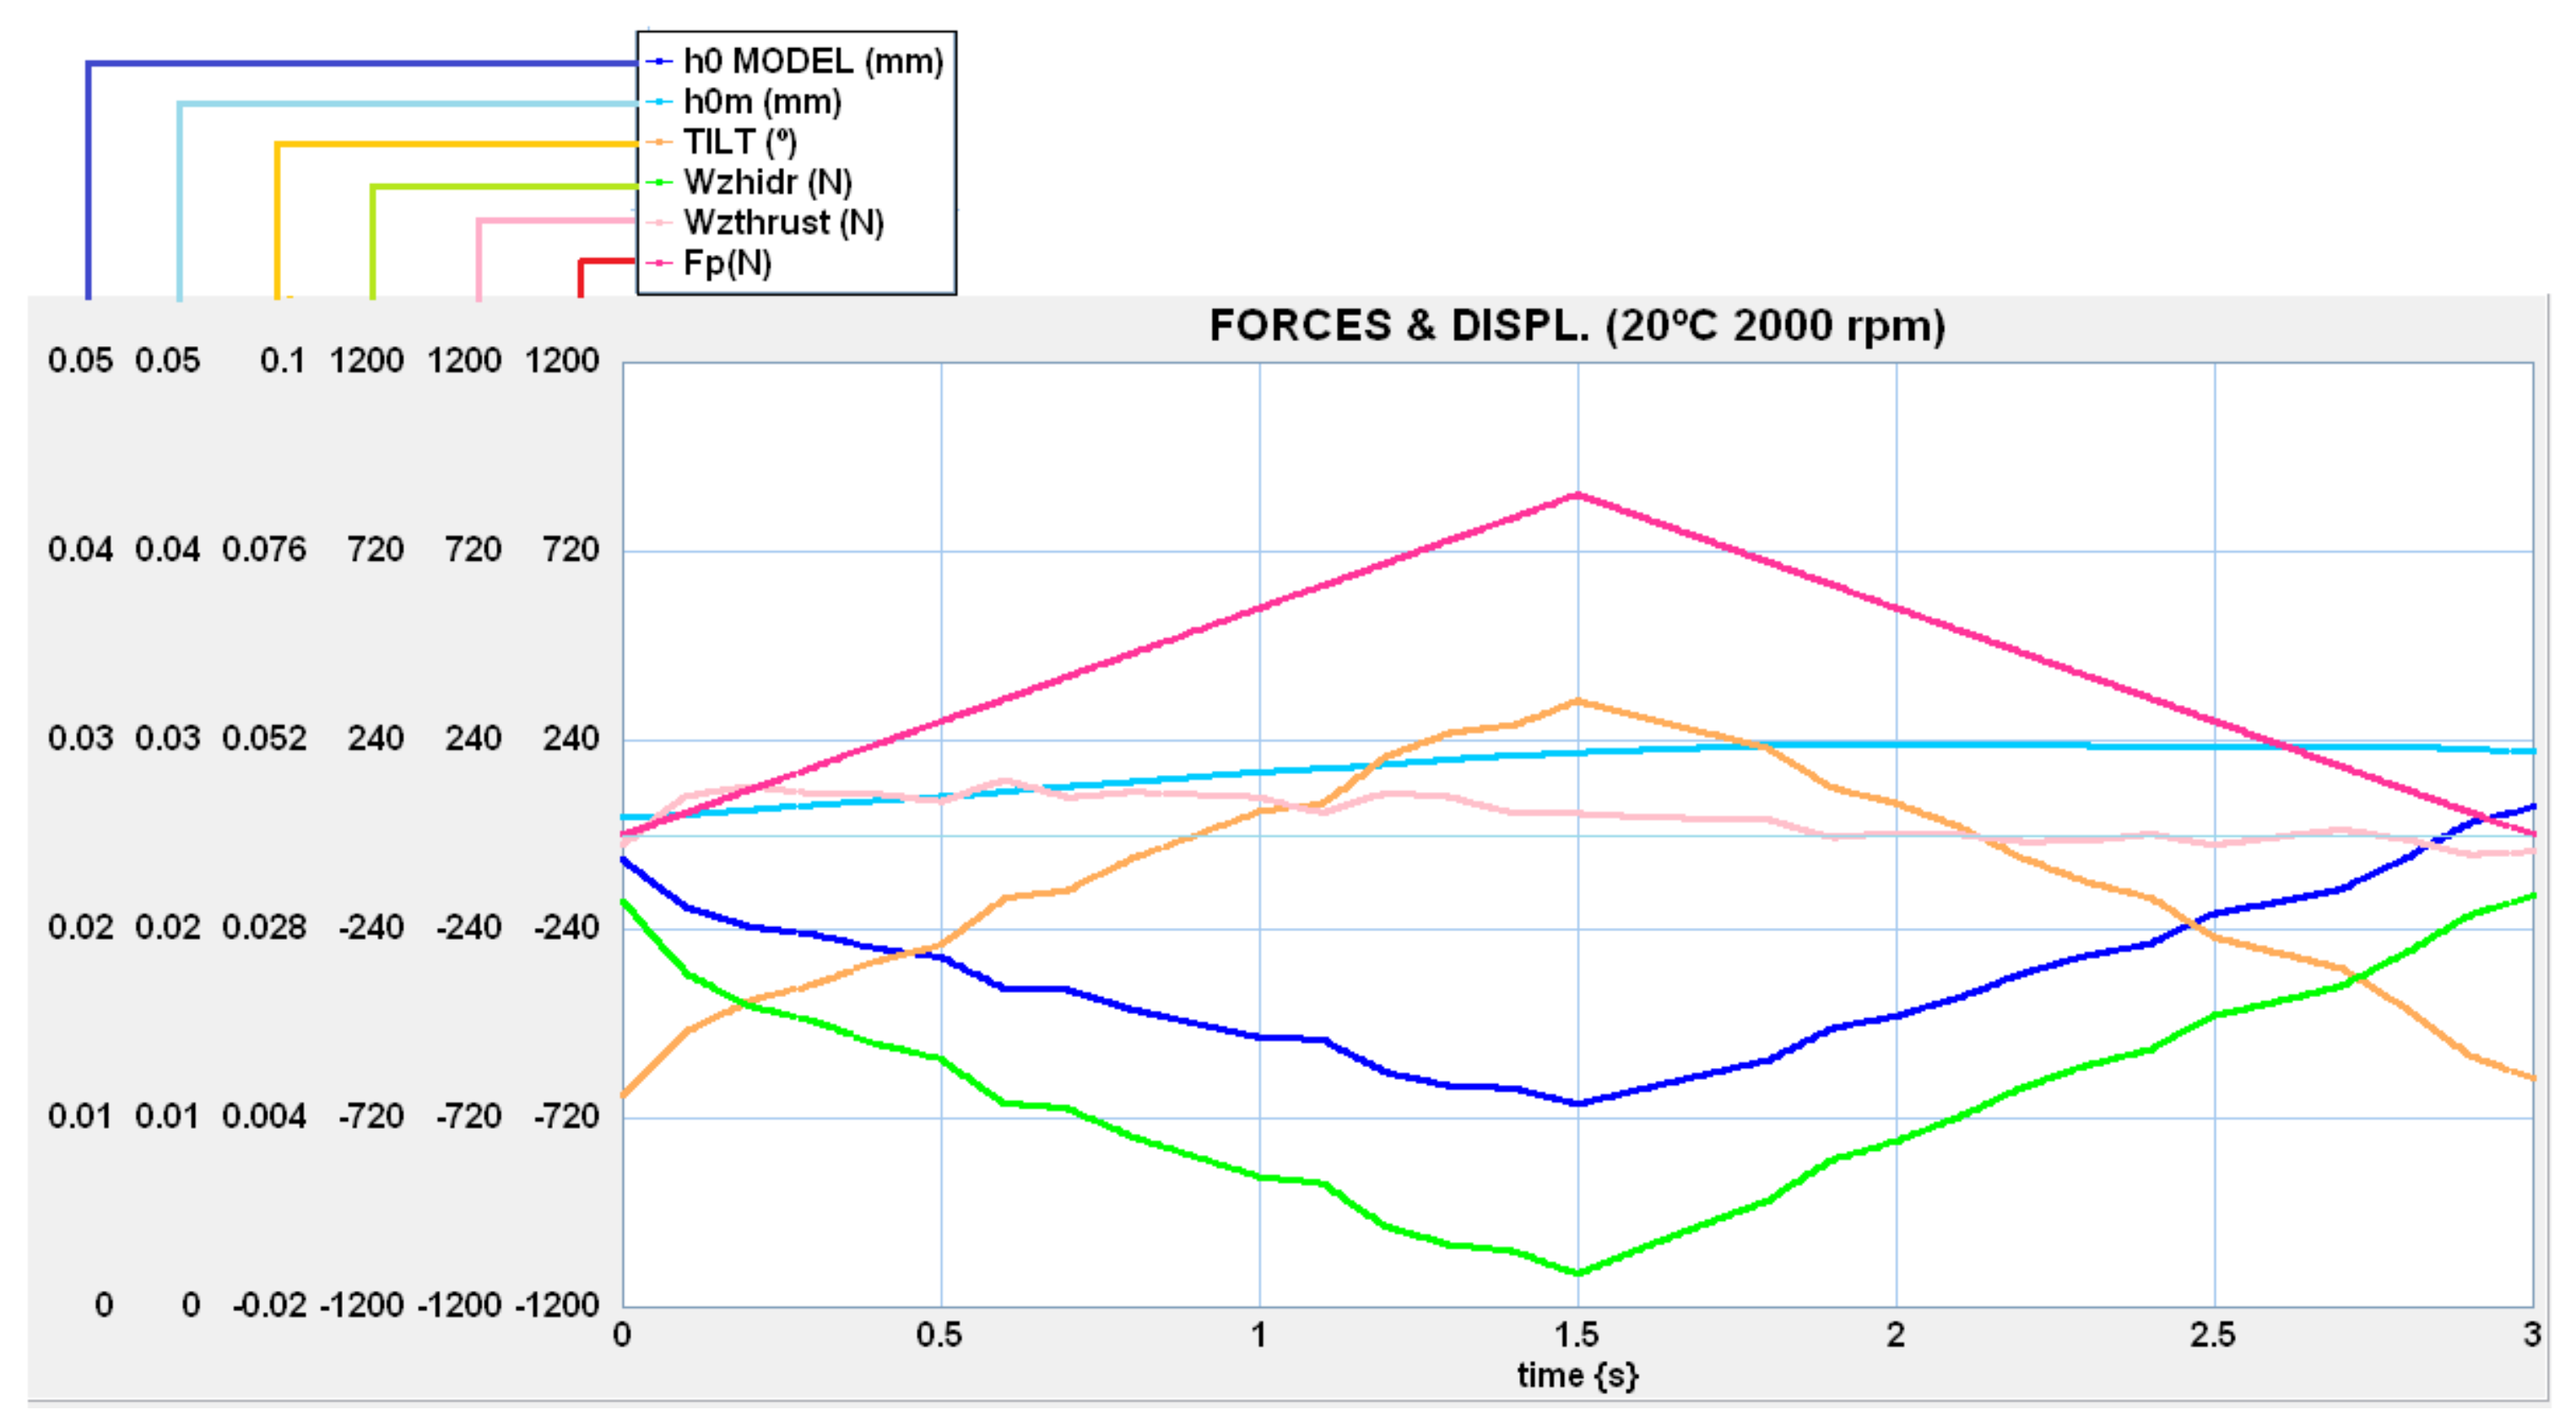
Similar to the experimental data, the model shows slight hysteresis in its behavior. Figure 11 shows different values of minimal thickness and tilting, depending on whether the pressure is increasing or decreasing. This phenomenon is also present in the results of the volumetric efficiency of the pump, according to ISO 4409. Although a possible explanation attributes this to the known stick–slip, a new explanation is presented here, based on Figure 12. At the beginning of the movement, when the bushing is held flat, it tends to tilt rapidly, so that its center separates from the gear, as can be seen in the evolution of h0m. The velocity in Equation (25) is negative, and the force generated in the lubricating film tends to make the bushing adhere to the gear, instead of separating it as expected (values about 100 N). The same phenomenon occurs when the maximum pressure is reached and the tilting is at its maximum. The floating bushing’s inclination decreases as it moves away from the gear, meaning that its center stays practically stationary and no force is generated due to the parallel-surface squeeze film. The bushing is only supported by the force generated by the fixed-incline slide, keeping the mean thickness approximately constant. Therefore, the tilting has to be slightly greater, and the minimum thickness slightly smaller. Hence, equilibrium can occur at the same pressure with different geometries, producing the hysteresis observed in the flow supplied by the pump. The heating of the oil in the oil film also contributes to this effect, which was simulated, and is in the order of 2–5 °C.
This phenomenon explains the fact that when pump depressurization suddenly occurs, there is a peak of the flow. The floating bushing, due to the hysteresis explained above, remains “attached” to the gear instead of separating, substantially reducing leakage and increasing its volumetric efficiency.
In any case, as shown by Thiagarajan et al. [31], it seems evident that the fit of the bushing in the housing generates frictional forces that produce hysteresis on the axial balance system, such that the lubricating gaps that develop within the pump in certain operating conditions depend on the previous operating state. This is another phenomenon that should be evaluated in future extensions of this bond graph model.
In simulations of lab tests, the model requires an initial value of the mean gear–bushing gap Xi that is similar to the real one. If not, the values will not match until the simulation is quite advanced. With long cycles, as are found in in-field simulations, this is not a problem, as from about 1 s onwards the values are not influenced by the starting point.
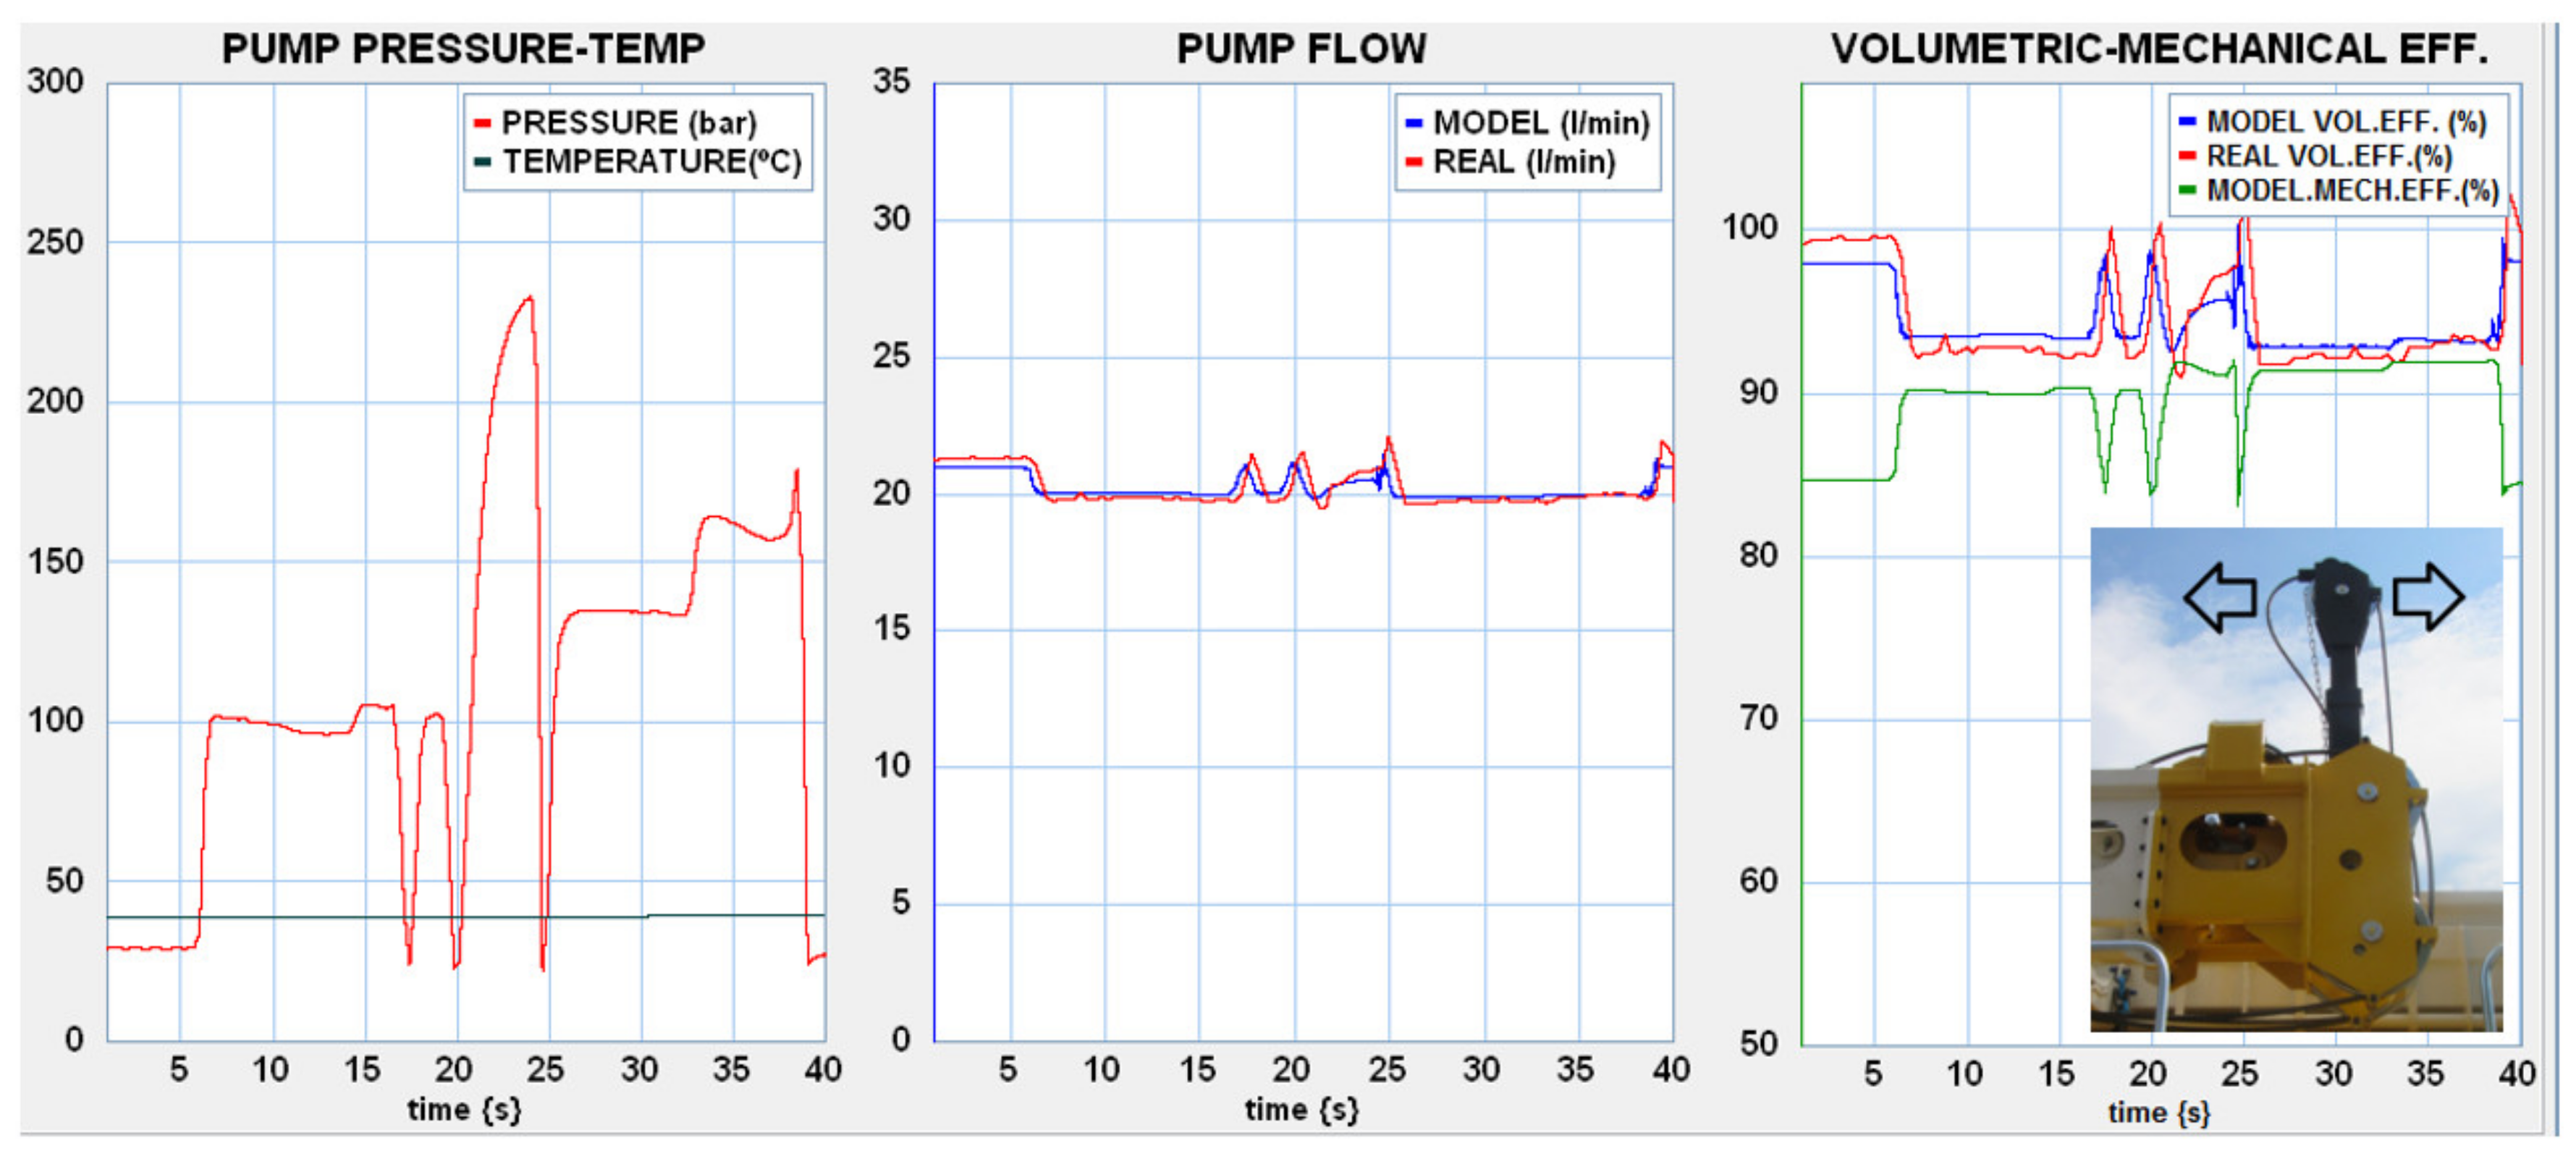
Figure 13 shows the operating cycle of the pump which was used [19]. Figure 14 shows the results of a pump model that included a submodel of bushing motion, plotting the evolution of the laminar (Cs) and turbulent (Cst) leakage coefficients together with the evolution of the minimum oil film thickness. In order to determine the bushing tilting, a correlation in the experimental values was introduced as a function of the working pressure at 1500 rpm, which is close to the rotational speed found in a real cycle. It can be seen that an increase in tilting due to higher pressure, and therefore a decrease in the minimum thickness, leads to a reduction in the laminar nature of the flow and an increment in turbulence. This is an example of the way in which the model created can relate the operating parameters of the pump to internal geometrical changes.
6. Conclusions
The motion of the floating bushing bearings in an external gear pump with axial compensation was modeled using a simple, fast and very expandable bond graph model. The model uses analytically solved expressions of the lubrication in the gear–bushing interface, derived by means of the analogy with a fixed-incline slide bearing and a parallel-surface squeeze film. The goodness of the model was verified by experimental data on the lubricating gap between the lateral side of the gear and the bushing, showing a good correlation and a very similar response to variations in the operating conditions. Once the model was validated, it was used to expand a previous pump model created by the authors, which also used the bond graph technique, to elucidate the correlation between the leakage coefficients and the bushing motion. This correlation was experimentally studied in a real cycle of the gear pump, driving auxiliary movements when working as part of a drilling machine.
The most significant limitation of the floating bushing motion model is the dependence of the shape factor Kd on the rotational speed of the pump and the oil temperature. For instance, in the displayed simulation of the in-field working cycle, a value of 0.2 was taken because it was found to be optimal in simulations of laboratory tests at 1500 rpm and 50 °C. Knowing that this shape factor is greater when the minimal gap is smaller, the model can be improved by introducing this dependency, at the expense of increasing its complexity.
The development of this model is not possible without experimental data, which are necessary both to parameterize the pump and adjust the analytical solutions of the floating bushing motion. Parameterization is a relatively simple task, only requiring the ISO 4409 test to be carried out at two different temperatures. However, the acquisition of the thickness in the gear–floating bushing interface requires the modification of the pump and the use of very complex instrumentation. Extrapolating the presented model to different gear pumps undoubtedly requires experimental verification that their behaviors are similar.
Notwithstanding the limitations of the model and its hypothesis, the model made it possible to draw very significant conclusions about the behavior of the pump when it was tested both in the laboratory and in-field cycles. The hysteresis of the volumetric efficiency is related to the fact that under the same operating conditions, the floating bushing can be balanced in different positions. It also made it possible to show that the bushing remains “attached” to the gear instead of separating when the pressure drops suddenly, substantially reducing leakage and increasing its volumetric efficiency. This phenomenon is shown in real cycles in a peak flow.
The developed model is a well-balanced tool for the relation of the parameterization that characterizes the operation of the pump (loss coefficients) with its internal behavior. In addition, despite the fact that powerful CFD simulations were discussed in the recent literature, bond graph modeling still retains its own advantages. For instance, the introduction of the submodel of bushing motion into the pump model in order to determine leakage coefficients could enable the pump model to run better when faced with transient phenomena, wherein hydrodynamic equilibrium is not immediately achieved.
Modeling the tilting of the floating bushing by creating a node at which the moments are balanced (taking into account the efforts of the journal bearings) is perhaps the most immediately logical extension of the model. Frictions can also be treated analytically, and can thus be introduced into the model by connecting them to the parameters that define the hydromechanical performance of the unit, i.e., the coefficients of viscous and coulomb friction. Finally, a more detailed treatment of the friction between the bushing and housing will make the model even more accurate.
Author Contributions
Conceptualization, M.T.; formal analysis, M.T.; investigation, M.T. and E.C.; supervision, P.J.G.-M. and E.C.; writing—original draft, M.T.; writing—review and editing, P.J.G.-M. All authors have read and agreed to the published version of the manuscript.
Funding
This research received no external funding.
Institutional Review Board Statement
Not applicable.
Informed Consent Statement
Not applicable.
Data Availability Statement
The data presented in this study are available on request from the corresponding author. The data are not publicly available due to privacy reasons.
Acknowledgments
The authors would like to thank the Roquet Group (https://www.pedro-roquet.com, accessed on 8 December 2021) and Construcciones Mecanicas Llamada (https://cm-llamada.es, accessed on 8 December 2021) for the facilities used to perform the tests with the pump and machine, respectively.
Conflicts of Interest
The funding sponsors had no role in the design of the study; in the collection, analyses or interpretation of data; in the writing of the conclusions; or in the decision to publish the results. The authors declare no conflict of interest.
Nomenclature
| Symbol | Description | Units |
| a | Acceleration of the bushing | |
| Effective area | ||
| b | Width of the hydrodynamic bearing | m |
| Specific heat at a constant pressure | ||
| External diameter of the gear | m | |
| Diameter of the shaft | m | |
| e | Thickness of the oil film between the housing and the bushing | m |
| O-ring force on the bushing | N | |
| Hydrostatic force on the bushing | N | |
| Resistive force on the bushing | N | |
| g | Gravitational acceleration (9.8) | |
| h | Thickness of the oil film | |
| H | Dimensionless thickness of the oil film | m |
| Minimal thickness of the oil film | m | |
| m | ||
| Mean thickness of the oil film | m | |
| Dimensionless minimal thickness of the oil film | - | |
| I | Inertia of the bushing | kg |
| J | Joule’s mechanical equivalent of heat | |
| Shape factor of a fixed-incline slide bearing | - | |
| Shape factor of a parallel-surface squeeze film bearing | - | |
| l | Length of the bearing | m |
| p | Pressure in the oil film section | Pa |
| Pressure in the outlet port of the pump | Pa | |
| P | Dimensionless pressure in the oil film section | - |
| R | Resistance of the bushing motion | |
| Wedge height | m | |
| Dimensionless wedge height | - | |
| Peripheral friction surface | ||
| S1 | Pressured area in the back side of the bushing | |
| S2 | Pressured area between the teeth | |
| S3 | Area between the teeth subjected to the pressure gradient | |
| S4 | Lateral area of the gear against the bushing | |
| T | Oil temperature | °C |
| Slide speed in a fixed-incline slide bearing | ||
| v | Relative velocity between the bushing and side face of the gear | L |
| Velocity inside the oil film | ||
| Load-carrying capacity as a fixed-incline slide bearing | N | |
| Force of a fixed-incline slide bearing in the bond graph | N | |
| Force of a parallel-surface squeeze film bearing in the bond graph | N | |
| Load-carrying capacity as a parallel-surface squeeze film bearing | N | |
| Dimensionless load-carrying capacity as a fixed-incline slide bearing | - | |
| x | Displacement of the bushing from the initial position | m |
| Initial position of the bushing | m | |
| m | ||
| - | ||
| (Greek letters) | ||
| Tilt of the bushing | rad | |
| Temperature rise inside the lubricating gap | °C | |
| Dimensionless temperature rise inside the lubricating gap | - | |
| Pressure–viscosity coefficient of the lubricant | ||
| Dynamic viscosity | Pa s | |
| Dynamic viscosity of the reference in the Barus formula | Pa s | |
| Mass density of the oil | kg m−3 | |
| Rotational speed of the pump |
References
- Wilson, W.E. Rotary pump theory. Trans. ASME 1946, 68, 371–383. [Google Scholar]
- Toet, G. Die Bestimmung des theoretischen Hubvolumens von hydrostatischen Verdrangerpumpen und Motoren aus volumetrischen Messungen. Oelhydraulik Pneum. 1970, 14, 185–190. [Google Scholar]
- Schlosser, W.M.J.; Hilbrands, J.W. Das volumetrische Wirkungsgrad von Verdrongerpumpen. Oelhydraulik Pneum. 1963, 7, 469–476. [Google Scholar]
- Dorey, R.E. Modelling of losses in pumps and motors. In Proceedings of the 1st Bath International Fluid Power Workshop on Design, Modelling and Control of Pumps, Bath, UK, 7 September 1988; pp. 71–97. [Google Scholar]
- Guo, R.; Li, Y.; Shi, Y.; Li, H.; Zhao, J.; Gao, D. Research on Identification Method of Wear Degradation of External Gear Pump Based on Flow Field Analysis. Sensors 2020, 20, 4058. [Google Scholar] [CrossRef] [PubMed]
- Edge, K.A.; Johnston, D.N. The ‘secondary source’ method for the measurement of pump pressure ripple characteristics part 1: Description of method. Proc. Inst. Mech. Eng. Part A J. Power Energy 1990, 204, 33–40. [Google Scholar] [CrossRef]
- Kojima, E. A new method for experimental determination of pump fluid-borne noise characteristics. In Proceedings of the 5th Bath International Fluid Power Workshop. Circuit, Components and System Design, Bath, UK, 16–18 September 1992. [Google Scholar]
- Nakagawa, S.; Ichiyanagi, T.; Nishiumi, T. Experimental investigation on effective bulk modulus and effective volume in an external gear pump. In Fluid Power Systems Technology, Proceedings of the BATH/ASME 2016 Symposium on Fluid Power and Motion Control, Bath, UK, 7–9 September 2016; (FPMC2016-1782, 50060, V001T01A043); ASME: New York, NY, USA, 2016. [Google Scholar]
- Zhao, X.; Vacca, A. Theoretical Investigation into the Ripple Source of External Gear Pumps. Energies 2019, 12, 535. [Google Scholar] [CrossRef] [Green Version]
- Corvaglia, A.; Ferrari, A.; Rundo, M.; Vento, O. Three-dimensional model of an external gear pump with an experimental evaluation of the flow ripple. Proc. Inst. Mech. Eng. Part C J. Mech. Eng. Sci. 2021, 235, 1097–1105. [Google Scholar] [CrossRef]
- Zardin, B.; Natali, E.; Borghi, M. Evaluation of the Hydro—Mechanical Efficiency of External Gear Pumps. Energies 2019, 12, 2468. [Google Scholar] [CrossRef] [Green Version]
- Thiagarajan, D.; Vacca, A. Mixed Lubrication Effects in the Lateral Lubricating Interfaces of External Gear machines: Modelling and Experimental Validation. Energies 2017, 10, 111. [Google Scholar] [CrossRef] [Green Version]
- Frosina, E.; Senatore, A.; Rigosi, M. Study of a High-Pressure External Gear Pump with a Computational Fluid Dynamic Modeling Approach. Energies 2017, 10, 1113. [Google Scholar] [CrossRef] [Green Version]
- Borghi, M.; Zardin, B. Axial Balance of External Gear Pumps and Motors: Modelling and Discussing the Influence of Elastohydrodynamic Lubrication in the Axial Gap. In Proceedings of the ASME International Mechanical Engineering Congress and Exposition, Houston, TX, USA, 13–19 November 2015. [Google Scholar]
- Mithun, M.G.; Koukouvinis, P.; Karathanassis, I.K.; Gavaises, M. Numerical simulation of three-phase flow in an external gear pump using immersed boundary approach. Appl. Math. Model. 2019, 72, 682–699. [Google Scholar] [CrossRef] [Green Version]
- Corvaglia, A.; Rundo, M.; Casoli, P.; Lettini, A. Evaluation of Tooth Space Pressure and Incomplete Filling in External Gear Pumps by Means of Three-Dimensional CFD Simulations. Energies 2021, 14, 342. [Google Scholar] [CrossRef]
- Marinaro, G.; Frosina, E.; Senatore, A. A Numerical Analysis of an Innovative Flow Ripple Reduction Method for External Gear Pumps. Energies 2021, 14, 471. [Google Scholar] [CrossRef]
- Mkadara, G.; Maré, J.-C.; Paulmann, G. Methodology for Model Architecting and Failure Simulation Supported by Bond-Graphs—Application to Helicopter Axial Piston Pump. Sustainability 2021, 13, 1863. [Google Scholar] [CrossRef]
- Torrent, M.; Gamez-Montero, P.J.; Codina, E. Parameterization, modeling, and validation in real conditions of an external gear pump. Sustainability 2021, 13, 3089. [Google Scholar] [CrossRef]
- ISO 4409:2007. Hydraulic Fluid Power; Positive Displacement Pumps and Motors; Methods of Testing and Presenting Basic Steady State Performance. (Revised by ISO 4409:2019). Available online: https://www.iso.org/standard/37528.html (accessed on 8 December 2021).
- Rundo, M. Models for Flow Rate Simulation in Gear Pumps: A Review. Energies 2017, 10, 1261. [Google Scholar] [CrossRef] [Green Version]
- Gamez-Montero, P.; Codina, E. Flow characteristics of a trochoidal-gear pump using bond graphs and experimental measurement Part 2. Proc. Inst. Mech. Eng. Part I J. Syst. Control. Eng. 2007, 221, 347–363. [Google Scholar]
- Bryant, M.D.; Lee, S. Resistive field bond graph models for hydrodynamically lubricated bearings. Proc. Inst. Mech. Eng. Part I J. Syst. Control. Eng. 2004, 218, 645–654. [Google Scholar] [CrossRef]
- Hooke, C.J.; Koç, E. End Plate Balance in Gear Pumps. Proc. Inst. Mech. Eng. Part B Manag. Eng. Manuf. 1984, 198, 55–60. [Google Scholar] [CrossRef]
- Gutès, M. Comportamiento de los Cojinetes Hidrodinámicos en Bombas Oleohidraulicas de Engranajes Externos. Ph.D. Thesis, Fluid Mechanics Department—Universitat Politècnica de Catalunya (UPC), Barcelona, Spain, 2008. [Google Scholar]
- Castilla, R.; Gutes, M.; Gamez-Montero, P.J.; Codina, E. Experimental Study of the Shaft Motion in the Journal Bearing of a Gear Pump. ASME J. Eng. Gas Turbines Power 2009, 131, 052502. [Google Scholar] [CrossRef]
- Reynols, O. On the Theory of Lubrication and its Application to Mr. Beauchamp Tower’s Experiments Including an Experimental Determination of olive Oil. Proc. R. Soc. Lond. 1886, 40, 191–203. [Google Scholar]
- Battarra, M.; Mucchi, E. On the assessment of lumped parameter models for gear pump performance prediction. Simul. Model. Pract. Theory 2020, 99, 102008. [Google Scholar] [CrossRef]
- Rituraj, F.; Vacca, A.; Morselli, M.A. Modeling of manufacturing errors in external gear machines and experimental validation. Mech. Mach. Theory 2019, 140, 457–478. [Google Scholar] [CrossRef]
- Vacca, A.; Guidetti, M. Modelling and experimental validation of external spur gear machines for fluid power applications. J. Fluids Eng. 2011, 19, 2007–2031. [Google Scholar] [CrossRef]
- Thiagarajan, D.; Vacca, A.; Watkins, S. On the lubrication performance of external gear pumps for aerospace fuel delivery applications. Mech. Syst. Signal Process. 2019, 129, 659–676. [Google Scholar] [CrossRef]
- Hamrock, B.J. Fundamentals of Fluid Film Lubrication; NASA Office of Management, Scientific and Technical Information Program, 1991. Available online: https://ntrs.nasa.gov/api/citations/19910021217/downloads/19910021217.pdf (accessed on 8 December 2021).
- Sensor Head LS-5041. Available online: https://www.keyence.com/products/measure/micrometer/ls-5000/models/ls-5041/ (accessed on 8 December 2021).
- P-140TA CFA. Available online: https://cm-llamada.es/machines/p-140tt-cfa-piling-rig/ (accessed on 8 December 2021).
- 20SIM Version 4.2; Controllab Products, B.V.: Enchede, The Netherlands. Available online: http://www.rt.el.utwente.nl/20sim (accessed on 8 December 2021).
- Renolin B 10. Available online: https://www.fuchs.com/de/en/product/product/144966-renolin-b-10/ (accessed on 8 December 2021).
- Shell Tellus S2 V 46. Available online: https://www.shell-livedocs.com/data/published/es/81c4c41c-b9f7-40da-9a57-fa8881dbc2da.pdf (accessed on 8 December 2021).
- Barus, C. Isothermals, isopiestics and isometrics relative to viscosity. Am. J. Sci. 1893, 45, 87–96. [Google Scholar] [CrossRef]
- Hydraulic Oil Viscosity Calculator. Available online: https://en.webtec.com/Calculator.aspx (accessed on 8 December 2021).
Figure 1.
Exploded view of an external gear pump: (a) components of a pump (Source: ROQUET Group, S.A.); (b) leakage paths; (c) back side of the bushing (adapted from Torrent et al. [19]).
Figure 1.
Exploded view of an external gear pump: (a) components of a pump (Source: ROQUET Group, S.A.); (b) leakage paths; (c) back side of the bushing (adapted from Torrent et al. [19]).

Figure 2.
Balancing forces on the floating bushing.

Figure 3.
Areas subject to pressure in the floating bushing: (a) S1, the back side area; (b) S2, the between-teeth area; (c) S3, the pressure gradient area between the teeth; and (d) S4, the lateral area between the gear and bushing.
Figure 3.
Areas subject to pressure in the floating bushing: (a) S1, the back side area; (b) S2, the between-teeth area; (c) S3, the pressure gradient area between the teeth; and (d) S4, the lateral area between the gear and bushing.


Figure 4.
(a) Mass flow through a rectangular section; (b) fixed-incline slider bearing; and (c) parallel-surface squeeze film bearing.
Figure 4.
(a) Mass flow through a rectangular section; (b) fixed-incline slider bearing; and (c) parallel-surface squeeze film bearing.

Figure 5.
(a) Test equipment used to measure the floating bushing motion; (b) in-field tests of the LLAMADA P140 drilling rig.
Figure 5.
(a) Test equipment used to measure the floating bushing motion; (b) in-field tests of the LLAMADA P140 drilling rig.

Figure 6.
Bond graph of the floating bushing motion.

Figure 7.
(a) Significant dimensions; (b) gear pump components.

Figure 8.
(a) Analogy with two fixed-incline slide bearings; (b) analogy with two parallel-surface squeeze film bearings.
Figure 8.
(a) Analogy with two fixed-incline slide bearings; (b) analogy with two parallel-surface squeeze film bearings.

Figure 9.
Simplified bond graph of the pump behavior.

Figure 10.
Minimum film thickness: (a) 20 °C, 1000 rpm; (b) 50 °C, 1000 rpm; (c) 20 °C, 1500 rpm; (d) 50 °C, 1500 rpm; (e) 20 °C, 2000 rpm; and (f) 50 °C, 2000 rpm (red line—experimental test, blue line—simulation).
Figure 10.
Minimum film thickness: (a) 20 °C, 1000 rpm; (b) 50 °C, 1000 rpm; (c) 20 °C, 1500 rpm; (d) 50 °C, 1500 rpm; (e) 20 °C, 2000 rpm; and (f) 50 °C, 2000 rpm (red line—experimental test, blue line—simulation).


Figure 11.
Minimum dimensionless film thickness: H0 and height Sh versus P; (a) 1500 rpm 20 °C and (b) 1500 rpm 50 °C.
Figure 11.
Minimum dimensionless film thickness: H0 and height Sh versus P; (a) 1500 rpm 20 °C and (b) 1500 rpm 50 °C.

Figure 12.
Balance of forces on the bushing and displacements (2000 rpm 20 °C).

Figure 13.
Real and simulated behavior in a jib-raising and -lowering cycle (1467 rpm).

Figure 14.
Leakage coefficients and minimum film thickness in a real jib cycle (1467 rpm).

Publisher’s Note: MDPI stays neutral with regard to jurisdictional claims in published maps and institutional affiliations. |
© 2021 by the authors. Licensee MDPI, Basel, Switzerland. This article is an open access article distributed under the terms and conditions of the Creative Commons Attribution (CC BY) license (https://creativecommons.org/licenses/by/4.0/).
Share and Cite
MDPI and ACS Style
Torrent, M.; Gamez-Montero, P.J.; Codina, E. Model of the Floating Bearing Bushing Movement in an External Gear Pump and the Relation to Its Parameterization. Energies 2021, 14, 8553. https://doi.org/10.3390/en14248553
AMA Style
Torrent M, Gamez-Montero PJ, Codina E. Model of the Floating Bearing Bushing Movement in an External Gear Pump and the Relation to Its Parameterization. Energies. 2021; 14(24):8553. https://doi.org/10.3390/en14248553
Chicago/Turabian StyleTorrent, Miquel, Pedro Javier Gamez-Montero, and Esteban Codina. 2021. "Model of the Floating Bearing Bushing Movement in an External Gear Pump and the Relation to Its Parameterization" Energies 14, no. 24: 8553. https://doi.org/10.3390/en14248553
Note that from the first issue of 2016, this journal uses article numbers instead of page numbers. See further details here.