
Analysis of the Effects of Failure of a Gas Pipeline Caused by a Mechanical Damage
by
 , , , and
Andrzej Rusin
1,* ,
,
Katarzyna Stolecka-Antczak
1,
Krzysztof Kapusta
2,
Krzysztof Rogoziński
1 and
Krzysztof Rusin
1 1
Department of Power Engineering and Turbomachinery, Silesian University of Technology, 44-100 Gliwice, Poland
2
Central Mining Institute, 40-166 Katowice, Poland
*
Author to whom correspondence should be addressed.
Energies 2021, 14(22), 7686; https://doi.org/10.3390/en14227686
Submission received: 6 October 2021
/
Revised: 12 November 2021
/
Accepted: 15 November 2021
/
Published: 17 November 2021
(This article belongs to the Special Issue Advanced Techniques and Technologies in Natural Gas Research and Engineering)
Abstract
:Natural gas continues to be one of the basic energy sources used as fuel in the power sector, in industries and in households. The potential and attractiveness of this fuel is gaining special significance in the current energy transitions from coal-based power engineering to power generation based on renewable energy sources. Natural gas is supplied to consumers mainly through a network of pipelines, which ensures a relatively high reliability of the supply. Still, failures occur due to the corrosion of pipeline walls, material defects or human errors, which can result in uncontrolled release of gas. The released gas can trigger dangerous phenomena, such as fires and explosions. This paper presents an analysis of the causes and effects of damage to a medium-pressure pipeline caused by earthworks carried out within an area where a pipeline is located. Holes in the pipeline due to the impact of an excavator bucket are analysed. The impact of the excavator bucket may cause a rupture equal to 50% of the pipeline’s cross-sectional area. Hazard zones related to fires and explosions due to the released natural gas are presented. For the analysed pipeline with a diameter of 0.5 m and a gas pressure of 5 MPa, the range of hazard zones arising due to pipeline damage caused by an excavator bucket can reach about 200 m.
1. Introduction
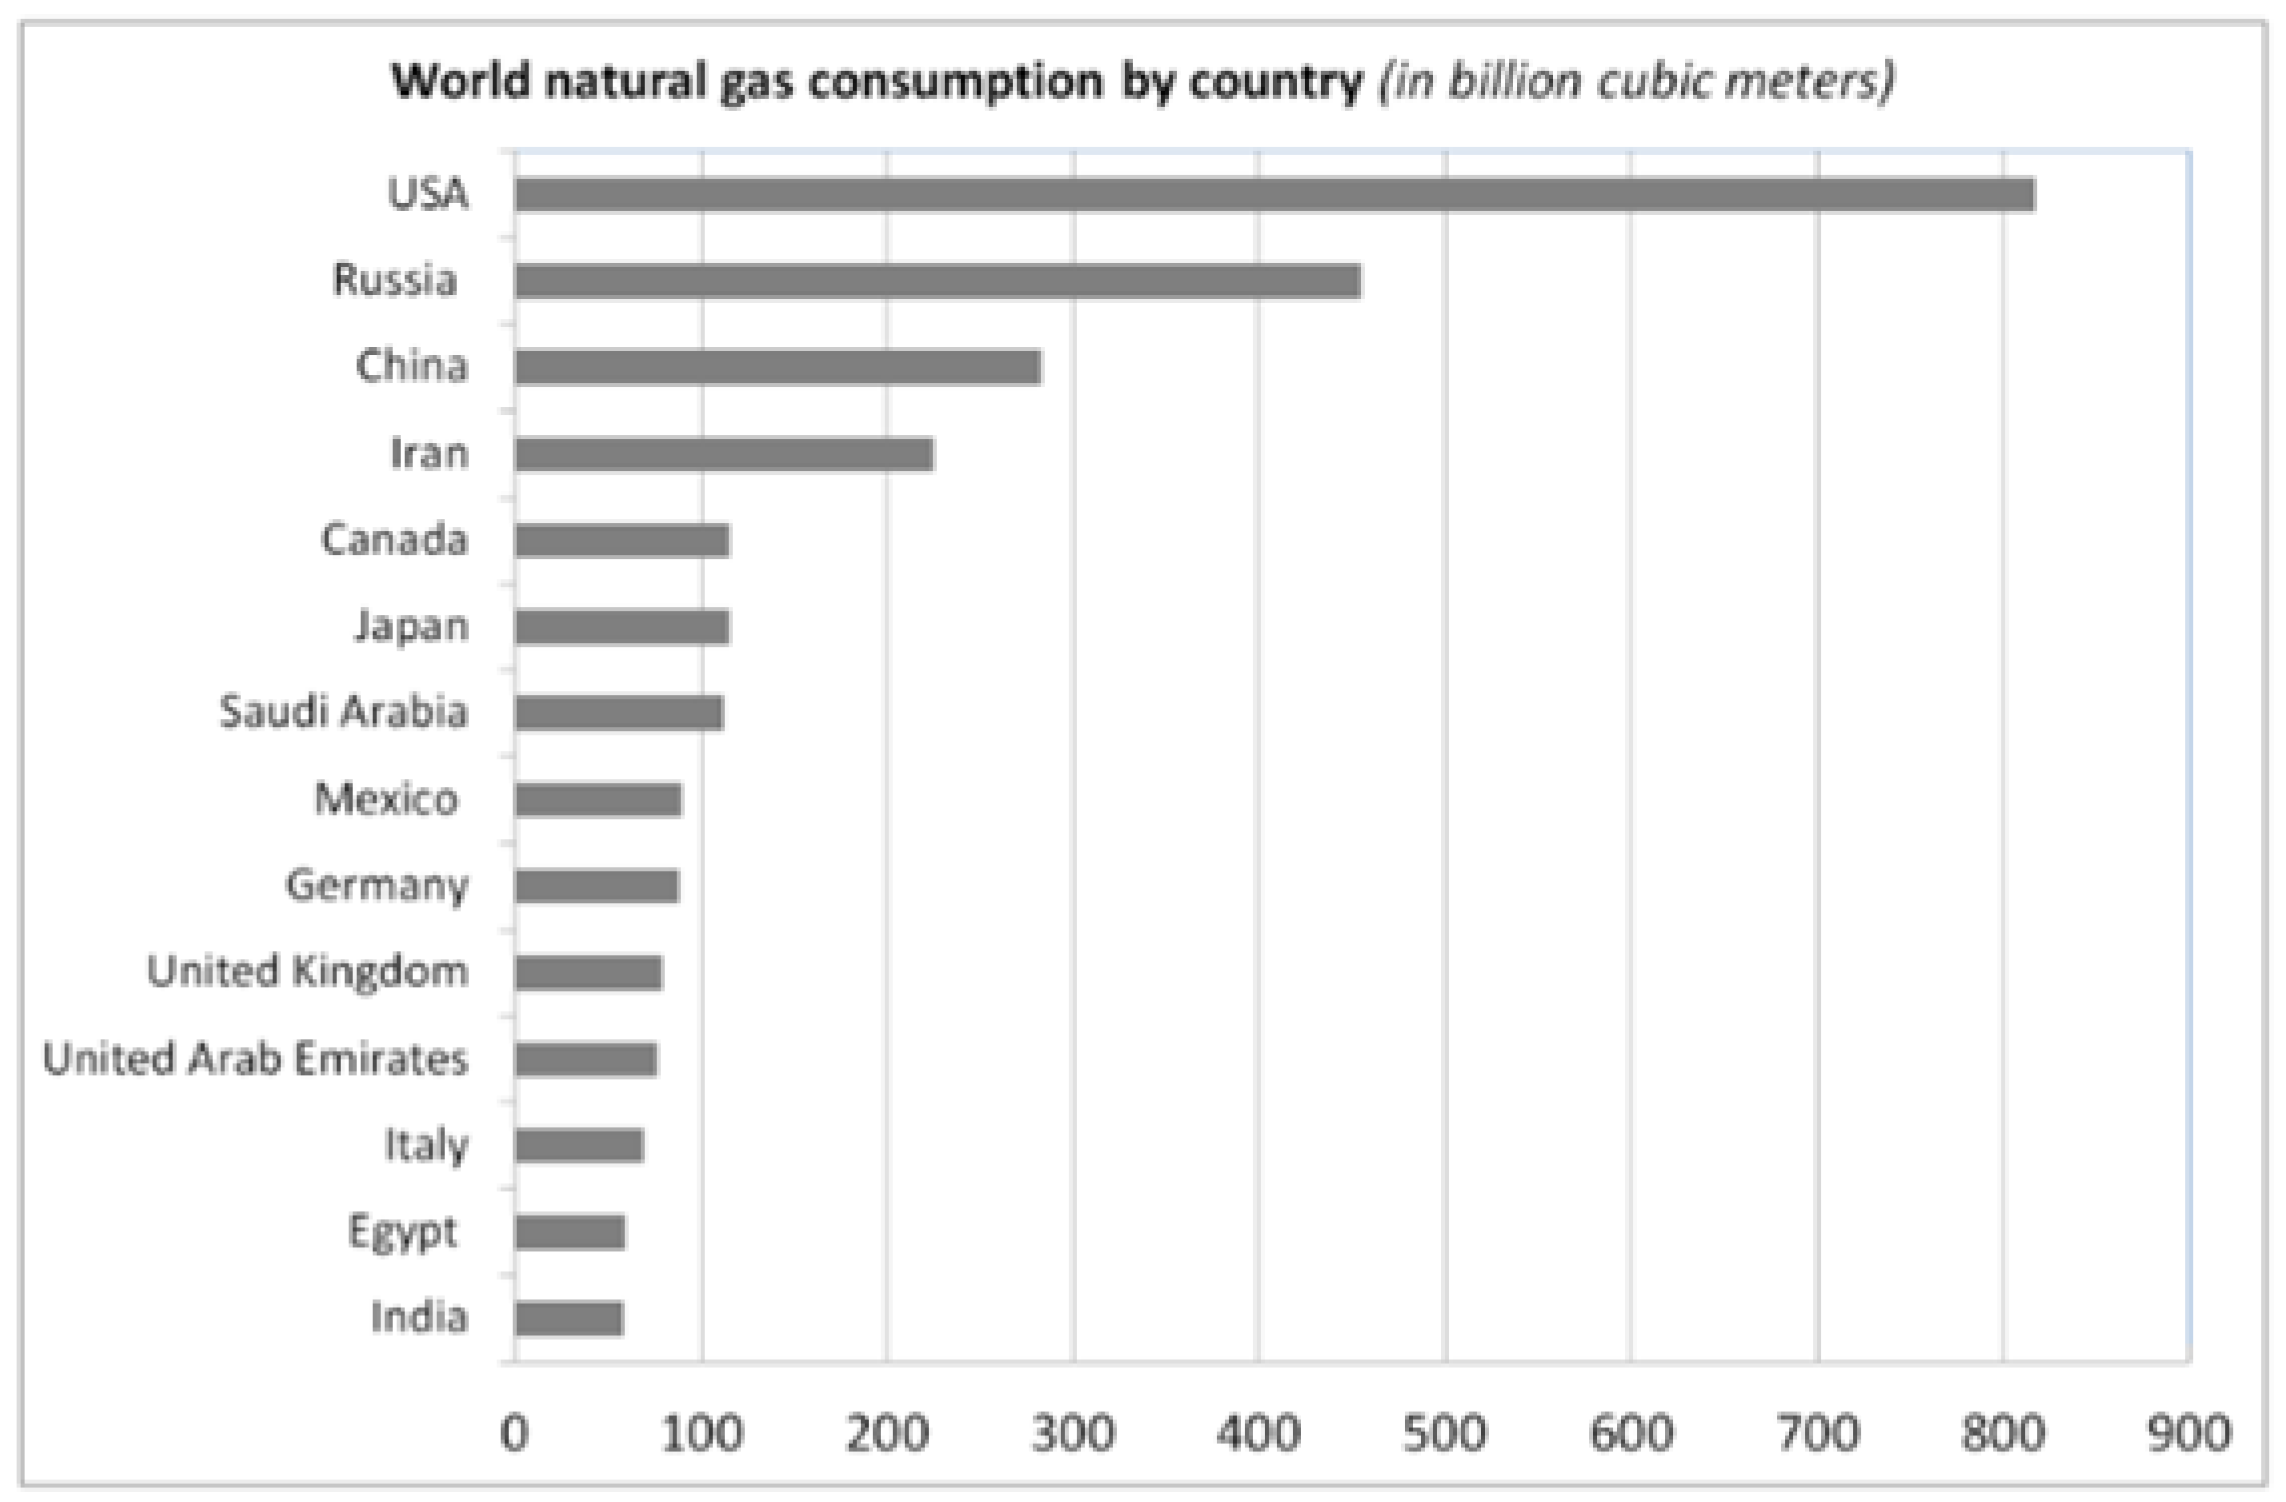
Natural gas continues to be one of the basic energy sources used as fuel in the power sector, in industries and in households. The largest consumer of natural gas in the world is the United States, which consumed about 817 billion cubic metres of gas in 2018. The United States is also one of the largest producers of natural gas in the world, with 761.1 billion cubic meters in 2018 [1]. It is followed by Russia and China, with consumptions of about 450 and 280 billion cubic meters, respectively. The natural gas consumptions of select countries in 2018 are shown in Figure 1 [1].
The growing global consumption of natural gas necessitates an increase in the gas transmission capacity. Both the number and length of gas pipelines as well as their operating parameters have increased. Currently, natural gas is transported by an extensive network of pipelines distributed throughout the world [2]. This method of natural gas transportation is the most economical and reliable way to deliver large quantities of this medium to commercial and domestic customers [3].
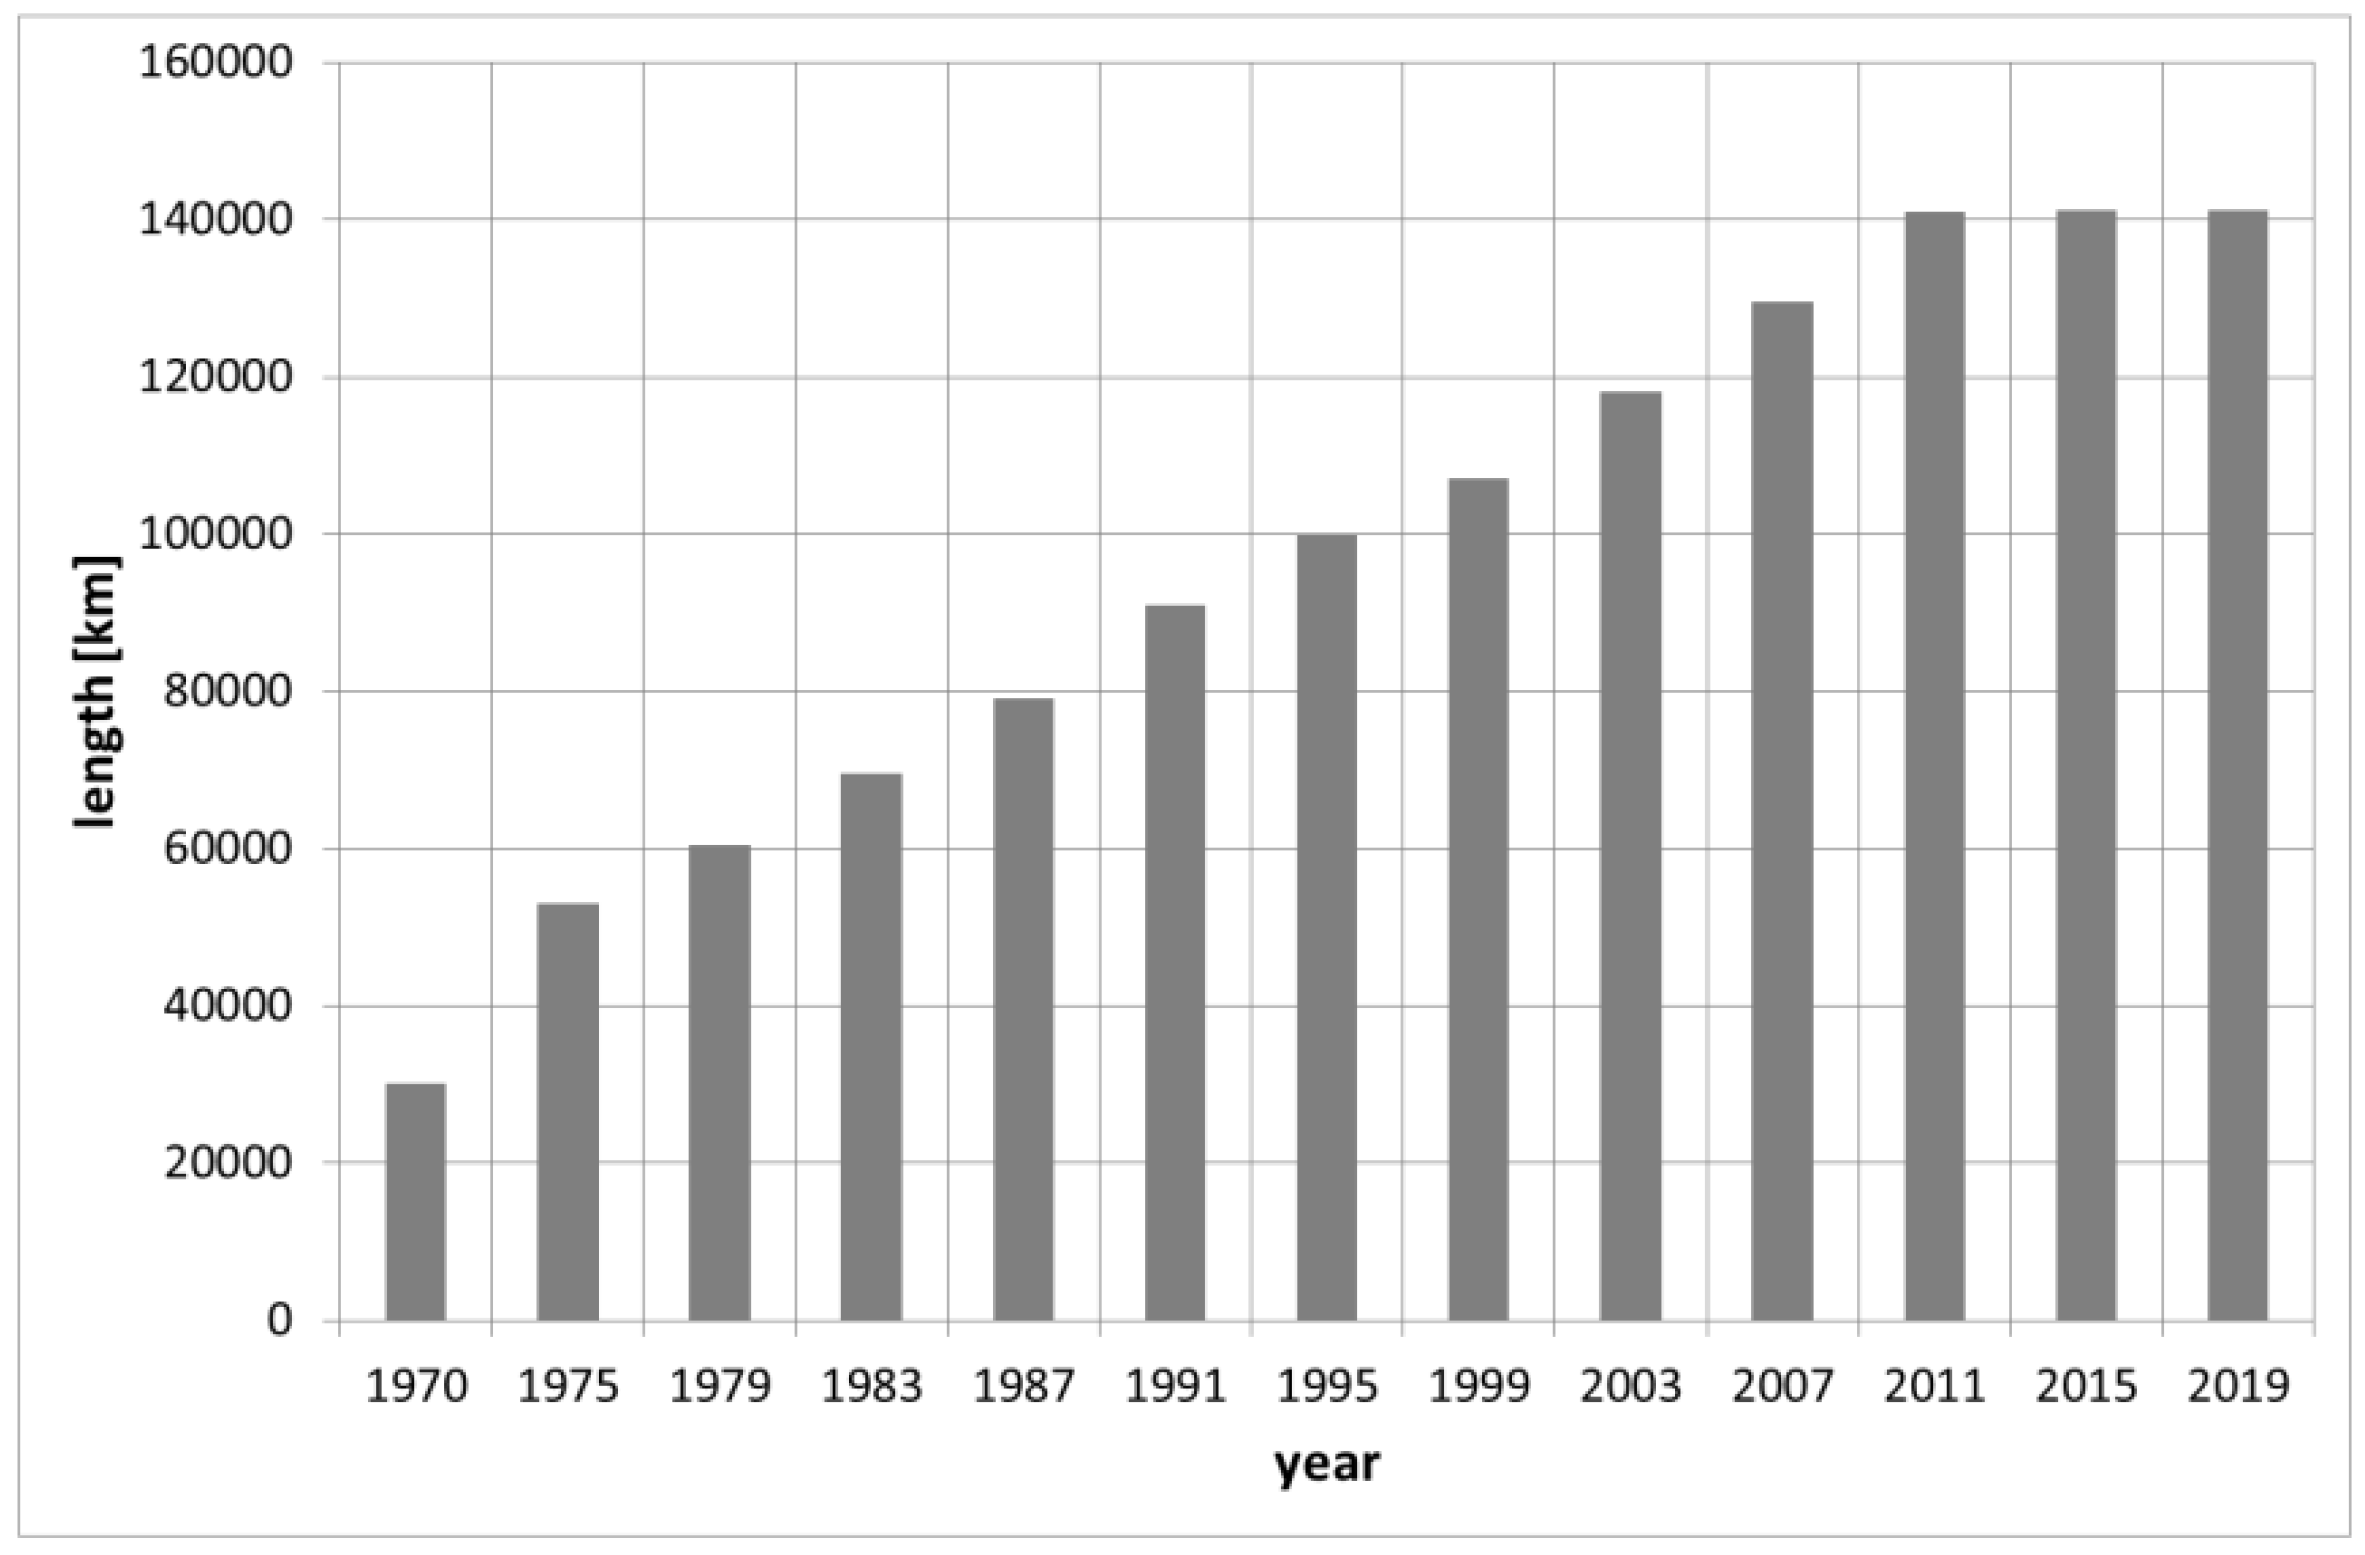
Established in 1982, the European Gas Pipeline Incident Data Group (EGIG) [4], which currently brings together seventeen operators of European transmission networks, reported that, in 2000, the total length of pipelines in Europe was just over 100,000 km. In 2019, this number increased to just over 143,000 km (cf. Figure 2).
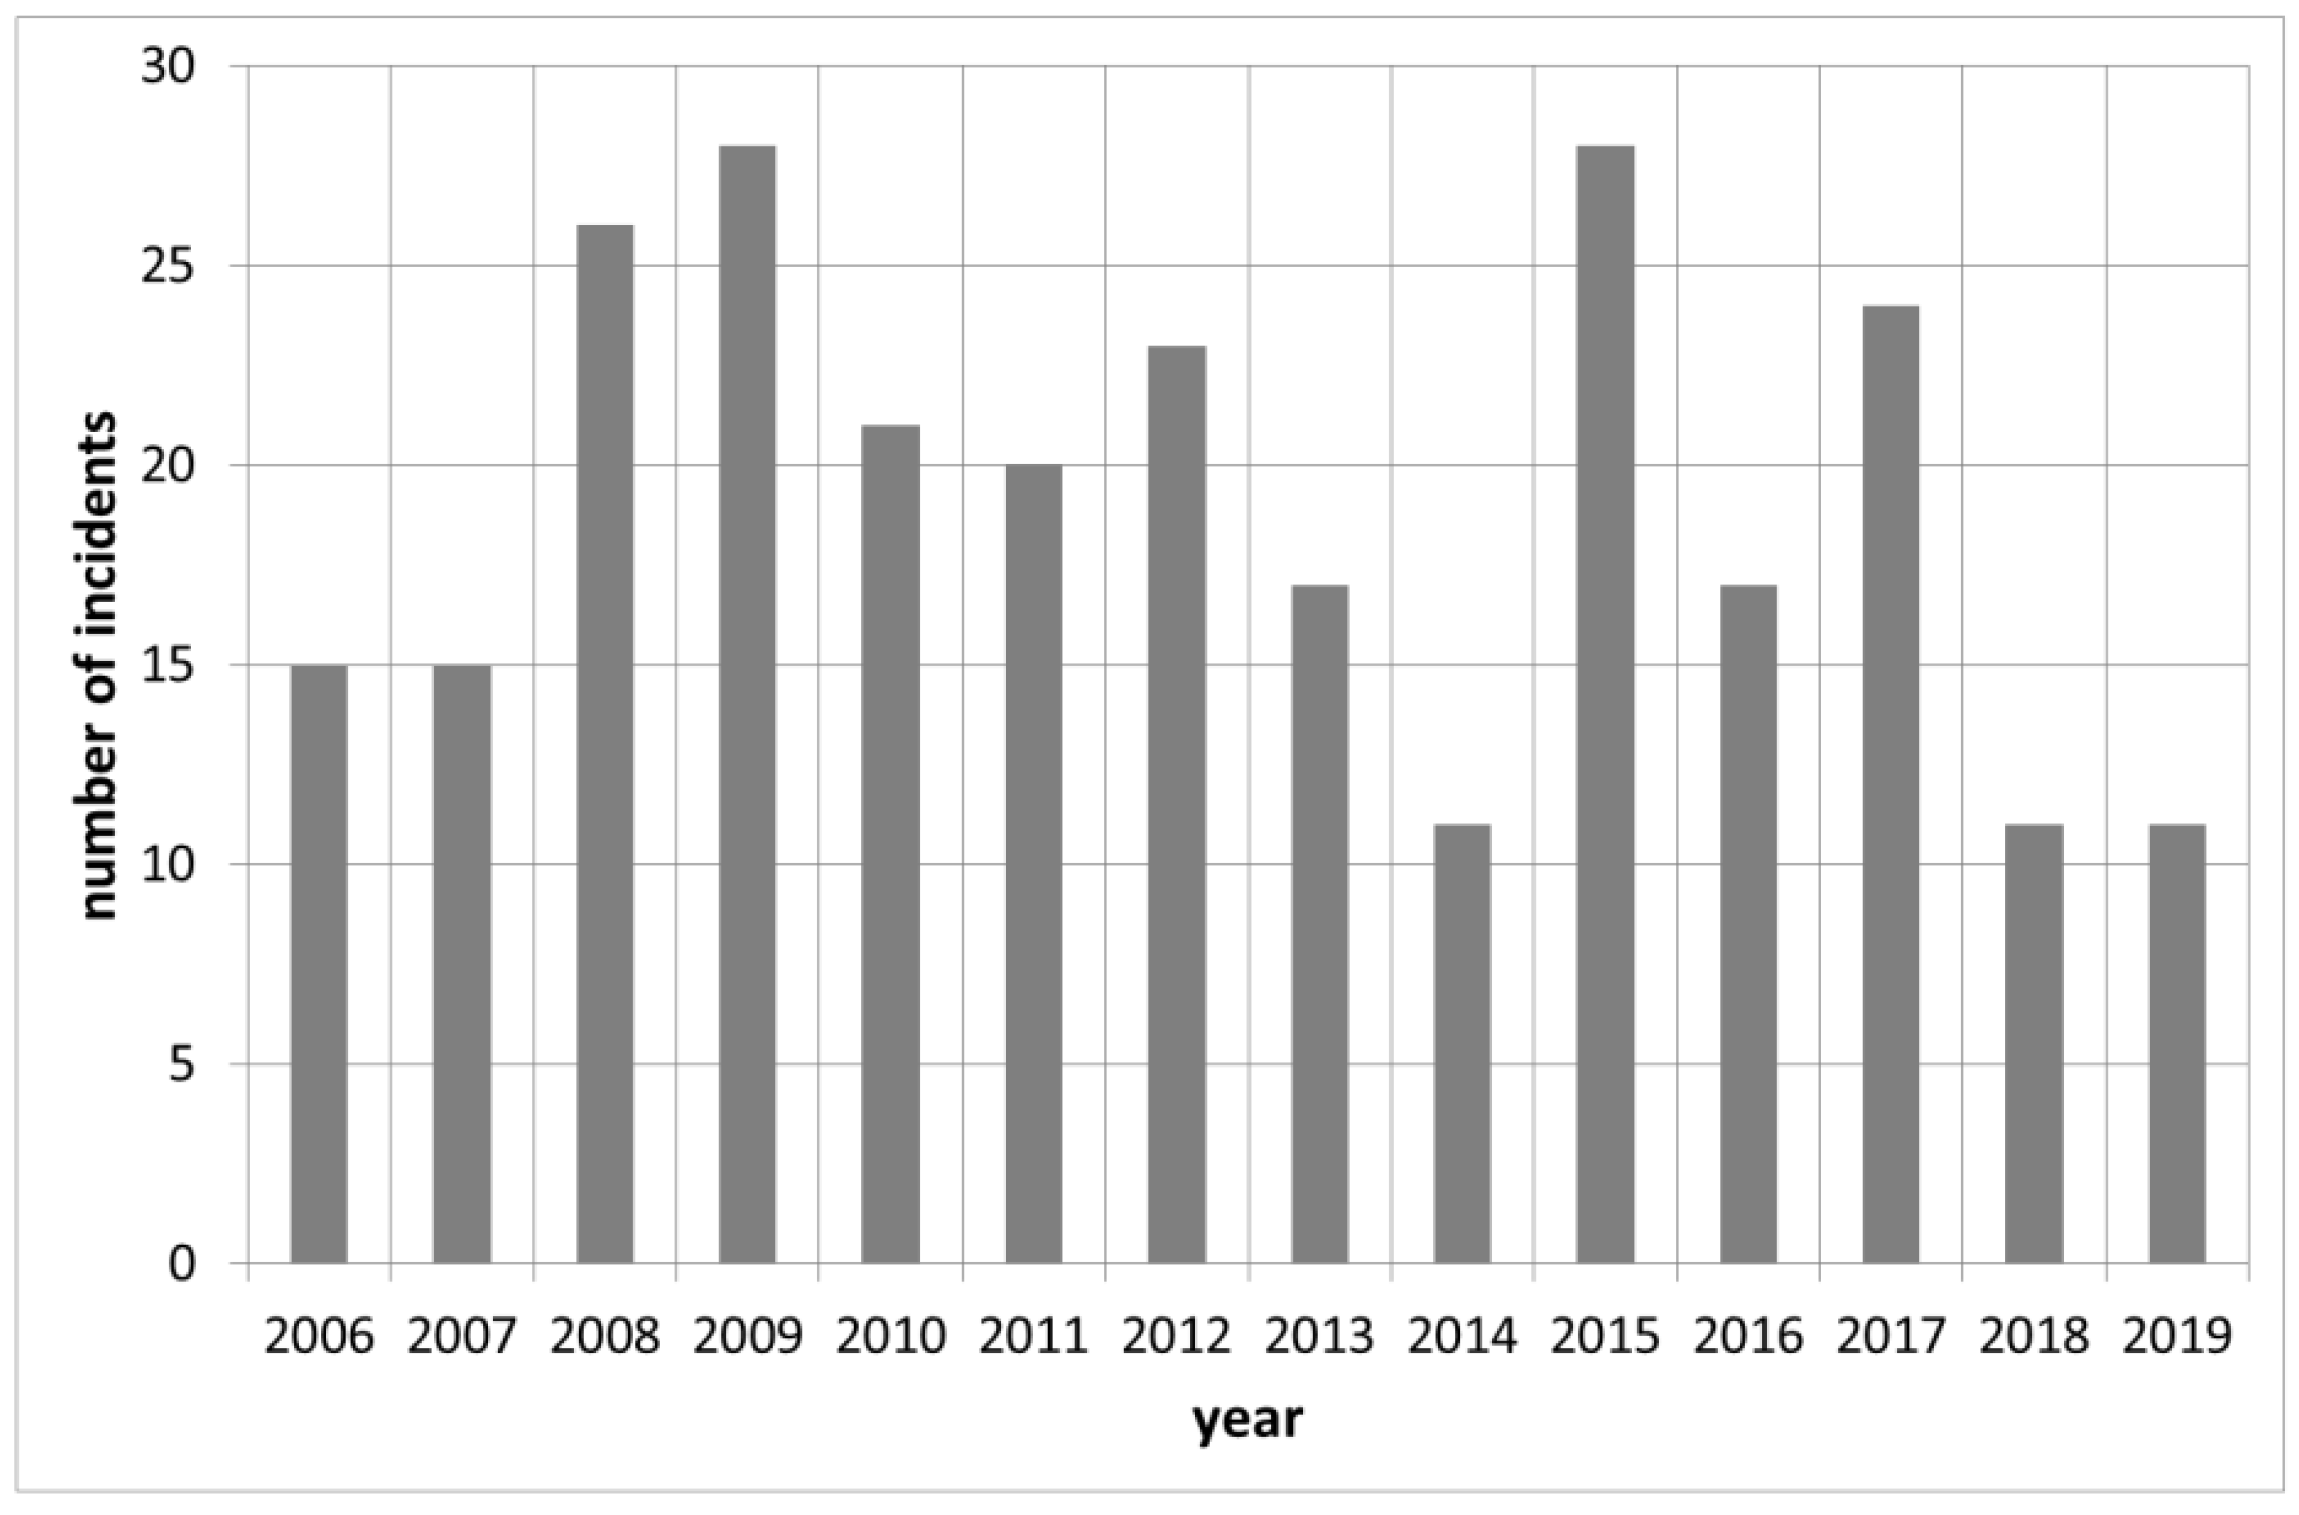
Despite many safety measures currently applied in the design, construction and operation of gas pipelines, such as continuous monitoring of their technical state or the use of new, more resistant materials to make them, it is impossible to ensure failure-free transmission of natural gas; 1366 incidents related to gas pipelines were recorded between 1970 and 2016 in the EGIG database.
The overall failure rate during that period was 0.31 failures per 1000 km per year [4]. It should be noted that the database keeps records of incidents leading to accidental releases of gas from onshore pipelines made of steel and characterised by operating pressures higher than 15 bar. Figure 3 shows the number of events involving gas pipeline damage recorded in the EGIG database from 2006 to 2019.
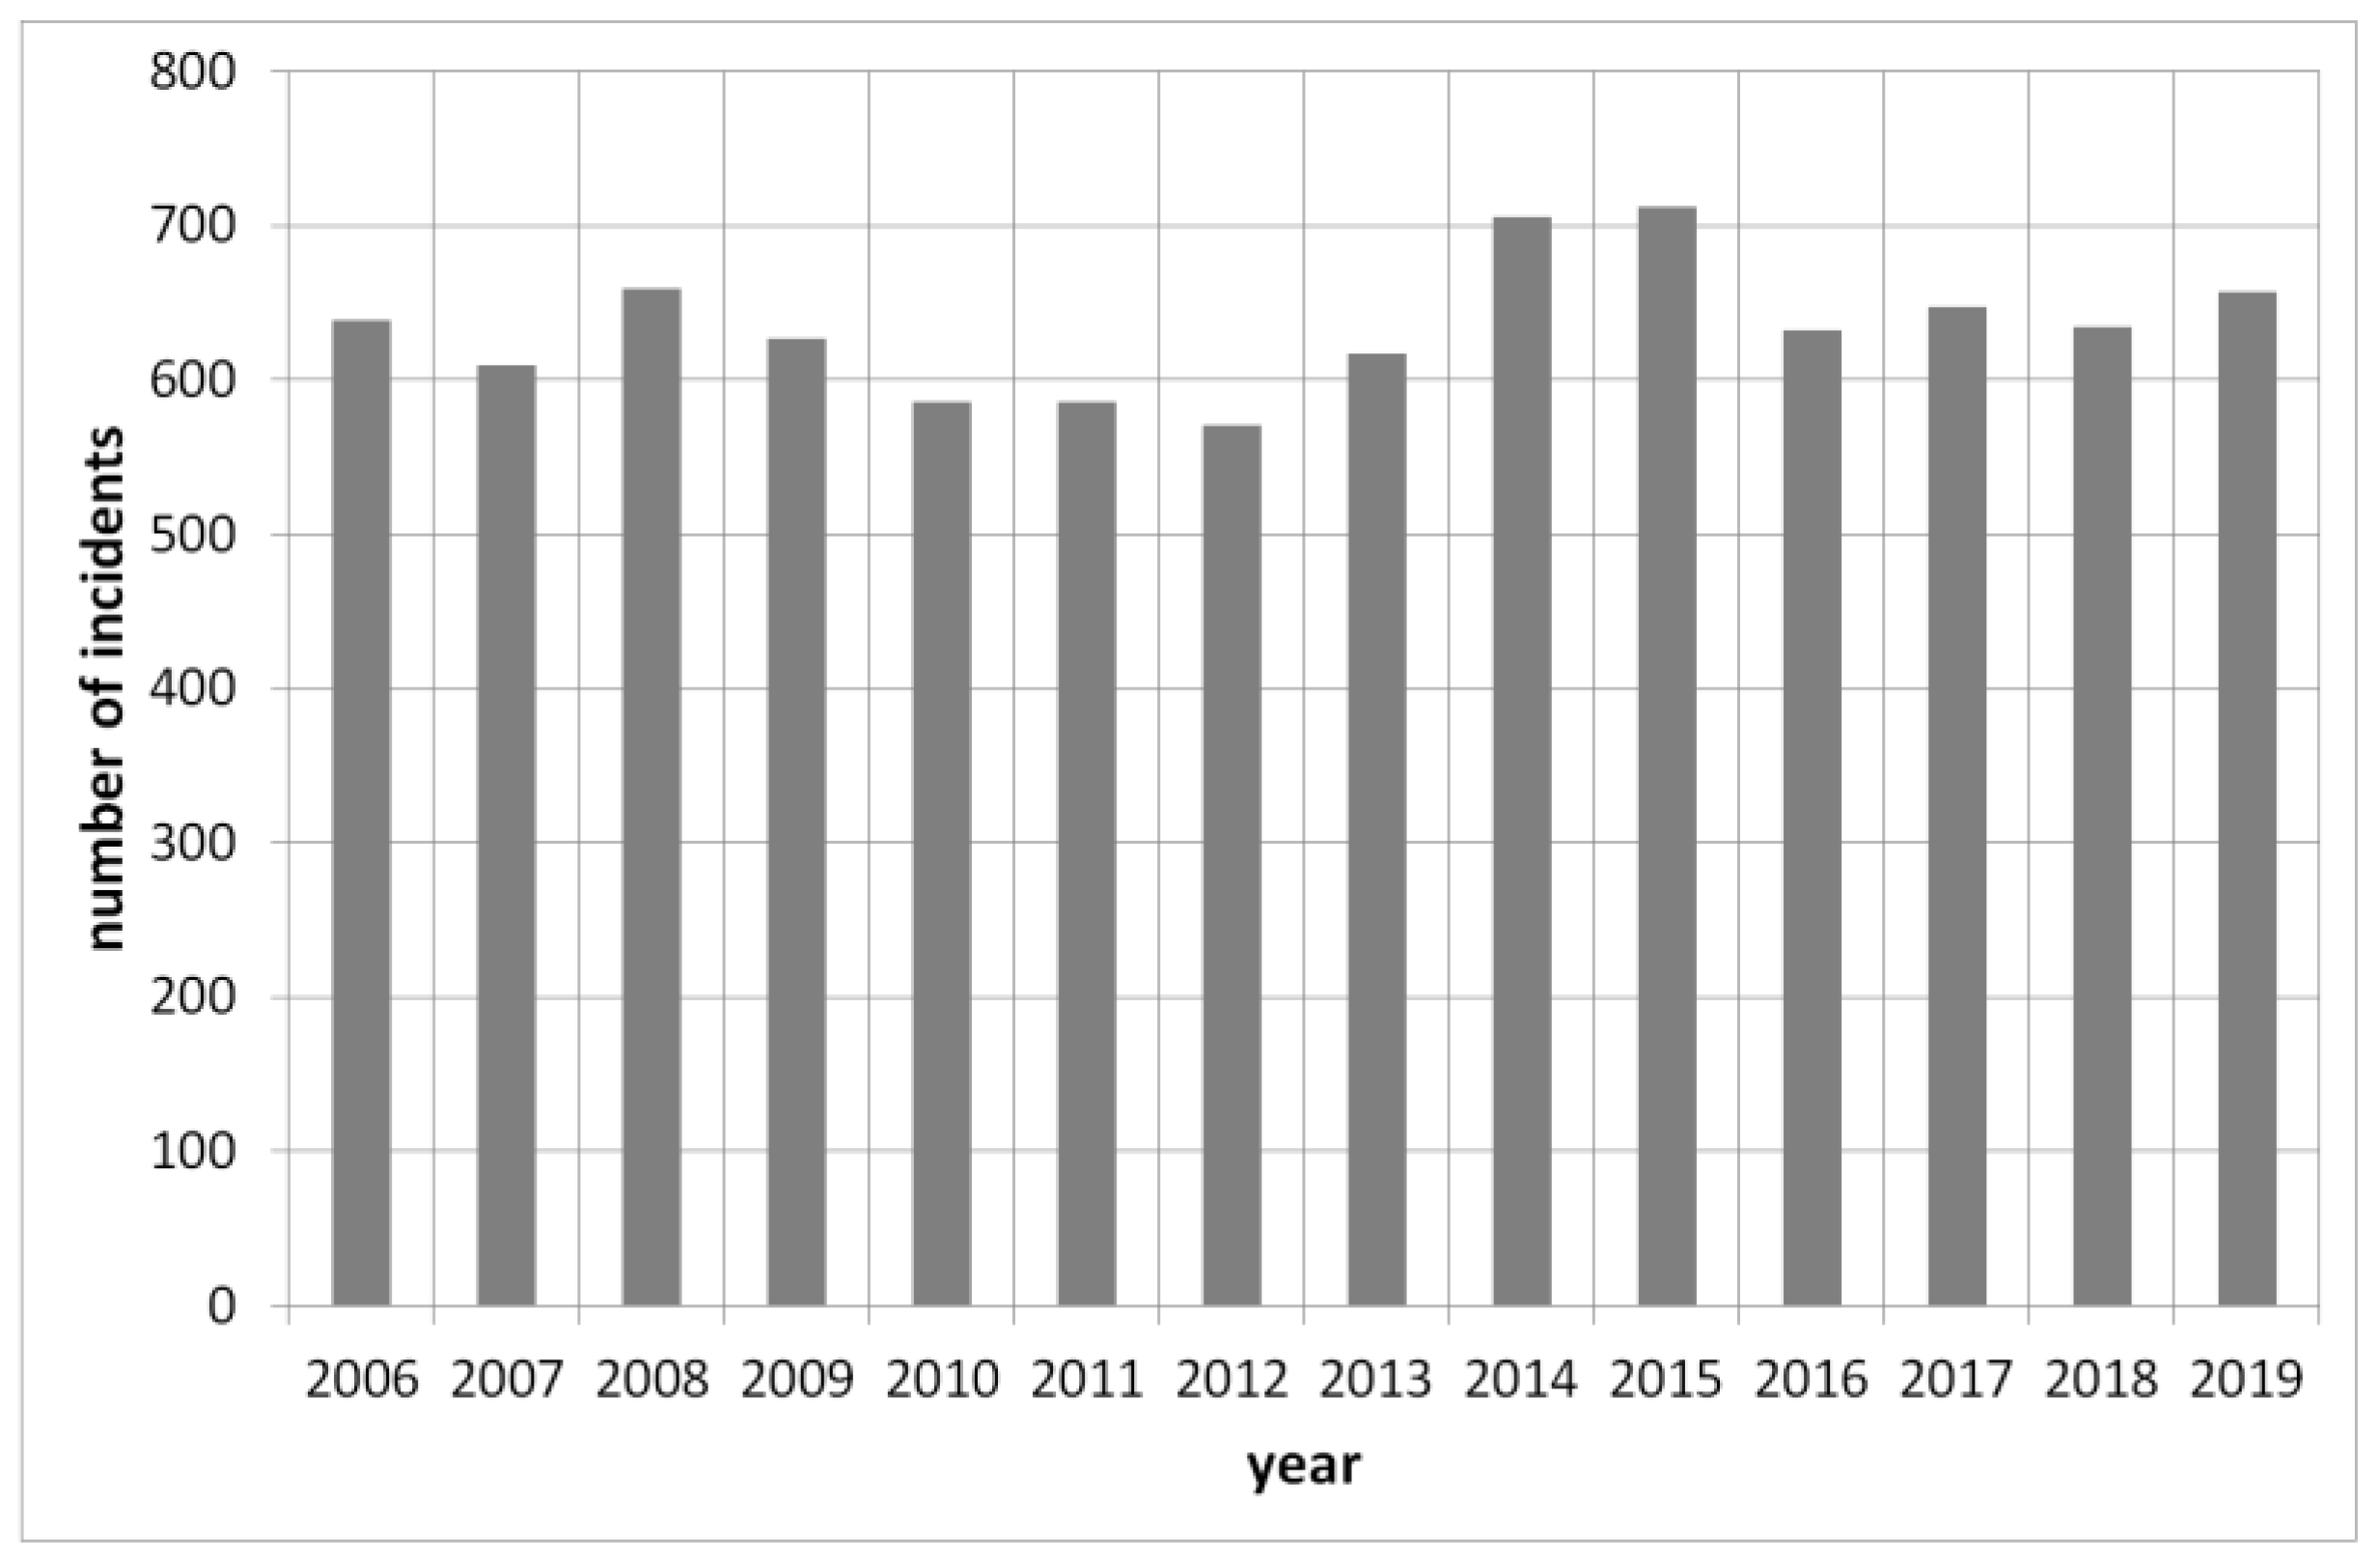
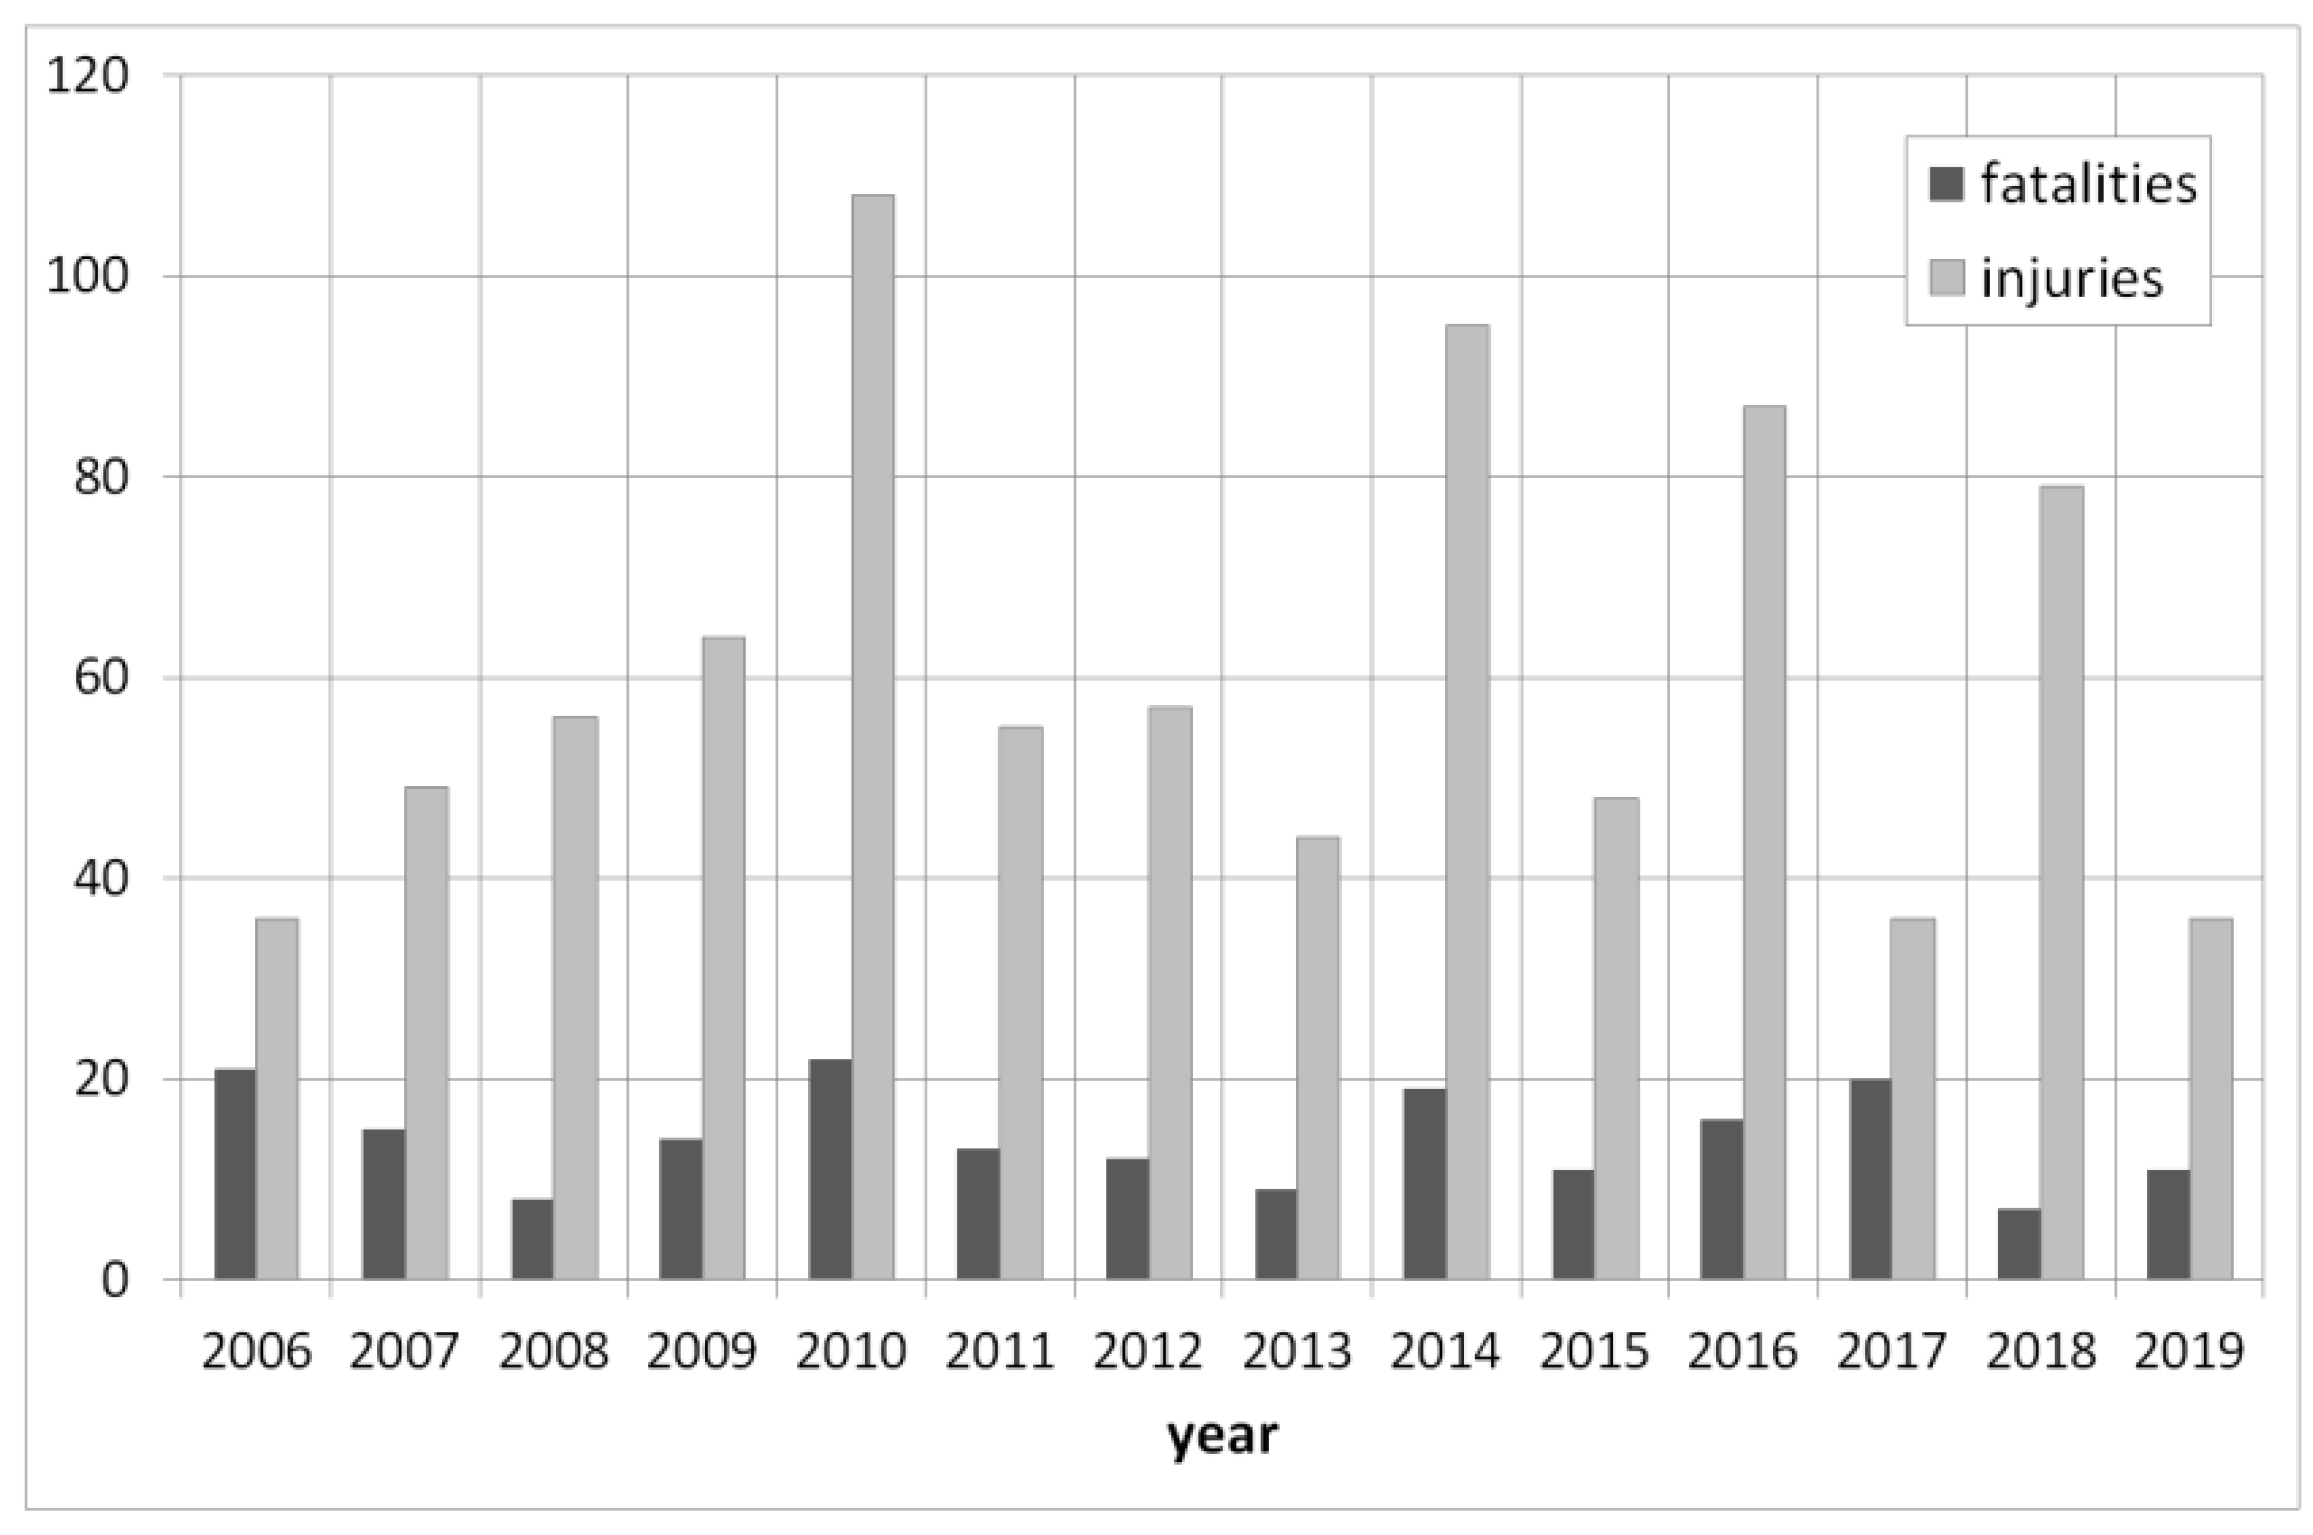
The next two figures show the U.S. data on the number of incidents (Figure 4) and the number of casualties (killed and injured) in 2000–2019 (Figure 5) [3,5].
Failures in the natural gas transport infrastructure depend on many factors. The main problem is the ageing of gas pipelines, but corrosion and interference by third parties are also significant issues.
A general overview of the causes of failure in the global gas industry was presented in [8], for example. A statistical analysis of accidents in the U.S. gas transmission system in the years 2004–2015 was presented in [9], and the 10 largest accidents related to a pipeline failure in history were discussed in [10]. Probabilistic models calculating the probability of damage to gas pipelines were presented in [11,12].
Detailed analyses of the causes of gas pipeline damage and failure are also the subject of many recent papers. For example, the cause of a gas pipeline failure due to a longitudinal weld crack was investigated in [13]. A study on one of the causes of stress corrosion generated in the zone of mechanical damage to a pipeline was conducted in [14]. An analysis of corrosion as a factor causing pipeline failure was also presented in [15,16]. The papers in [17,18] focused on gas pipeline damage due to mechanical factors. Experimental and numerical studies on the dynamic response of an underground gas pipeline under loading due to an excavator were described in [17]. A stress-and-strain analysis of buried polyethylene pipelines affected by mechanical excavation was performed in [18].
This paper presents an analysis of the causes and effects of damage to a medium-pressure pipeline caused by earthworks carried out within the area in which the pipeline is located. Holes in the pipeline due to the impact of an excavator bucket on the pipeline surface are analysed. This is one of the most common causes of damage to gas and other underground pipelines. The size of the pipeline damage caused by the impact and the range of the effects of uncontrolled release of gas are estimated.
2. Causes and Effects of Damage to Pipelines
2.1. Causes of Pipeline Damage
As already mentioned, the rising demand for natural gas involves the development of a system of pipelines to supply this fuel to an increasing number of customers. A large and complex network of gas pipelines is prone to failures, which affect the regularity of fuel supply and may disrupt customers’ operations.
A pipeline failure is understood as a failure related to the gas transmission network causing a sudden change in the pipeline technical state and posing a hazard to human health and life as well as to the environment. The causes of pipeline failures can be divided into three basic groups: damage due to corrosion, mechanical damage and third party interference/errors. Another criterion for pipeline damage is the division into intra- and extra-systemic failures.
The first group includes damage due to weld defects, material defects or defects of the pipeline fittings. These occur primarily as a result of irregularities during the pipeline construction and repair. This group of damage also includes corrosion damage—a phenomenon that may occur both on the inner and outer surfaces of the pipe wall in steel pipelines. It may take the form of stress corrosion, electrochemical corrosion or chemical corrosion. Corrosion may occur in the form of pitting (point corrosion) and uniform corrosion (with regular and uniform loss of metal from the corroding surface of the pipeline). These processes are often triggered by damage to and scratches or micro-cracks in the structure of the gas pipeline surface [6,19,20]. Intra-systemic causes of gas pipeline failures also include damage related to instability of the pipeline placement in the ground.
The group of extra-systemic threats includes unintentional or intentional human activity, such as acts of vandalism, terrorist actions, theft and accidental damage caused in the course of engineering or construction work. This group of causes of damage to pipelines also includes hazards related to the impact of natural forces, i.e., land displacement due to earthquakes, movement of rock masses or land subsidence due to floods [4,6,7,21,22,23].
2.2. Accidents in the Gas Sector
Gas pipeline safety is an important element in the reliable supply of gas to consumers, meeting the requirements of the supply chain, as well as minimising the hazards posed to people and the environment due to uncontrolled release of natural gas. The properties of natural gas may contribute to the occurrences of fires and explosions and, consequently, to significant property damage and loss of human life and health.
2.3. Causes of Pipeline Damage
As indicated by the events presented above, due to the physicochemical properties of natural gas, pipeline damage can result in significant property damage and loss of human life and health.
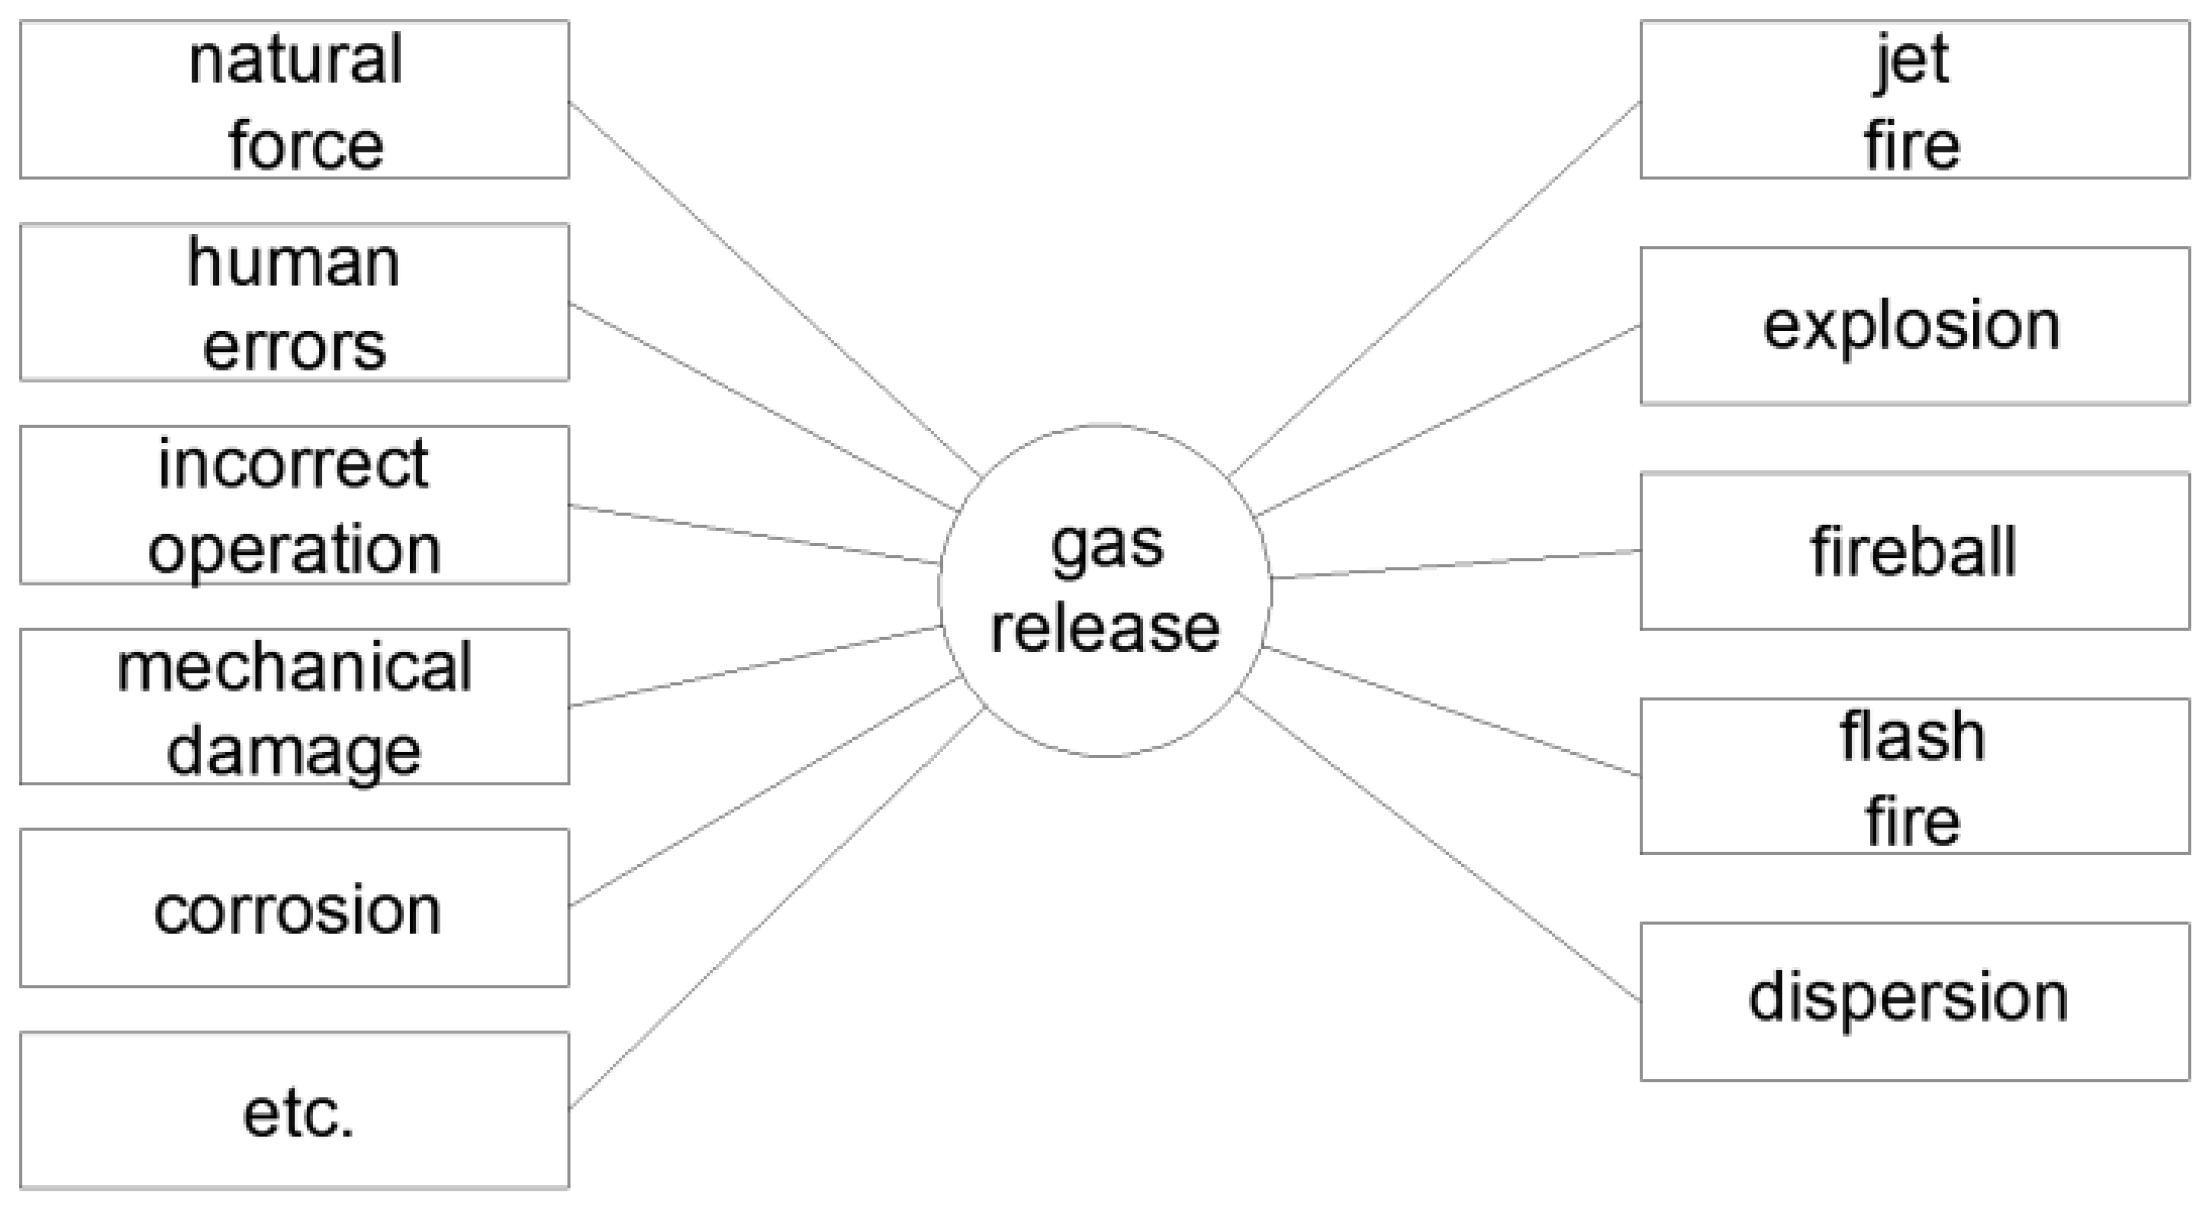
The dangerous effects of events triggered by natural gas leakage and ignition intensify if damage to the gas network occurs in a populated area. Failures also involve economic losses incurred by businesses due to interruptions in gas supply. The kind of hazard created depends on the course of the failure, the cause and type of damage, the gas pipeline size, etc. An important factor affecting the development of a scenario in which a hazardous event is triggered by a leakage of natural gas is the presence of ignition sources in the leakage area and the moment when a cloud of the released gas ignites. Immediate ignition results in a fire, whereas delayed ignition results in an explosion (Table 3). If there is no ignition, the released gas disperses into the atmosphere (cf. Figure 7).
3. Analysis of Gas Pipeline Damage Caused by the Impact of an Excavator
3.1. Estimation of the Size of Damage
The starting event that leads to uncontrolled leakage of natural gas from a transport pipeline is partial or complete damage (pinhole-crack (puncture) or rupture). The size of the damage to the gas pipeline determines the amount of gas released and, therefore, the range of potential hazard zones. For this reason, an estimation of the size of damage to pipelines, especially those running through urbanised areas, is an important issue. As indicated by the literature data presented above, in these areas, gas pipelines often become damaged during construction works when an excavator bucket hits the pipe surface.
To estimate the consequences of such an event, the impact of an excavator bucket on a medium-pressure gas pipeline was simulated. A pipeline with a diameter of 0.5 m, a wall thickness of 10 mm and a gas internal pressure of 5 MPa was assumed for the analysis. The material elastic-plastic behaviour and the material destruction were simulated using the Johnson–Cook model described, among others, in [26,27].The calculations were performed in the ANSYS software [28].
A 600 mm wide excavator bucket made of a 10 mm thick metal plate was assumed. The leading edge was 3 mm thick. It was equipped with four teeth with a profile adopted from the catalogue data of the CAT company, Stockton, CA, USA (cf. Figure 8). The numerical model used a section of the bucket, mapped as a rigid body.
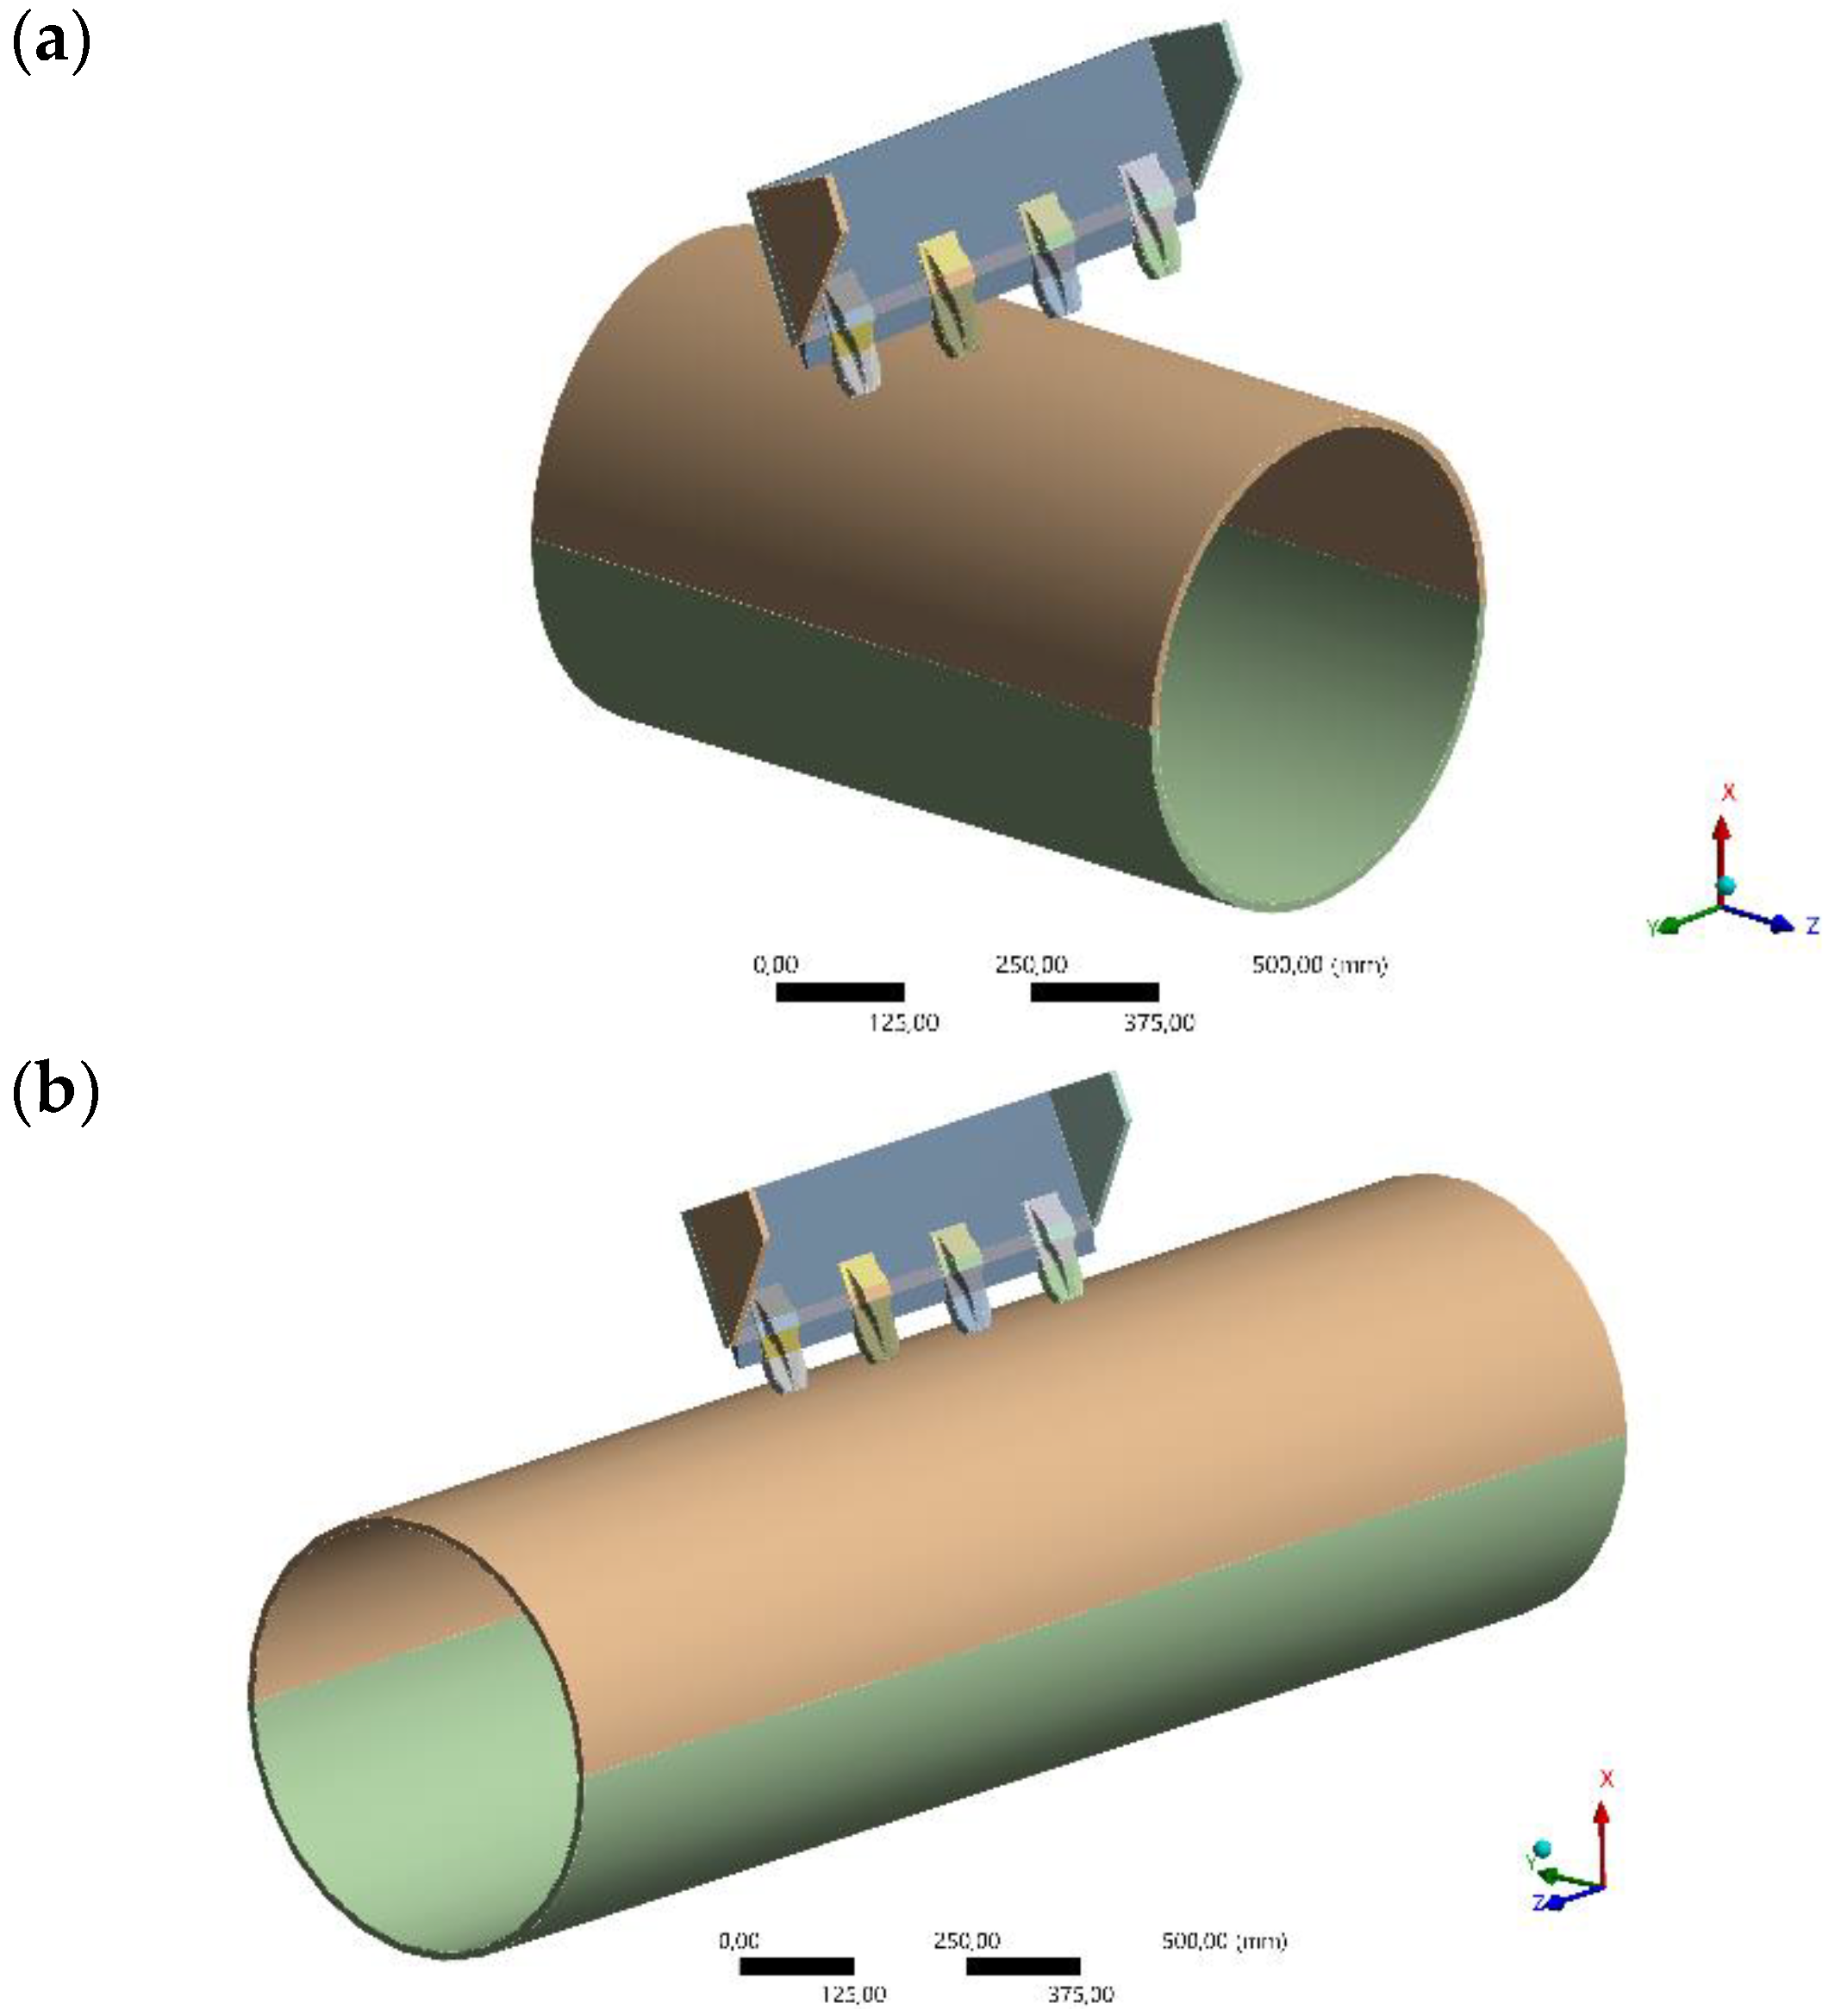
The numerical mesh of the pipeline consists of 10 × 10 mm hexahedral elements. The pressure of 5 MPa on the pipeline inner surface was assumed as the boundary condition. The pipeline was restrained at both ends and on the surface of the bottom half of the pipe using the fixed-support method. Three variants in the positioning of the excavator bucket in relation to the pipeline were considered (cf. Figure 9):
A simulation is presented for each variant of pipeline damage due to the bucket falling with the excavator arm, with a mass of 1000 kg from a height of 1000 mm. To simulate the movement of the machine arm, it is assumed that the bucket rotation point is 5000 mm from the bucket’s centre of gravity.
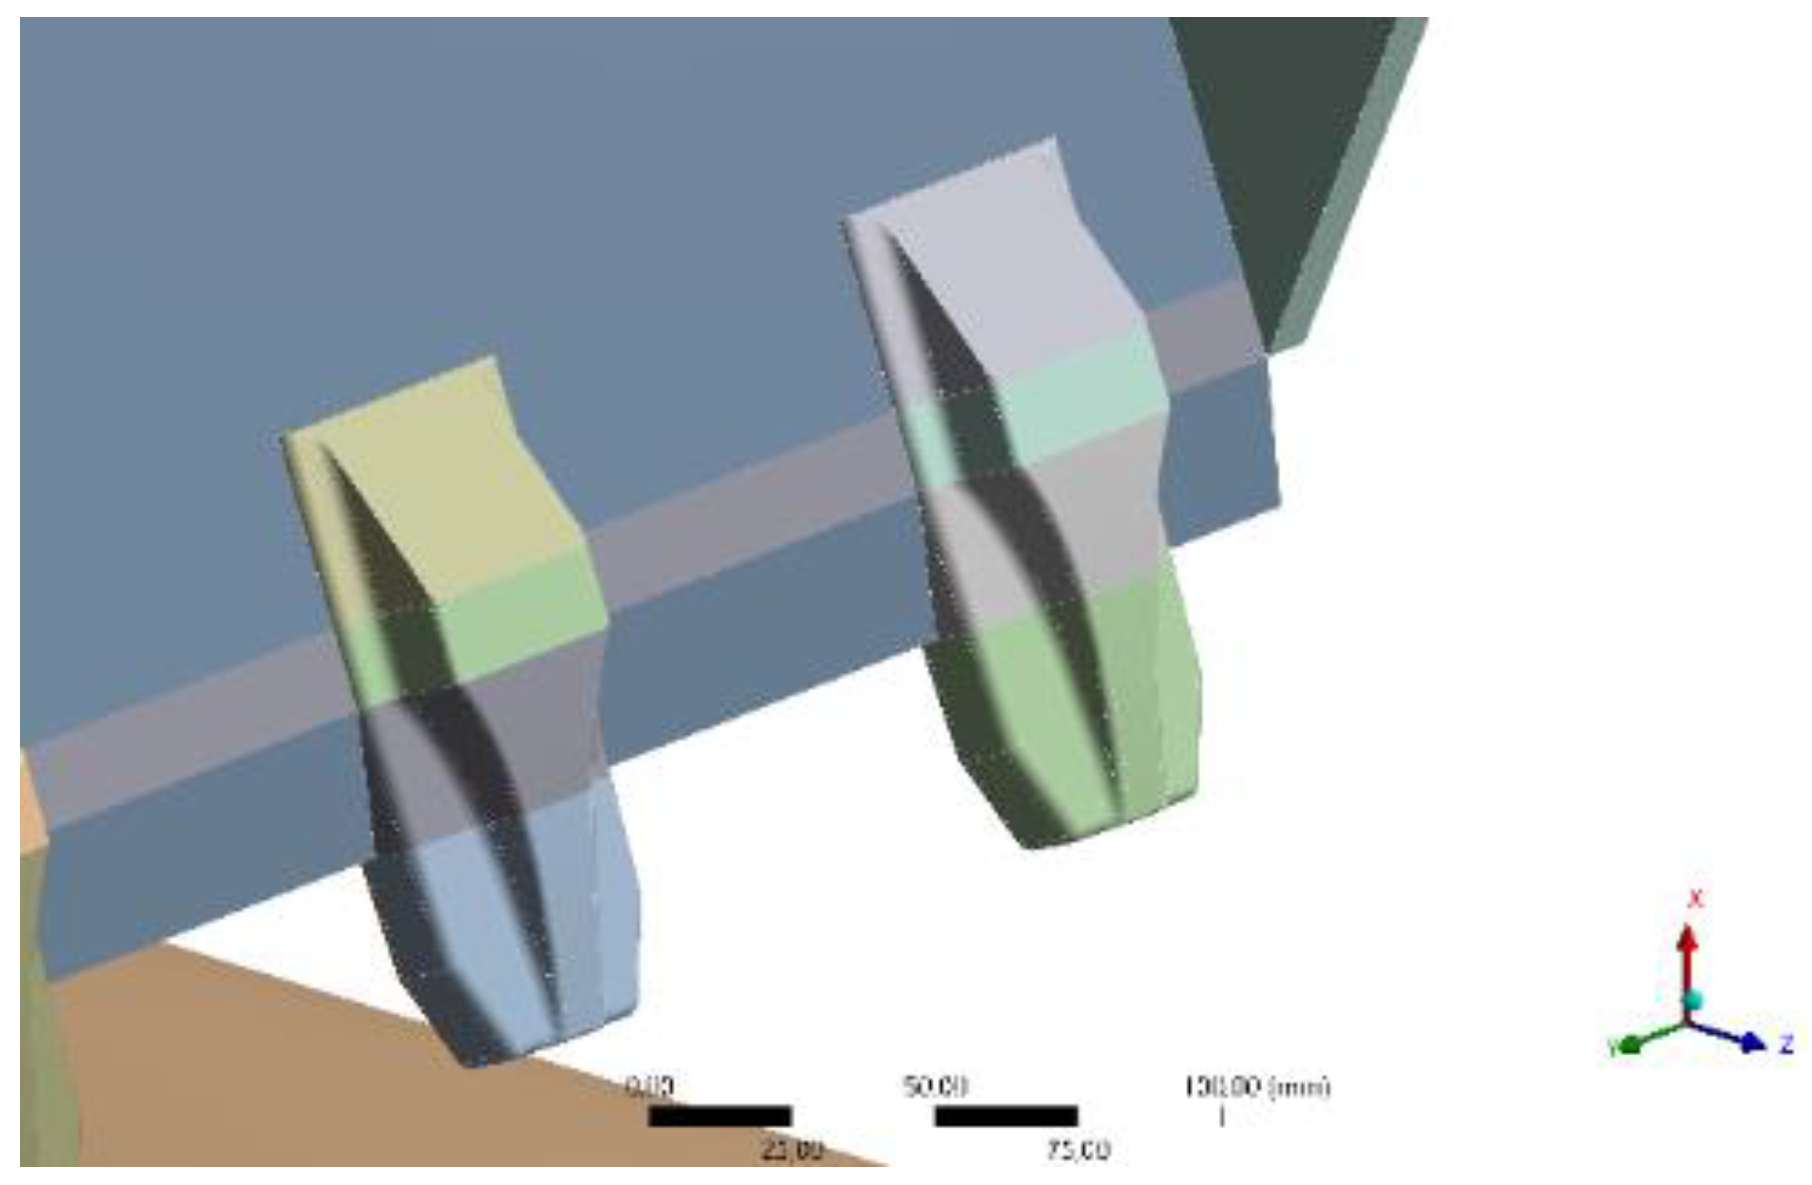
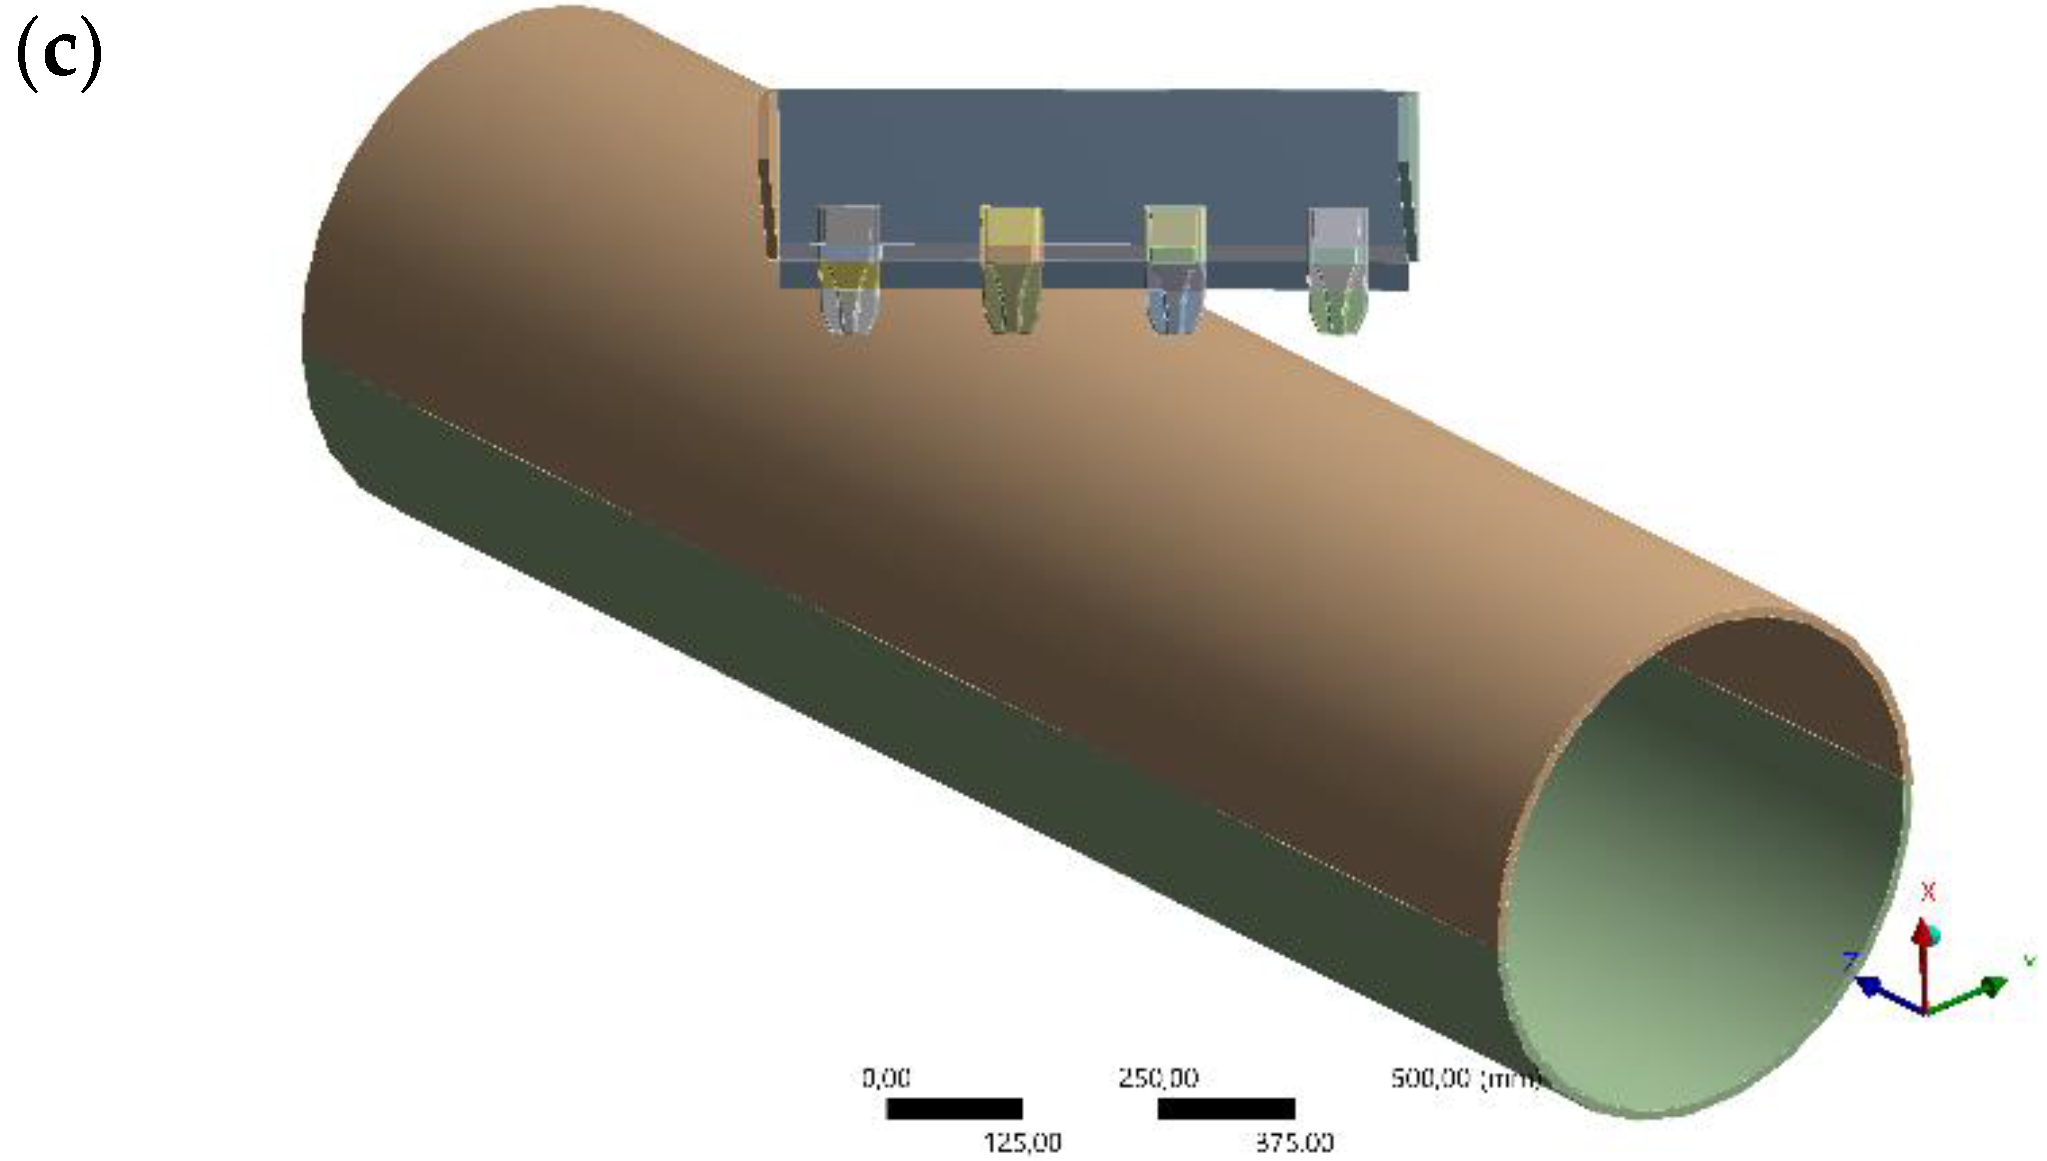
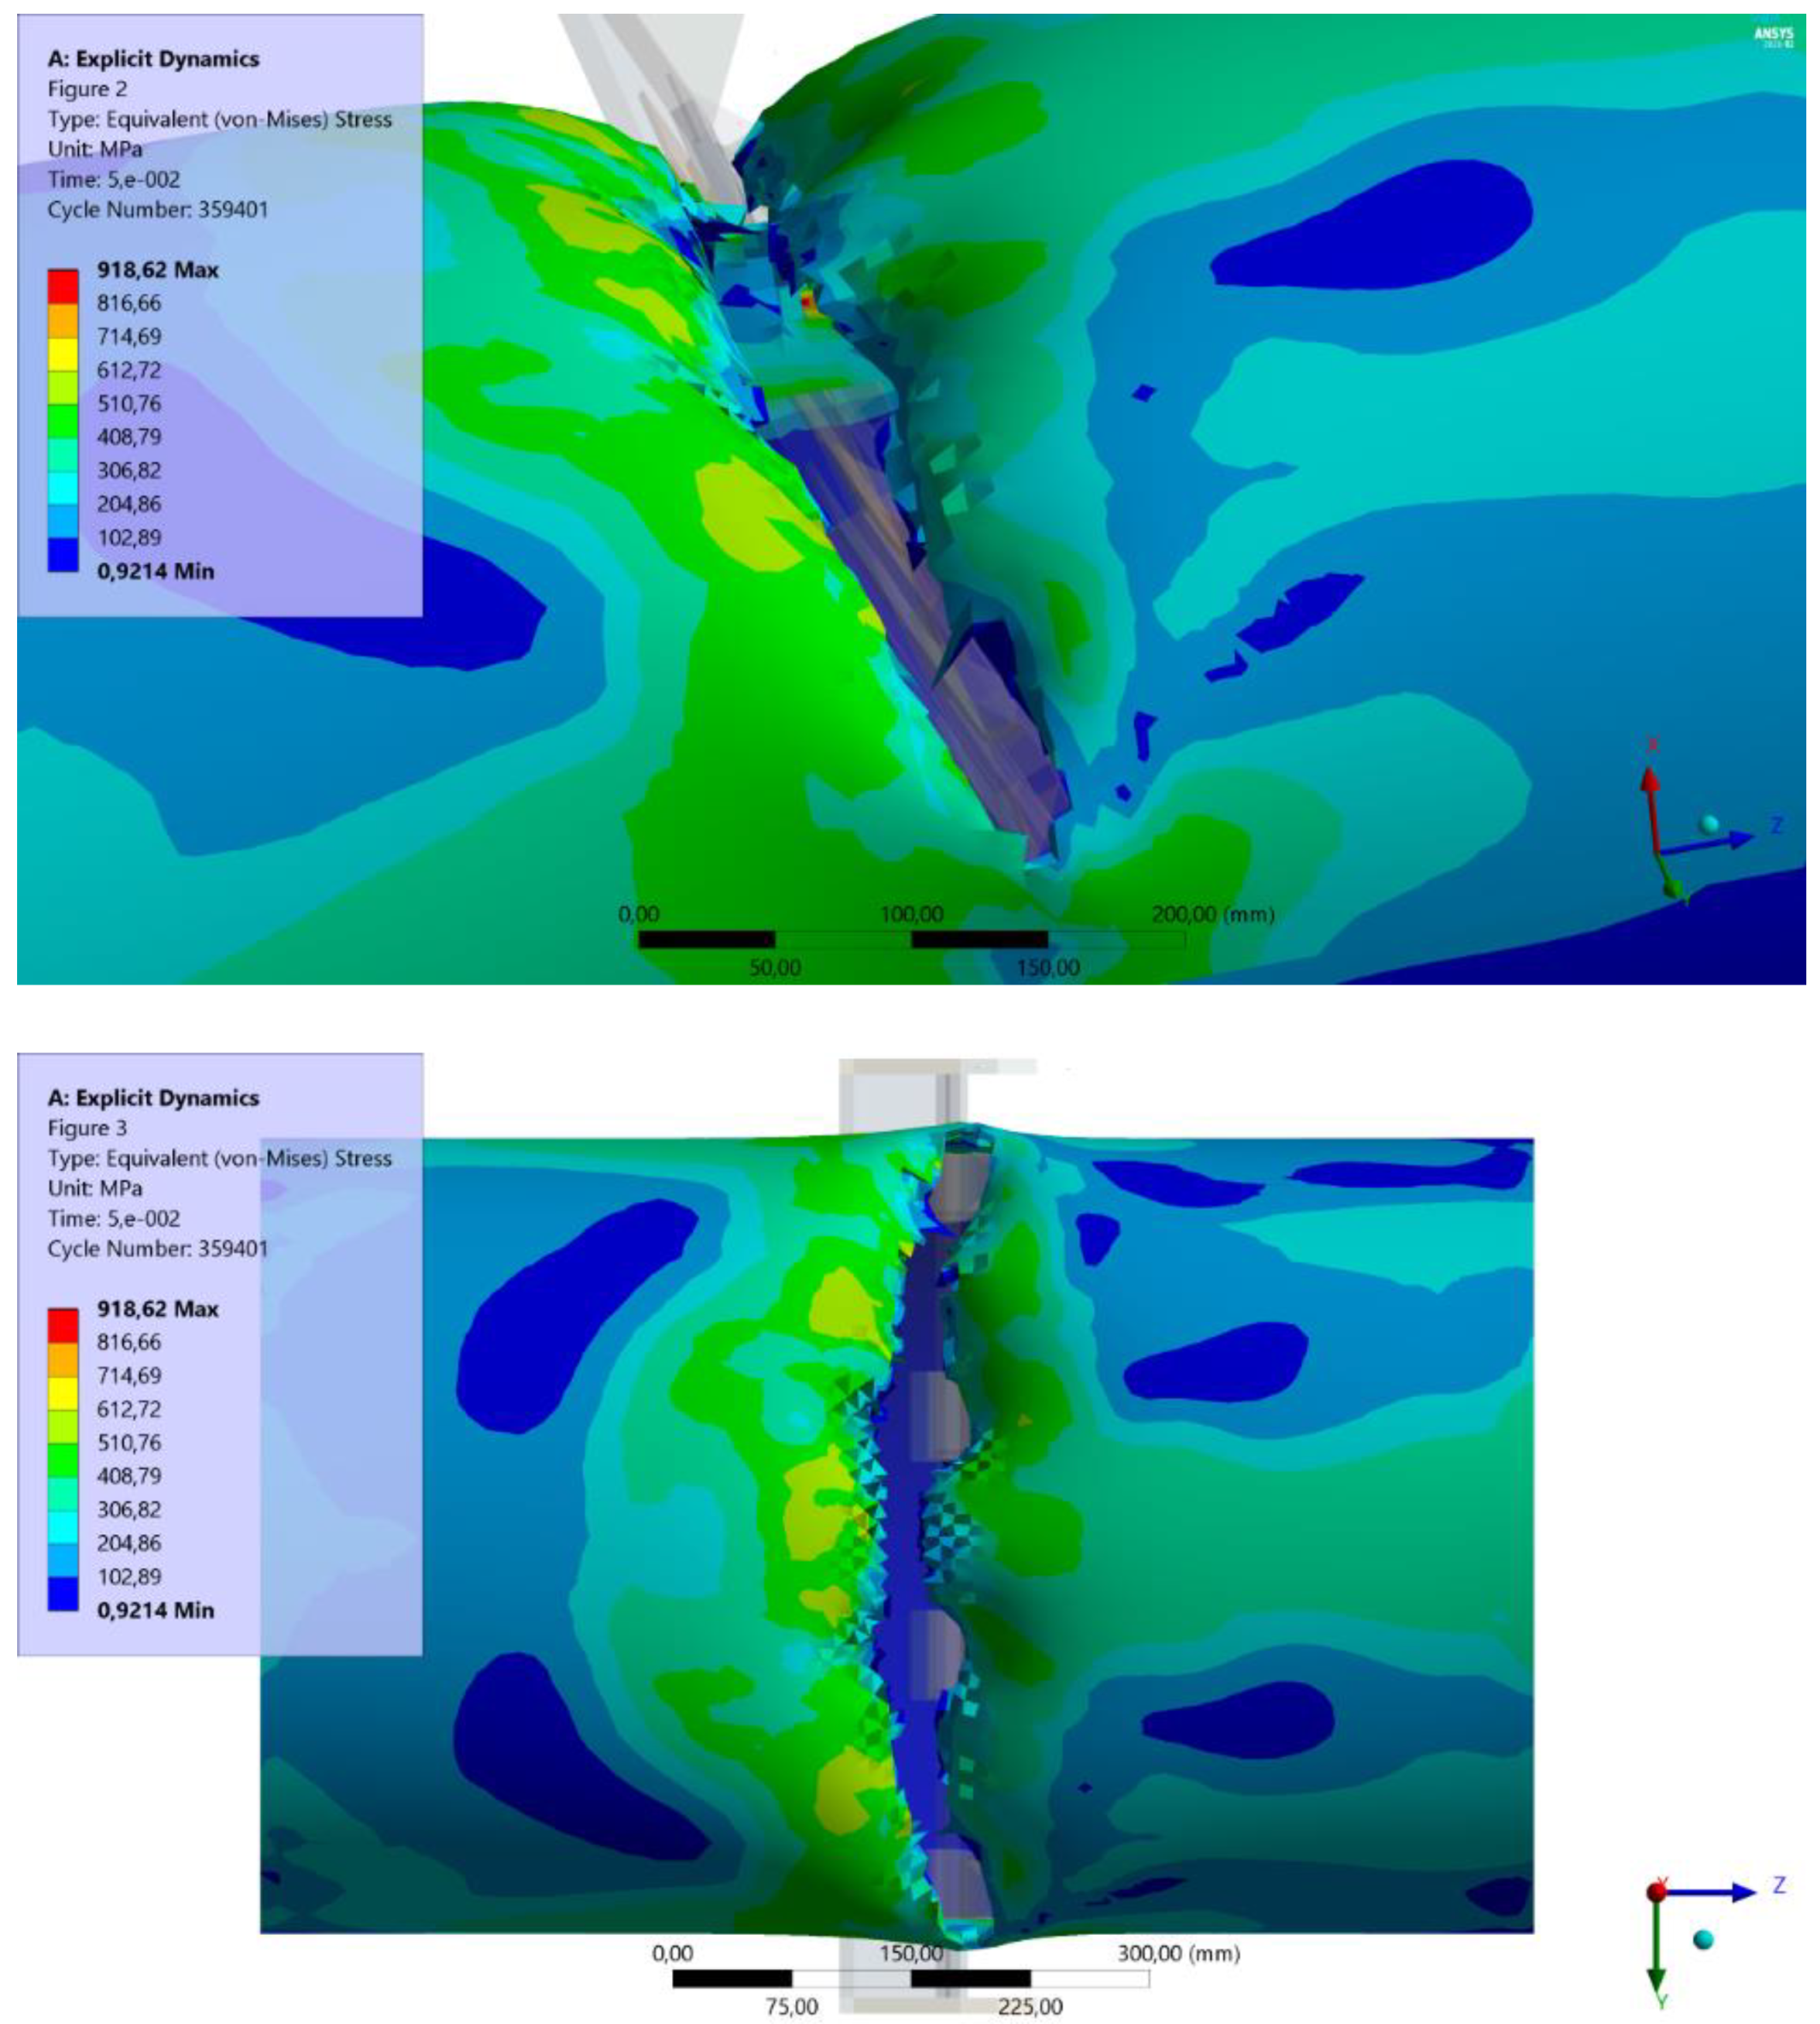
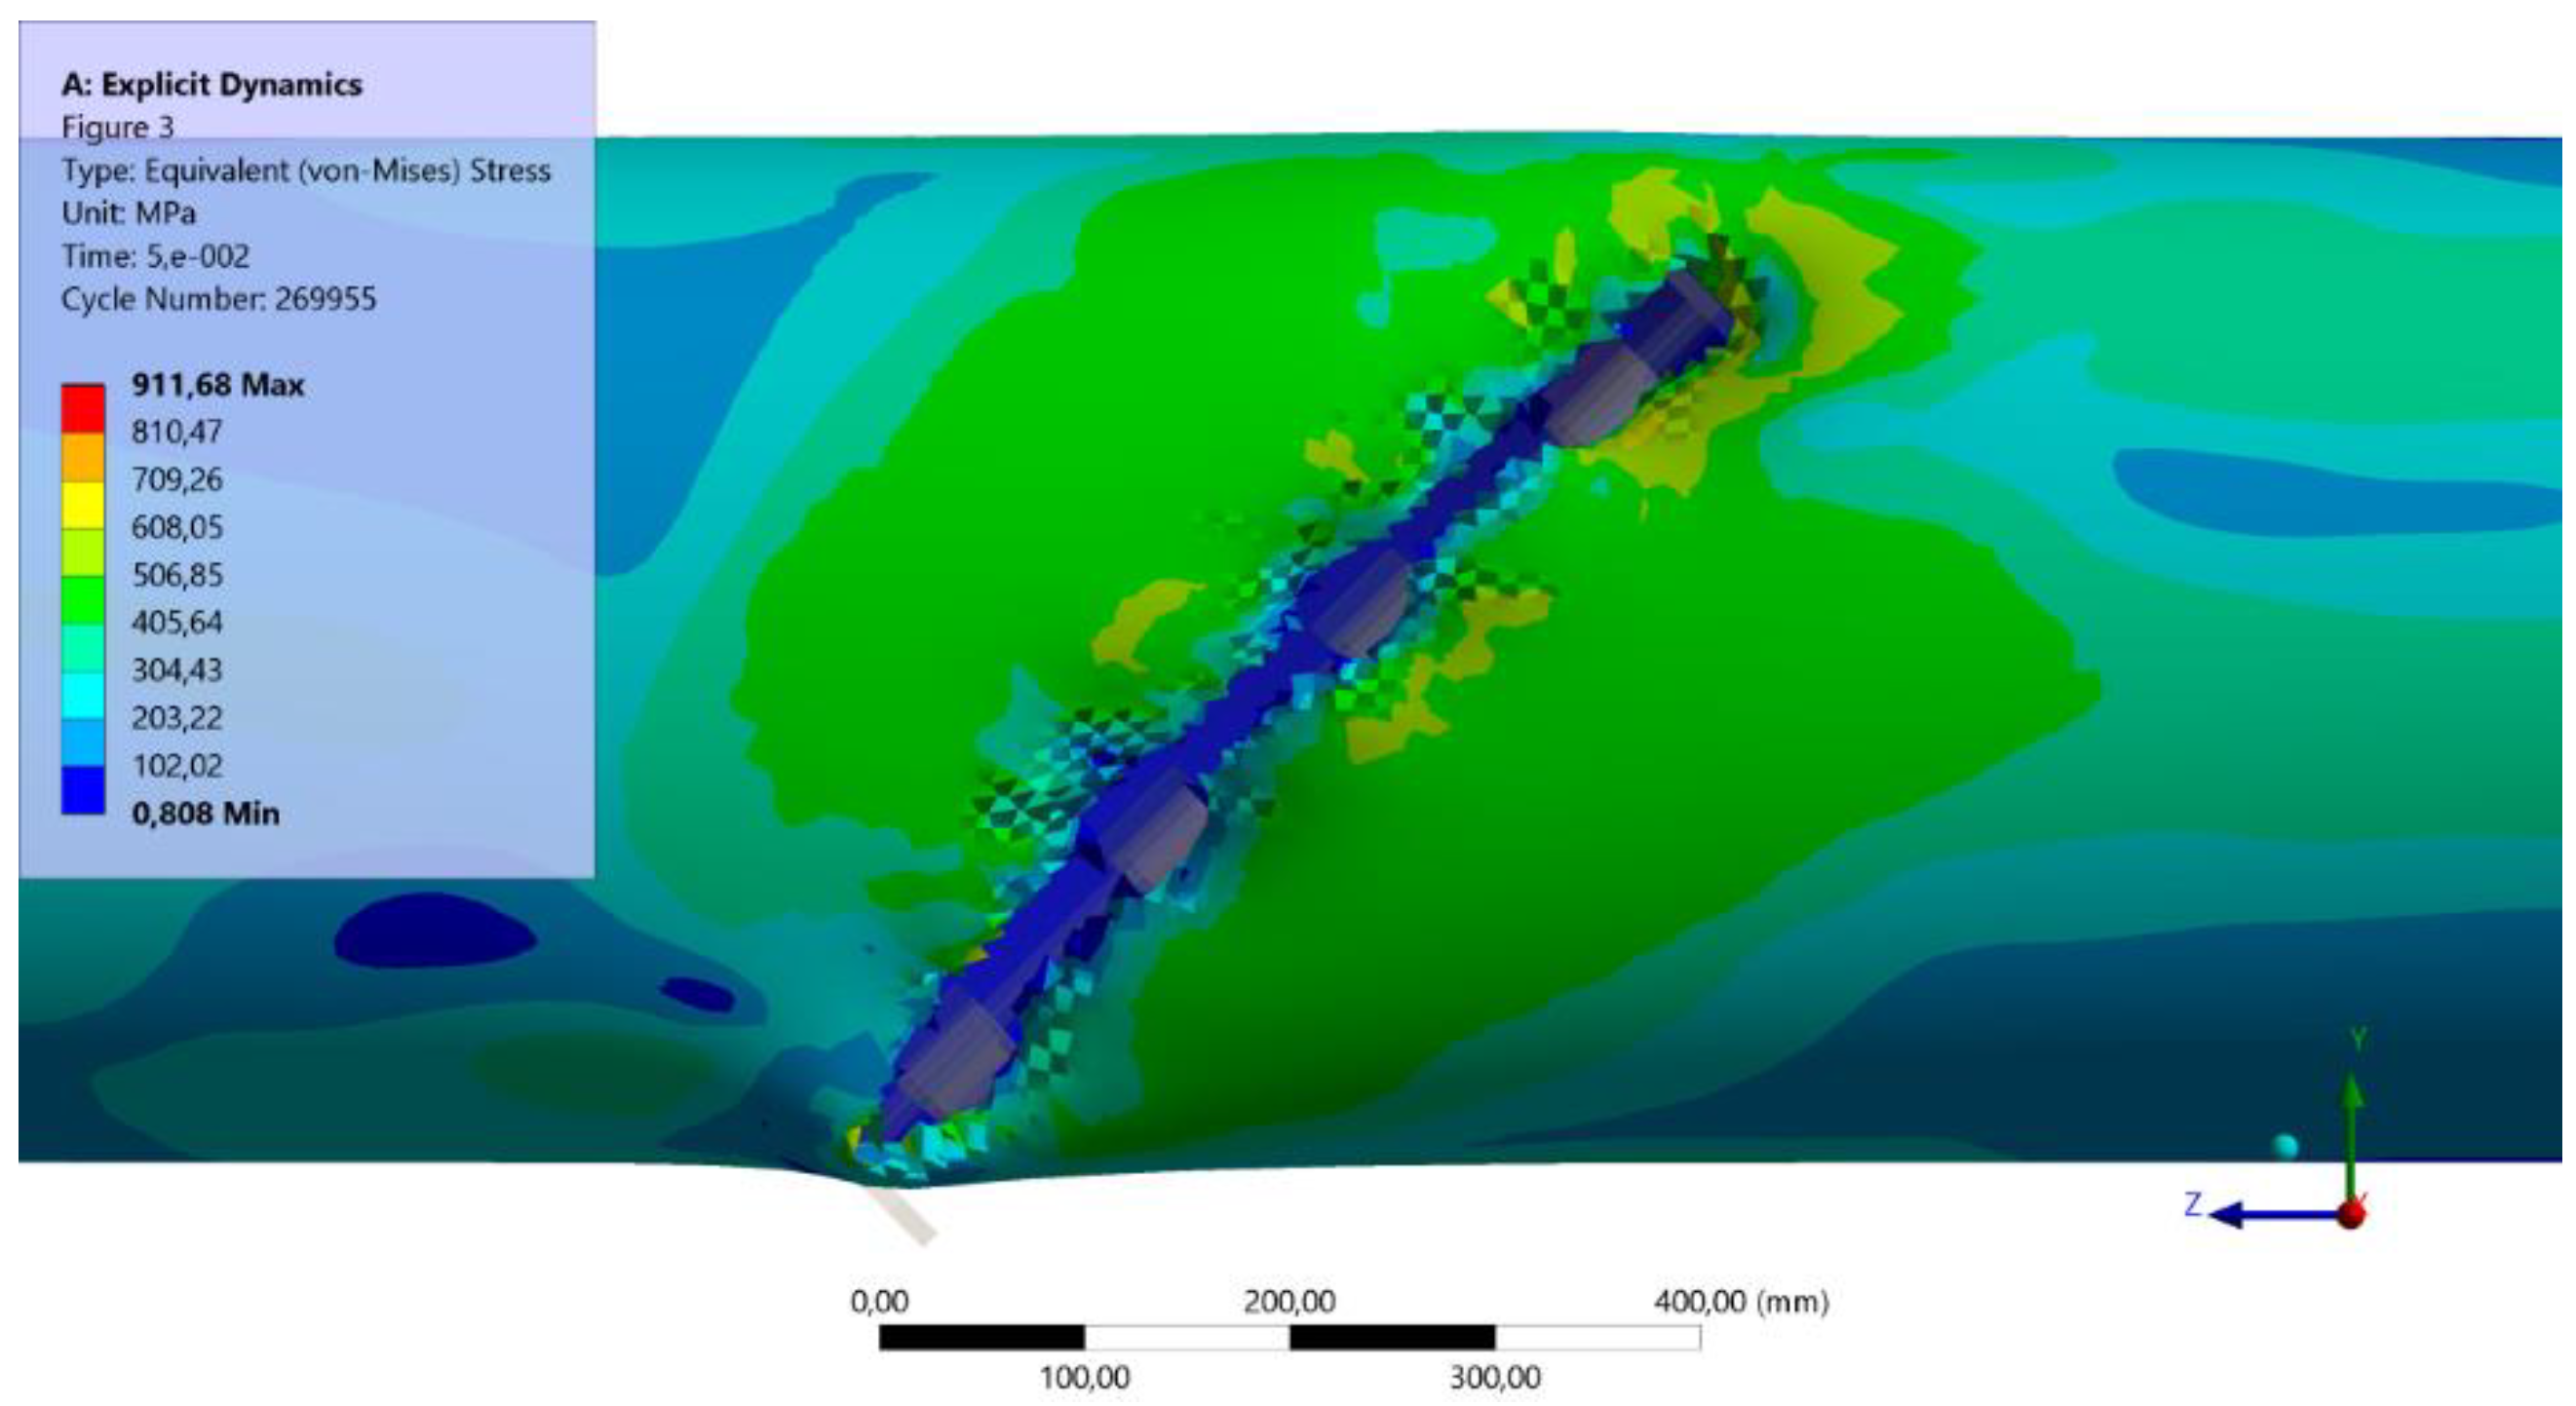
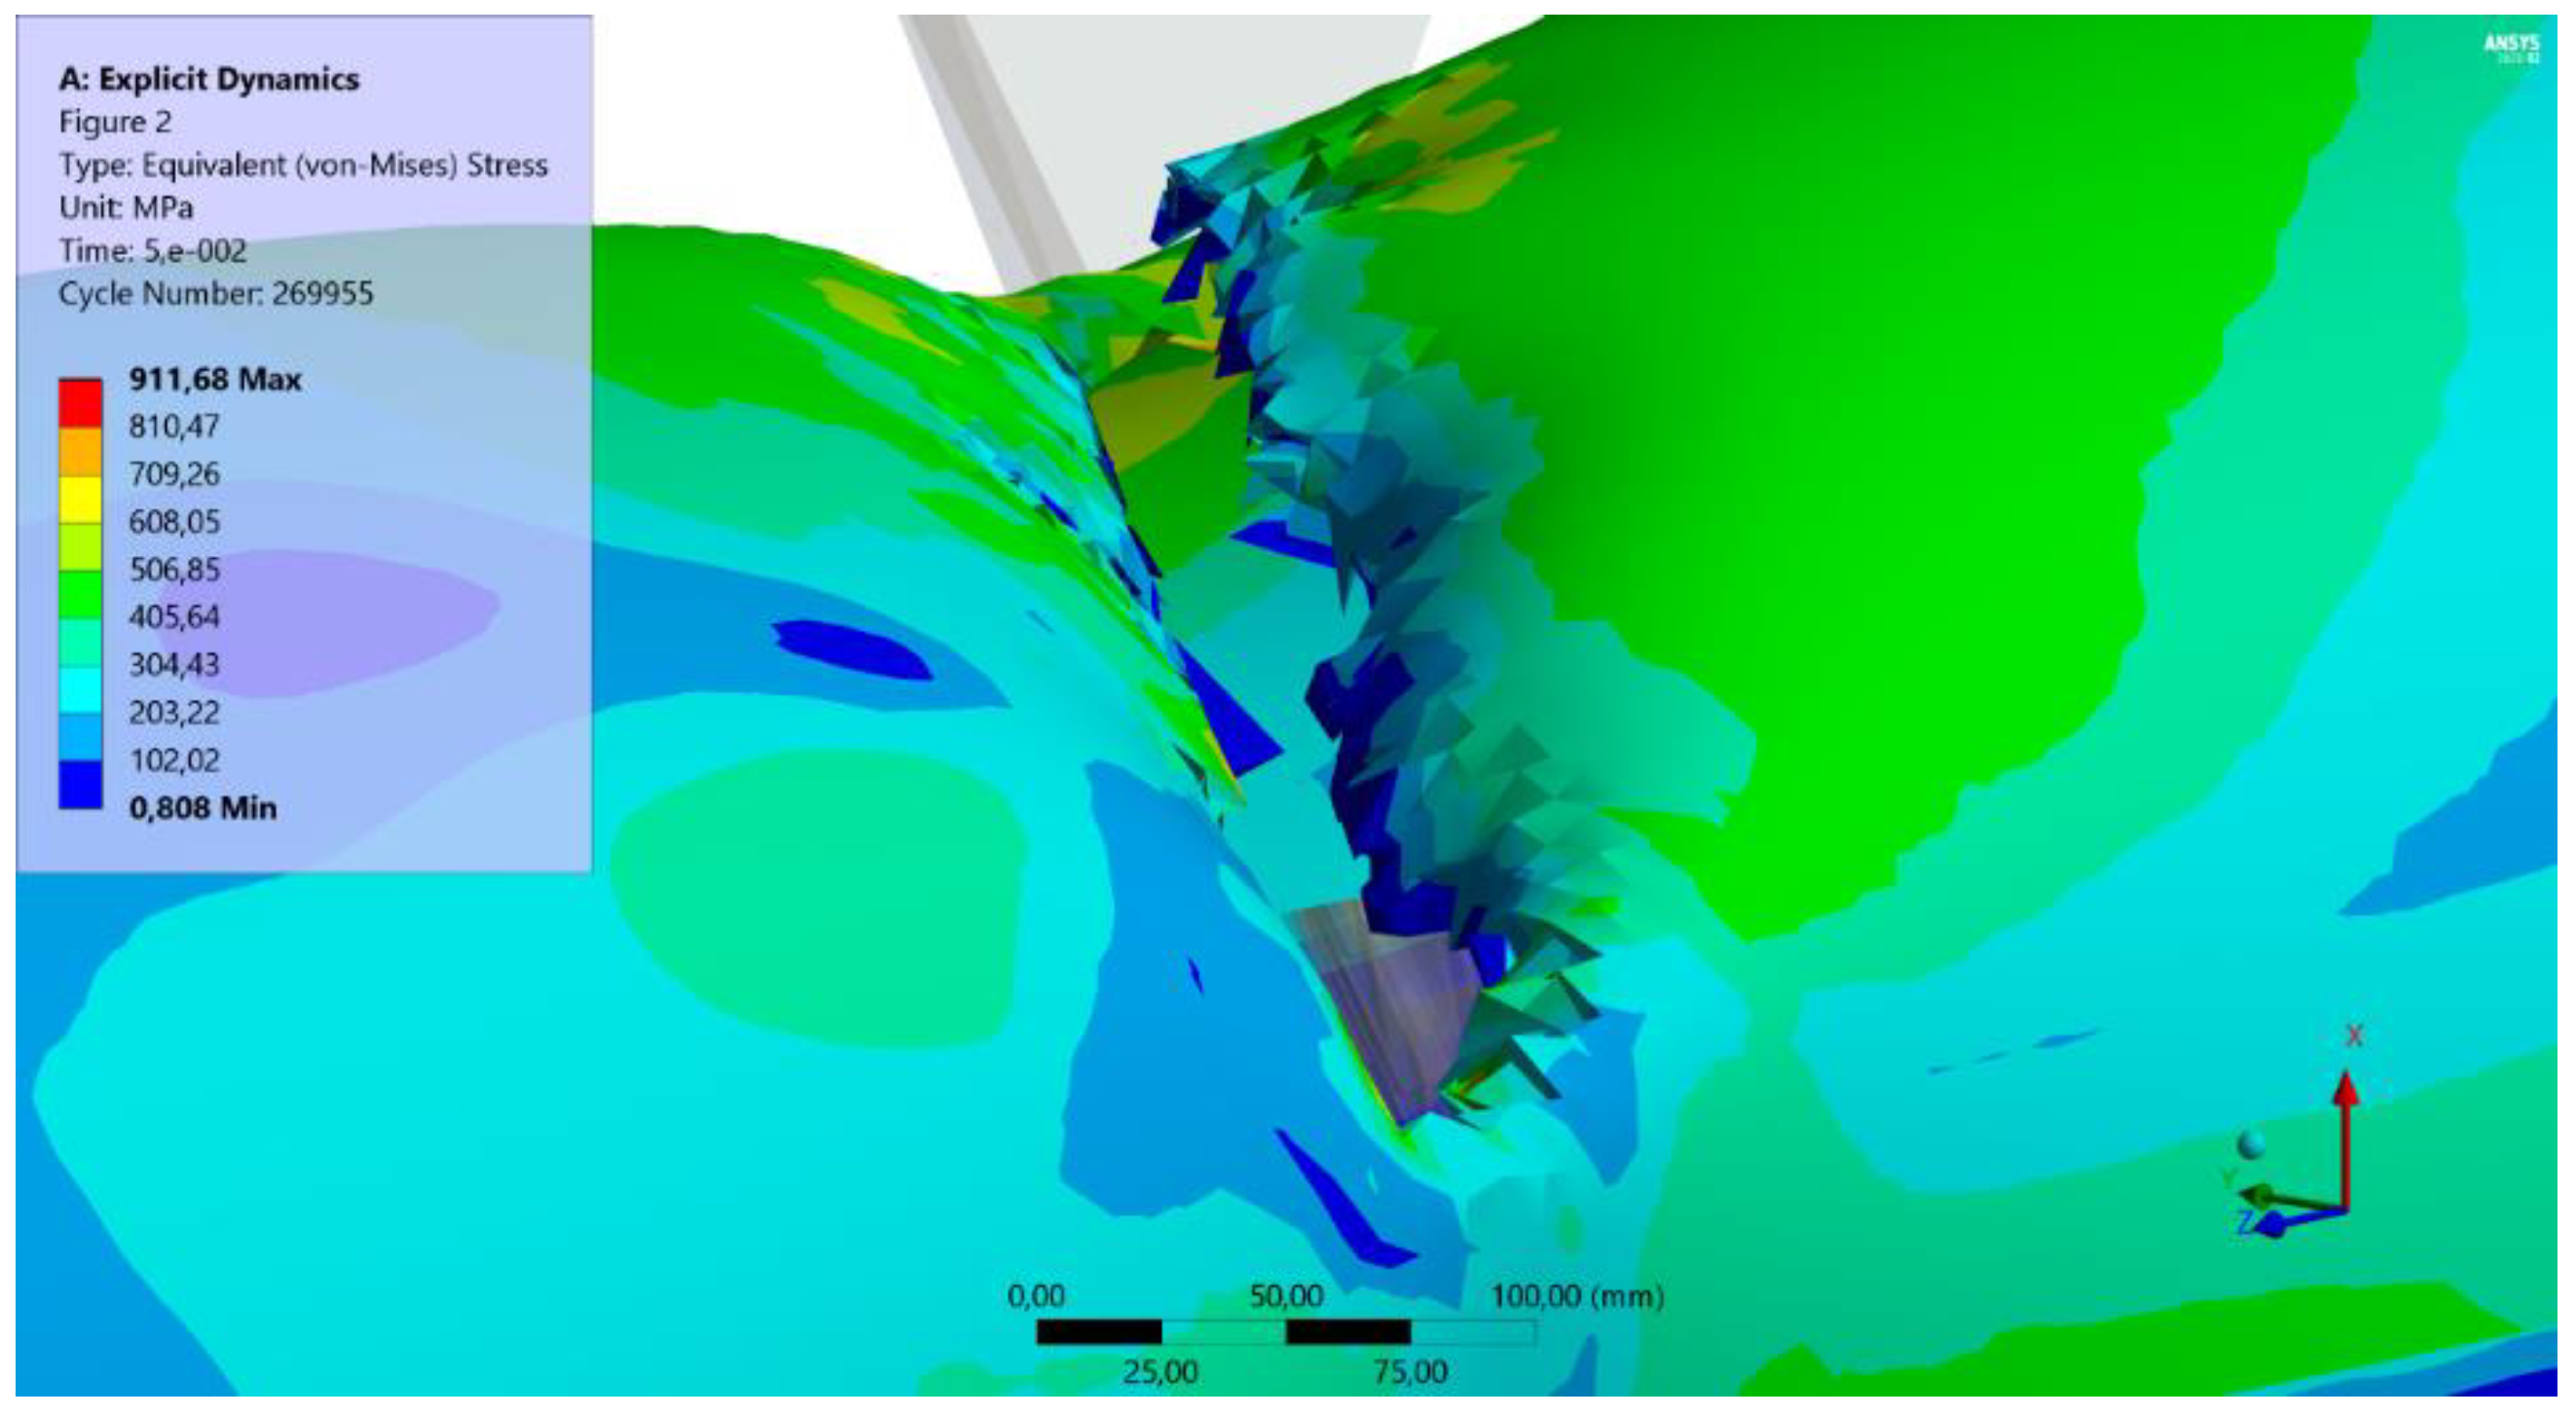
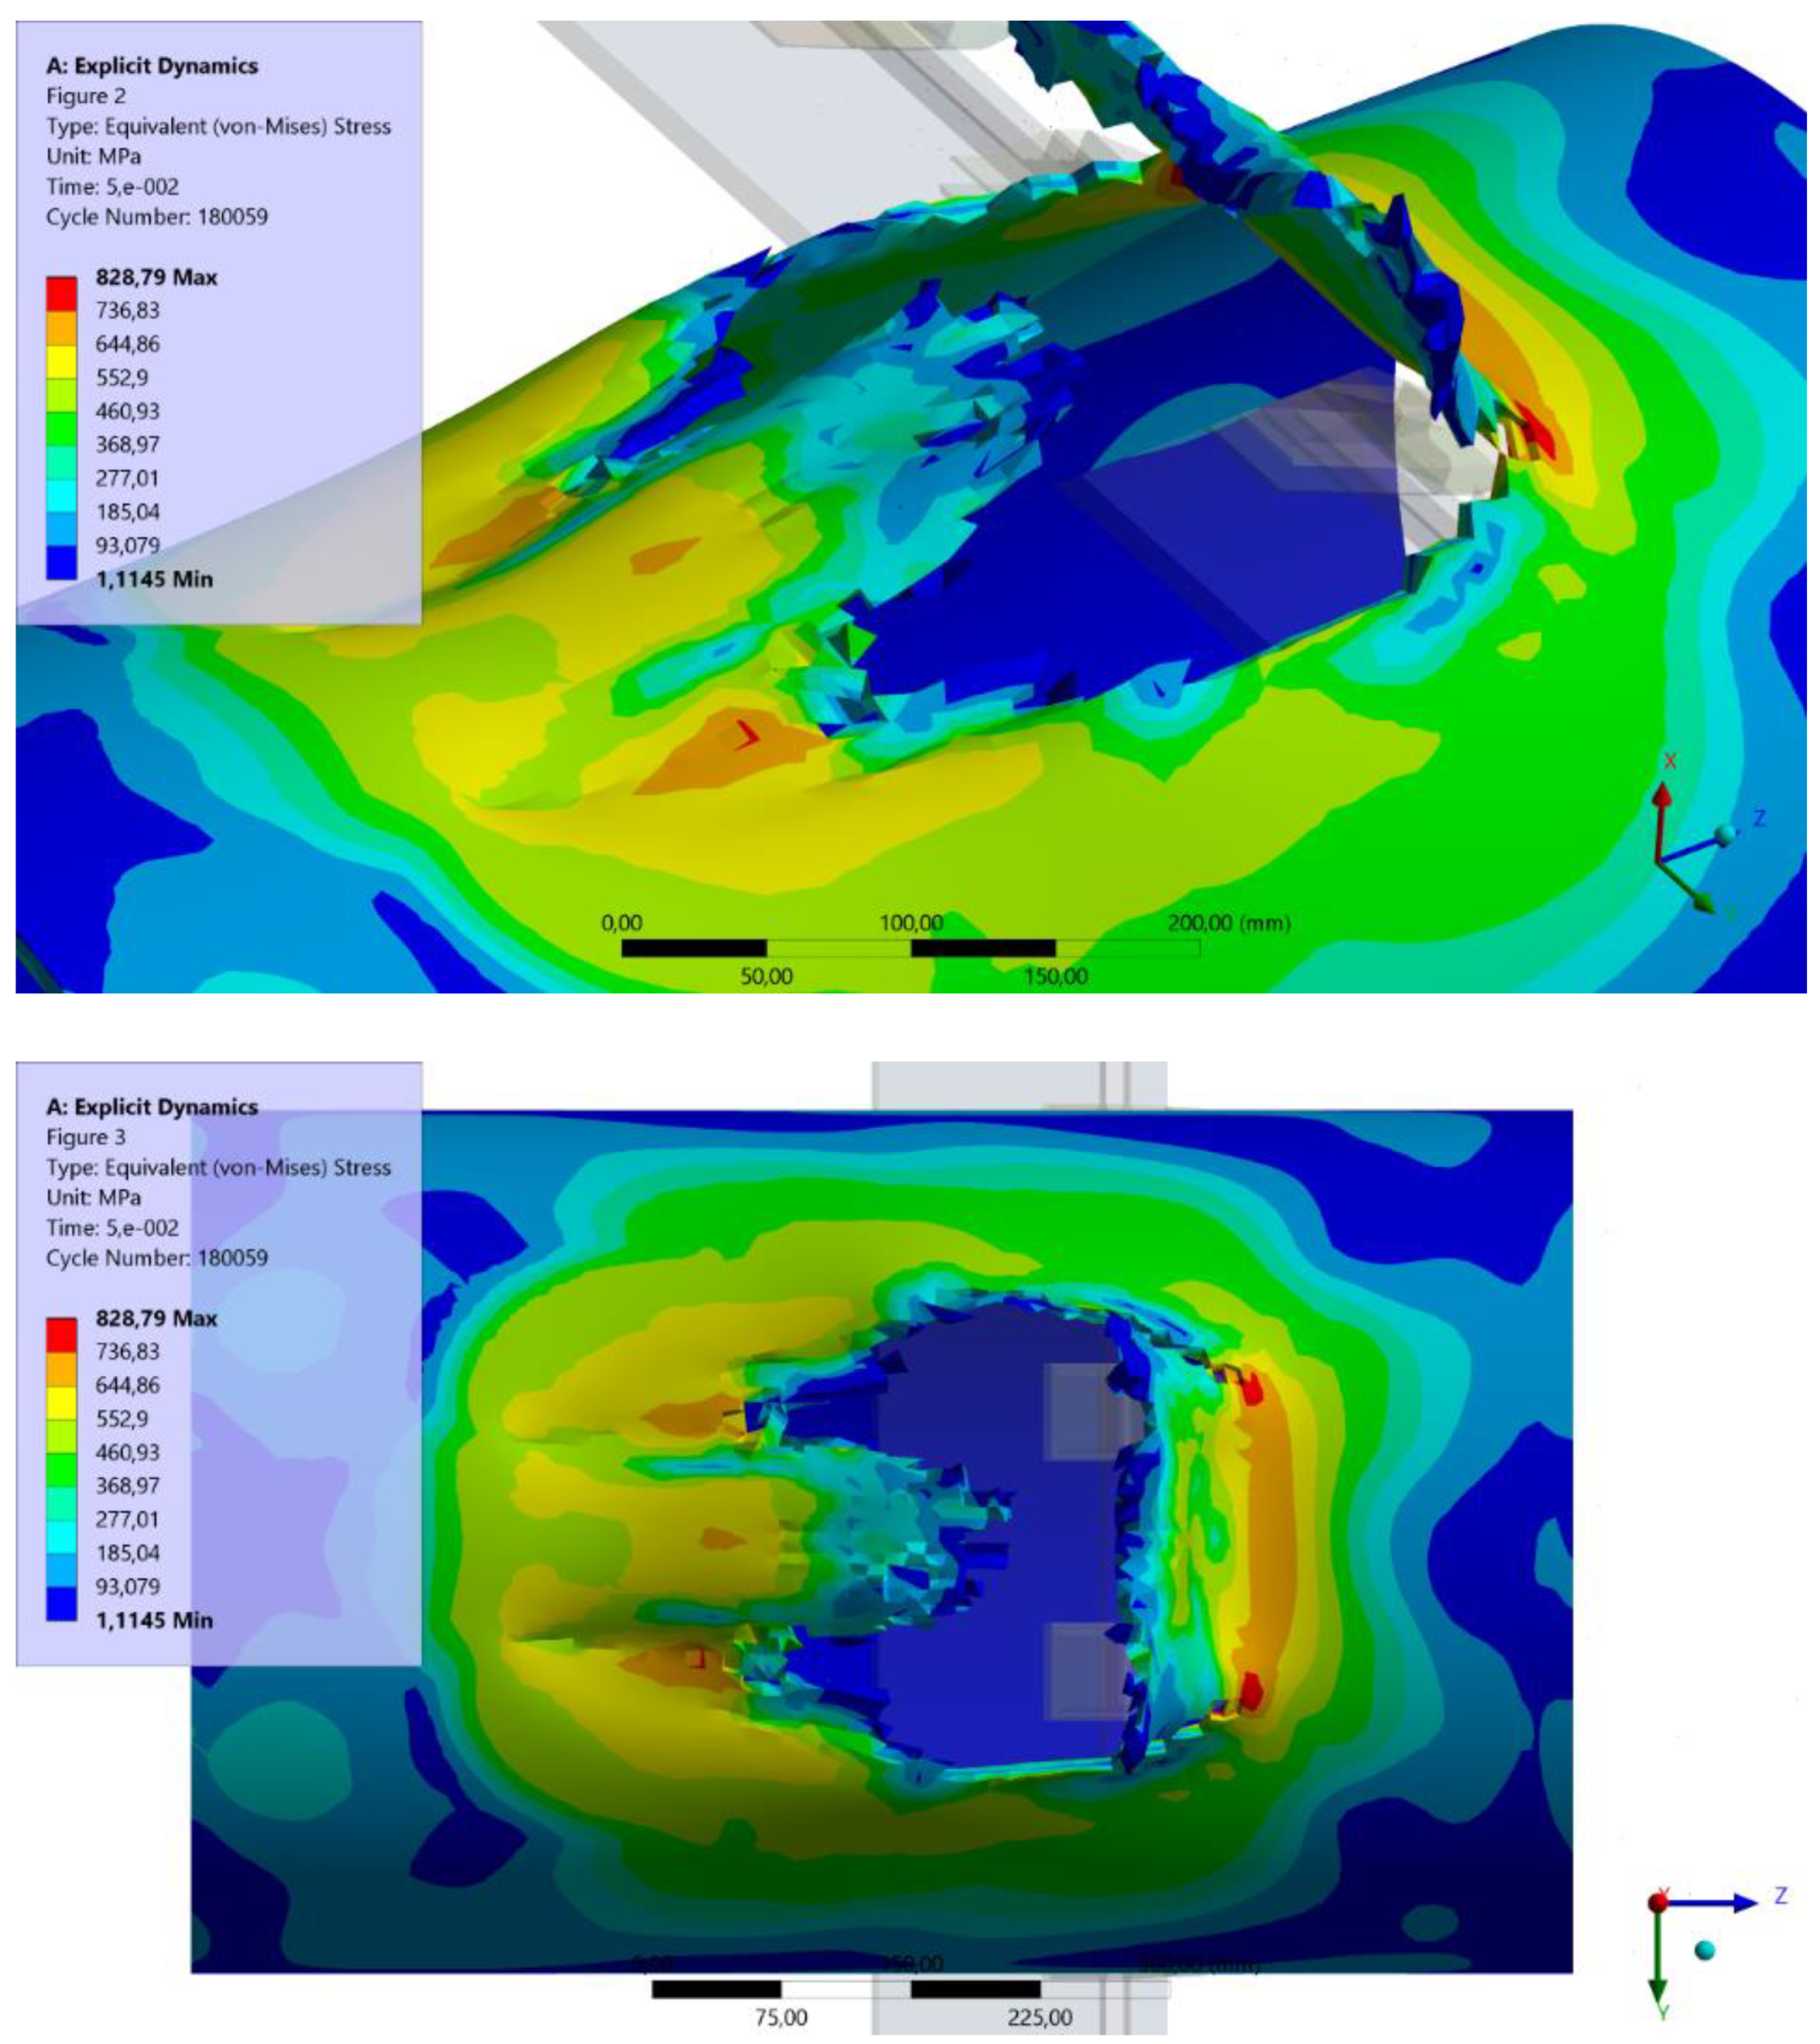
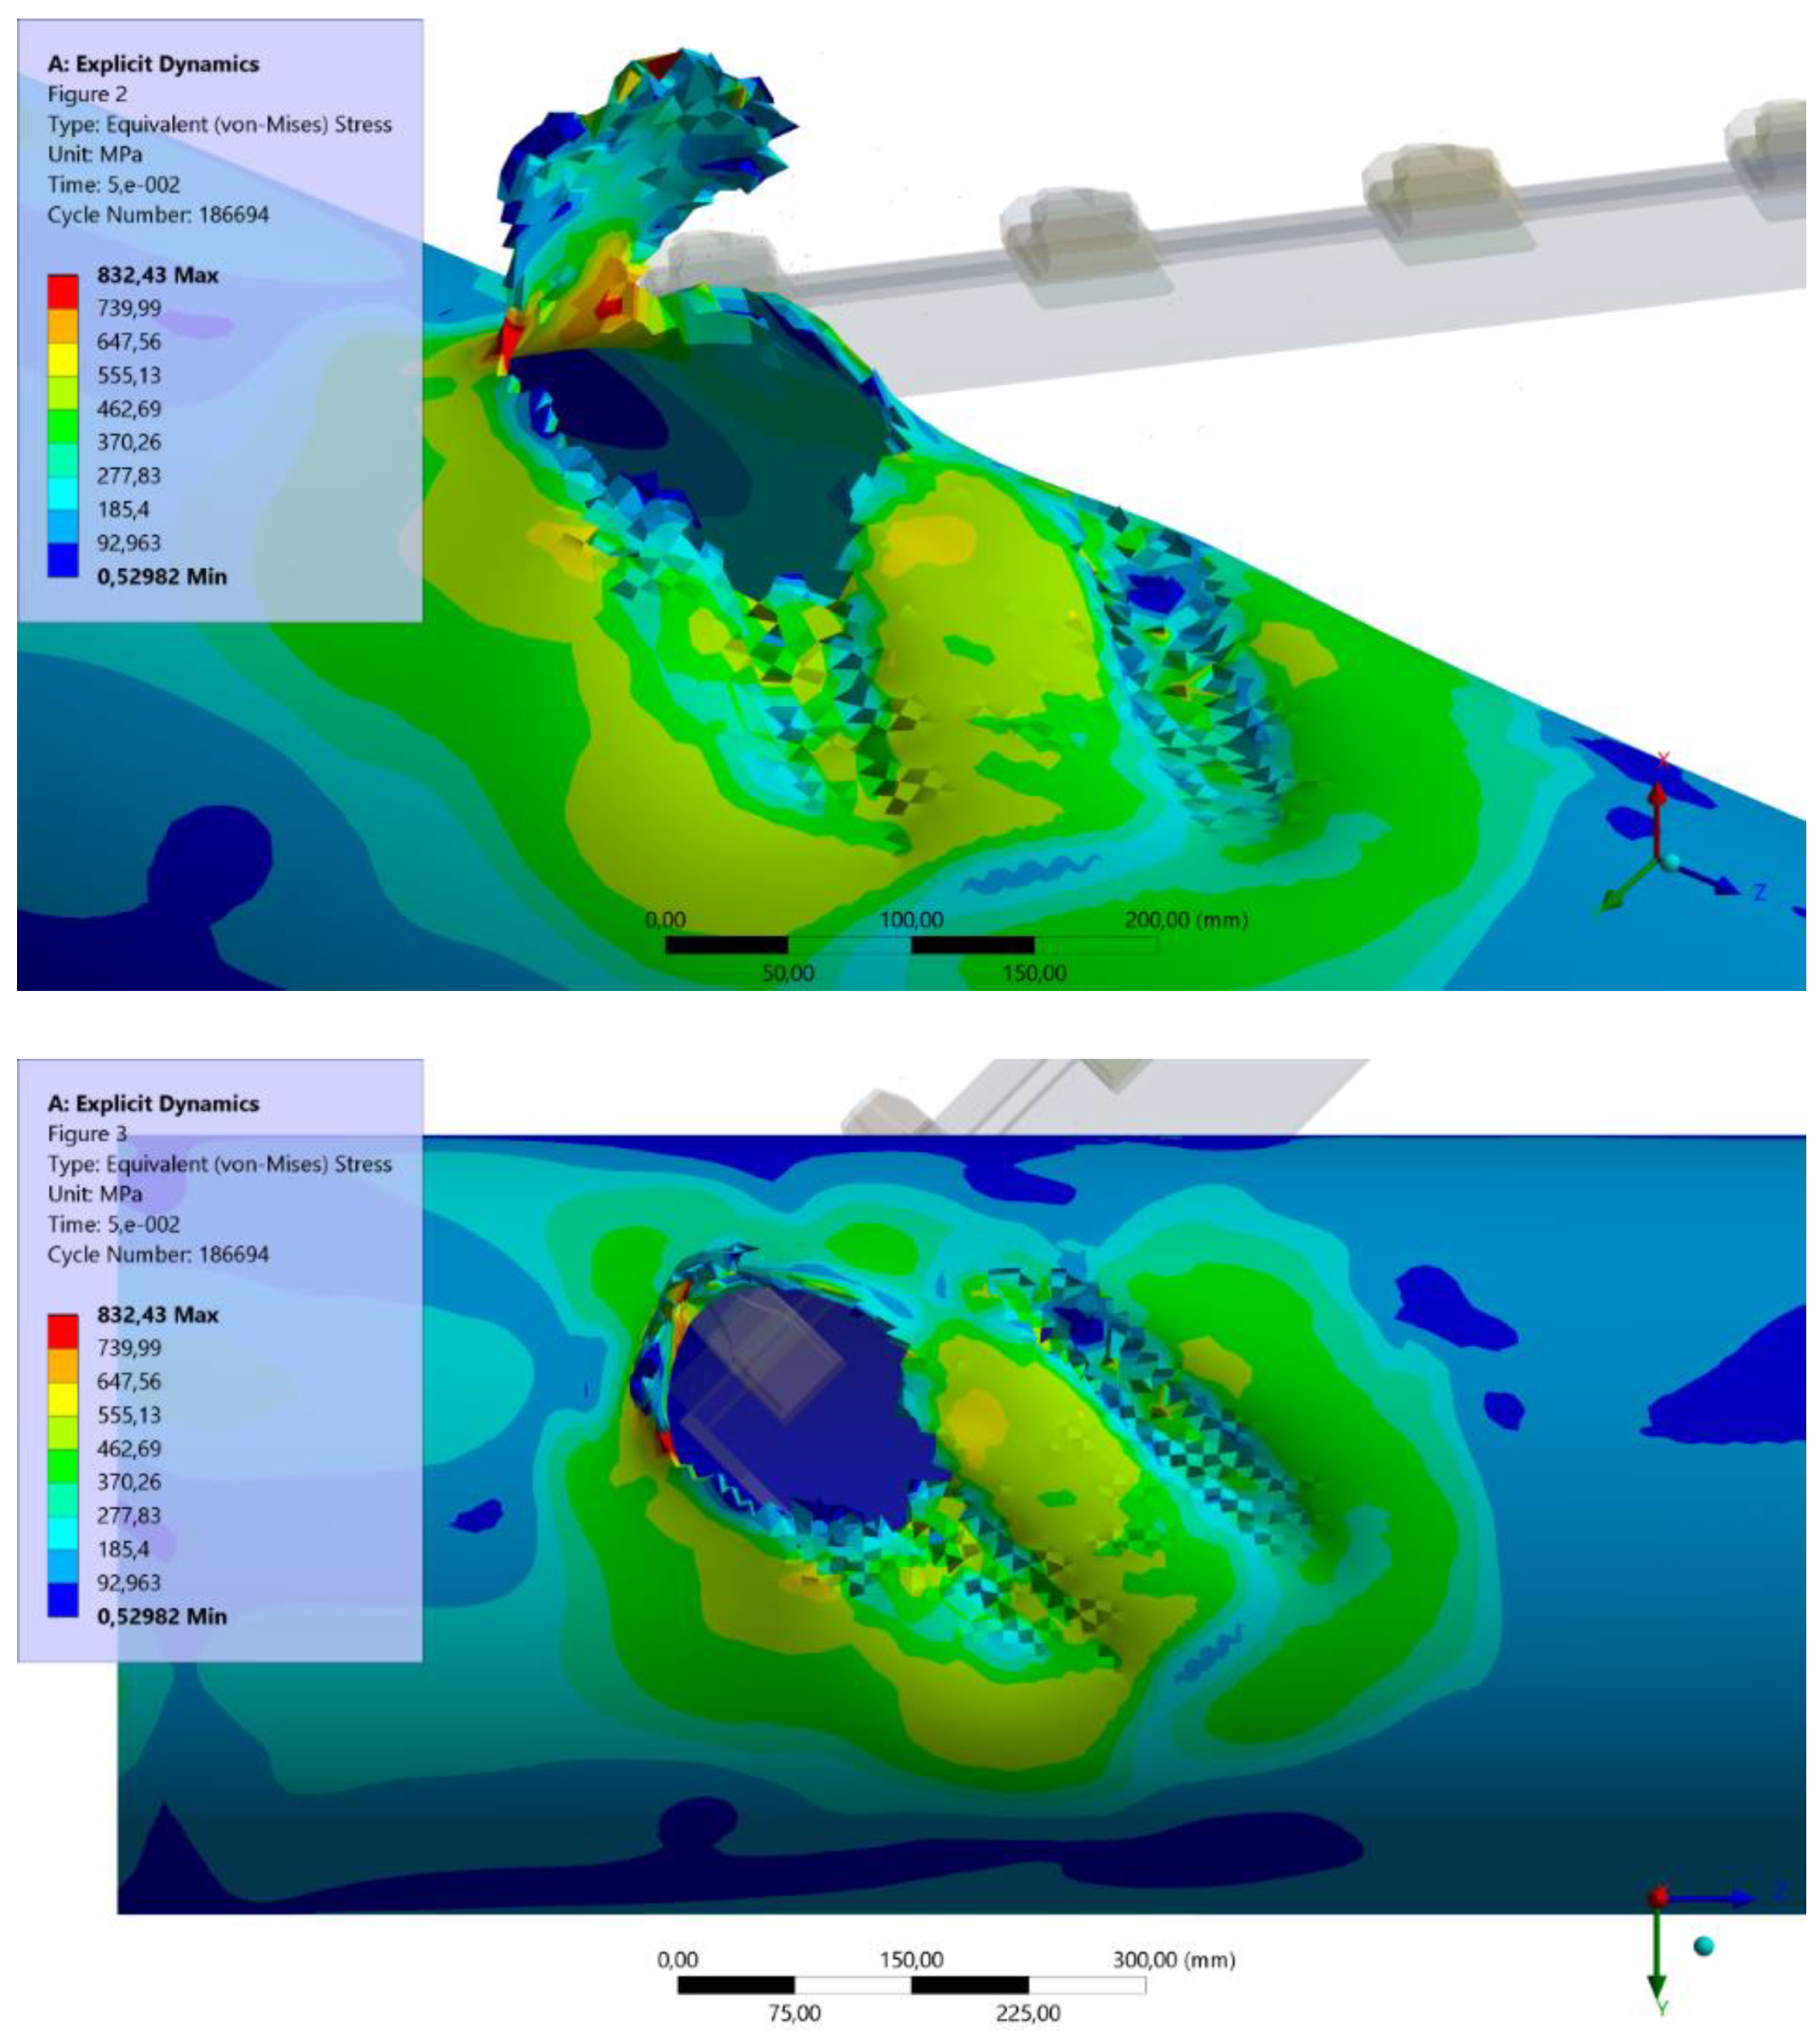
Example results of modelling the bucket impact effects are shown in the following figures. The effect of the impact for Variants 1, 2 and 3 are shown in Figure 10, Figure 11 and Figure 12, respectively. The aim of these figures is to show the potential size of the damage, which in turn influences the mass flow rate of the gas released and its consequences.
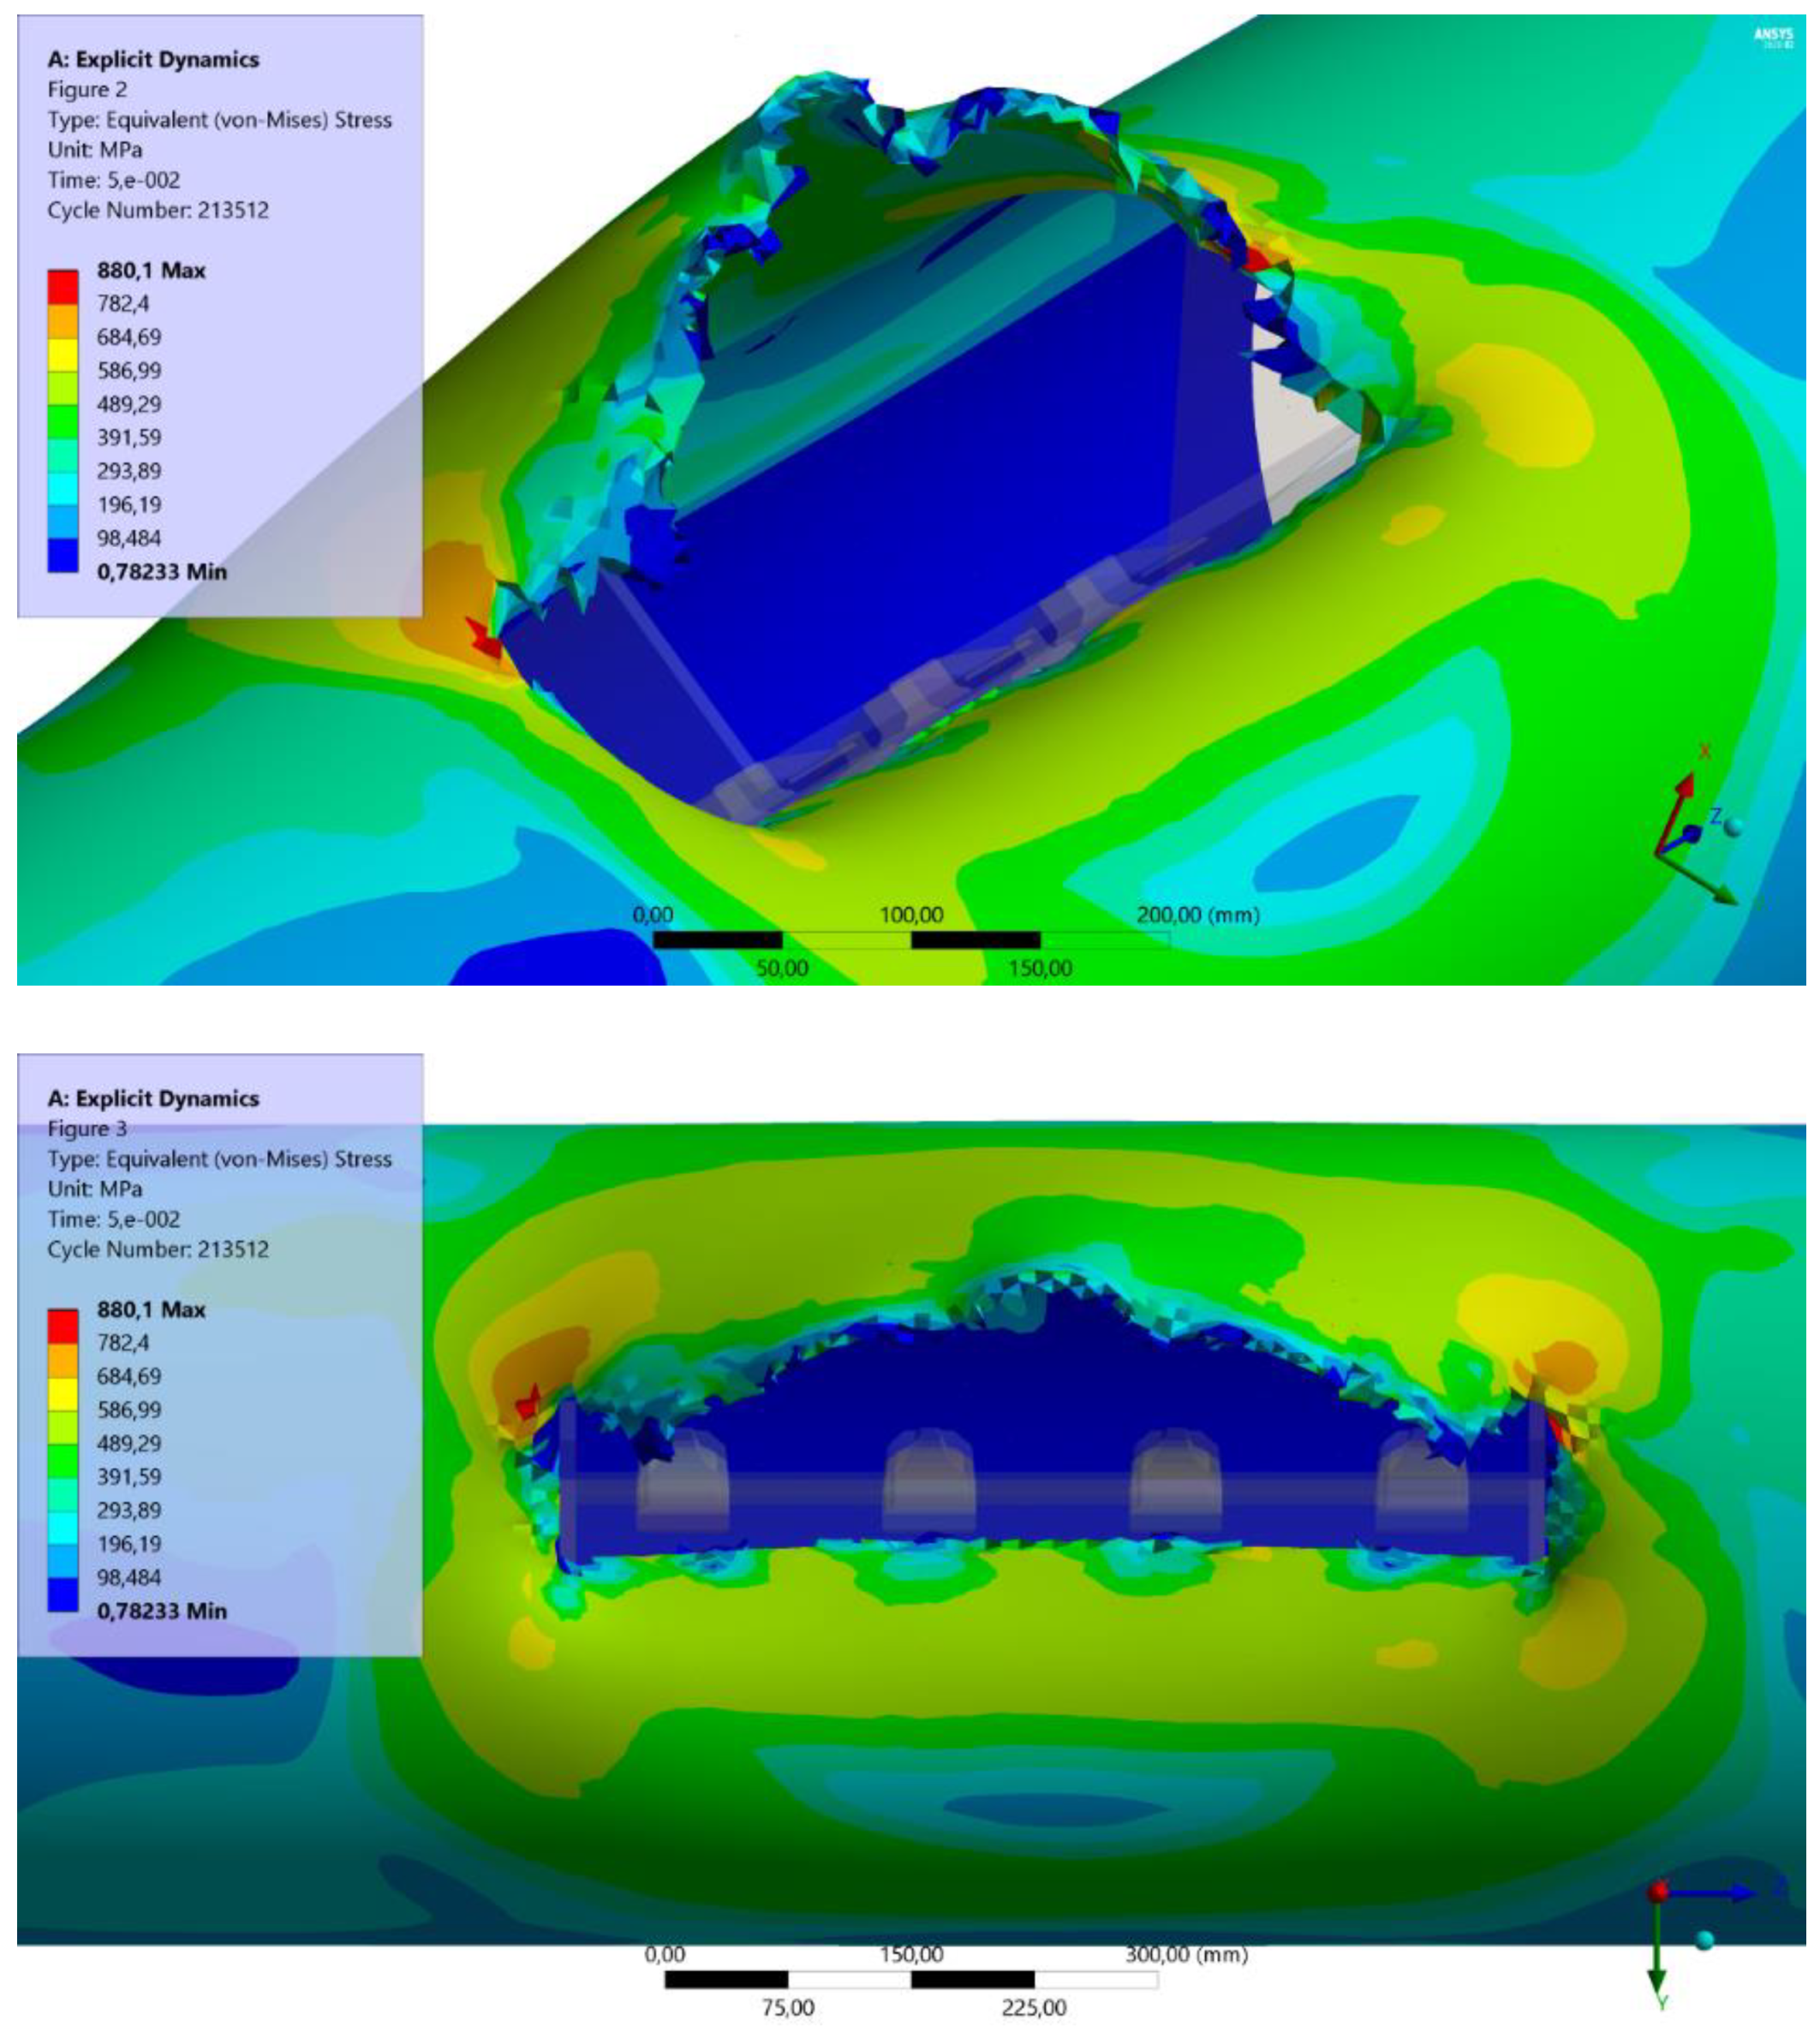
A simulation was also performed for Variant 1 and Variant 3 of the development of the pipeline damage after the bucket hits the pipeline and then rotates further in relation to the machine arm. Such a situation occurs if the excavator operator does not notice or fails to respond to the bucket first hitting against the pipeline and continues their work. In these calculations, the rotation point was assumed to be at the distance of 300 mm from the bucket’s centre of gravity. In this variant, the bucket, as a rigid body, rotates at a set angle of 45°. The effects of pipeline destruction for Variants 1 and 3 are shown in Figure 13 and Figure 14, respectively.
The simulation results show that the development of damage due to rotation of the excavator bucket can significantly increase the damage size and thus increase the amount of released gas. The results of the numerical simulations indicate that, for the case of pipeline damage analysed, the size of the hole can total from 20% to even 50% of the pipeline’s cross-sectional area.
3.2. Released Gas Spreading in the Gas Pipeline Surroundings
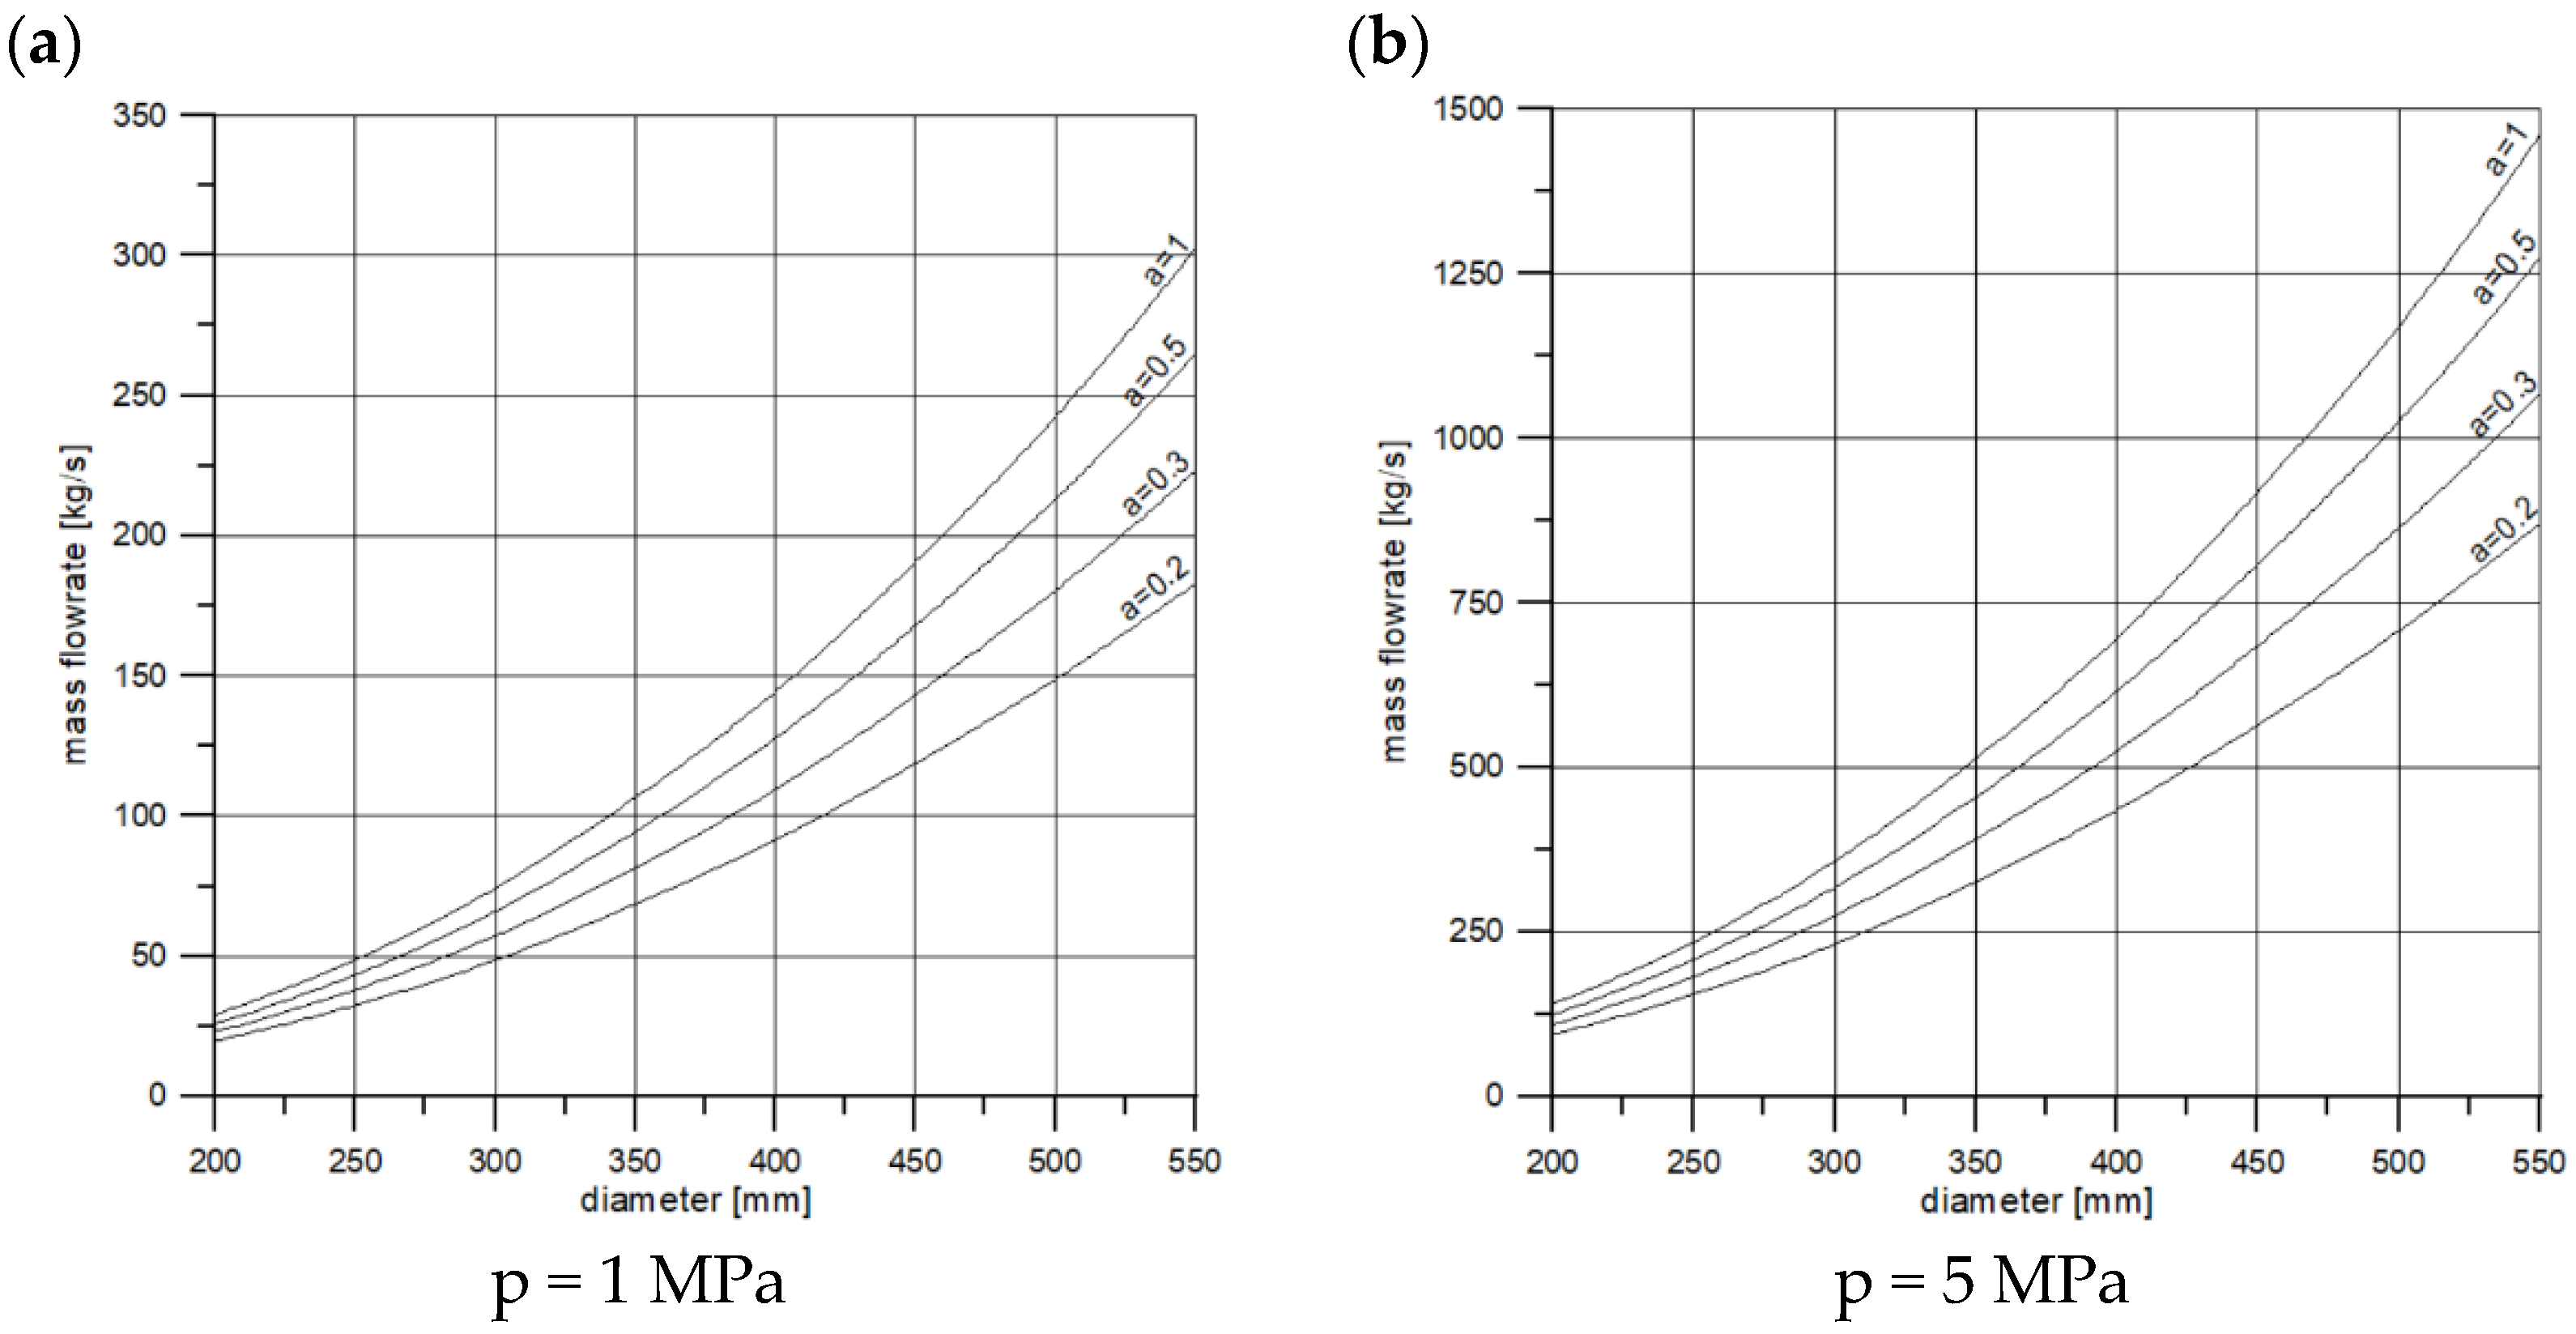
If the pipeline is damaged mechanically, an uncontrolled gas leakage occurs. Further consequences of the leakage depends, among other things, on the amount of released gas and the nature of its dispersion in the atmosphere. In the simplest case, the amount of gas released from the damaged pipeline can be estimated using the relations valid for an isentropic outflow of perfect gas through a hole with a round shape. If the hole’s cross-sectional area has a value of A, and the pressure values upstream and downstream from the hole are p0 and p2, respectively, the mass flow of the escaping medium can be calculated from the following relation [29]:
where ρ0 is the gas density upstream from the hole and κ is the isentropic exponent.
As pressure p2 decreases, the mass flow rises to reach the maximum critical pressure value, expressed as follows:
If the pressure ratio, defined as backpressure-to-inlet pressure, reaches 0.542, the flow is choked and the mass flow rate can be calculated using the following equation [30]:
where ρk and pk are the density and pressure in the critical cross section, and c is the discharge coefficient.
The change in the mass flow through the hole for different diameters of a 50 km long pipeline is presented in Figure 15. The gas pressure and temperature are 5 MPa and 20 °C, respectively. The curves in the figure correspond to different levels of pipeline damage expressed using coefficient a, which is defined as the ratio of the damage surface area to the cross-sectional area of the pipeline.
3.3. Consequences of an Uncontrolled Gas Leakage
The released gas spreads in the air, and if an ignition source is found in the area with concentrations corresponding to the lower-to-upper intervals of the flammability limit of methane, a fire and/or an explosion occurs. Fire poses a threat to people and infrastructure due to the direct impact of the flame and the generated heat flux. Explosions create a hazard related to the generated overpressure. Example effects of the impact of these phenomena on people and the surroundings are presented in Table 4 [31,32].
If a jet fire occurs, which is caused by the ignition of a jet of gas released under high pressure through the hole in the damaged pipeline wall, a hazard is created due to high thermal radiation [33].
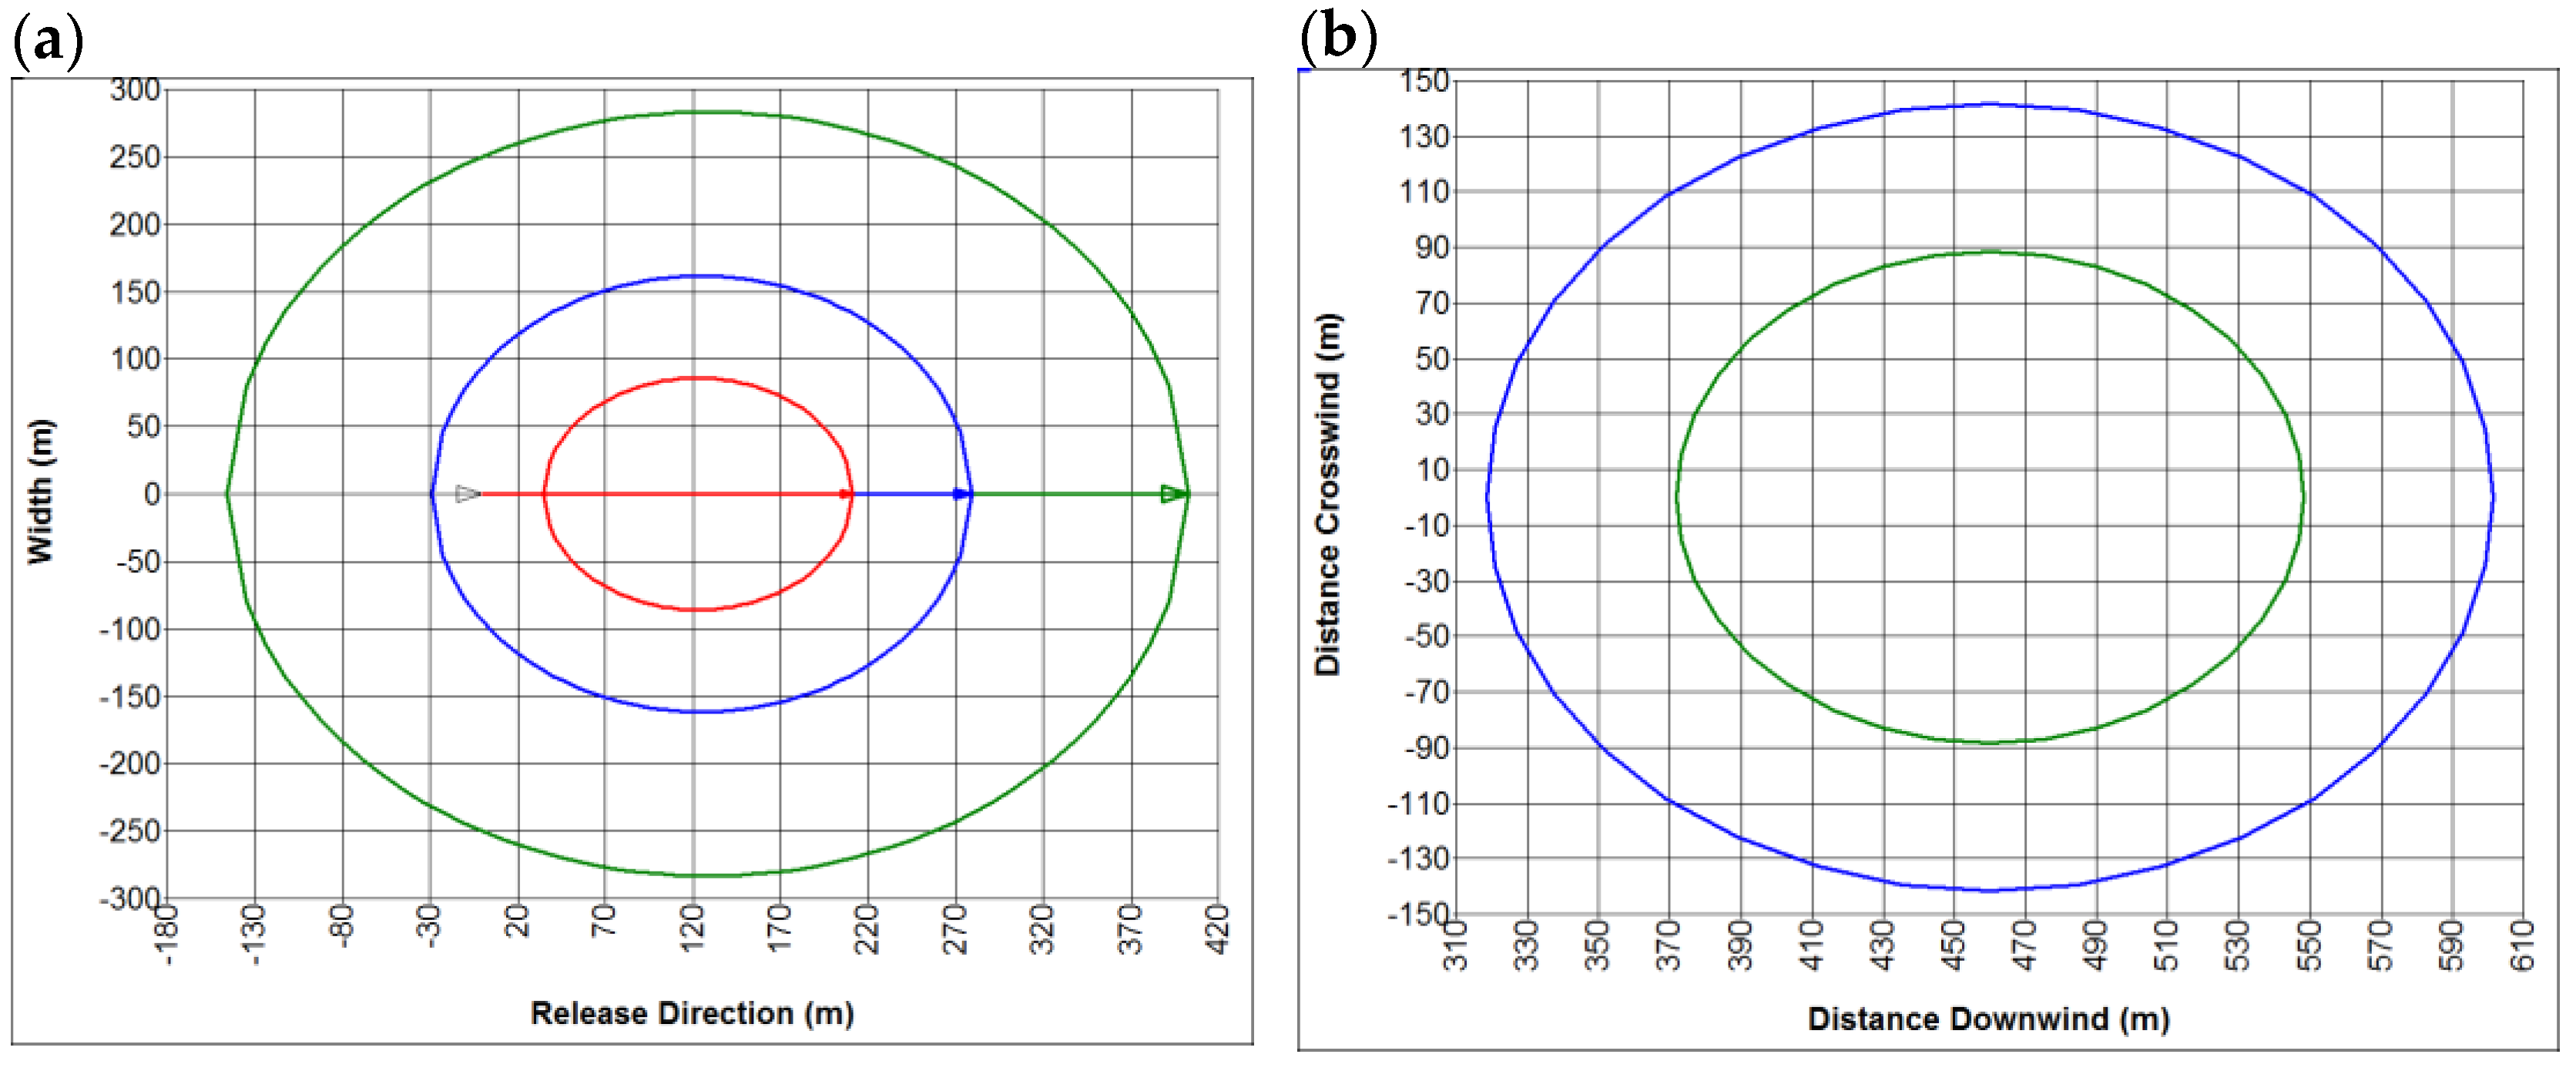
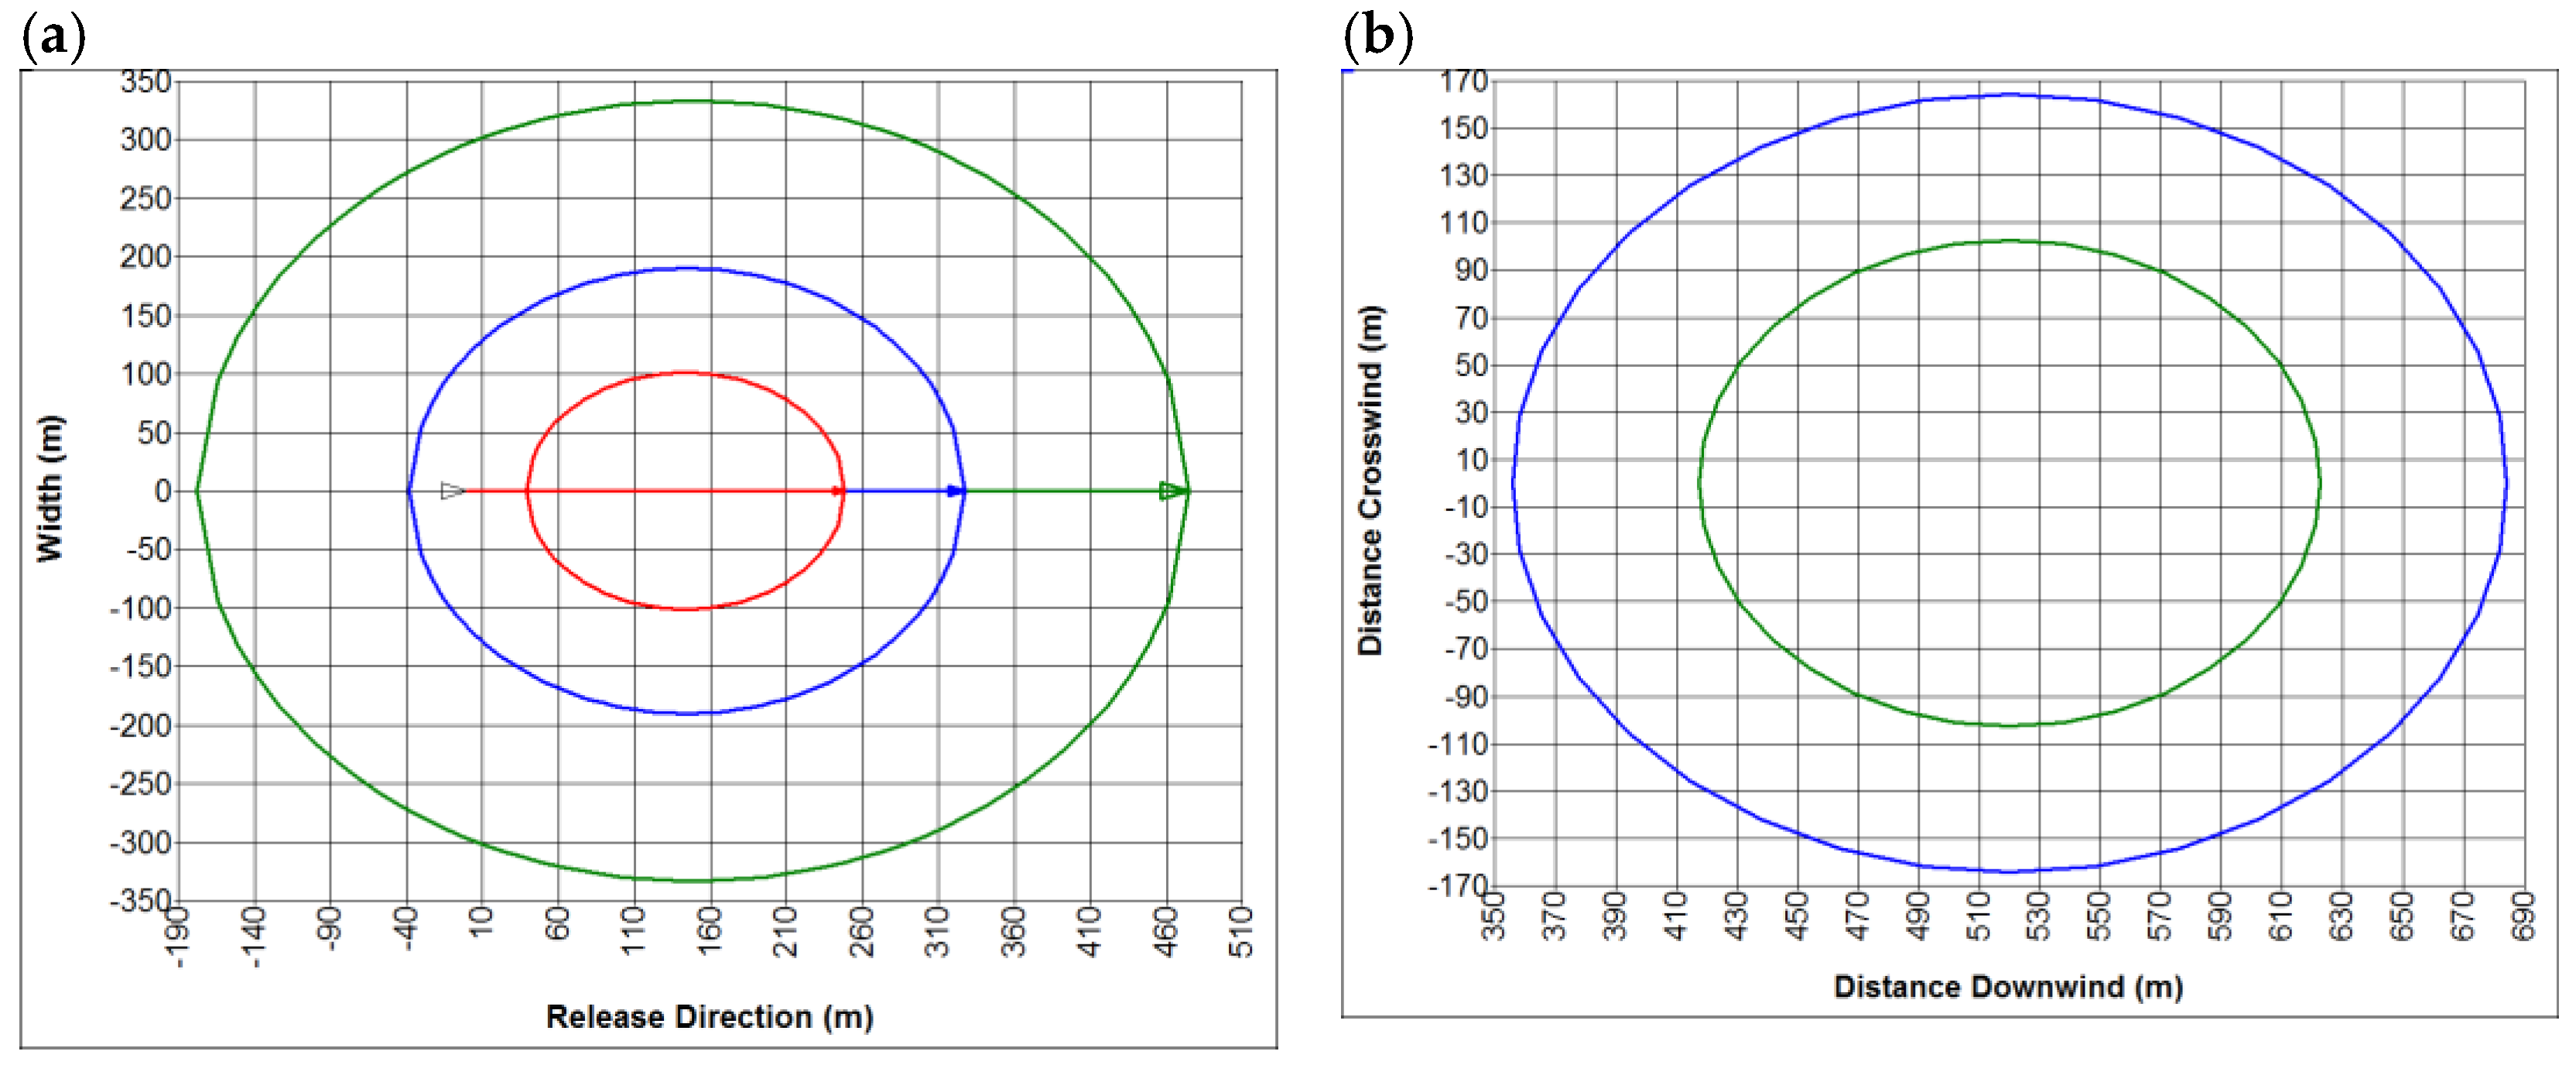
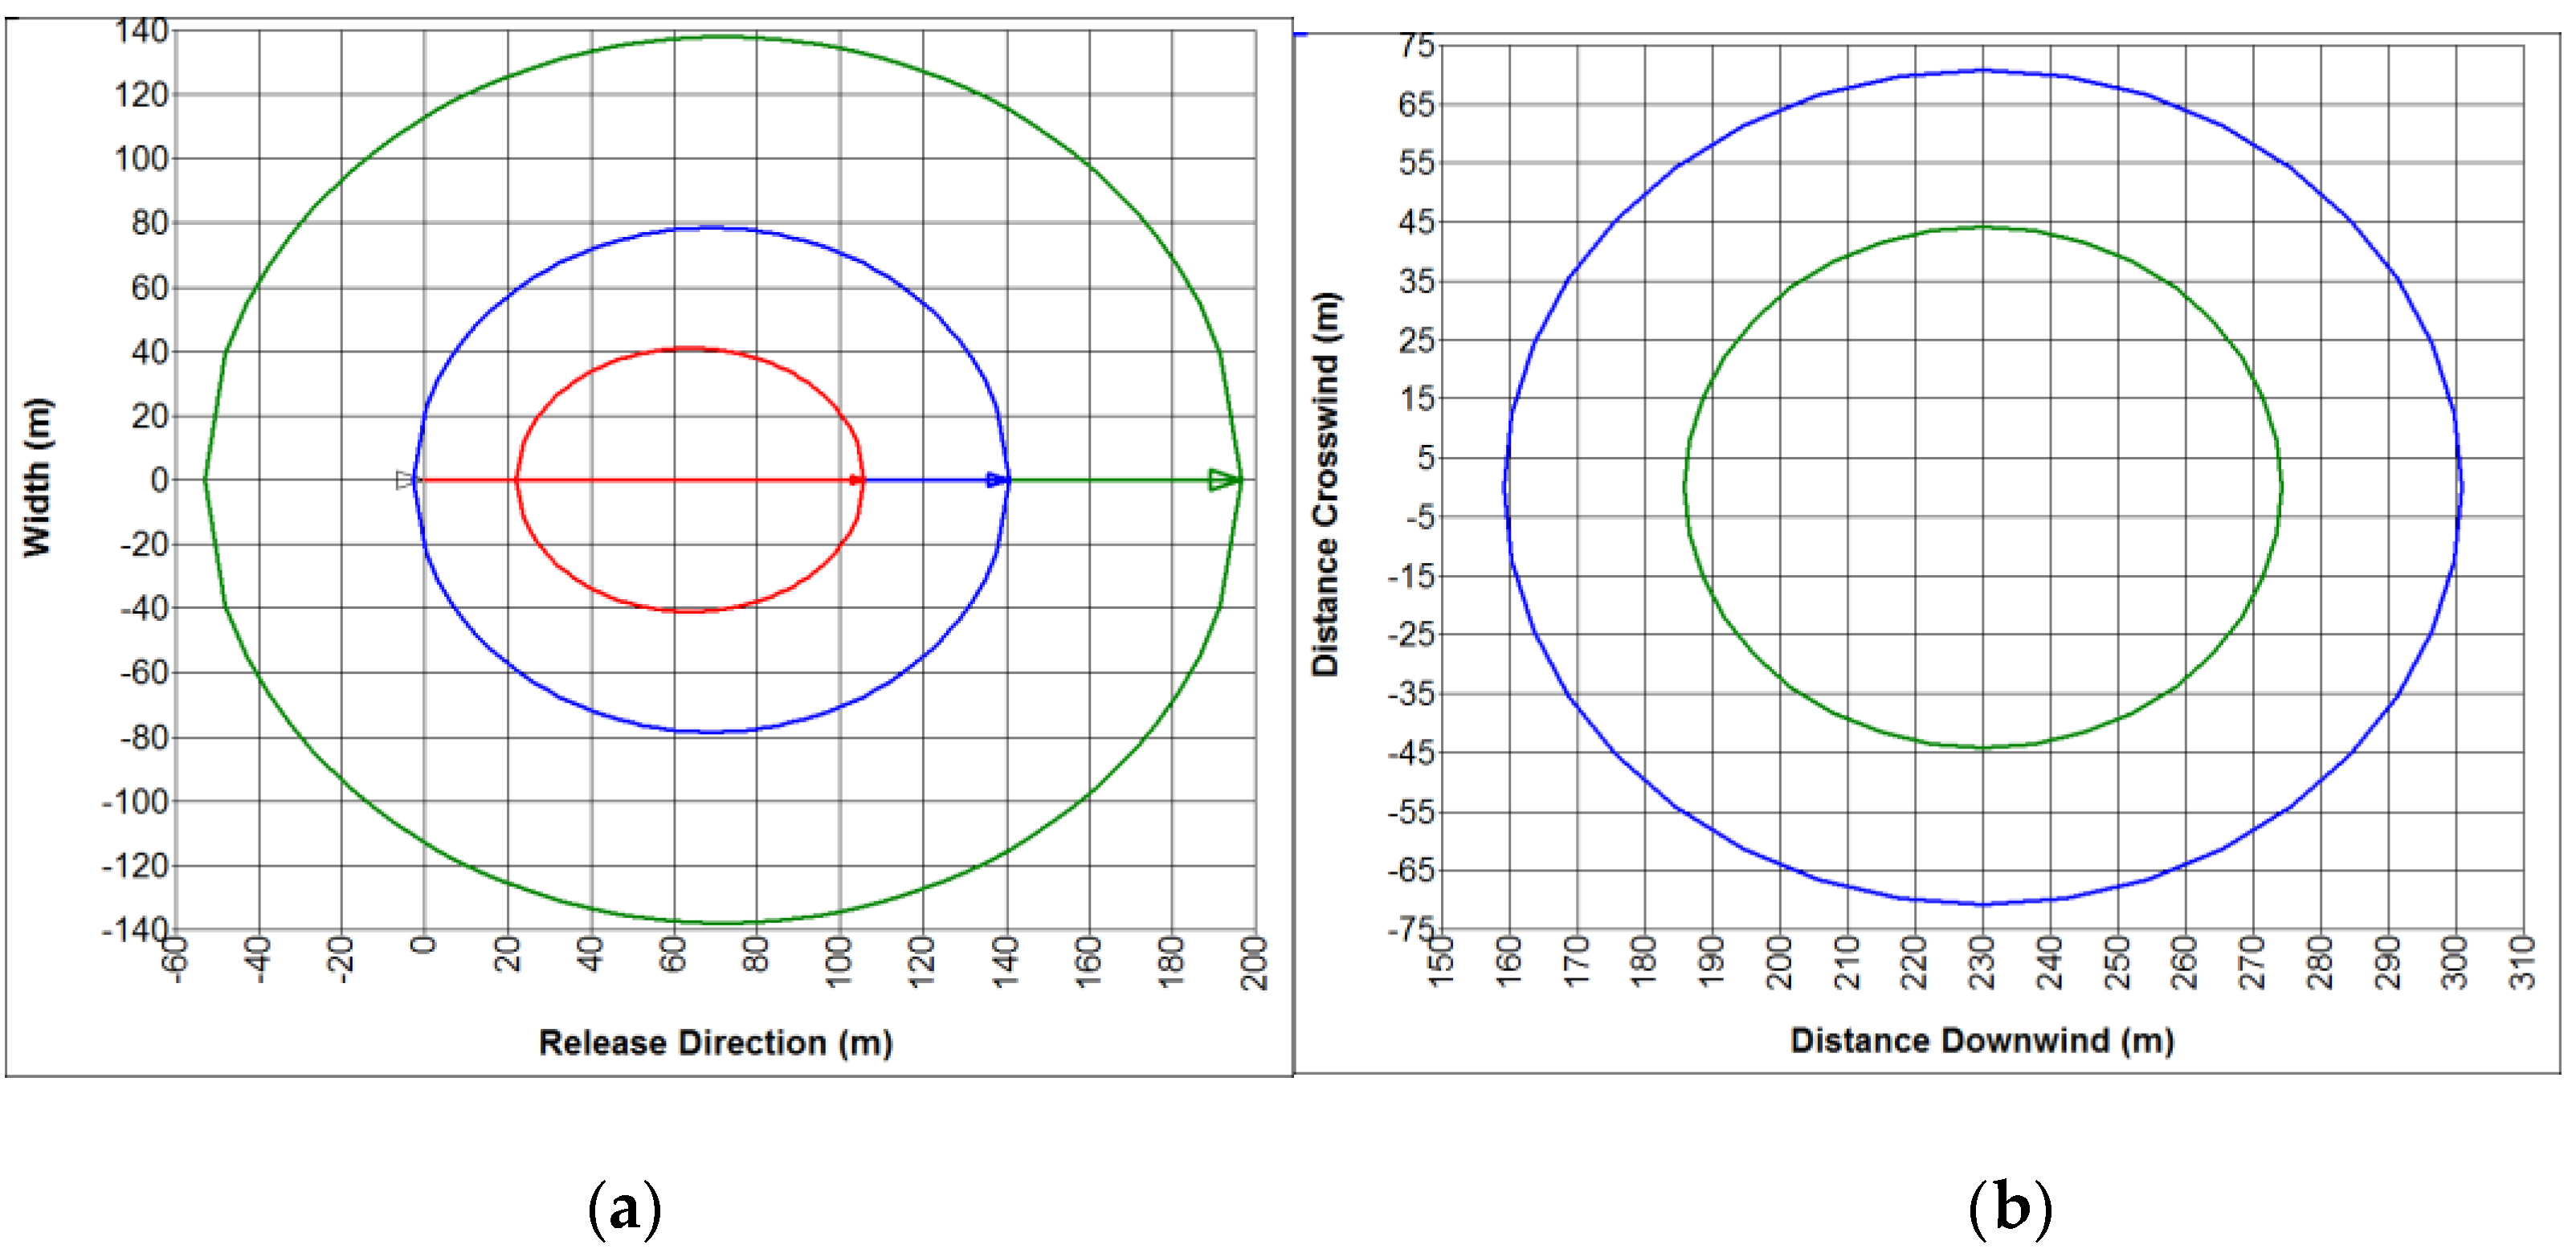
The figures below show the hazard zones arising due to the impact of this type of fire as well as due to explosions of gas released from a 50 km long pipeline with a diameter of 0.5 m transporting natural gas under pressure p = 5 MPa. Natural gas was released through a hole created after an excavator bucket hit the pipeline. Two cases of pipeline damage were investigated. In the first case, the hole had an area of about 20% of the pipeline cross-sectional area. In the second case, a larger damage area of 50% of the pipeline cross-sectional area was assumed. The wind speed and the ambient temperature in the area of the gas leakage were adopted at 1.5 m/s and 20 °C, respectively. The calculations were performed using the PHAST v6.7 program [34].
The zones shown in the figures are related to the effects of a fire and an explosion in the form of a heat flux and overpressure, respectively. In Figure 16a, Figure 17a, Figure 18a and Figure 19a, the red lines represent zones with heat fluxes above 37.5 kW/m2, the blue lines represent those at 12.5 kW/m2 and the green lines represent those at 4 kW/m2. The values of 4, 12.5 and 37.5 kW/m2 are defined as the limits of the heat flux values, which, if exceeded, result in pain, first-degree burns and human death, respectively. In Figure 16b, Figure 17b, Figure 18b and Figure 19b, the green lines show the zones with overpressure above 0.344 bar and the blue lines show the zones above 0.16 bar. The overpressure values of 0.16 and 0.344 bar, respectively, are the lower limits of pressure causing structural damage and damage to human lungs. The results shown in Figure 16 and Figure 17 pertain to the cases where the area of damage is equal to 20% (a = 0.2) and 50% (a = 0.5) of the pipe diameter, respectively.
All of the zones are presented for the least favourable scenarios of failure, i.e., for those where the range of the effect of a given phenomenon is the greatest. In the case of a fire, this is the immediate ignition of a jet of natural gas released under high pressure. In the event of an explosion, this is a delayed ignition with the largest mass of the gas–air mixture formed, with a concentration corresponding to the lower explosive limit.
The next figure shows the hazard zones for the same dangerous phenomena caused by natural gas release and ignition, but this time a complete rupture of the pipeline is assumed.
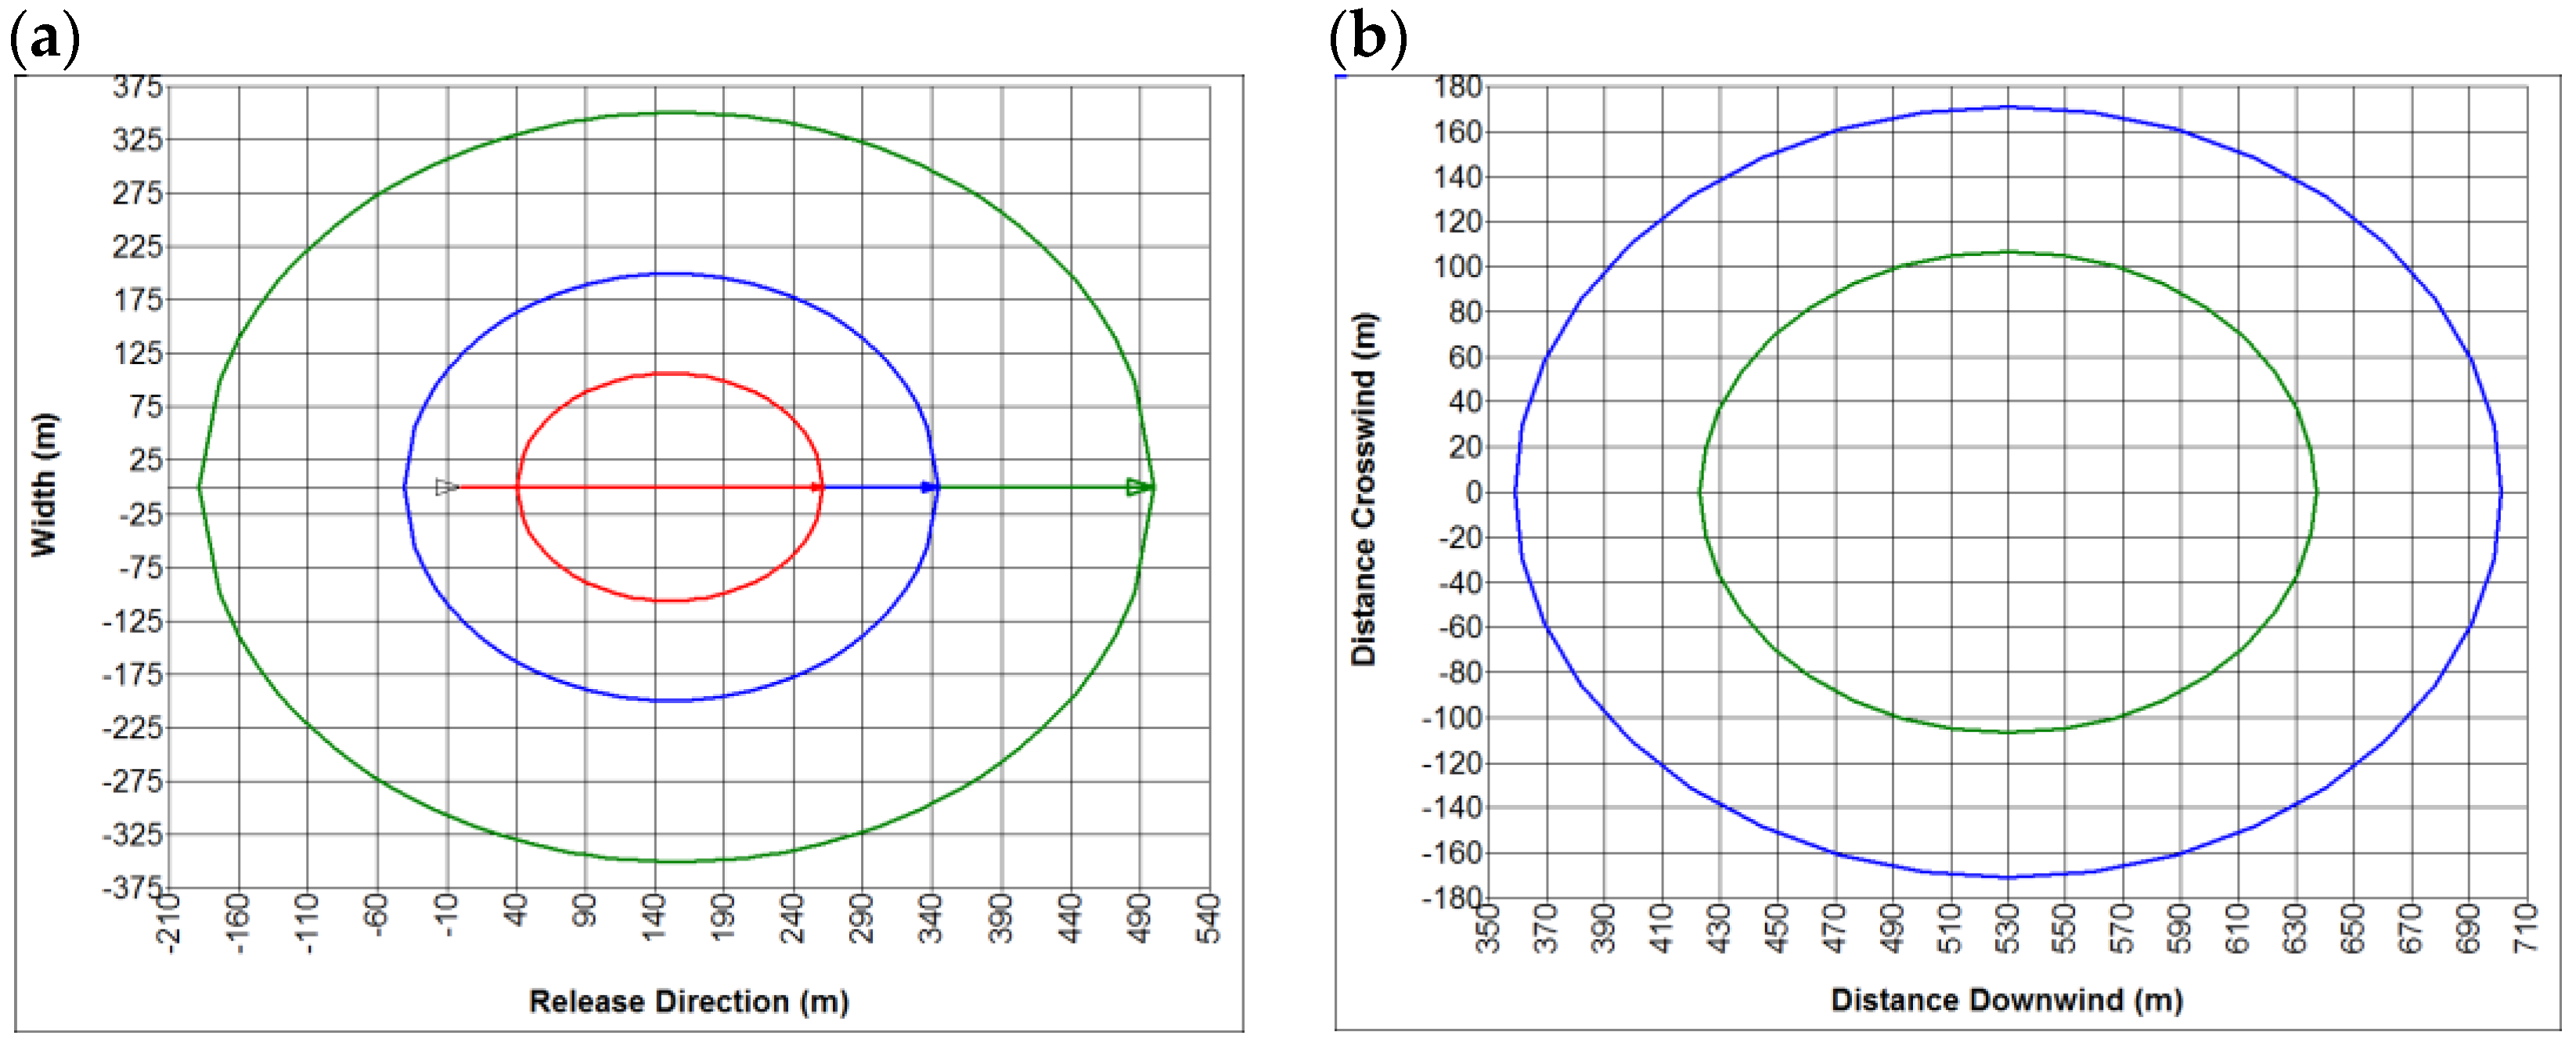
Analysing the figures presented above, it can be seen that, the bigger the degree of pipeline damage, the larger the hazard posed to humans and the surroundings. For example, for a jet fire of natural gas released from the pipeline, the hazard zone increases by about 25 metres on average for increase in the size of the pipeline damage analysed.
The essential factors that affect the hazard level also include the gas parameters and pressure, in first place. Therefore, the figures below present changes in the range of the hazard zones arising due to the release of natural gas through a hole for which the ratio of its surface area to the pipeline cross-sectional area is 0.2 at the gas lower pressure value of 1 MPa. The ranges of the hazard zones are almost two times smaller.
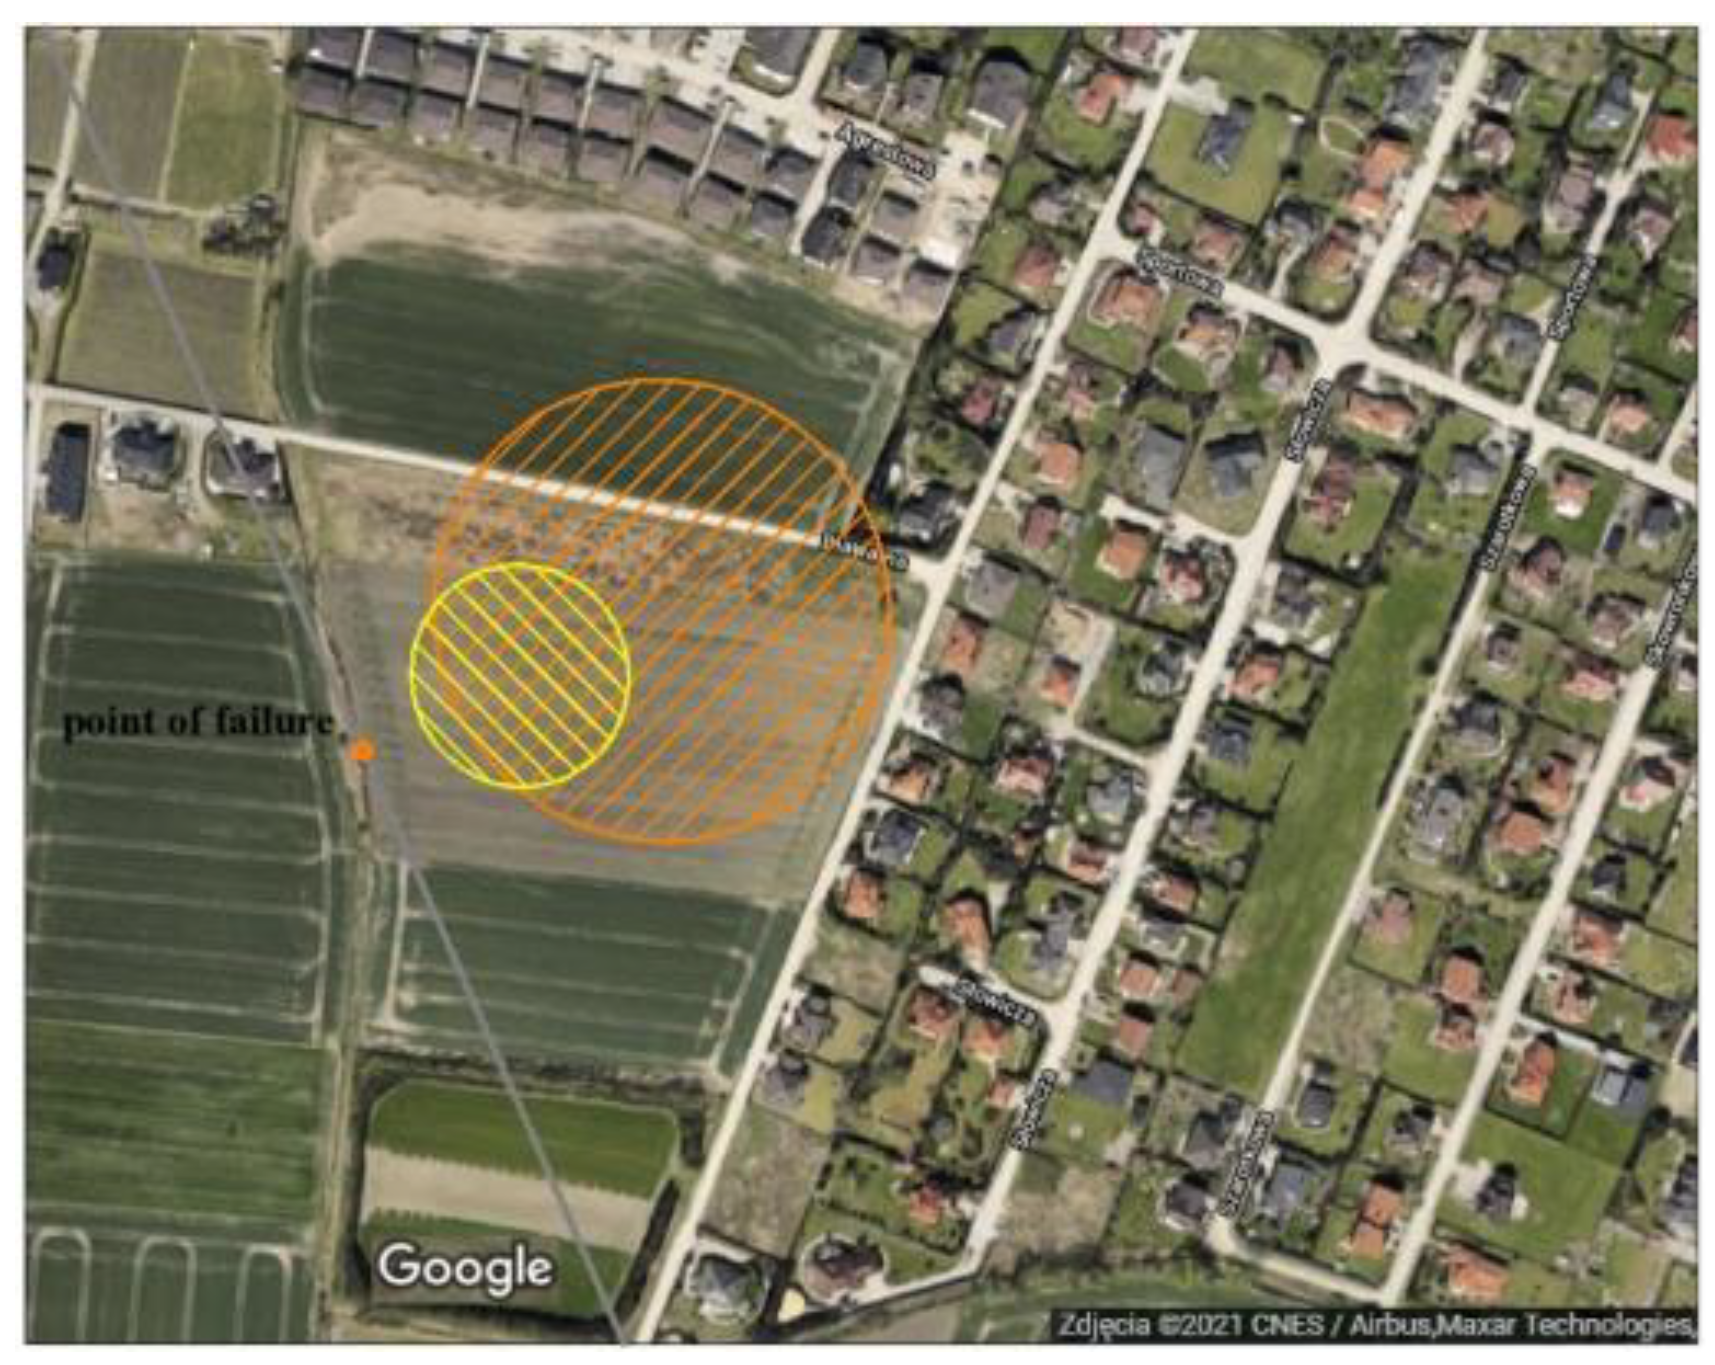
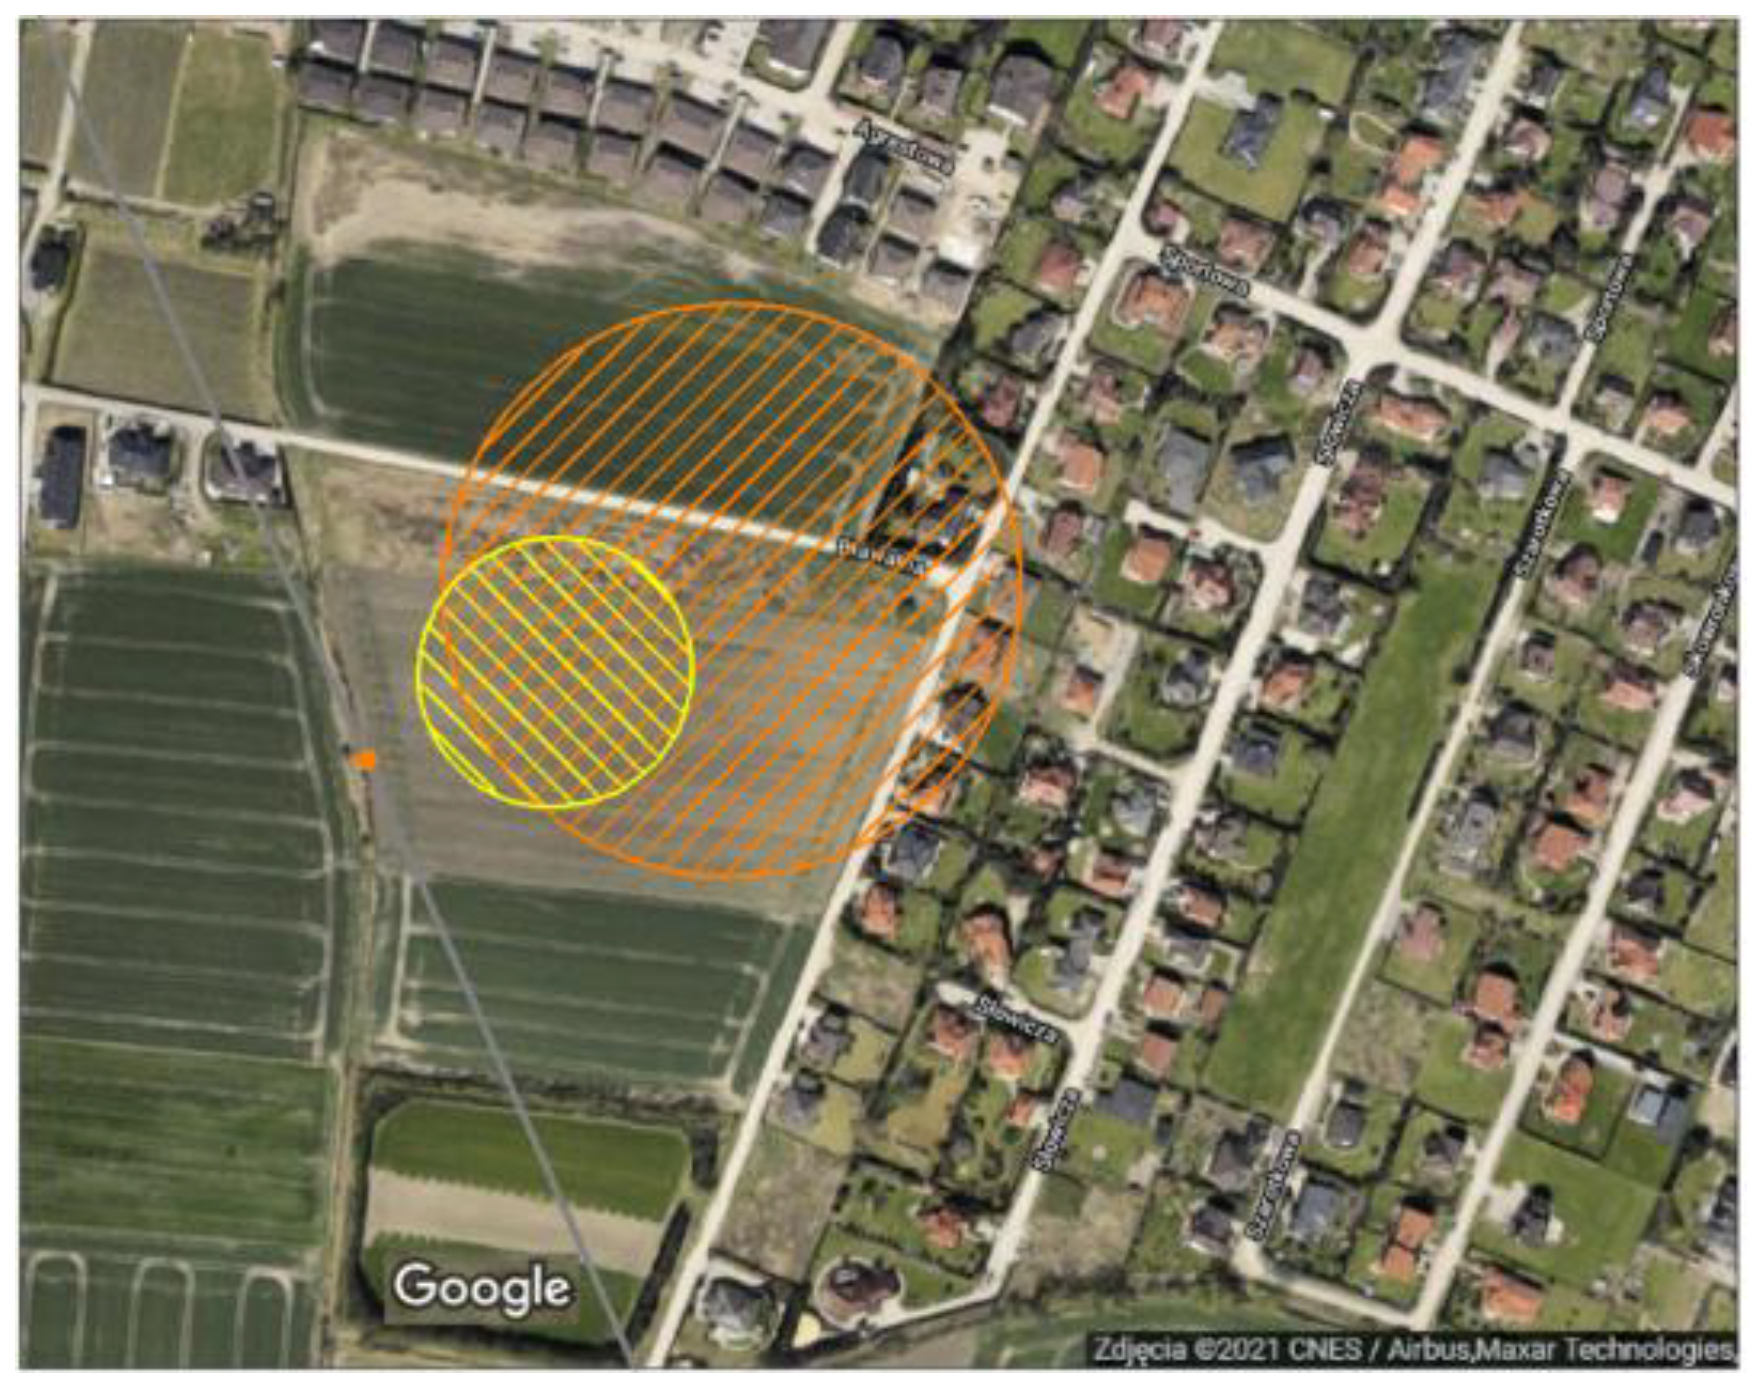
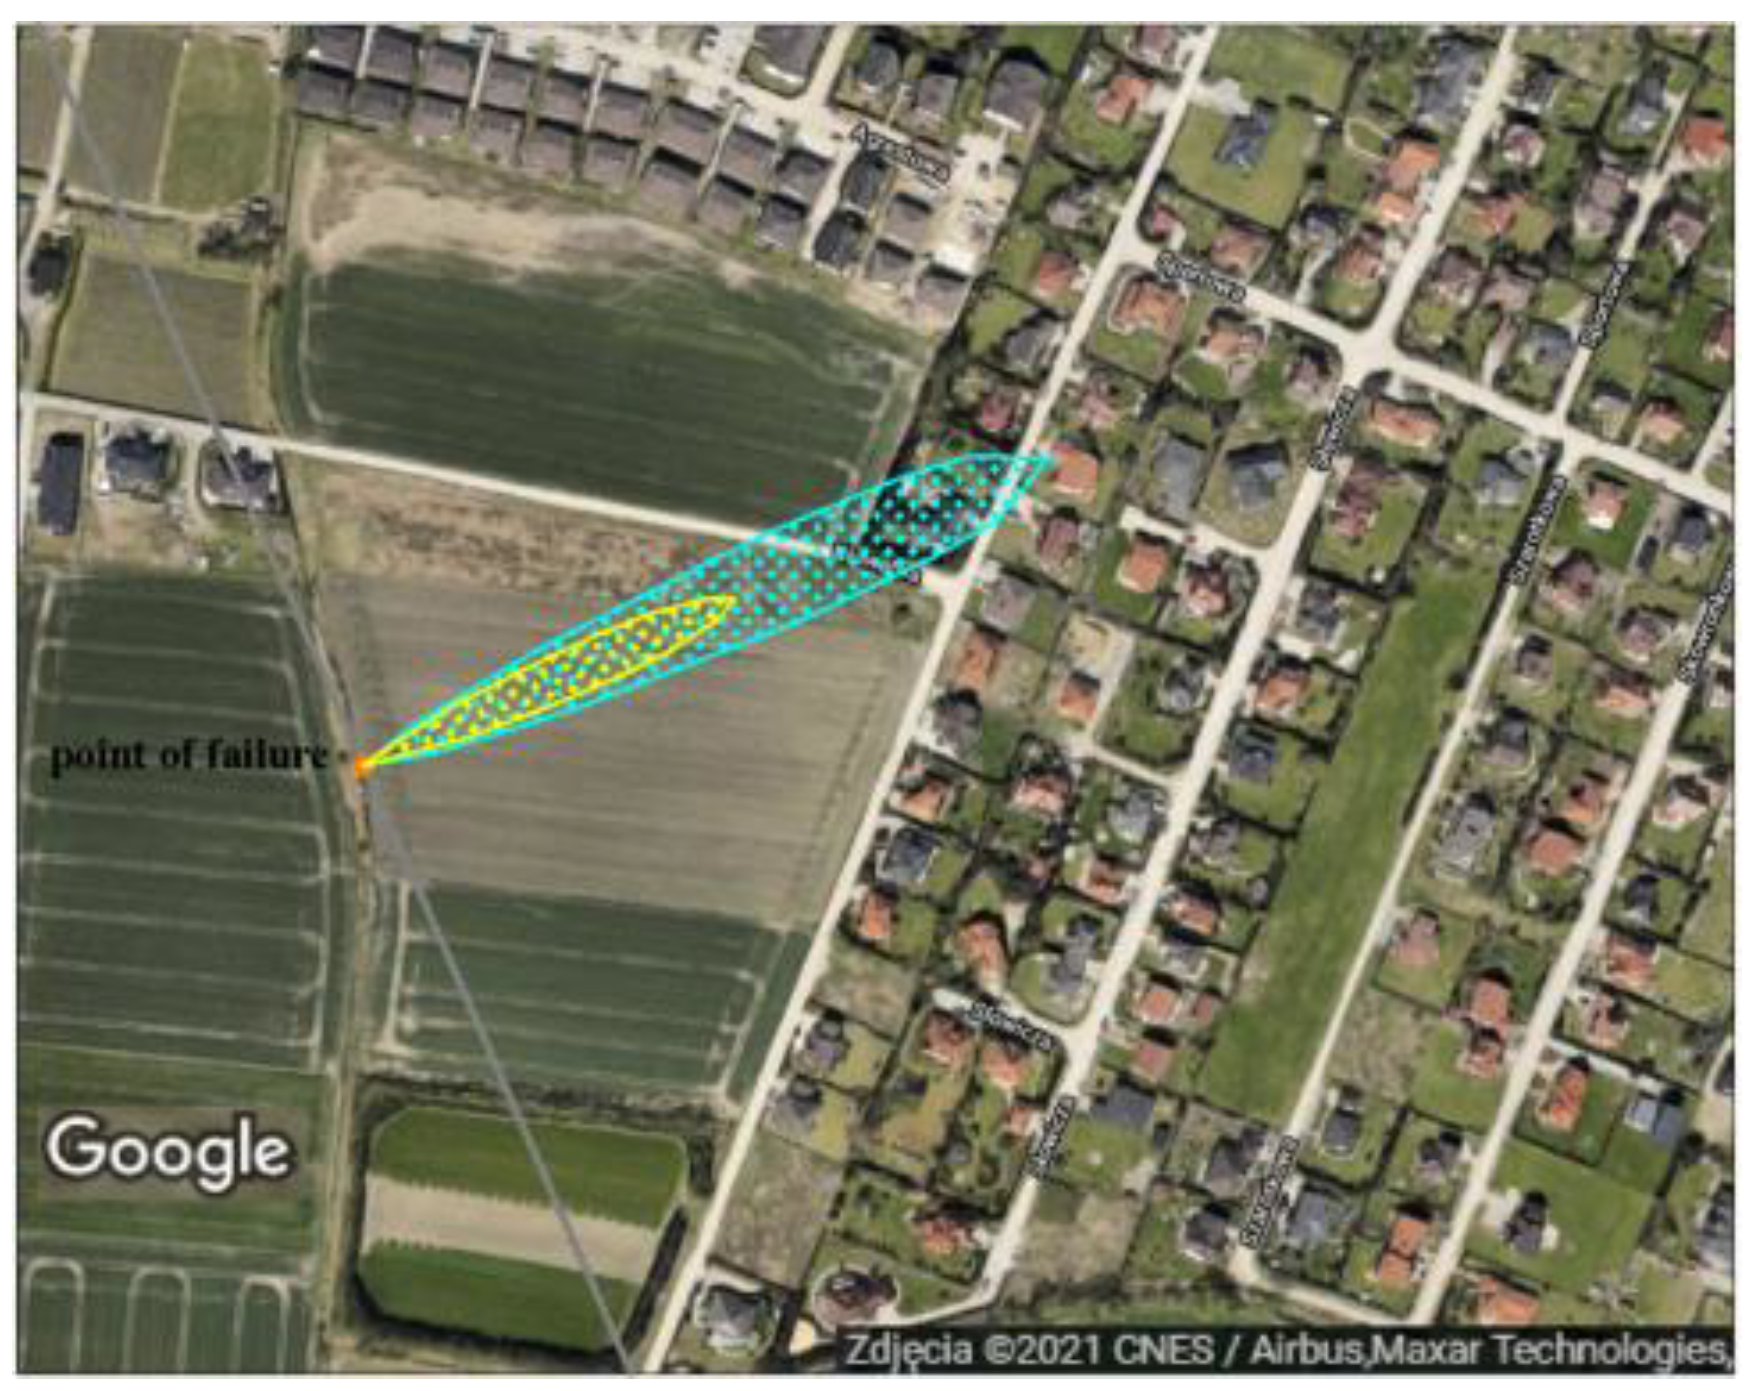
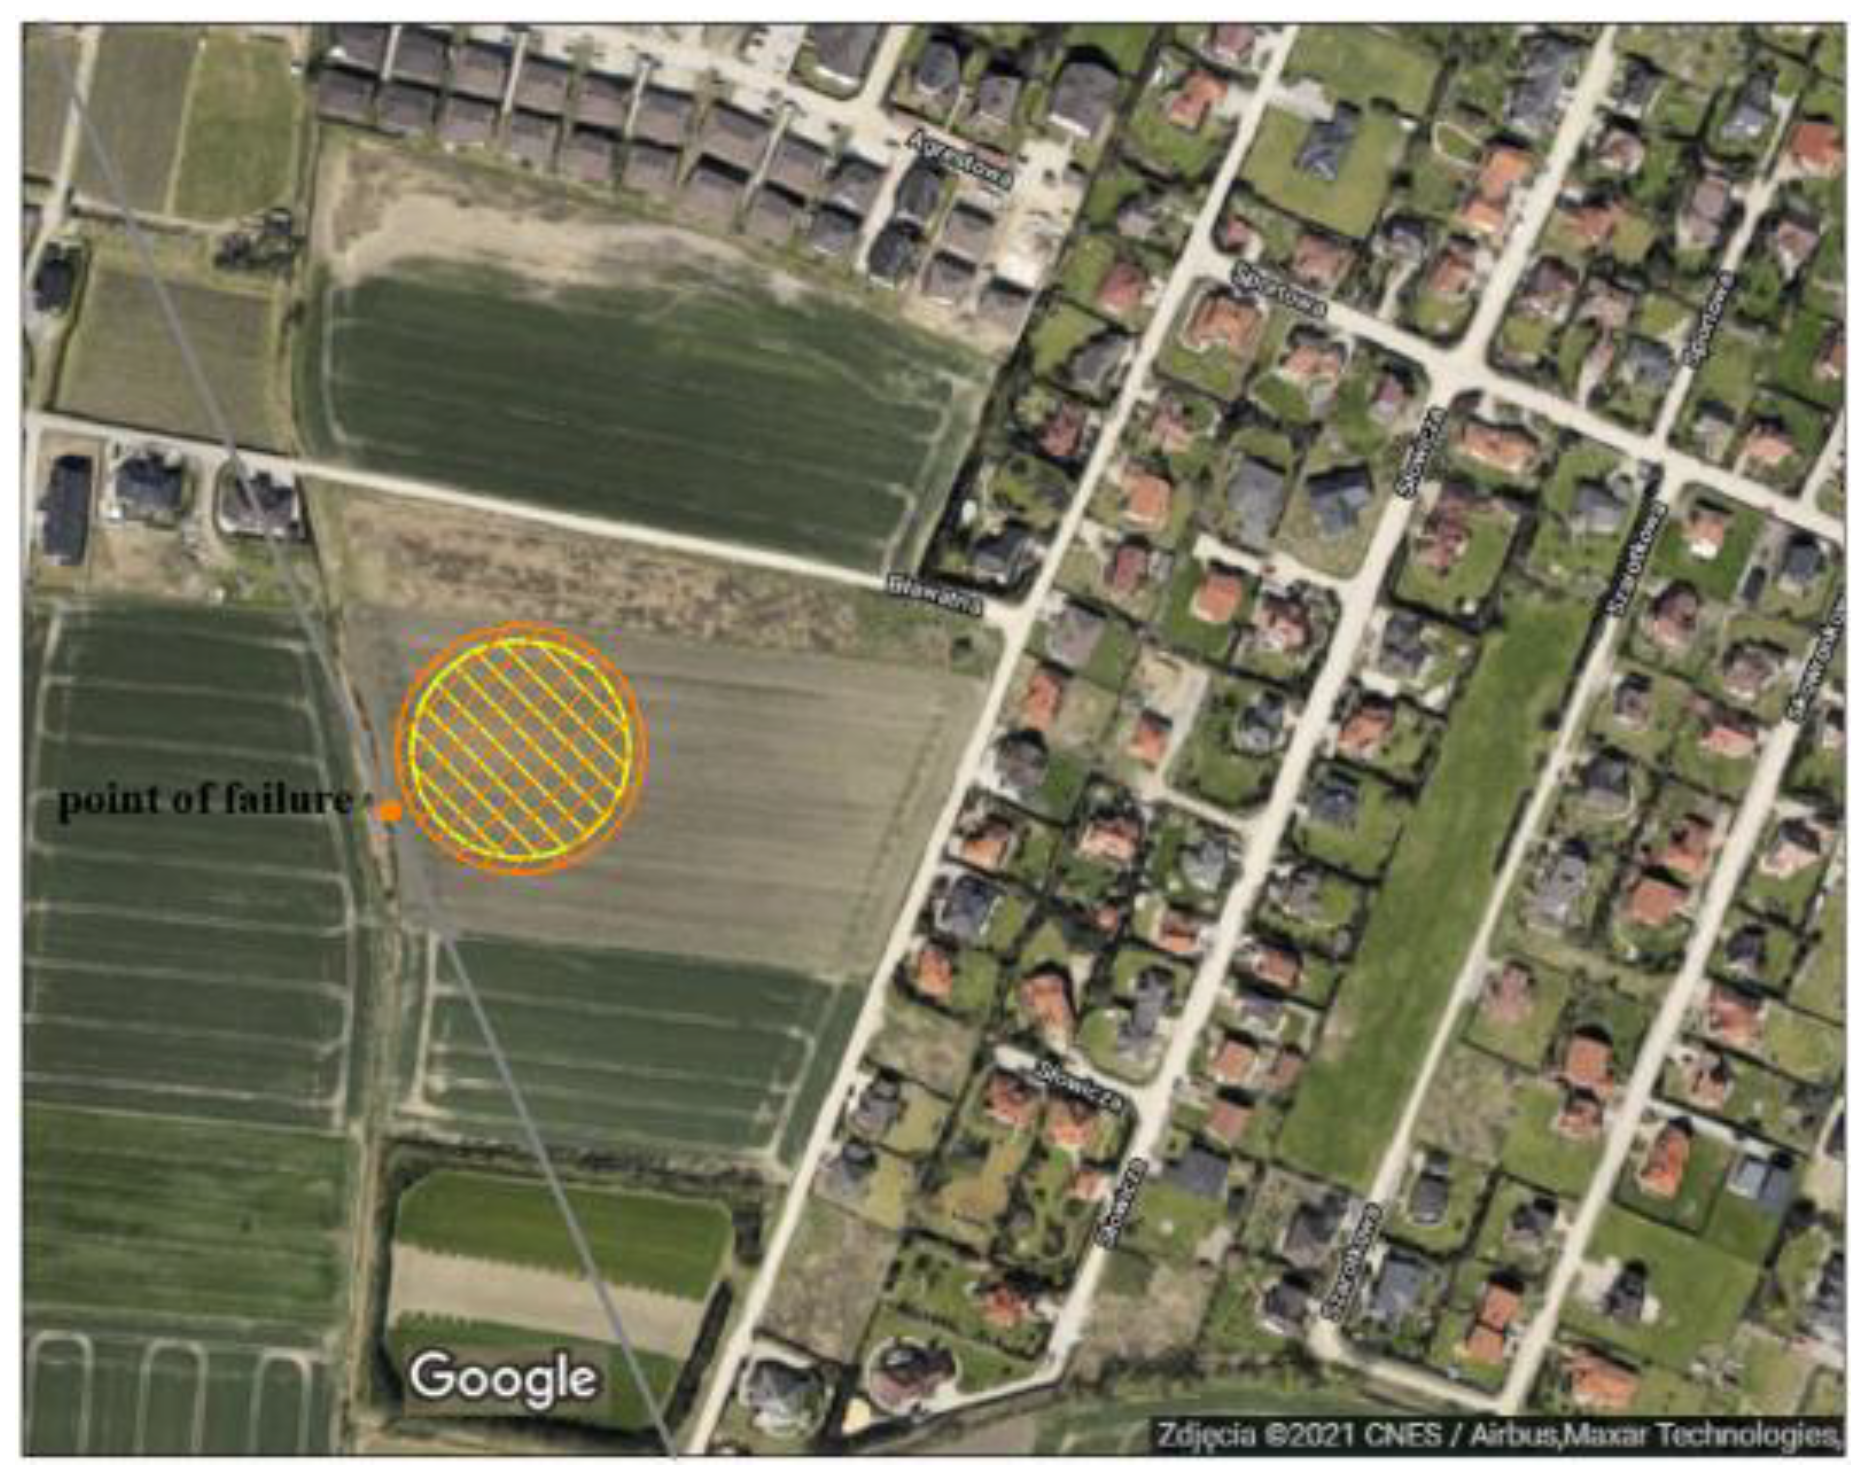
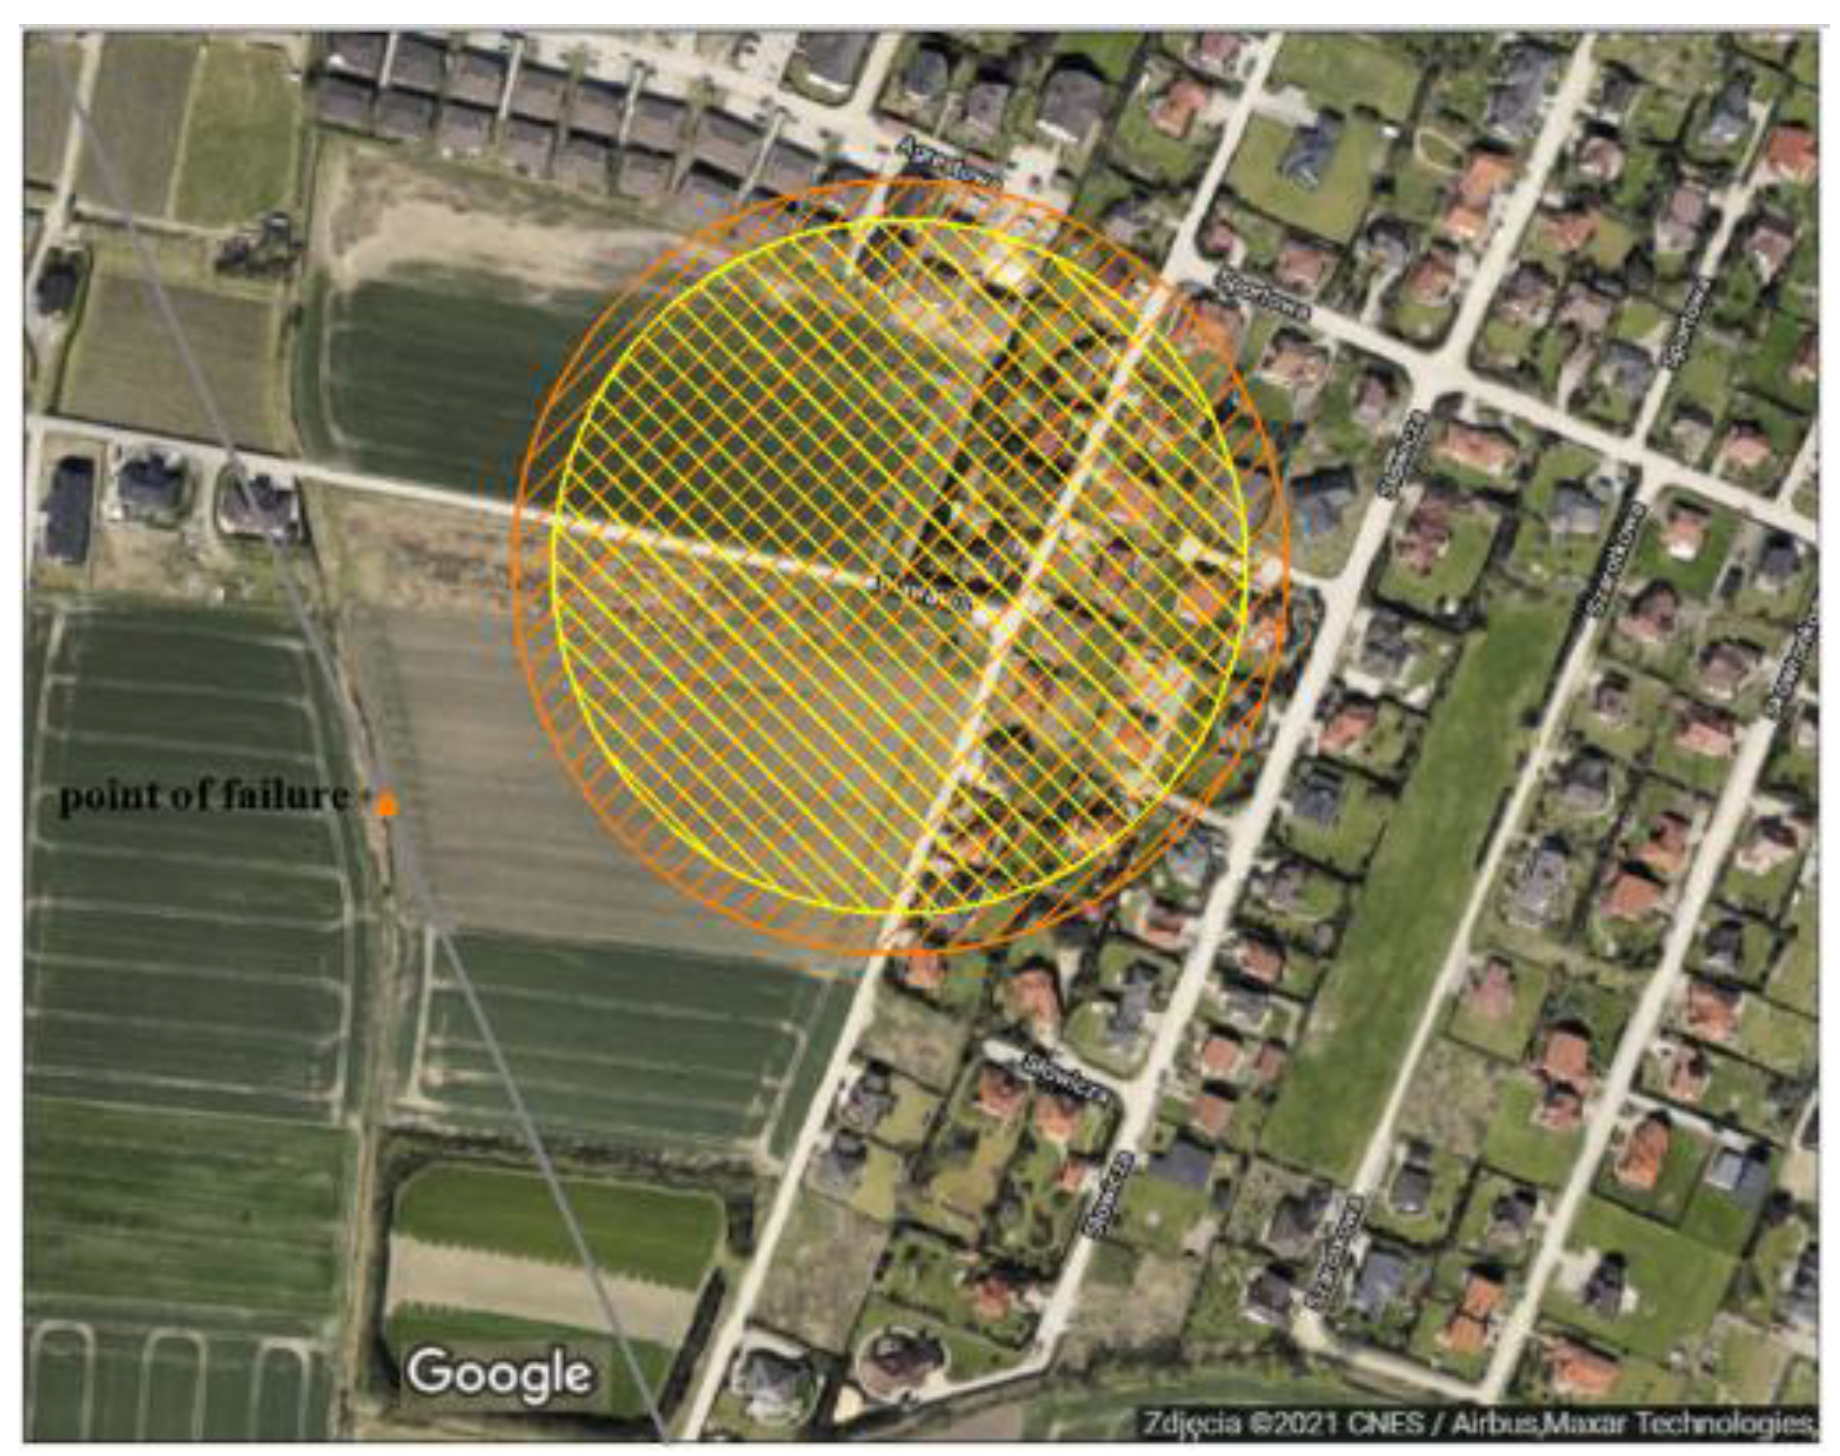
As already mentioned, the negative effects of a fire or an explosion of natural gas released from the pipeline are much more dramatic when the pipeline is located in populated areas. Examples of such a hypothetical localisation of the gas leakage are presented in Figure 20, Figure 21, Figure 22, Figure 23 and Figure 24. The hazard zones arising due to the heat flux generated from a fire caused by natural gas released from an example pipeline are shown in the figures below. The distance of the failure site from built-up areas is approximately 150 m. The zones marked in yellow and orange indicate the range within which the heat flux value causes human death. In the analysed scenario for a pipeline with a diameter of 0.5 m, partial damage is assumed (a = 0.2) with gas pressure values of 5 MPa (orange) and 1 MPa (yellow) (cf. Figure 20). Higher gas pressure values cause stronger outflows of the gas jet. As a result, the hazard zone moves away from the site of the pipeline failure to a certain degree. It can also be noticed that, if the damage size and the gas pressure are increased (cf. Figure 21), the range of the hazard zones becomes substantially bigger. In the case under consideration, it covers an area with buildings in the vicinity of the potential failure site.
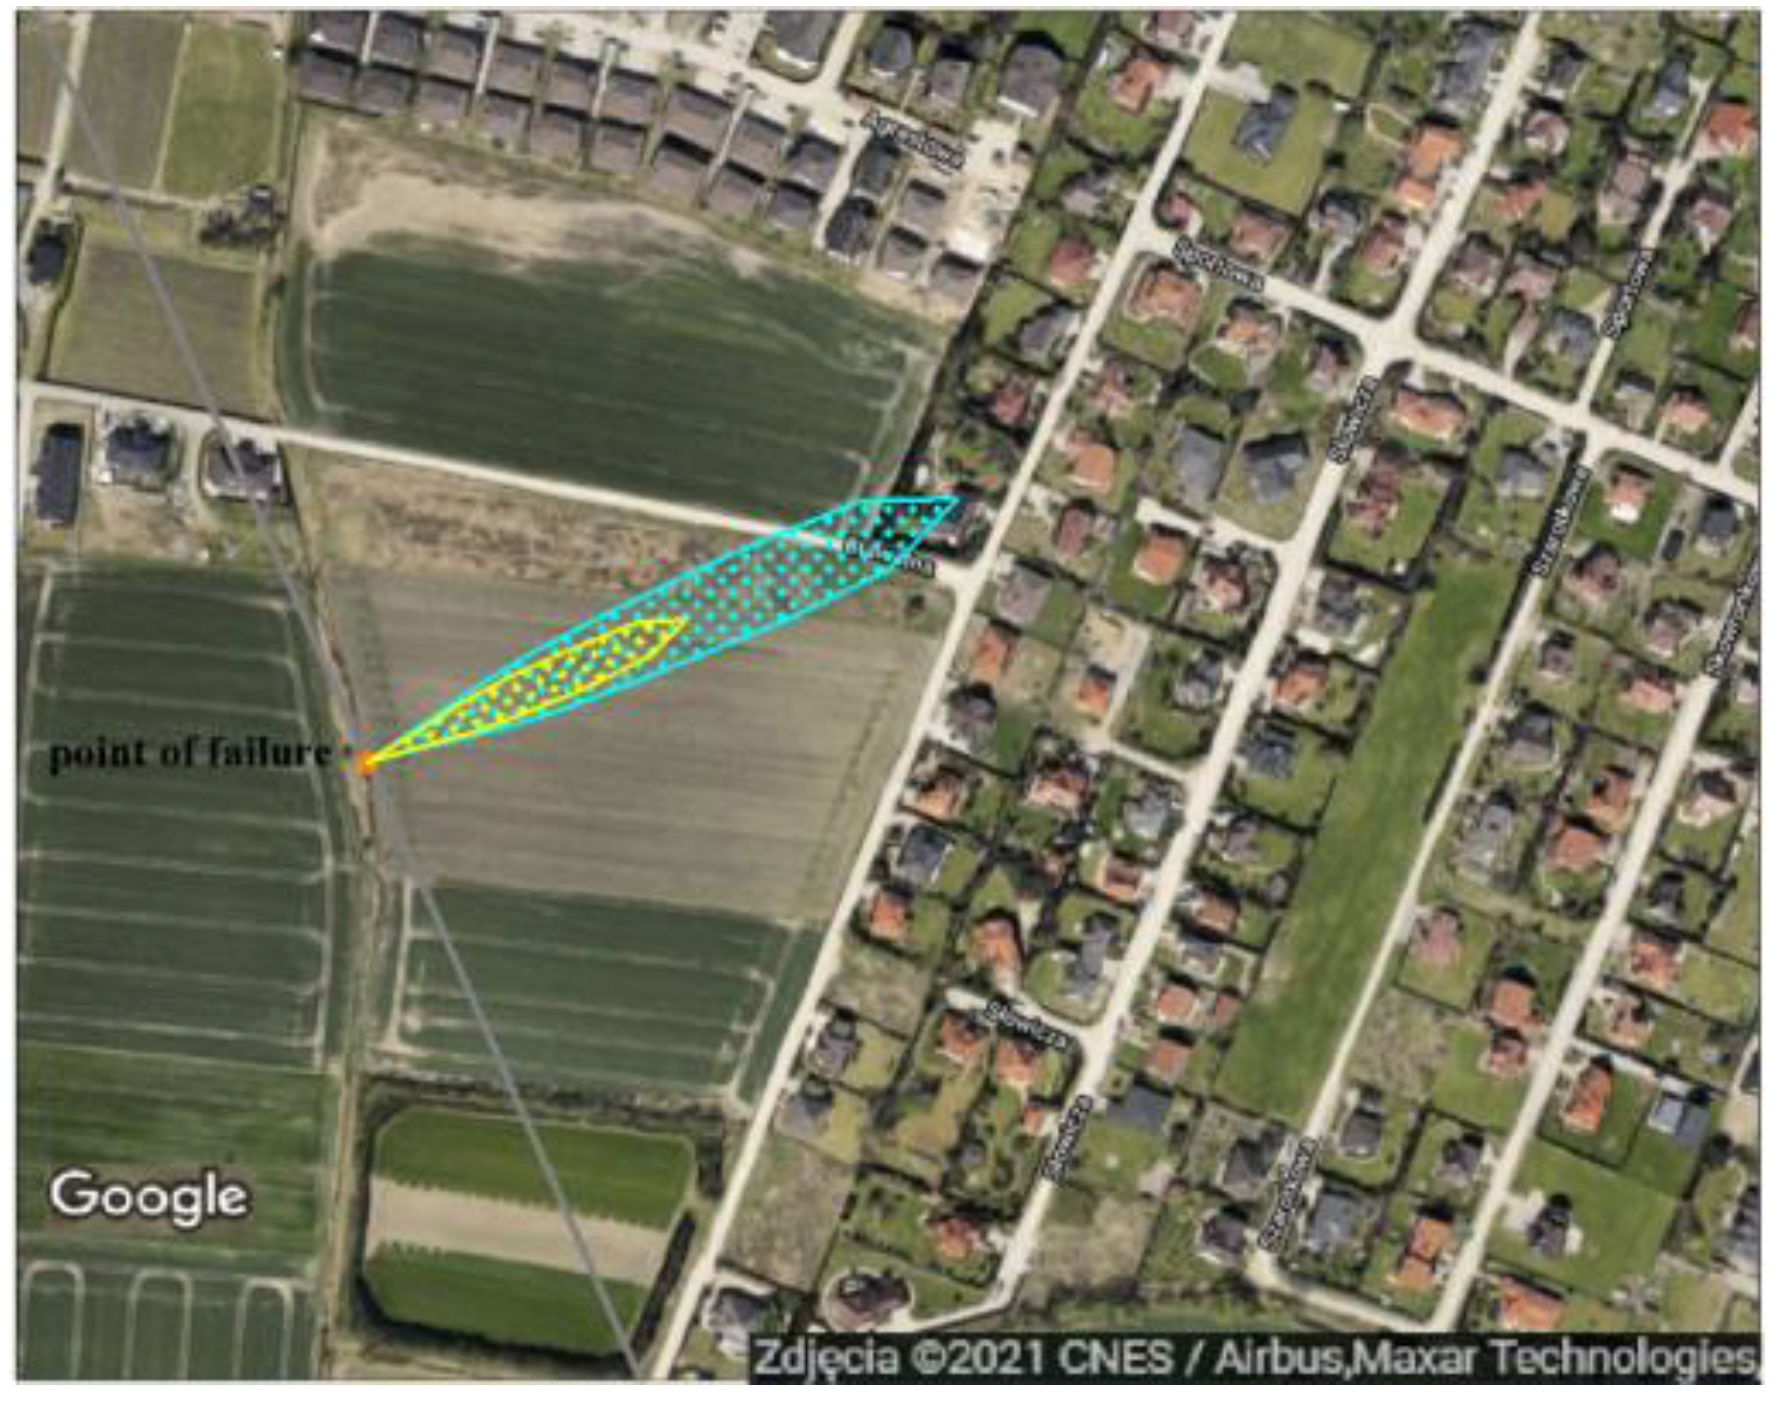
Explosions are another dangerous consequence of a natural gas leakage. It is triggered by a delayed ignition of the gas–air mixture. In this case, the significant factor determining the occurrence of an explosion is the gas concentration in the cloud. The concentration level should be between the gas’s lower and upper explosion limits. For natural gas, such a concentration value varies from 4.4% to 17%. Therefore, Figure 22 and Figure 23 present the zones with the concentration value equal to or higher than the lower explosion limit of natural gas. Two variants of partial damage are assumed in the analysis: a = 0.2 (yellow) and a = 0.5 (turquoise). The time of the formation of a cloud with a dangerous concentration varies depending on the gas pipeline size and the transported gas parameters. In the case under consideration, i.e., for a gas pressure of 5 MPa, a pipeline length of 25 km and a pipeline diameter of 500 mm, the time of formation of the largest cloud with a concentration level corresponding to the lower explosion limit totals 19.5 s; if the gas pressure is 1 MPa, such a cloud is formed in about 29 s.
If an ignition source occurs within the hazard zones, the explosion may generate overpressure. The areas affected by the consequences of a gas explosion are shown in the figures below.
As already mentioned, if there is an ignition source in the above-illustrated zones with an increased gas concentration, an explosion occurs. The pictures below present the hazard zones arising due to an explosion and the formation of overpressure of over 34.4 kPa. This value causes damage to human lungs as well as to buildings.
The zone for the natural gas pressure in the pipeline of 1 MPa is marked in yellow and for the pressure of 5 MPa is marked in orange. In the analysis shown in Figure 24, it is assumed that the point from which the gas cloud ignites is located at a distance of L = 50 m from the site of the pipeline rupture, and an explosion occurs when the gas cloud contains a large amount of natural gas that is released in a very short time after the failure, i.e., 1 s.
The figure presented above indicates that, in the case of a very short time from natural gas release and the close proximity of the ignition source, the hazard zones reach a range posing no threat to the buildings located near the example failure site. Figure 25 presents a scenario of an event with delayed explosion of the gas cloud when the ignition source is L = 200 m from the pipeline failure site.
In this case, the time it takes the cloud to reach the concentration corresponding to the lower explosion limit is longer and totals to about 7 s for a gas pressure of 5 MPa and 16 s for a gas pressure of 1 MPa. The mass of the gas–air mixture affected by the explosion is also bigger, which substantially extends the area of potential damage caused by the explosion.
4. Conclusions
The paper presents an analysis of the possible consequences of damage to a gas pipeline caused by machines used in construction. This is one of the most common causes of damage to pipelines. The size of the damage and, consequently, the amount of released gas depend not only on the dimensions and shape of the element that hits the pipeline but also on the response of the excavator operator after the impact. In the case of a pipeline with the diameter of 0.5 m analysed, the area of the hole created due to the impact of the excavator bucket can total to about 20% and sometimes even up to 50% of the pipeline cross-sectional area. If ignition occurs, the gas escaping through such a hole presents a serious hazard due to thermal radiation. The hazard zone has a range of up to 200 m from the gas release site. A similar threat is the overpressure that may arise due to an explosion caused by the gas released. In this case, the location of the ignition source is also an important factor.
Author Contributions
Conceptualisation, A.R. and K.S.-A.; methodology, A.R.; software, K.S.-A. and K.R. (Krzysztof Rogoziński); validation, K.K. and K.R. (Krzysztof Rusin); formal analysis, K.S.-A.; investigation, K.S.-A., K.R. (Krzysztof Rogoziński) and K.K.; writing—original draft preparation, K.R.; writing—review and editing, A.R.; visualisation, K.R. (Krzysztof Rogoziński); supervision, A.R.; funding acquisition A.R. All authors have read and agreed to the published version of the manuscript.
Funding
The presented work was supported by the Silesian University of Technology with means from statutory research funds.
Conflicts of Interest
The authors declare no conflict of interest.
Nomenclature
| A | Cross-sectional area | m2 |
| a | rupture-to-pipe-cross-sectional areas ratio | - |
| c | discharge coefficient | - |
| L | distance from the rupture to the point of ignition | m |
| mass flow rate | kg/s | |
| p | pressure | Pa |
| κ | isentropic exponent | - |
| ρ | density | kg/m3 |
References
- Available online: https://www.statista.com/statistics/265407/world-natural-gas-consumption-by-country/ (accessed on 10 September 2021).
- Osiadacz, A.J.; Isoli, N. Multi-objective optimization of gas pipeline networks. Energies 2020, 13, 5414. [Google Scholar] [CrossRef]
- Anderson, D.A. Natural gas transmission pipelines: Risk and remedies for host communities. Energies 2020, 13, 1873. [Google Scholar] [CrossRef]
- European Gas Pipeline Incident Data Group (EGIG). 11th Report of the European Gas Pipeline Incident Data Group (Period 1970–2019). December 2020. Available online: https://www.egig.eu/reports (accessed on 10 September 2021).
- US DOT Pipeline and Hazardous Materials Safety Administration, Pipeline Incidents. 2021. Available online: https://www.bts.gov/content/hazardous-liquid-and-natural-gas-pipeline-safety-and-property-damage-data (accessed on 10 September 2021).
- Rusin, A.; Stolecka, K. Modelling the effects of failure of pipelines transporting hydrogen. Chem. Process. Eng. 2011, 32, 117–134. [Google Scholar] [CrossRef]
- Li, X.; Chen, G.; Zhu, H. Quantitative risk analysis on leakage failure of submarine oil and gas pipelines using Bayesian network. Process. Saf. Environ. Prot. 2016, 103, 163–173. [Google Scholar] [CrossRef]
- Abd, A.A.; Naji, S.Z.; Hasim, A.S. Failure analysis of carbon dioxide corrosion through wet natural gas gathering pipelines. Eng. Fail. Anal. 2019, 105, 638–646. [Google Scholar] [CrossRef]
- Bianchini, A.; Guzzini, A.; Pellegrini, M.; Saccani, C. Natural gas distribution system: A statistical analysis of accidents data. Int. J. Press. Vessel. Pip. 2018, 168, 24–38. [Google Scholar] [CrossRef]
- Biezma, M.V.; Andrés, M.A.; Agudo, D.; Briz, E. Most fatal oil & gas pipeline accidents through history: A lesson learned approach. Eng. Fail. Anal. 2020, 110, 104446. [Google Scholar]
- Qin, G.; Gong, C.; Wang, Y. A probabilistic-based model for predicting pipeline third-party hitting rate. Process. Saf. Environ. Prot. 2021, 148, 333–341. [Google Scholar] [CrossRef]
- Hao, Y.; Yang, W.; Xing, Z.; Yang, K.; Sheng, L.; Yang, J. Calculation of accident probability of gas pipeline based on evolutionary tree and moment multiplication. Int. J. Press. Vessel. Pip. 2019, 176, 103955. [Google Scholar] [CrossRef]
- Sharbani, H.; Goudarzi, N.; Shabani, M. Failure analysis of a natural gas pipeline. Eng. Fail. Anal. 2018, 84, 167–184. [Google Scholar] [CrossRef]
- Zhao, Y.; Song, M. Failure analysis of a natural gas pipeline. Eng. Fail. Anal. 2016, 63, 61–71. [Google Scholar] [CrossRef]
- Qiao, Q.; Cheng, G.; Li, Y.; Wu, W.; Hu, H.; Huang, H. Corrosion failure analyses of an elbow and an elbow-to-pipe weld in a natural gas gathering pipeline. Eng. Fail. Anal. 2017, 82, 599–616. [Google Scholar] [CrossRef]
- He, B.; Han, P.; Lu, C.; Bai, X. Effect of soil particle size on the corrosion behavior of natural gas pipeline. Eng. Fail. Anal. 2015, 58, 19–30. [Google Scholar] [CrossRef]
- Xu, T.; Yao, A.; Jiang, H.; Li, Y.; Zeng, X. Dynamic response of buried gas pipeline under excavator loading: Experimental/numerical study. Eng. Fail. Anal. 2018, 89, 57–73. [Google Scholar] [CrossRef]
- Wu, K.; Zhang, H.; Liu, X.; Bolati, D.; Lliu, G.; Chen, P.; Zhao, Y. Stress and strain analysis of buried PE pipelines subjected to mechanical excavation. Eng. Fail. Anal. 2016, 106, 104171. [Google Scholar] [CrossRef]
- Han, Z.Y.; Weng, W.G. An integrated quantitative risk analysis method for natural gas pipeline network. J. Loss Prev. Process. Ind. 2010, 23, 428–436. [Google Scholar] [CrossRef]
- Kabir, G.; Sadiq, R.; Tesfamariam, S. A fuzzy Bayesian belief network for safety assessment of oil and gas pipelines. Struct. Infrastruct. Eng. 2016, 12, 874–889. [Google Scholar] [CrossRef]
- Guo, Y.; Meng, X.; Wang, D.; Meng, T.; Liu, S.; He, R. Comprehensive risk evaluation of long-distance oil and gas transportation pipelines using a fuzzy Petri net model. J. Nat. Gas Sci. Eng. 2016, 33, 18–29. [Google Scholar] [CrossRef]
- Cunha, S.B. Comparison and analysis of pipeline failure statistics. In Proceedings of the Biennial International Pipeline Conference, IPC, Calgary, AB, Canada, 24–28 September 2012; pp. 521–530. [Google Scholar]
- Rusin, A.; Stolecka, K. Effects of serious failures of natural gas pipelines. Rynek Energii 2009, 85, 97–102. [Google Scholar]
- Adegboye, M.A.; Fung, W.-K.; Karnik, A. Recent Advances in Pipeline Monitoring and Oil Leakage Detection Technologies: Principles and Approaches. Sensors 2019, 19, 2548. [Google Scholar] [CrossRef] [Green Version]
- Wang, H.; Duncan, I.J. Likelihood, causes, and consequences of focused leakage and rupture of U.S. natural gas transmission pipelines. J. Loss Prev. Process. Ind. 2014, 30, 177–187. [Google Scholar] [CrossRef]
- Johnson, G.R.; Cook, W.H. A constitutive model and data for etas subjected to large strain, high strain rates and high temperatures. In Proceedings of the 7th International Symposium on Ballistics, Hague, The Netherlands, 19–21 April 1983; pp. 541–547. [Google Scholar]
- Chen, G.; Huang, X. Simulation o deformation and fracture characteristics of a 45 steel Taylor impact specimen. Eng. Trans. 2016, 64, 225–240. [Google Scholar]
- Ansys 2019 Software; Ansys: Canonsburg, PA, USA, 2019.
- Bosch, C.J.H.; Weterings, R.A.P.M. (Eds.) Yellow Book; TNO: The Hague, The Netherlands, 2005. [Google Scholar]
- Jo, Y.D.; Ahn, B.J. Analysis of hazard areas associated with high-pressure natural-gas pipelines. J. Loss Prev. Process. Ind. 2002, 15, 179–188. [Google Scholar] [CrossRef]
- LaChance, J.; Tchouvelev, A.; Engebo, A. Development of uniform harm criteria for use in quantitative risk analysis of the hydrogen infrastructure. Int. J. Hydrogen Energy 2011, 36, 2381–2388. [Google Scholar] [CrossRef]
- Rusin, A.; Stolecka, K. Reducing the risk level for pipelines transporting carbon dioxide and hydrogen by means of optimal safety valves spacing. J. Loss Prev. Process. Ind. 2015, 33, 77–87. [Google Scholar] [CrossRef]
- Han, Z.Y.; Weng, W.G. Comparison study on qualitative and quantitative risk assessment methods for urban natural gas pipeline network. J. Hazard. Mater. 2011, 189, 509–518. [Google Scholar] [CrossRef]
- Phast v6.7, DNV Software; DNV: Oslo, Norway, 2017.
Figure 1.
Top 14 consumers of natural gas in 2018.

Figure 2.
Total length of the European gas transmission system in the EGIG in 2019.

Figure 3.
Number of incidents per year (EGIG Pipeline Network).

Figure 4.
Number of incidents per year in the USA.

Figure 5.
Number of fatalities and injuries per year in the USA.

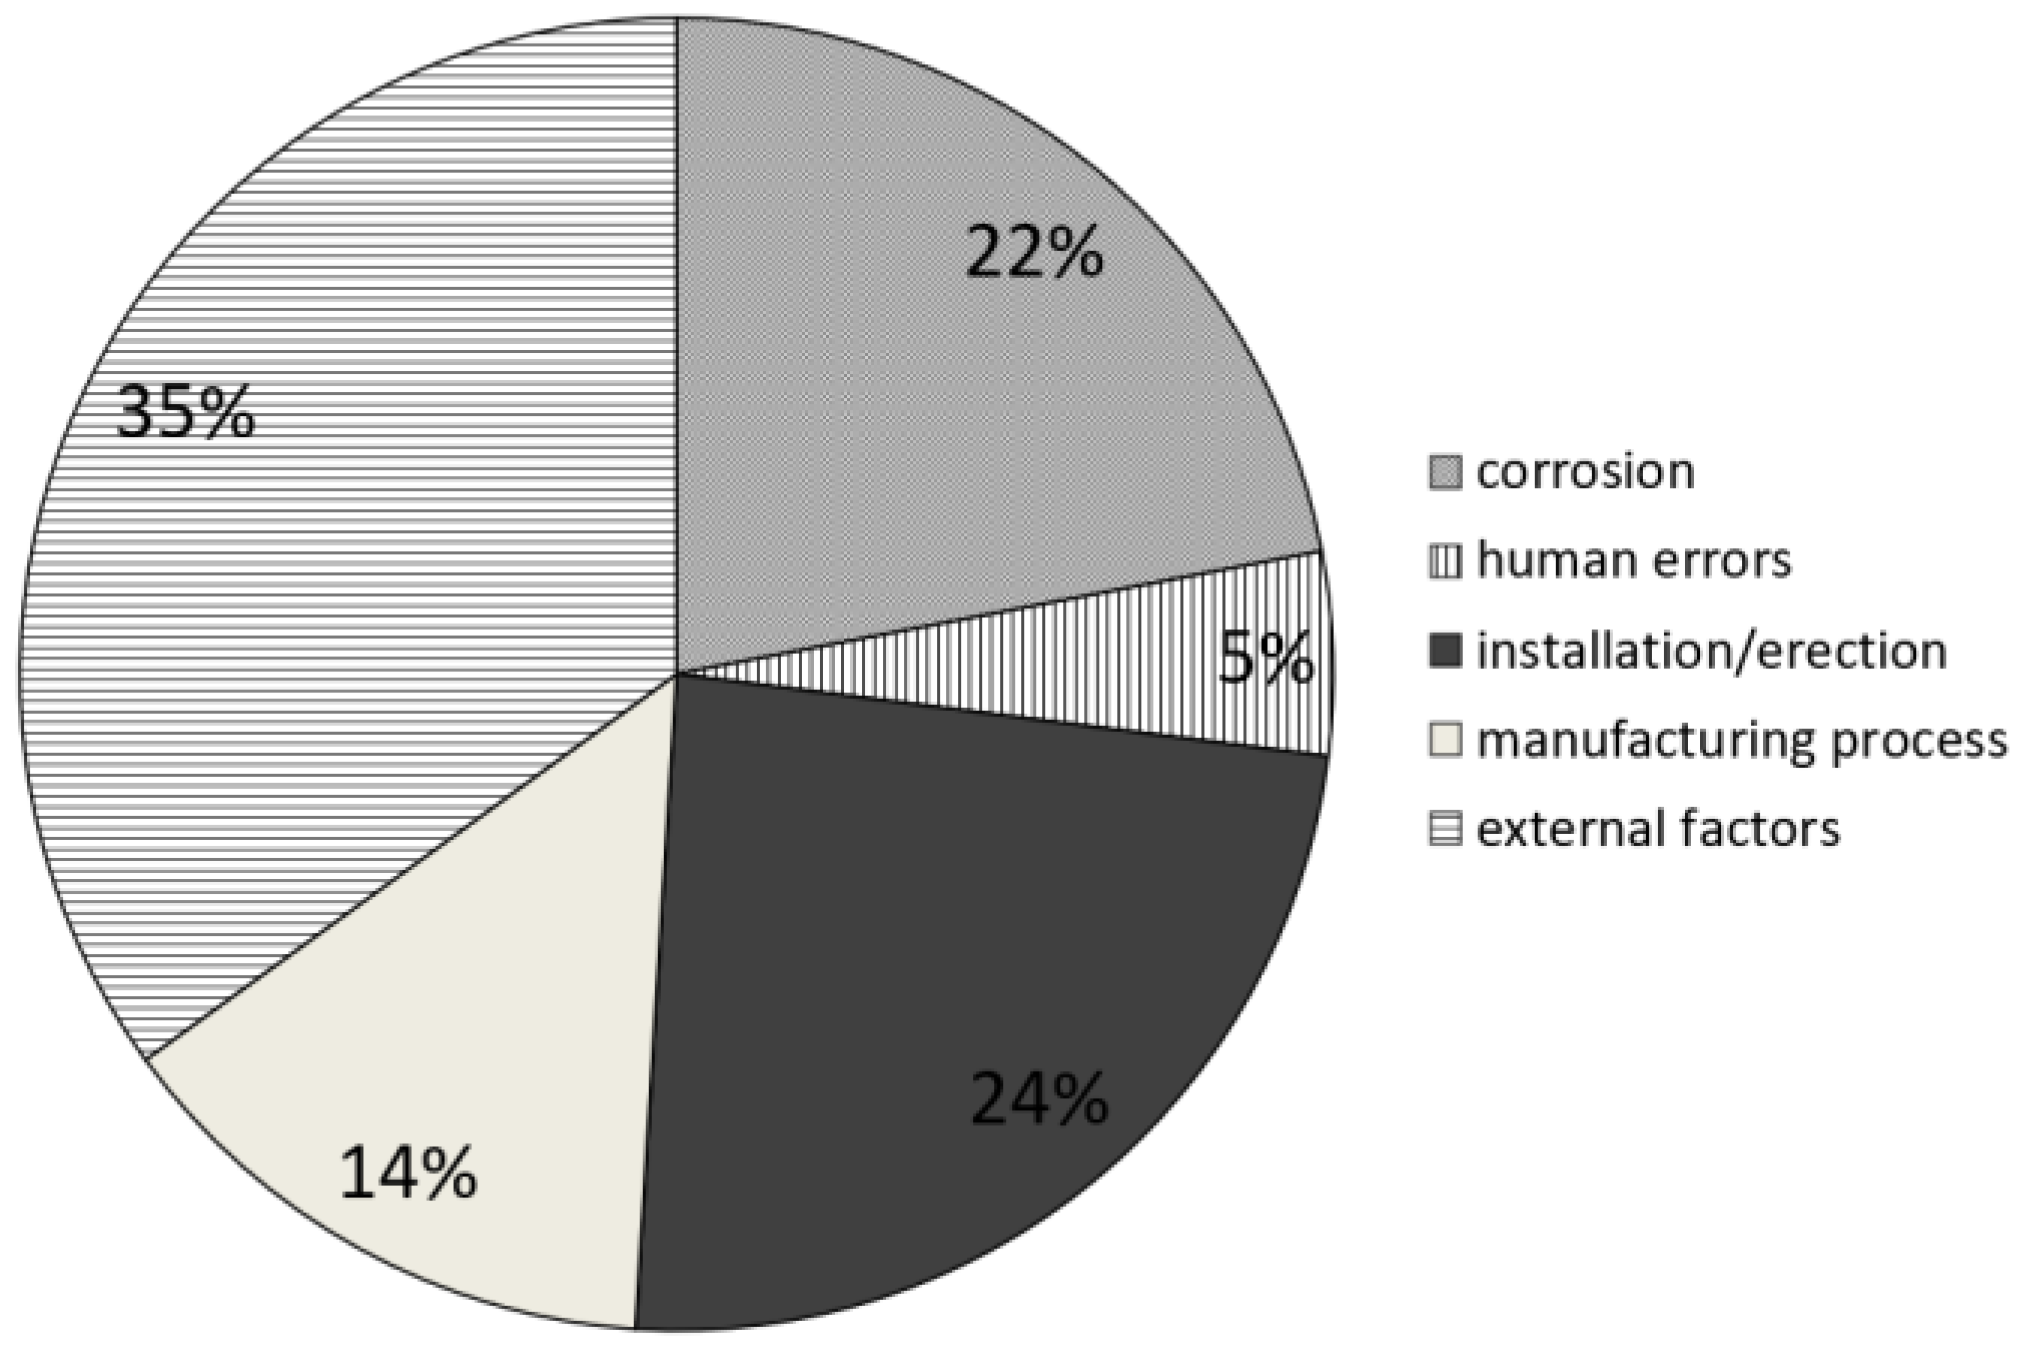
Figure 6.
Sources of pipeline failure [24].
Figure 6.
Sources of pipeline failure [24].


Figure 8.
Model of the excavator bucket teeth.

Figure 9.
Variants in the excavator bucket positioning in relation to the pipeline axis: (a) bucket in the pipeline axis, (b) bucket perpendicular to the pipeline axis and (c) bucket rotated by 45° in relation to the pipeline axis.
Figure 9.
Variants in the excavator bucket positioning in relation to the pipeline axis: (a) bucket in the pipeline axis, (b) bucket perpendicular to the pipeline axis and (c) bucket rotated by 45° in relation to the pipeline axis.


Figure 10.
Pipeline damage for Variant 1—effective stress values.

Figure 11.
Pipeline damage for Variant 2—effective stress values.

Figure 12.
Pipeline damage for Variant 3—effective stress values.


Figure 13.
Development of the pipeline destruction at the bucket position according to Variant 1.

Figure 14.
Development of the pipeline destruction at the bucket position according to Variant 3.

Figure 15.
Mass flow through the hole (puncture/rupture) in the pipeline for various gas pressures in the pipeline: (a) p = 1 MPa and (b) p = 5 MPa.
Figure 15.
Mass flow through the hole (puncture/rupture) in the pipeline for various gas pressures in the pipeline: (a) p = 1 MPa and (b) p = 5 MPa.

Figure 16.
Hazard zones due to a jet fire (a) and an explosion (b) for a natural gas pipeline (a = 0.2).
Figure 16.
Hazard zones due to a jet fire (a) and an explosion (b) for a natural gas pipeline (a = 0.2).

Figure 17.
Hazard zones due to a jet fire (a) and an explosion (b) for a natural gas pipeline (a = 0.5).
Figure 17.
Hazard zones due to a jet fire (a) and an explosion (b) for a natural gas pipeline (a = 0.5).

Figure 18.
Hazard zones due to a jet fire (a) and an explosion (b) for a natural gas pipeline (a = 1).
Figure 18.
Hazard zones due to a jet fire (a) and an explosion (b) for a natural gas pipeline (a = 1).

Figure 19.
Hazard zones due to a jet fire (a) and an explosion (b) for a natural gas pipeline (a = 0.2, p = 1 MPa).
Figure 19.
Hazard zones due to a jet fire (a) and an explosion (b) for a natural gas pipeline (a = 0.2, p = 1 MPa).

Figure 20.
Hazard zones due to a jet fire for a natural gas pipeline (a = 0.2): yellow zone, p = 1 MPa; orange zone, p = 5 MPa.
Figure 20.
Hazard zones due to a jet fire for a natural gas pipeline (a = 0.2): yellow zone, p = 1 MPa; orange zone, p = 5 MPa.

Figure 21.
Hazard zones due to a jet fire for a natural gas pipeline (a = 0.5): yellow zone, p = 1 MPa; orange zone, p = 5 MPa.
Figure 21.
Hazard zones due to a jet fire for a natural gas pipeline (a = 0.5): yellow zone, p = 1 MPa; orange zone, p = 5 MPa.

Figure 22.
Rang of the natural gas cloud with a concentration above 4.4% (p = 1 MPa) for a = 0.2 (yellow area) and a = 0.5 (turquoise area).
Figure 22.
Rang of the natural gas cloud with a concentration above 4.4% (p = 1 MPa) for a = 0.2 (yellow area) and a = 0.5 (turquoise area).

Figure 23.
Range of natural gas cloud with a concentration of 4.4% (p = 5 MPa) for a = 0.2 (yellow area) and a = 0.5 (turquoise area).
Figure 23.
Range of natural gas cloud with a concentration of 4.4% (p = 5 MPa) for a = 0.2 (yellow area) and a = 0.5 (turquoise area).

Figure 24.
Hazard zones due to an explosion for a natural gas pipeline (a = 0.2, L = 50 m): yellow zone, p = 1 MPa; orange zone, p = 5 MPa.
Figure 24.
Hazard zones due to an explosion for a natural gas pipeline (a = 0.2, L = 50 m): yellow zone, p = 1 MPa; orange zone, p = 5 MPa.

Figure 25.
Hazard zones due to an explosion for a natural gas pipeline (a = 0.2, L = 200 m): yellow zone, p = 1 MPa; orange zone, p = 5 MPa.
Figure 25.
Hazard zones due to an explosion for a natural gas pipeline (a = 0.2, L = 200 m): yellow zone, p = 1 MPa; orange zone, p = 5 MPa.


Table 1.
Pipeline failure rate.
| Country/Region | Period | Frequency of Failure (per Year per km) |
|---|---|---|
| United States | 2004–2015 | 1.55 × 10⁻⁵ |
| Canada | 2011–2015 | 2.25 × 10⁻⁴ |
| Europe | 1970–2013 | 3.30 × 10⁻⁴ |
| United Kingdom | 1962–2014 | 2.19 × 10⁻⁴ |
| Brazil | 1978–2010 | 8.23 × 10⁻³ |
| Country | Year | Site, Hazard Scenario and Consequences |
|---|---|---|
| Canada | 2003 | On 24 April 2003, a gas explosion occurred in the Etobicoke district (Toronto, Ontario) as a result of damage caused to a gas pipeline by a backhoe loader, destroying a two-storey commercial and residential building. Seven people were killed and four others were injured. |
| Belgium | 2004 | On 30 July 2004, natural gas was released from a pipeline in the town of Ghislenghien (about 50 km from Brussels). A few minutes later, the leakage intensified and an explosion occurred. The gas cloud ignited, producing a “fireball”, which then turned into a long torch, the height of which was estimated at about 150–200 m. The fire rapidly engulfed nearby factories, parked cars, etc. With more than 20 dead and 132 injured, the accident qualified as the most serious industrial disaster in Belgium in half a century. The industrial zone was completely destroyed within a radius of 200 m, and the damage caused by the accident was worth about 100 million euros. |
| Canada | 2009 | On 20 July 2009, the fire and explosion caused by a gas pipeline operated by the Trans Canada Corporation destroyed two hectares of forestland. Corrosion was cited as the cause of the pipeline damage. |
| USA | 2010 | A gas pipeline explosion on 9 September 2010 in San Bruno (a suburb of San Francisco) killed 8 people and injured 58; 38 houses were destroyed. The fire is believed to have been caused by an explosion caused by the gas pipeline rupture due to lack of inspections and maintenance, and poor pipe quality control. |
| Canada | 2011 | On 19 February 2011, an explosion and a fire from TransCanada gas pipelines occurred in Beardmore, Ontario. The failure resulted in a large crater and damage to the pipe system. Six residents near the failure site were evacuated until the fire was extinguished. No fatalities were reported. |
| Canada | 2012 | On 23 June 2012, an ignition and a fire occurred in a valve closure structure at the Spectra Energy Transmission Compressor Station N4, located approximately 160 km northwest of Fort St. John. Two maintenance crew members were performing annual inspection work on valves and suffered burns when natural gas flowing out of the valve ignited. |
| USA | 2012 | On 11 December 2012, a buried 20-inch interstate natural gas transmission pipeline operated by the Columbia Gas Transmission Corporation ruptured in a sparsely populated area in Sissonville, West Virginia. A section with the length of about 20 feet was separated and ejected more than 40 feet from its original location. The gas escaping under high pressure ignited immediately. The area destroyed by the fire was about 820 feet wide and extended along the pipeline for almost 1100 feet. As a result of the fire, three homes were completely destroyed and several others were damaged. No fatalities and no serious injuries were reported. The pipeline rupture was probably caused by corrosion of the pipe’s outer wall due to deterioration of the coating and ineffective cathodic protection, or failure to detect corrosion because the pipeline was not inspected or tested after 1988. Rocky backfill around the buried pipe contributed to the poor condition of the anticorrosion protection systems. |
| India | 2014 | On 27 June 2014, a fire occurred in southern India in the state of Andhra Pradesh due to an underground gas pipeline explosion; 18 people were killed and 40 were injured. The fire caused huge property damage. Dozens of houses were destroyed. In an area of over 10 acres, coconut trees, other crops, cattle and wild birds were turned to ash. |
| Taiwan | 2014 | On 31 July 2014, in the city of Kaohsiung, a gigantic explosion of a gas pipe located under one of the main streets of the metropolis took place. The explosion occurred underground when gas from the damaged pipes leaked into the city’s sewer system; 27 people were killed and 286 were taken to hospitals. The explosion was most probably due to damage to the gas pipeline belonging to the state-owned CPC Corporation. |
| Canada | 2014 | On 25 January 2014, a natural gas pipeline operated by the TransCanada Corporation exploded and caught fire in a rural area in the province of Manitoba (near Otterburne), causing a natural gas shortage in Manitoba and parts of the United States. Some households close to the failure site were evacuated. No fatalities were reported. |
| Poland | 2018 | A gas explosion and a fire occurred in Murowana Goślina when a high-pressure natural gas pipeline became unsealed on 26 January 2018. One utility building was completely destroyed, three residential buildings were destroyed as a result of the fire, and fifteen other buildings were destroyed to varying degrees due to exposure to thermal radiation and other factors. There were no fatalities and no injuries. |
| USA | 2019 | On 1 August 2019, a 30-inch gas transmission pipeline operated by Enbridge Inc. was damaged near Danville (Lincoln County, Kentucky). The failure resulted in the release of about 66 million cubic feet of natural gas, which caught fire. Due to the incident, 1 person died, 6 were taken to hospitals and 75 residents from the Indian Camp mobile home development were evacuated. The fire destroyed 5 nearby residences; damaged 14 others; and burned approximately 30 acres of land, including railway tracks. The explosion resulted in the ejection of an approx. 110-foot-long section of the pipeline that landed about 481 feet away from the rupture site. |
| Poland | 2019 | On 4 December 2019, a gas explosion occurred in Szczyrk, when the gas pipeline was damaged during construction work performed near a single-family building. Due to the explosion, the three-storey house collapsed completely. Eight people were killed. |
Table 3.
Ignition of releases per leak type—EGIG report [4].
Table 3.
Ignition of releases per leak type—EGIG report [4].
| Leak Size | % of Releases with Ignition |
|---|---|
| Pinhole-crack | 4.7 |
| Hole | 2.2 |
| Rupture ≤ 0.4 m | 9.8 |
| Rupture > 0.4 m | 40.7 |
| Fire | Explosion | ||
|---|---|---|---|
| Heat Flux (kW/m2) | Consequences | Overpressure (kPa) | Consequences |
| 100 | steel structure collapse (>30 min exposure) | 482.6–1379 | immediate blast fatalities |
| >37.5 | death, all operating equipment destroyed completely | 50–100 | displacement of cylindrical storage tanks, failure of pipes |
| 25 | significant injury in 10 s, 100% mortality in 1 min, unpiloted ignition of wood, steel deformation (>30 min exposure) | 48.3 | threshold of internal injuries by blast |
| 12.5–15 | first-degree burn after 10 s, 1% mortality in 1 min, piloted ignition of wood, melting of plastics (>30 min exposure) | 35–40 | displacement of pipeline bridges, breakage of piping |
| 4–5 | pain for 20 s exposure, first-degree burn, glass breakage (30 min exposure) | 15–20 | threshold for eardrum rupture (18.8 kPa), collapse of unreinforced concrete or cinderblock walls |
| <1.6 | safe | 1 | threshold for glass breakage |
Publisher’s Note: MDPI stays neutral with regard to jurisdictional claims in published maps and institutional affiliations. |
© 2021 by the authors. Licensee MDPI, Basel, Switzerland. This article is an open access article distributed under the terms and conditions of the Creative Commons Attribution (CC BY) license (https://creativecommons.org/licenses/by/4.0/).
Share and Cite
MDPI and ACS Style
Rusin, A.; Stolecka-Antczak, K.; Kapusta, K.; Rogoziński, K.; Rusin, K. Analysis of the Effects of Failure of a Gas Pipeline Caused by a Mechanical Damage. Energies 2021, 14, 7686. https://doi.org/10.3390/en14227686
AMA Style
Rusin A, Stolecka-Antczak K, Kapusta K, Rogoziński K, Rusin K. Analysis of the Effects of Failure of a Gas Pipeline Caused by a Mechanical Damage. Energies. 2021; 14(22):7686. https://doi.org/10.3390/en14227686
Chicago/Turabian StyleRusin, Andrzej, Katarzyna Stolecka-Antczak, Krzysztof Kapusta, Krzysztof Rogoziński, and Krzysztof Rusin. 2021. "Analysis of the Effects of Failure of a Gas Pipeline Caused by a Mechanical Damage" Energies 14, no. 22: 7686. https://doi.org/10.3390/en14227686
Note that from the first issue of 2016, this journal uses article numbers instead of page numbers. See further details here.