
Environmental and Cost Impacts of Food Waste in University Canteen from a Life Cycle Perspective


School of Economics and Management, Taiyuan University of Technology, Taiyuan 030024, China
*
Authors to whom correspondence should be addressed.
Energies 2021, 14(18), 5907; https://doi.org/10.3390/en14185907
Submission received: 31 July 2021
/
Revised: 9 September 2021
/
Accepted: 13 September 2021
/
Published: 17 September 2021
(This article belongs to the Collection Energy Transition towards Carbon Neutrality)
Abstract
:Food waste has caused double waste of resources in the food itself and the food supply chain of production, transportation, cooking, and processing, resulting in unnecessary greenhouse gas emissions and economic losses. This paper first conducted the quantification of students’ food waste and the collection of canteens operation data in the three canteens at Taiyuan University of Technology (China) in 2019 through the weighing method and interview. Then an integration of Life Cycle Assessment and Life Cycle Costing was used to quantify the impact of food waste in university canteens on the environment and costs. The study found that the total amount of food waste in the university canteens with 22,000 students was 246.75 t/a, the carbon footprint caused by food waste was 539.28 t CO2-eq, and the cost was 4,729,900 yuan. Most of the impact of canteen meals on the environment comes from the use of energy in food cooking and the consumption of animal food types. The innovative integration of life cycle cost calculations highlights the key role of the labor required for cooking. The research results answer the basic scientific questions of how much food is wasted in the university canteens, and the carbon emissions and cost ratios of these wasted food in all links of the supply chain. The research results can provide a policy-making basis and data support for reducing food waste in universities and realizing carbon emission reduction in university canteens.
1. Introduction
Food security is one of the major challenges facing human society in the 21st century. As of 2020, more than 600 million people in the world are living in hunger, and the outbreak of the COVID-19 has once again brought the food supply problem back to the international perspective [1]. The concept of double energy waste reveals the interwoven relationship between energy and food security, suggesting that appropriate reduction of food waste can increase the level of food production and save related energy [2]. From agricultural production to the dinner table, food waste occurs throughout the food supply chain. According to FAO and its report, about 1.3 billion tons of food produced in the world each year end up as kitchen waste, which is equivalent to 1/3 of the total global food production [1,3,4]. The food energy loss of two to three persons is equal to a person’s total daily intake [5]. The annual carbon footprint of food waste is 4.4 GT CO2-eq [6], resulting in a social cost of 2.31 trillion euros in waste [7]. Food waste contributes to the environmental damage through the unjustified emissions of greenhouse gases [8,9], and disposal of uneaten food also means unnecessary financial expenditure. The negative effects of food waste also reflected in a social level, because it is related to the global food insecurity for a growing world population [10]. It can be seen that such a high level of food waste has a huge negative impact on the sustainable development of the environment, society, and economy.
Internationally, researches on the phenomenon of food waste in the food supply chain have their own focuses. In the consumption link, scholars have focused on waste on the dining table, that is, food surplus on the plate [11,12]. In developed countries, researches mainly focus on restaurants [13], households [14], hospitals [15], and schools [16].
According to data from the National Bureau of Statistics of China (NBSC), there were 2663 universities in mainland China in 2018, and the number of enrolled university students was also the largest in the world, setting a record high of 30.3 million in 2019 [17]. Therefore, the food waste generated by the group of university students is an important part of the overall food waste problem in China. On the other hand, universities have the ability to spread food consumption habits while sustainably managing existing resources. As a controlled environment, the university canteen provides an ideal behavioral laboratory for studying the consumption link in the food system. Students are the younger generation of consumers; hence, influencing their food-related habits can improve the sustainability of future food consumption patterns [18,19,20].
Since food waste may be inconsistent under different circumstances, many studies have defined specific research objects. WRAP divides food waste into three categories: avoidable, possibly avoidable, and unavoidable [21]. It is also a study of food waste in canteens—Falasconi et al. define food waste as edible food that meets safety standards and is discarded from all links of the food supply chain [22]. Martins et al. used “the food remaining on the plate after the students have eaten” to define the food waste of the primary school canteens [23]. When Liu et al. investigated the school canteens in Beijing area, they defined the food that was purchased but not consumed as food waste [24]. In this study, the edible portion discarded after purchase is defined as food waste. Bones, fishbone, and soup are not included in the scope of this survey because they do not contain or contain very little edible parts. The definition of food waste is different, and the measurement method used in the survey is also varied [25]. In terms of quantification methods of food waste, some use bookkeeping methods to investigate food waste in restaurants [13] and households [14]. The bookkeeping method is a way that the respondent or investigator records the food discarded every day through memory [26]. There are also “archaeology” methods, in which investigators estimate food waste based on the food residue in trash bins [27]. The method of measuring the ratio of the remaining amount of food on the plate to the amount of food supplied is called the empirical research method [28]. After conducting in-depth research on food waste in the catering industry, Wang et al. proposed that a scientific and reasonable sampling method is an important basis for the empirical research method [29]. Quarter-waste visual assessment is an observation method that assigns to every plate assessed a value between 0 and 25-50–75-100 referring to the percentage of food left in the plate [30]. Differences in measurement methods are important factors of inconsistency and methodological risk in the study of food losses and waste, which should be properly assessed and managed. FUSIONS results also confirmed the problem with data availability and quality [31]. In May 2019, at the EU level, respective guidelines were adopted in the delegated decision of the European Commission; those guidelines referred to a common methodology of and minimum quality requirements for the uniform measurement of food waste levels [32]. This study uses a combination of sampling and weighing to quantify food waste in university canteens, ensuring the authenticity and accuracy of the data.
It is undeniable that the special diet in the school cafeteria is a hot spot of food waste [33]. Zhao et al. found that the canteens of Jilin Agricultural University have a serious waste situation, and only less than a quarter of the students have achieved the “CD-ROM” [34]. Costello et al. took the University of Missouri in Missouri as an example to quantify food waste and its composition. The survey found that fruits and vegetables are the largest source of food waste, followed by grains [16]. Some scholars have also evaluated the potential risks of food waste to energy and nutrient loss [35]. In recent years, the impact of food waste in university canteens on the environment has attracted widespread attention. Based on field research and questionnaires, Zhu et al. found that the carbon footprint of food waste in universities is relatively high, and called on all parties to make more efforts in energy conservation and emission reduction in universities [36].
The outbreak of the COVID-19 in 2020 has sounded the alarm for food supply, and the current research on food waste has undoubtedly become a hot spot. However, none of these studies provide an estimate of the impact of food waste on the environment and cost in universities. Food waste management starts with preventing and optimizing the use and supply of food [37].
The purpose of this study is to identify the key links of food waste in university canteens and provide measures to reduce their environmental and cost impacts. Based on the above analysis, this paper performs the following: Section 2 presents the case design and research methods. The study first quantifies food waste in university canteens using the weighing method, and then combines Life Cycle Assessment (LCA) and Life Cycle Costing (LCC) to evaluate the impacts of food waste on the environment and cost. Sensitivity analysis is used to help strengthen the interpretation of the results. The results and analysis of the model-based assessment are shown in Section 3. Section 4 discusses the evaluation results. Finally, Section 5 concludes the paper.
2. Materials and Methods
2.1. Case Study
This research takes the Mingxiang campus of Taiyuan University of Technology (TYUT) as a case. The Mingxiang campus of TYUT is located in the Jinzhong City, Shanxi Province, China. The campus currently has 16 colleges settled as a whole, including more than 20,000 undergraduates and more than 2000 graduate students (December 2020). There are 3 student canteens on the campus, which are located in the east, west, and north areas of the school. The school’s food service center is responsible for the procurement, transportation, storage, and service of food in the school canteens.
Among the methods to quantify food waste, direct weighing is considered the most accurate method [23,38,39]. This survey adopts a random sampling method. Students are randomly selected from three canteens on the Mingxiang campus of TYUT, and their plate waste was weighted. The weighing object is the remaining edible part of the plate after the student has finished eating in the canteens. Bones, fish bones, and soup are not included in the scope of this survey because they do not contain or contain very little edible parts. In our survey, pre-trained investigators (mainly team members) arrived at each canteen early at lunch or dinner time. After the respondents had eaten, the remaining food was collected by the investigators in collection bins, and the plate waste was sorted and weighed using electronic scales according to the following nine items: cooked wheaten food, rice products, vegetables, soy products, pork, poultry meat, beef and mutton, aquatic products, and eggs. The simple information and measurement data of each respondent are recorded on the prepared schedule of the survey. After the recording was completed, we first used Microsoft Excel 2010 to perform statistical descriptive analysis to determine the average weight and waste composition of each student’s food waste per meal. In order to determine whether there is a difference between the respondents in terms of food waste, we then used Stata 14.0 to perform a t-test and one-way ANOVA test on the data.
The weight of ingredients before and after cooking will change, and the conversion rate of raw and cooked ingredients refers to the ratio of the weight of ingredients after cooking to before [40]. According to interviews with chefs in university cafeterias, Li et al. summarized the raw and cooked conversion coefficients of different foods [41]. Using the waste weight and the raw and cooked conversion coefficients, the waste weight of six ingredients can be calculated.
The data collection work was conducted in November and June of the 2019 school year, which represents the average waste situation in the student canteens over the course of the year. In this survey, a total of 600 data were collected. The proportions of men and women were 52% and 48%, and the proportions of undergraduates and graduate students were 90% and 10%. The survey time is lunch time and dinner time, and the proportions of lunch and dinner are 55% and 45% (Table 1).
2.2. Life Cycle Assessment (LCA) and Life Cycle Cost (LCC)
2.2.1. Goal and Scope
This study uses a combined life cycle thinking method to evaluate the impact of food waste in university canteens on the environment and costs. The environmental impact of food waste is assessed through the Life Cycle Assessment (LCA), which is a method of observing and analyzing the entire life cycle of a product or activity to quantify its environmental impact [42,43]. According to the recommendations of Hunkeler et al., the cost impact of food waste is calculated by using Environmental Life Cycle Costing (E-LCC), which is a way of assessing the cost directly borne by one or more participants in the life cycle of a product [44,45].
When conducting LCA-LCC integration research, the same function unit, system boundary, and time range are used. The function unit is the amount of ingredients wasted a day in canteens. Using the “cradle to grave” point of view, Table 2 describes the system boundary of the study. The environmental and cost impacts of food waste are calculated and analyzed in accordance with the four phases in the table.
2.2.2. Life Cycle Inventory (LCI)
The catering service center of the university provides preliminary data on the quantity and price of the purchased ingredients, the transportation of the ingredients from the wholesale market to the university canteens, the input of cooking food, and the disposal of residues. Secondary data on background processes comes from Environmental Product Declarations (EPD), LCA studies, and ecoinvent database version 3 [46].
- Procurement Phase
This phase mainly refers to the activity of purchasing ingredients. The quality and price information of the purchased ingredients are counted by the ingredients purchase table provided by the catering service center. The raw and cooked conversion coefficient and comprehensive carbon conversion coefficient of each main food ingredient are shown in Table 3. The calculation of carbon emission at this stage is shown in Equation (1):
Among them, EC is the total amount of direct carbon emission generated during the procurement phase, including direct carbon emission from ingredients and carbon emission from feed and grain; eci is the direct carbon emission of the ith ingredient, Qi is the waste weight of the ith ingredient, and Ri is the comprehensive carbon conversion coefficient of the ith ingredient.
The cost impact of this phase is equivalent to the price paid for ingredients purchasing, which was used to represent the life cycle cost of the procurement phase. The cost data of this stage has been provided by the food service center, and the results are in RMB yuan.
- Transportation Phase
This phase mainly refers to the activity of transporting ingredients from the wholesale market to the university canteens. The transportation distance was provided by the university’s food service center. The weight of each ingredient is multiplied by the kilometer to get the total kilometer. The diesel trucks transport ingredients on the roads. The carbon emission factor is 0.1772 kg CO2/(t·km) [50]. The calculation of carbon emission at this stage is shown in Equation (2):
Among them, Et is the total carbon emissions during the transportation phase, eti is the carbon emissions during the transportation of the ith ingredient, Qi is the waste weight of the ith ingredient, Di is the distance to transport the ith ingredient, and EFh is the carbon emission factor of diesel vehicles transporting goods on roads.
The cost impact of this phase is composed of the fuel consumption cost and labor cost required to transport the ingredient. The cost data has been provided by the food service center, and the results are in RMB yuan.
- Cooking Phase
This phase mainly refers to all the activities needed to store and prepare food. Environmental inputs mainly include public utilities such as natural gas, water, and electricity from electrical appliances, lighting, and heating. The consumption data of water, electricity, and natural gas came from the relevant invoices provided by the catering service center. Each input is allocated to each meal based on the number of meals produced per month. The relevant energy carbon emission coefficients in this phase are shown in Table 4. The calculation of carbon emissions at this stage is shown in Equation (3):
Among them, Eu is the total carbon emissions generated during the cooking phase, Qi is the waste weight of the ith ingredient, Wij is the total jth energy consumed in making the ith food, and EFj is the carbon emission coefficient of the jth energy.
The cost impact of this phase takes into account the price of water, electricity, and natural gas used in the food cooking phase; the price of labor required for food cooking. The university’s food service center provided these cost information.
- Disposal Phase
This phase mainly refers to the activity of transporting and processing food waste. It was learned from the Food Service Center that the government arranges designated food waste disposal plants to collect and process university food waste. The model number of the food waste transport truck used is Haide Vehicle, with a capacity of 5–7 t and a diesel fuel consumption of 0.15 L/km. The transportation distance is 17.8 km. According to the existing literature, the calculation of carbon emissions at this stage is shown in Equation (4):
Among them, Em is the total carbon emissions generated in the residue disposal phase, Qi is the total weight of the ith food waste, Wc is the capacity of the food waste truck, D is the distance from the university canteen to the food waste disposal plant, Wn is the unit fuel consumption of the food waste truck, EFC is the carbon emission coefficient of diesel 2.71 kgCO2 eq/L [51]. The environmental impacts of the two typical food waste disposal methods, hydrothermal treatment and aerobic composting, are 163.1 kgCO2 eq/t and 337.7 kg CO2 eq/t [52], respectively, and EFm is the carbon emission coefficient of food waste disposal.
The cost impact mainly considers the cost of transportation of food waste to the food waste disposal plant. The food waste generated by university canteens is collected and processed by the food waste disposal plant designated by the government in accordance with the Regulations on the Disposal of Food Waste promulgated by the government, so the cost of disposal is not calculated in this study.
2.3. Sensitivity Analysis
The resource and environmental benefits in the process of food waste in university canteens are affected by many factors. In order to find the key factors that cause greater environmental impact and to propose measures to improve the resource and environmental performance of the entire life cycle, it is necessary to carry out life cycle sensitivity analysis [43]. Sensitivity analysis refers to the uncertainty analysis technique that studies the impact of a certain change in related factors on a certain target variable or a group of target variables from the perspective of quantitative analysis, that is, analyzes the impact of input uncertainty on output uncertainty [53]. Sensitivity analysis is an important tool to study sensitivity of results to uncertain factors in LCA. It highlights the most significant group or groups of model parameters to strengthen interpretation of the results. There are currently two main type of methods: local sensitivity analysis (LSA) and global sensitivity analysis (GSA). The purpose of LSA is to study how a small perturbation around a reference input value impacts on the output value. Perturbation analysis is described as a method to determine which elements in the LCA are most decisive for the output result [54]. LSA is especially suitable for situations where there are many uncertain parameters, and the focus is on identifying driving factors [55]. Its result indicates how many percent of the environmental impact will change if an input parameter changes within a certain range. In LCA, most case studies are conducted with LSA [56]. The same is true for this study.
In this study, the sensitivity of key parameter input values was analyzed. Since no experience-based data related to these sensitivities is available, we can apply the same arbitrary changes to these key factors [57]. For example, change the uncertain variable in the range of −10% to +10%. There is no specific rationality for this, and such a regular LSA method can only be used when the true scope is lacking [58].
3. Results
3.1. Food Waste Quantification
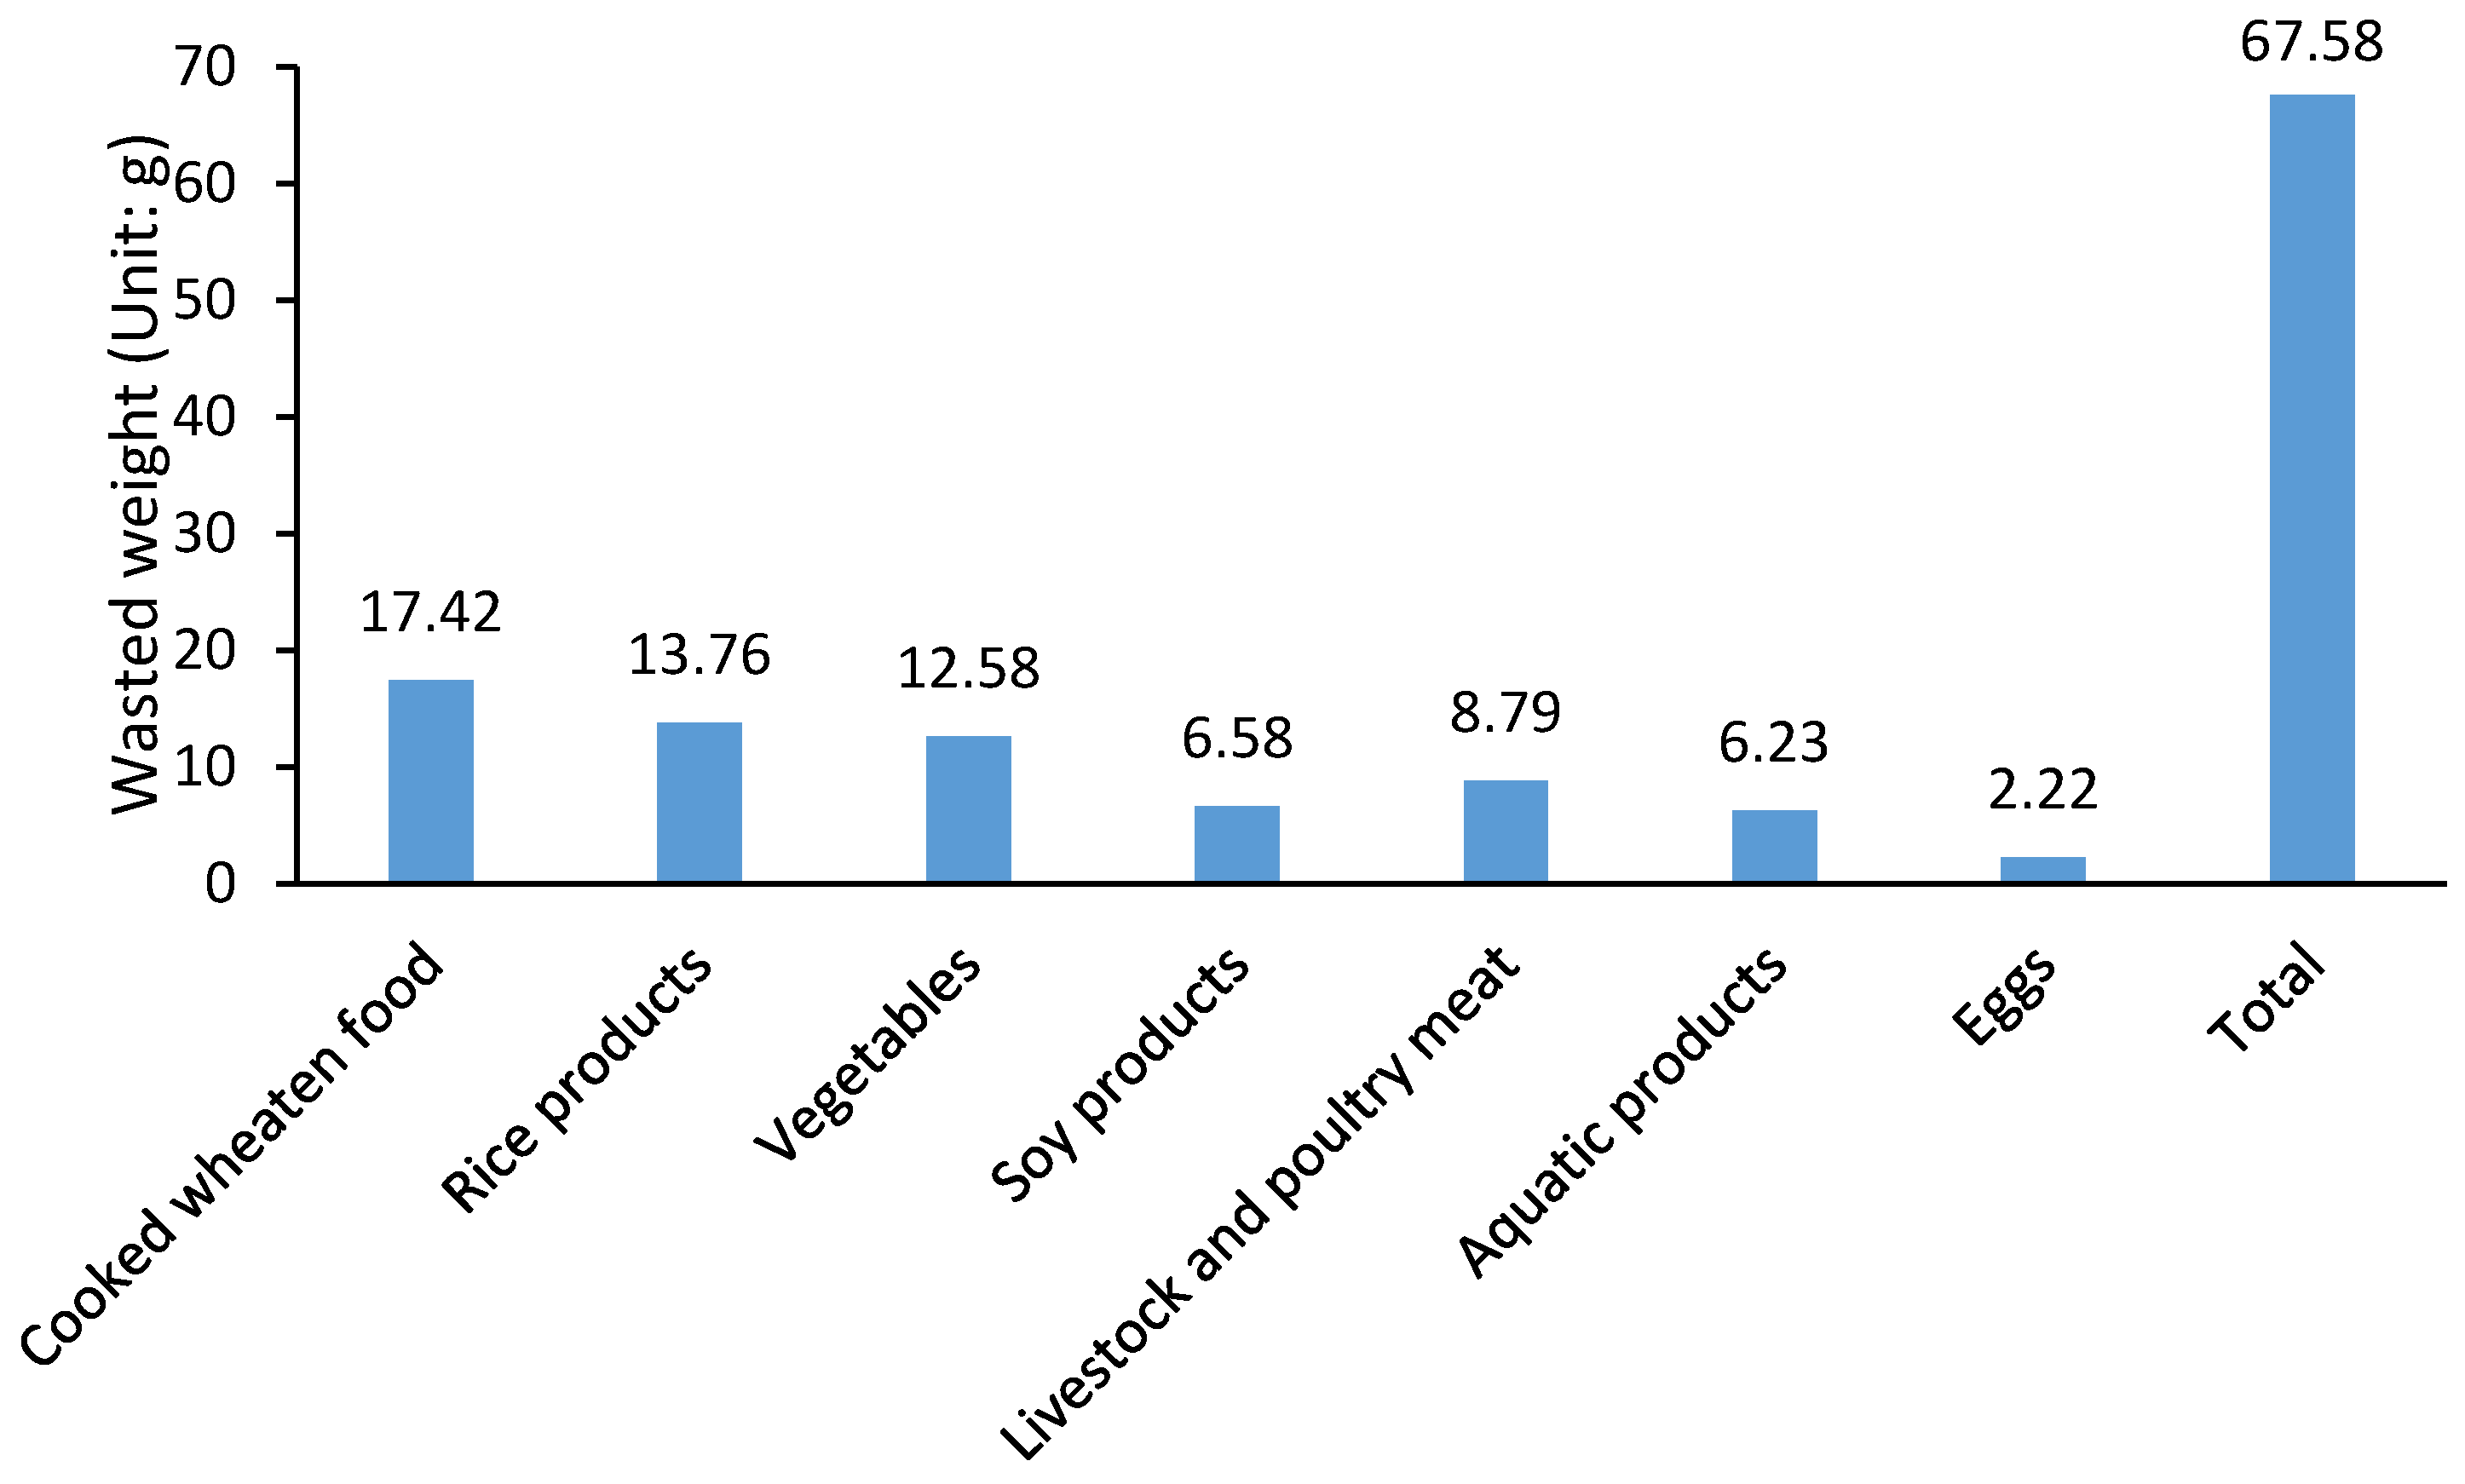
The results show that the amount of food waste in canteens of TYUT is 913.88 kg. Among them, the amount of grain waste is the highest, accounting for about 46.14% of the total waste. In the grain waste, the amount of cooked wheaten food (25.78%) waste is larger than that of rice products (20.36%), which may be due to the preference for cooked wheaten food in the north, followed by vegetables and soy products, accounting for 18.61% and 9.73% of the waste, respectively. The third tier is poultry meat and aquatic products, which account for 13.01% and 9.23% of the waste, respectively. Among the meat, the waste amount is pork (5.60%), poultry (5.16%), beef and mutton (2.24%) in descending order, which is related to the meat consumption structure of Chinese residents. Eggs are the least wasted, accounting for about 3.28% of the waste (Figure 1).
When analyzing the samples, it can also be found that for all types of food ingredients, men’s waste is less than women’s, which may be due to women’s picker eating habits [24]. Although they are at different levels of education, the waste of undergraduates, masters, and doctoral students is very similar. In terms of total amount, doctoral students are the least, and undergraduates and masters are the highest. The waste situation of different meal times is basically the same, and the total waste of lunch is higher than that of dinner.
3.2. The Carbon Footprint of Food Waste
The carbon footprint of food waste in the canteens of Taiyuan University of Technology as a case reflects the environmental impact of food waste in the canteens of colleges and universities. The daily total carbon footprint of food waste in the canteens of Taiyuan University of Technology is 1997.34 kg CO2-eq (Table 5).
The life cycle inventory of food waste includes four stages: procurement, transportation, cooking, and disposal. Among them, the procurement stage mainly refers to the comprehensive carbon emissions, including the direct carbon emissions of various food ingredients and the indirect carbon emissions of feed and grain; the transportation stage mainly considers the carbon emissions generated by the transportation process of the ingredients supplied by the raw material suppliers; the cooking stage mainly refers to the energy consumption of water, electricity, and natural gas produced in the canteen during the cooking process of food ingredients; the disposal stage mainly includes the carbon emissions generated by the unified collection, transportation, and disposal of food waste by the food waste treatment plant. During the whole process, the carbon emissions during the cooking stage are the largest, accounting for 68.96% of the total carbon footprint of food waste. The second is the procurement stage, accounting for 19.06% of the total carbon footprint of food waste, and the third is the disposal stage, accounting for 11.76% of the total carbon footprint of food waste. Finally, the carbon footprint of the transportation stage is the least, which only accounts for 0.22% of the total carbon footprint of food waste (Table 5).
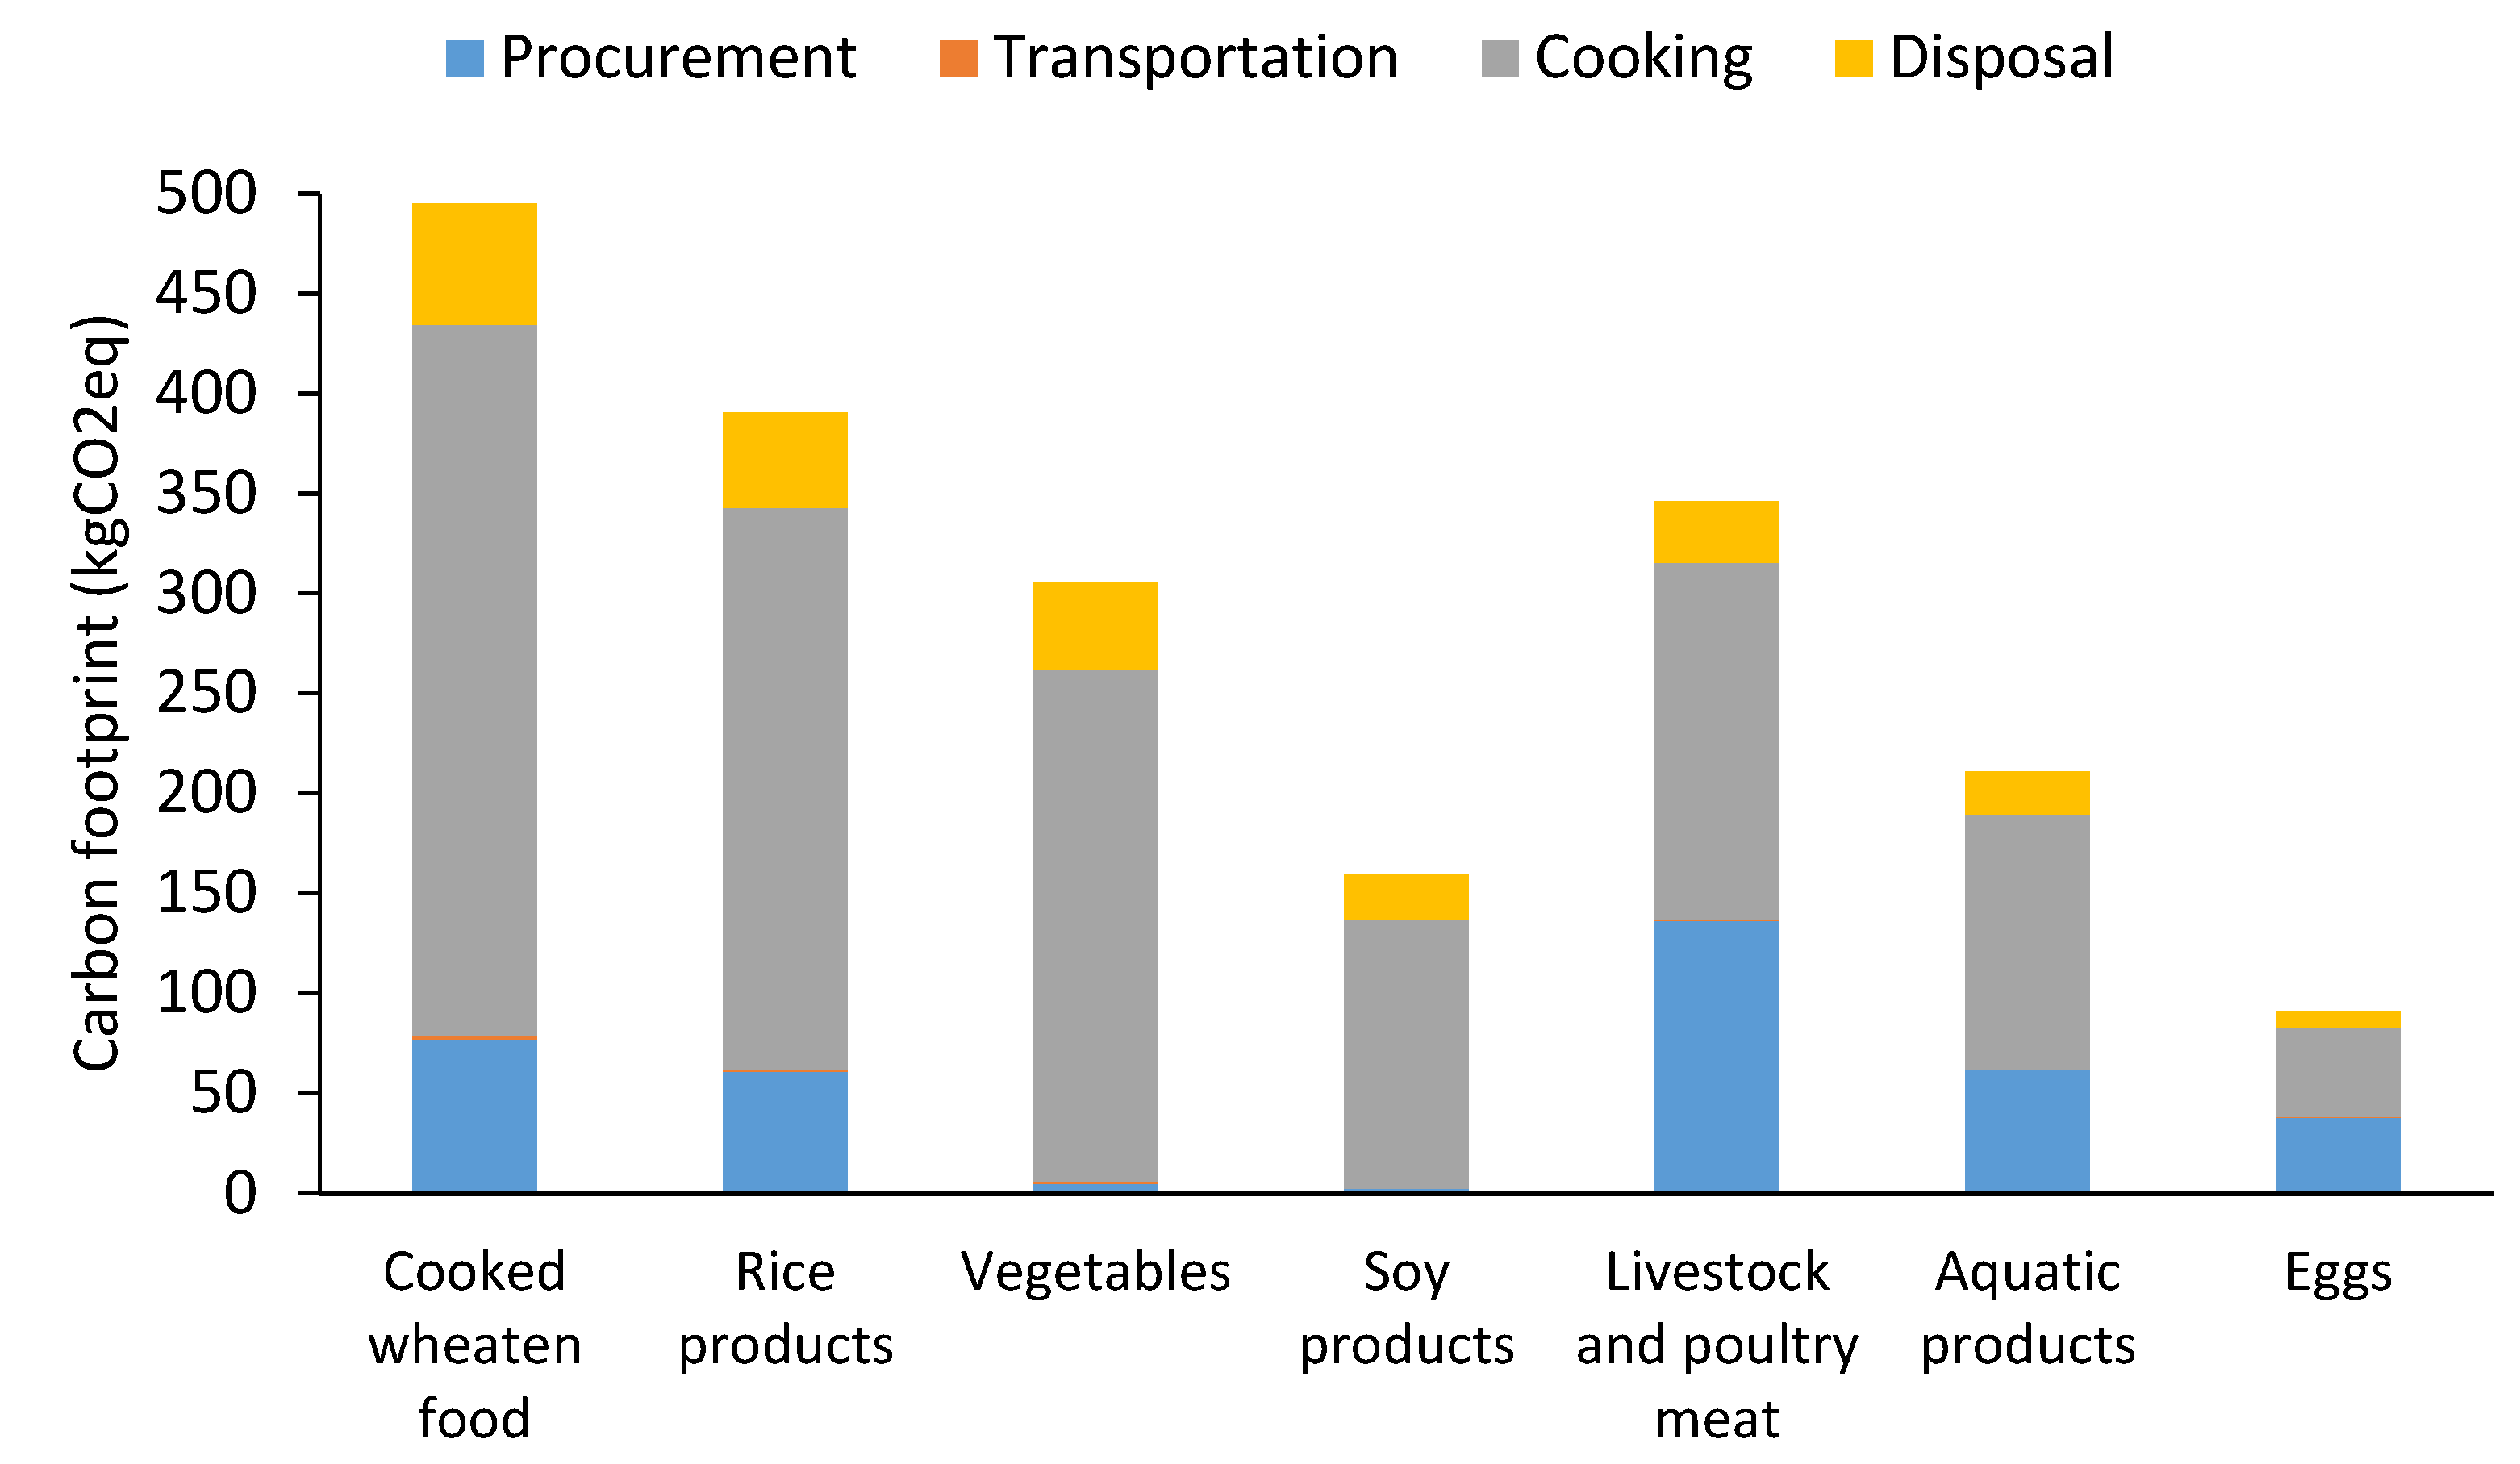
The carbon footprint of food waste in the canteens of Taiyuan University of Technology can be divided into seven categories: cooked wheaten food, rice products, vegetables, soy products, livestock and poultry meat, aquatic products and eggs (Figure 2). Among them, the carbon footprint of food waste mainly comes from the waste of cooked wheaten food and rice products, accounting for 44.32% of the total carbon footprint of food waste. The waste of livestock and poultry meat is the second echelon of the carbon footprint of food waste, accounting for 17.31% of the total carbon footprint of food waste. The third echelon contribution to the carbon footprint of food waste is vegetables, accounting for 15.29% of the total carbon footprint of food waste. The fourth tier contributing to the carbon footprint of food waste is aquatic products, soy products, and eggs, accounting for 10.56%, 7.97%, and 4.55% of the total carbon footprint of food waste. The process with the largest amount of carbon emissions of each food category is the cooking stage.
From the perspective of the carbon footprint of wasting a unit of food (Table 5), eggs and livestock and poultry meat have the largest carbon footprints. Vegetables and soy products have the smallest carbon footprint.
3.3. The Cost of Food Waste
Food waste in university canteens not only has a negative impact on the resources and environment, but also produces double economic waste of food itself and the process of transportation, cooking, and disposal of food. The life cycle costing of food waste in the canteens of Taiyuan University of Technology as a case reflects the economic cost of food waste in the canteens of colleges and universities. The daily economic cost of food waste in the canteens of Taiyuan University of Technology is 17,518.01 yuan (Table 6).
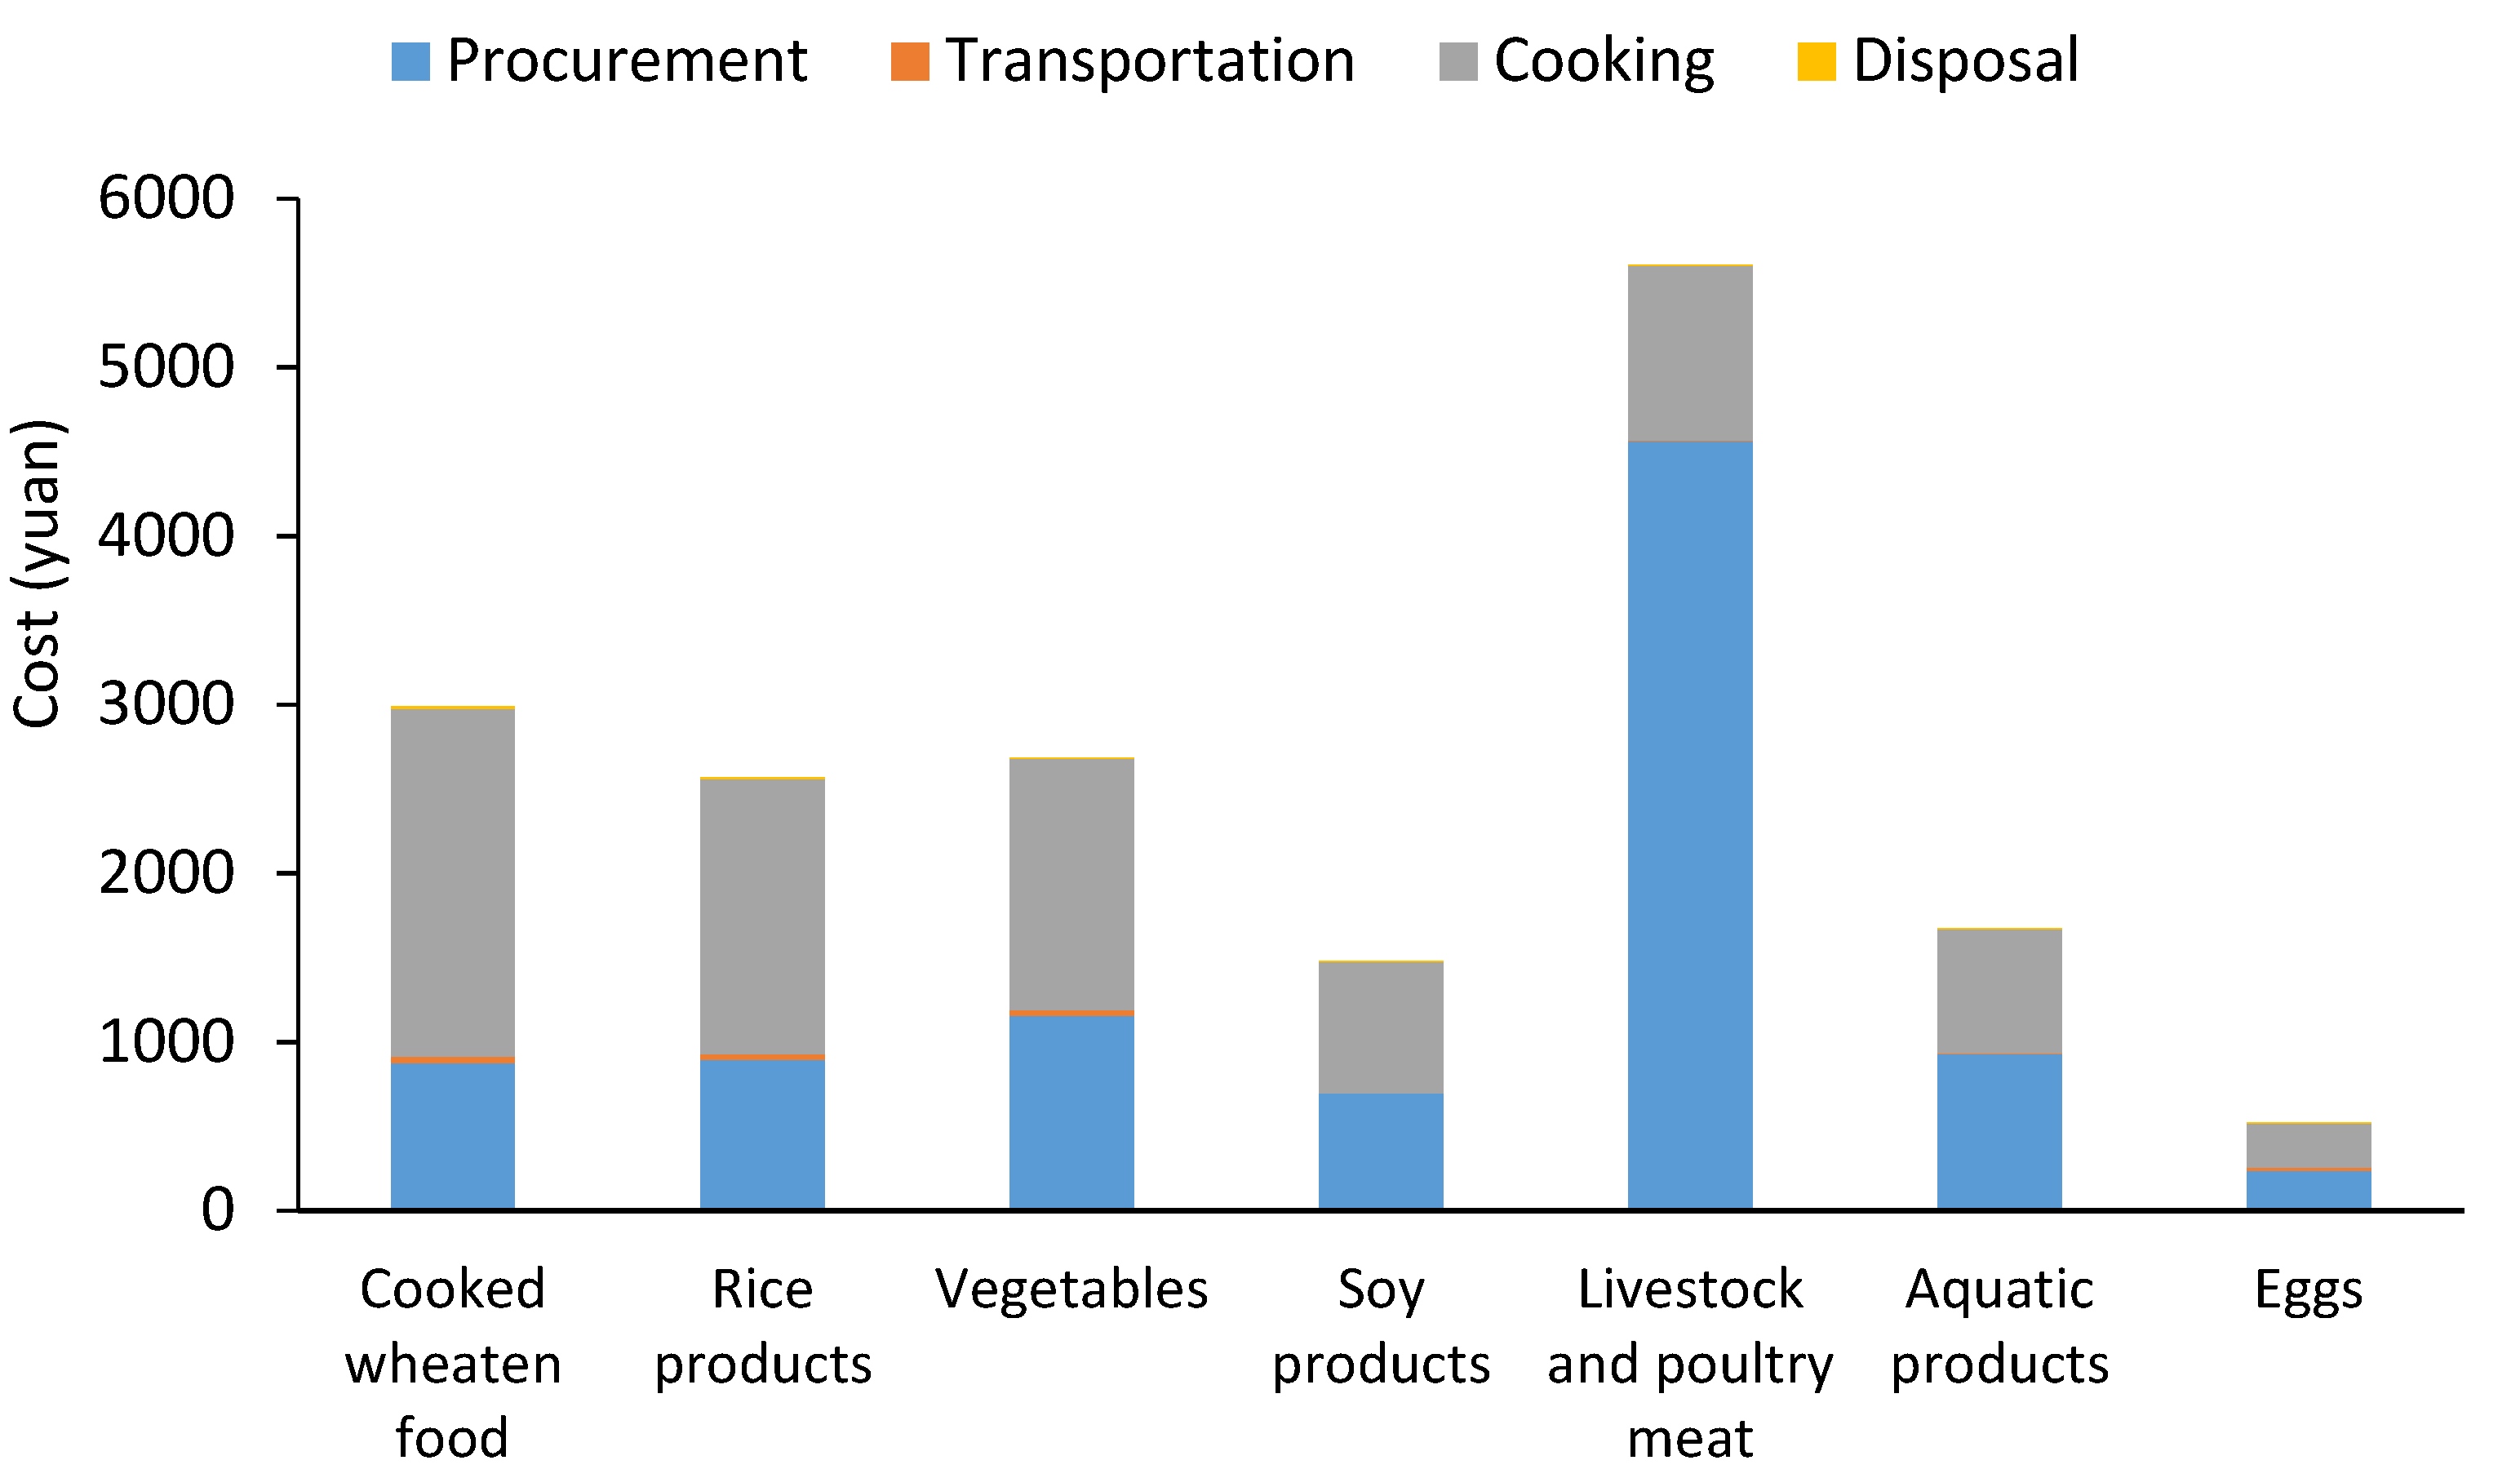
The life cycle costing of food waste adopts the same function unit and inventory analysis as the life cycle assessment. In the four stages of procurement, transportation, cooking, and disposal, procurement stage mainly refers to the price paid for the purchase of food ingredients; the transportation stage mainly considers the fuel consumption cost and labor cost produced by transporting food ingredients from the supplier to the university canteens; the cooking stage mainly refers to the cost of water, electricity, natural gas, and labor generated by the storage and cooking of food; the disposal stage mainly considers the fuel consumption cost of transporting food residues to the kitchen waste treatment plant. Different from the environmental evaluation, the highest cost of food waste in university canteens is the procurement phase, accounting for 53.34% of the total cost of food waste. The second is the cooking phase, accounting for 45.64% of the total cost of food waste. The cost of food waste in the transportation stage and the disposal stage is lower, accounting for 0.78% and 0.24% of the total cost of food waste, respectively (Figure 3). In the procurement stage, the cost of livestock and poultry meat is the highest, accounting for 48.83% of the cost of this stage. In the cooking stage, the labor cost is the highest, 6687.2 yuan, accounting for 83.64% of the cost of this phase. It can be seen that the cost of food waste for students in the canteens of Taiyuan University of Technology mainly comes from the purchase of livestock and poultry meat and the wages of canteen workers.
The cost of food waste in the canteens of Taiyuan University of Technology can also be considered from seven types of ingredients, such as cooked wheaten food, rice products, vegetables, soy products, livestock and poultry meat, aquatic products and eggs (Figure 3). Among them, the cost of food waste mainly comes from the waste of livestock and poultry meat, accounting for 32.01% of the total cost of food waste. The process that contributes the most to the cost of livestock and poultry meat waste is the procurement phase, accounting for 81.35% of the cost of livestock and poultry meat food waste. The second tier of food waste cost are cooked wheaten food, rice products, and vegetables, accounting for 17.05%, 14.65%, and 15.33% of the total cost of food waste, respectively. The third tier of food waste cost are aquatic products and soy products, accounting for 9.56% and 8.43% of the total cost of food waste, respectively. The waste cost of eggs is the least, accounting for 2.97% of the total food waste cost. Like livestock and poultry meat, the process that contributes the most to the cost of aquatic products is also the procurement stage. In addition, the process that contributes the most to the waste cost of cooked wheaten food, rice products, vegetables, soy products, and eggs is the cooking phase.
From the perspective of the unit cost of wasting food (Table 6), the unit cost of wasting livestock and poultry meat is the largest. The unit cost of wasting cooked wheaten food is the lowest.
3.4. Sensitivity Analysis
This paper selects five input variables according to their contribution to the environmental impact, from high to low: electricity consumption in the cooking phase, natural gas consumption in the cooking phase, livestock and poultry meat in the procurement phase, cooked wheaten food in the procurement phase, and haul distance in the transportation and disposal phase. The sensitivity analysis method is adopted to analyze the five key influencing factors, respectively. The analysis method is to keep other input parameters unchanged, the variable studied is changed within +/−10%, and then the changes in the environmental impact index before and after the parameter value changes are compared to determine sensitivity of the food waste life cycle of university canteens to changes in input parameters.
Figure 4 demonstrates the impact of changing five input variables on the LCA results of food waste in university canteens. The abscissa represents the percentage of change in sensitivity factors, and the ordinate represents the percentage of life cycle carbon emissions changes caused by changes in input variables. In Figure 4, the five straight lines respectively represent the sensitivity of five input variables to the LCA results of food waste in university canteens. For example, when the amount of electricity increases by 2%, the LCA result, that is, carbon emissions will increase by about 2.437%. When the consumption of natural gas, livestock and poultry meat, cooked wheaten food, and transportation distance undergo the same change, the LCA results will increase by about 6.367%, 0.454%, 0.257%, and 0.540%. It can be seen that changes in natural gas usage are most sensitive to carbon emissions from food waste in university canteens, followed by changes in electricity consumption, followed by changes in transportation distance, and then changes in livestock and poultry meat. Changes in cooked wheaten food have the least impact on carbon emissions. Sensitivity analysis provides the priorities of measures to reduce the environmental impacts of food consumption and waste in university canteens, that is, controlling the use of natural gas and electricity is the most effective in reducing environmental impacts.
4. Discussion
In general, the total daily food waste in the canteens of Taiyuan University of Technology is 913.88 kg, the carbon footprint caused by food waste is 1997.34 kg CO2-eq, and the cost of food waste is 17,518.01 yuan. Calculated on the basis of students studying in school for 9 months a year, that is 270 days, the total amount of food waste in the canteens of Taiyuan University of Technology is 246.75 t/a, the carbon footprint caused by food waste is 539.28 t CO2-eq, and the cost is 4,729,900 yuan.
From the above preliminary results, it can be seen that the scale of students’ food waste in university canteens is staggering, and the carbon emissions and costs caused by it cannot be ignored. In terms of the types of food wasted, staple foods have the highest amount of waste, accounting for about 46.14% of the total wastage. Among them, cooked wheaten food is more wasteful than rice products. Li et al. proved that this may be due to the preference for cooked wheaten food in northern China and the difficulty of sharing it [41]. Secondly, vegetables and soy products account for 28.34% of the waste. A pilot study conducted by Wu et al. in six universities in Beijing, China, also proved that staple foods and vegetables are the most wasted food items [59]. Food waste in Western universities has the same characteristics. Rajan et al. found that at Northern British Columbia University in Canada, grain-based waste accounted for the largest proportion of food waste (28%), followed by raw fruits and vegetables (20%) [60]. To reduce food waste in university canteens, canteens should provide small servings of staple food and small dishes. In order to avoid students with no income from blindly choosing large portions due to the same price of large and small portions of food, canteens should also set different prices for different portions of food. The service staff in the canteens can work part-time as persuaders, prompting students to order moderately, and reminding and persuading the behavior of over-ordering. University canteens should establish a meal communication mechanism with students, and collect students’ opinions on the canteen’s dishes, portion size, and prices by posting a QR code or placing an opinion and suggestion booklet on the dining table. In addition, all parties in society should strengthen education for students on practicing strict economy and combating waste, and cultivate good eating habits for the new generation of consumers.
The results of carbon emissions at different stages of the food supply chain in university canteens show that the carbon emissions in the cooking phase are the largest, accounting for 68.96% of the total carbon footprint of food waste, among which carbon emissions from electricity and natural gas account for 61.57% and 38.07% of the carbon emissions in the cooking phase, respectively. It can be seen that the carbon footprint of food waste in university canteens mainly comes from the use of cooking energy, electricity, and natural gas. Its policy implies that university canteens should use more energy-efficient electrical appliances, and pay attention to energy conservation in the process of cooking food. The input of electricity and natural gas is closely related to the environmental impact and has a great impact on the cost. At present, China’s renewable energy has achieved leapfrog development, and the energy market is promoting the promotion and use of more renewable energy, which will be very beneficial to reducing the impact of food waste in university canteens on the environment. The cost results of each stage of food waste in university canteens show that the highest contribution stage is the procurement stage, which accounts for 53.34% of the total cost of food waste, among which the cost of livestock and poultry meat accounts for 48.83% of the cost at this stage. The second is the cooking stage, which accounts for 45.64% of the total cost of food waste, among which labor cost accounts for 83.64% of the cost at this stage. It can be seen that the cost of food waste in university canteens mainly derives from the purchase of livestock and poultry meat and the payment of labor cost. Due to the general improvement of people’s living standards, the proportion of meat consumption in food consumption has increased. Although university students’ waste of livestock and poultry meat only accounts for 13.01% of food waste, the carbon footprint and cost of producing meat of the same quality are higher than other food categories. Therefore, the consumption and waste of meat foods contribute considerably to the carbon footprint and cost. Hence, reducing meat consumption and waste and a balanced diet are the important ways to develop ecologically civilized consumption and strengthen students’ nutritious diets. It is worth noting that the figure of labor cost may have far-reaching economic and social impacts. Due to the stability of labor wages, this item is unlikely to change. The transportation phase and disposal phase mainly consider the transportation carbon emissions and costs from various food suppliers to the university and from the university to the food waste treatment plant. The choice of food suppliers and the food waste treatment plant has greatly considered the nearest distribution. Research by Giordano et al. concluded that replacing diesel trucks with electric vehicles can reduce greenhouse gas emissions by 35–99%, which depends on the route characteristics and energy structure [61]. Furthermore, the environmental and cost impact can also be reduced by eliminating or reducing vacant transportation and optimizing transportation routes.
There are few studies on the evaluation of the carbon footprint and cost of food waste in university canteens in China. Zhu et al. made a preliminary estimate of the scale of food waste in university canteens across the country. Due to different algorithms, the results are much higher than this study [36]. The reason is that their calculation is based on the hypothesis of university students’ consumption in the canteens for every meal, while this study is based on the daily waste in a canteen with a certain number of students. The distribution of the impact of the food supply chain on the environment in this study is similar to other foreign studies using Life Cycle Assessment to analyze school meals. Through a case study in the school catering service of Turin (Italy), Cerutti et al. proved that meat component in the food production phase and electricity consumption in the cooking phase are the main sources of carbon footprint, and the impact of the logistical stages on the carbon footprint is relatively low [62]. Jungbluth et al. proposed a programme to improve the environmental performance of the Swiss canteen by reducing the average amount of meat per meal, using energy-efficient appliances, and reducing food waste and so on [63]. Mistretta et al. performed a life cycle assessment of a scholastic catering and concluded that the food production phase is responsible for the highest environmental impacts, and meat and fish products are the most impacting foods [64]. The impact of food waste in China on resources and environment is an area that urgently needs to be studied [65].
The results of this study are of great theoretical and practical significance for clarifying the scale and structure of food waste in university canteens, pinpointing the food supply and consumption stages of universities where carbon emissions and costs are prominent, and exploring mechanisms and countermeasures to reduce food waste and its environmental and cost impacts. Based on the quantification of food waste, this paper is the first to try to construct a method system for measuring the impacts of food waste in university canteens, including the calculation methods of carbon footprint and costs of food waste, and the acquisition of related parameters. Improved data measurement aims to help better understand the environmental, social, and economic impacts of food waste, identify hot spots for priority actions, provide information and long-term options for policy makers, and make an overall contribution to the sustainable development of university canteens.
5. Conclusions
This paper takes the Taiyuan University of Technology in China as a case study to evaluate the impact of food waste in university canteens on the environment and costs. The results of the study put forward specific conclusions for decreasing food waste in university canteens and reducing its adverse effects on the environment and costs, which are meaningful for promoting the construction of a conservation-oriented society. In particular:
- The scale of food waste in university canteens is staggering, with staple food waste being the highest (46.14%), followed by vegetables and soy products (28.34%). For this reason, canteens should be equipped with small servings of staple food and small dishes, and set different prices. Canteens can also strengthen students’ education on saving food and reduce food waste by setting up persuaders and establishing meal communication mechanisms.
- The carbon footprint of food waste in university canteens mainly comes from the use of electricity and natural gas (68.71%) in the cooking phase. This requires the use of more energy-efficient electrical appliances in university canteens, attention to energy conservation, and consider the use of renewable energy sources.
- The cost of food waste in university canteens mainly comes from the purchase of livestock and poultry meat in the procurement phase (26.04%) and the payment of labor costs in the cooking phase (38.17%). This calls on students to reduce meat consumption and waste, and to have a balanced diet. Labor wages are stable and unlikely to change.
- Sensitivity analysis results show that the two most important variables that affect the life cycle carbon emissions of food waste in university canteens are the use of natural gas and electricity in the cooking phase, which provides a priority for measures to reduce environmental impact.
It must be admitted that the findings of this paper have certain limitations. Due to the limitation of data acquisition, in the calculation of food waste carbon emissions, only comprehensive carbon emissions including direct carbon emissions from ingredients themselves and indirect carbon emissions from feed and grain are considered. The initial processing and deep processing of food materials are not considered. At the same time, as the definition of food waste in this paper does not include soup, etc., the waste of vegetable oil, animal oil and beverages is also not within the accounting scope. This will result in smaller calculation results. Considering that food suppliers and food waste trucks may transport food materials and food waste from other nearby universities at the same time, the results of the transportation phase and the disposal phase may be overestimated. Further research will continue to complete the life cycle inventory to make the research results more accurate.
Further research can expand the sample size of food waste measurement in university canteens, complete the inventory analysis of Life Cycle Assessment, find out the influencing factors of food waste in university canteens, so as to establish a long-term mechanism to prevent food waste in university canteens, and promote a better balance between nutrition, environment and costing variables.
Author Contributions
Conceptualization, W.L.; methodology, W.L.; software, J.L.; validation, W.L., L.W. and B.J.; formal analysis, B.J.; investigation, J.L.; resources, W.L.; data curation, J.L.; writing—original draft preparation, J.L.; writing—review and editing, L.W.; visualization, B.J.; supervision, W.L.; project administration, W.L.; funding acquisition, L.W. All authors have read and agreed to the published version of the manuscript.
Funding
This research was supported by the National Natural Science Foundation of China (Grant Nos. 72174137, 72004155, 71602136, 7210040883 and 71373170) and the Humanity and Social Science Foundation Project of Ministry of Education of China (Grant Nos. 20YJCZH155 and 21YJA630060).
Institutional Review Board Statement
Not applicable.
Informed Consent Statement
Not applicable.
Data Availability Statement
Not applicable.
Acknowledgments
The study was performed at the Taiyuan University of Technology (China). This research was possible thanks to the support and collaboration of the school authority and the catering service. We also thank students who assisted in the collection of data and the canteen staff who collaborated and provided empirical insights.
Conflicts of Interest
The authors declare no conflict of interest.
References
- FAO. Global Food Losses and Food Waste-Extent, Causes and Prevention; FAO: Rome, Italy, 2011. [Google Scholar]
- Vittuari, M.; De Menna, F.; Pagani, M. The hidden burden of food waste: The double energy waste in Italy. Energies 2016, 9, 660. [Google Scholar] [CrossRef] [Green Version]
- FAO. Food Wastage Footprint: Impacts on Natural Resources: Summary Report; FAO: Rome, Italy, 2013. [Google Scholar]
- Gustavsson, J.; Cederberg, C.; Sonesson, U. Global Food Losses and Food Waste: Extent, Causes and Prevention; Study Conducted for the International Congress Save Food; At Interpack 2011, 16–17 May, Düsseldorf, Germany; FAO: Rome, Italy, 2011; ISBN 978-92-5-107205-9. [Google Scholar]
- Hoehn, D.; Margallo, M.; Laso, J.; García-Herrero, I.; Bala, A.; Fullana-I-Palmer, P.; Irabien, A.; Aldaco, R. Energy embedded in food loss management and in the production of uneaten food: Seeking a sustainable pathway. Energies 2019, 12, 767. [Google Scholar] [CrossRef] [Green Version]
- FAO. Food Wastage Footprint & Climate Change; FAO: Rome, Italy, 2015. [Google Scholar]
- FAO. Food Wastage Footprint: Fool Cost–Accounting, Final Report; FAO: Rome, Italy, 2014; ISBN 978-92-5-108512-7. [Google Scholar]
- Scholz, K.; Eriksson, M.; Strid, I. Carbon footprint of supermarket food waste. Resour. Conserv. Recycl. 2015, 94, 56–65. [Google Scholar] [CrossRef]
- Xue, L.; Liu, G.; Parfitt, J.; Liu, X.; Van Herpen, E.; Stenmarck, Å.; O’Connor, C.; Östergren, K.; Cheng, S. Missing food, missing data? A critical review of global food losses and food waste data. Environ. Sci. Technol. 2017, 51, 6618–6633. [Google Scholar] [CrossRef] [PubMed]
- Pawlak, K.; Kołodziejczak, M. The role of agriculture in ensuring food security in developing countries: Considerations in the context of the problem of sustainable food production. Sustainability 2020, 12, 5488. [Google Scholar] [CrossRef]
- Xu, Z.; Zhang, Z.; Liu, H.; Zhong, F.; Bai, J.; Cheng, S. Food-away-from-home plate waste in China: Preference for variety and quantity. Food Policy 2020, 97, 101918. [Google Scholar] [CrossRef]
- Alharbi, N.S.; Qattan, M.Y.; Alhaji, J.H. Towards sustainable food services in hospitals: Expanding the concept of ‘plate waste’ to ‘tray waste’. Sustainability 2020, 12, 6872. [Google Scholar] [CrossRef]
- Charlebois, S.; Creedy, A.; von Massow, M. “Back of house”—focused study on food waste in fine dining: The case of Delish restaurants. Int. J. Cult. Tour. Hosp. Res. 2015, 9, 278–291. [Google Scholar] [CrossRef]
- Wenlock, R.W.; Buss, D.H.; Derry, B.J.; Dixon, E.J. Household food wastage in Britain. Br. J. Nutr. 1980, 43, 53–70. [Google Scholar] [CrossRef] [Green Version]
- Eriksson, M.; Malefors, C.; Bergström, P.; Eriksson, E.; Persson Osowski, C. Quantities and quantification methodologies of food waste in Swedish hospitals. Sustainability 2020, 12, 3116. [Google Scholar] [CrossRef] [Green Version]
- Costello, C.; Birisci, E.; McGarvey, R. Food waste in campus dining operations: Inventory of pre- and post-consumer mass by food category, and estimation of embodied greenhouse gas emissions. Renew. Agric. Food Syst. 2016, 31, 191–201. [Google Scholar] [CrossRef]
- National Bureau of Statistics of China. Projected Data from the Annual Population Sample Survey. Available online: http://data.stats.gov.cn/easyquery.htm?cn=C01 (accessed on 31 December 2019).
- Balzaretti, C.M.; Ventura, V.; Ratti, S.; Ferrazzi, G.; Spallina, A.; Carruba, M.O.; Castrica, M. Improving the overall sustainability of the school meal chain: The role of portion sizes. Eat. Weight. Disord. Stud. Anorex. Bulim. Obes. 2018, 25, 107–116. [Google Scholar] [CrossRef] [PubMed]
- Derqui, B.; Fayos, T.; Fernandez, V. Towards a more sustainable food supply chain: Opening up invisible waste in food service. Sustainability 2016, 8, 693. [Google Scholar] [CrossRef] [Green Version]
- Wyse, R.; Yoong, S.L.; Dodds, P.; Campbell, L.; Delaney, T.; Nathan, N.; Janssen, L.; Reilly, K.; Sutherland, R.; Wiggers, J.; et al. Online canteens: Awareness, use, barriers to use, and the acceptability of potential online strategies to improve public health nutrition in primary schools. Health Promo. J. Aust. 2017, 28, 67–71. [Google Scholar] [CrossRef]
- Wrap, W. Household Food and Drink Waste in the UK; WRAP: Banbury, UK, 2009. [Google Scholar]
- Falasconi, L.; Vittuari, M.; Politano, A.; Segrè, A. Food waste in school catering: An Italian case study. Sustainability 2015, 7, 14745–14760. [Google Scholar] [CrossRef] [Green Version]
- Martins, M.L.; Cunha, L.M.; Rodrigues, S.S.; Rocha, A. Determination of plate waste in primary school lunches by weighing and visual estimation methods: A validation study. Waste Manag. 2014, 34, 1362–1368. [Google Scholar] [CrossRef]
- Liu, Y.; Cheng, S.; Liu, X.; Cao, X.; Xue, L.; Liu, G. Plate waste in school lunch programs in Beijing, China. Sustainability 2016, 8, 1288. [Google Scholar] [CrossRef] [Green Version]
- Gao, L.W.; Cheng, S.K.; Cao, X.C.; Zhang, D.; Liu, X.J.; Qin, Q.; Liu, Y.; Wang, L.E. Review of food loss and waste research and its prospect. J. Nat. Resour. 2015, 30, 523–536. (In Chinese) [Google Scholar]
- Adelson, S.F.; Deláney, I.; Miller, C.; Noble, I.T. Discard of edible food in households. J. Int. Econ. 1963, 55, 633–638. [Google Scholar]
- Abeliotis, K.; Chroni, C.; Kyriacou, A.; Lasaridi, K. Food waste within households: A review on the generated quantities and potential for prevention. In Proceedings of the ATHENS 2014 2nd International Conference on Sustainable Solid Waste Management, Athens, Greece, 12–14 June 2014. [Google Scholar]
- Xu, S.W. An analysis on food consumption and waste in China. Food Nutr. China 2005, 11, 4–8. (In Chinese) [Google Scholar]
- Wang, L.E.; Cheng, S.K.; Liu, G.; Liu, X.J.; Bai, J.F.; Zhang, D.; Gao, L.W.; Cao, X.C.; Liu, Y. Study on theories and methods of Chinese food waste. J. Nat. Resour. 2015, 30, 715–724. (In Chinese) [Google Scholar]
- Hanks, A.S.; Wansink, B.; Just, D.R. Reliability and accuracy of real-time visualization techniques for measuring school cafeteria tray waste: Validating the quarter-waste method. J. Acad. Nutr. Diet. 2014, 114, 470–474. [Google Scholar] [CrossRef] [Green Version]
- FUSIONS Estimates of European Food Waste Levels. FUSIONS Reducing Food Waste through Social Innovation. Food Use for Social Innovation by Optimising Waste Prevention Strategies (FUSIONS); Swedish Environmental Research Institute: Stockholm, Sweden, 2016; Available online: https://www.eu-fusions.org/phocadownload/Publications/Estimates%20of%20European%20food%20waste%20levels.pdf (accessed on 23 November 2020).
- European Union. DIRECTIVE 2008/98/EC of the European Parliament and of the Council, 19 November 2008 on Waste and Repealing Certain Directives; European Union: Brussels, Belgium, 2008. [Google Scholar]
- Eriksson, M.; Osowski, C.P.; Björkman, J.; Hansson, E.; Malefors, C.; Eriksson, E.; Ghosh, R. The tree structure—A general framework for food waste quantification in food services. Resour. Conserv. Recycl. 2018, 130, 140–151. [Google Scholar] [CrossRef]
- Zhao, Y.C.; Sun, L.; Liu, H.M. Investigation and research on current university students’ waste behavior: Taking the investigation of students in jilin agricultural university as an example. J. Educ. I. Jilin Prov. 2013, 29, 16–17. (In Chinese) [Google Scholar]
- Kowalewska, M.T.; Kołłajtis-Dołowy, A. Food, nutrient, and energy waste among school students. Br. Food J. 2018, 120, 1807–1831. [Google Scholar] [CrossRef]
- Zhu, Q.; Li, F.; Qian, Z. A survey of canteen food waste and its carbon footprint in universities national wide. J. Arid. Land Resour. Environ. 2020, 34, 49–55. (In Chinese) [Google Scholar]
- Brenes-Peralta, L.; Jiménez-Morales, M.F.; Campos-Rodríguez, R.; De Menna, F.; Vittuari, M. Decision-making process in the circular economy: A case study on university food waste-to-energy actions in Latin America. Energies 2020, 13, 2291. [Google Scholar] [CrossRef]
- Derqui, B.; Fernandez, V.; Fayos, T. Towards more sustainable food systems. Addressing food waste at school canteens. Appetite 2018, 129, 1–11. [Google Scholar] [CrossRef]
- Engstrom, R.; Carlsson-Kanyama, A. Food losses in food service institutions examples from Sweden. Food Policy 2004, 29, 203–213. [Google Scholar] [CrossRef]
- Yu, W.; Xu, S.W.; Wang, Y.; Cheng, S.K.; Liu, X.J.; Bai, J.F.; Wang, L.E.; Zhang, D.; Gao, L.W.; Cao, X.C.; et al. Research methods exploring of food waste in the catering industry. Agric. Outlook 2016, 12, 67–70. (In Chinese) [Google Scholar]
- Li, F.; Qian, Z.; Qian, L. Report on Food Waste in College and University Canteen; Economic Management Press: Beijing, China, 2019. (In Chinese) [Google Scholar]
- ISO. ISO 14044, Environmental Management—Life Cycle Assessment—Requirements and Guidelines; ISO: Geneva, Switzerland, 2006. [Google Scholar]
- ISO. ISO 14040 Environmental Management—Life Cycle Assessment—Principles and Framework; ISO: Geneva, Switzerland, 2006. [Google Scholar]
- De Menna, F.; Dietershagen, J.; Loubiere, M.; Vittuari, M. Life cycle costing of food waste: A review of methodological approaches. Waste Manag. 2018, 73, 1–13. [Google Scholar] [CrossRef]
- Hunkeler, D.; Lichtenvort, K.; Rebitzer, G. Environmental Life Cycle Costing; CRC Press: Boca Raton, FL, USA, 2008. [Google Scholar]
- Wernet, G.; Bauer, C.; Steubing, B.; Reinhard, J.; Moreno-Ruiz, E.; Weidema, B. The ecoinvent database version 3 (Part I): Overview and methodology. Int. J. Life Cycle Assess. 2016, 21, 1218–1230. [Google Scholar] [CrossRef]
- Huang, H.P.; Li, Y.L.; Yang, S.L. Spatio-temporal evolutio characteristics of carbon emissions from food consumption of urban residents in China. Chin. J. Environ. Manag. 2021, 13, 112–120. (In Chinese) [Google Scholar]
- An, Y.F.; Peng, K.; Bao, J. Research on residents’ food consumption carbon emission calculation and its factors decompositio. J. Agrotech. Econ. 2014, 3, 74–82. (In Chinese) [Google Scholar]
- Zhi, J.; Gao, J.X. Analysis of carbon emission caused by food consumption in urban and rural inhabitants in China. Prog. Geog. 2009, 28, 429–434. (In Chinese) [Google Scholar]
- Chen, J.; Wang, S.; Ou, C.Y.; Jiang, X. Study on carbon emission measurement and dynamic optimization of fresh meat supply chain. J. China Agric. Univ. 2020, 25, 165–182. (In Chinese) [Google Scholar]
- Wu, Y.; Wang, X.K.; Lu, F. The carbon footprint of food consumption in Beijing. Acta Ecol. Sin. 2012, 32, 1570–1577. (In Chinese) [Google Scholar]
- Du, X.; Chen, T.; Li, H.; Ren, L.H.; Jin, Y.Y. Environment impact analysis of two typical restaurant garbage regeneration technologies. Chinese J. Environ. Eng. 2010, 4, 189–194. (In Chinese) [Google Scholar]
- Saltelli, A.; Chan, K.; Scott, E.M. Sensitivity Analysis; John Wiley and Sons: Hoboken, NJ, USA, 2000. [Google Scholar]
- Wei, W.; Larrey-Lassalle, P.; Faure, T.; Dumoulin, N.; Roux, P.; Mathias, J.-D. How to conduct a proper sensitivity analysis in life cycle assessment: Taking into account correlations within lci data and interactions within the lca calculation model. Environ. Sci. Technol. 2014, 49, 377–385. [Google Scholar] [CrossRef]
- Heijungs, R.; Kleijn, R. Numerical approaches towards life cycle interpretation five examples. Int. J. Life Cycle Assess. 2001, 6, 141–148. [Google Scholar] [CrossRef] [Green Version]
- Bala, A.; Raugei, M.; Benveniste, G.; Gazulla, C.; Fullana-i-Palmer, P.; Gala, A.B. Simplified tools for global warming potential evaluation: When ‘good enough’ is best. Int. J. Life Cycle Assess. 2010, 15, 489–498. [Google Scholar] [CrossRef]
- Igos, E.; Benetto, E.; Meyer, R.; Baustert, P.; Othoniel, B. How to treat uncertainties in life cycle assessment studies? Int. J. Life Cycle Assess. 2019, 24, 794–807. [Google Scholar] [CrossRef]
- Guo, M.; Murphy, R. LCA data quality: Sensitivity and uncertainty analysis. Sci. Total Environ. 2012, 435–436, 230–243. [Google Scholar] [CrossRef]
- Rajan, J.; Fredeen, A.L.; Booth, A.L.; Watson, M. Measuring food waste and creating diversion opportunities at Canada’s Green University TM. J. Hunger Environ. Nutr. 2018, 13, 573–586. [Google Scholar] [CrossRef]
- Wu, Y.; Tian, X.; Li, X.; Yuan, H.; Liu, G. Characteristics, influencing factors, and environmental effects of plate waste at university canteens in Beijing, China. Resour. Conserv. Recycl. 2019, 149, 151–159. [Google Scholar] [CrossRef]
- Giordano, A.; Fischbeck, P.; Matthews, H.S. Environmental and economic comparison of diesel and battery electric delivery vans to inform city logistics fleet replacement strategies. Transp. Res. Part D Transp. Environ. 2018, 64, 216–229. [Google Scholar] [CrossRef]
- Cerutti, A.K.; Ardente, F.; Contu, S.; Donno, D.; Beccaro, G.L. Modelling, assessing, and ranking public procurement options for a climate-friendly catering service. Int. J. Life Cycle Assess. 2018, 23, 95–115. [Google Scholar] [CrossRef] [Green Version]
- Jungbluth, N.; Keller, R.L.; König, A. ONE TWO WE—life cycle management in canteens together with suppliers, customers and guests. Int. J. Life Cycle Assess. 2016, 21, 646–653. [Google Scholar] [CrossRef]
- Mistretta, M.; Caputo, P.; Cellura, M.; Cusenza, M.A. Energy and environmental life cycle assessment of an institutional catering service: An Italian case study. Sci. Total Environ. 2019, 657, 1150–1160. [Google Scholar] [CrossRef]
- Cheng, S.K.; Gao, L.W.; Xu, Z.R.; Tang, C.C.; Wang, L.G.; Dhruba, B.G. Food waste in catering industry and its impact on resources and environment in China. China Soft Sci. 2012, 7, 106–114. (In Chinese) [Google Scholar]
Figure 1.
Total food waste per student per meal and its composition.

Figure 2.
Distribution of carbon footprint of food waste in university canteens.

Figure 3.
Distribution of cost of food waste in university canteens.

Figure 4.
Sensitivity of carbon emissions (per functional unit) to changes in uncertain variables.


Table 1.
Sample distribution.
| Classification | Quantity | Total | |
|---|---|---|---|
| Gender | Male | 312 | 600 |
| Female | 288 | ||
| Education | Undergraduate | 540 | 600 |
| Graduate student | 60 | ||
| Time | Lunch | 330 | 600 |
| Dinner | 270 | ||
Table 2.
LCA and E-LCC system boundaries and phases.
| Procurement | Transportation | Cooking | Disposal | |
|---|---|---|---|---|
| Environmental inputs | Cooked wheaten food, rice products, vegetables, soy products, pork, poultry meat, beef and mutton, aquatic products, eggs | Type of vehicle Transportation distance | Water Electricity Gas | Waste transportation Waste disposal |
| Cost inputs | Food price | Fuel needed Labour | Water Electricity Gas Labour | Transportation |
Table 3.
Food raw and cooked conversion coefficient and comprehensive carbon conversion coefficient.
Table 3.
Food raw and cooked conversion coefficient and comprehensive carbon conversion coefficient.
| Name | Raw and Cooked Conversion Coefficient 1 | Comprehensive Carbon Conversion Coefficient (kgc/kg) 2 |
|---|---|---|
| Cooked wheaten food | 0.62 | 0.3268 |
| Rice products | 0.45 | |
| Vegetables | 0.896 | 0.0274 |
| Soy products | 1.0 | |
| Pork | 1.64 | 1.1892 |
| Poultry meat | 1.48 | 1.0062 |
| Beef and mutton | 1.54 | 1.3657 |
| Aquatic Products | 1.25 | 0.7315 |
| Eggs | 1.31 | 1.2621 |
Table 4.
Energy carbon emission factor.
| Name | Water | Electricity | Gas |
|---|---|---|---|
| Carbon emission factor 1 | 0.194 kg CO2-eq/t | 0.85 kg CO2-eq/kWh | 2.09 kg CO2-eq/m3 |
1 Refer to the carbon emission coefficient table of various energy provided by Wu et al. [51].
Table 5.
Carbon footprint of food waste in university canteens (unit: kgCO2-eq).
| Item | Procurement | Transportation | Cooking | Disposal | Subtotal | Carbon Footprint per Unit Mass |
|---|---|---|---|---|---|---|
| Cooked wheaten food | 76.99 | 1.59 | 355.61 | 60.55 | 494.74 | 2.10 |
| Rice products | 60.81 | 1.25 | 280.63 | 47.82 | 390.51 | 2.10 |
| Vegetables | 4.66 | 1.12 | 255.99 | 43.71 | 305.48 | 1.80 |
| Soy products | 2.44 | 0.05 | 133.89 | 22.85 | 159.23 | 1.79 |
| Livestock and poultry meat | 136.27 | 0.10 | 178.88 | 30.55 | 345.80 | 2.91 |
| Aquatic products | 61.70 | 0.08 | 127.46 | 21.68 | 210.92 | 2.50 |
| Eggs | 37.84 | 0.13 | 44.99 | 7.70 | 90.66 | 3.02 |
| Subtotal | 380.71 | 4.32 | 1377.45 | 234.86 | 1997.34 | - |
Table 6.
Cost of food waste in university canteens (unit: yuan).
| Item | Procurement | Transportation | Cooking | Disposal | Subtotal | Unit Mass Cost |
|---|---|---|---|---|---|---|
| Cooked wheaten food | 876.43 | 35.74 | 2064.21 | 10.67 | 2987.05 | 12.68 |
| Rice products | 893.14 | 35.74 | 1628.98 | 8.43 | 2566.29 | 13.79 |
| Vegetables | 1156.48 | 34.80 | 1485.98 | 7.70 | 2684.96 | 15.79 |
| Soy products | 693.58 | 2.82 | 777.19 | 4.03 | 1477.62 | 16.62 |
| Livestock and poultry meat | 4562.30 | 2.35 | 1038.32 | 5.38 | 5608.35 | 47.20 |
| Aquatic products | 927.85 | 2.35 | 739.88 | 3.82 | 1673.90 | 19.84 |
| Eggs | 233.84 | 23.51 | 261.13 | 1.36 | 519.84 | 17.34 |
| Subtotal | 9343.62 | 137.31 | 7995.69 | 41.39 | 17,518.01 | - |
Publisher’s Note: MDPI stays neutral with regard to jurisdictional claims in published maps and institutional affiliations. |
© 2021 by the authors. Licensee MDPI, Basel, Switzerland. This article is an open access article distributed under the terms and conditions of the Creative Commons Attribution (CC BY) license (https://creativecommons.org/licenses/by/4.0/).
Share and Cite
MDPI and ACS Style
Li, J.; Li, W.; Wang, L.; Jin, B. Environmental and Cost Impacts of Food Waste in University Canteen from a Life Cycle Perspective. Energies 2021, 14, 5907. https://doi.org/10.3390/en14185907
AMA Style
Li J, Li W, Wang L, Jin B. Environmental and Cost Impacts of Food Waste in University Canteen from a Life Cycle Perspective. Energies. 2021; 14(18):5907. https://doi.org/10.3390/en14185907
Chicago/Turabian StyleLi, Jing, Wei Li, Lei Wang, and Baihui Jin. 2021. "Environmental and Cost Impacts of Food Waste in University Canteen from a Life Cycle Perspective" Energies 14, no. 18: 5907. https://doi.org/10.3390/en14185907
Note that from the first issue of 2016, this journal uses article numbers instead of page numbers. See further details here.