Article

Potential of Using Medium Electric Vehicle Fleet in a Commercial Enterprise Transport in Germany on the Basis of Real-World GPS Data

1
Institute for Electrical Engineering, University of Applied Science Magdeburg, 39114 Magdeburg, Germany
2
Fraunhofer Institute for Factory Operation and Automation IFF, 39106 Magdeburg, Germany
3
Institute of Electrical Engineering and Electronics, Poznan University of Technology, 60965 Poznan, Poland
*
Author to whom correspondence should be addressed.
Energies 2021, 14(17), 5327; https://doi.org/10.3390/en14175327
Submission received: 8 July 2021 / Revised: 20 August 2021 / Accepted: 24 August 2021 / Published: 27 August 2021

Abstract

:
The intensive electrification of the automotive sector means that the energy system must be able to adapt to the current market situation. The increase in energy demand is a major factor associated with electric vehicles. The study analyzed the operation of a grid-connected facility operating a vehicle fleet providing transport services in the region Halle/Saale, Germany. Measurement data were used in the analysis, including global positioning system data of the vehicles and technical data, including average fuel consumption on a given route section, daily load demand of the industrial facility, and energy generation from photovoltaics. This paper shows the impact of using a battery electric vehicles (BEVs) fleet in the load distribution for the industrial facility considered. The NEDC energy consumption profile for the Nissan e-NV200 were used in this study. Furthermore, the paper presented simulation results allowing one to determine the usage potential, energy demand, and consumption of EVs using real data, reliably representing the processes related to EV daily use. The measurement data were captured using available specialized equipment: Dako-Key (GPS data), PV power generation (Siemens 7KM PAC4200), and load (Janitza UMG 604-Pro) in September, 2018. On this basis, it is possible to identify the effects and variations in load on the power grid during the replacement of combustion vehicle fleets used currently by EVs for the provision of transport services. Three models were presented, making it possible to calculate changes in energy demand for each scenario. In the first model, EVs were charged exclusively from the distribution network. In the second, the energy generation from a renewable source was considered and the possibility of compensating the energy demand of the vehicles from this source was demonstrated. In the third model, the daily load profile and the period of maximum load in the electricity grid were considered. The results are presented in graphical and tabular form. Finally, the potential of using an EV fleet to increase the functionality of a modern industry object was determined and discussed. Based on data for the adopted scenarios, electrification of transport can increase demand for energy by 40.9% for individual enterprises. The electrification of the automotive sector will increase the instantaneous energy demand of businesses, forcing the integration of renewable energy sources during designing new invests.

1. Introduction

The stability of the power system is a complex issue and depends on many factors, which are increasingly difficult to maintain at the level required [1,2]. The reason for these events is disorders occurring in the network in the form of uncontrolled load changes, the stochastic generation of energy from renewable energy sources (RES), and overloads in distribution lines resulting from outdated, radial network topology, the environment (lightning), and limited equipment reliability. These factors cause the network to be treated as a nonlinear system, for which it is difficult to determine the optimal parameters of real-time operation. Therefore, it is advisable to use all methods available to monitor system operation, including the detection of faults and disturbances. This observation is often limited to the measurements of power grid parameters and the energy balance in a specific node of the system with specialized devices (e.g., PMU devices, SCADA system) by transmission and distribution system operators [3]. A corresponding increase in the observability of the system is important in view of the growing number of new sources, including electric vehicles (EVs). When modifying the grid structure and implementing new elements, the additional extended system and regional services should also be developed/built, which are perhaps not yet technically necessary or implementable under the current regulatory framework, but should not be overlooked regarding the technical and economic analysis of system operation for future grid extensions. Those services could increasingly be provided partially or totally by electromobility in the medium- and long-term.
With the current generation of electric-powered vehicles, including battery electric vehicles (BEVs), plug-in hybrid electric vehicles (PHEVs), and hybrid electric vehicles (HEVs), the most popular in Germany are BEVs and PHEVs based on statistics for 2019 and 2020 [4]. Detailed information on the design and differences between the mentioned vehicle variants can be found in the articles [5,6,7], which describe in detail power sources, models, sustainability, and charging infrastructure. The most popular approach consists of buying and using a vehicle as a private means of transport, but products and services based on car-sharing are developing rapidly on the market, which is helping to make electromobility more competitive. All the car-sharing models used currently are described in detail in the article [8], which also points out the existing trends in this sector and topics of new future research. In addition, the articles [9,10,11] present the results of research and analyses concerning the development of EV rental services, including the intelligent deployment of stations [11], field testing of the current solutions [10] and the impact of the growing number of car-sharing services on mobility and environmental protection [9]. This growth is due to government subsidies and benefits included in the new directives and allowing, among other things, EVs to use bus lanes [12]. This affects the current attractiveness of EVs significantly and essentially affects the increasing number of rentals per year. Moreover, their price is relatively small and acceptable, allowing EVs to be rented for a period of a few to several minutes, which, in most cases, is sufficient to cover a specific range of distances under urban conditions. Additionally, emission-free driving contributes to the improvement of environmental standards and the quality of inhabitants’ life in the large cities where these services are provided. This also reduces the growing problem of traffic noise in large metropolises. All these factors are aiming for the sustainable use of electric vehicles in logistics management strategies, as presented in the article [13].
Based on the studies available, similar analyses were carried out in the article [14] where real data measurements were used to analyze current charging behavior in Sweden and Norway. The article focused on the utilization of public high-power charging stations to reduce the length of charging time for EVs, taking into account the vehicle’s energy demand. It tried to find a queuing model for a future fast charging infrastructure. The authors of [15] also used the real measurements data of vehicles available to quantify correlations between the kinematic parameters of the vehicle and its energy consumption. Apart from using real data from vehicles, the authors did not consider the charging process. Another study that uses measurement data in the analysis of EV utilization in the power grid is [16]. This article also used global positioning system (GPS) data, such as the vehicle’s driving profiles including charging and discharging data. The authors tried to determine the possibility of using vehicles in the process of peak-load shifting using their own control algorithms. No additional energy source was used to supply the vehicles in [16], which is the case in this work. Moreover, the authors focused on the fleet of vehicles used not only by industry but also by individual customers with different driving styles. Different driving techniques also increase the energy consumption of the vehicle and therefore the energy taken from the grid. Detailed information on the economic aspects of different urban driving techniques can be found in [17]. Another article where real measurement data of the EV fleet were used is [18]. The authors determined the savings compared with conventional internal combustion engine (ICE) vehicles used on the same routes using GPS data and information on the charging stations available. Nevertheless, no information was included in this study about the impact of this fleet on the grid power flow or additional energy sources. Ji and Thal [19] focused on the analysis of greenhouse gas emissions with plug-in hybrid and battery EVs based on logged trips. Similar to the previous case, local load growth was not considered. The element of RES was fully omitted.
The works in which the authors analyzed the cooperation of EVs with RES include [20,21,22,23,24,25]. In [20], the author showed the advantages of the cooperation of EVs with wind generators, using the example of their application in Denmark. Similar to the following article, the author made use of measured data from an additional energy source installed in the system. However, the driving profiles of the vehicles or the grid load were not considered, and the utilization of the vehicles was limited to the regulation of energy generation from wind farms. A similar approach was presented in [21], where the authors used measured data obtained from a photovoltaic farm and real energy demand data in the urban residential area in their simulation. They proposed two strategies to control EVs for peak shaving. In this case, the modeling of vehicle operation including discharging and charging was done according to the algorithm adopted and focused on determining the annual costs of battery degradation, energy costs, and revenue in relation to parameters such as the maximum depth of discharge. In the article [22], the authors performed a similar analysis using historical metering data. Nevertheless, in the article different types of electric vehicles (PHEVs and BEVs) are used and a larger number of additional energy sources. There was no focus on economic analysis related to electricity trading. Similar for the paper [23], in the paper [24], the authors proposed a control system for vehicle charging process to reduce the negative uncontrolled impact on the power grid. They used real-time measurements for energy and PV installations for this purpose. The electric cars used in the analysis had a random value of the SOC level and the start time of the charging process according to the adopted algorithm, unlike here, where the charging time was strictly determined by the GPS data, for which the vehicle was actually parked and could be physically connected to the charging station. In the paper [25], a similar problem of integrating electric vehicles into the electricity grid and reducing their impact on the grid when cooperating with PV sources was presented. In this paper, the authors used 1-min data to develop the analysis results. However, the authors used models based on Markov transition matrices and probability theory to create the input data, unlike in this case, where measured and GPS data of vehicles were used as inputs. Nevertheless, many scientific articles describe the potential use of EVs extensively in a distribution network [26]. One of the fields of application is the energy distribution sector. The deployment of vehicles in smart grids has often been analyzed to increase efficiency and reduce disruptions in the power grid, as an increase in their number and uncontrolled operation may contribute to reducing the flexibility and stability of the distribution network [27]. Consequently, various analyses, such as optimal solutions for charging management [28], are being carried out to counteract this effect and identify the potential benefits of such use of EVs. In [29], the authors indicated the real benefits of cooperation between EVs, power system operators, and energy producers. Similar relationships and conclusions were presented in [30], which also included energy management in micro-grids. In addition, EVs equipped with rechargeable batteries, serving primarily as a means of transport, may, based on tests, be used as a specialized emergency energy source. The work on such a solution can be found in [31], where a real-life military application of a microgrid system based on vehicle-to-grid/vehicle-to-vehicle (V2G-V2V) was described.
V2G systems can be developed due to the increase in the number of electric vehicles on the market. Research on these systems is also possible due to the intensified development of car-sharing offers, which can be observed in many cities in Europe, and which was described by Sprei et al. [32] with the example of 12 cities in Europe and the United States. Furthermore, common car-sharing systems were described, among others, by Schmöller et al. [33] on the example of Munich and Berlin, for which data of a German free-floating carsharing system was used. Similar analyses were presented by Campisi et al. [34] in Italy, Becker et al. [35] in Switzerland, and Vine and Polak [36] in England. The significant participation of electric vehicles in car-sharing has a horizontal effect on the environment by reducing emissions [37,38] and EVs’ social aspects as presented in the article [39].
The cooperation of new energy sources cannot take place in an uncontrolled way and, therefore, appropriate communication standards have been used in this area [40] for the secure exchange of data between participants. In the case of large systems consisting of EV fleets, energy management, communication, and appropriate control systems play a decisive role in the stable implementation of the V2G strategy. In [41], the authors indicate the tasks that such a system should fulfill to be able to perform the assumed functions, and point out the necessity of modularization and increasing the number of possible communication methods. The latest protocol, which is being developed for the need to standardize communication between the EV, the charging station, and the system operator, is the ISO 15118 standard, which was described in [42]. Together with the IEC 61851 charging standard, which has been prepared for EVs and is described in [43], it complements it with elements of secure, encrypted communication allowing bidirectional energy exchange and, thus, realization of the V2G model. Moreover, in [44], the authors constructed their own charging system and carried out tests of the system functioning according to the IEC 61581 and ISO 15118 communication standard. These standards are currently being implemented by all leading automotive manufacturers.
Another aspect that was omitted in this article is the impact of the charging process on the quality of the electricity. However, this aspect is also a popular research topic worldwide. The large integration of electronic power devices both in the vehicle itself or the charging station can lead to voltage and current distortions. Examples of such deformations can be observed in [45,46]. In [47], authors not only presented the negative impact of vehicles and the potential interferences that can be generated but also proposed possible actions to reduce the occurrence of these interferences. Similarly, in [48], the authors presented a solution based on the utilization of EVs to regulate the voltage in the system with appropriate control strategies.
Furthermore, intensive utilization of EVs is associated with the degradation of the battery cells and acceleration of the aging processes, which are linked with the deterioration of user comfort. Analyses are often carried out using real measurement data, and models as in [49,50] are created with the purpose of determining the phenomena affecting the battery use in the V2G operations resulting from the construction and technology used. These studies most often show a deterioration in the properties of the storage facilities due to the increased frequency of the charging and discharging process under various conditions. In [51], the life of batteries used in vehicles has been estimated, based on different driving profiles and charging methods during the provision of system services within the Vehicle-to-Grid strategy. In [52], the authors identified negative effects resulting from calendar aging on capacity loss, resistance increase, and rate capability based on the Vehicle-to-Grid and Grid-to-Vehicle strategies adopted. Similar analyses can also show scientific research which presents a small impact of Vehicle-to-Grid strategies on battery capacity with appropriate control algorithms [53]. Aging processes are also directly related to additional costs, the analysis of which was carried out, inter alia, in the [54,55]. The issue of cell wear and battery lifetime is not covered in this article. In reaction to the occurrence of undesired events during the charging of vehicle batteries, appropriate methods and control algorithms are being developed. In [56], the authors proposed a method allowing electric vehicles to be charged in temporary load valleys, thus limiting the impact of vehicles on increasing energy demand. The methodology presented was studied for different locations (home, public buildings) and for different numbers of vehicles (low, medium, and high electric vehicle penetration). In turn, Iacobucci et al. [57] proposed a practical approach to optimize the operation of shared autonomous electric vehicles including smart charging based on dynamic electricity prices. Another global approach to the problem of cooperation between electric vehicles and energy system was presented by Wulff et al. [58], where he presented smart control implementations for 9 million EVs in Germany in 2030. The authors show that peak load can be reduced from 3 to 5% depending on the proposed charging solution for EVs.
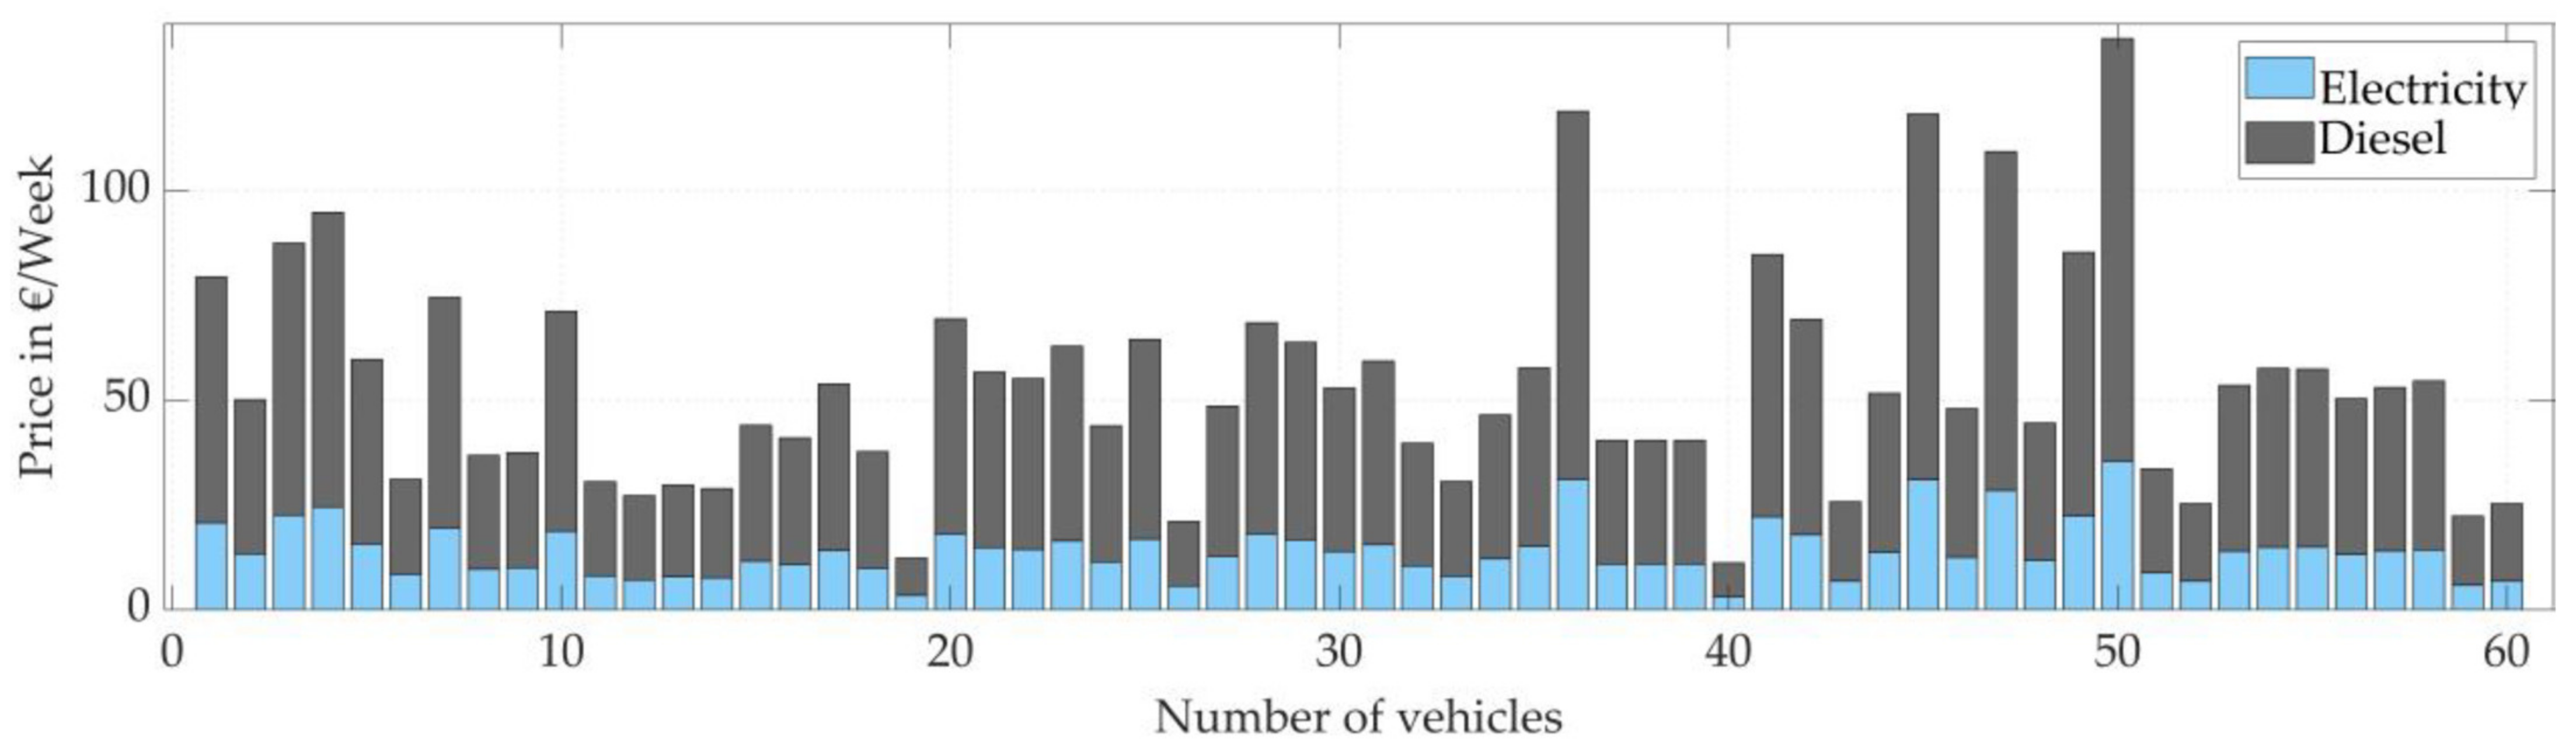
According to the European Commission’s proposal, the sale of diesel cars will be stopped from 2030 [59]. Similar measures will lead to a transformation in the transport sector. Companies which have so far used classic engines in their fleet will increasingly opt for solutions which do not conflict with EU regulations. This growth will be associated with an increase in energy demand. The work is aimed at investors, planners, and designers, with the aim of pointing out the need to take the extra measures into account when planning the construction of new company headquarters, which are also investing in various types of renewable energy sources.
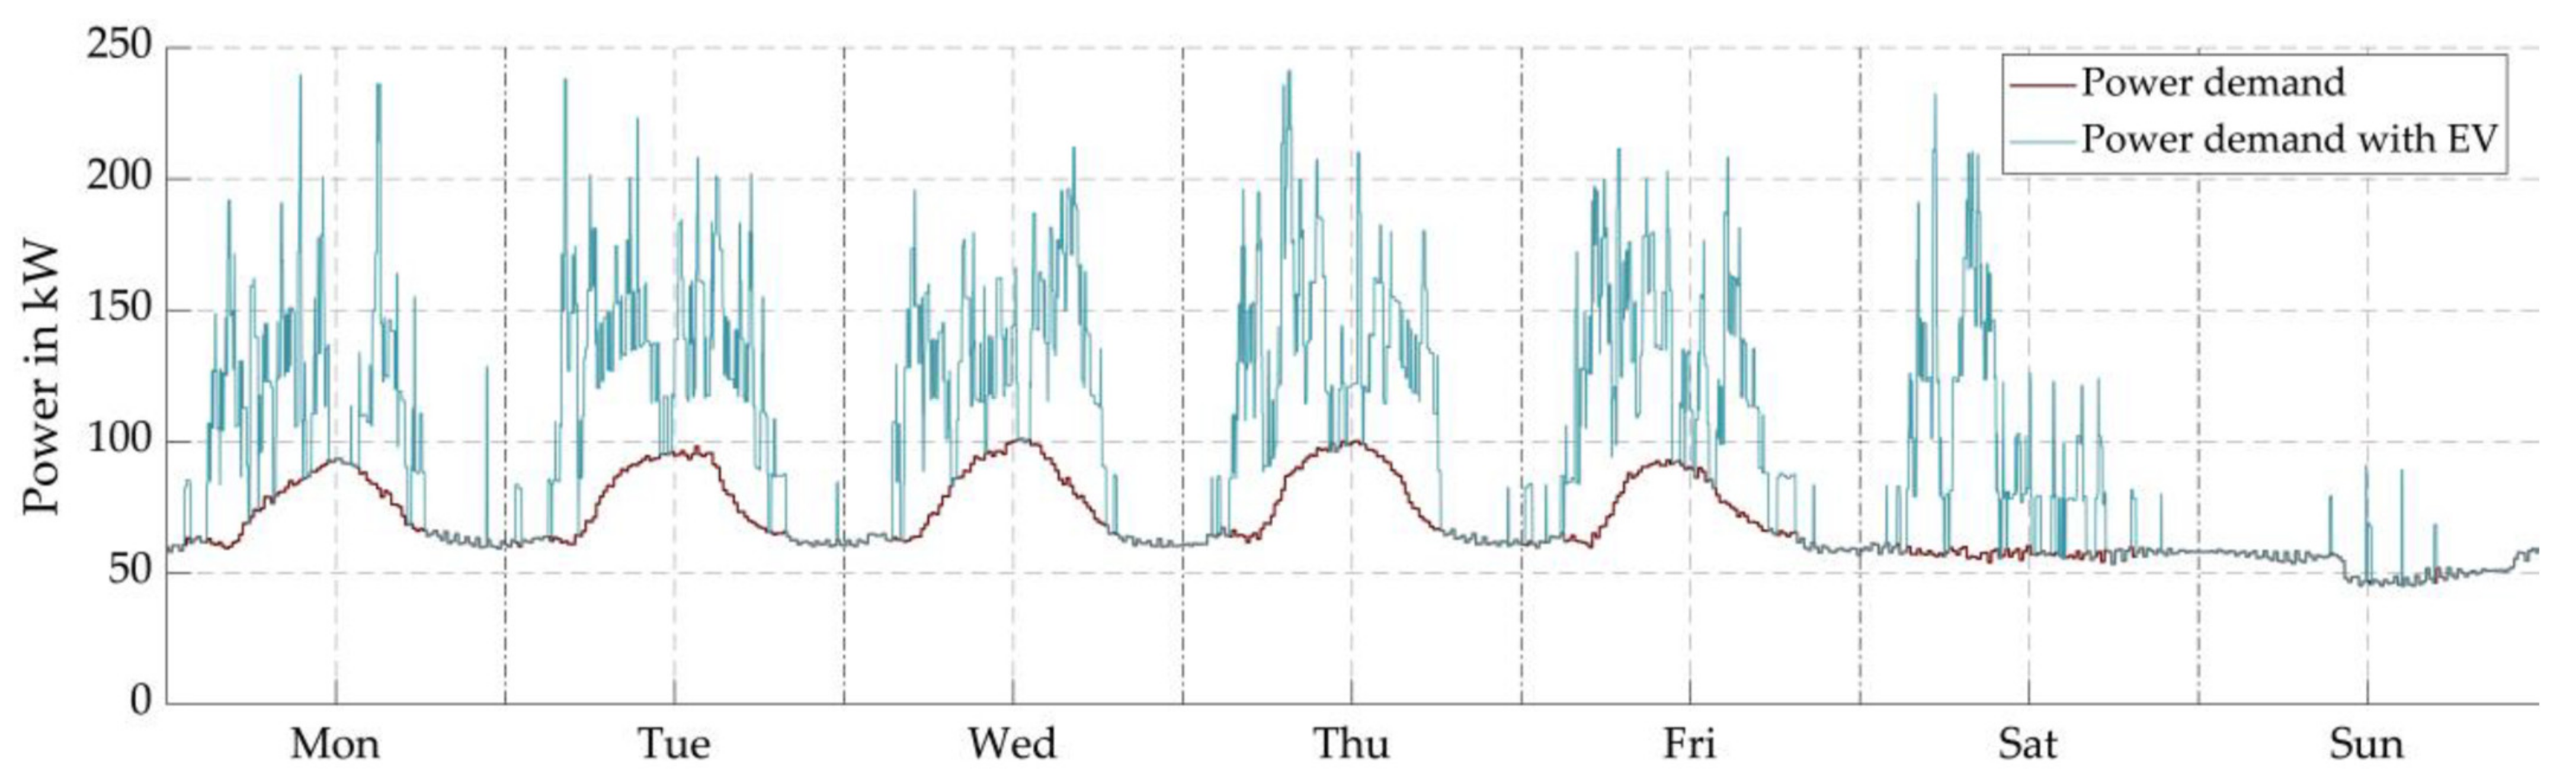
The current work includes elements of technical analysis allowing one to identify the potential of an EV fleet composed of 60 battery electric vehicles. An attempt was made to determine the real impact of replacing traditional ICE vehicles with electric ones for a medium-sized company. The study observes the changes in energy demand that can occur with this replacement.
The energy consumption of the EVs was based on GPS data of traditional ICE vehicles currently used for transport services in Germany. Based on this data, the theoretical fuel consumption provided by the manufacturer was compared with the real consumption taken from the measured data (amount of fuel used in l) of a fleet of 60 tested vehicles. The driving profiles were compiled using GPS data, and energy usage for the EV was obtained by calculation. Furthermore, the intervals during which the batteries would be discharged due to driving were taken into account, as well as charging at designated possible periods during the stopover on the company premises according to the data recorded. Both charging and discharging profiles were determined based on assumptions regarding the charging power available and vehicle energy demand per km. The aim of this work was to analyze the change of the fleet of traditional ICE vehicles to EVs within a given enterprise. The increase in electricity consumption and constantly rising prices of electricity on the market force enterprises to seek appropriate solutions to reduce costs and energy usage and simultaneously increase their independence from energy supplies. In addition, some of the specialized companies make extensive use of vehicles that provide services in the framework of which they carry out specific tasks and cover similar routes with a known frequency. On this basis, a model was analyzed based on the use of historical GPS data of the journeys of ICE vehicles, the potential impact of PV electricity generation, and the daily energy demand of the company’s facility. The studies present the potential for the use of the EV fleet in industrial transport and the charging requirements for the group of vehicles selected. In addition, it was shown that electrification of the automotive sector will increase the instantaneous energy demand, forcing the integration of renewable energy sources in the project design of new installations by developers.
The article is organized as follows: Section 2 presents the current state of the charging station infrastructure in Europe and the system services that this infrastructure could provide. Section 3 defines the assumptions and their justification and presents the calculation process for the model of the EV fleet created. 
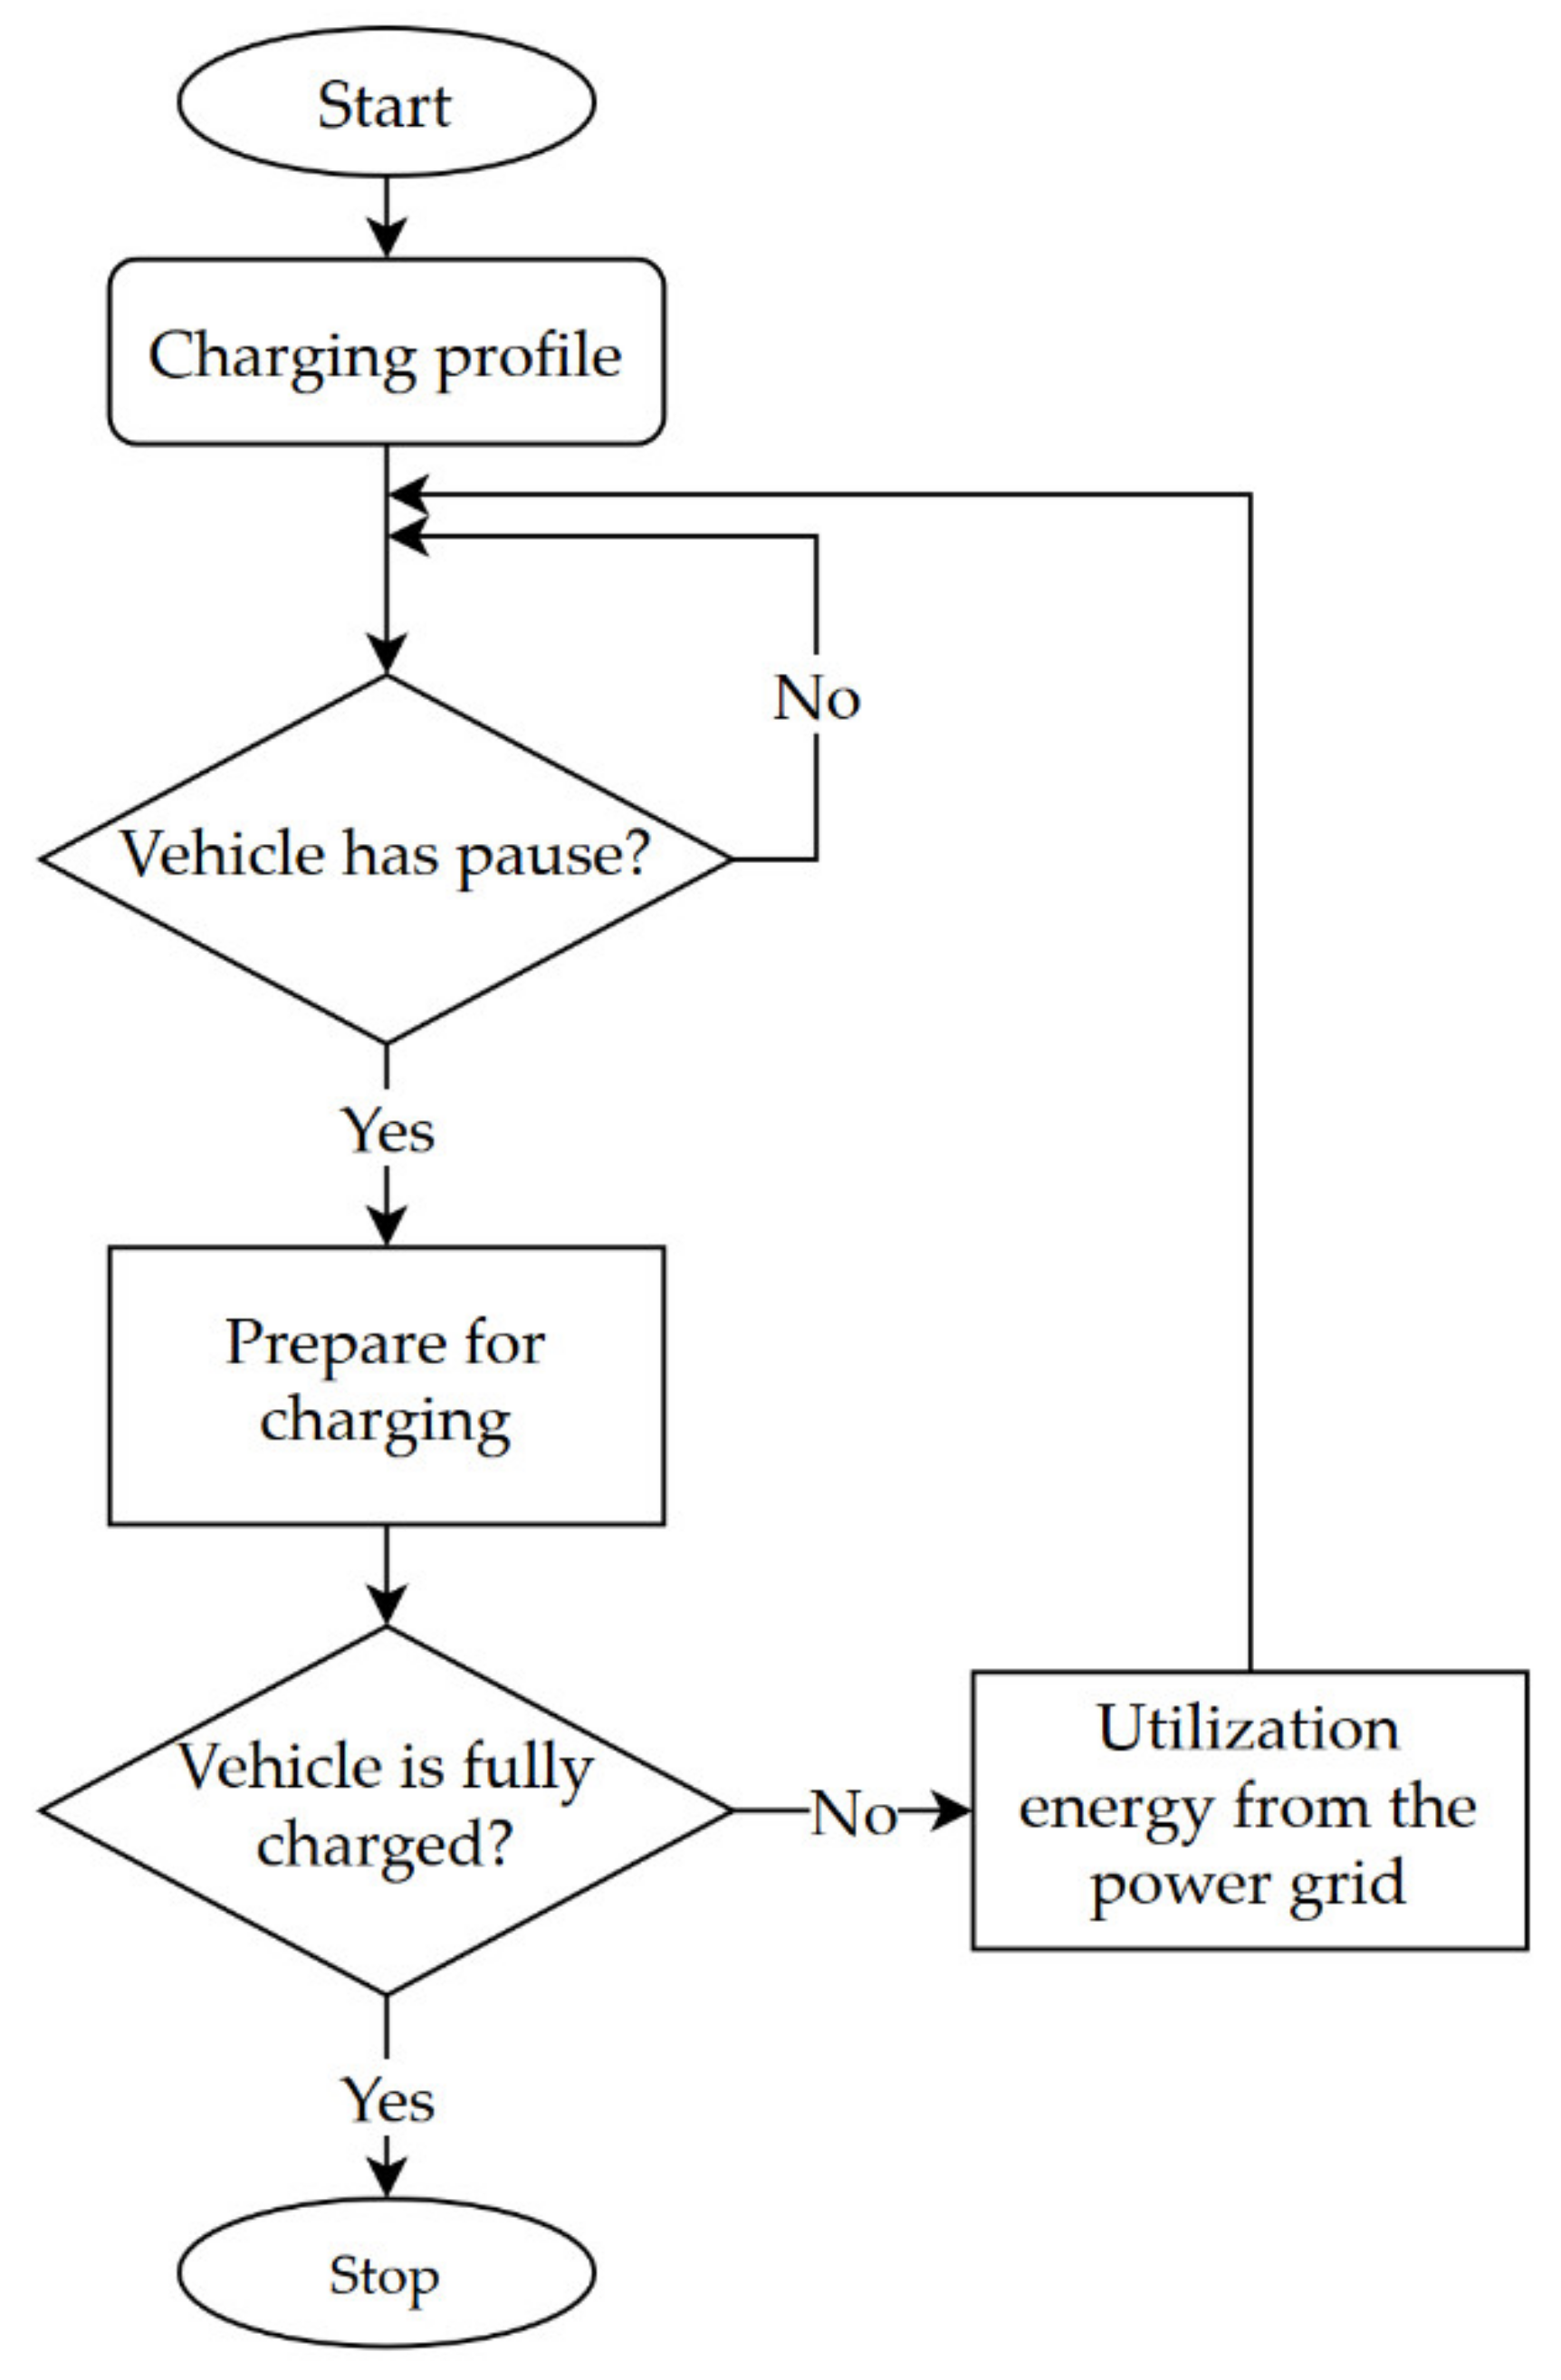
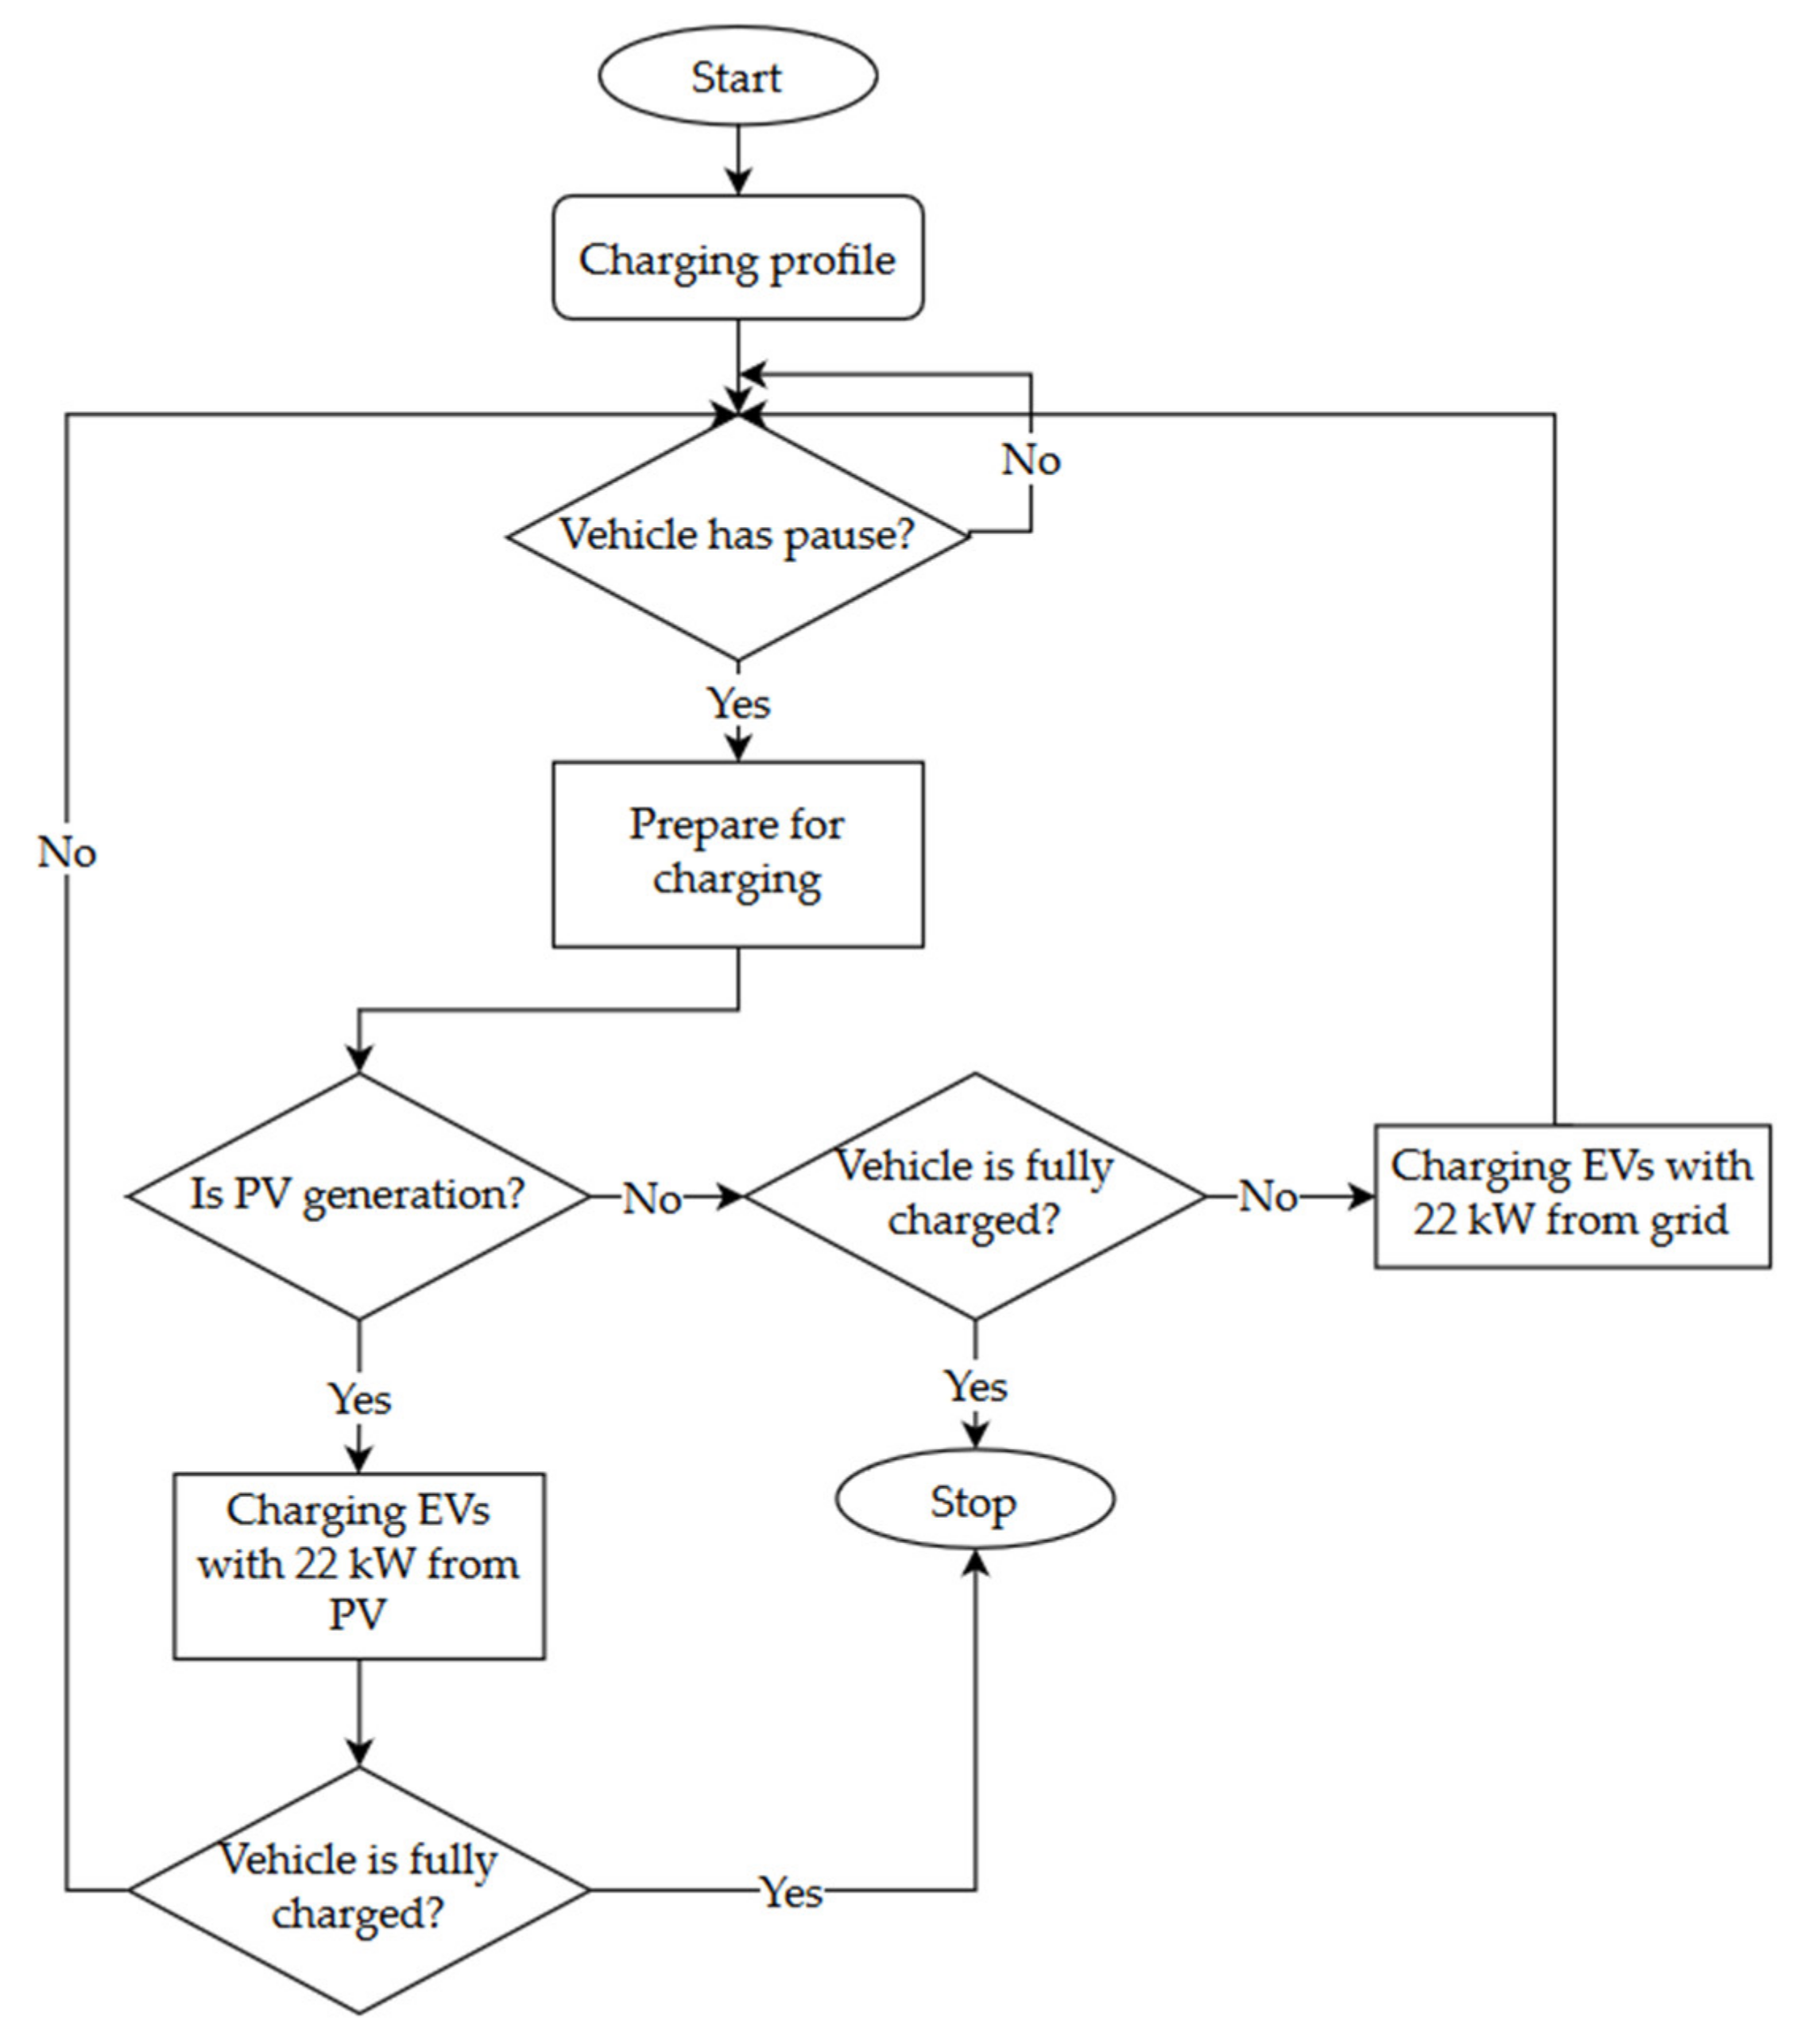
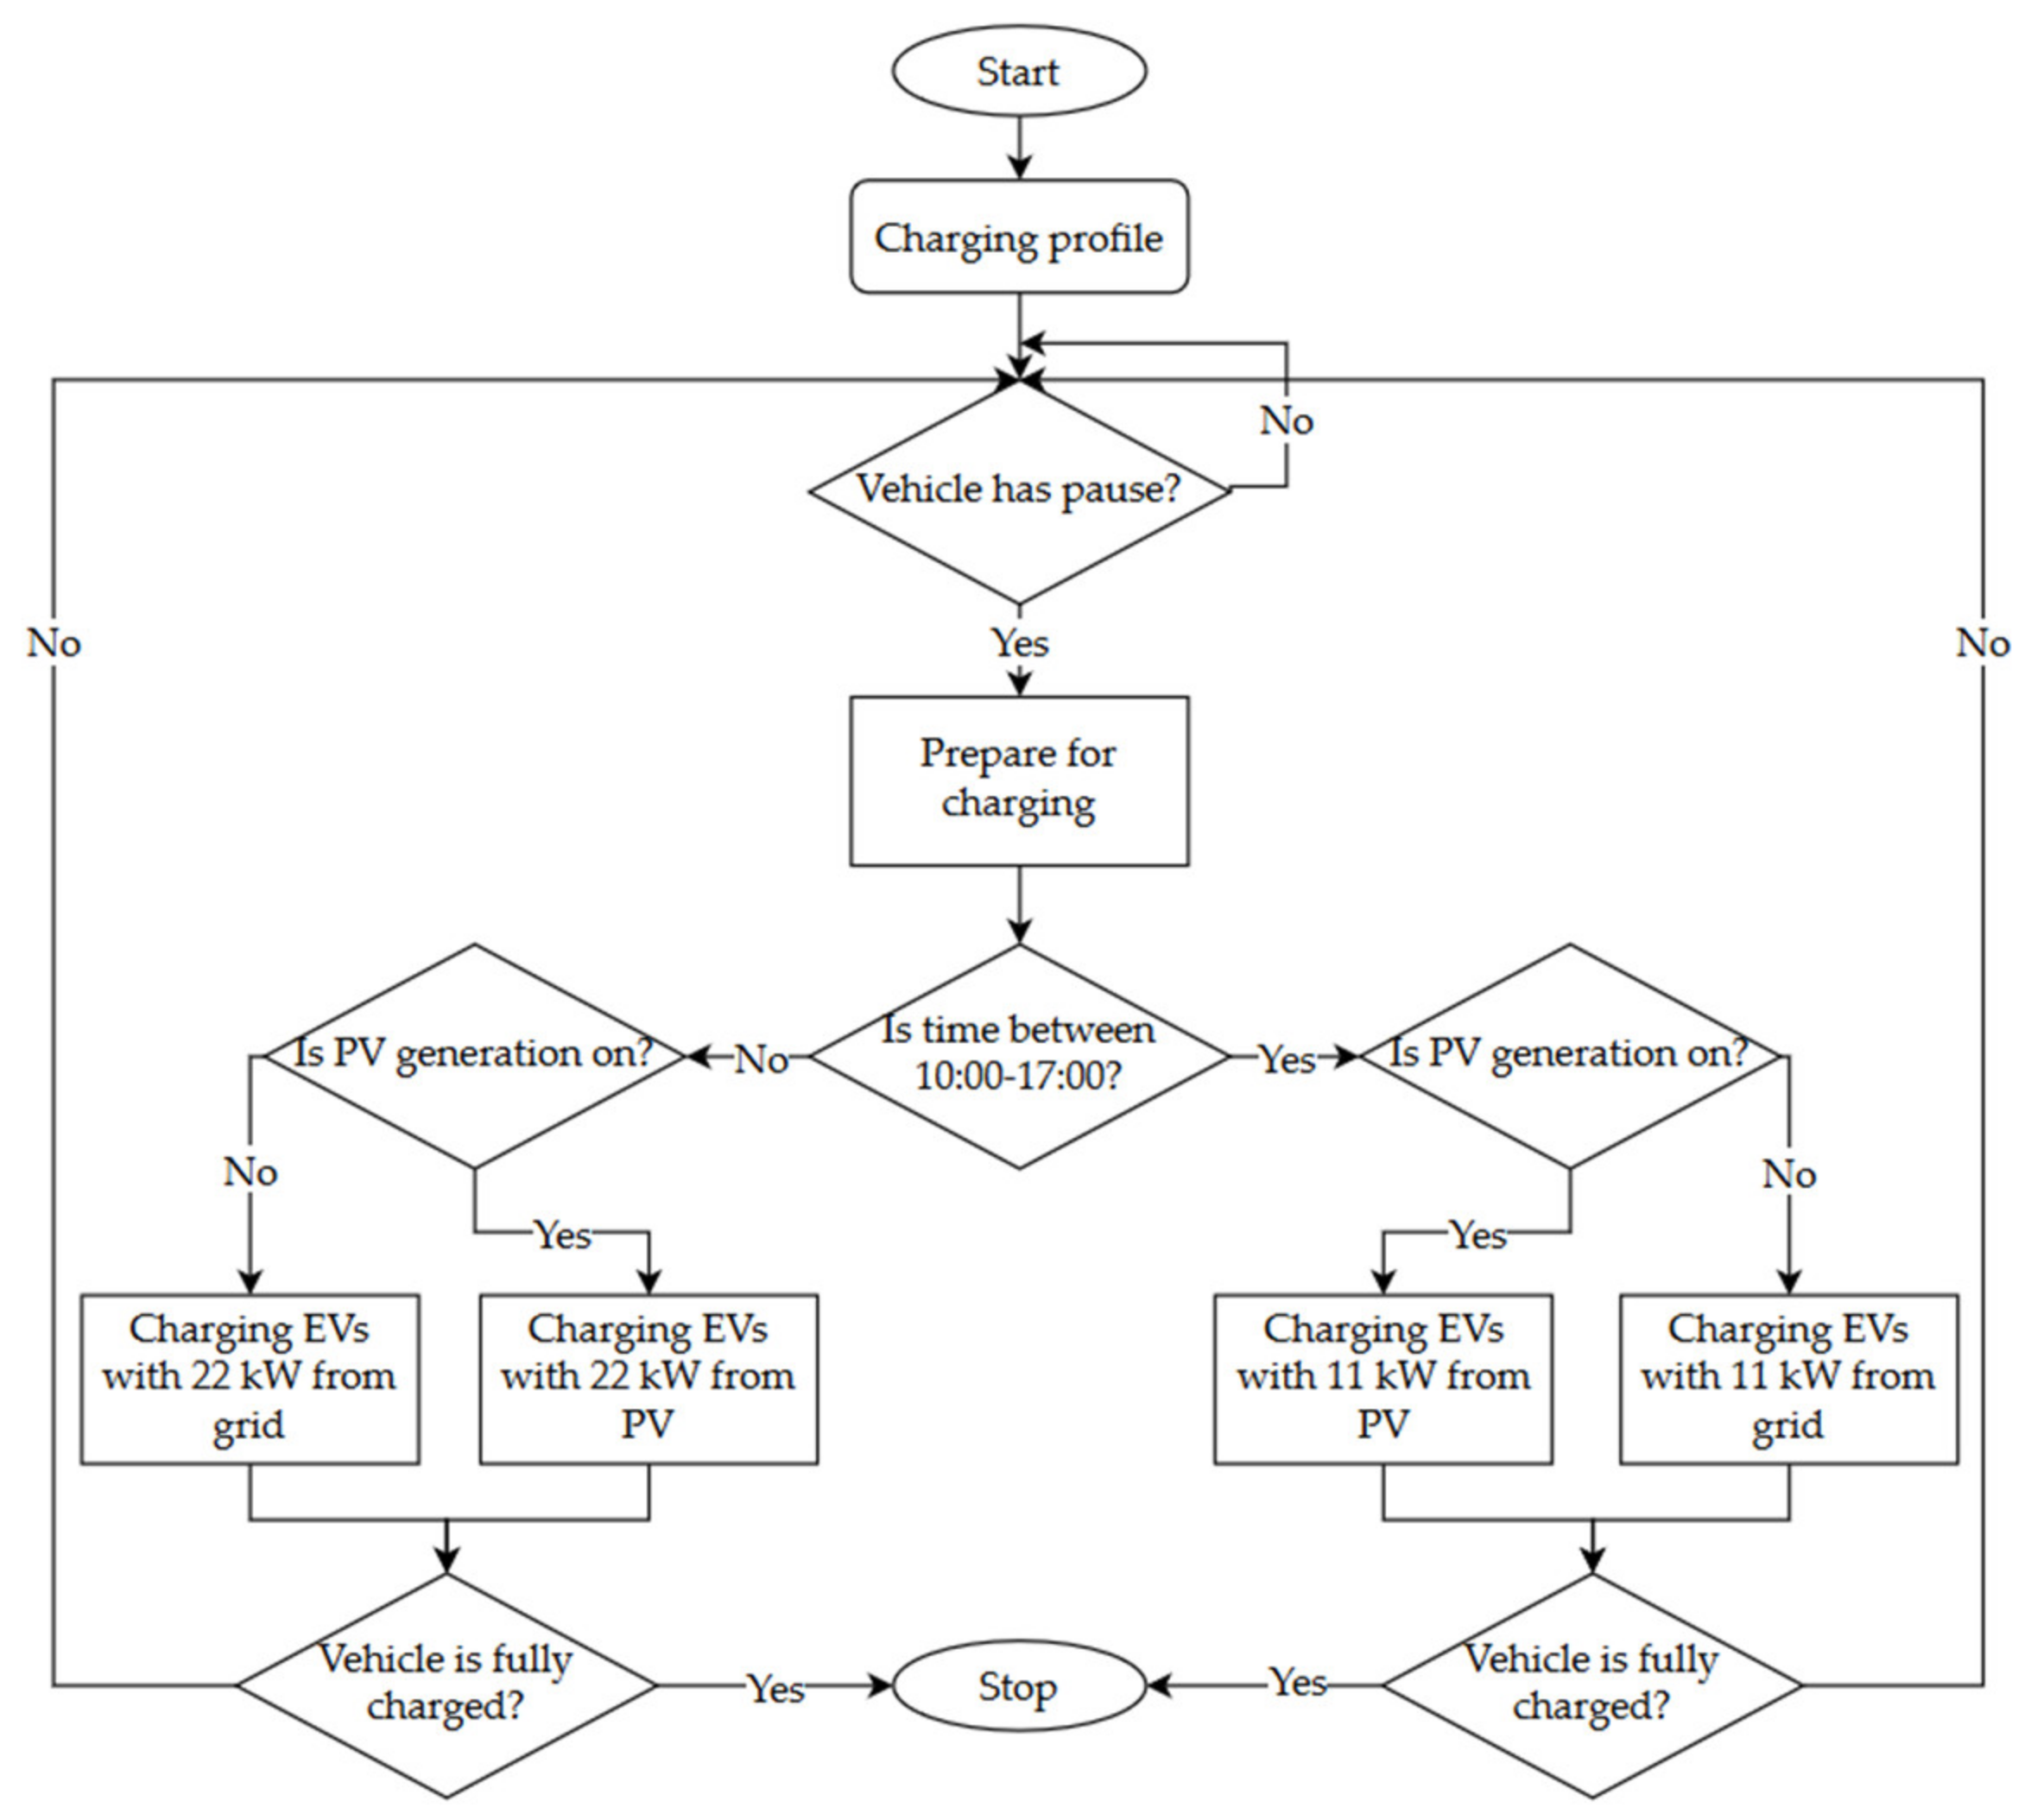
Section 4 defines the control algorithm that manages the vehicle charging process in the scenario under analysis. Section 5 looks at the case study. Finally, Section 6 presents the results and discussion from the work conducted. Conclusions are presented in the Section 7.

2. Evolution and Application Potential of Electromobility

Electromobility does not only describe a group of EVs but also all the interconnections and integration infrastructure in the power grid as a framework for safe and reliable cooperation. The charging stations are used as physical connection for the EV to the grid.
Common charging methods and charging times for electric cars are presented in Table 1.
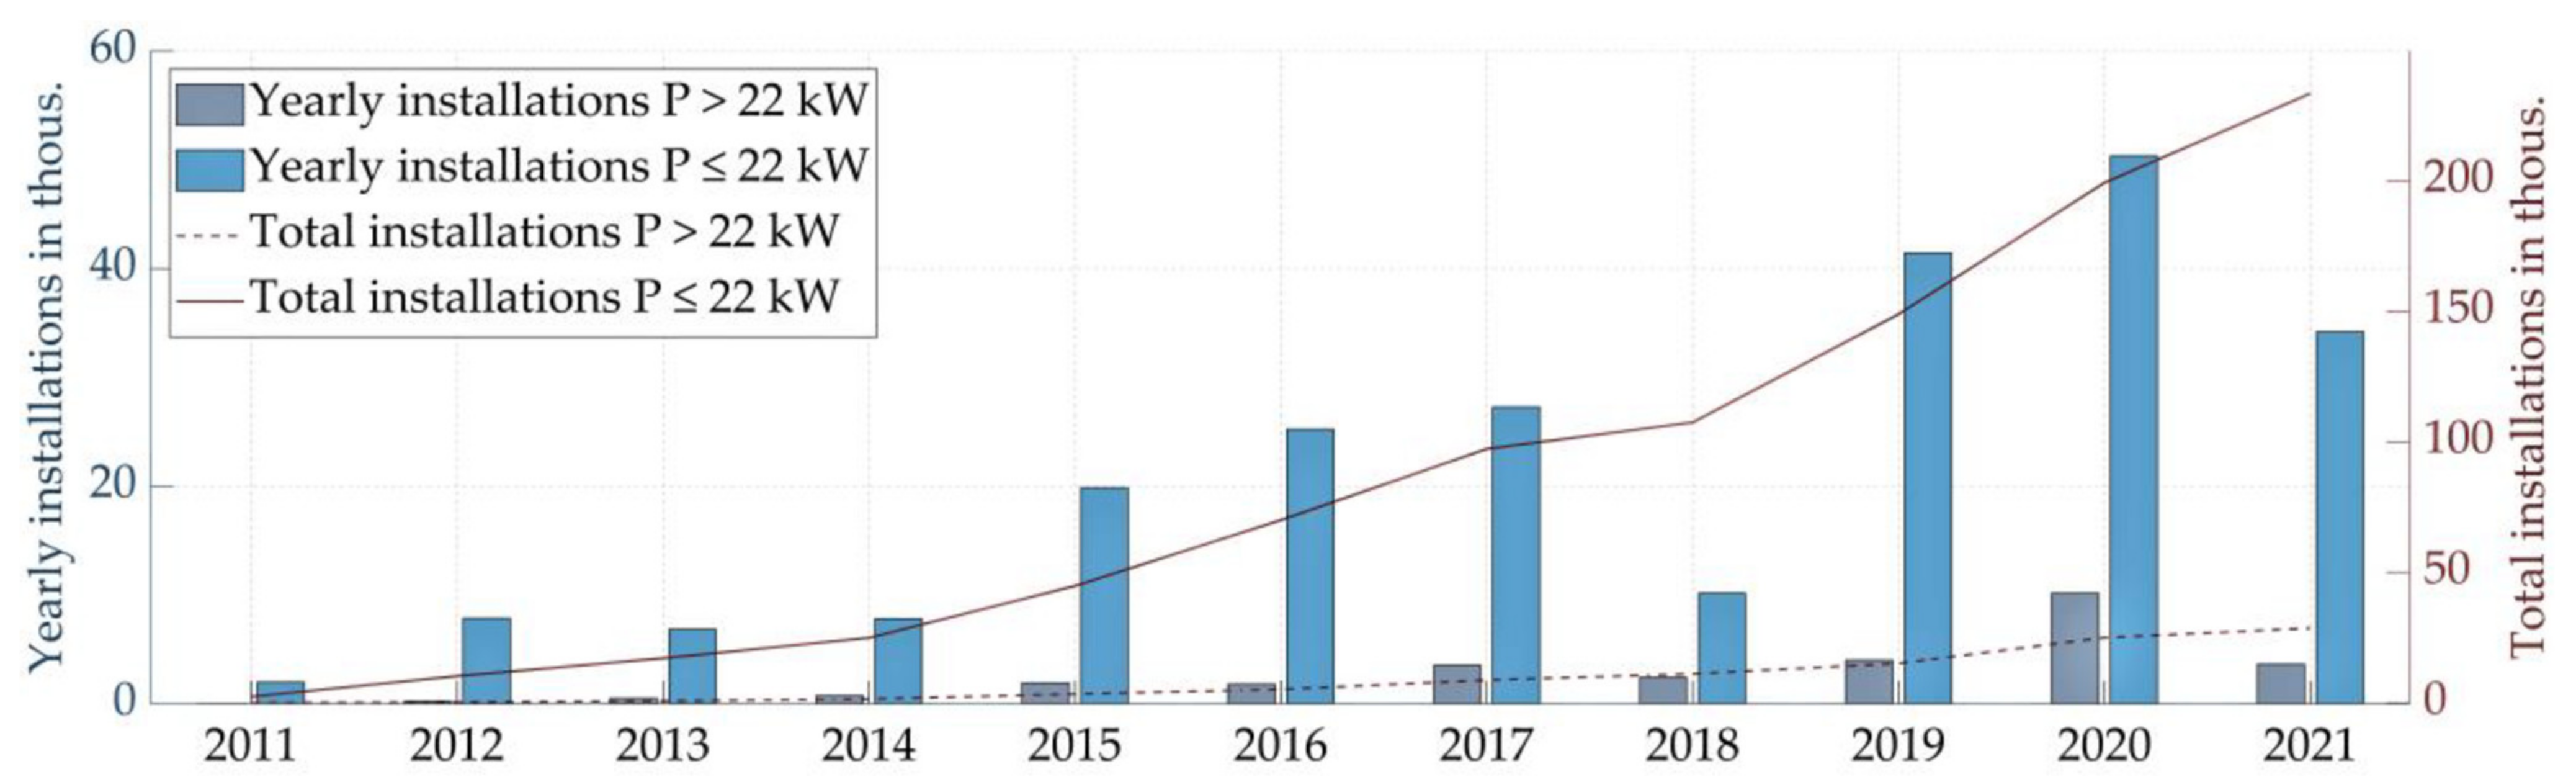
This poses an increasing challenge to the current grid infrastructure as the current building and commercial object where connections have been designed for specific power values with a minimum reserve resulting from the connection plans. In the past, the possibility of increasing the load on the grid as a result of new vehicle charging points had not been considered. This results in some network elements which are now exposed to overloading of the distribution lines. Despite the difficulties of integrating EVs into the grid, their number is steadily increasing. The number of new public charging points have been rising in recent years, as shown in
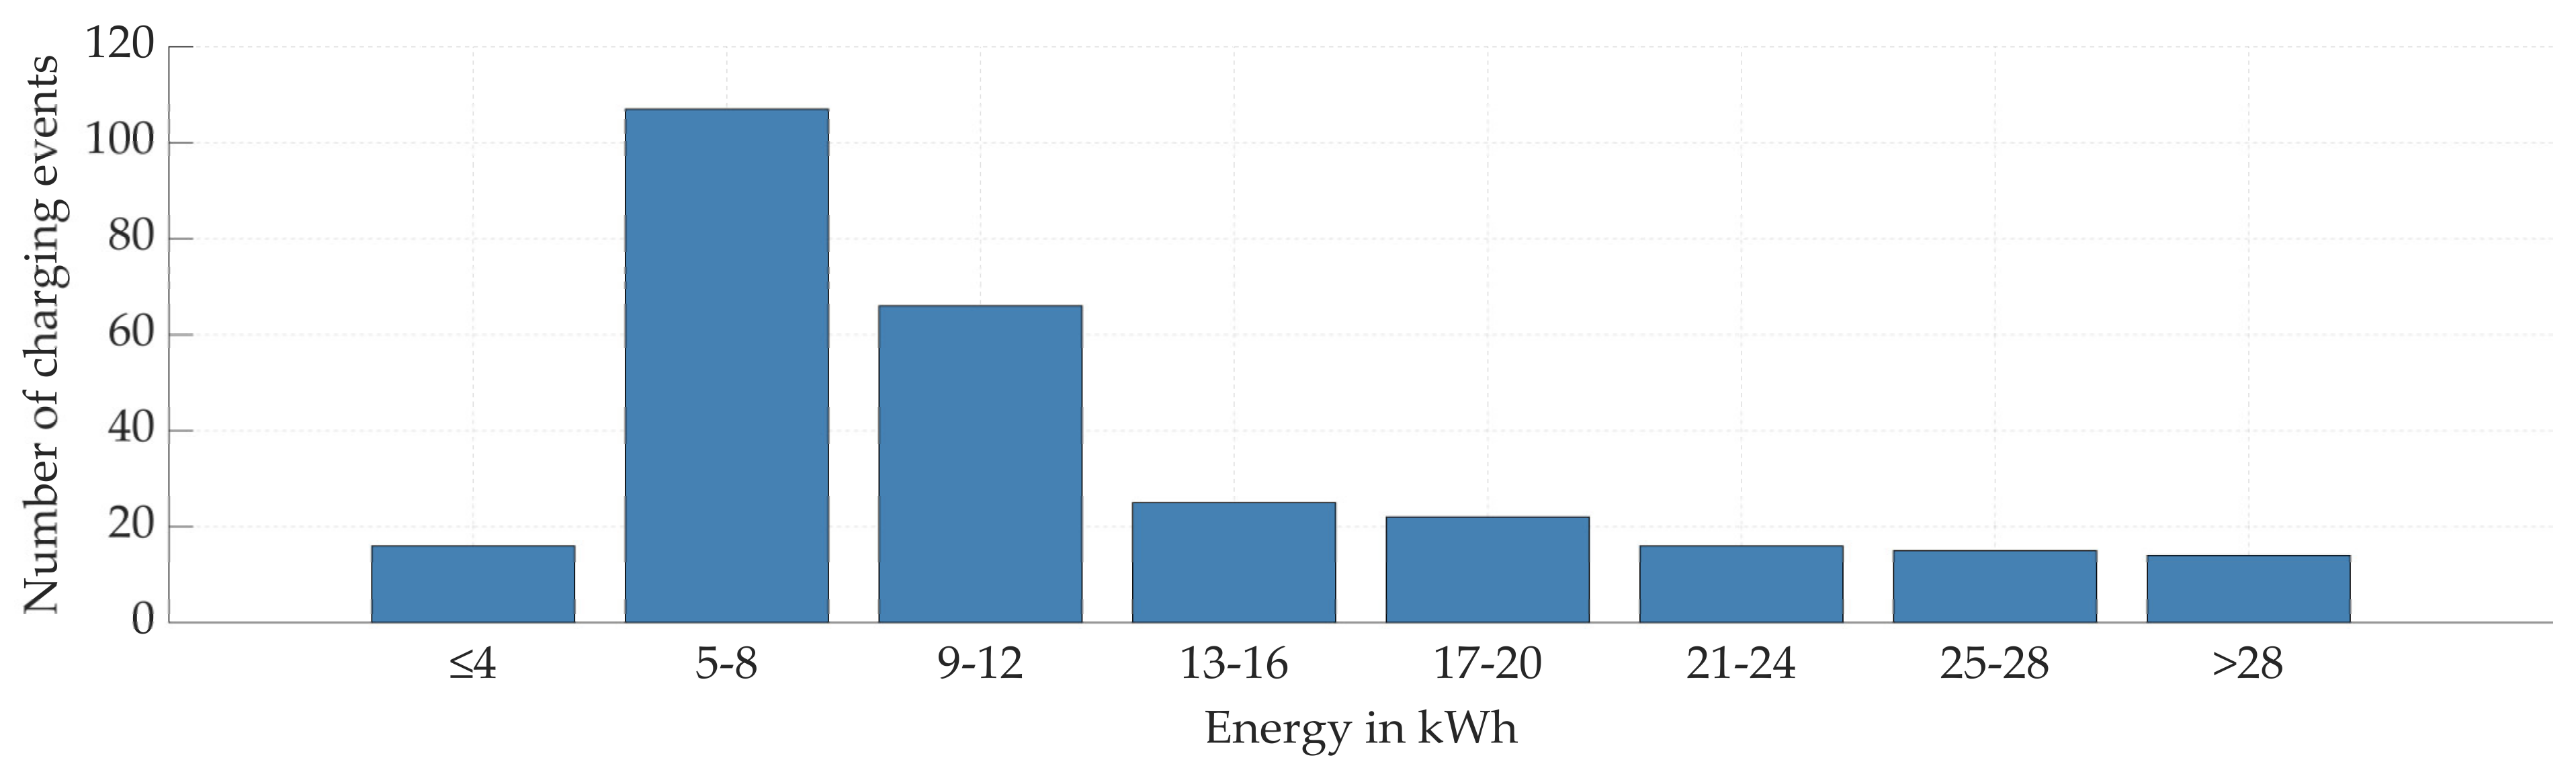
 Figure 1 and Figure 2. Figure 1 also forecasts the growth in the number of charging stations in 2021. Figure 2 represents the number of times the vehicle has been charged in the specified energy range in one year. The development of EVs will eventually require the power grid to be adapted to the needs of electromobility.
Based on the charts attached, vehicles were most often charged between 7:00 and 9:00 in the IFF Fraunhofer charging station, where the charging process took from one to three hours and allowed the battery to be charged with an energy value from 5 to 12 kWh. In the case of the analysis of the optimal distribution of vehicle charging stations, proper interpretation of behavioral patterns is required which contribute significantly to the correct determination of their number, thus preventing oversizing and reducing infrastructure development costs. The EVs, together with their power electronics and batteries, should be capable of converting energy, including extracting it from or transferring it back to the grid. They are increasingly not treated as electricity consumers but prosumer solutions. Therefore, their connection to the grid is standardized according to technical connection rules for low voltage (VDE-AR-N 410) [62], which define the rules of cooperation between the vehicle and the grid, while maintaining the relevant parameters and utility profiles of the electric grid. In theory, because of this and the relatively high power and performance values of the systems, it is possible to provide classic system services, such as frequency maintenance (active power) and local voltage stabilization (reactive power), but it is also possible to use their potential for future system services: load management, phase balancing, energy quality improvement, or under exceptional circumstances, short circuit power supply. A detailed description is presented in Table 2.
It should be noted that, regardless of the infrastructure and operation mode, the analysis and development of the model must be examined separately and in detail, as different factors can play a decisive role in this area. Some models that consider future network services may not be able to predict certain technical and regulatory aspects that could change in the future. In addition, particular attention should be paid not only to further trends and forecasts concerning the technical and economic development of systems and components but also to user requirements and behavior, as this is a costly technology that will continue to be subject to a medium- to rather long-term return on investment today. Some assumptions can be made, such as equipment costs may decrease with technology development, while approval/planning and installation costs will remain roughly the same. Other parameters and criteria are relevant for the development of a business model, for example, for suppliers or operators of charging infrastructure, such as the number of charging stations in the city districts, periods of use, charging services or electricity purchase costs. These, in turn, are currently still difficult to predict.
Finally, in the future, electric vehicles will be a crucial element in the power distribution. Their evolution, and in particular the development of electrochemical storage technologies, will increase battery capacity and battery lifetime, which will make it possible, in the long term, to use them for grid services (Table 2). At the moment, this is difficult to achieve due to insufficiently developed communication and data transfer technology between system operators and charging stations, but it continues to be vigorously developed.

3. Modeling EVs–Consumption and Driving Profiles

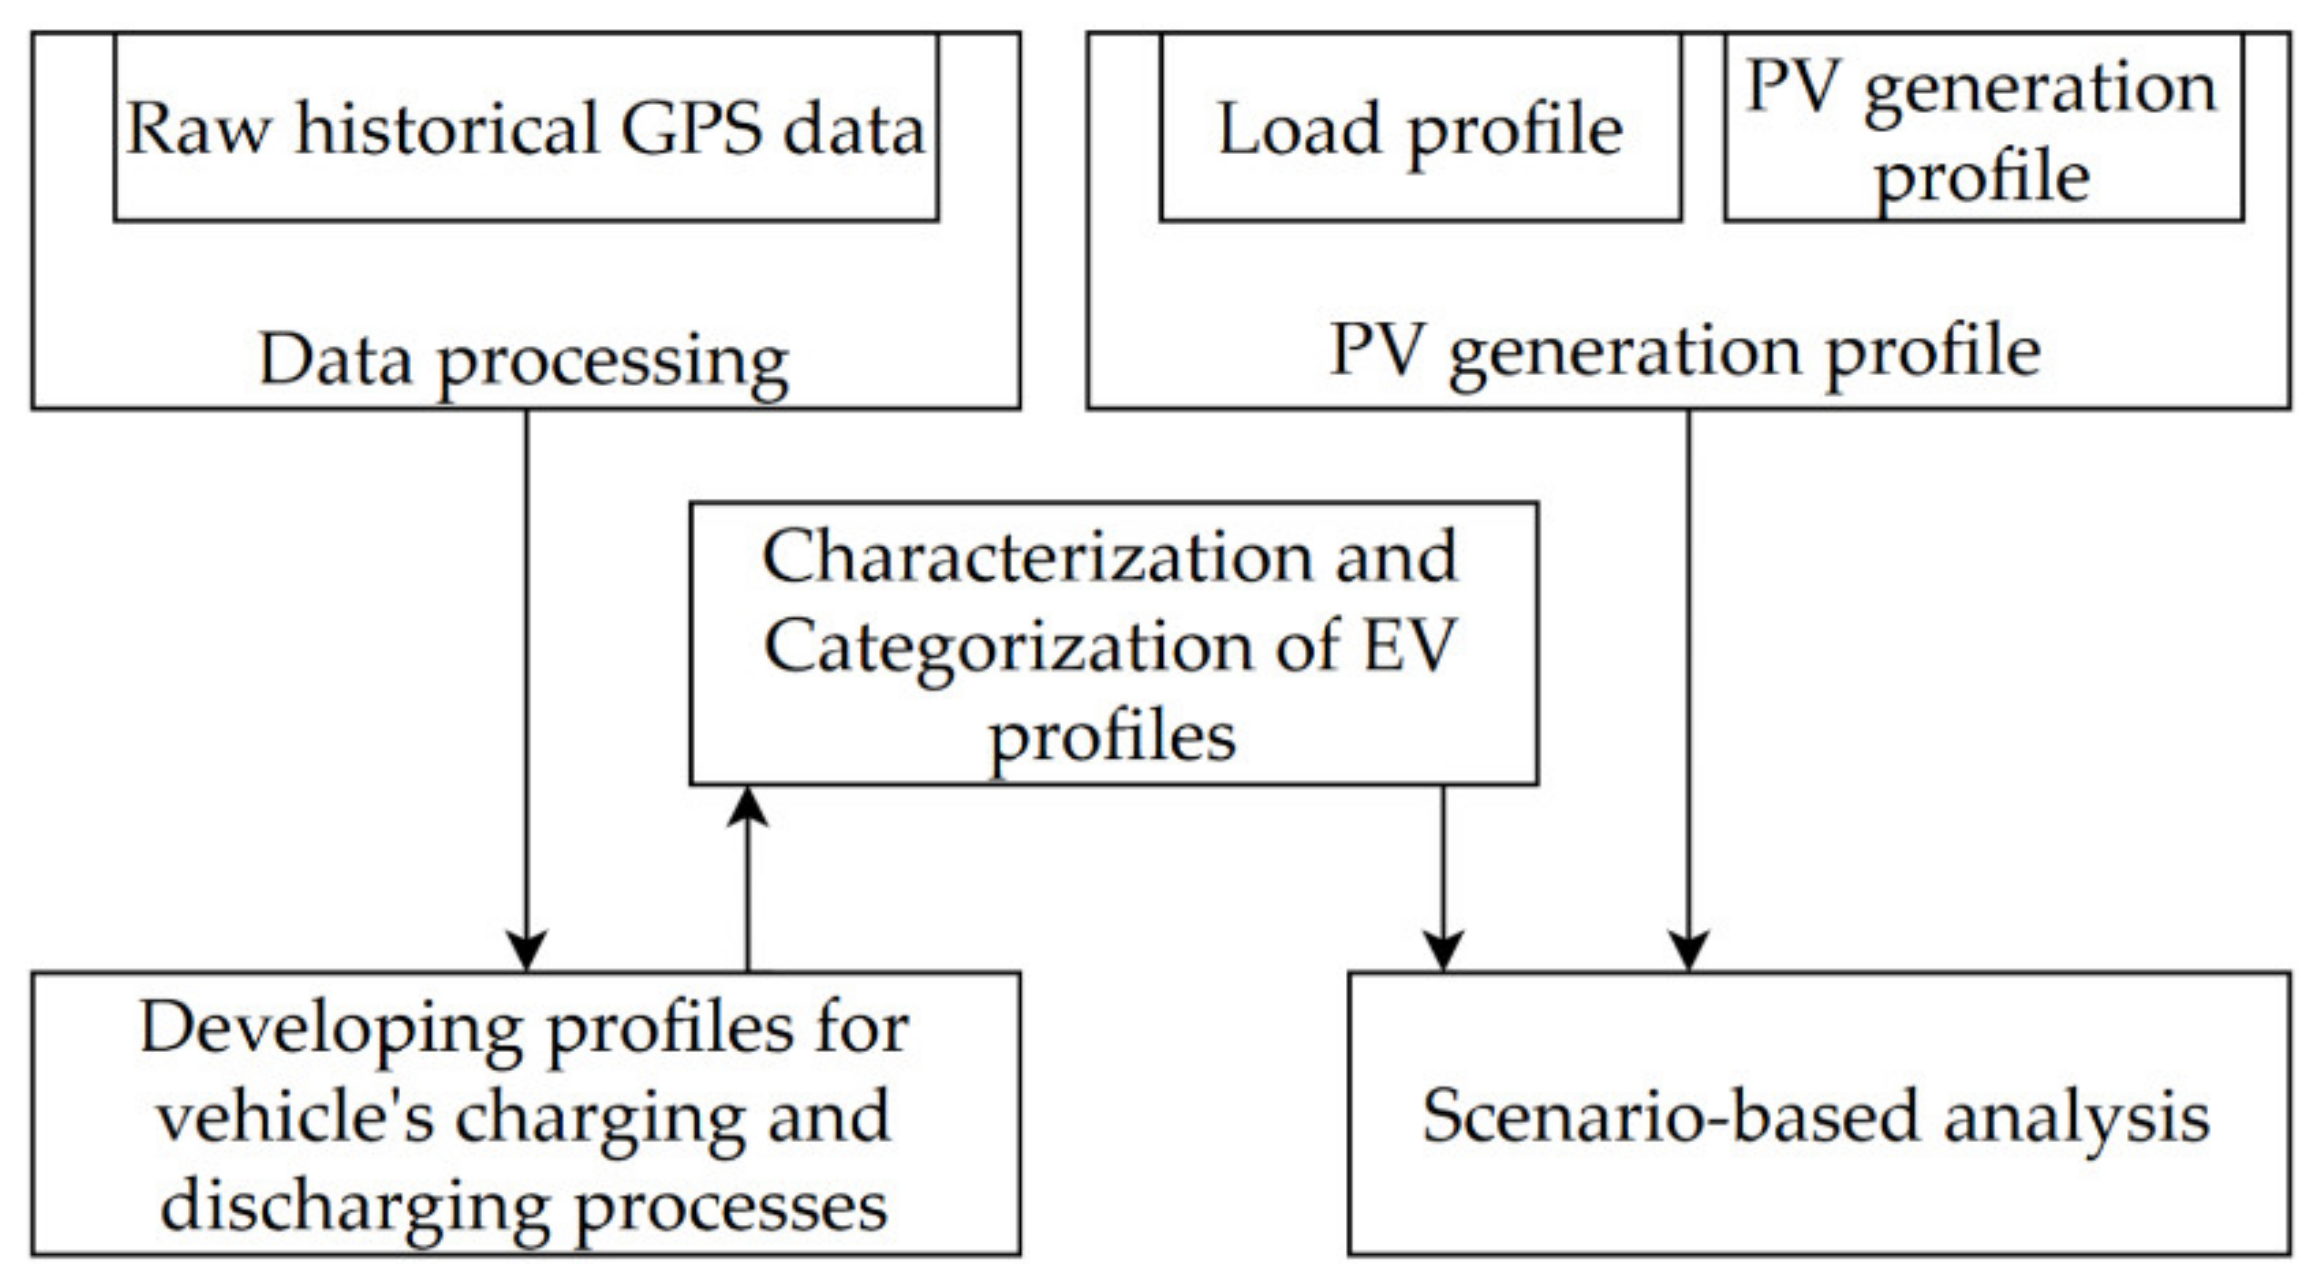
The analyses were carried out using the Matlab R2020a software environment and based on measurement data consisting of n = 604,800 points, which include weekly profiles of the fleet of diesel vehicles specializing in the provision of transport services. The GPS data used from “DAKO-Key” recorders placed in 60 light commercial vehicles (LCV) monitored the route traveled during the day and logging the selected parameters at a 1 min. frequency. The GPS recorders enabled 60 cars to be identified within one week in the process of delivering products in Halle/Saale in the southern part of the region of Saxony-Anhalt, Germany. They were used as input to simulate the use of EVs equipped with a battery pack in the scenarios under consideration. The calculations also used load measurements recorded by Janitza UMG 604-Pro and a power generation profile from the PV farm based on Siemens 7KM PAC4200 in September, 2018. A simplified model of the analysis is presented in Figure 3.
This modeling method made it possible to determine certain characteristics values characterizing each individual journey, which made it possible to determine the potential demand for electricity or the compartments in which the vehicles can be recharged to the required level. The following assumptions were made in the calculation case chosen and they are presented in Equation (1):
E ( i , j )     0 ,   for   Δ s   >   0 ,   Δ s = s ( i , j + 1 )   s ( i , j ) P CHAR ( i , j )   >   0 ,   Δ s = 0     T min   >   120   min     Bat ( i , j )   <   0   ( EV Lat ( i , j ) ,   EV Long ( i , j ) )     <   Depo Lat ,   Depo Long >  
where   Δ E ( i , j )   is the i-th EV’s energy consumption for j-th time stamp, Δ s is the difference in the distance traveled in consecutive time samples, P CHAR i , j is the value of the power that the i-th vehicle is charged for time j, T min , minimum parking time required, EV Lat i , j ,   EV Long i , j   are the geographical coordinates of the i-th vehicle in the j-th time sample, Depo Lat ,   Depo Long are the geographical coordinates of the company address, and Bat ( i , j )   is   the battery energy usage.
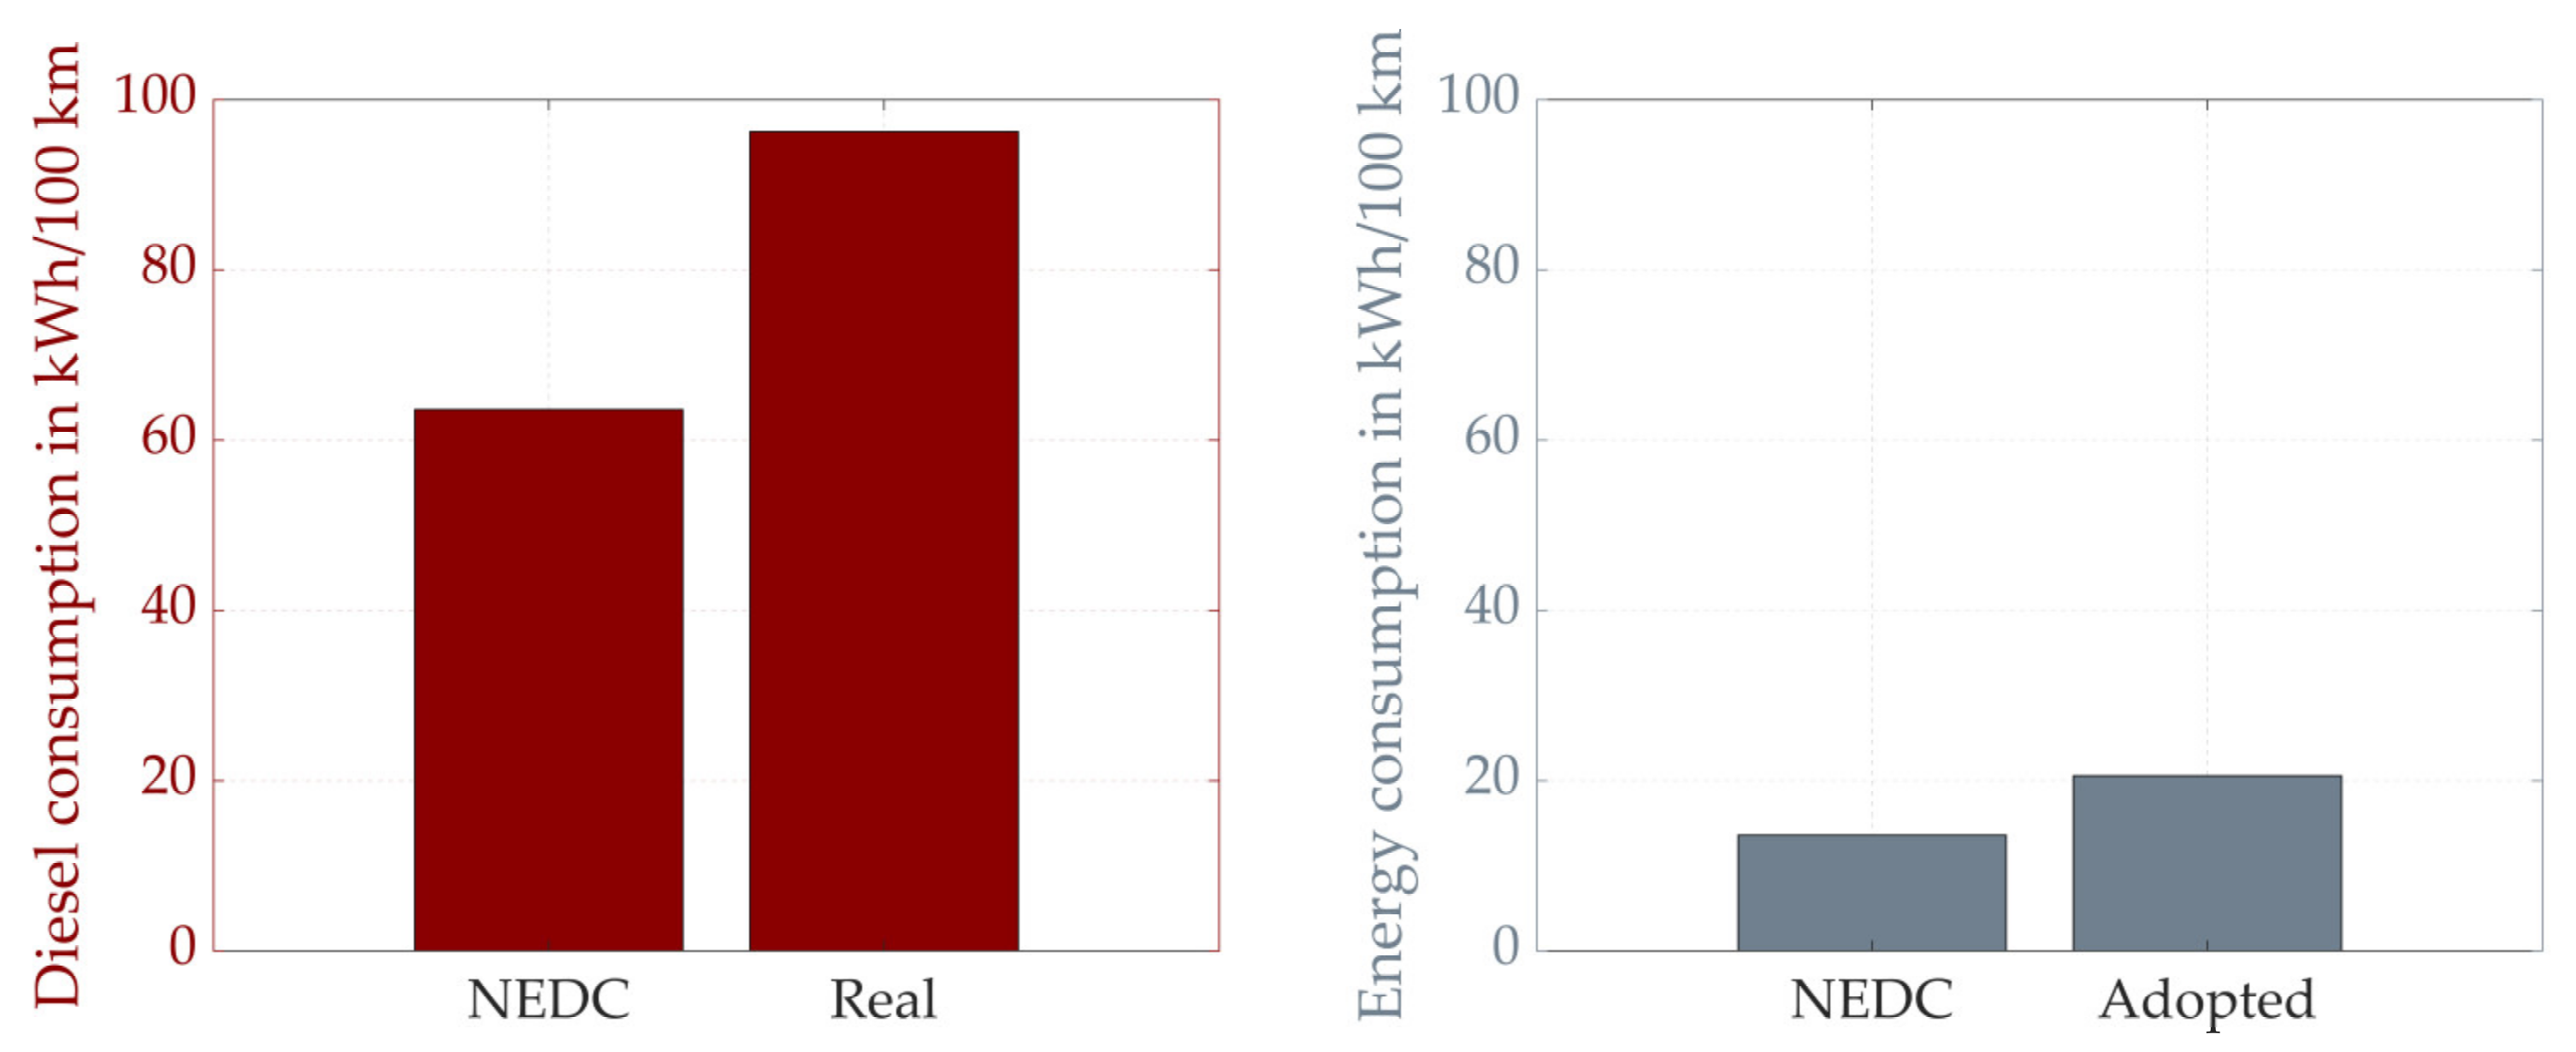
Furthermore, based on the driving profiles calculated and the time during which the vehicle remains in parking place, the electricity consumption profiles during driving and the charging profiles for which the corresponding values in kWh have been adopted. During the vehicle trips, it was not possible to measure the vehicle cargo, so these data were not used to determine the electric energy consumption. This value was determined on the basis of The New European Driving Cycle (NEDC) from which the manufacturer determined the energy consumption of the vehicle. The specific energy consumption for this study was calculated based on real fuel consumption from measurements compared with NEDC standard consumption (Figure 4). In this case, a 51.3% increase in consumption was measured in comparison with the manufacturer’s declaration. The scaling factor was defined, and a further electrical consumption specification was amplified accordingly. The simulation considers the energy consumption declared by the manufacturer of the Nissan e-NV200 [63], which is 136 Wh/km (NEDC), and for which the consumption value has been increased to 206 Wh/km by calculated the scaling factor.
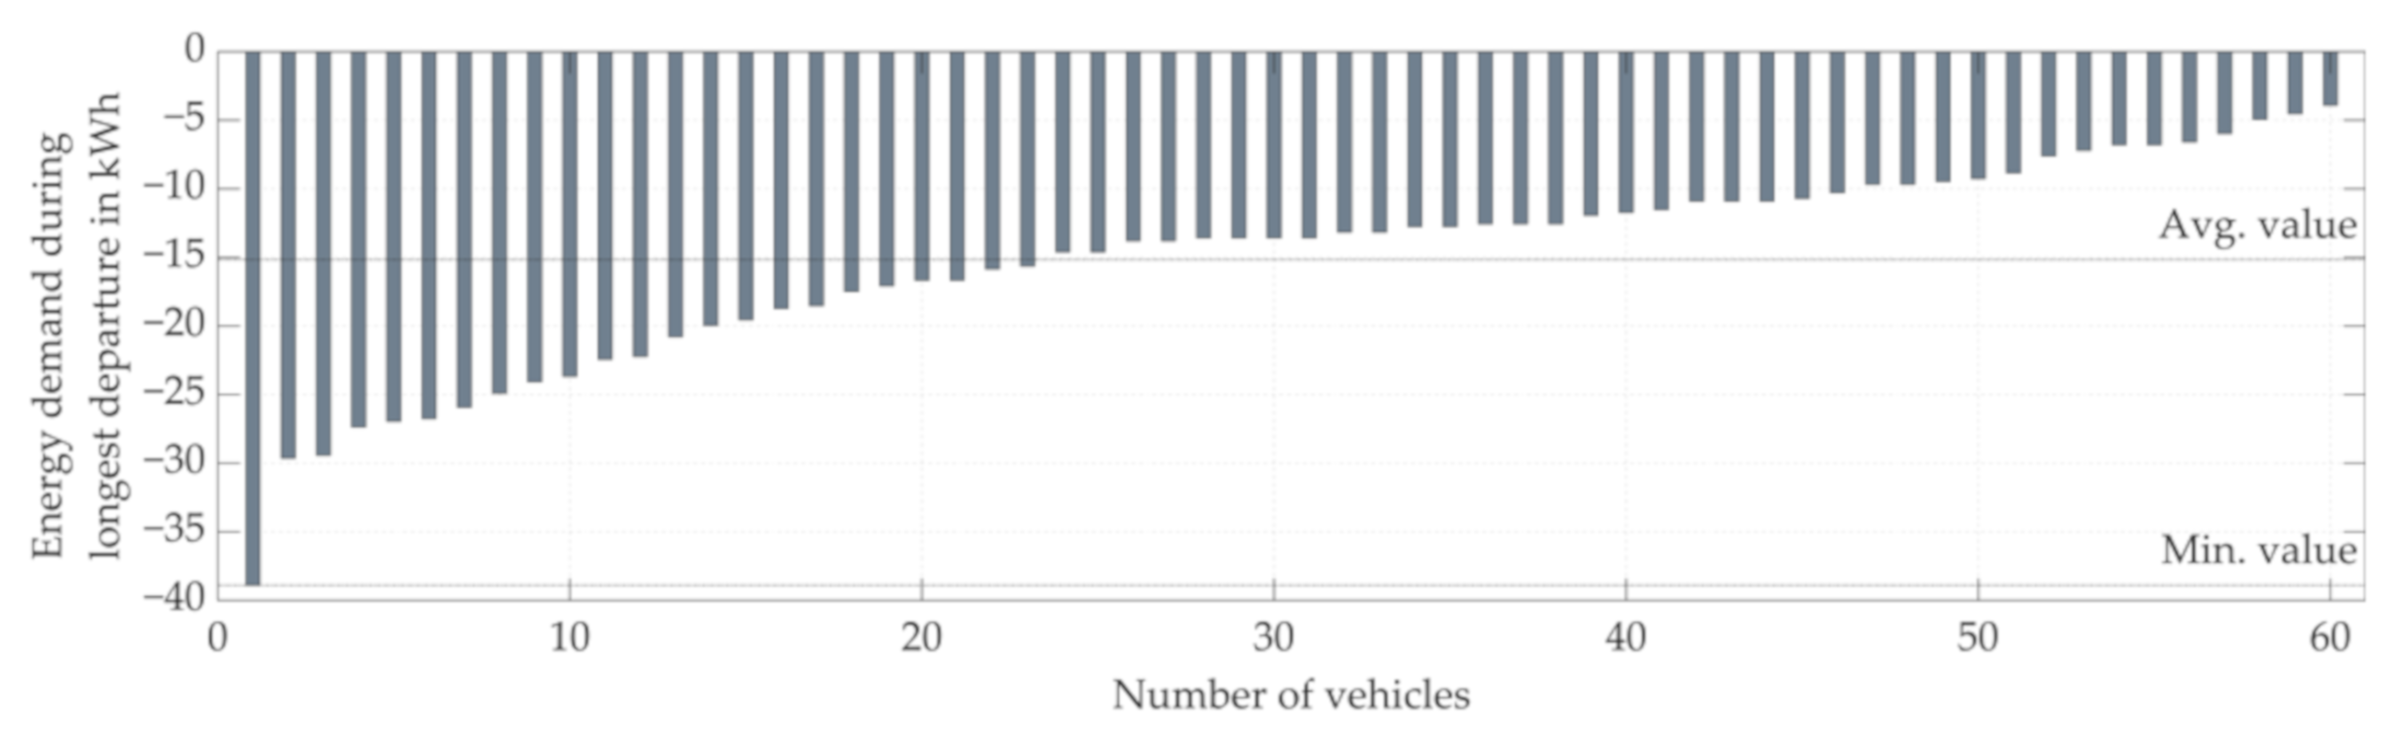
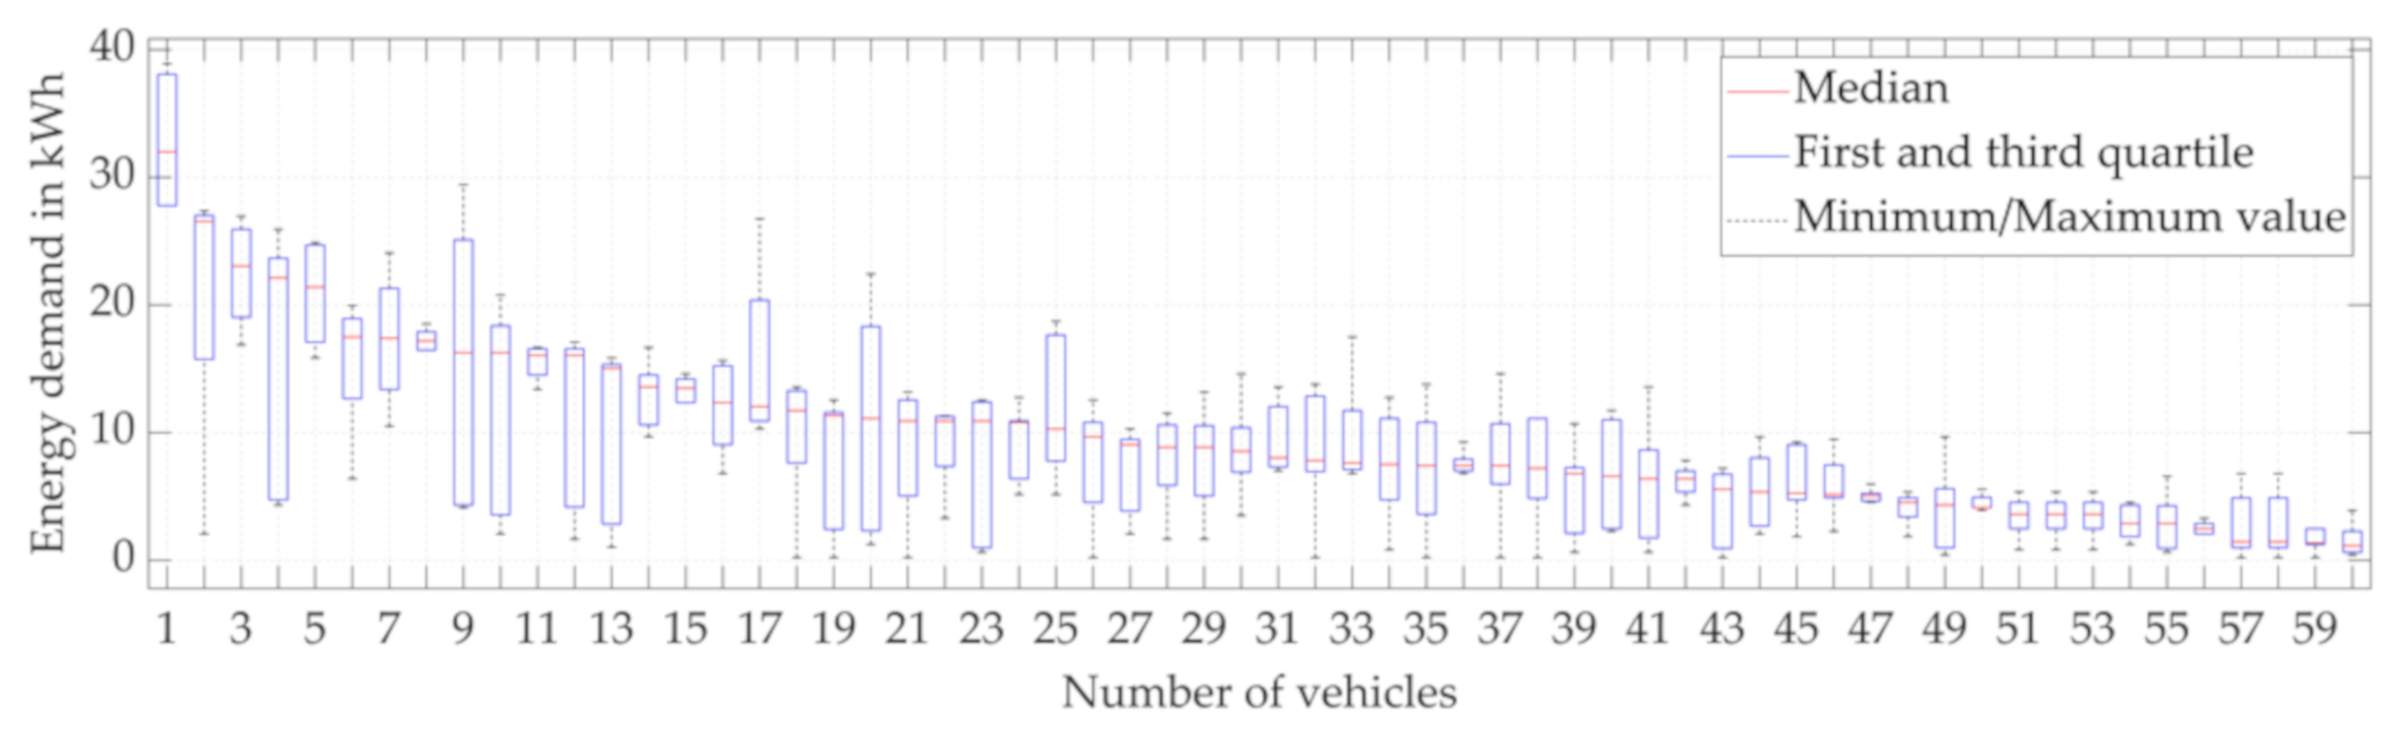
Furthermore, based on GPS data and the assumptions made, the daily energy consumption of the vehicle during the departure has been calculated according to Equation (2). Equation (3) shows the value of the charging power at the possible time intervals selected. Examples of the vehicle routes are presented by GPS data, and they are shown in Figure 5.
Bat ( i , j ) =   Bat ( i , j )   E ( i , j )   for   Δ s   >   0   Bat ( i , j )   for   Δ s = 0   Bat ( i , j ) + P ( i , j )   for   Δ s = 0     Bat ( i , j )   <   0 ,   j = 0     Bat ( i , j )   = 0
  P ( i , j ) = P ( i , j )     0 ,   when   Equation   ( 1 ) = true P ( i , j ) = 0 ,   when   Equation   ( 1 ) = false
where   P ( i , j )   is the change in charging power resulting from the duration of the charging process in the station.
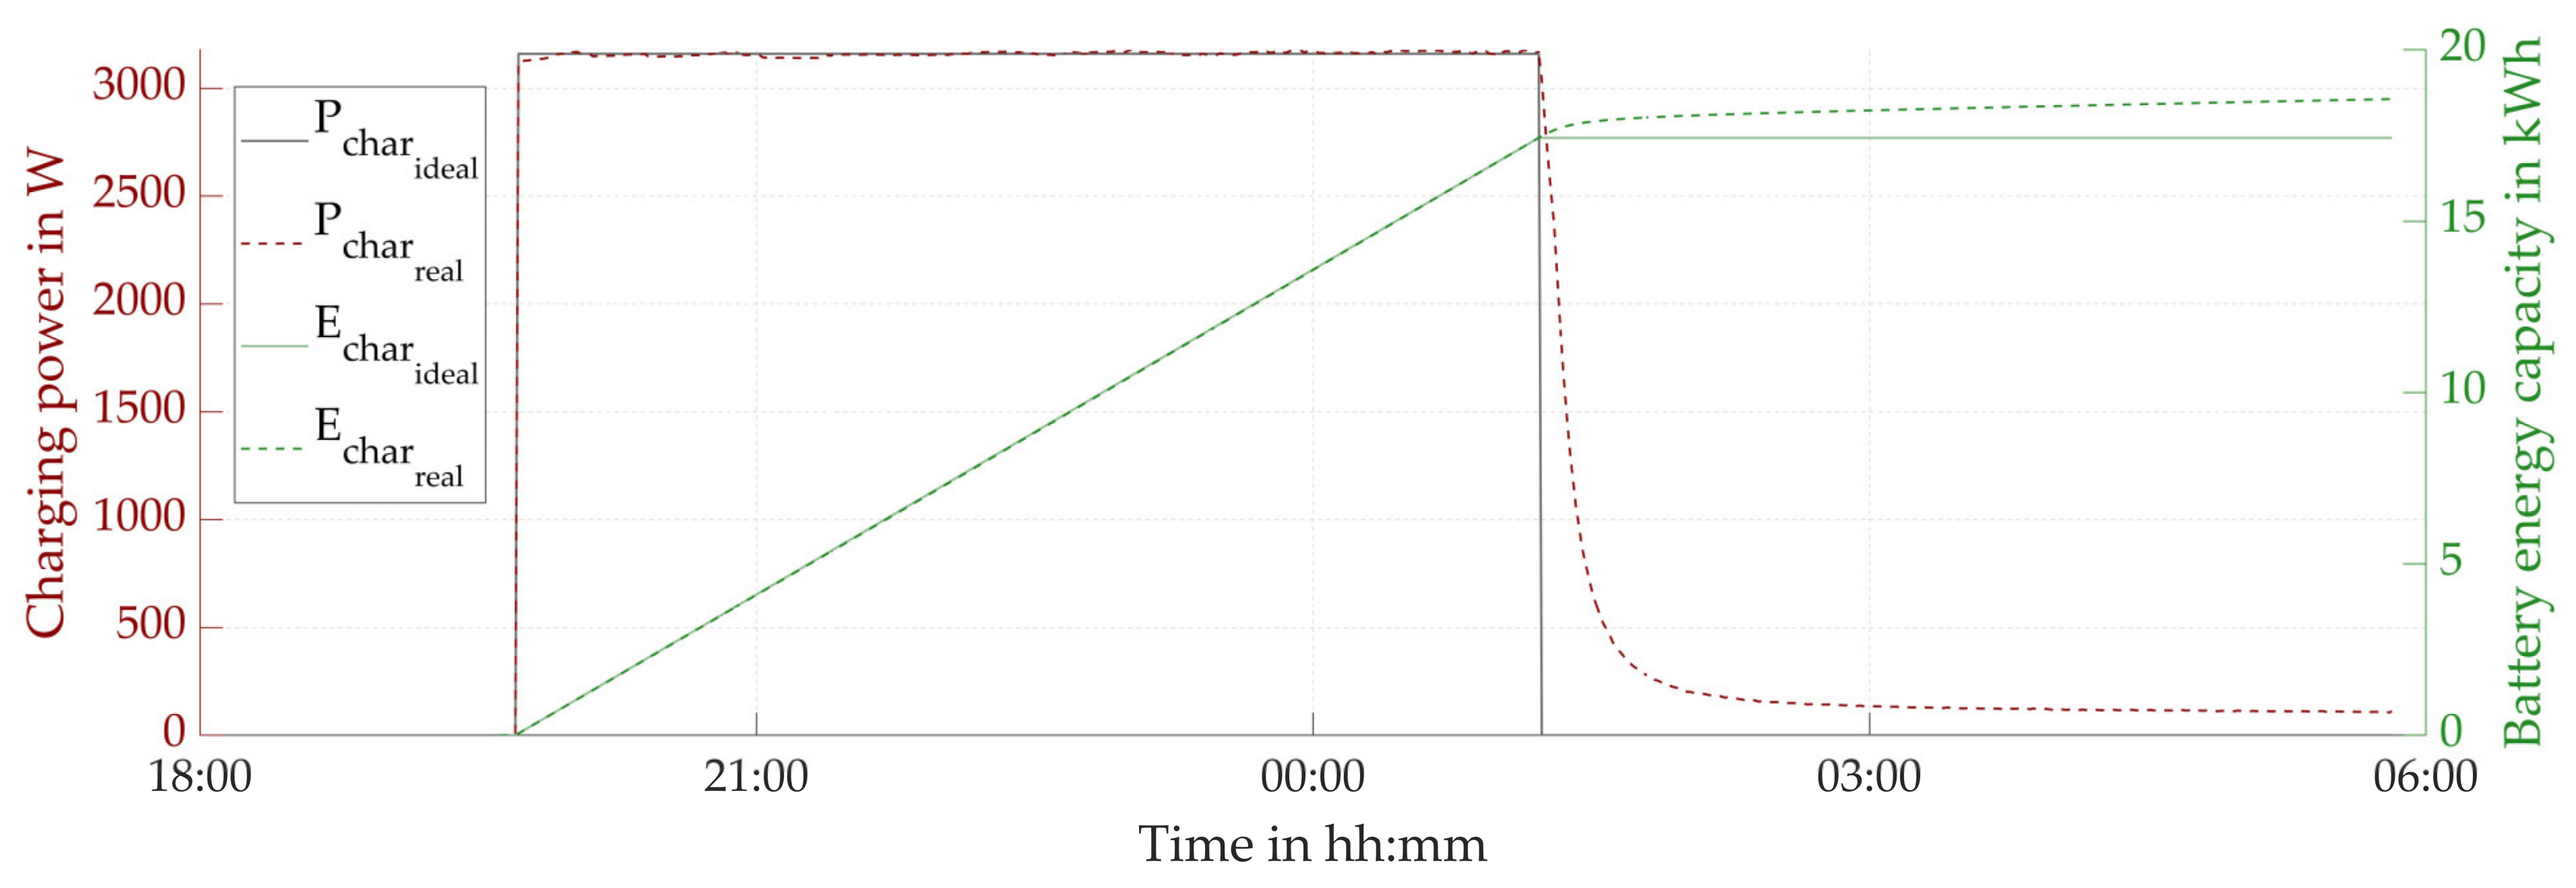
A simplified model was adopted for which the power value changes in steps to create charging profiles for EVs. The simplification adopted does not affect the simulation results obtained significantly, and the average relative error of the supplied energy E determined for the whole recorded charging process from Figure 6 does not exceed σE = 2.19%. Figure 6 was developed on the basis of the same measurements, which were also partly used to analyze harmonics during vehicle charging in article [64].
The simplification used in Figure 6 was implemented in a simulation for which the time intervals were determined in which the vehicle battery can be charged using the default 22 kW charger. The charging power is controlled depending on the algorithms applied, which are described in Section 5. 
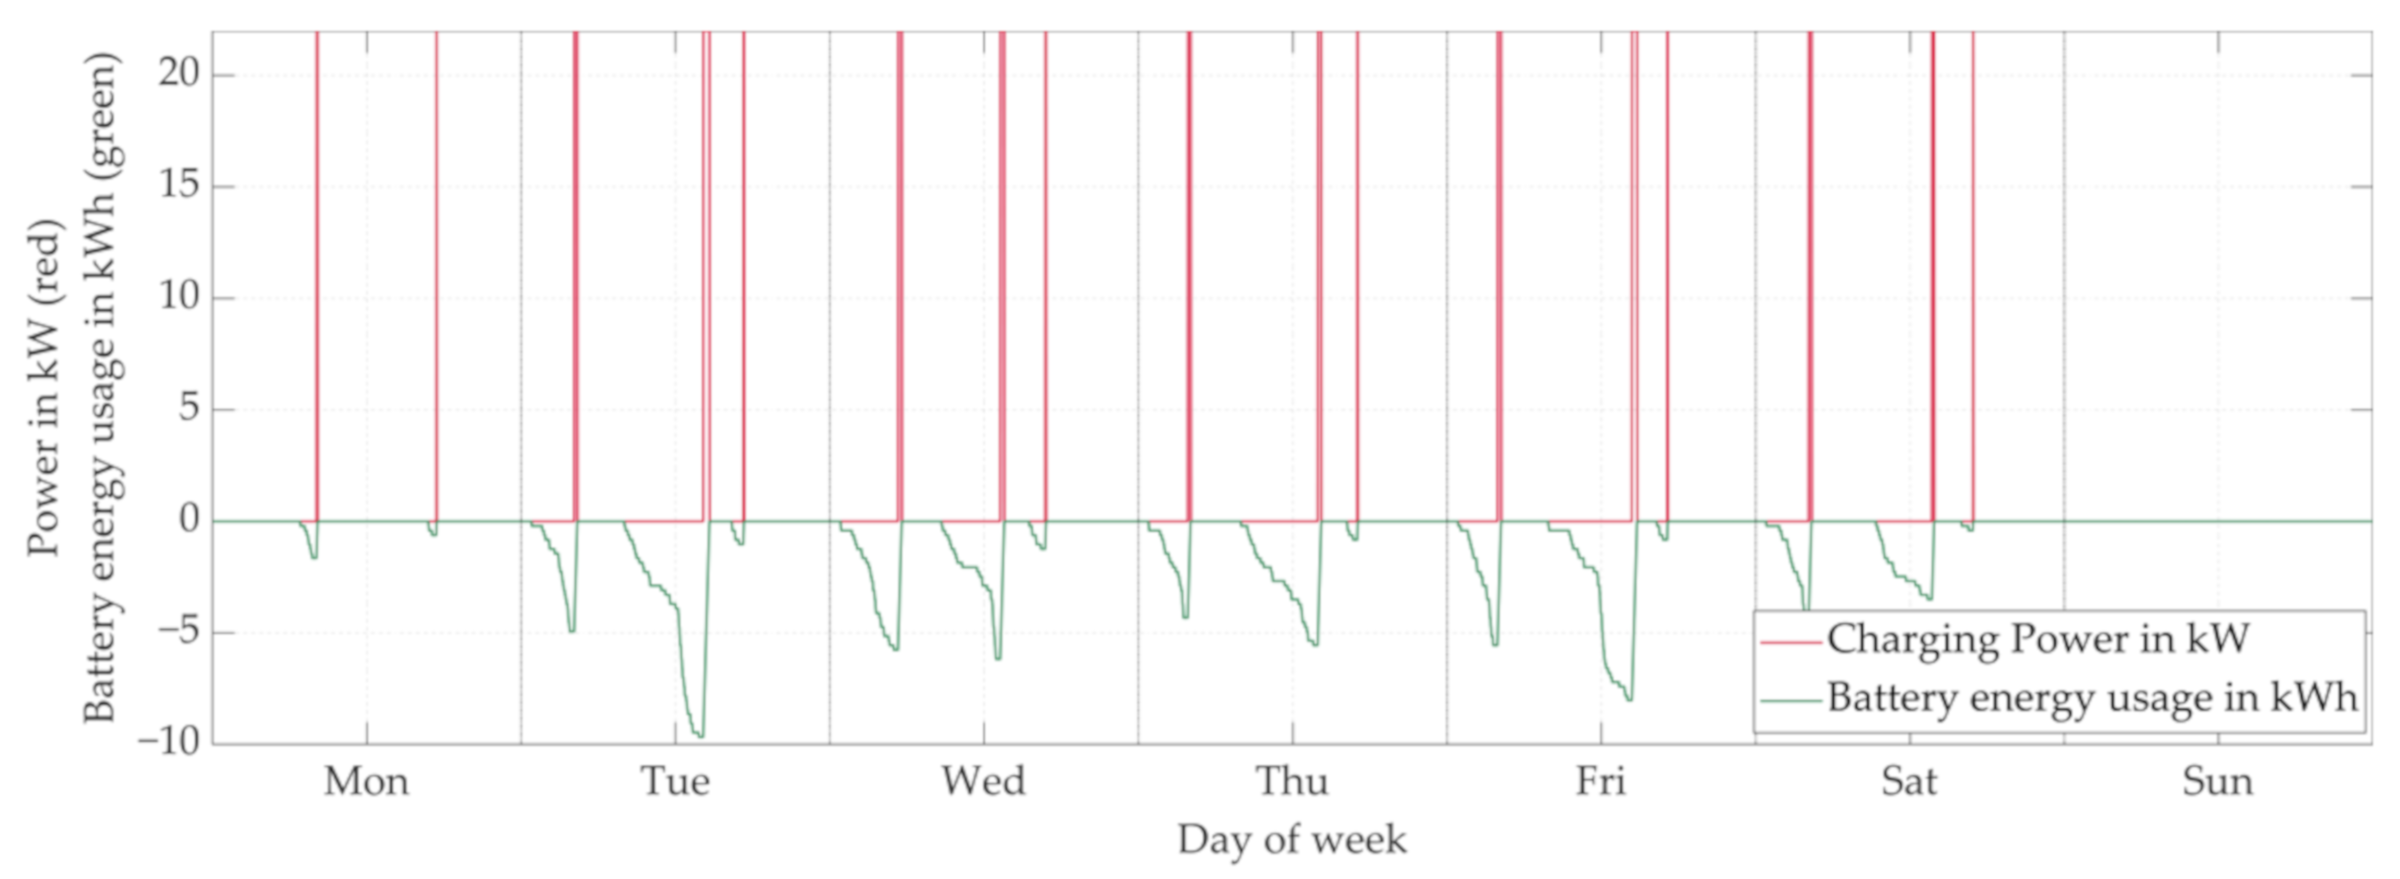
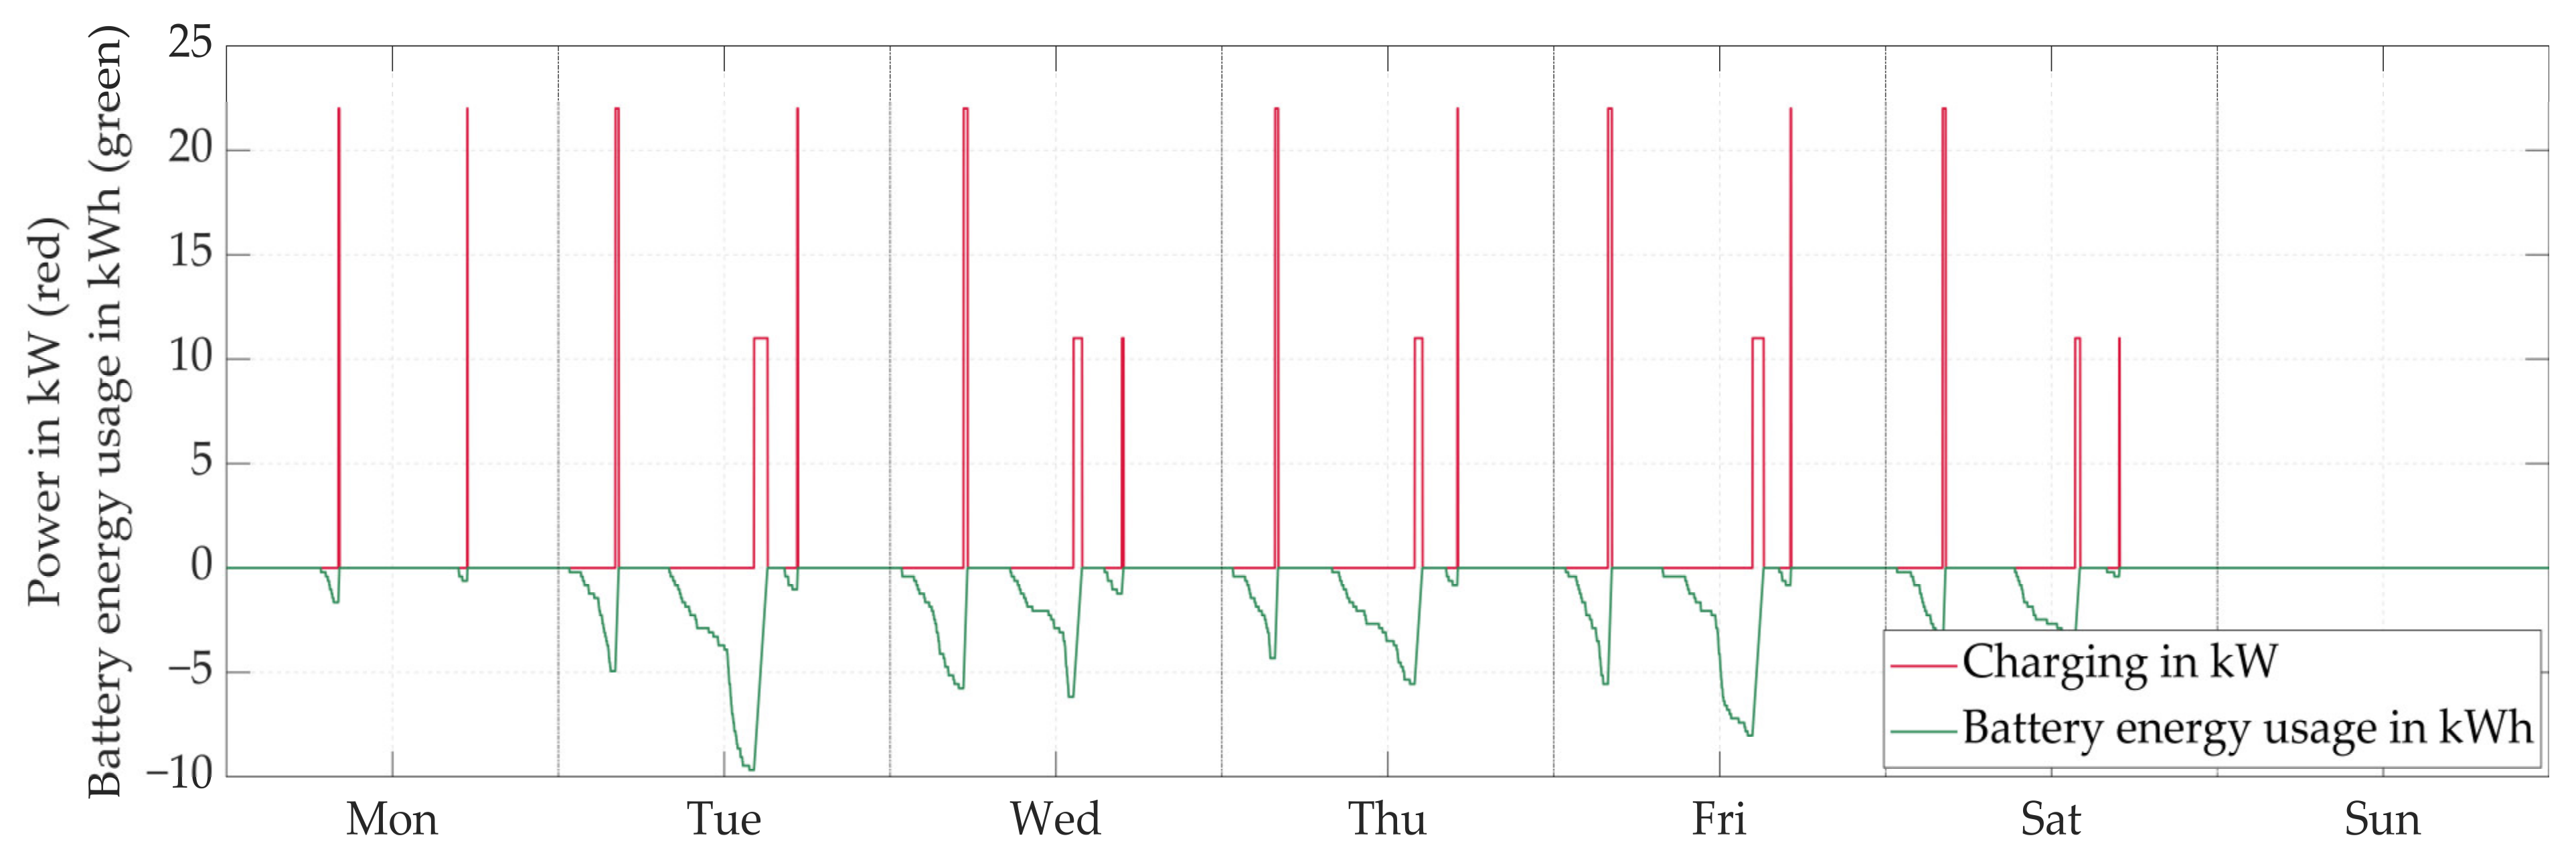
Figure 7 shows a selected one-week profile of one EV including the time windows available in which the vehicle has completed its trip and is recharged to the required value. Similar profiles were developed for the entire fleet analyzed.

4. Statistical Evaluation of the Tested Vehicle Fleet

As a result of the analyses, additional parameters describing the group of vehicles tested were determined. The corresponding Figure 8a determine the entire distance traveled by each vehicle during the one week considered. Based on the input data, histograms were also created representing the distance most frequently driven by the selected fleet for the entire week (Figure 8b) and during single trips (Figure 8c). The distance most frequently traveled by vehicles during the whole week was between 300 and 350 km but, due to the nature of their use, single trips did not exceed 100 km and usually ranged between 0 and 10 km (Figure 8c).
Additionally, based on the values of electricity consumption assumed and trips made during the day, the minimum battery capacity were determined. The statistics shown in Figure 9 allow to determine the type of vehicle fleet analyzed to be determined in terms of the battery capacity required, i.e., the type of vehicles used (light or heavy vehicle). The figure shows that the maximum battery capacity required does not exceed 20 kWh for 50% of the vehicles analyzed. Moreover, the capacity level required for 60 vehicles was below 40 kWh, which increasingly often corresponds to the lower limit of the capacity of EVs manufactured today [65].
Furthermore, the vehicle’s parking time was determined based on the data available and the time of vehicle’s utilization. The results obtained according to Equation (4) are shown in Figure 10 as a percentage share for the whole day.
  T = k = 1 7 T PAUSE ( i , j )   for   P CHAR i , j     0   k     { 1 , 2 , ,   7 }
where T is a matrix representing the duration time of driving and not driving by car during the week represented, T PAUSE ( i , j ) is a variable which represent pause duration for every vehicle, and k is the total number of days.
The energy demand for each vehicle is also shown in Figure 11. In this case, the minimum and maximum energy demand can be observed in Figure 11, which were determined based on individual trips for each vehicle separately. The ranges in which electric vehicles were most frequently used were also identified. The average value for the minimum required capacity, calculated based on all the objects tested, was 2.96 kWh. Similarly, the average value for the maximum values was 15.17 kWh. The average median value of all vehicles was 9.86 kWh.

5. Case Study: Impact of the Electrification of an Enterprise’s Fleet

In order to carry out the relevant simulations, The Matlab R2020a software was used in the calculations, in which all the profiles were created and all the simulations implemented and results obtained.
The daily variations of the load and the demand for power and energy in the time interval considered were taken into account during the evaluation of the use of EVs in the operation of the company. Metering data was used in the simulation for an intermediate enterprise for which the average demand per week is shown in Figure 12. The maximum instantaneous power demand of the company is 100 kW. When controlling the additional load resulting from the charging of EVs, the energy generation from the photovoltaic farm, whose maximum instantaneous power was 140 kW and produced ca. 5.31 MWh, was considered. The waveform of energy production is shown in Figure 12. Three scenarios/cases were created for the assumed load and PV generation in which the additional load is shaped and balanced.
Based on the developed driving profiles, for each vehicle, a comparison was made between the purchase cost of the electricity per week for an electric vehicle, and the corresponding purchase cost of the diesel for a combustion vehicle. For the fleet analyzed, the cost of diesel is approximately 2.8 times more than electricity. The total purchase cost of diesel for the fleet is 2381.72 Euros per week while for the electric vehicle fleet the cost is 861.40 Euros per week. The unit prices of fuels were adopted on the basis of statistical data according to [66,67]. The results are shown in Figure 13.

5.1. Control Algorithm—No Regulation

The group of EVs supplied from the power grid has an impact on the increase in the demand for electricity. A load profile was adopted for the model, for which the impact of connecting additional energy loads was examined. The demand profile adopted represents real-world data registered for a company. Equations (5) and (6) were used to determine the values. The algorithm used is shown in Figure 14. Graphical representation of the results obtained has been presented in Figure 15.
Δ P i = P LOAD ( i ) + P CHAR   ( i ) ,
E EV i , j = 0 T P CHAR ( i , j ) dt ,
where   P LOAD ( i ) is the power demand of the load analyzed, E EV i , j   is the energy demand of the EVs under consideration, and T is the time period for which the measurement was taken.
In this case, a significant increase in the power demand can be observed in a given week in which EVs were connected to the grid. This increase was, in some cases, even double the maximum peak demand. The charging of EVs was also dynamic; thus, there were very high instantaneous power spikes on the grid. The energy consumption of the company and the charging process is shown in Table 3.

5.2. Control Algorithm–PV Support

In the next model, an additional energy source was used to cover the local energy demand of the vehicle fleet. The power distribution was performed according to the algorithm in Figure 16. Equation (5) was modified with an additional PPV resulting from the generation of energy from the PV modules. The change is presented in Equation (7). The amount of energy was calculated according to the Equation (6).
Δ P i = P LOAD ( i ) + P CHAR   ( i ) -   P PV ( i )
where   P PV ( i ) is matrix representing the energy yield of photovoltaic panels.
It is possible to shape the demand curve for the model adopted using an additional system in the case of PV panels. The energy generated was calculated based on real measurements recorded for a selected week in September and scaled for a 150 kW system. The vehicles were charged with a constant power at the set value of 22 kW. According to Figure 16, the energy generated by PV panels was used for the charging process. Such cooperation between PV and EVs made it possible to partially cover the P demand. Graphical representation of the results obtained has been presented in Figure 17.
The total energy balance for the developed system can be determined considering the vehicles’ charging time windows, their simultaneous number connected to the grid, and the current power generation from PV. Comparing the results with the previous control system, the new configuration shows that the demand by vehicles has been reduced by ca. 50% for the time window considered. The demand curve was, thus, smoothed out at the peaks. The results for the algorithm applied are shown in Table 4.

5.3. Control Algorithm—PV and Time Window

Both the energy production from the renewable source and the time for which the highest instantaneous load P occurs in the grid were considered for scenario III. As a result of the algorithm, new charging profiles for the vehicle fleet were created, shown in Figure 18. In the algorithm adopted, the vehicles are charged from 10:00 to 17:00 with a power of 0.5 PCHAR, respectively, shown in Figure 19. Based on the simulations performed, the new load and generation profiles are shown in Figure 20.
The charging power for the particular case under consideration was limited from 10:00 to 17:00 in order to reduce the electricity demand during this time. The restriction involved reducing the maximum available charging station power from 22 to 11 kW for the fleet selected.
It can be seen in Figure 20 that the control system applied reduced the oscillations in the case of PV power generation, which has a beneficial effect on the performance characteristics. The values calculated are shown in Table 5.
Comparing the results of energy consumption and production obtained with the previous control model, it can be seen that there was a slight increase in the energy required for vehicle charging as a result of the algorithm used. This energy was distributed and purchased from the power grid. This is the result of a longer charging time due to the time constraint. The value of generation for the period assumed is the highest and there is the greatest probability of using this energy to charge EVs. Therefore, the vehicles must be recharged at times when the PV generation was not available or insufficient to cover the demand of the vehicles. As the PV energy could not be fully utilized between 10:00 and 17:00, PV power generation also increased.

6. Results and Discussion

This article presented a comparative analysis of simulations related to the intensive use of an EV fleet in an enterprise providing logistic services, where vehicles drive on similar and known routes. In order to conduct the analysis, measured data from three different sites were used: A company with a maximum demand of P = 100 kW per week, a PV farm whose power was scaled up to a maximum value of P = 150 kW, and GPS data of a fleet of vehicles equipped with traditional ICE and used commercially to provide transport services. The statistical analysis of the input data allowed the determination of the energy demand of the enterprise, the generation from the PV farm, and the utilization characteristics of the EVs.
Assumptions were made regarding the data obtained, for example, the increase in electricity demand by an EV used theoretically analogous to the difference resulting from the theoretical fuel combustion value declared by the manufacturer and the value measured and obtained from measurement data. Three scenarios were assumed in which vehicles will be used and charged at charging stations in different conditions by checking the changes in the load curve during the day for a given company.
Vehicle charging for model I is not subject to any regulation and represents an additional load on the grid, thus increasing the average energy demand of the company. The impact of the RES source for model II has been considered and the potential of the EVs to cover the increased demand has been determined. Based on the simulation, the time windows in which the vehicles were charged and the corresponding power generated by the PV farm, demand for which could be covered by the local RES source could be determined. The simulation in model III was extended with an additional constraint that limited the charging power by half in order to reduce the demand during the peak-load period on the grid. A comparison of the results is shown in Table 6.
Due to the dynamic variation of power values in the system, it is advantageous to use an additional electric energy storage facility, which would effectively eliminate the undesirable oscillations. In addition to the traditional storage in the form of chemical, electrochemical and mechanical magazines, which can be used in this analysis, EVs which are not currently providing services (or are out of service due to a fault which does not affect the electrical part in any way) can provide it.

7. Conclusions

The work has focused on determining whether EVs can replace legacy technologies and provides a background for developing more complex analyses, including optimizing the vehicle charging process, the number of charging stations, maximizing profits and minimizing losses, optimizing consumption and local generation, and providing system services in terms of “grid services”. The work presents the behavior and characteristic of the electric vehicles operation basing on the measurement data of real systems (PV and load). Large companies and enterprises should take into account the changes during the selection of the new fleet of vehicles and they should prepare for these changes by analyzing the data of the current fleet:
  • While ICE vehicles only serve transport purposes, EVs together with renewable sources and energy storage can effectively replace them and create sustainable solutions. This reduces the carbon footprint and is in line with the European Union’s regulations;
  • Electric vehicles will drastically change companies’ electricity demand profiles, increase load shifting dynamics;
  • Electric vehicles using energy from RES, reduce the power load in the grid;
  • Renewable energy sources can be an additional source of income from the sale of surplus energy and allow to reduce the total energy consumption of the enterprise;
  • These studies provide the background for modernizing old installations, equipping them with modern metering systems and planning energy consumption. Companies can determine the theoretical increase in demand on the basis of metering data carried out;
  • Pressure from the European Union suggests that more companies than ever before will be faced with a similar problem in their organization.
The model has some limitations that will be considered in future work. There is no information on the cargo carried by the vehicles, which strongly influences the value of energy consumption. The applied metering system allowed the measurements to be sampled and recorded with a frequency of 1 min. Measurements were taken for 1 year for load changes, 1 year for PV generation, and only 1 week for vehicles. Therefore, it is necessary to average the results for longer periods of time. Consequently, the article focused more on the environmental and technical aspects. Utilizing the current technology, the ecological aspect should be analyzed considering the support mechanisms for RES available, which will be taken into account in further work.

Author Contributions

Conceptualization, C.W. and R.P.; methodology, P.K.; software, R.P.; validation, C.W., S.B., and L.K.; formal analysis, R.P.; investigation, C.W.; resources, P.L.; data curation, R.P and C.W.; writing, R.P and D.B. All authors have read and agreed to the published version of the manuscript.

Funding

This paper is a result of the project KielFlex (01MZ18002B) funded by Federal Ministry for Economic Affairs and Energy according to a decision of the German Federal Parliament.

Data Availability Statement

Data available on request due to restrictions eg privacy or ethical, industrial conflicts.

Conflicts of Interest

The authors declare no conflict of interest.

Abbreviations

Bat ( i , j ) instantaneous value of the battery energy usage
Depo Lat parking area geographical coordinate-latitude
Depo Long parking area geographical coordinate-longitude
EV Lat i , j the geographical coordinate, latitude of the i-th vehicle in the j-th time sample
EV Long i , j the geographical coordinate, longitude of the i-th vehicle in the j-th time sample
E EV i , j the energy demand of the EVs
Δ E ( i , j ) the i-th EV’s energy consumption for j-th time stamp
σEaverage relative error of the supplied energy
Δ s the difference in the distance traveled in consecutive time samples
Δ P i a matrix containing total change in power in system
P ( i , j ) charging power value
P CHAR i a matrix containing the charging power value changes
P CHAR i , j the value of the power that the i-th vehicle is charged for time j
  P LOAD ( i ) the power demand of the load
  P PV ( i ) matrix representing the energy yield of photovoltaic panels
T a matrix representing the duration time of driving and not driving by car during the week
T min minimum parking time required
T PAUSE ( i ) a vector containing pause duration for every vehicle
NEDCThe New European Driving Cycle

References

  1. Remon, D.; Cantarellas, A.M.; Mauricio, J.M.; Rodriguez, P. Power system stability analysis under increasing penetration of photovoltaic power plants with synchronous power controllers. IET Renew. Power Gener. 2017, 11, 733–741. [Google Scholar] [CrossRef] [Green Version]
  2. Flynn, D.; Rather, Z.; Ardal, A.; D’Arco, S.; Hansen, A.D.; Cutululis, N.A.; Sorensen, P.; Estanquiero, A.; Gómez, E.; Menemenlis, N.; et al. Technical impacts of high penetration levels of wind power on power system stability. Wiley Interdiscip. Rev. Energy Environ. 2017, 6, 216. [Google Scholar] [CrossRef] [Green Version]
  3. Wenge, C.; Pelzer, A.; Naumann, A.; Komarnicki, P.; Rabe, S.; Richter, M. Wide area synchronized HVDC measurement using IEC 61850 communication. In Proceedings of the 2014 IEEE PES General Meeting | Conference & Exposition, National Harbor, MD, USA, 27–31 July 2014; pp. 1–5. [Google Scholar]
  4. Statista. Electromobility in Germany. Available online: https://www.statista.com/study/82582/electromobility-in-germany/ (accessed on 26 July 2021).
  5. Komarnicki, P.; Haubrock, J.; Styczynski, Z.A. Elektromobilität Und Sektorenkopplung; Springer: Berlin/Heidelberg, Germany, 2018; ISBN 978-3-662-56248-2. [Google Scholar]
  6. Pistoia, G. Electric and Hybrid Vehicles; Elsevier: Amsterdam, The Netherlands, 2010. [Google Scholar]
  7. Martínez-Lao, J.; Montoya, F.G.; Montoya, M.G.; Manzano-Agugliaro, F. Electric vehicles in Spain: An overview of charging systems. Renew. Sustain. Energy Rev. 2017, 77, 970–983. [Google Scholar] [CrossRef]
  8. Francesco, F.; Guido, P.; Mariangela, R.; Andrea, V. Car-sharing services: An annotated review. Sustain. Cities Soc. 2018, 37, 501–518. [Google Scholar]
  9. Baptista, P.; Melo, S.; Rolim, C. Energy, environmental and mobility impacts of car-sharing systems. Empirical results from Lisbon, Portugal. Procedia Soc. Behav. Sci. 2014, 111, 28–37. [Google Scholar] [CrossRef] [Green Version]
  10. Galatoulas, N.-F.; Genikomsakis, K.N.; Ioakimidis, C.S. Analysis of potential demand and costs for the business development of an electric vehicle sharing service. Sustain. Cities Soc. 2018, 42, 148–161. [Google Scholar] [CrossRef]
  11. Bi, J.; Sai, Q.; Xie, D.; Zhao, X. Bi-level optimisation model for one-way electric carsharing stations based on survival model. Sustain. Cities Soc. 2021, 65, 102528. [Google Scholar] [CrossRef]
  12. Cansino, J.; Sánchez-Braza, A.; Sanz-Díaz, T. Policy instruments to promote electro-mobility in the EU28: A comprehensive review. Sustainability 2018, 10, 2507. [Google Scholar] [CrossRef] [Green Version]
  13. Klimecka-Tatar, D.; Ingaldi, M.; Obrecht, M. Sustainable Developement in Logistic–A Strategy for Management in Terms of Green Transport. Manag. Syst. Prod. Eng. 2021, 29, 91–96. [Google Scholar]
  14. Gnann, T.; Funke, S.; Jakobsson, N.; Plötz, P.; Sprei, F.; Bennehag, A. Fast charging infrastructure for electric vehicles: Today’s situation and future needs. Transp. Res. Part. D Transp. Environ. 2018, 62, 314–329. [Google Scholar] [CrossRef]
  15. De Cauwer, C.; Van Mierlo, J.; Coosemans, T. Energy consumption prediction for electric vehicles based on real-world data. Energies 2015, 8, 8573–8593. [Google Scholar] [CrossRef]
  16. Dost, P.; Spichartz, P.; Sourkounis, C. Evaluation of potentials for peak load shifting by means of electric vehicles based on field test measurements. In Proceedings of the 18th Mediterranean Electrotechnical Conference (MELECON), Lemesos, Cyprus, 18–20 April 2016. [Google Scholar]
  17. Wróblewski, P.; Kupiec, J.; Drożdż, W.; Lewicki, W.; Jaworski, J. The Economic Aspect of Using Different Plug-In Hybrid Driving Techniques in Urban Conditions. Energies 2021, 14, 3543. [Google Scholar] [CrossRef]
  18. Wu, X. Role of workplace charging opportunities on adoption of plug-in electric vehicles–Analysis based on GPS-based longitudinal travel data. Energy Policy 2018, 114, 367–379. [Google Scholar] [CrossRef]
  19. Ji, W.; Tal, G. Scenarios for transitioning cars from ICEV to BEVs and PHEVs using household level GPS travel data. Transp. Res. Part. D Transp. Environ. 2020, 88, 102555. [Google Scholar] [CrossRef]
  20. Ekman, C.K. On the synergy between large electric vehicle fleet and high wind penetration–An analysis of the Danish case. Renew. Energy 2011, 36, 546–553. [Google Scholar] [CrossRef]
  21. Drude, L.; Junior, L.C.P.; Rüther, R. Photovoltaics (PV) and electric vehicle-to-grid (V2G) strategies for peak demand reduction in urban regions in Brazil in a smart grid environment. Renew. Energy 2014, 68, 443–451. [Google Scholar] [CrossRef]
  22. Van Roy, J.; Lemput, N.; Geth, F.; Busher, J.; Salenbien, R.; Driesen, J. Electric Vehicle Charging in an Office Building Microgrid With Distributed Energy Resources. IEEE Trans. Sustain. Energy 2014, 5, 1389–1396. [Google Scholar] [CrossRef]
  23. Van Roy, J.; Lemput, N.; Geth, F.; Busher, J.; Salenbien, R.; Driesen, J. Apartment Building Electricity System Impact of Operational Electric Vehicle Charging Strategies. IEEE Trans. Sustain. Energy 2014, 5, 264–272. [Google Scholar] [CrossRef]
  24. Liu, N.; Chen, Q.; Liu, J.; Lu, X.; Li, P.; Lej, J.; Zhang, J. A Heuristic Operation Strategy for Commercial Building Microgrids Containing EVs and PV System. IEEE Trans. Ind. Electron. 2015, 62, 2560–2570. [Google Scholar] [CrossRef]
  25. Fretzen, U.; Ansarin, M.; Brandt, T. Temporal city-scale matching of solar photovoltaic generation and electric vehicle charging. Appl. Energy 2021, 282, 116160. [Google Scholar] [CrossRef]
  26. Wenge, C.; Arendarski, B.; Haensch, K.; Naumann, A.; Komarnicki, P. Electric vehicle simulation models for power system applications. In Proceedings of the 2012 IEEE Power and Energy Society General Meeting, San Diego, CA, USA, 22–26 July 2012; pp. 1–6. [Google Scholar]
  27. Staudt, P.; Schmidt, M.; Gärttner, J.; Weinhardt, C. A decentralized approach towards resolving transmission grid congestion in Germany using vehicle-to-grid technology. Appl. Energy 2018, 230, 1435–1446. [Google Scholar] [CrossRef]
  28. Mkahl, R.; Nait-Sidi-Moh, A.; Gaber, J.; Wack, M. An optimal solution for charging management of electric vehicles fleets. Electr. Power Syst. Res. 2017, 146, 177–188. [Google Scholar] [CrossRef]
  29. Wang, K.; Gu, L.; He, X.; Guo, S.; Sun, Y.; Vinel, A.; Shen, J. Distributed energy management for vehicle-to-grid networks. IEEE Netw. 2017, 31, 22–28. [Google Scholar] [CrossRef]
  30. Nunna, H.S.V.S.K.; Battula, S.; Doolla, S.; Srinivasan, D. Energy management in smart distribution systems with vehicle-to-grid integrated microgrids. IEEE Trans. Smart Grid 2018, 9, 4004–4016. [Google Scholar] [CrossRef]
  31. Masrur, M.A.; Skowronska, A.G.; Hancock, J.; Kolhoff, S.W.; McGrew, D.Z.; Vandiver, J.C.; Gatherer, J. Military-based vehicle-to-grid and vehicle-to-vehicle microgrid–system architecture and implementation. IEEE Trans. Transp. Electrif. 2018, 4, 157–171. [Google Scholar] [CrossRef]
  32. Sprei, F.; Habibi, S.; Englund, C.; Petterson, S.; Voronov, A.; Wedlin, J. Free-floating car-sharing electrification and mode displacement: Travel time and usage patterns from 12 cities in Europe and the United States. Transport. Res. Part D-Transport. Environ. 2019, 71, 127–140. [Google Scholar] [CrossRef]
  33. Schmöller, S.; Weikl, S.; Müller, J.; Bogenberger, K. Empirical analysis of free-floating carsharing usage: The Munich and Berlin case. Transp. Res. Pt. C-Emerg. Technol. 2015, 56, 34–51. [Google Scholar] [CrossRef]
  34. Campisi, T.; Torrisi, V.; Ignaccolo, M.; Inturri, G.; Tesoriere, G. University propensity assessment to car sharing services using mixed survey data: The Italian case study of Enna city. Transp. Res. Procedia 2020, 47, 433–440. [Google Scholar] [CrossRef]
  35. Becker, H.; Ciari, F.; Axhausen, K.W. Comparing car-sharing schemes in Switzerland: User groups and usage patterns. Transp. Res. Pt. A-Policy Pract. 2017, 97, 19–29. [Google Scholar] [CrossRef] [Green Version]
  36. Vine, L.S.; Polak, J. The impact of free-floating carsharing on car ownership: Early-stage findings from London. Transp. Policy 2019, 75, 119–127. [Google Scholar] [CrossRef]
  37. Velez, A.M.A.; Plepys, A. Car Sharing as a Strategy to Address GHG Emissions in the Transport System: Evaluation of Effects of Car Sharing in Amsterdam. Sustainability 2021, 13, 2418. [Google Scholar]
  38. Nijland, H.; Meerkerk, J. Mobility and environmental impacts of car sharing in the Netherlands. Environ. Innov. Soc. Trans. 2017, 23, 84–91. [Google Scholar] [CrossRef]
  39. Omahne, V.; Knez, M.; Obrecht, M. Social Aspects of Electric Vehicles Research—Trends and Relations to Sustainable Development Goals. World Electr. Veh. J. 2021, 12, 15. [Google Scholar] [CrossRef]
  40. Wenge, C.; Komarnicki, P.; Styczynski, Z.A. Models and boundaries of data exchange between electric-vehicle and charging-point. Example of a practical realisation. In Proceedings of the 2010 Modern Electric Power Systems, Wroclaw, Poland, 20–22 September 2010. [Google Scholar]
  41. Krueger, H.; Cruden, A. Modular strategy for aggregator control and data exchange in large scale Vehicle-to-Grid (V2G) applications. Energy Procedia 2018, 151, 7–11. [Google Scholar] [CrossRef]
  42. Kester, J.; Noel, L.; Lin, X.; Zarazua de Rubens, G.; Sovacool, B.K. The coproduction of electric mobility: Selectivity, conformity and fragmentation in the sociotechnical acceptance of vehicle-to-grid (V2G) standards. J. Clean. Prod. 2019, 207, 400–410. [Google Scholar] [CrossRef]
  43. Komarnicki, P.; Wenge, C.; Pietracho, R. Electromobility–integration of electric vehicles with the power grid infrastructure. Prz. Elektrotechniczny 2020, 1, 3–15. [Google Scholar] [CrossRef]
  44. Shin, M.; Kim, H.; Kim, H.; Jang, H. Building an interoperability test system for electric vehicle chargers based on ISO/IEC 15118 and IEC 61850 standards. Appl. Sci. 2016, 6, 165. [Google Scholar] [CrossRef] [Green Version]
  45. Wenge, C.; Winkler, T.; Stotzer, M.; Komarnicki, P. Power quality measurements of electric vehicles in the low voltage power grid. In Proceedings of the 11th International Conference on Electrical Power Quality and Utilisation, Lisbon, Portugal, 17–19 October 2011; pp. 1–5. [Google Scholar]
  46. Pinto, D.R.; Arioli, V.T.; Hax, G.R.T.; Borges, R.T.; Teixeira, W.W. Analysis of the impact on power quality during the recharge of electric vehicles and vehicle-to-grid functionality. In Proceedings of the 2017 IEEE PES Innovative Smart Grid Technologies Conference Europe (ISGT-Europe), Turin, Italy, 26–29 September 2017; pp. 1–6. [Google Scholar]
  47. Monteiro, V.; Goncalves, H.; Afonso, J.L. Impact of electric vehicles on power quality in a smart grid context. In Proceedings of the 11th International Conference on Electrical Power Quality and Utilisation, Lisbon, Portugal, 17–19 October 2011; pp. 1–6. [Google Scholar]
  48. Martinenas, S.; Knezovic, K.; Marinelli, M. Management of power quality issues in low voltage networks using electric vehicles: Experimental validation. IEEE Trans. Power Deliv. 2017, 32, 971–979. [Google Scholar] [CrossRef] [Green Version]
  49. Burzyński, D.; Pietracho, R.; Kasprzyk, L.; Tomczewski, A. Analysis and modeling of the wear-out process of a lithium-nickel-manganese-cobalt cell during cycling operation under constant load conditions. Energies 2019, 12, 3899. [Google Scholar] [CrossRef] [Green Version]
  50. Petit, M.; Prada, E.; Sauvant-Moynot, V. Development of an empirical aging model for Li-ion batteries and application to assess the impact of Vehicle-to-Grid strategies on battery lifetime. Appl. Energy 2016, 172, 398–407. [Google Scholar] [CrossRef]
  51. Jafari, M.; Gauchia, A.; Zhao, S.; Zhang, K.; Gauchia, L. Electric vehicle battery cycle aging evaluation in real-world daily driving and vehicle-to-grid services. IEEE Trans. Transp. Electrif. 2018, 4, 122–134. [Google Scholar] [CrossRef]
  52. Dubarry, M.; Devie, A.; McKenzie, K. Durability and reliability of electric vehicle batteries under electric utility grid operations: Bidirectional charging impact analysis. J. Power Sources 2017, 358, 39–49. [Google Scholar] [CrossRef]
  53. Wang, D.; Coignard, J.; Zeng, T.; Zhang, C.; Saxena, S. Quantifying electric vehicle battery degradation from driving vs. vehicle-to-grid services. J. Power Sources 2016, 332, 193–203. [Google Scholar] [CrossRef] [Green Version]
  54. Calearo, L.; Marinelli, M. Profitability of frequency regulation by electric vehicles in Denmark and Japan considering battery degradation costs. World Electr. Veh. J. 2020, 11, 48. [Google Scholar] [CrossRef]
  55. Kasprzyk, L.; Domeracka, A.; Burzyński, D. Modelling of lithium-ion batteries operation and life in electric vehicles. Prz. Elektrotechniczny 2018, 1, 160–163. [Google Scholar] [CrossRef]
  56. Bastida-Molina, P.; Hurtado-Pérez, E.; Pérez-Navarro, Á.; Alfonso-Solar, D. Light electric vehicle charging strategy for low impact on the grid. Environ. Sci. Pollut. Res. 2021, 28, 18790–18806. [Google Scholar] [CrossRef]
  57. Iacobucci, R.; Bruno, R.; Schmöcker, J.-D. An Integrated Optimisation-Simulation Framework for Scalable Smart Charging and Relocation of Shared Autonomous Electric Vehicles. Energies 2021, 14, 3633. [Google Scholar] [CrossRef]
  58. Wulff, N.; Steck, F.; Gils, H.C.; Hoyer-Klick, C.; van den Adel, B.; Anderson, J.E. Comparing Power-System and User-Oriented Battery Electric Vehicle Charging Representation and Its Implications on Energy System Modeling. Energies 2020, 13, 1093. [Google Scholar] [CrossRef] [Green Version]
  59. Carey, N.; Steitz, S. EU Proposes Effective Ban for New Fossil-Fuel Cars from 2035. Available online: https://www.reuters.com/business/retail-consumer/eu-proposes-effective-ban-new-fossil-fuel-car-sales-2035-2021-07-14/ (accessed on 26 July 2021).
  60. Wellmann, P. Materialien der Elektronik und Energietechnik; Springer: Berlin/Heidelberg, Germany, 2017; ISBN 978-3-658-14006-9. [Google Scholar]
  61. European Alternative Fuels Observatory. Normal and Fast Public Charging Points. Available online: https://www.eafo.eu/electric-vehicle-charging-infrastructure (accessed on 23 March 2021).
  62. Technische Anschlussregeln Niederspannung (VDE-AR-N 4100). Available online: https://www.vde.com/de/fnn/arbeitsgebiete/tar/tar-niederspannung/tar-niederspannung-vde-ar-n-4100 (accessed on 23 March 2021).
  63. Electric Vehicle Database. Available online: https://ev-database.org/car/1117/Nissan-e-NV200-Evalia (accessed on 27 July 2021).
  64. Wenge, C.; Guo, H.; Roehrig, C. Measurement-based harmonic current modeling of mobile storage for power quality study in the distribution system. Arch. Electr. Eng. 2017, 66, 801–814. [Google Scholar] [CrossRef] [Green Version]
  65. Statista. Estimated Average Battery Capacity in Electric Vehicles Worldwide from 2017 to 2025, by Type of Vehicle. Available online: https://www.statista.com/statistics/309584/battery-capacity-estimates-for-electric-vehicles-worldwide (accessed on 23 March 2021).
  66. Statista. Average Price of Diesel Fuel in Germany from 1950 to 2021. Available online: https://de.statista.com/statistik/daten/studie/779/umfrage/durchschnittspreis-fuer-dieselkraftstoff-seit-dem-jahr-1950/ (accessed on 23 March 2021).
  67. Statista. Industrial Electricity Prices (including Electricity Tax) in Germany in the Years 1998 to 2021. Available online: https://de.statista.com/statistik/daten/studie/252029/umfrage/industriestrompreise-inkl-stromsteuer-in-deutschland/ (accessed on 23 March 2021).
Figure 1. Development of public charging stations in Europe [61].
Energies 14 05327 g001
Figure 2. Histogram representing the level of consumption for particular charging events.
Energies 14 05327 g002
Figure 3. A multi-criteria EV modeling method.
Energies 14 05327 g003
Figure 4. Comparison between the real vehicle fuel consumption and the average manufacturer’s consumption declaration, and the corresponding electricity consumption for an EV.
Energies 14 05327 g004
Figure 5. Selected routes for 4 of the 60 vehicles in the fleet used in analyses.
Energies 14 05327 g005
Figure 6. Real-based charging process characteristics for an electric vehicle (EV).
Energies 14 05327 g006
Figure 7. One-week profile of vehicle energy demand and the resulting charging profile while parking.
Energies 14 05327 g007
Figure 8. Diagrams representing the road most frequently driven by the vehicles that have been analyzed; (a) the entire distance traveled by each vehicle during the one week; (b) the distance most frequently driven by the selected fleet for the entire week; (c) the distance most frequently driven by the selected fleet during single trips.
Energies 14 05327 g008aEnergies 14 05327 g008b
Figure 9. Diagram representing the energy demand for a single trip of each vehicle during operation for one week.
Energies 14 05327 g009
Figure 10. Diagram representing the share in% of the operation time and vehicle pause for the fleet analyzed during the week.
Energies 14 05327 g010
Figure 11. Diagram representing the energy demand for a single trip of each vehicle during operation for one week.
Energies 14 05327 g011
Figure 12. Energy demand of the commercial load for one week’s operation and PV generation.
Energies 14 05327 g012
Figure 13. Comparison of diesel and electricity purchase cost for a vehicles fleet.
Energies 14 05327 g013
Figure 14. The control algorithm for model I.
Energies 14 05327 g014
Figure 15. One week’s energy demand for the company including EVs.
Energies 14 05327 g015
Figure 16. The control algorithm for model II.
Energies 14 05327 g016
Figure 17. The control algorithm for model II.
Energies 14 05327 g017
Figure 18. One week’s profile of the vehicle energy demand and resulting charging profile while depot parking in model III.
Energies 14 05327 g018
Figure 19. The control algorithm for model III.
Energies 14 05327 g019
Figure 20. The control algorithm for model III.
Energies 14 05327 g020
Table 1. Common charging methods and charging times for electric cars [60].
Number of PhasesVoltage/CurrentPowerPlug SystemCharging Time for 300 km Range
Slow charging1 AC230 V/10 A2,3 kWSchuko30 h
(<10 kW)1 AC230 V/16 A3,7 kWBlue CEE socket19 h
1 AC230 V/32 A7,4 kWIEC Typ 210 h
Accelerated charging3 AC400 V/16 A11 kWIEC Typ 26.5 h
(11, 22 kW)3 AC400 V/32 A22 kWIEC Typ 23 h
Fast chargingDC400 V/125 A50 kWIEC Typ 2
CCS
90 min
(>50 kW)DC400 V/500 A200 kW30 min
DC800 V/500 A350 kW10 min
Table 2. Summary of system services provided in the power grid.
ServiceDescription
Improving the local quality of energy supplyNetwork parameters can be improved locally by using connected EVs or a fleet of vehicles. (Total harmonic distortion and indicators such as voltage and current harmonics can be reduced locally).
Power system restorationIn the event of a system failure, i.e., a blackout, the connected EVs or their fleets can assist in system restoration.
Islanding (resynchronization)In the case of network desynchronization, i.e., the creation of several isolated microgrids, connected EVs, or their fleets can be used to selectively support network resynchronization.
Voltage, frequency regulationConnected EVs or their fleets can support local voltage stability in certain sections of the low voltage grid or maintain the load profiles required.
Short-circuit power supplyIn a critical network/system state (short-circuit)–connected EVs or their fleets can help to eliminate or shorten failures by ‘staying on the network.’
Marketing of hourly and quarter-hourly products on the energy marketVarious services can be offered on the energy market by using EVs or their batteries (e.g., energy arbitrage).
Table 3. Summary of energy consumption for the company and the vehicle fleet for model I.
ObjectEnergy Demand [MWh]Cost [Euro]
Enterprise11.532104.26
EVs4.72861.40
PV 00
Table 4. Summary of energy consumption for the company and the vehicle fleet for model II.
ObjectEnergy Demand [MWh]Cost [Euro]
Enterprise11.532104.26
EVs2.45447.13
PV 1 −3.04−172.67
1 Energy generated by PV and not used for vehicle charging, can be sold to the grid at the actual rate of 5.68 ct/kWh (July 2021).
Table 5. Summary of energy consumption for the company and the vehicle fleet for model III.
ObjectEnergy Demand [MWh]Cost [Euro]
Enterprise11.532104.26
EVs2.53461.73
PV 1 −3.13−177.78
1 Energy generated by PV and not used for vehicle charging, can be sold to the grid at the actual rate of 5.68 ct/kWh (July 2021).
Table 6. Summary of energy consumption for all models adopted.
ObjectModel IModel IIModel III
Energy Demand [MWh]
Enterprise11.53
EVs4.722.452.53
PV0−3.04−3.13
Publisher’s Note: MDPI stays neutral with regard to jurisdictional claims in published maps and institutional affiliations.

