1. Introduction
The transport system plays a key role in socio-economic development by physically connecting the locations where various activities are conducted. Nonetheless, it is widely accepted that the transport system also produces external impacts on society and the economy, as well as on the environment. The intensification of climate change and air quality problems, and the depletion of natural resources during past decades, in combination with the ongoing increase in mobility demand and the challenges that persist regarding safety, accessibility and affordability, highlight even more the significance of decision-making concerning transport development within the framework of sustainability.
On the one hand, in Europe, mainly as a result of improvements in vehicle technology, roadway design and regulatory and policy interventions, the number of persons killed in road traffic accidents has continuously decreased since 2009 [
1]. Nonetheless, the problem persists in densely populated European cities, where 38% of road fatalities take place, 70% of which involve vulnerable road users [
2]. On the other hand, the transport sector is responsible for more than 25% of annual manmade greenhouse gas emissions (including international aviation but excluding maritime shipping) in the European Union (EU), with approximately 75% of this being due to road transport [
3]. Apart from constituting a major contributor to climate change, transportation significantly contributes to air pollution (NO
x, particulate matter, etc.) and energy intensity, especially in urban areas, which are characterized by increased mobility needs, given the increasing concentrations of population and activity [
3]. The adoption of innovative vehicle technologies with the potential to significantly reduce emissions and energy intensity is regarded as one of the most powerful means, being placed high in the EU sustainable mobility agenda [
4,
5].
In this framework, the evolution toward fully autonomous road vehicles is nowadays promoted as an innovative sustainable transport solution, mainly due to their ability to reduce road accidents that derive from human error on the part of the driver [
6,
7]. Nonetheless, the first evidence collected from the experimental application of autonomous driving in real-life conditions indicates that autonomous cars are not yet able to navigate safely in complex urban environments, while some scientists highlight the uncertain impact on road safety during the period when vehicles with different levels of automation will share the road network [
8]. In terms of environmental sustainability, vehicles of automation level 5 [
9], which are also connected and battery-electric (referred to as autonomous electric vehicles hereinafter), emerge as a promising sustainable mobility solution, as their efficiency in terms of air pollutants, greenhouse gas emissions and energy consumption is expected to be significantly higher than motorized vehicles of conventional technology under specific conditions [
10].
In order to capitalize on the potential of autonomous electric vehicles to increase safety and decrease emissions and energy consumption in cities, decision-makers are charged with the task of developing not only the appropriate policy interventions for the vehicles but also the road network infrastructure. These interventions must aim at the maximization of positive and the minimization of negative impacts on aspects of socio-economic and environmental sustainability [
11]. Given the novel character of the autonomous electric vehicles and the lack of previous wide-scale implementation of such technologies, decision-makers will have to step into uncharted territory in their effort to efficiently cope with dilemmas, such as choosing a plug-in or wireless charging infrastructure. Dynamic or stationary charging services? Road segments of mixed traffic flow, where autonomous vehicles share the roadway space with conventional vehicles or dedicated traffic lanes? Such issues need to be addressed in a holistic way, taking into account different sustainability criteria, primarily aiming at the enhancement of travel safety for all road users while ensuring the safety and public health of all residents, in terms of exposure to electromagnetic radiation.
With the purpose of contributing to the above task, the present research aims initially at an early-stage evaluation (due to the current lack of wide-scale implementation) of infrastructure alternatives for autonomous electric vehicles. These alternatives and the respective evaluation criteria are derived from the review of international literature, while a group of experts participated in the formulation of the final criteria list. The alternatives were finally evaluated through the combined application of two hybrid multi-criteria analyses (MCA) on the basis of a set of safety and sustainability criteria. The group of experts also provided the weighting of the criteria and the evaluation of the alternatives. The proposed combination of analyses was expected to lead to more reliable and valid estimations, compared to the application of each analysis separately.
The paper is structured as follows: Following the introductory part, the review of selected works for the evaluation of infrastructure requirements for autonomous electric vehicles is presented in
Section 2. The methodological approach is described in
Section 3. In
Section 4, the combined analysis for the evaluation of infrastructure planning interventions for autonomous electric vehicles in urban areas is carried out, while
Section 5 and
Section 6 refer to the interpretation of the results and to the study’s relevant limitations, along with conclusions and future prospects, respectively.
2. Autonomous and Electric Vehicle Infrastructure Evaluation in Existing Literature
Several recent papers on the potential impacts of autonomous vehicles, especially in urban areas, can be found in the literature. The challenges for urban planners, derived from the potential impacts of autonomous vehicles on the location choices of people and businesses, the traffic and parking conditions, the requirements of pick-up and drop-off areas, as well as the need for integration to the energy and communication grids of smart cities, are highlighted in [
12]. The expected changes in urban design and sustainability due to the advent of autonomous vehicles are discussed, among other aspects, in [
13]. The expected impacts of autonomous and electric vehicles at social, economic, and environmental levels are included in [
10], while the performance of these new technologies with regard to different sustainability criteria is also investigated. In [
14], the expected impacts of autonomous vehicles on cities at various levels, such as road capacity and congestion, parking demand, land use, health, economy, the labor market, road infrastructure, and environment are studied. Scenario analysis to investigate potential implications for traffic, travel behavior and transport planning, on a time horizon up until 2030 and 2050 in the Netherlands, is conducted in [
15]. The potential implications of automated vehicles at different levels, such as land use, transport infrastructure, energy consumption, air pollution and safety, are studied in [
16]. The likely benefits and costs of autonomous vehicles, along with the potential impacts and implications for planning decisions, such as optimum road, parking and public transit supply, are investigated in [
17]. However, no work has been published up to now concerning the systematic evaluation of road infrastructure alternatives for fully autonomous (automation level 5) and connected vehicles in the international research literature.
As regards the evaluation of infrastructure for electric vehicles, namely, the different charging systems for urban environments, a limited number of research papers can be allocated, mainly referring to electric buses, which are often based on assumptions due to the low maturity level of certain charging alternatives (such as dynamic inductive charging). In [
18], for example, three different inductive charging systems (stationary, static and dynamic) for electric buses are compared, in terms of the initial investment cost (including those of the infrastructure and batteries), for two urban routes in Korea, stressing that such a comparison should be carried out again in the future when the cost data for these new technologies will be more reliable. The environmental and techno-economic feasibility of the dynamic charging of electric vehicles in urban and interurban road networks in the U.S.A. is assessed by [
19], where a significant reduction in CO
2 emissions, partial reduction in VOC, CO, NO
x, PM10 and PM2.5, and an increase in SO
x, is estimated for dynamic charging. Moreover, the researchers of [
20] present a new method for the performance evaluation of dynamic charging systems for two types of vehicles: a light-duty truck and a city car. A cost-benefit analysis (CBA) for three scenarios relating to plug-in charging, stationary inductive, and dynamic inductive charging of electric vehicles is conducted by [
21]; however, they take into account only the acquisition cost of the vehicle, the charging cost, and the installation cost of the charging station. An estimate of the environmental and economic benefits stemming from dynamic charging systems use is included in [
22]. Venugopal et al. conduct an economic evaluation of the sustainability of a future self-healing highway with integrated wireless electric vehicle charging (using renewable energy sources) in the Netherlands [
23]. A CBA for the evaluation of the economic sustainability (in terms of initial investment and operation cost) of a dynamic charging system is conducted by [
24], emphasizing the legal context for the use of this new technology. The study conducted by [
25] models the benefits related to reducing the battery size, due to dynamic charging. The economic sustainability of a dynamic charging system is examined in [
26], while a dynamic inductive charging system for electric buses is compared to a stationary inductive system, in terms of energy and pollutant emissions, by [
27].
3. Materials and Methods
The use of multi-criteria analysis (MCA) is gaining more and more attention during recent years compared to conventional quantitative methods, such as the CBA, due to certain specific advantages [
28,
29]. There is no better or worse MCA method, but there is an appropriate MCA method for each problem [
30].
In order to select the optimum solution in terms of infrastructure alternatives for autonomous electric vehicles for the promotion of sustainable urban mobility, a new decision-aiding methodology, as proposed in [
10], is applied. The methodology mainly consists of the combined application of AHP-VIKOR and AHP-TOPSIS MCA models, with an additional condition that contributes to the “consolidation” of the optimum solution. Apart from the fact that AHP, VIKOR and TOPSIS methods can be easily understood and applied, the methodology in question is selected because it allows for the construction of a more solid background for optimum decision-making. The strengths of the engaged methods are capitalized, leading to more reliable and valid results, compared to a separate application of each method or model. At the same time, the in-depth comprehension of the problem and of the relevant parameters is ensured.
The main steps of the methodology are summarized below, while a more detailed description of the methodology can be found in [
10].
Step 1: Scope—problem definition.
Step 2: Selection of the appropriate experts.
Step 3: Definition of the overall goal.
Step 4: Formulation of an initial list of alternatives, based on a literature review.
Step 5: Formulation of an initial list of evaluation criteria, based on a literature review.
Step 6: Formulation of the final list of alternatives by means of interviews with the chosen experts.
Step 7: Formulation of the final list of criteria applying, e.g., a modified Delphi.
Step 8: Hierarchy structure of the problem according to AHP [
31].
Step 9: Design and distribution of questionnaires for pair-wise comparisons to the experts.
Step 10: Aggregation of the experts’ judgments based on the “aggregation of individual judgments” method.
Step 11: Pair-wise comparison matrix derivation, as shown in Equation (1), based on AHP, both for the criteria and for the alternatives [
31]:
where
= w
i/ w
j = element of matrix A (Equation (1)), representing the relative importance of the criterion or alternative (i) over the criterion or alternative (j) with regard to the overall goal achievement or with regard to each criterion respectively, with i = 1, 2, …, n and j = 1, 2, …, n (
= 1/
and
= w
i/w
i = 1).
wi, wj = weight coefficients of the criteria or of the alternatives (i) and (j) respectively.
Step 12: Normalization of the abovementioned pair-wise comparison matrices (each value is divided by the sum of values in the same column of the matrix).
Step 13: Extraction of criteria weights’ (priority vector W) and alternatives’ performance (priority vectors W) with regard to each criterion, based on AHP, applying Equation (2) [
31]:
where A = pair-wise comparison matrix, W = (w
1, w
2, …, w
n)
T = priority vector for each hierarchy level, λ
max = principal eigenvalue of matrix A.
Step 14: Calculation and control of the AHP consistency ratio (CR) using Equation (3) [
31]:
where CI = consistency index, calculated by Equation (4) [
31]:
and RI = random consistency index (
Table 1).
Step 15: Decision matrix formulation, as shown in Equation (5) for n criteria and m alternatives, based on the extracted priority vectors of the alternatives with regard to each criterion, for the application of TOPSIS and VIKOR, aiming at the overall ranking of the alternatives:
where x
ij = performance of the alternative A
i with regard to the criterion C
j, where i = 1, 2, …, m and j = 1, 2, …, n.
Step 16: Application of VIKOR [
32] for the overall ranking of the alternatives:
Calculation of the best (fj*) and the worst (fj−) performance values for each criterion function, for the decision matrix formulated in step 15.
For benefit functions (where a higher value is better) [
32]:
and for cost functions (where a lower value is better) [
32]:
where i = 1, 2, …, m and j = 1, 2, …, n.
The calculation of group utility (S
i) and individual regret (R
i) values for each alternative A
i (i = 1, 2, …, m) are as follows [
32]:
where w
j (j = 1, 2, …, n) gives the criteria weights.
Calculation of Q
i values for each alternative A
i (i = 1, 2, …, m) for v = 0.5 [
32]:
Alternatives ranking based on S
i, R
i and Q
i values of each alternative (minimum value → best alternative and maximum value → worst alternative) and control of the conditions of acceptable advantage and of acceptable stability as defined in [
32] for the reveal of the optimum solution.
Step 17: Application of TOPSIS [
33] for the overall ranking of the alternatives:
If r
ij the elements of the decision matrix of step 15 (already normalized), the elements v
ij of the weighted normalized matrix are calculated as follows [
33]:
where w
j is the weight of the criterion C
j (where j = 1,2, …, n) and Σw
j = 1.
Calculation of the ideal (A
+) and negative-ideal (A
−) solution [
33] is as follows:
where J = {j = 1,2,…n and j refers to benefit criteria} and J′ = {j = 1,2,…n and j refers to cost criteria}.
Calculation of the “separation measure” (distance of each alternative from the ideal and the negative-ideal solution), applying the “Euclidian distance method” is as follows.
Euclidian distance of the alternative A
i from the ideal solution (S
i+) [
33]:
Euclidian distance of the alternative A
i from the negative-ideal solution (S
i−) [
33]:
Calculation of the relative closeness c
i+ to the ideal solution [
33]:
Alternative ranking based on ci+ values (maximum ci+ value → best alternative).
Step 18: Control of the convergence of the derived results of the two models (AHP-VIKOR and AHP-TOPSIS):
4. Selection of Infrastructure Alternatives for Autonomous Electric Vehicles in Urban Areas
The methodology described in
Section 3 was implemented to select the optimum solution regarding infrastructure alternatives for autonomous electric vehicles in urban areas, based on their evaluation according to safety and sustainability criteria. The implementation steps and the main output are presented below.
4.1. Definition of the Decision Problem
Autonomous vehicles are widely promoted as a new solution for the improvement of traffic and mobility conditions, with a significant reduction of accidents due to human error, while electromobility is considered as a prerequisite for the transition to low-carbon mobility, with the benefits expected to be much higher in the case of energy production by renewable and low-carbon resources [
10,
12,
34,
35,
36]. Obviously, automation, connectivity, and electrification, apart from private cars, also concern means of public transport [
37,
38]. In the next few decades, it is expected that autonomous electric vehicles will gradually replace a significant percentage of conventional motorized road vehicles. This evolution will go along with the need to adjust current infrastructures and develop new ones in order to service autonomous and electric vehicles. In cities, policymakers will be called to choose the most appropriate infrastructure alternative, taking into account the overarching goal of promoting sustainable urban mobility. In the absence of relevant previous work, a preliminary evaluation of infrastructure alternatives for autonomous electric vehicles, in the context of sustainable urban mobility, is implemented to support decision-making by policymakers.
The following assumptions are made:
The study area is a typical large-scale urban area.
Infrastructure alternatives are mainly intended for passenger cars.
Autonomous electric vehicles co-exist with conventional ones.
The charging infrastructure is constructed and managed by the public sector.
Plug-in (wired) charging is approximately 5 times faster than stationary wireless (contactless) charging and 10 times faster than charging via existing plug-in stations (based on the literature review mentioned in
Section 4.4 and
Section 4.5 below, related to electric vehicles).
There is no fare to enter the dynamic charging lane dedicated to autonomous electric vehicles, as well as to use stationary wireless charging infrastructure, within the framework of promoting these new technologies.
The criterion of “traffic congestion”, apart from the impact on user’s time value, is also related to air pollutants and greenhouse gas emissions, as well as to natural resource consumption.
4.2. Selection of Experts
The selection of experts, both in terms of quality and in terms of quantity, is of extremely high importance for the application of such a methodology. The number of experts should be large enough to capture all the different aspects, but, at the same time, reasonable. The recommended number of experts participating in a group pair-comparison procedure is 8–15 [
39,
40]. In order to ensure that all the participants can express themselves independently and without fear of “exposure”, as well as for equity reasons concerning their treatment, pair-wise comparisons are usually executed anonymously [
39,
40,
41].
As regards their number, 15 experts participated in the present analysis, by means of interviews, for the definition of the evaluation criteria and the alternatives, on the basis of the initial list (based on a comprehensive literature review). As for the next stage of the criteria and alternative pair-wise comparisons, 12 experts participated in the process. Regarding their level of expertise, the criteria for their selection were the relevance of their studies to the evaluation subject, along with their years of experience and expertise in the field of transport, especially in relation to autonomous and electric vehicles.
4.3. Overall Goal
The overall goal is meeting the principles of sustainable urban mobility, which refers to the satisfaction of urban mobility needs, at the least possible economic, social and environmental cost [
42]. The optimum compromise between social, environmental, and economic criteria is therefore sought by selecting the most appropriate road infrastructure alternatives for autonomous electric vehicles.
4.4. Alternatives
Concerning roadway infrastructure planning for autonomous (automation level 5) and connected vehicles, the examined alternatives comprise either mixed traffic roads, shared by vehicles of different automation levels or separate lanes for the circulation of autonomous vehicles. Given the absence of research related to the evaluation of such alternatives, due to the low maturity level of these technologies, the relevant alternatives, as well as the evaluation criteria, are mainly defined on the basis of literature related to the expected impacts of autonomous vehicles.
Concerning the types of electric vehicle charging systems, battery charging can be either wired (plug-in) or wireless. Wireless charging may be contactless or not, and can be realized either when the vehicle is parked (stationary) or when it is in motion (dynamic) [
18,
24,
26,
43,
44].
The main advantages and disadvantages of wireless over wired (plug-in) electric vehicle charging are presented below.
Advantages of wireless over wired (plug-in) vehicle charging:
A simple process, comfortable in bad weather conditions (e.g., rain) [
45,
46].
Given that all the infrastructure parts are underground, the system is protected against stealing or vandalism [
45].
Given the underground installation, there are no visual intrusion and landscape “disruption” problems [
45].
Dynamic wireless charging is time-saving, as the vehicle can be charged when moving [
24,
43,
47,
48].
The battery weight can be significantly reduced in the case of dynamic charging, also leading to vehicle weight reduction and, thus, a reduction in energy consumption and pollutant emissions (given the optimization of these systems in the future) [
19,
49,
50,
51,
52].
Disadvantages of wireless over wired (plug-in) vehicle charging:
Infrastructure requirements (both economic and technical) are much higher than in the case of wired charging [
43,
47,
53,
54].
Safety questions are raised in the case of wireless charging, especially dynamic (when people will be in the vehicle during charging), as negative health impacts due to electromagnetic radiation may be caused, while there are safety concerns in the case of passengers with pacemakers, or animals that may be present between the charging infrastructure devices and vehicle equipment [
49,
55].
Due to the high demand for wireless charging, the energy distribution network might not be sufficient, so a later need for upgrades is highly possible [
47,
56].
Wired charging is characterized by less energy loss [
45,
46].
The initial list of infrastructure alternatives was derived from the literature review included in
Section 2, as well as [
57,
58,
59,
60,
61,
62]. The final list of infrastructure alternatives was based on the review in combination with interviews with the experts. The following infrastructure alternatives were selected for evaluation:
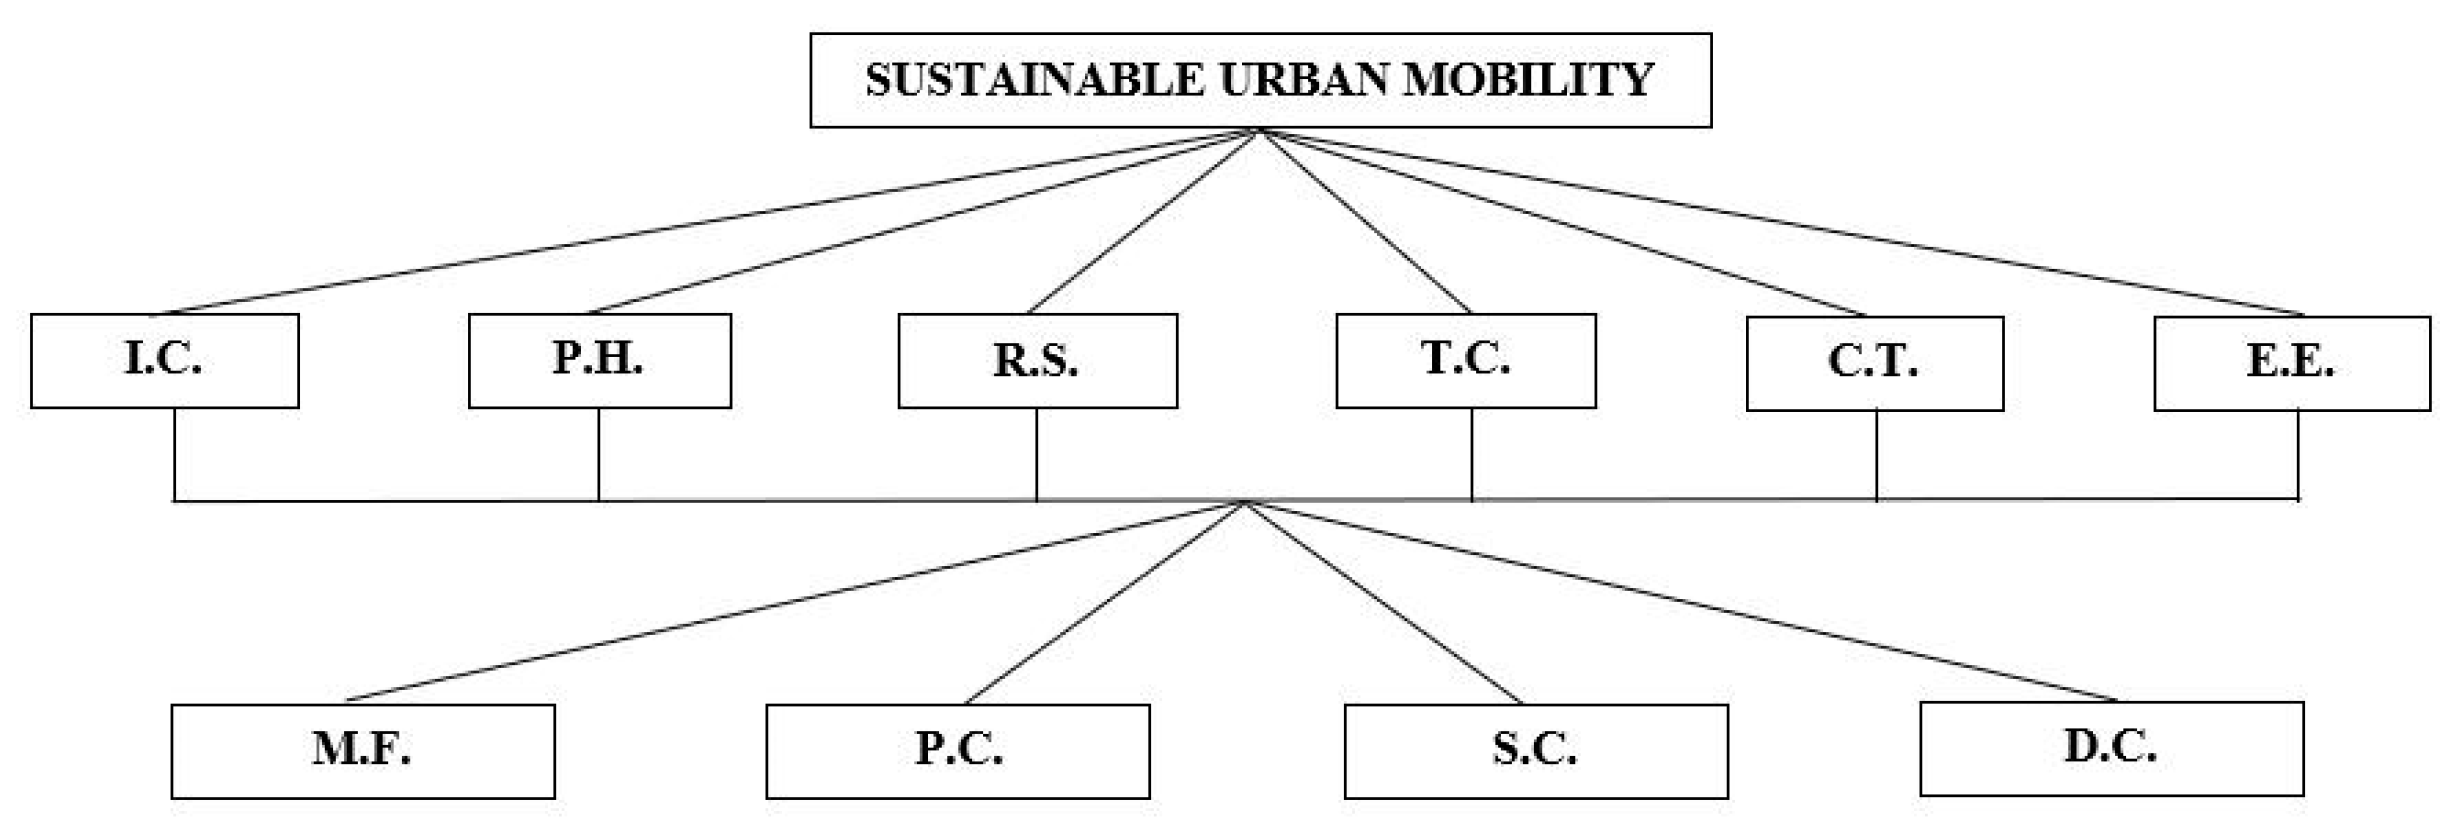
Mixed flow of conventional and autonomous electric vehicles (and charging at existing plug-in charging stations)—encoded as M.F.
Lanes dedicated to autonomous electric vehicles, with plug-in charging stations beside the roadway, along the route—encoded as P.C.
Lanes dedicated to autonomous electric vehicles, with stationary wireless charging stations beside the roadway—encoded as S.C.
Lanes dedicated to autonomous electric vehicles, with dynamic wireless charging infrastructure along the route—encoded as D.C.
4.5. Evaluation Criteria
The initial list of evaluation criteria includes social, environmental, and economic criteria, based on the literature review included in
Section 2 and in
Section 4.4, as well as [
63,
64,
65,
66,
67] (as already mentioned, in the case of autonomous vehicles, the literature is mainly related to the expected impacts, given the absence of previous work related to infrastructure evaluation). It is worth highlighting that the number of criteria should be sufficient to cover all aspects of the evaluation but also be reasonable, taking into account that the human mind may efficiently compare up to 7 ± 2 elements [
68] in pairs. For this reason, a modified Delphi was then applied, as described in [
10]. Briefly, the experts were asked to select (on the basis of the “7 ± 2 principle”) the 7 most important criteria (in their opinion) from the list, as well as to add any other ones that might not have been included in the list, but would be among the 7 most important criteria for the evaluation of the 4 alternatives. The usual “consensus threshold” in traditional Delphi ranges from 50% to 97% [
69], so a threshold of 75% was chosen for this modified Delphi application. Only 6 criteria were selected by at least 75% of the participants, while no other criterion was added. Thus, the final criteria list was the following:
Construction, operation and maintenance infrastructure cost (much higher in case of dynamic wireless charging)—encoded as I.C.
Impact on public health due to electromagnetic radiation (in case of dynamic wireless charging)—encoded as P.H.
Road safety (e.g., high risk in case of mixed flow)—encoded as R.S.
Traffic congestion (e.g., reduction in case of lanes dedicated to autonomous electric vehicles)—encoded as T.C.
Charging time (e.g., dynamic wireless charging → less time-consuming)—encoded as C.T.
Charging system energy efficiency (wireless—especially dynamic—charging → more energy-consuming)—encoded as E.E.
Other criteria that were included in the initial list, but were not selected by at least 75% of the experts, referred to equity concerns (e.g., lanes dedicated to autonomous electric vehicles, to the detriment of conventional ones), comfort in general and in adverse weather conditions, the adequacy of energy distribution in the case of increased demand and energy loss, visual intrusion, etc. It should be noted that the perception of these experts may change in a future iteration of the process when the maturity level of the engaged technologies will be higher.
4.6. Hierarchy Structure of the Problem, Based on AHP
The decision problem hierarchy is formed as shown in
Figure 1. The alternatives are at the base, the criteria at the upper level, while the overall goal is at the top.
4.7. Criteria Weighting Based on AHP
After the formulation of the decision problem hierarchy, 15 criteria pair-wise comparisons (an indicative part is shown in
Table 2), were executed by the group of experts, using the 9-level linear Saaty scale (
Table 3).
The experts’ answers were aggregated by implementing the “aggregation of individual judgments” method, using the geometric mean-GEOM. MEAN (for a set of n numbers x
1, x
2,…, x
n, geometric mean equals
) of the value attributed to each criterion. The AHP consistency ratio (CR: (Equation (3)) is used for the consistency control of the answers. The input data, based on the experts’ answers and the geometric mean for each case, can be found in
Table 4. When the criterion on the left is selected (
Table 2), the value is used for the analysis exactly as it is. When the criterion on the right is selected, the reverse value of the selected one in
Table 2 is used for the analysis.
The geometric mean values of
Table 4 serve as input data for the AHP comparison matrix (
Table 5), based on Equation (1), and for the normalized comparison matrix of
Table 6, where the calculated criteria priority vector (criteria weights) and the respective consistency control are shown.
4.8. Evaluation of Alternatives with Regard to Each Criterion, Based on AHP
The evaluation of the infrastructure alternatives concerning their performance in terms of each criterion is as follows. This is realized through pair-wise comparisons executed by the group of experts. In order to proceed with the pair-wise comparisons of infrastructure alternatives, the same methodological steps as were followed for the criteria pair-wise comparisons were implemented.
Following exactly the same process with the criteria, the alternatives are compared in pairs, using Saaty’s 9-level scale, but this time, in terms of preference (
Table 7). An indicative part of these pair-wise comparisons (6 pair-wise comparisons for each of the 6 criteria) is shown in
Table 8. It should be noted that, in certain cases, in MCA, it might be meaningful to compare two alternatives in terms of a particular criterion, but not in terms of another. When a comparison between two alternatives in terms of a criterion is not meaningful, due to incompatibility or indifference, they are treated as if they were “equal”, concerning their performance in terms of this criterion (attributed value: 1) [
70].
The input data on the basis of the experts’ answers for the infrastructure alternatives pair-wise comparison, as well as the geometric mean for each criterion, are shown in
Table 9. The normalized infrastructure alternatives pair-wise comparison matrices, the priority vectors, and the consistency control for each criterion, can be found in
Table 10.
4.9. Decision Matrix for the Application of VIKOR and TOPSIS for the Overall Ranking of the Alternatives
The priority vectors of the alternatives (
Table 10), calculated with regard to each criterion with AHP, and showing the ranking of the alternatives for each criterion, serve as input data for the decision matrix, shown in
Table 11. This is based on Equation (5), used for the application of VIKOR and TOPSIS, so that the final ranking of the alternatives can be derived. It should be noted that all the criteria are considered as benefit criteria (benefit functions), as the experts were asked which alternative is preferable to the other in the relevant questionnaires.
4.10. Application of VIKOR for the Overall Ranking of the Alternatives
Concerning VIKOR application, the f
*j and f
−j values (Equations (6) and (7)) are calculated on the basis of
Table 11:
f*j = maxi(xij) = {0.5780 0.4222 0.3278 0.3475 0.6207 0.4124}
f−j = mini(xij) = {0.0477 0.0565 0.0675 0.0702 0.0515 0.1408}
S
i, R
i and Q
i values for VIKOR (calculated according to Equations (8)–(11), for v = 0.5, adopting the criteria weights (priority vector W) of
Table 6, can be found in
Table 12. The corresponding ranking of the alternatives (minimum value → best alternative) can be also found in
Table 12.
According to
Table 12, the alternative P.C. (lanes dedicated to autonomous electric vehicles with plug-in charging stations beside the road, along the route) has the minimum Q
i, so it is first in rank. After checking the satisfaction of the two conditions [
32] of the acceptable advantage (0.8879 − 0.000 = 0.8879 > 1/(m − 1) = 1/(4 − 1) = 1/3 = 0.3333) and of the acceptable stability (the alternative P.C. is also first in rank by S
i and R
i), the alternative P.C. constitutes the optimum solution of new vehicle technologies in urban areas, according to the AHP-VIKOR model.
4.11. Application of TOPSIS for the Overall Ranking of the Alternatives
The weighted normalized decision matrix for the application of TOPSIS, shown in
Table 13, is calculated on the basis of
Table 11, according to Equation (12) and using the criteria weights (priority vector W) of
Table 6.
The values of A+ and A− for TOPSIS are calculated according to Equations (13)–(14), as follows:
A+ = {0.0318 0.1777 0.1179 0.0242 0.0261 0.0219}
A− = {0.0026 0.0238 0.0243 0.0049 0.0022 0.0075}
S
i+, S
i− and c
i+ values (calculated according to Equations (15)–(17)) for TOPSIS, as well as the alternatives ranking (maximum c
i+ value → best alternative), are shown in
Table 14.
As shown in
Table 14, the alternative P.C. (lanes dedicated to autonomous electric vehicles with plug-in charging stations beside the road, along the route), having the maximum c
i+, constitutes the optimum solution for new vehicle technologies in urban areas, according to the AHP-TOPSIS model.
4.12. Reveal of the Optimum Solution
According to the last step of the methodology described in
Section 3, given the convergence (in terms of the optimum solution) of the results derived from the two models, the alternative solution of lanes dedicated to autonomous electric vehicles, with plug-in charging stations beside the road, along the route, constitutes the optimum choice in terms of road infrastructure for autonomous electric vehicles in urban areas, within the framework of safety and sustainability.
5. Results and Discussion
The application of the two MCA models resulted in the identification of an optimum solution for autonomous electric vehicles in urban areas, integrating safety and sustainability aspects, this being the alternative of lanes dedicated to autonomous electric vehicles with plug-in charging stations beside the road, along the route.
However, apart from the final result, derived as regards the optimum solution, it is also worth commenting on individual results relating to the criteria weighting, as well as to the performance of each alternative in terms of each criterion, derived through the decision-aiding methodology implementation. According to the criteria priority vector shown in
Table 6, the criteria related to safety emerge as the most important ones. Specifically, public health, as it relates to electromagnetic radiation, and road safety are highlighted as the most important criteria, with the greatest weights among the other ones (42.07% and 35.95% respectively). Traffic congestion reduction (6.97%), infrastructure cost (5.50%), reduction in natural resources consumption due to low energy loss during charging (5.31%), and charging time (4.20%) are much lower in terms of importance.
According to the alternatives’ priority vectors in terms of each criterion, as shown in
Table 10, concerning the criteria of construction, operation and maintenance infrastructure cost, the first in ranking is the alternative of a mixed flow of conventional and autonomous electric vehicles, with the alternative of lanes dedicated to autonomous electric vehicles and stationary wireless charging following behind, the alternative of lanes dedicated to autonomous electric vehicles and plug-in charging stations beside the roadway coming next, and the alternative of dedicated lanes to autonomous electric vehicles and dynamic wireless charging along the route being the least preferred alternative for the criterion in question. As regards the criterion of public health related to electromagnetic radiation exposure, the alternatives of mixed flow and separate lanes with stationary plug-in charging are almost together in the first rank, while the alternative of separate lanes with stationary wireless charging follows behind, and the alternative of separate lanes with wireless charging has the lowest performance. Concerning the criterion of road safety, the alternative of a mixed flow has impressively low performance, while it does not make a significant difference for the other three alternatives (dynamic charging seems to have a slightly better performance, due to the fact that vehicle drivers will not have to stop beside the road to charge the vehicle). Concerning the criterion of traffic congestion, the alternative of circulation in separate lanes and dynamic charging comes first, with a significant difference from the last one, which is the mixed flow alternative, while the other two alternatives are in fact almost together in the second rank. As regards the criterion of charging time, the alternative of dynamic charging holds the first place, with impressively high performance; as expected, mixed flow with charging in existing stations is the least preferred, while separate lanes with plug-in charging and separate lanes with stationary wireless charging are ranked second and third, respectively. Finally, concerning the criterion of energy efficiency related to the charging system, the alternative of separate lanes and dynamic charging is the least preferred, while separate lanes with new plug-in charging stations hold the first place, and mixed flow with charging at existing stations and separate lanes are ranked second and third, respectively (this is to be expected, as energy loss is higher in the case of wireless, and especially dynamic, charging).
6. Conclusions
In the present study, infrastructure alternatives for autonomous electric vehicles are evaluated and prioritized, for the first time and at an early stage, due to the low maturity level of certain of these technologies (e.g., autonomous vehicles, dynamic charging, etc.), through the combined application of two hybrid multi-criteria analysis models, with the participation of experts. The experience drawn from conducting the research that is presented in this paper shows that the decision on the appropriate infrastructure for autonomous electric vehicles depends on the selection between alternatives with different maturity levels, in terms of technology readiness and real-life implementation. This fact increases the uncertainty in their evaluation. For example, there is relatively limited international experience in dynamic electric vehicle charging, which is until now at an experimental stage. The specific paper depicts the methodological framework that allows both for the comprehensive evaluation of different infrastructure alternatives within the current context and for the ability to update the evaluation in the future, taking into account the dynamic evolution of the relevant technologies, in order to support the decision-making process regarding the optimum solution relating to infrastructure for autonomous electric vehicles, in terms of safety and sustainability criteria.
Based on the current availability of data and information, plug-in (wired) charging facilities and the separate circulation of autonomous electric vehicles are revealed as the optimum solution. This selection is mostly due to the significantly high weight attributed to two aspects of safety for the users, i.e., public health, with the alternative of dynamic charging being linked to concerns due to exposure of the public to electromagnetic radiation, and road safety concerns, which relates to the avoidance of mixed traffic conditions for vehicles of different levels of automation.
In addition to prioritization and the optimum selection among the available alternatives, the methodology leads to the identification and prioritization of specific issues (e.g., electromagnetic radiation and road safety considerations) related to the overall concept of safety and sustainability that will emerge when the most technologically advanced of these alternatives will be ready for wide-scale implementation. Thus, the analysis offers useful insight to policymakers, highlighting important safety aspects that should be taken into account for the integrated and sustainable planning of transport infrastructure in the future.
It is therefore shown that these new technologies should be adopted with prudence and should focus on the appropriate design and operation of infrastructure in order to primarily ensure traffic safety and public health. Moreover, as technologies are advancing, the available infrastructure alternatives should be constantly evaluated concerning their safety and sustainability implications in a holistic, cross-disciplinary way that goes beyond the conventional traffic engineering and transport planning approaches.


 ,
, 

