Article

Spatially Explicit Assessment of the Feasibility of Sustainable Aviation Fuels Production in Brazil: Results of Three Case Studies

1
School of Mechanical Engineering, University of Campinas, 200 Mendeleyev, Campinas 13083-860, Brazil
2
School of Agricultural Engineering, University of Campinas, 501 Candido Rondon, Campinas 13083-875, Brazil
3
Geo Meridium, 777 Jorge Hennings, Campinas 13070-142, Brazil
*
Author to whom correspondence should be addressed.
Energies 2021, 14(16), 4972; https://doi.org/10.3390/en14164972
Submission received: 1 July 2021 / Revised: 30 July 2021 / Accepted: 4 August 2021 / Published: 13 August 2021

Abstract

:
For international civil aviation to be able to significantly reduce its greenhouse gas (GHG) emissions, the use of Sustainable Aviation Fuels (SAF) needs to be made feasible. This paper presents the results of an assessment of the feasibility of production of SAF in Brazil, considering three certified routes, based on the dedicated production of eucalyptus, soy, sugarcane and corn. The results presented here refer to the production of biomass in selected locations, aiming to reduce GHG emissions and minimise production costs. Considering that the opportunity costs of feedstocks were not observed, the minimum selling price (MSP) of SAF in the reference case was estimated at 13.4 EUR·GJ−1 for the production based on soybean oil (HEFA-SPK route), 21.0 EUR·GJ−1 for the production based on ethanol from sugarcane and corn (ATJ-SPK) and 32.0 EUR·GJ−1 from eucalyptus (FT-SPK). These values refer to SAF’s nth industrial plant and biomass costs that are compatible with the current agricultural yields in Brazil but which are also the highest. The MSP results are relatively low compared to the estimates available in the literature, but they do not show the strict economic viability of SAFs in the short- to medium-term, mainly because of the low prices of fossil fuels.

1. Introduction

As long as biomass is produced sustainably and its conversion is efficient, bioenergy can contribute significantly to the mitigation of greenhouse gas (GHG) emissions [1]. Bioenergy is still the main source of renewable energy and is the only one that can directly contribute to the supply of fuels and electricity, potentially with negative GHG emissions, as long as carbon capture, utilisation and storage (CCUS) technologies are applied to bioenergy systems. In the IEA (International Energy Agency) scenario that corresponds to maintaining the Earth’s temperature not exceeding 1.5 °C in this century, the demand for primary bioenergy is expected to increase from the current 60 EJ to 125 EJ in 2070 [2]. In 2011, when a special report of the IPCC (International Panel on Climate Change) was published, it was estimated based on a review of the scientific literature that the deployment levels of biomass for energy by 2050 could be in the range of 100–300 EJ·year−1 [1]. The same subject has been recently addressed by reference [3], indicating that biomass could provide between 70 and 360 EJ·year−1 also by 2050.
It is estimated that, in 2018, aviation contributed to 2.4% of the global CO2 emissions, while the overall GHG contribution was even higher due to induced aircraft contrails and other emissions [4]. Prior to COVID-19, ICAO [5] (International Civil Aviation Organization) estimated that, by 2045, the fuel consumption by the International Civil Aviation could be 2.2–3.1 times higher than the one in 2015, depending on the scenarios. In this sense, the civil aviation sector has set ambitious targets for reducing its GHG emissions up to the middle of this century: both ICAO and IATA (International Air Transport Association) mention that the GHG emissions must be reduced by 50% in 2050, regarding the estimated emissions of 2005 [5,6].
One of the options for reducing GHG emissions is the use of fuels with a lower carbon footprint, displacing—even partially—conventional petroleum-based Jet A-1 fuel. These alternative fuels will be classified as Sustainable Aviation Fuels (SAF) if they meet the supply chain sustainability criteria defined by ICAO CORSIA (Carbon Offsetting and Reduction Scheme for International Aviation) [7].
As the main motivation for producing alternative jet fuels is the reduction in GHG emissions, one of the principles of the sustainability criteria is related to lower carbon emissions on a lifecycle basis. In the first moment (i.e., the pilot phase of ICAO CORSIA), only two principles need to be fulfilled: the one related to GHG emissions (Theme 1) and a second to the carbon stocks (Theme 2). However, by the end of in the pilot phase, other themes should be included in the sustainability criteria, addressing aspects such as water; soil; air; conservation (biodiversity); wastes and a set of socioeconomic aspects (e.g., human and labour rights, land use and water use rights, local and social development and food security) [7]. The principle related to GHG emissions establishes that eligible fuels shall achieve reductions of at least 10% compared to the baseline life cycle emissions for conventional aviation fuel (defined as 89 gCO2eq.MJ−1) [7]. Obviously, an aviation company will be interested in meeting its GHG goals at the lowest possible cost, with low sustainability-related risks and assured supply. For additional information, see reference [8].
This paper presents an assessment of three certified routes for the sustainable production of biofuels (SAF) in Brazil. These three routes, certified by ASTM D7566 (American Society for Testing and Materials), are FT-SPK (Fischer-Tropsch conversion to produce synthetic paraffinic kerosene from gasified biomass) based on planted eucalyptus, HEFA-SPK (hydro-treated esters and fatty acids) based on soybean oil and ATJ-SPK (alcohol-to-jet) based on anhydrous ethanol produced from sugarcane and corn. The assessment presented here is based on the assumption that dedicated biomass would be produced for SAF production. This paper follows a recent publication by the same authors [8], in which the conditions for the sustainable production of eucalyptus, soy, sugarcane and corn in Brazil were evaluated.
Both papers are based on a geospatial database (SAFmaps) that was built in the context of a project with the aim of providing information to stakeholders who would be interested in the production of SAF. SAFmaps is a publicly available database and provides information on eight feedstocks (six of them crop-based).
This paper is organised into five sections, including this introduction. The following section provides background information about the three production routes addressed here. Section 3 describes the methodology and the assumptions for the assessment. Section 4 presents the results and the related discussion. Finally, the conclusions are presented.

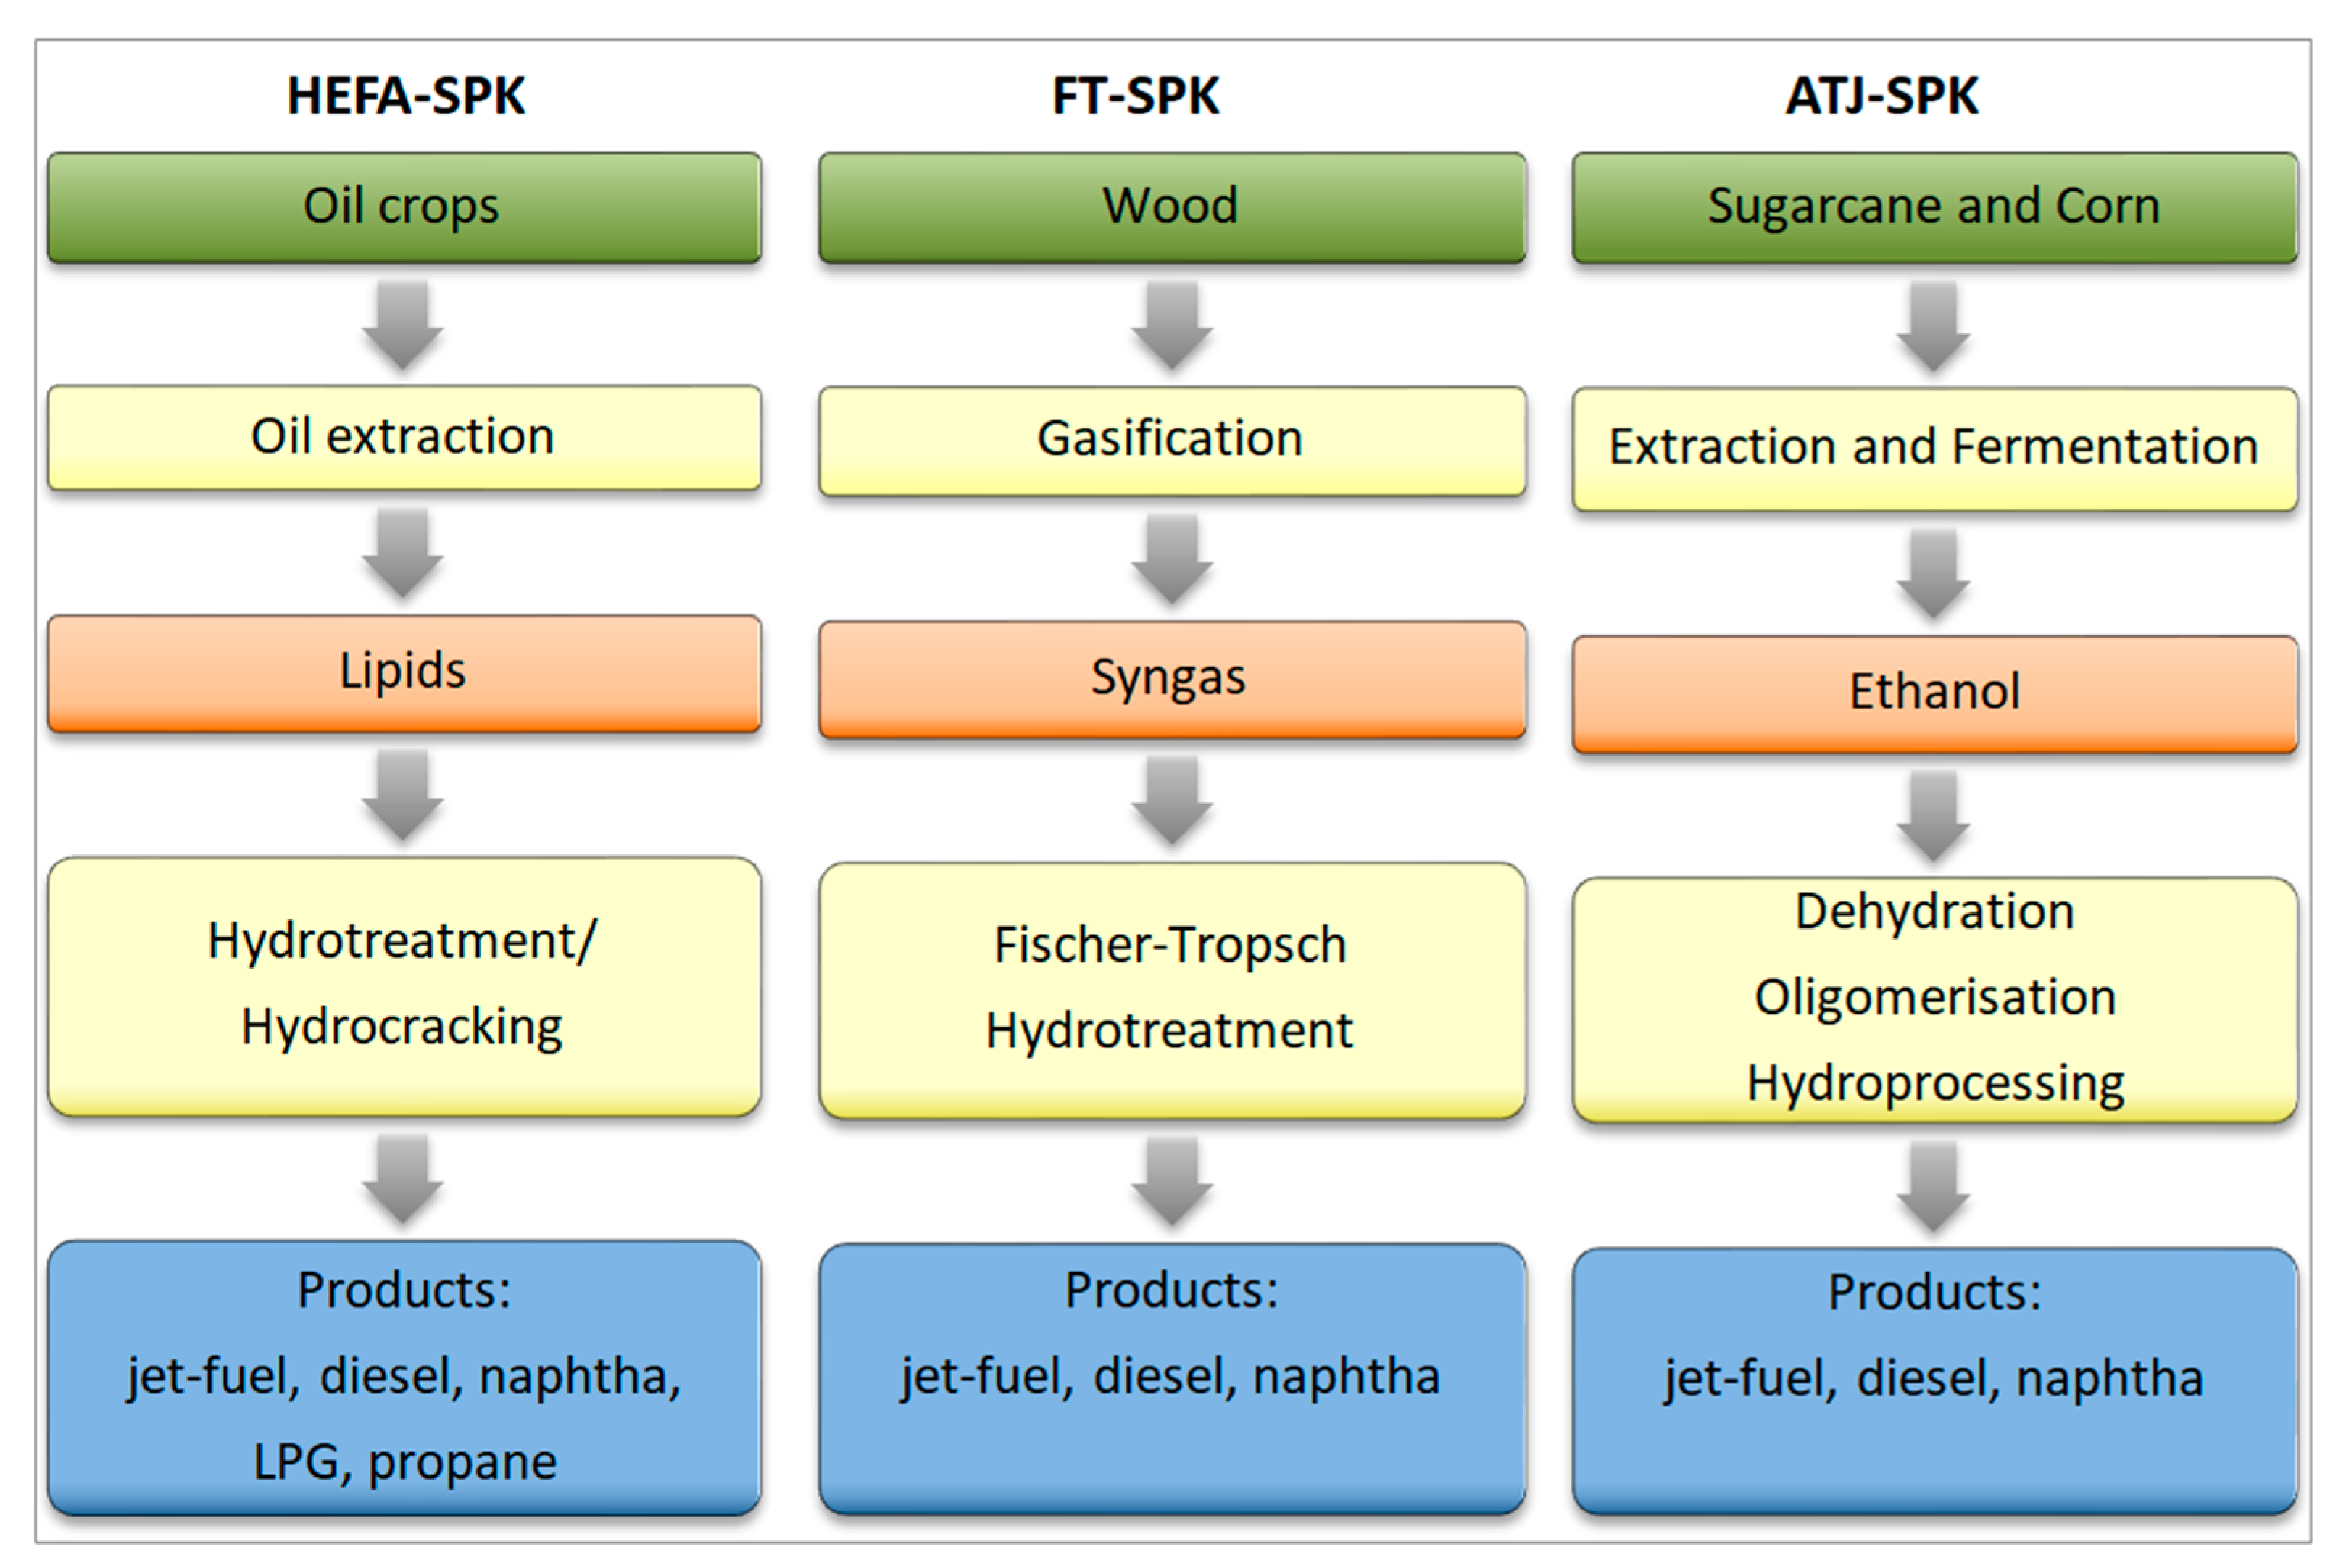
2. Routes for SAF Production

Conventional fuels for aviation turbines consist of refined hydrocarbons derived from fossil sources, with variable chemical compositions. The composition depends on the raw material used in refining, but it is crucial to meet the strict specifications regarding its physical and chemical properties. Kerosene-type jet fuels consist of hundreds of different components ranging between 8 and 16 carbons, with n-paraffins, isoparaffins, cycloparaffins and aromatics as the major components [9].
The rigorous safety standards and procedures adopted by the commercial aviation industry impose stringent quality requirements for the fuel used to power aircrafts. The most widely used standard to define the kerosene-type fuel specifications for aviation turbine fuels is the one by the American Society of Technical Materials, ASTM D1655. Due to the strict quality control and economic concerns, the introduction of alternative fuels must follow the “drop-in” concept. This means that the alternative fuel must be interchangeable and compatible with the conventional jet fuel when blended so that no adaptations are needed for the aircraft/engine fuel system or the fuel distribution network [10].
To complement the ASTM D1655 standard, in 2009, ASTM introduced a specific standard for alternative aviation fuels: the ASTM D7566. This standard addresses the specifications for aviation turbine fuels that have synthesised hydrocarbons. Thus, alternative fuel production routes need to be certified by ASTM D7566, and each time a new process is certified, the standard is complemented with a new annex [11].
In 2009, the first certified conversion process was announced, the FT-SPK, using as raw material coal, natural gas or biomass; the use of this alternative fuel is currently limited to a 50% blend with conventional jet fuel (volume basis). The specification of the blending limits for these alternative fuels is part of the certification procedure. The HEFA-SPK was approved in 2011, followed by the routes of HFS-SIP, ATJ-SPK and CHJ. FT-SPK with an increased aromatic content (FT-SPK/A) has also been certified.
In 2020, there were eight conversion processes approved for the production of aviation fuels in accordance with ASTM D7566 (seven of them) and ASTM 1655 (the one related with coprocessing). Table 1 summarises the information of these routes. In each case, the commercial initiatives listed in the table correspond to the companies that are involved with the production of alternative jet fuels.
Technologies that convert biomass into alternative aviation fuels rely heavily on the characteristics of the feedstock. According to reference [12], oilseeds are converted to bio-jet fuels through hydroprocessing technologies, including hydrotreating, deoxygenation and isomerisation/hydrocracking. Catalytic hydrothermolysis (CH) is an example of processes that have also been developed to treat triglyceride-based oils. Solid-based feedstocks can be converted into biomass-derived intermediates (such as syngas, alcohols, bio-oils and sugars) through biochemical or thermochemical processes. Finally, the intermediates can be further converted to biofuels via a variety of synthetic, fermentative or catalytic processes.
A crucial point in converting biomass to drop-in biofuels is the removal of oxygen present in the feedstock, as oxygen is undesirable in the final product. Aspects such as biofuel compatibility and reactivity are important, but also, the reduction of energy density is a matter of concern [13].
In the production of drop-in biofuels, the hydrogen–carbon (H/C) ratio must be raised to the typical range of hydrocarbons, such as diesel, jet fuel and gasoline (H/C close to 2). In this sense, the greater the effective H/C ratio (Heff/C) of the feedstocks, the less hydrogen is needed in the industrial process. Sugars and cellulosic biomass have low Heff/C ratios, and lipids have a higher one. Therefore, biofuel production through the oleochemical platform requires fewer hydrogen addition steps than the thermochemical conversion processes based on lignocellulosic materials and biochemical processes for sugar conversion [13]. As a consequence, the availability of hydrogen (as well as its sustainability and cost) should be an important aspect of the future production of drop-in biofuels.
Here, it is assumed that the FT-SPK route would not require an external hydrogen supply, as the amount that would be obtained in gasification and gas synthesis (syngas) would be sufficient for the subsequent conversion to SAF [12,14].
It was assumed that the production of sustainable aviation fuels (SAF) would be in industrial units besides oil refineries, where a regular and large amount of hydrogen is usually available. Figure 1 shows the scheme of the supply chain and production of bio-jet fuel (SAF), and other fuels, based on the three routes assessed here. Lipids (here, soybean oil), syngas and ethanol are the intermediate products. As will be described in the following section, the assumption is that soybean oil and ethanol would be produced close to where the feedstock production would take place and transported to the SAF plant. In the case of the FT-SPK route, wood (here, eucalyptus) would be transported to the SAF plant, and there, it would be gasified. Further information about these routes can be found in references [9,12,14].
Concerned with the state-of-the-art status of each of the three SAF production routes, reference [15] mentioned that HEFA-SPK is at a more advanced stage, with both the TRL (Technology Readiness Level) and FRL (Fuel Readiness Level) at the maximum level (9), i.e., at the commercialisation stage. At the time of the assessment, the FT-SPK route had a TRL = 6–8 and FRL = 6 to 7, which would indicate a transition from the demonstration to the commercialisation stage. Finally, the route ATJ-SPK was evaluated with a TRL = 7 to 8 and FRL = 7, which could also be interpreted as at the same transition stage. All three routes have several developers involved [16], as can be seen in Table 1.

3. Methodology and Assumptions
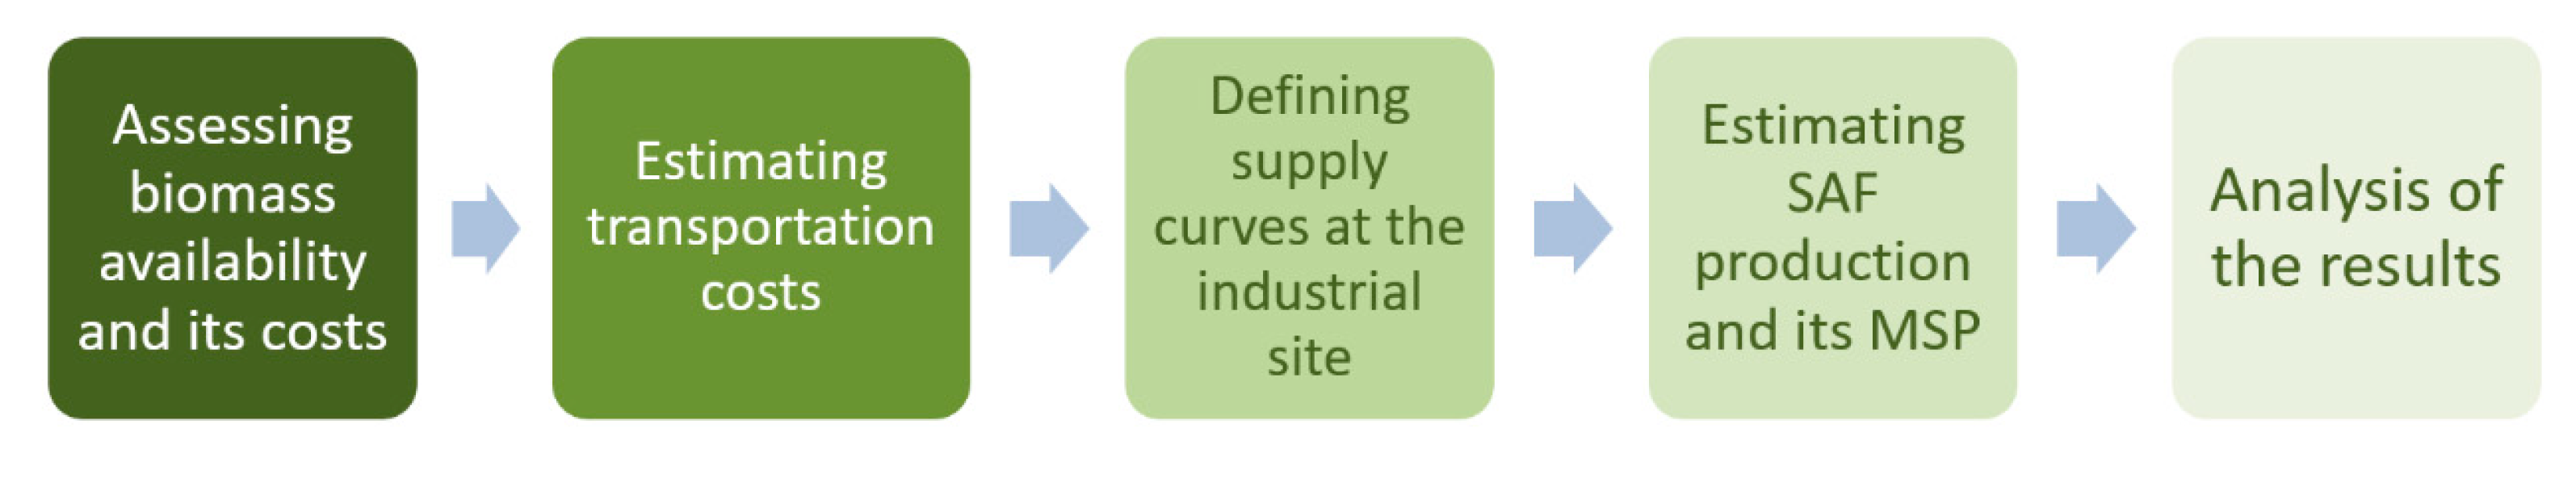
3.1. Methodology

Figure 2 indicates the main steps of the methodological procedure applied to assess the feasibility of producing SAF in Brazil based on the three routes. The first step corresponds to evaluating the potential biomass availability in specific locations and its cost as a feedstock for the production of SAF.
The assumptions regarding the transport of feedstocks from the field to the industrial unit or from the units that allow their conversion to intermediates (i.e., soybean oil and ethanol) could be crucial to setting the feasibility of SAF production. The feasibility of SAF is evaluated based on its minimum selling price (MSP).

3.2. Assessing Biomass Availability

The potential availability of a crop-based feedstock is estimated based on a broad suitability assessment, combined with site-specific estimates of the potential yields and production costs. The study is based on the information available in the platform SAFmaps, and the geographic coverage corresponds to 12 Brazilian states, which represent about half of the country’s total area.
Details of the hypotheses used for assessing the suitability of eucalyptus, soybean, sugarcane and corn were presented in reference [8]. For the assessment of these crop-based feedstocks, only a rainfed cultivation was considered. Essentially, suitability was defined based on the edaphoclimatic requirements of each crop-based feedstock, with a single classification of soil suitability used for all biomass [18,19]. As described in reference [8], both the spatial distribution of the estimates of suitability and of the agricultural yields was validated vis-à-vis the information available for Brazil. As for biomass costs, the estimates were based on an extensive literature review and on representative cost structures that are valid for the main production regions in Brazil [20]. The estimated costs were compared with the information available for different regions of the country, and it was concluded that the results are good. In the SAFmaps database, there is information about the error analysis performed for the yield and cost estimates. This paper does not explore an error analysis on the estimates of the biomass and intermediate production costs.
It was assumed that biomass production for SAF could only occur by displacing pastures (in this sense, satellite images identifying land use and land cover in 2018 were used to define the target areas [21]). Taking into account the aim of producing sustainable aviation fuels (SAF), in the assessment, the total exclusion of two sensitive biomes (Amazon and Pantanal) was imposed, as well as the exclusion of conservation units, indigenous reserves and areas that should not be used for biomass production, in accordance with the CORSIA’s sustainability criteria.
It is clear that the estimated costs are impacted by the predicted yields. Figure 3 illustrates the results of the estimated sugarcane production costs in a five-year cycle, after the imposition of the restrictions mentioned above. Similar maps for soybean, eucalyptus and corn are presented in the Supplementary Materials.

3.3. Estimating Transportation Costs

Here, it was assumed that SAF production could take place at Refinaria Henrique Lage (REVAP) in São José dos Campos (SP). REVAP is the largest producer of jet fuel in Brazil (about 30% of the total production in recent years [22]) and is connected to the main international airport (Cumbica in Guarulhos and, also, in the State of São Paulo) by a pipeline.
Other important assumption is that the transport of eucalyptus or intermediaries (soybean oil and ethanol) to the SAF production unit would take place by rail or pipeline (in the case of ethanol, depending on the location of the distilleries), aiming at both cost and carbon footprint reductions.
The distance between the origin and the destination was obtained, and the costs were estimated based on the assumption that the transport costs by rail were 50% of the costs of transport by road for the same distance and that the transport costs by pipeline were 20% of the road costs for the same distance [23,24]. The impact of these assumptions was evaluated in a sensitivity analysis. The details of the procedure for estimating the transporting costs are presented in the Supplementary Materials.

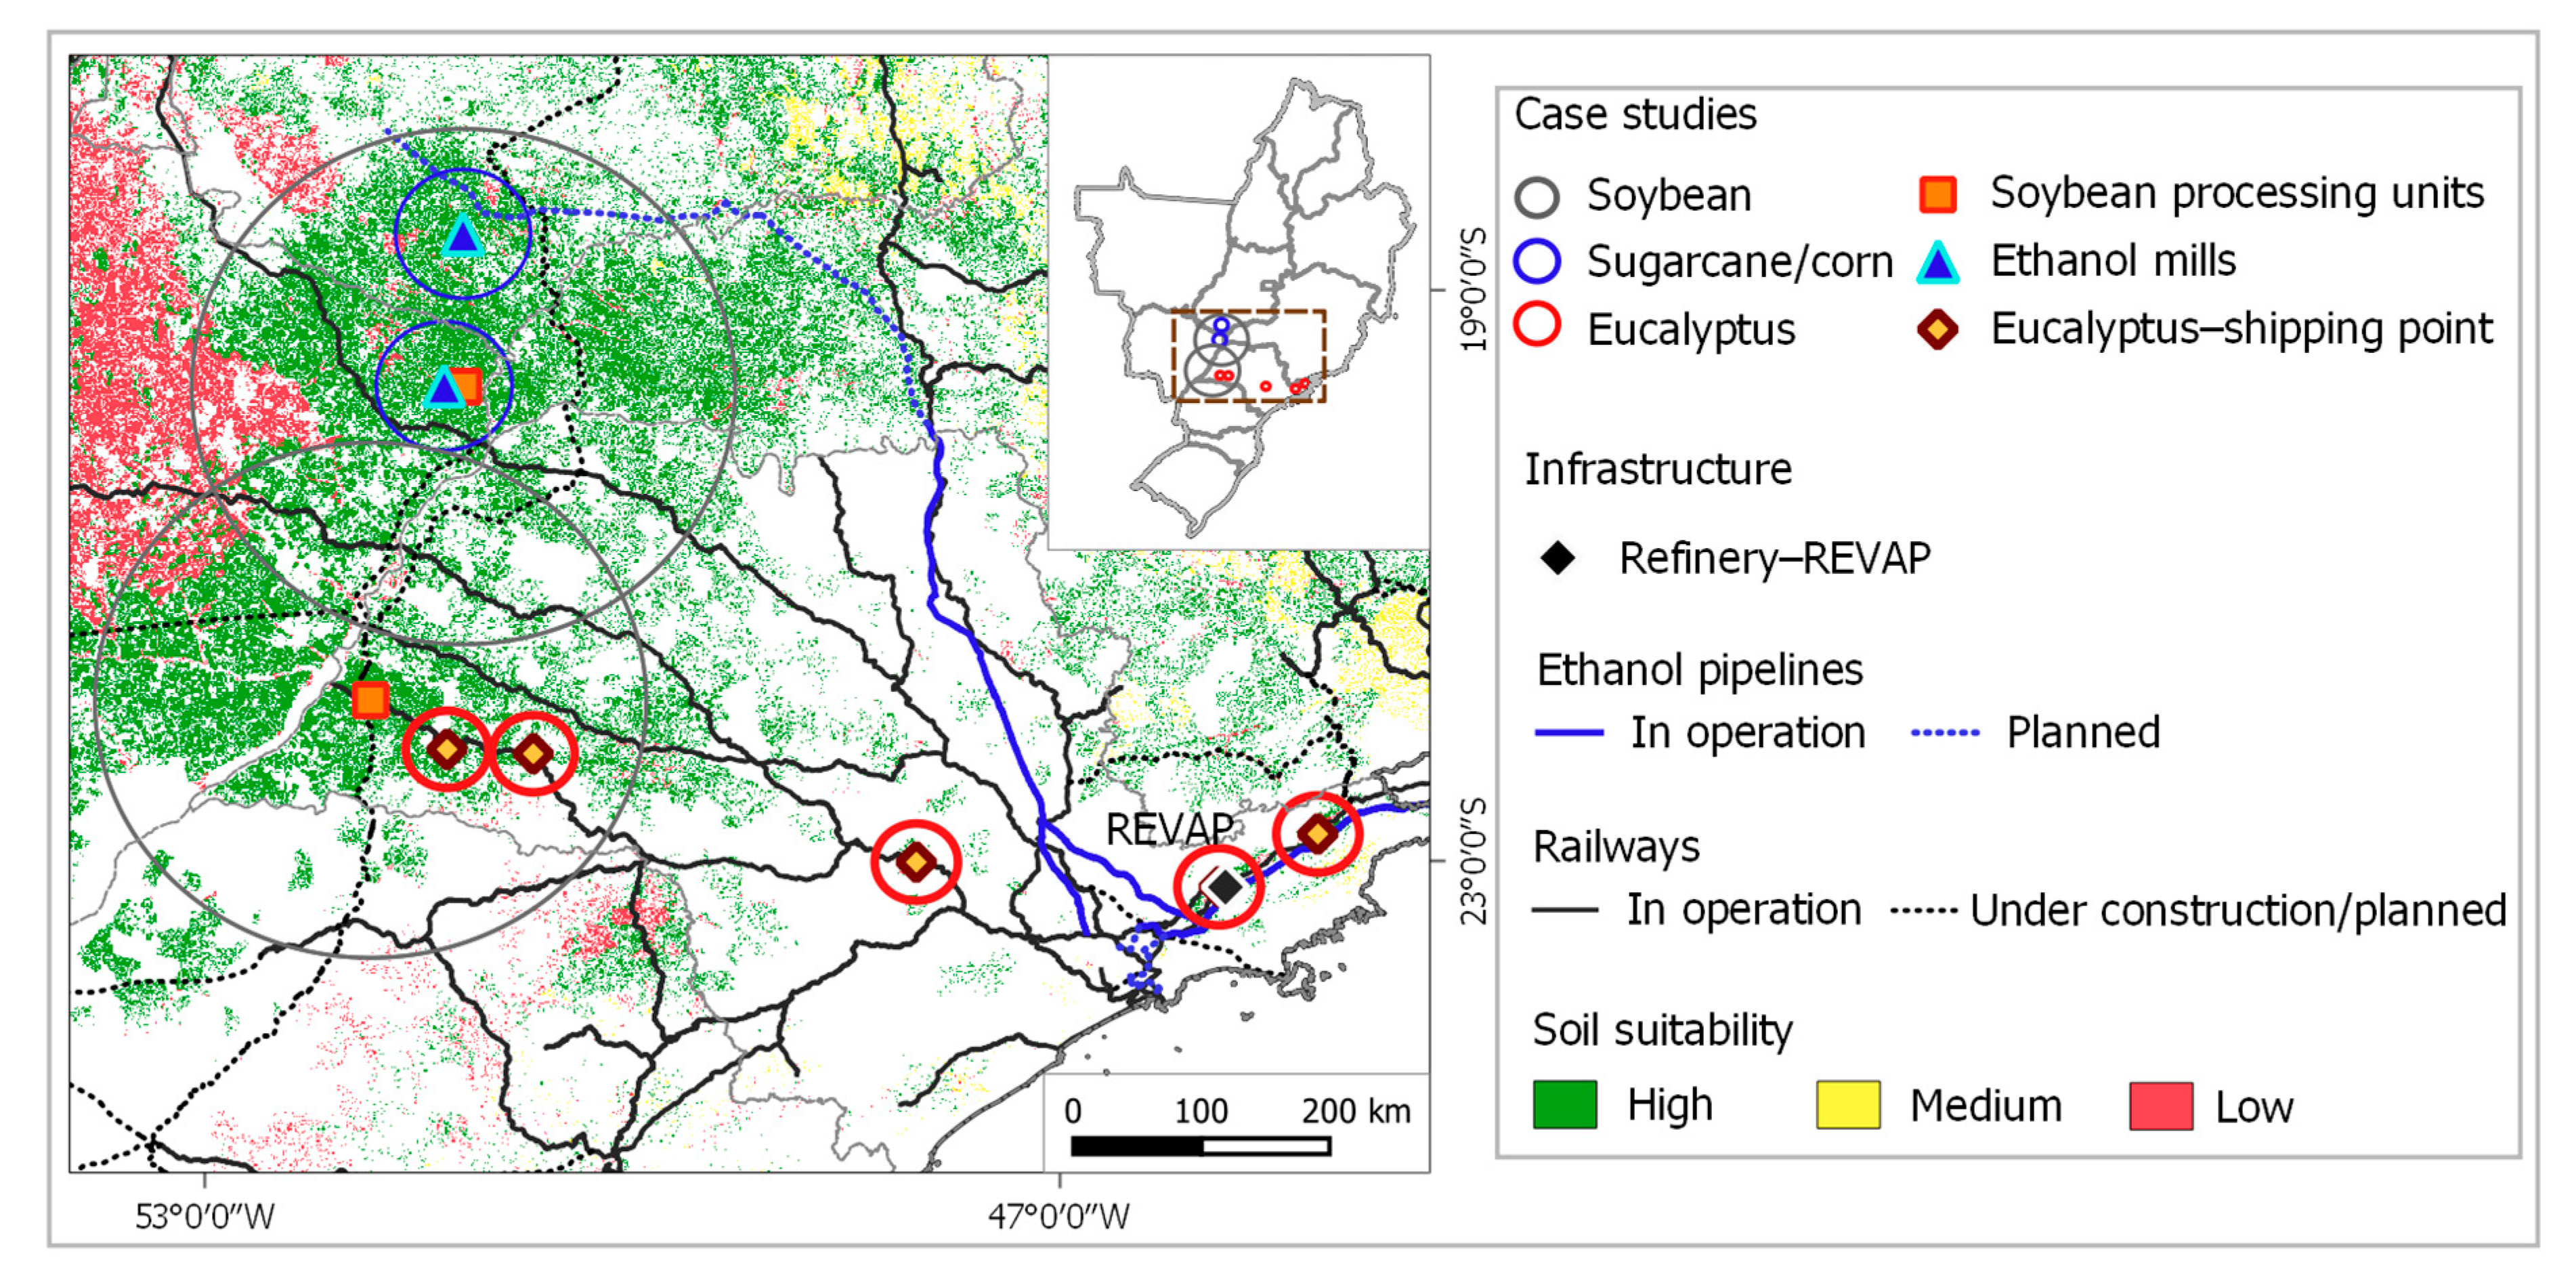
3.4. Defining Biomass Production Sites

In the following step, the map of the estimated production costs for each feedstock (in a sense, the production cost is the synthesis both of the suitability and yield estimates) was combined with the maps of the existing and planned transport infrastructures. The rationale is that the areas with the lowest estimated costs of biomass production and those close to the transport infrastructure are the priority for the case studies aimed at assessing the feasibility of producing SAF.
Figure 4 shows the locations chosen for the production of biomass in the case studies, combined with the map of the railways and the ethanol pipeline that would allow transport to REVAP; the information is presented over the soil suitability map. The soil suitability map is common for all feedstocks and serves here to indicate in a single figure, as a proxy, the most suitable areas for biomass production.
Five eucalyptus production sites were chosen for the development of the case study related to the FT-SPK route, all of them located in the State of São Paulo (SP): Espigão and Quatá on the west side of the state, Conchas more to the centre and São José dos Campos and Guaratinguetá on the east side. São José dos Campos is where the oil refinery is located, and in this case, the transport of wood from the forest to the refinery would be by truck.
For soy, the two production sites chosen are Paranaíba in the southeast of Mato Grosso do Sul (MS) and Presidente Venceslau in the west of São Paulo. Finally, for sugarcane and corn, which will be the inputs for the production of ethanol, the options are Paranaíba (MS) and Caçu in the south of Goiás (GO). The ethanol produced near Caçu would be transported by a pipeline to the SAF industrial unit.
For the sake of simplicity, the production areas were defined as a circle around a reference point. The centre of the circles would be the shipping point in the case of eucalyptus (or even REVAP, in the case of production around SJ Campos), where soybeans would be processed, or the ethanol distilleries (in the case of sugarcane and corn). The radii of the circles of influence were defined as 30 km for eucalyptus, 200 km for soybeans and 50 km for sugarcane and corn; in order to simplify the analysis, it was assumed that sugarcane would be produced near the centre of the circle and corn on its edges. Nearby the production sites, the biomass would be transported by truck.
In the procedure for estimating the areas for biomass production, a pixel-filtering process was imposed. The rationale is that the mechanisation of planting and/or harvesting requires minimal contiguous areas. The filtering imposed was for the following minimum areas: 50 hectares for eucalyptus, 100 hectares for soybean and sugarcane and 100 hectares for corn, as it was assumed that corn must be the second crop in the soybean area.

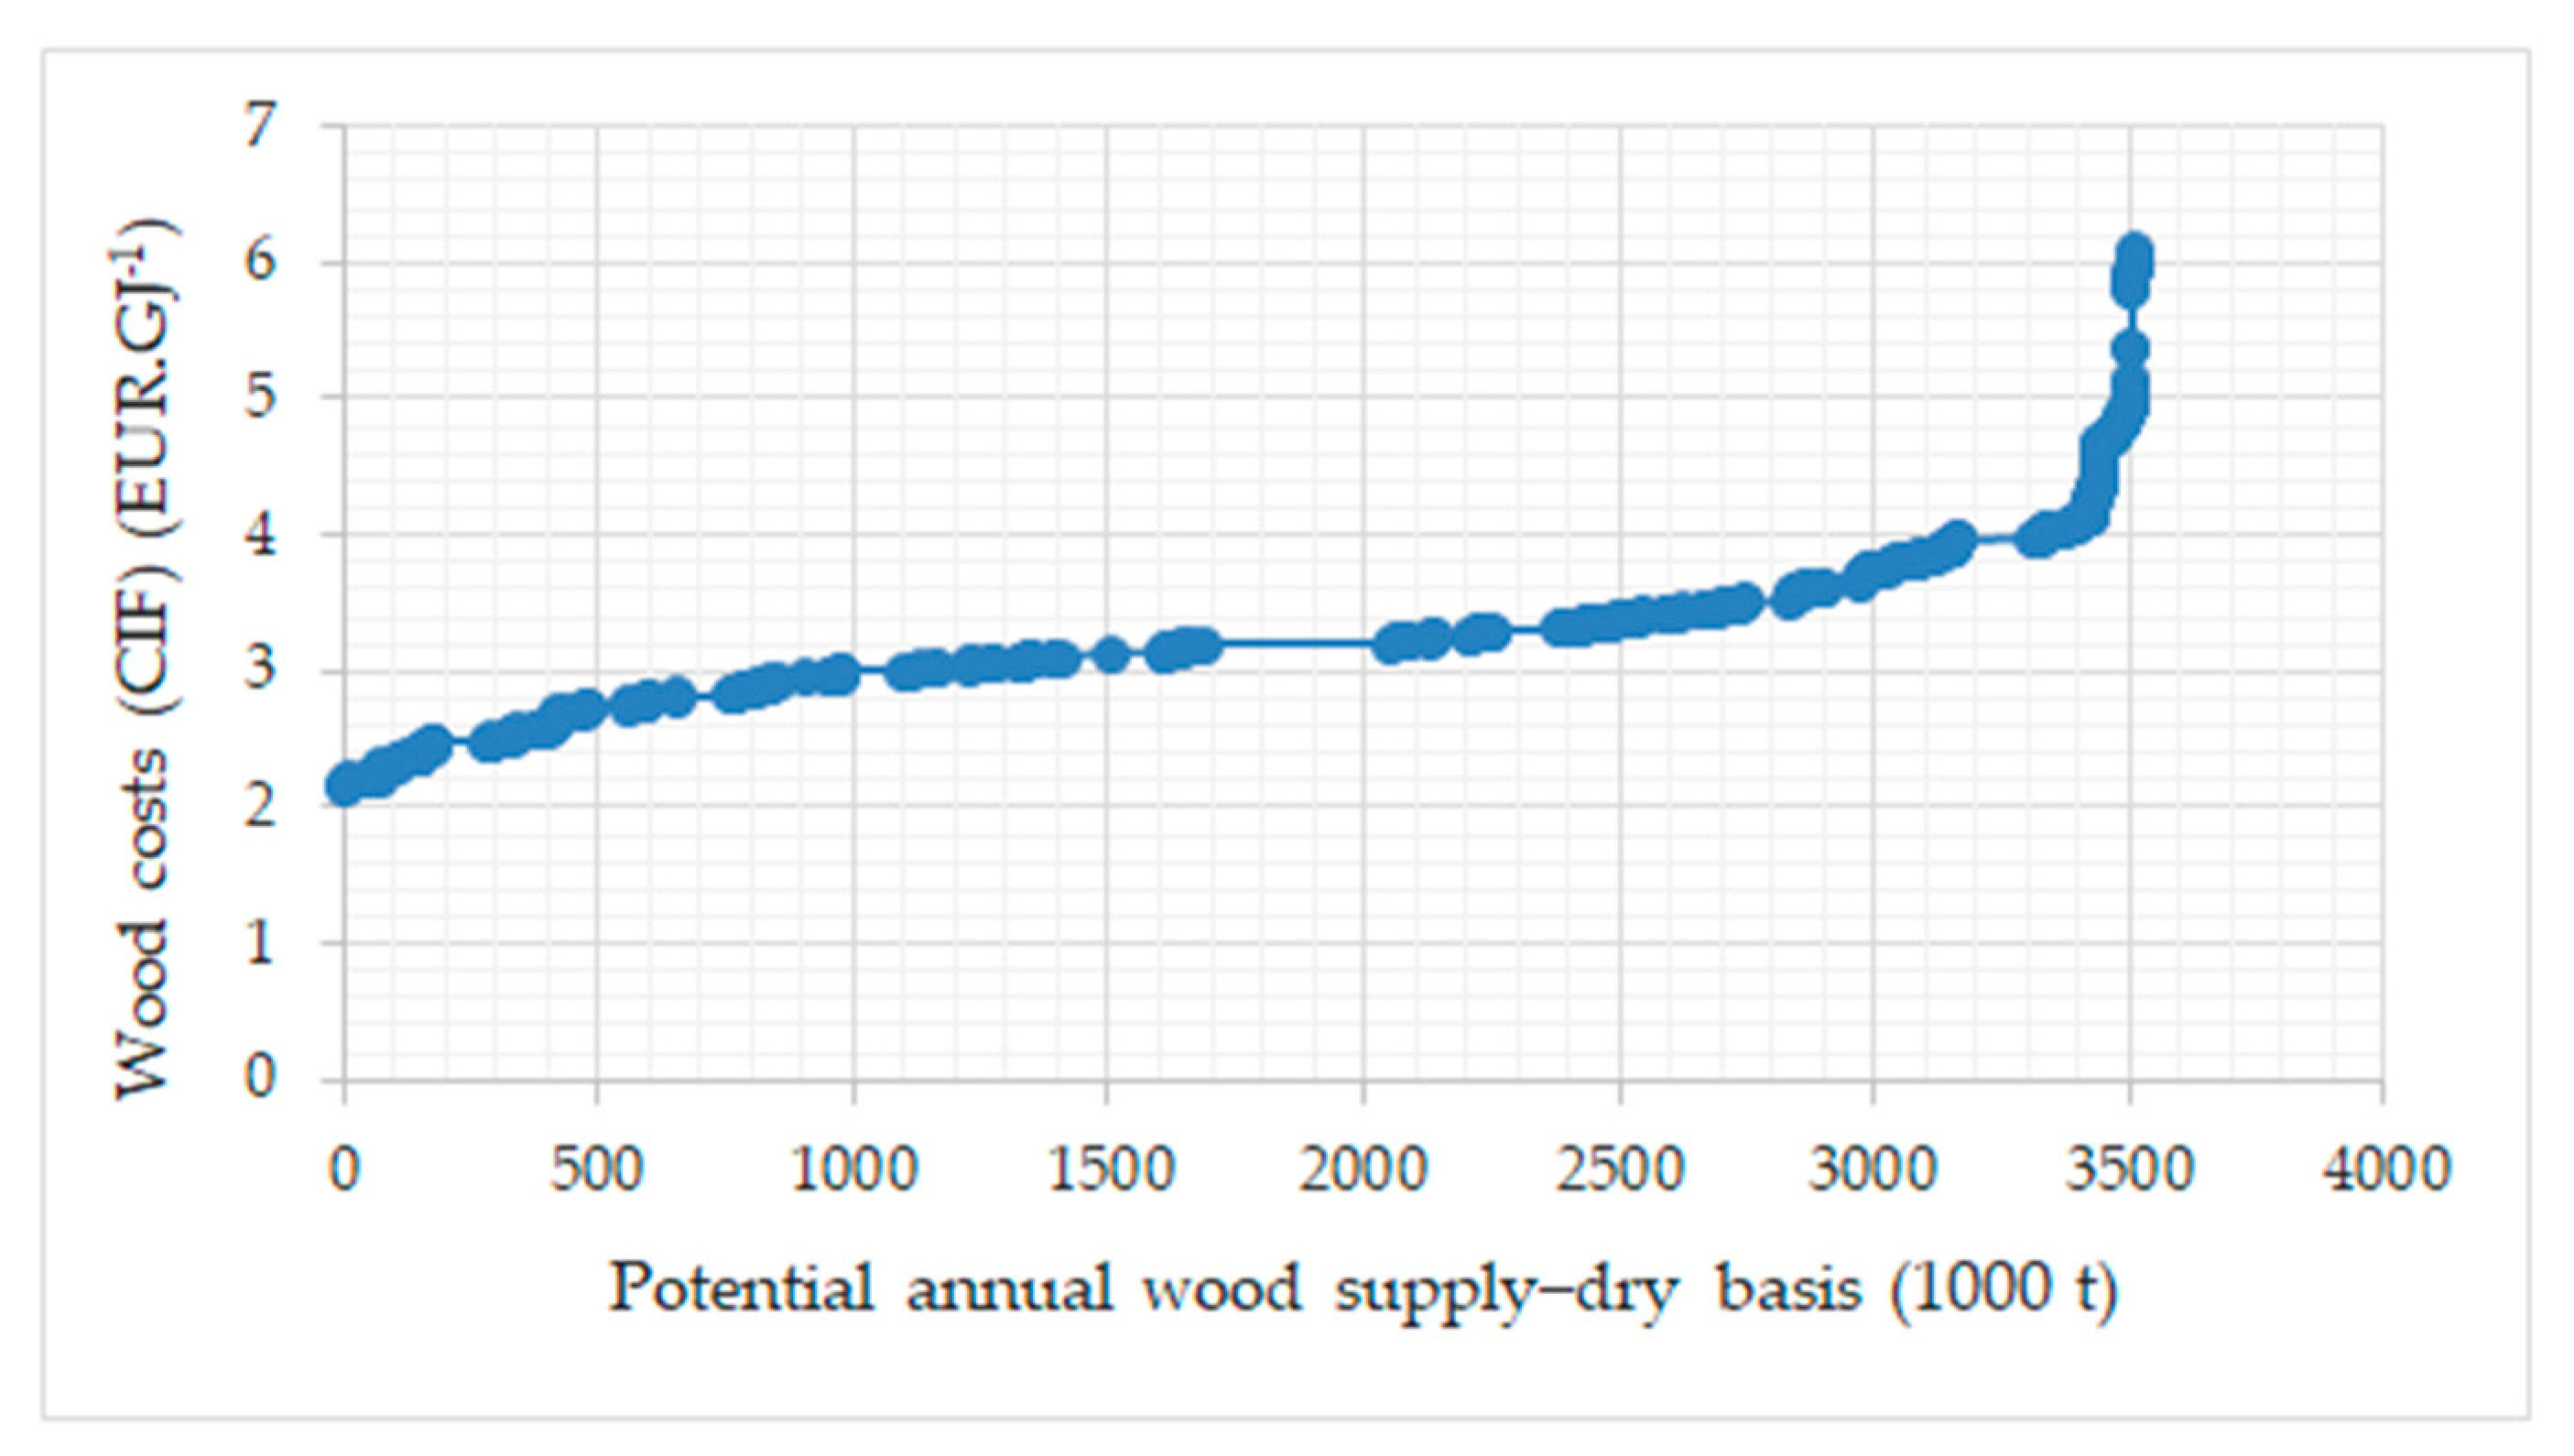
3.5. Biomass Supply Curves

For each feedstock, the annual supply curves were estimated. In the case of soybeans, the estimate was done in the centre of the influence circle, where the oil would be extracted. In the case of sugarcane and corn, the supply curve was estimated at the ethanol distillery. Due to the SAF production capacities considered (see Section 3.6), both the soybean oil and ethanol production at each production site are sufficient to meet demand, and therefore, the supply curves were not estimated at the SAF industrial unit.
In the case of eucalyptus, as the production in each of the five locations considered is relatively small, the supply curve was estimated at the SAF production unit.

3.6. Industrial Units and Assumptions

The total investment costs (TIC) of the SAF industrial units were taken from reference [25], and they corresponded to the nth plant of a co-locating facility (i.e., sharing as much infrastructure as possible with the existing industrial plants). A location factor of 1.14 [26] was applied to these values to take into account, more realistically, the costs in Brazil. The costs presented by reference [25] were not for the same production capacity assumed here in the base case, and therefore, a scale factor of 0.6 was assumed in the input (feedstock) capacity for estimating the TIC.
The industrial yields, the input requirements and operation and maintenance (O&M) costs were taken from references [17,25]. More specifically, this includes the costs of labour and the inputs (e.g., hydrogen, natural gas, etc.), and in this sense, this simplified assumption means that some specificities of the Brazilian case are not adequately reflected. The impacts of this simplification were explored in the sensitivity analysis (see Section 4.4). The economic assessment was done assuming an annual discount rate of 10% in all cases. The same assumptions presented by reference [25] were used for the utility prices, financing scheme, investment schedule, construction time and useful life. The tax rates were also the same as presented in reference [25]. In this sense, once more, the results of the evaluation were very likely not completely consistent with the Brazilian reality, but this was done in order to establish a basis for comparison with the results presented in the literature; either way, the impact of this simplification should be small. The parameters assumed in the economic assessment are presented in the Supplementary Materials.
Table 2 presents the parameters of the SAF units considered in the base case for each of the three routes studied. The base case was defined for a given SAF production capacity in order to explore a comparison between the three routes. The scale effects were further explored.
In the case of the FT-SPK route, reference [25] considered a unit with 2000 t·day−1 (i.e., 83.3 t·h−1) (dry basis) as the input capacity, which, in practice, corresponds to the input of the lignocellulosic feedstock to the gasifier (pressurised, oxygen-blown, directly heated, fluidised bed). An analysis was presented in reference [27] on the feeding capacity of biomass gasifiers, and 120 t.h−1 was mentioned as the predicted maximum, with the highest values of the existing (or predicted) units a few years ago well below this. Here, conservatively, 100 t·h−1 was assumed to be the feed capacity of a biomass gasifier (2400 t·day−1), which resulted, based on the assumed technical coefficients, in the production of 408 t·day−1 of hydrocarbons, which was 61.2 t·day−1 of SAF.
To define an adequate basis for comparison, it was assumed that four modules of the FT-SPK base unit would be built on the same site, resulting in the need for 9600 t·day−1 of dry wood and the production of 244.8 t·day−1 of SAF. In order to compare the routes for the same SAF production capacity, the capacity of the HEFA-SPK route was scaled down in relation to the reference, while the capacity of the ATJ route was scaled up (see Table 2).
For one module of the HEFA-SPK or ATJ-SPK routes assumed in the case (or four modules of the FT-SPK route), the annual production of SAF would contribute an amount equivalent to 1.3% of the total consumption of jet fuel in Brazil in 2018 or 3.0% of the consumption due to international flights departing from Brazil that year [22].
The soybean oil extraction costs were taken from reference [28] and updated to 2018. The compatibility of the soybean processing capacities was checked with reference [29]. The extraction costs were allocated between oil and meal in proportion to the mass of each product.
To estimate the production costs of anhydrous ethanol, a distillery with a capacity of 542 × 103 m3·year−1 was considered, requiring a supply of 4 × 10⁶ t·year−1 of sugarcane and 526 × 103 t·year−1 of corn. The parameters used in the estimation were based on reference [30].

3.7. Limiting Production to Degraded Pastures

It has been argued that biomass production on degraded land is an option to reduce the impacts of induced Land Use Change (iLUC) and that this should be encouraged [31,32]. Based on an assessment of the level of degradation in pastures in Brazil, which is based on satellite images [33], here, this option was explored in refining the results. This was done for assessing the impacts of soybean, sugarcane and corn production in the surrounds of Paranaíba (MS).
Reference study [33] was based on the definitions presented by references [34,35] and, also, on the remote sensing classification presented by reference [36]. In references [34,35], the agronomic and biological aspects were considered. Agronomic degradation is related to the regeneration of native vegetation in pastures, while the biological aspect is due to the loss of soil fertility and the existence of exposed soil.
A classification of pastures into four groups was presented in reference [33]: no degradation, slight, moderate and severe degradation. The classification of pastures into degradation levels was obtained from the stratification of a vegetative vigor index based on images from 2018 [36]. Here, the assessment was based in the assumption that the production would be limited in displacing pastures with degradation levels classified as moderate and severe.

4. Results and Discussion

4.1. Supply of Eucalyptus

Figure 5 shows the estimated wood supply curve at REVAP, based on the potential production in the five sites considered and the transport by rail from four of them (wood produced around SJ Campos would be transported by road). The maximum supply would be 3.5 × 10⁶ t·year−1 (dry basis), with the CIF costs varying from 2.2 to 6.1 EUR·GJ−1 (average 3.5 EUR·GJ−1 ± 0.84 EUR·GJ−1). The estimated production in these five sites corresponds to 4.9% of the total commercial production of eucalyptus in 2018, excluding the amount used for charcoal production [37].
For a single module of the FT-SPK plant, the best wood supply option would be production close to the SAF industrial unit, i.e., in SJ Campos and Guaratinguetá (covering almost two-thirds of the required supply). For four modules, production at all five locations will be required, and in this case, Espigão, where the potential is larger, would be the main supplier. Table 3 presents the estimated contributions from each of the five locations.
Due to the low energy density of wood, transport has a significant impact on the CIF costs at the SAF plant. For example, the transport of wood by rail from Espigão to REVAP (about 790 km) represents 1.36 EUR·GJ−1 of the CIF costs, while the weighted average cost at the point of shipment is 2.49 EUR·GJ−1. This brings up the discussion about where to install the SAF plant in order to minimise the distances from the wood planting sites (see Section 4.8).

4.2. Supply of Soil Oil

The estimated costs of soybean oil at REVAP are quite similar for the two production sites considered. The estimated weighted average cost of grain in the centre of the production area is a little lower in Presidente Venceslau (SP) (about 1.5%), as is the cost of transport from that region. However, as the difference is almost insignificant, the results for the production around Paranaíba (MS) are presented in the analysis that follows. The estimated maximum production of soybean in these two sites is quite large in comparison to the total Brazilian production in 2018 [37] (about 17%).
To assure the annual supply of soybean oil to the reference HEFA-SPK plant (see Table 2), the average estimated CIF cost at REVAP is estimated at 5.15 EUR·GJ−1 (varying from 5.0 to 5.3 EUR·GJ−1). In each region, it is possible to produce more than twice the oil required by the reference SAF plant, but the costs increase significantly in the last quartile (average CIF cost 8.11 EUR·GJ−1). The annual need for soybean oil for a module of the HEFA-SPK route (see Table 2) is equivalent to 7.6% of all soybean oil production in Brazil in 2018 [29].
The estimated cost of the dedicated soybean oil production is significantly lower than the opportunity cost of the product (about three times lower if considering the average market prices in 2018).

4.3. Production and Supply of Anhydrous Ethanol

It was assumed that anhydrous ethanol would be produced in new distilleries, combining sugarcane and corn, and these feedstocks would be produced in new areas of cultivation. The production of ethanol from corn is a new issue in Brazil. In the last harvest season (2020/2021), the total ethanol production was 32.8 × 10⁶ m3, 3.02 × 10⁶ m3 from corn [38]. In most cases, corn is complementary to sugarcane for ethanol production, and the objective is to expand the annual capacity factor, using corn in regions where local market prices are low.
In the base case (see Table 2), an industrial unit on the ATJ route would annually demand the equivalent of 2.6% of the anhydrous production in Brazil in 2018 [22].
Under the conditions mentioned above, the cost of the combined production (corn + sugarcane) tends to be lower than that of the production from sugarcane alone. The obtained results of the ethanol production costs indicate that, with the combined production, these can be 11–18% lower, depending on the production capacity; the difference is smaller in larger units.
The costs of anhydrous ethanol production were estimated at 11.36 EUR·GJ−1 in the case of the production in Paranaíba (MS) and 11.88 EUR·GJ−1 in the case of Caçu (GO). The transport from Paranaíba to REVAP by rail (about 600 km) adds 0.69 EUR·GJ−1, while the transport by the pipeline from Caçu (about 920 km) adds 0.49 EUR·GJ−1. In summary, there is a small difference in the CIF costs at REVAP, and it is clear that the transport by a pipeline partially counterbalances the slightly higher costs of the feedstocks in Caçu [8]. It is worth noting that the average prices paid to producers of anhydrous were close to 19 EUR·GJ−1 in 2018 in the regions considered in the case studies presented here [39].

4.4. MSP of SAF in the Base Cases

Table 4 presents the results of the estimated SAF MSP for the base case of each of the three routes. In the case of HEFA-SPK and ATJ-SPK, Paranaíba and Caçu were chosen as the biomass production sites, respectively, but there are no significant differences in comparison to the alternative sites. It should be mentioned that the base case of the FT-SPK route corresponds to a relatively small production (identified in the table as biomass production “mainly in two sites”), and the comparison for the same SAF production capacity should be made for the situation where all five production sites are suppliers.
In any case, the MSP of the FT-SPK route is more than twice that of the ATJ-SPK route and about 50% larger than that of the HEFA-SPK. Additionally, in Table 4, it can be seen that the share of the feedstock in the MSP is relatively low, which indicates a small margin of improvement in the feasibility along with a reduction in the wood costs (e.g., reducing the transport costs and/or producing in regions of the greatest potential). For the FT-SPK route, the predicted capital and O&M costs are also high because of the high up-front costs of the gasification system and syngas cleaning system [14].
However, it is essential to take into account that the results for the HEFA-SPK and ATJ-SPK routes are deeply impacted by the lower costs of the feedstocks (soybean oil and ethanol) compared to their opportunity costs. Assuming the market price of soybean oil in 2018 (15.5 EUR·GJ−1), the estimated MSP of the SAF in the base case would be 25 EUR·GJ−1 (1072 EUR·t−1). The same analysis in the case of the ATJ-SPK route, assuming 19 EUR·GJ−1 for anhydrous ethanol, would result in 30 EUR·GJ−1 (1288 EUR·t−1) for the SAF’s MSP. In this sense, establishing a supply chain that ensures the regular delivery of the biomass at low cost with a guarantee that production is sustainable is a challenge to be carefully considered.
The structure of the MSP shown in Table 4 highlights the crucial role of the feedstock in enabling the production of SAF through the ATJ-SPK route. The combined, capital cost, O&M costs and hydrogen cost (shown separately) are significant in the case of the HEFA-SPK route.
For the results presented above, a sensitivity analysis was performed, ranging ±10% (1) of the capital costs related to the SAF plant; (2) the set of O&M costs and the input costs required for the production of SAF (including natural gas, electricity and hydrogen) and (3) the costs of the feedstocks at the SAF’s production site. The results are shown in Table 5. In the case of the capital costs, the uncertainties would be related to the further development of the industrial technology (including the learning effects) and the additional costs to internalise it in Brazil, since at least the first units must be mostly imported. As for the costs of O&M and the other inputs, the uncertainties were partially related to the capital costs (i.e., the O&M component that is proportional to the investment) and, secondly, to the fact that the particularities of the costs in Brazil were not fully explored here (e.g., the labour costs could be lower). It can be seen in Table 5 that these uncertainties would be more significant in the case of the FT-SPK and HEFA-SPK routes, but it can be concluded that the simplifications made here would hardly have a significant impact on the MSP estimates.
In the case of the feedstock costs, a relatively small variation in the long-distance transport costs does not have a material impact on the MSP’s results. The impact is smaller in the case of the HEFA-SPK and ATJ-SPK routes because of the energy density of what is transported. However, it should be considered that, depending on the distance between the biomass production site and the SAF production unit, the impacts could also be significant. On the other hand, the variations in the biomass production costs (or intermediates) are more significant, especially in the case of the ATJ-SPK route. The cost of the biomass (or intermediates) is most impacted by the agricultural yields, and it should not be assumed that, on average, the yields can be more than 10% higher than those estimated here. Very low yields would not be likely either, given that the analysed production sites are adequate, and it is assumed that the best agricultural practices would be used.

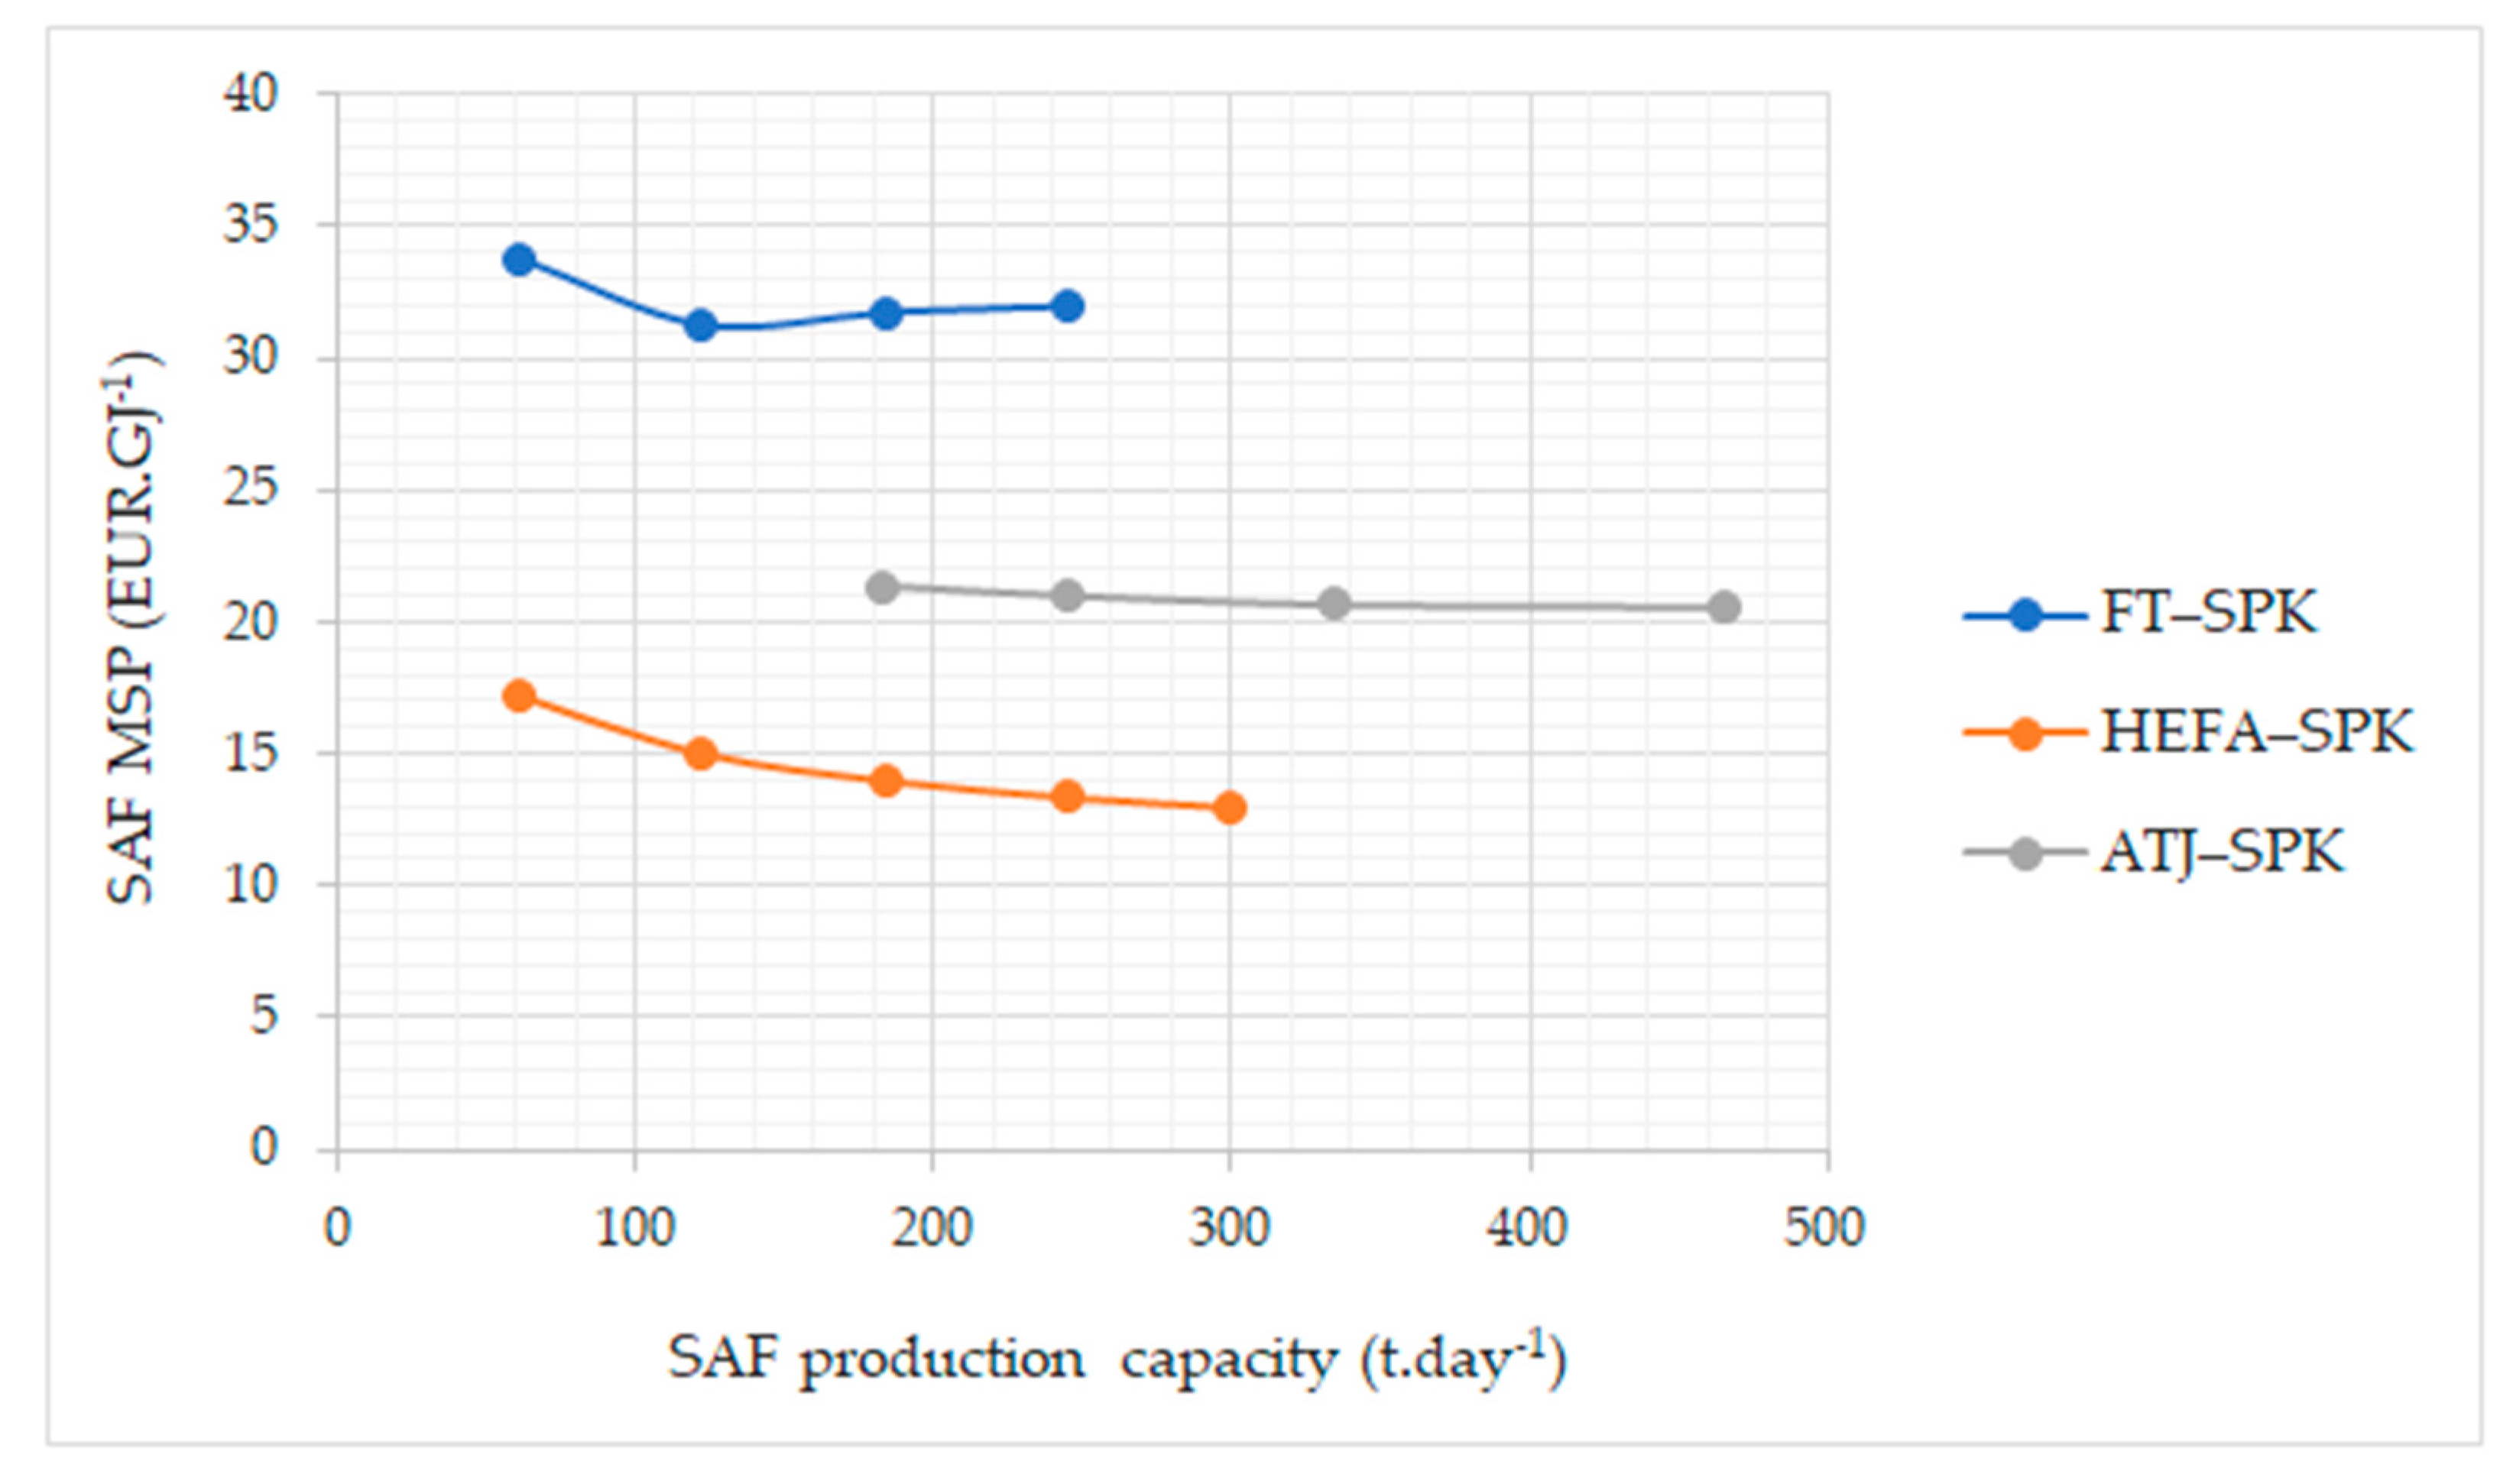
4.5. Exploring the Scale Effects on the SAF MSP

The scale effects were explored by varying the capacity of the SAF plant, with corresponding changes in the biomass supply curve. The results are presented in Figure 6. The results presented in Table 4 for the same production of SAF are for 245 tSAF·day−1 (i.e., about 84.5 × 10³ tSAF·day−1, which is equivalent to 1.3% of the total Brazilian consumption of jet fuel in 2018 [22]).
For the assumed hypotheses, this (245 tSAF·day−1) is the greatest production capacity for the FT-SPK route, since practically all the eucalyptus available in the five sites would be used to feed the four modules. As explained earlier, a module is essentially defined by the gasifier’s feeding capacity. The diseconomy of the scale that can be seen in Figure 6 for three and four modules is explained by two points: first, the scale effect associated with the total capital cost is relatively small, since scaling is due to the installation of more modules, and second, for larger capacities, it is necessary to bring wood from more distant locations (see Table 3) with a higher transport cost.
On the ATJ-SPK route, the new distillery to be built (in this case, in Caçu (GO)) has the capacity to supply anhydrous ethanol in a quantity that can almost double the production of SAF in relation to the reference case. As the CIF cost of anhydrous is constant across the range of capacities explored in Figure 6, it is only the impact of the scale on the capacity (which is relatively small; see Table 4) that explains the behaviour of the curve.
Finally, in the case of HEFA-SPK, the explanation is the same, but the differences that the scale effects in the capital and operational expenditures are more pronounced (see Table 4). The maximum estimated production of soybean in the surrounds of Paranaíba (MS) would allow producing even more SAF than the maximum presented in Figure 6 (about 600 t·day−1).

4.6. Comparing Results

The first and obvious comparison of the economic results presented here should be with those presented by reference [25], since this is the main source of information for the economic and technical parameters of the SAF plants. The results by other authors are also presented in Table 6.
It is not possible to simply compare the results of this study with those of other authors, since the costs of the feedstock, the industrial scale of production and the economic hypotheses can be quite different. A comparison with the results available in the literature for the ATJ-SPK route is also difficult, because those results reflect the cost of producing ethanol 2G. In a general sense, the results of this study are compatible with those of other authors for the FT-SPK route, but they are relatively low for the HEFA-SPK and ATJ-SPK routes, since, here, the feedstock cost reflects the dedicated production; in Section 4.4, the MSP results are presented based on the market prices of soybean oil and anhydrous ethanol.
To put this into perspective, in reference [14] quoting reference [47], it was mentioned that the price of HEFA-SPK in September 2020 was 2124 US$·t−1; at that moment, the price of conventional jet fuel was slightly less than 330 US$·t−1; at that time, the jet fuel prices were impacted by the COVID-19 pandemic and, also, by low oil prices. According to IATA [48], the price of jet fuel varied in the 612–645 US$·t−1 range in June 2021, with lower prices in the Middle East and higher ones in Latin America; since 2013, the jet fuel prices have always been below—and, in some cases, well below—1100 US$·t−1 [49].

4.7. Producing on Degraded Pasturelands

Biomass production on degraded land is recognised as a low iLUC strategy. In the context of assessing the GHG emissions of SAF on a life cycle basis, the iLUC share can be significant. The set of default life cycle emission values provided by CORSIA [50] presents the factors for the routes based on soybean (HEFA) and sugarcane (ATJ) produced in Brazil: in the case of the HEFA-SPK route, the iLUC value corresponds to 27.0 gCO2eq.MJ−1 of SAF in an estimated life cycle emission factor totaling 67.4 gCO2eq.MJ−1; in the case of the ATJ route based on sugarcane, the iLUC share is 8.7 over 32.8 gCO2eq.MJ−1 of SAF.
Here, the exercise of estimating the biomass production only in degraded pastures was carried out for the production of soybean, sugarcane and corn in Paranaíba (MS). It was assumed that the production would displace pastures classified as having moderate and severe levels of degradation (in 2018). It was also part of the assumptions that the potential agricultural yields would be achieved after specific actions, and here, the soil recovery costs were not computed. Table 7 presents the results of the evaluation.
In all three cases, the area to be potentially utilised would be significantly reduced (to 24–28%); in the case of soybeans, production would not be reduced in the same proportion, as the remaining area has a greater potential yield than the total area previously estimated.
The consequence would be a drastic reduction in the supply of feedstock for the SAF plant, with an increase in the biomass costs. In the case of soybean oil, the maximum supply would be reduced to 468.5 × 10³ t·year−1 (from 1931.1 × 103 t·year−1), with an increase of about 20% in the CIF costs (at REVAP). Counting only on soybean oil produced in Paranaíba (MS), the maximum SAF production would be 183.8 t·day−1, and its MSP would be 15.2 EUR·GJ−1 (17% higher than the minimum value in the curve shown in Figure 6, and about 10% higher than the previous estimate for the same production capacity).
On the production of ethanol in the region of Paranaíba (MS), using sugarcane and corn as the raw material, the impact is that this would be reduced to less than half of the maximum production previously estimated. The estimated cost of ethanol production would increase by almost 20% compared to the previous situation, reaching 13.61 EUR·GJ−1, while the CIF cost at REVAP would be 14.30 EUR·GJ−1. Altogether, combining the effects of the smaller industrial scale and the higher feedstock cost, the estimated MSP of the SAF produced in this new context would be 22.8 EUR·GJ−1 (i.e., about 10% higher than the previous estimates for similar industrial capacities).
The feasibility of this action needs to be analysed carefully, as clearly, there is a trade-off situation, with less production and less economic viability but (potentially) lower GHG emissions. A key question is how much the GHG emissions would be reduced and whether this reduction would be effectively recognised, as a substantial share of the expected results would be related to reducing iLUC GHG emissions. In this sense, the results of a preliminary analysis are presented in Table 8 based on the estimates for the routes HEFA-SPK and ATJ-SPK assuming the emission factors presented by reference [50] and calculating the avoided emissions per tonne of SAF used by the procedure described by reference [51] (see the Supplementary Materials for details). The life cycle emission factors presented by reference [50] are composed by the core LCA (life cycle assessment) values, which are related to the material flows in the production process, plus the components that are related to the land use change (LUC), including the induced impacts.
It is assumed that the MSP is a good proxy to estimate the cost of the avoided GHG emissions due to the use of SAF, and the assessment was also made using the emission factors presented by reference [50] in addition to the procedure reported by reference [51]. To estimate the feasibility of adopting low-iLUC measures, the iLUC LCA value was calculated that corresponds to the breakeven point between the biomass production (soybean, sugarcane and corn) in the entire area considered suitable or just displacing degraded (at some level) pastures. In the case of the route HEFA-SPK from soybean oil, it would be necessary to reduce the iLUC LCA value from 27 gCO2e·MJ−1 (see Table 8) to −1.1 gCO2e·MJ−1, while, in the case of the ATJ-SPK route, it would be necessary to reduce the factor from 8.7 gCO2e·MJ−1 to −2.6 gCO2e·MJ−1. Negative values indicate that it is not only necessary to avoid induced land use changes but, also, to add carbon to the degraded soil, for instance, with the adoption of the best agricultural practices.
In addition, the procedure was applied to estimate the cost of the avoided GHG emissions due to the use of SAF in displacing conventional fossil-based jet fuel, and the results are also presented in Table 8. It can be seen that the estimated costs are high, which is also due to the relatively low market prices of conventional fuel; the lower the market price of fossil fuels, the greater the cost of the avoided GHG emissions. In order to have a reference, the market price of conventional jet fuel, which would be the breakeven point for each production route, was calculated in each case; that is, the prices that would make the costs of the avoided GHG emissions nil. For the HEFA-SPK route, they are 683, 774 and 1273 US$·t−1 for the cases identified as the base, low iLUC and market prices, respectively, while, for the ATJ-SPK route, they are 1070, 1161 and 1533 US$·t−1, respectively, for the same three cases. To put these results into perspective, 1030 US$·t−1 corresponds to a jet fuel price at about 130 US$ per barrel, and this price was reached in mid-2013 [49].

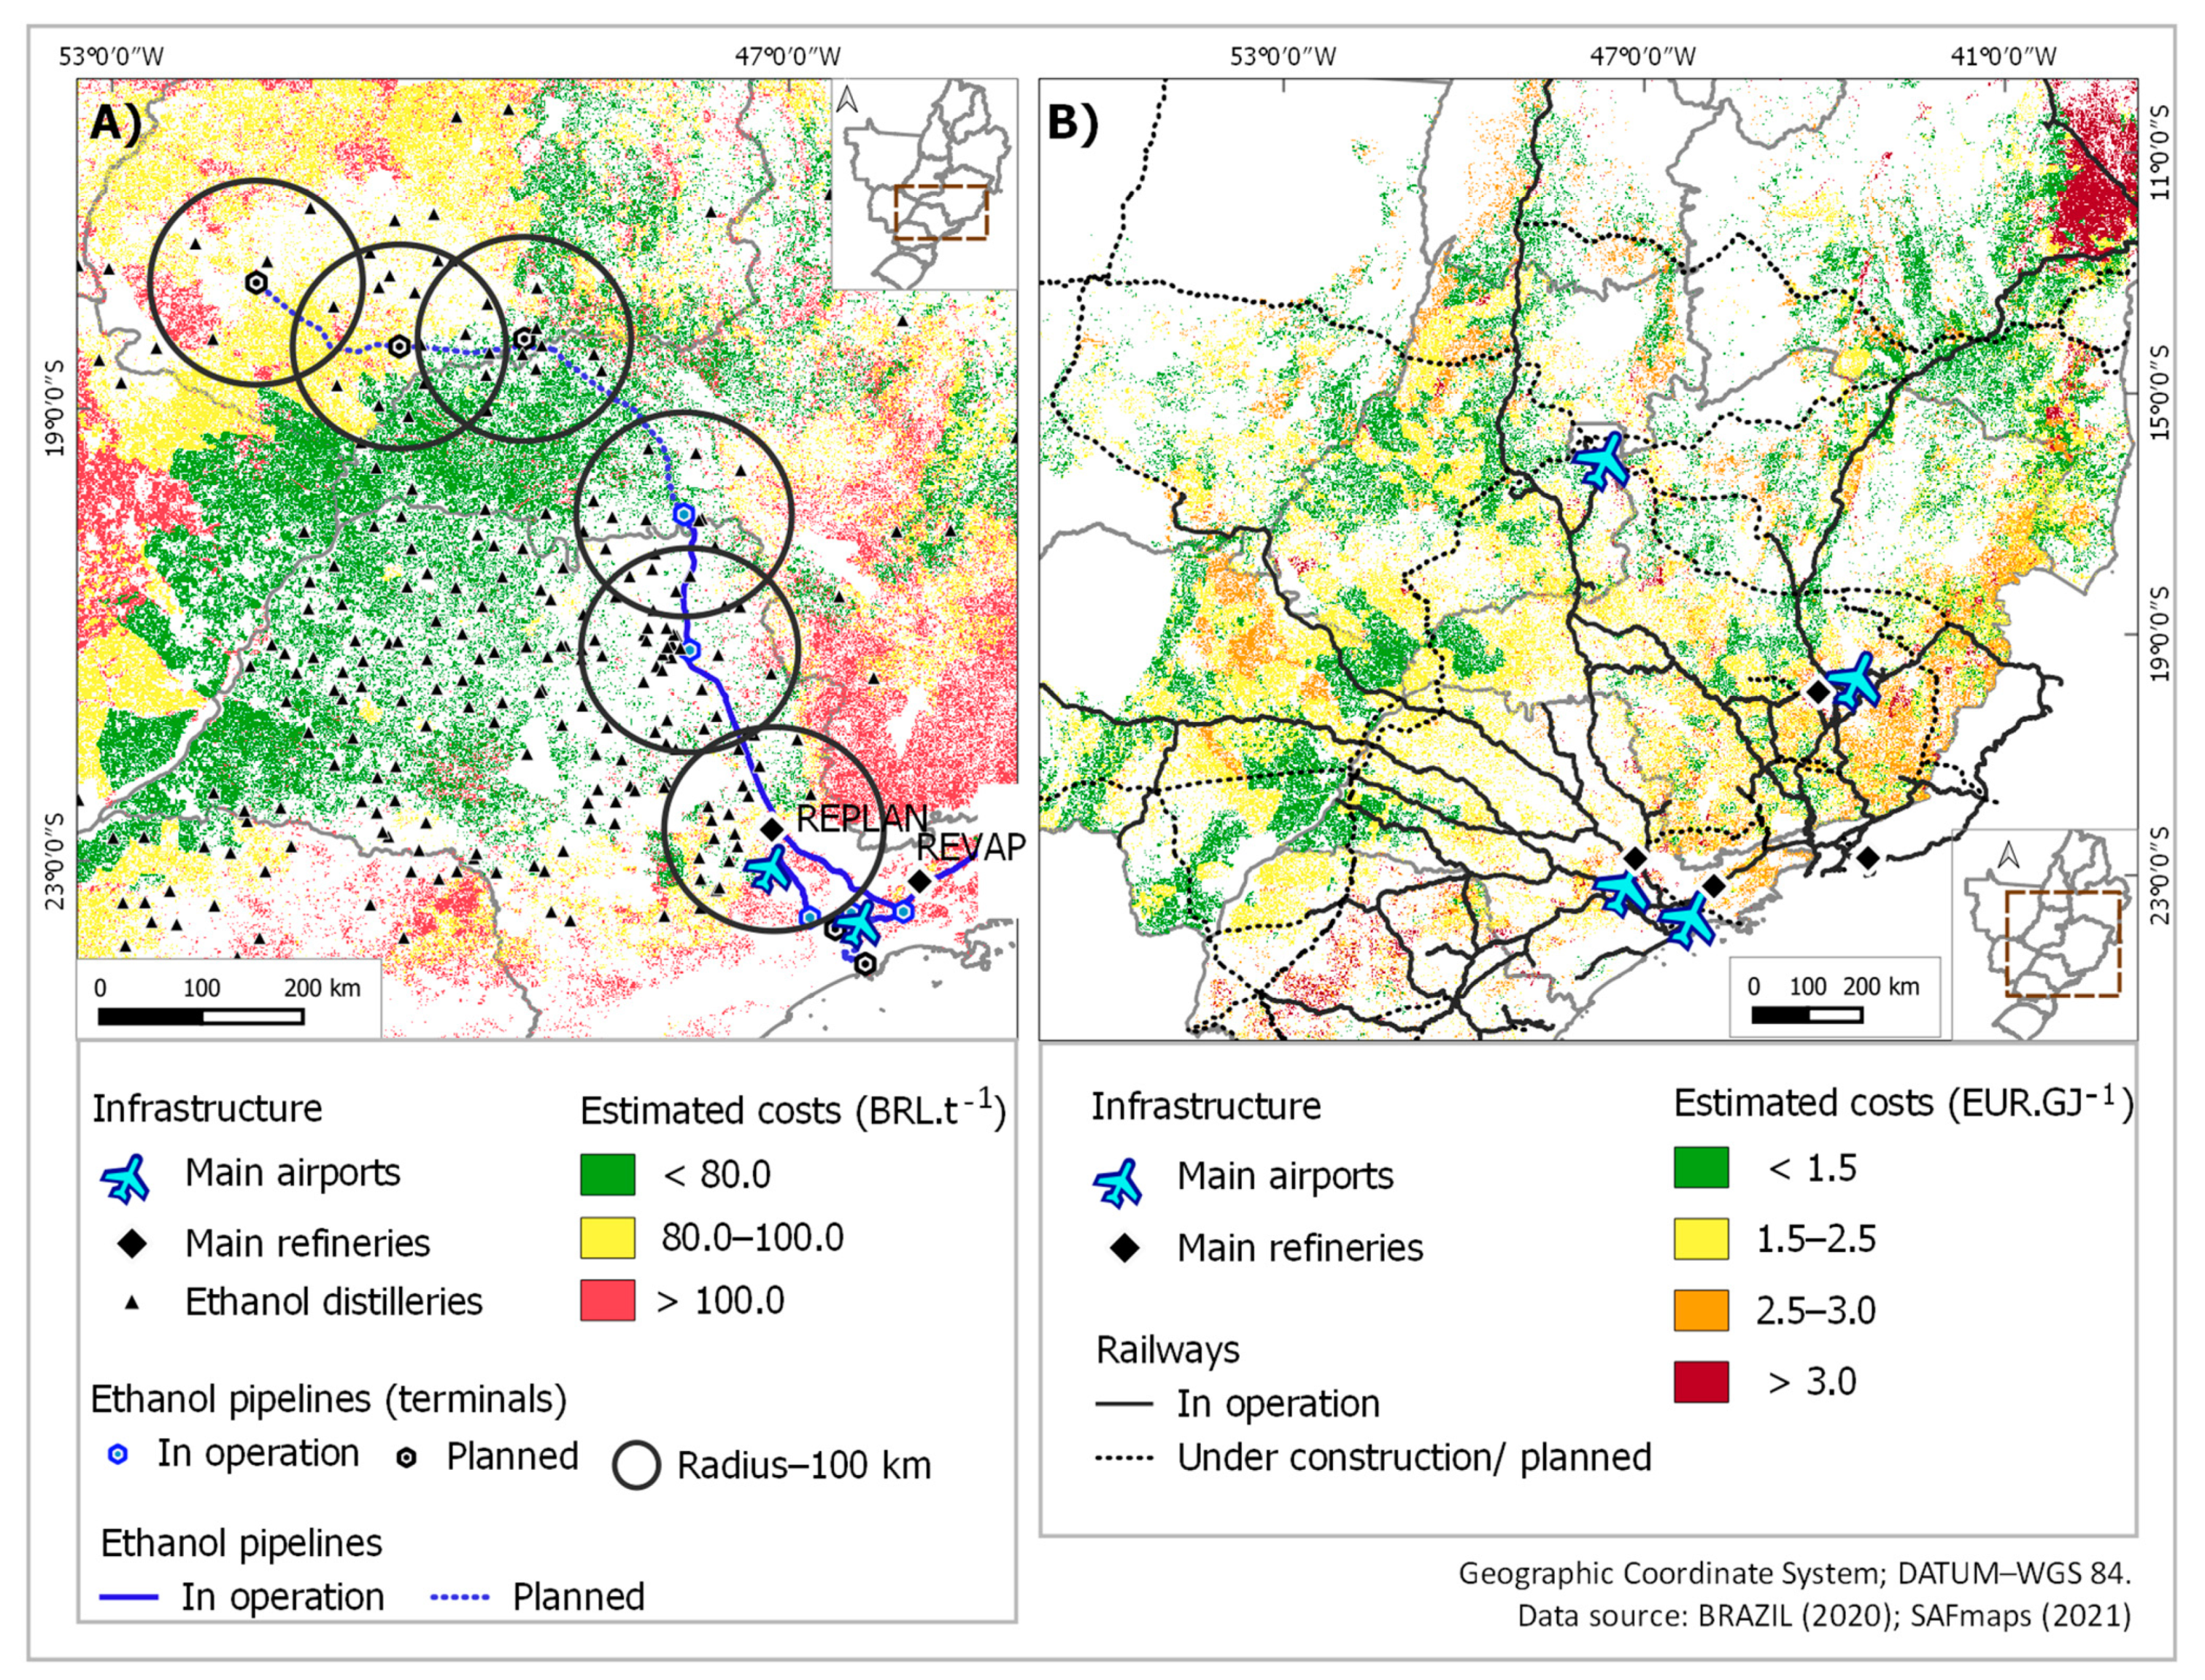
4.8. Identifying Regions with Good Potential

Figure 7A, which highlights part of the Brazilian Southeast and Centre-West regions, shows the ethanol pipeline in Brazil (existing and planned sections) and also the location of the existing ethanol distilleries. The figure has as the background the estimated cost of sugarcane production. The circles, with radii of 100 km, indicate the areas closest to the pipeline terminals, suggesting where it would be cheaper to access the pipeline in order to ship ethanol. The two main international airports in the State of São Paulo are also shown, as well as two oil refineries (REPLAN and REVAP). Caçu (GO), which is one of the case studies discussed here, is close to the second circle from left to right.
Figure 7B shows similar information used as the background for the estimated costs of eucalyptus. The figure shows the railroads (existing and planned), the location of four international airports (two in the State of São Paulo, in addition to Brasília further north and the one in Belo Horizonte), and also, four oil refineries.
In the case of the ATJ-SPK route, it is clear that there are areas to be explored for new ethanol production in the States of Minas Gerais and Goiás (near the three circles at the top of Figure 7A). SAF production could be at the two refineries indicated in the figure. In the case of the FT-SPK route, since the production of SAF does not require the input of large amounts of hydrogen, the industrial units should be closer to where it is possible to produce wood at a low cost, as well as to transport SAF by rail to the airports. Thus, further studies should consider production in Minas Gerais and in the centre-west.

5. Conclusions

The objective of this paper was to analyse the feasibility of producing SAF in Brazil considering three certified routes based on the biomass that would be produced in a dedicated way in new plantations. The objectives were achieved, and the results showed that production can be cheaper than in many other countries without the significant risks associated with land use changes. In this sense, the assessment was carried out under the premise that cropping can only take place in areas already anthropised (before 2008) and replacing pastures. The base case corresponded to a SAF production that would be equivalent to 1.3% of the annual jet fuel consumption in Brazil in 2018 or about 3% of the estimated consumption due to international flights in the same year.
The economic results are expressed by the minimum selling price (MSP) in each case. The hypotheses reflected the costs of mature industrial technologies (nth plant) in the production of SAF, while the biomass costs were those that can be achieved in the short term, as long as the planting was in suitable areas. The lowest MSP was for the HEFA-SPK route from soybean oil and the highest for the FT-SPK route from planted eucalyptus.
There was a significant difference in the estimated MSP when considering that the feedstocks would have to be paid at their opportunity costs. In this sense, an important conclusion is that a dedicated biomass production must ensure not only supply and sustainability but, also, a better economic viability of production.
Among the routes studied, the biggest challenge lied in defining the production sites for the FT-SPK route, since the transport of wood over long distances, even by rail, significantly impacts the viability of SAF production. For the HEFA-SPK and ATJ-SPK routes, there was more flexibility, since the intermediary product could be transported over long distances even by rail or a pipeline. In this sense, it is important to highlight the particularity of the Brazilian case, since there are adequate conditions for the production of a biomass in different places, but the transport infrastructure is inadequate, and there is a concentration of industrial parks close to the coast.
In this paper, the feasibility of producing a biomass by planting on degraded land was also analysed, albeit on a preliminary basis. This was done by considering only one of the production sites and for the cases of soybean and sugarcane planting (plus corn). From the results, it was concluded that it is necessary not only to reduce the risk of iLUC but, also, to increase the stock of carbon in soil. However, it is necessary to deepen the analysis and estimate with greater precision the costs and possible impacts on the agricultural yield.
Even considering the Brazilian conditions for low-cost biomass production, there would still be significant economic restrictions to replace conventional aviation fuels with SAF, and this is partly due to the relatively low oil prices. In this sense, higher oil prices and/or carbon taxation would define a better context for alternative jet fuels.
From the results presented, it is clear that, besides the crucial production of a biomass and intermediates at low costs, it is also necessary to reduce the transportation and industrial costs. This point indicates that coordination and planning will be fundamental in creating adequate conditions for SAF production.
The results presented in this paper are valid for Brazil, and the generalisation of the conclusions cannot be made without caution. This method can be replicated for other countries and regions, depending on the data availability, but it is obvious that the results and conclusions are specific. It is clear that the conditions that exist in Brazil for the large-scale production of biomass do not exist in many countries, but this viability also crucially depends on the existing transport and industrial infrastructure. Considering the required set of aspects, other countries would be able to produce SAF in at least moderate amounts. The challenge is to identify the context that will make the first units viable.
In addition to reducing the SAF costs and having higher prices for conventional fuels, to reduce the costs of the avoided emissions, it is necessary to minimise the carbon footprints of alternative fuels. Some options have been explored in this paper but do not necessarily represent a trade-off between the production costs and avoided emissions.
Finally, an important aspect is that many consumers are likely to accept paying a premium if they are confident that the fuel is really sustainable in a broad sense. Although not clearly explored in this paper, this aspect was considered in defining the case studies presented.

Supplementary Materials

The following are available online at https://www.mdpi.com/article/10.3390/en14164972/s1, Figure S1. The estimated costs for soybean (a), eucalyptus (b) and corn (c) in the areas assessed. Table S1. The parameters assumed in the FT-SPK case. Table S2. The coproducts in the FT-SPK route. Table S3. The coproducts in the HEFA-SPK route. Table S4. The coproducts in the ATJ-SPK route. Table S5. Assumptions for calculating the MSP of SAF. Table S6. The parameters used to estimate the ethanol production costs from sugarcane and corn (as a complementary feedstock).

Author Contributions

Conceptualisation, A.W. and J.S.; methodology, A.W., J.S. and J.R.; data processing, M.G., N.V., D.D. and J.L.S.; writing—original draft preparation, A.W.; writing—review and editing, J.S., J.R. and M.G.; supervision, A.W.; project administration, A.W. and J.S. and funding acquisition, A.W. and J.S. All authors have read and agreed to the published version of the manuscript.

Funding

The database used in this paper, available at [52], was developed in the context of a project supported by Boeing Research & Technology, a Division of the Boeing Company. This project was conceived as a collaborative between the University of Campinas (Unicamp) and the Boeing–Embraer Joint Research Center for Sustainable Aviation Fuels (SAF).

Institutional Review Board Statement

Not applicable.

Informed Consent Statement

Not applicable.

Data Availability Statement

The Supplementary Materials will be available in electronic format. The maps, reports and data can be accessed through [52]. Moreover, detailed information can be accessed through the following links: SAFmaps—Eucalyptus: doi.org/10.17632/ghvrstw7pw, SAFmaps—Soybean: doi.org/10.17632/jpwggmp9zy, SAFmaps—Sugarcane: doi.org/10.17632/dp4y36fjw5, SAFmaps—Corn: doi.org/10.17632/g25wt3t7k5, SAFmaps—Infrastructure: doi.org/10.17632/kwdd5mbg4h and SAFmaps—Diagnostics: doi.org/10.17632/czrwfbd7ct.

Acknowledgments

The authors are grateful to The Boeing Company (Boeing Research & Technology division) for the financial support to the project Development of Database Management System (DBMS) for Sustainable Aviation Biofuel in Brazil.

Conflicts of Interest

The authors declare no conflict of interest.

References

  1. Chum, H.; Faaij, A.; Moreira, J.; Berndes, G.; Dhamija, P.; Dong, H.; Gabrielle, B.; Goss Eng, A.; Lucht, W.; Mapak., M.; et al. Bioenergy. In IPCC Special Report on Renewable Energy Sources and Climate Change Mitigation; Edenhofer, O., Pichs-Madruga, R., Sokona, Y., Seyboth, K., Eickemeier, P., Matschoss, P., Hansen, G., Kadner, S., Schlömer, S., Zwickel, T., Eds.; Cambridge University Press: Cambridge, UK, 2011; pp. 209–332. [Google Scholar]
  2. IEA—International Energy Agency. Energy Technology Perspectives 2020; IEA: Paris, France, 2020; 397p. [Google Scholar]
  3. Strapasson, A.; Woods, J.; Chum, H.; Kalas, N.; Shah, N.; Rosillo-Calle, F. On the global limits of bioenergy and land use for climate change mitigation. GCB Bioenergy 2017, 9, 1721–1735. [Google Scholar] [CrossRef]
  4. EESI—Environment and Energy Study Institute. The Growth in Greenhouse Gas Emissions from Commercial Aviation. Available online: www.eesi.org/papers (accessed on 9 March 2021).
  5. ICAO—International Civil Aviation Organization. Trends in Emissions that Affect Climate Change. Available online: www.icao.int/environmental-protection/pages/climatechange_trends.aspx (accessed on 9 March 2021).
  6. IATA—Climate Change. IATA—International Air Transport Association. Available online: www.iata.org/en/programs/environment/climate-change (accessed on 9 March 2021).
  7. ICAO—International Civil Aviation Organization. CORSIA Sustainability Criteria for CORSIA Eligible Fuels. 2019. Available online: www.icao.int/environmental-protection/CORSIA/Pages/CORSIA-Eligible-Fuels.aspx (accessed on 9 March 2021).
  8. Walter, A.; Seabra, J.; Rocha, J.; Guarenghi, M.; Vieira, N.; Damame, D.; Santos, J.L. Spatially explicit assessment of the suitable conditions for the sustainable production of aviation fuels in Brazil. Land 2021, 10, 705. [Google Scholar] [CrossRef]
  9. Chuck, C. Biofuels for Aviation: Feedstocks, Technology and Implementation, 1st ed.; Elsevier: Cambridge, MA, USA, 2016. [Google Scholar]
  10. ICAO. Sustainable Aviation Fuels Guide, 2nd ed.; Transforming Global Aviation Collection; ICAO: Montreal, QC, Canada, 2018. [Google Scholar]
  11. ASTM D7566-20c, Standard Specification for Aviation Turbine Fuel Containing Synthesized Hydrocarbons; ASTM International: West Conshohocken, PA, USA, 2020. [CrossRef]
  12. Wang, W.C.; Tao, L.; Markham, J.; Zhang, Y.; Tan, E.; Batan, L.; Warner, E.; Biddy, M. Review of Biojet Fuel Conversion Technologies; Technical Report No. NREL/TP-5100-66291; National Renewable Energy Laboratory: Golden, CO, USA, 2016. [Google Scholar]
  13. Van Dyk, S.; Su, J.; McMillan, J.D.; Saddler, J.N. ‘Drop-in’ Biofuels: The Key Role that Co-Processing Will Play in Its Production; IEA Bioenergy Task 39: Paris, France, 2019; ISBN 9781910154618. [Google Scholar]
  14. Van Dyk, S.; Saddler, J. Progress in Commercialization of Biojet/Sustainable Aviation Fuels (SAF): Technologies, Potential and Challenges; IEA Bioenergy Task 39: Paris, France, 2021. [Google Scholar]
  15. Prussi, M.; O’Connell, A.; Lonza, L. Analysis of current aviation biofuel technical production potential in EU28. Biomass Bioenergy 2019, 130, 105371. [Google Scholar] [CrossRef]
  16. De Jong, S.; Antonissen, K.; Hoefnagels, R.; Lonza, L.; Wang, M.; Faaij, A.; Junginger, M. Life-cycle analysis of greenhouse gas emissions from renewable jet fuel production. Biotechnol. Biofuels 2017, 10, 1–18. [Google Scholar] [CrossRef] [PubMed] [Green Version]
  17. Haq, Z.; Kostova, B. Biofuels in Defense and Aviation. Available online: https://www.energy.gov/sites/default/files/2017/03/f34/day_3_plenary_haq_aviation_overview.pdf (accessed on 10 March 2021).
  18. Manzatto, C.V.; Assad, E.D.; Bacca, J.F.M.; Zaroni, M.J.; Pereira, S.E.M. Zoneamento Agroecológico da Cana-de-Açúcar: Expandir a Produção, Preservar a Vida, Garantir o Future; EMBRAPA Solos: Rio de Janeiro, Brazil, 2009. [Google Scholar]
  19. Simões, M.G.; Oliveira, S.R.M.; Peçanha, R.; Ferraz, D.; Santos, H.G.; Manzatto, C.V. Democratization of information on Brazilian soils: Geoportal and soil database accessible via web. Cad. Ciência Technol. 2015, 32, 55–69. [Google Scholar]
  20. Agrianual Databe on Agribusiness. Available online: http://www.agrianual.com.br/ (accessed on 12 March 2020).
  21. Map and Data Platform. MapBiomas. Available online: https://mapbiomas.org/ (accessed on 8 February 2020).
  22. ANP—Agência Nacional de Petróleo, Gás Natural e Biocombustíveis. Statistic Database. Available online: http://www.anp.gov.br/dados-estatisticos (accessed on 12 April 2021).
  23. Forkenbrock, D.J. External Costs of Truck and Rail Freight Transportation; The University of Iowa Public Policy Center: Iowa City, IA, USA, 1998. [Google Scholar]
  24. Vassallo, M.D. Análise de Impactos Econômicos Setoriais e Regionais Decorrentes de Investimentos em Infraestrutura de Transportes. Ph.D. Thesis, Faculdade de Economia, Administração e Contabilidade, Universidade de São Paulo, São Paulo, Brazil, 2015. [Google Scholar]
  25. De Jong, S.; Hoefnagels, R.; Faaij, A.; Slade, R.; Mawhood, R.; Junginger, M. The feasibility of short-term production strategies for renewable jet fuels—A comprehensive techno-economic comparison. Biofuels Bioprod. Biorefin. 2015, 9, 778–800. [Google Scholar] [CrossRef]
  26. Towler, G.; Sinnott, R. Chemical Engineering Design: Principles, Practice, and Economics of Plant and Process Design, 2nd ed.; Butterworth-Heinemann: Waltham, MA, USA, 2013. [Google Scholar]
  27. Jin, H.; Larson, E.D.; Celik, F.E. Performance and cost analysis of future, commercially mature gasification-based electric power generation from switchgrass. Biofuels Bioprod. Biorefin. 2009, 3, 142–173. [Google Scholar] [CrossRef]
  28. Mandarino, J.M.G.; Hirakuri, M.H.; Roessing, A.C. Tecnologia para Produção do Óleo de Soja: Descrição das Etapas, Equipamentos, Produtos e Subprodutos; Embrapa: Londrina, Brazil, 2015. [Google Scholar]
  29. Associação Brasileira das Indústrias Óleos Vegetais. Statistics Database. 2019. Available online: https://abiove.org.br/ (accessed on 20 March 2020).
  30. Milanez, A.Y.; Nyko, D.; Valente, M.S.; Xavier, C.E.O.; Kulay, L.A.; Donke, A.C.G.; Matsuura, M.I.S.F.; Ramos, N.P.; Morandi, M.A.B.; Bonomi, A.M.F.L.J.; et al. A Produção de Etanol Pela Integração do Milho-Safrinha às Usinas de Cana-de-Açúcar: Avaliação Ambiental, Econômica e Sugestões de Política; BNDES: Rio de Janeiro, Brazil, 2014. [Google Scholar]
  31. Wiegmann, K.; Hennenberg, K.; Fritsche, U.R. Degraded Land and Sustainable Bioenergy Feedstock Production. In Joint International Workshop on High Nature Value Criteria and Potential for Sustainable Use of Degraded Lands; Öko-Institut: Darmstadt, Germany, 2008. [Google Scholar]
  32. Sumfleth, B.; Majer, S.; Thrän, D. Recent developments in low iLUC policies and certification in the EU biobased economy. Sustainability 2020, 12, 8147. [Google Scholar] [CrossRef]
  33. LAPIG—Laboratório de Processamento de Imagens e Geoprocessamento. Atlas das Pastagens Brasileiras. Available online: https://pastagem.org/map (accessed on 20 September 2020).
  34. Dias-Filho, M.B. Degradação de Pastagens: Processos, Causas e Estratégias; Embrapa Amazônia Oriental: Belém, Brazil, 2005. [Google Scholar]
  35. Dias Filho, M.B. Diagnóstico das Pastagens no Brasil; Embrapa Amazônia Oriental: Belém, Brazil, 2014; p. 22. [Google Scholar]
  36. Pereira, O.J.R.; Ferreira, L.G.; Pinto, F.; Baumgarten, L. Assessing pasture degradation in the Brazilian Cerrado based on the analysis of MODIS NDVI time-series. Remote Sens. 2018, 10, 1761. [Google Scholar] [CrossRef] [Green Version]
  37. IBGE—Instituto Brasileiro de Geografia e Estatística. Produção da Extração Vegetal e da Silvicultura. Available online: https://www.ibge.gov.br/estatisticas/economicas/agricultura-e-pecuaria/9105-producao-da-extracao-vegetal-e-da-silvicultura.html?=&t=resultados (accessed on 30 May 2020).
  38. Novacana. Private Database on Sugarcane and Ethanol Production. Available online: https://www.novacana.com/ (accessed on 1 June 2021).
  39. CEPEA—Centro de Estudos Avançados em Economia Agropecuária. Available online: https://cepea.esalq.usp.br/br/indicador/etanol.aspx (accessed on 20 November 2020).
  40. Bann, S.J.; Malina, R.; Staples, M.D.; Suresh, P.; Pearlson, M.; Tyner, W.E.; Hileman, J.I.; Barrett, S. The costs of production of alternative jet fuel: A harmonized stochastic assessment. Bioresour. Technol. 2017, 227, 179–187. [Google Scholar] [CrossRef] [PubMed] [Green Version]
  41. Neuling, U.; Kaltschmitt, M. Techno-economic and environmental analysis of aviation biofuels. Fuel Process. Technol. 2018, 171, 54–69. [Google Scholar] [CrossRef]
  42. Diederichs, G.W.; Ali Mandegari, M.; Farzad, S.; Görgens, J.F. Techno-economic comparison of biojet fuel production from lignocellulose, vegetable oil and sugar cane juice. Bioresour. Technol. 2016, 216, 331–399. [Google Scholar] [CrossRef] [PubMed]
  43. Capaz, R.S.; Guida, E.; Seabra, J.E.A.; Osseweijer, P.; Posada, J.A. Mitigating carbon emissions through sustainable aviation fuels: Costs and potential. Biofuels Bioprod. Biorefin. 2020, 15, 502–524. [Google Scholar] [CrossRef]
  44. Le Freuve, P. Are Biofuels Ready for Take off? International Energy Agency: 2019. Available online: https://www.iea.org/commentaries/are-aviation-biofuels-ready-for-take-off (accessed on 1 June 2021).
  45. Klein, B.C.; Chagas, M.F.; Junqueira, T.L.; Rezende, M.C.A.F.; Cardoso, T.D.F.; Cavalett, O.; Bonomi, A. Techno-economic and environmental assessment of renewable jet fuel production in integrated Brazilian sugarcane biorefineries. Appl. Energy 2018, 209, 290–305. [Google Scholar] [CrossRef]
  46. Bosch, J.; de Jong, S.; Hoefnagels, R.; Slade, R. Aviation Biofuels: Strategically Important, Technically Achievable, Tough to Deliver; Grantham Institute—Imperial College: London, UK, 2017. [Google Scholar]
  47. Argus Media Database. Available online: https://www.argusmedia.com/en/press-releases/2020/argus-launches-new-price-as-europe-moves-towards-sustainable-aviation-fuel (accessed on 28 June 2021).
  48. IATA—International Air Transport Association. Jet Fuel Price Monitor. Available online: https://www.iata.org/en/publications/economics/fuel-monitor/ (accessed on 25 June 2021).
  49. Platts Global Index. IATA Jet Fuel Price Monitor Information. Available online: https://www.airportwatch.org.uk/iata-jet-fuel-price-monitor-information/ (accessed on 15 March 2021).
  50. ICAO—International Civil Aviation Organization. CORSIA Supporting Document—CORSIA Eligible Fuels—Life Cycle Assessment Methodology. 2019. Available online: www.icao.int/environmental-protection/CORSIA/documents/Forms/AllItems.aspx (accessed on 20 March 2021).
  51. ICAO—International Civil Aviation Organization. Climate Change Mitigation: CORSIA. Chapter Six. 2019. Available online: www.icao.int/environmental-protection/CORSIA/documents/Forms/AllItems.aspx (accessed on 20 March 2021).
  52. SAFmaps. Available online: www.safmaps.com (accessed on 18 April 2021).
Figure 1. Scheme of the three SAF production routes considered. Sources: based on references [13,17].
Energies 14 04972 g001
Figure 2. Scheme of the methodological procedure applied to assess SAF production in Brazil.
Energies 14 04972 g002
Figure 3. Estimated costs of sugarcane in a five-year cycle (including transport to a nearby mill) in twelve Brazilian states, considering the production over pasturelands.
Energies 14 04972 g003
Figure 4. Considered sites of biomass production in the case studies (production within the circles of influence); the existing railways and the existing and planned ethanol branches of a pipeline are highlighted.
Energies 14 04972 g004
Figure 5. Wood (Eucalyptus) supply curve at REVAP, supposing the production in five sites and the bulk of the transport by rail.
Energies 14 04972 g005
Figure 6. SAF’s MSP as a function of its production capacity.
Energies 14 04972 g006
Figure 7. Maps with a set of information that can be used to identify the areas more suitable for dedicated biomass production for energy purposes (here, for SAF production): (A) sugarcane and (B) eucalyptus.
Energies 14 04972 g007
Table 1. Bio-jet fuel production processes approved by ASTM International; the blending ratios are expressed on a volume basis.
Conversion ProcessRouteFeedstocksBlending
Ratio
Commercial Initiatives
Fischer-Tropsch hydroprocessed synthesised paraffinic keroseneFT-SPKCoal, natural gas, biomass50%Fulcrum Bioenergy, Red Rock Biofuels, SG Preston, Kaidi, Sasol, Shell, Syntroleum
Synthesised paraffinic kerosene produced from hydroprocessed esters and fatty acidsHEFA-SPKBio-oils, animal fat, recycled oils50%World Energy, Honeywell UOP, Neste Oil, Dynamic Fuels, EERC
Synthesised isoparaffins produced from hydroprocessed fermented sugarsSIP-HFSBiomass used for sugar production10%Amyris, Total
Synthesised kerosene with aromatics derived by alkylation of light aromatics from nonpetroleum sourcesSPK/ACoal, natural gas, biomass50%Sasol
Alcohol-to-jet synthetic paraffinic keroseneATJ-SPKBiomass from ethanol or isobutanol production50%Gevo, Cobalt, Honeywell UOP, Lanzatech, Swedish Biofuels, Byogy
Synthesised kerosene from hydrothermal conversion of fatty acid esters and fatty acidsCHJBio-oils, animal fat, recycled oils50%ARA
Synthesised paraffinic kerosene from hydroprocessed hydrocarbons, esters and fatty acidsHC-HEFA SPKOils produced from (Botryococcus braunii) algae10%IHI Corporation
Co-processing Fats, oils, and greases (FOG) from petroleum refining5%
Source: adapted from references [10,11].
Table 2. Assumed technical parameters for the SAF production unit based on the literature and those considered in the base case—tf refers to tonnes of the feedstock on a dry basis.
ParametersUnitsFT-SPKHEFA-SPKATJ-SPKFT-SPKHEFA-SPKATJ-SPK
Based on the LiteratureAssumed in the Base Case
Industrial yieldtHC·tf−10.1700.8300.5040.1700.8300.504
Industrial yieldkgSAF·tf−125.5120.0378.825.5120.0378.8
Input capacitytf·day−12000250048224002041647
HCs productiontHC·day−1340.02075242.9408.01694325.9
SAF productiontSAF·day−151.0300.1182.661.2245.0245.0
Sources: references [17,25] and the assumptions of this study.
Table 3. Annual wood demand (dry basis—103 t) as a function of the number of modules of the technology FT-SPK and the estimated contribution (also in 103 t·year−1) of each of the five sites of production.
Number of
Modules
Annual Wood
Requirement
GuaratinguetáSJ CamposConchasQuatáEspigão
1788.4409212561330
21576.8504212156453278
32365.2513225278509859
43153.66822994926201063
Remaining351.010036612153
Table 4. Parameters and results of the selected case studies: SAF MSP and its structure (%) for the reference production capacity for the three routes considered.
ParameterUnitsFT-SPKFT-SPKHEFA-SPKATJ-SPK
Biomass produced at Mainly two sitesAll five sitesParanaíba (MS)Caçu (GO)
Production capacitytSAF·day−161.2244.8245.0245.0
Feedstock CIF cost(EUR·GJ−1)2.543.125.1512.37
MSPSAF (EUR·GJ−1)(EUR·GJ−1)33.832.013.421.0
MSP structure
Capital costs(%)40.837.626.18.7
Feedstock(%)22.128.742.880.4
Hydrogen(%)______5.21.6
O&M & other inputs(%)38.835.824.59.0
Taxes(%)2.22.01.40.5
Surplus electricity(%)−3.9−4.1______
Table 5. The sensitivity analysis results in relation to the MSP estimates in the base case for the three routes considered.
Case and ParametersFT-SPKHEFA-SPKATJ-SPK
Biomass produced atAll five sitesParanaíba (MS)Caçu (GO)
MSPSAF (EUR·GJ−1) in the base case32.013.421.0
Capital costs (±10%)±3.8%±2.6%±0.9%
O&M & other inputs (±10%)±3.7%±3.0%±1.1%
Feedstock CIF costs (±10%, combining the factors below)±2.9%±4.3%±8.1%
Feedstock costs (impact of long-distance transport costs)±0.7%±0.4%±0.3%
Feedstock costs (impact of biomass/intermediate costs)±2.2%±3.9%±7.8%
Table 6. The MSP results presented in this paper and comparisons with the equivalent estimates available in the literature.
RouteMSP ResultsOther EstimatesReferenceComments
FT-SPK32.0–33.8 EUR·GJ−1
1369–1446 EUR·t−1
38–55 EUR·GJ−1[25]Feedstock: forest residues and wheat straw (feedstock CIF costs 4.8 EUR·GJ−1 or 10.6 EUR·GJ−1, respectively)
1188–1738 US$·t−1[40]Feedstock: municipal solid waste (MSW) (not charged)
1244 and 1982 US$·t−1[41]Feedstock: willow pretreated (lower value) and wheat straw (higher value)
2440 EUR·t−1[42]Feedstock: lignocellulosic residues
32.4 US$·GJ−1[43]Feedstock: lignocellulosic residues
HEFA-SPK13.0–17.2 EUR·GJ−1
555–736 EUR·t−1
29 EUR·GJ−1/1241 EUR·t−1[25]Feedstock: used cooking oil (UCO).
770–1750 EUR·t−1[44]From different feedstocks. Figures are for production costs.
825–1550 US$·t−1; 988–1775 US$·t−1; 1086–2000 US$·t−1[40]From top to bottom, estimated MSP from yellow grease, tallow and soybean oil
23.1 US$·GJ−1[45]From soybean oil in Brazilian conditions
36.4 US$·GJ−1[43]From soybean oil in Brazilian conditions
ATJ-SPK20.6–21.4 EUR·GJ−1
880–915 EUR·t−1
52–78 EUR·GJ−1[25]Produced from second-generation (2G) ethanol
2300 and 3500 EUR·t−1[46]From second-generation ethanol, from forest residues (lower value) and wheat straw (higher value)
27.2 and 36.6 US$·GJ−1[45]From first-generation (1G) and 2G ethanol in Brazilian conditions
33.7 US$·GJ−1[43]From 1G ethanol in Brazilian conditions
Table 7. The results of the areas assessed for the production of soybean, sugarcane and corn in Paranaíba (MS), considering cropping when no restrictions were imposed besides those considered for defining the eligible areas (reference case) and only in degraded pasturelands (moderate and severe levels).
FeedstockArea Assessed (km2)Production (1000 t)Area Assessed (km2)Production (1000 t)
No (Additional) Restrictions ImposedIn Moderate and Severe Degraded Lands
Soybean25,836.19522.35469.92310.0
Sugarcane728.46460.9204.61815.1
Corn1416.01006.0363.0257.8
Table 8. Synthesis of the results of the MSP in different cases, and estimates of the avoided costs of GHG emissions.
ParameterJet FuelHEFA-SPKATJ-SPK
Life cycle emission factor (gCO2e·MJ−1)89.067.432.8 *
Core LCA value (gCO2e·MJ−1) 40.424.1 *
iLUC LCA value (gCO2e·MJ−1) 27.08.7 *
Avoided emissions per tonne of SAF (tCO2) 0.7071.995
Jet fuel price (as for June 2021) (EUR·t−1)514 **
MSP in the base case (EUR·t−1) 574899
MSP in the low iLUC case (EUR·t−1) 651976
MSP based on market prices (EUR·t−1) 10701288
Cost of avoided emissions—base case (EUR·tCO2−1) 77.2192.7
Cost of avoided emissions—low iLUC *** (EUR·tCO2−1) 79.0200.3
Cost of avoided emissions—market prices (EUR·tCO2−1) 724.6387.7
Note: * Here, the emission factor for ethanol from sugarcane is assumed, as there is still no evaluation for the combined production from sugarcane and corn. ** Assuming 612 US$·t−1 and an exchange rate of 1.19 US$.EUR−1. *** Assuming that the iLUC LCA value would be nil.
Publisher’s Note: MDPI stays neutral with regard to jurisdictional claims in published maps and institutional affiliations.

