
Empirical Investigation of the Hygrothermal Diffusion Properties of Permeable Building Membranes Subjected to Variable Relative Humidity Condition


Abstract
:
1. Introduction
2. Materials and Methods
2.1. Hygrothermally Controlled Test Room Operation and Climatic Condition Parameters
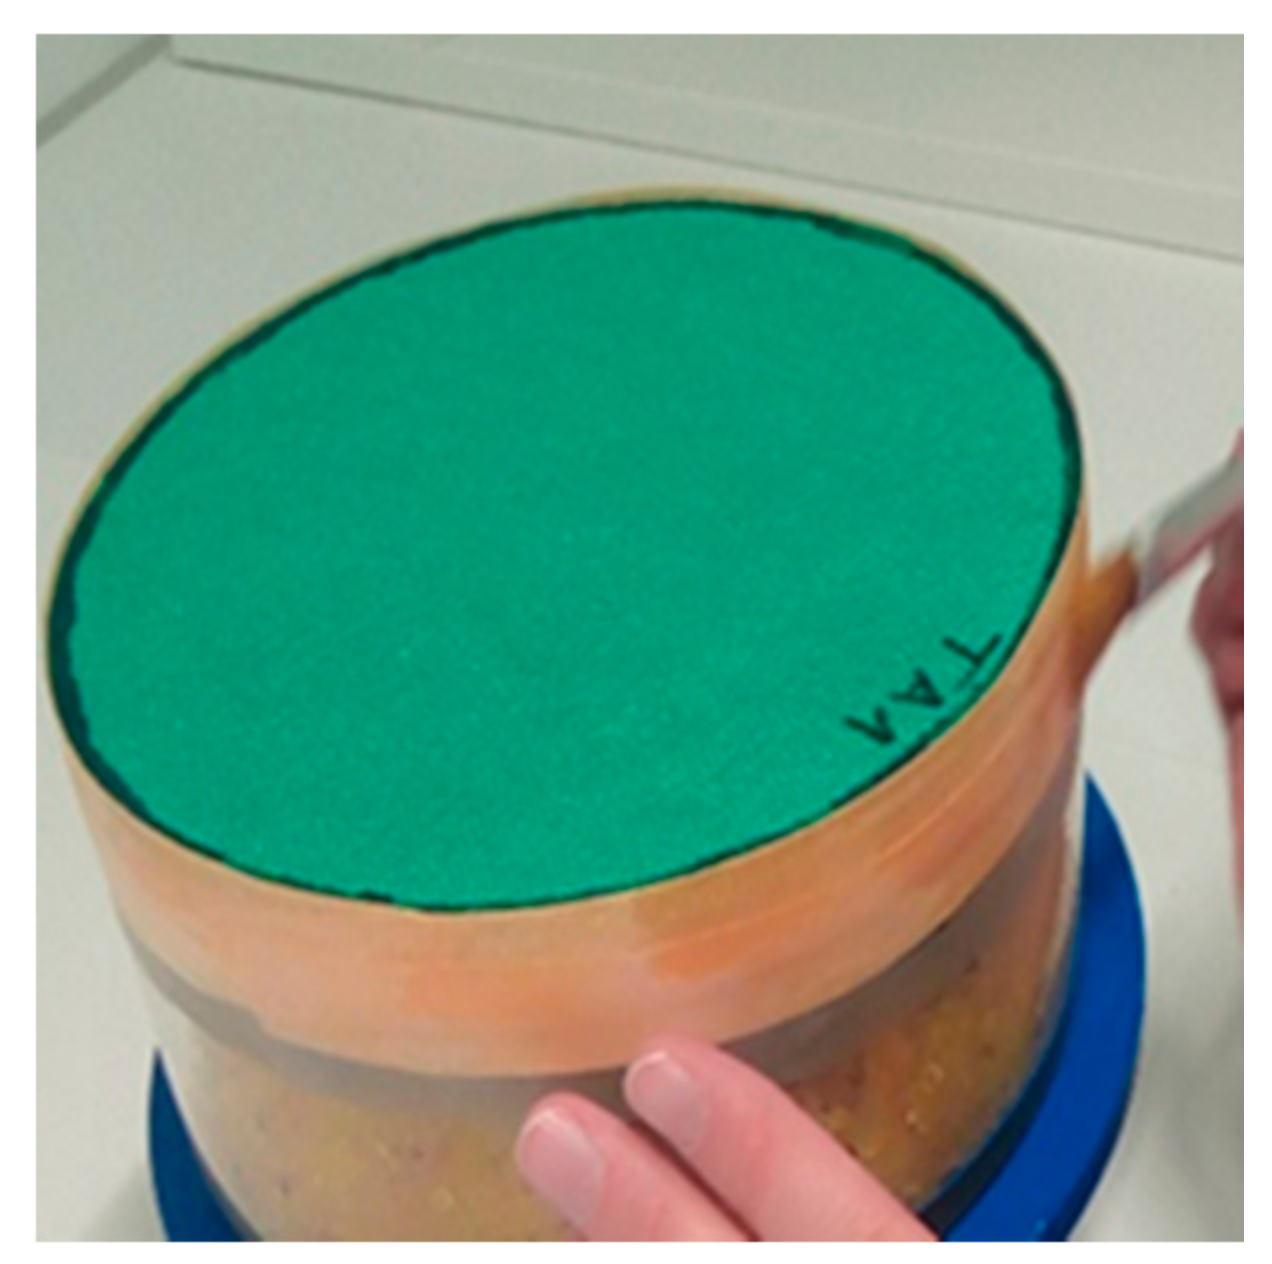
2.2. Selection of Pliable Building Membranes
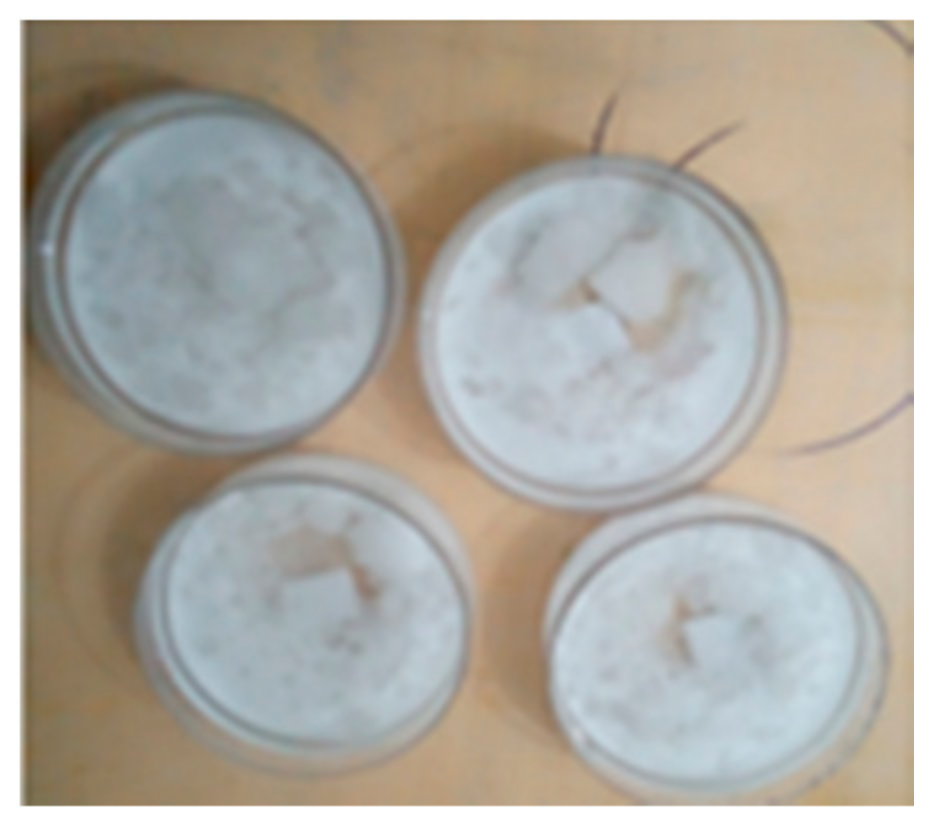
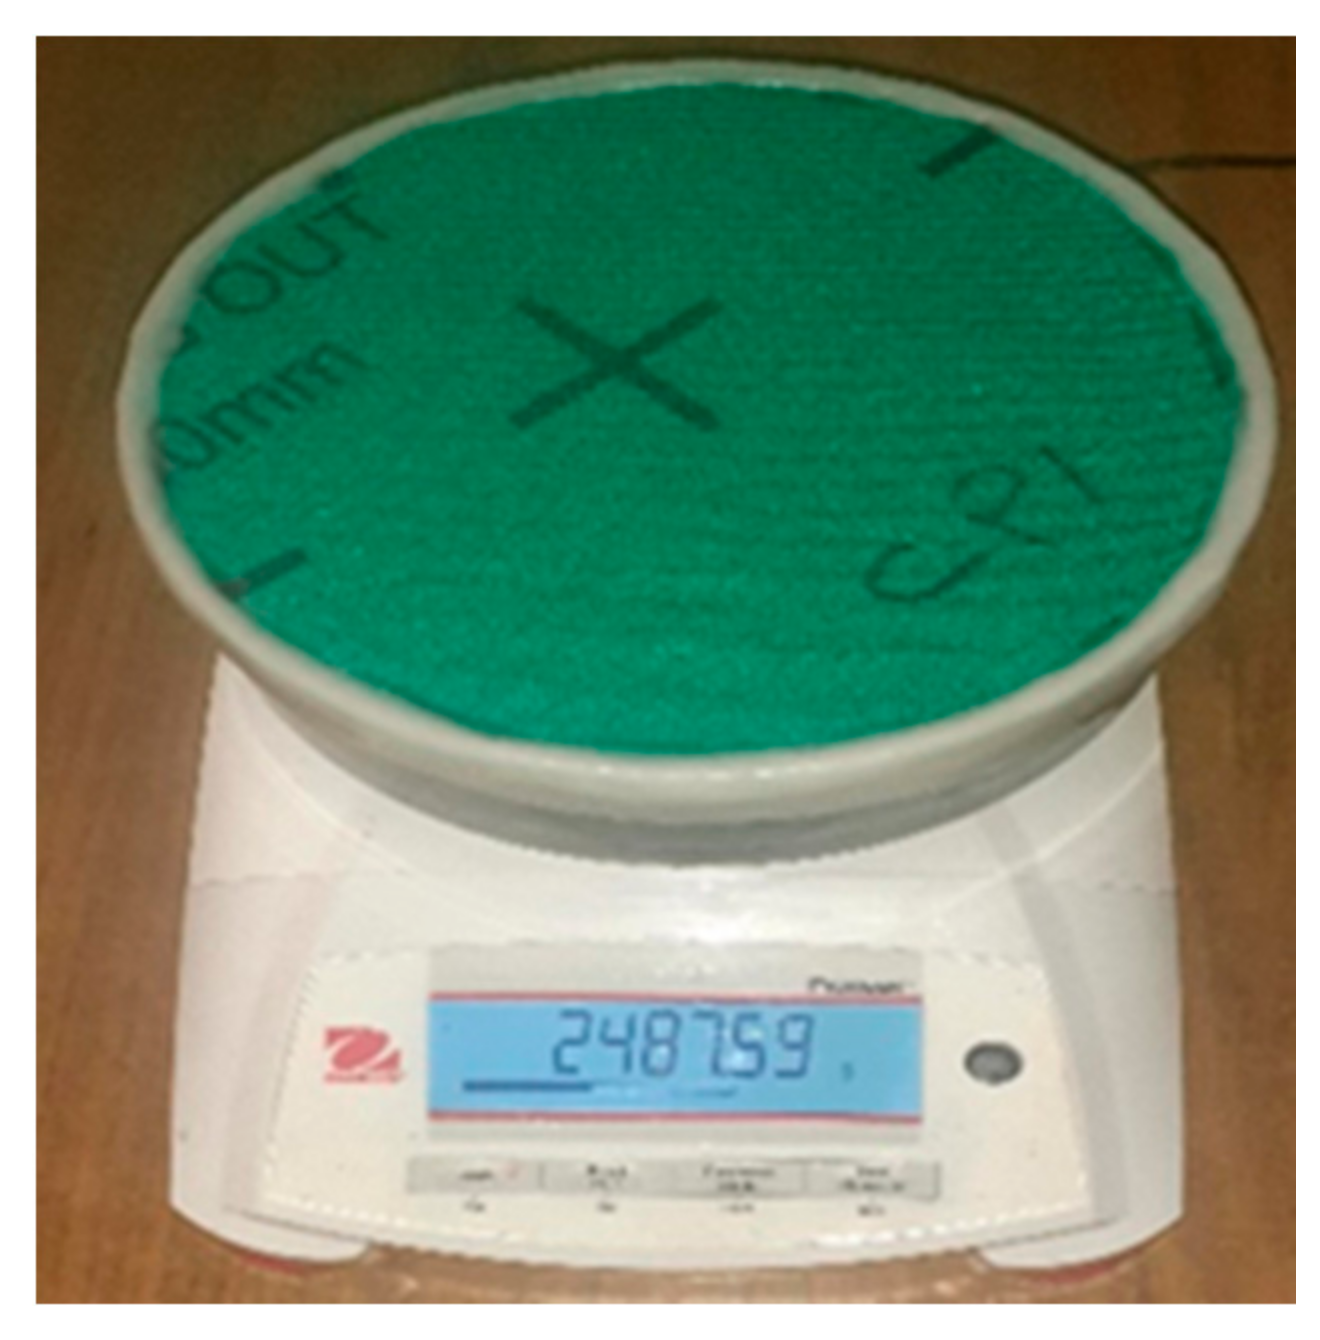
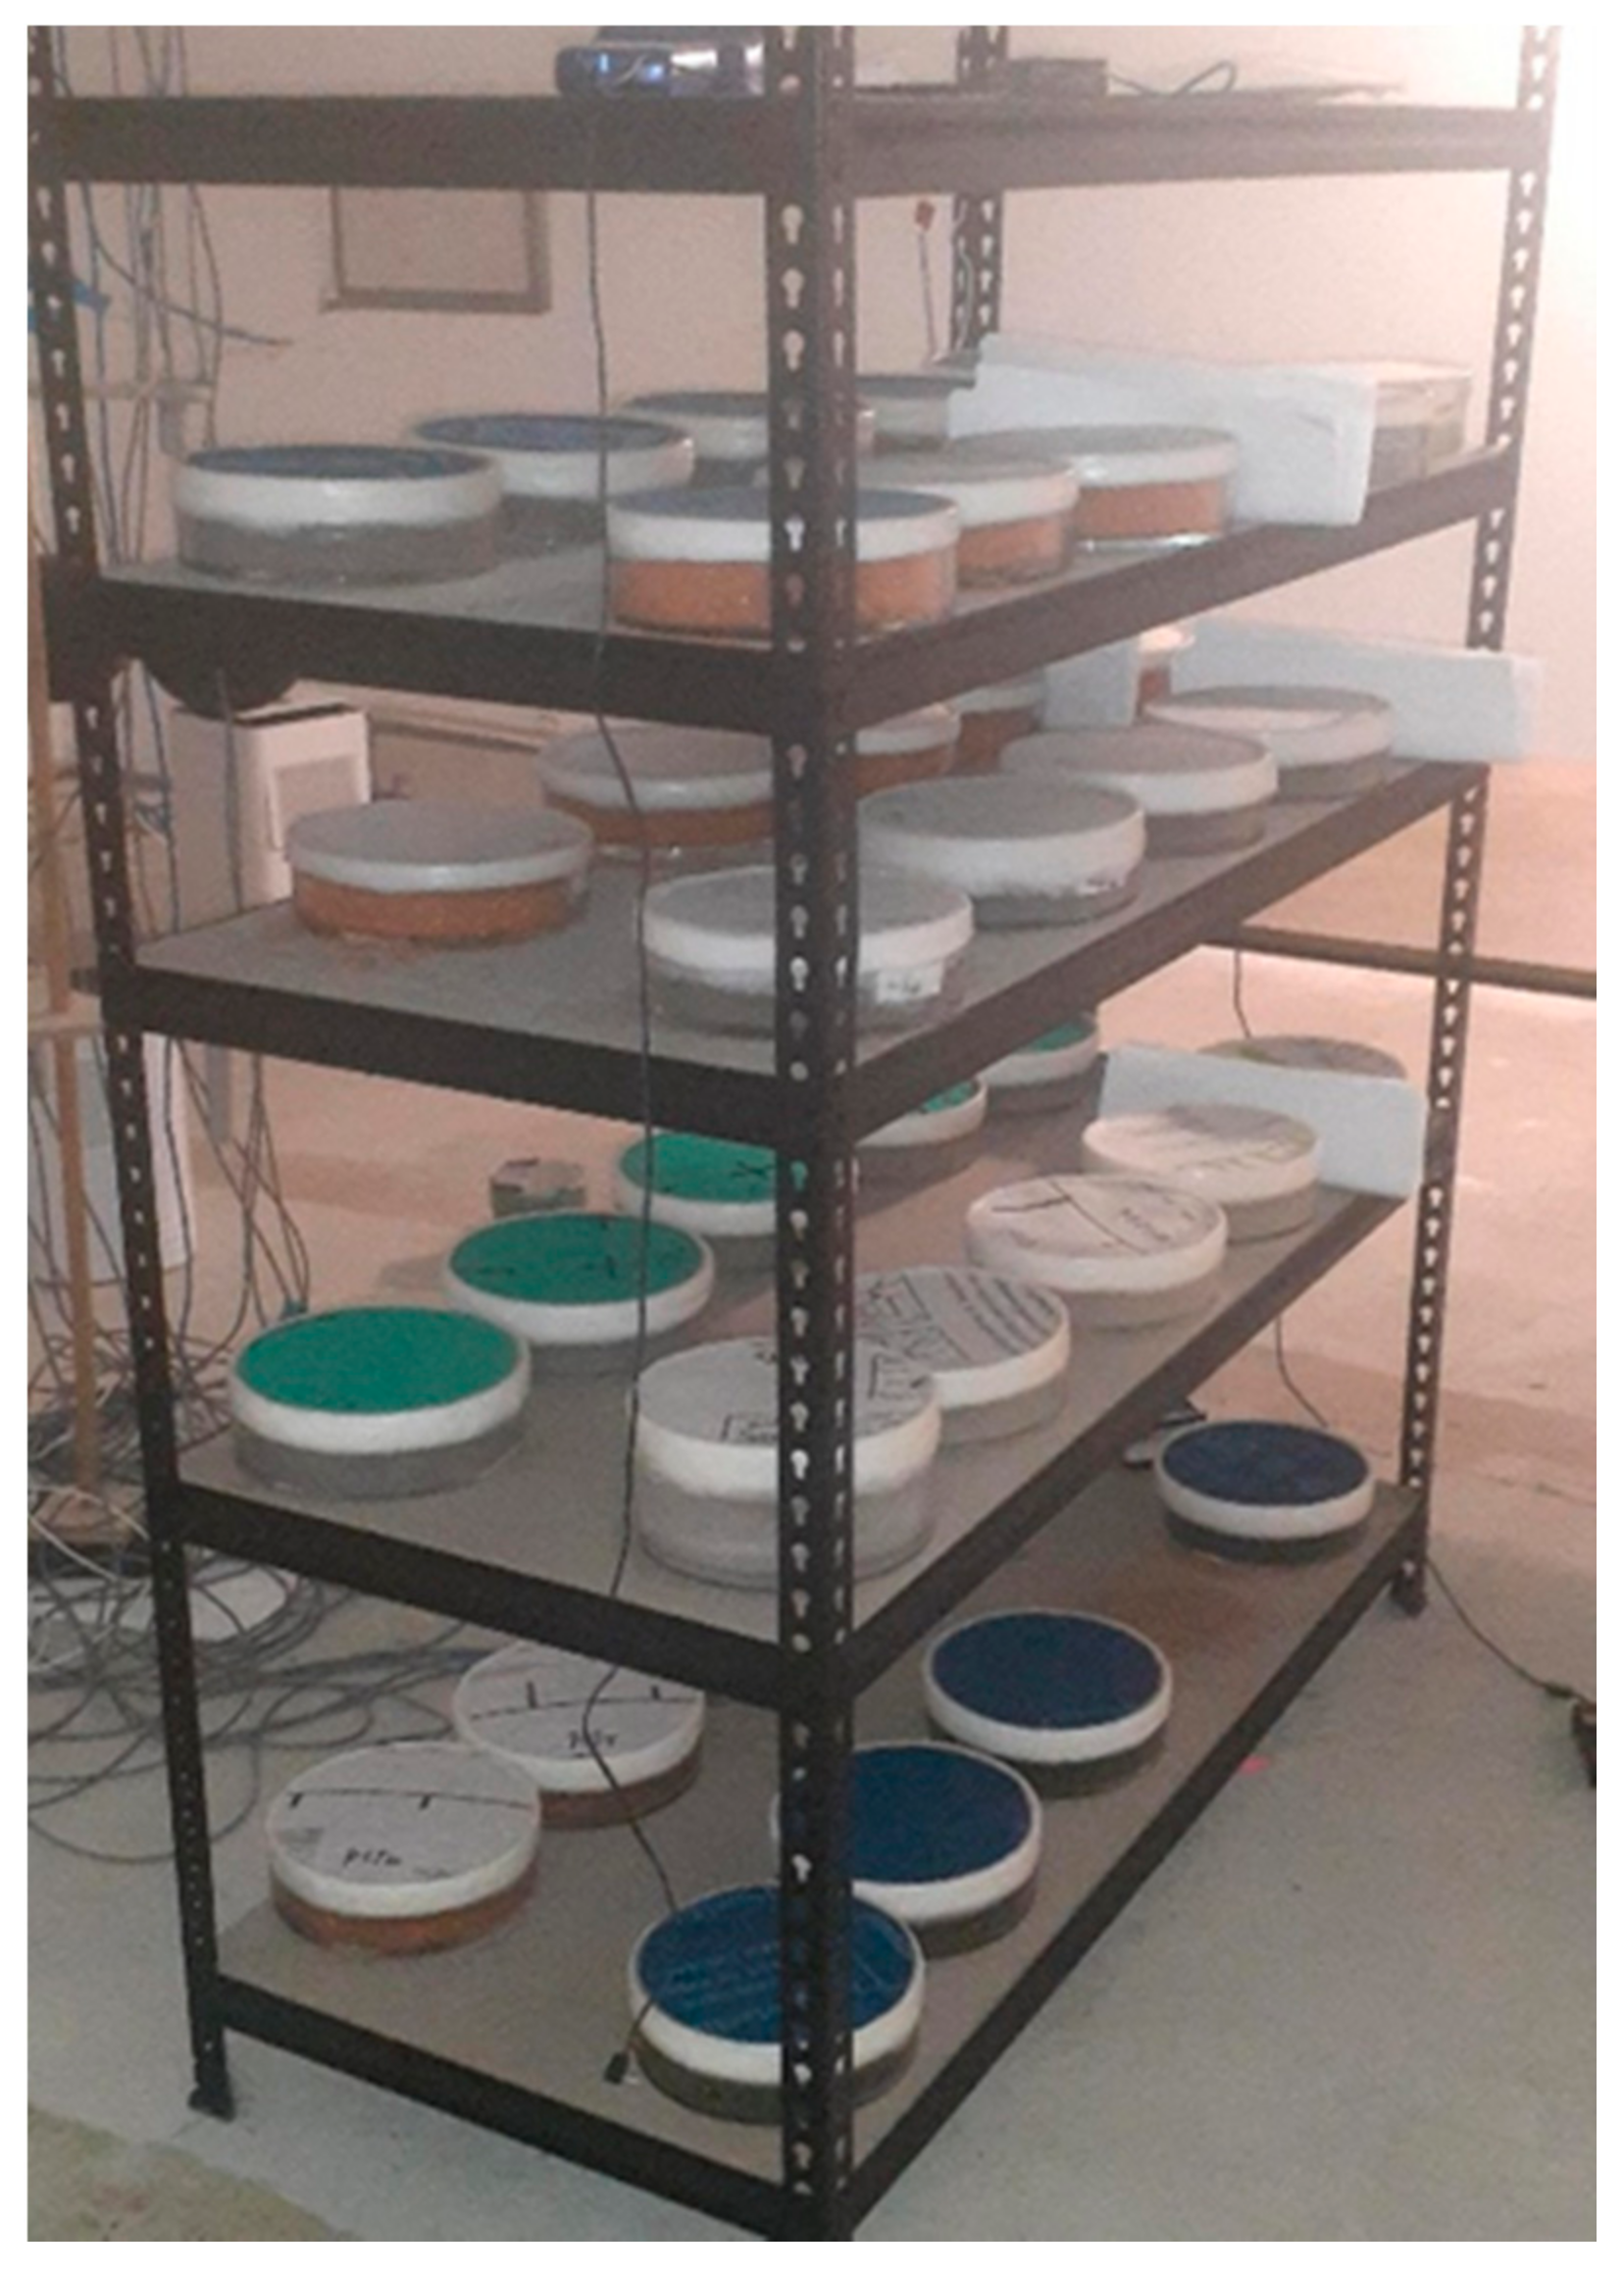
2.3. Gravimetric Measurement
2.4. Mathematical Equation and Water Vapour Diffusion Resistivity Properties Calculation
3. Results
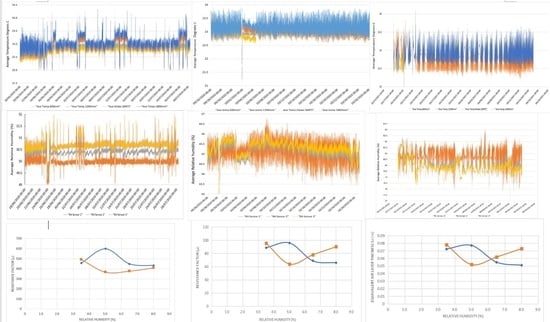
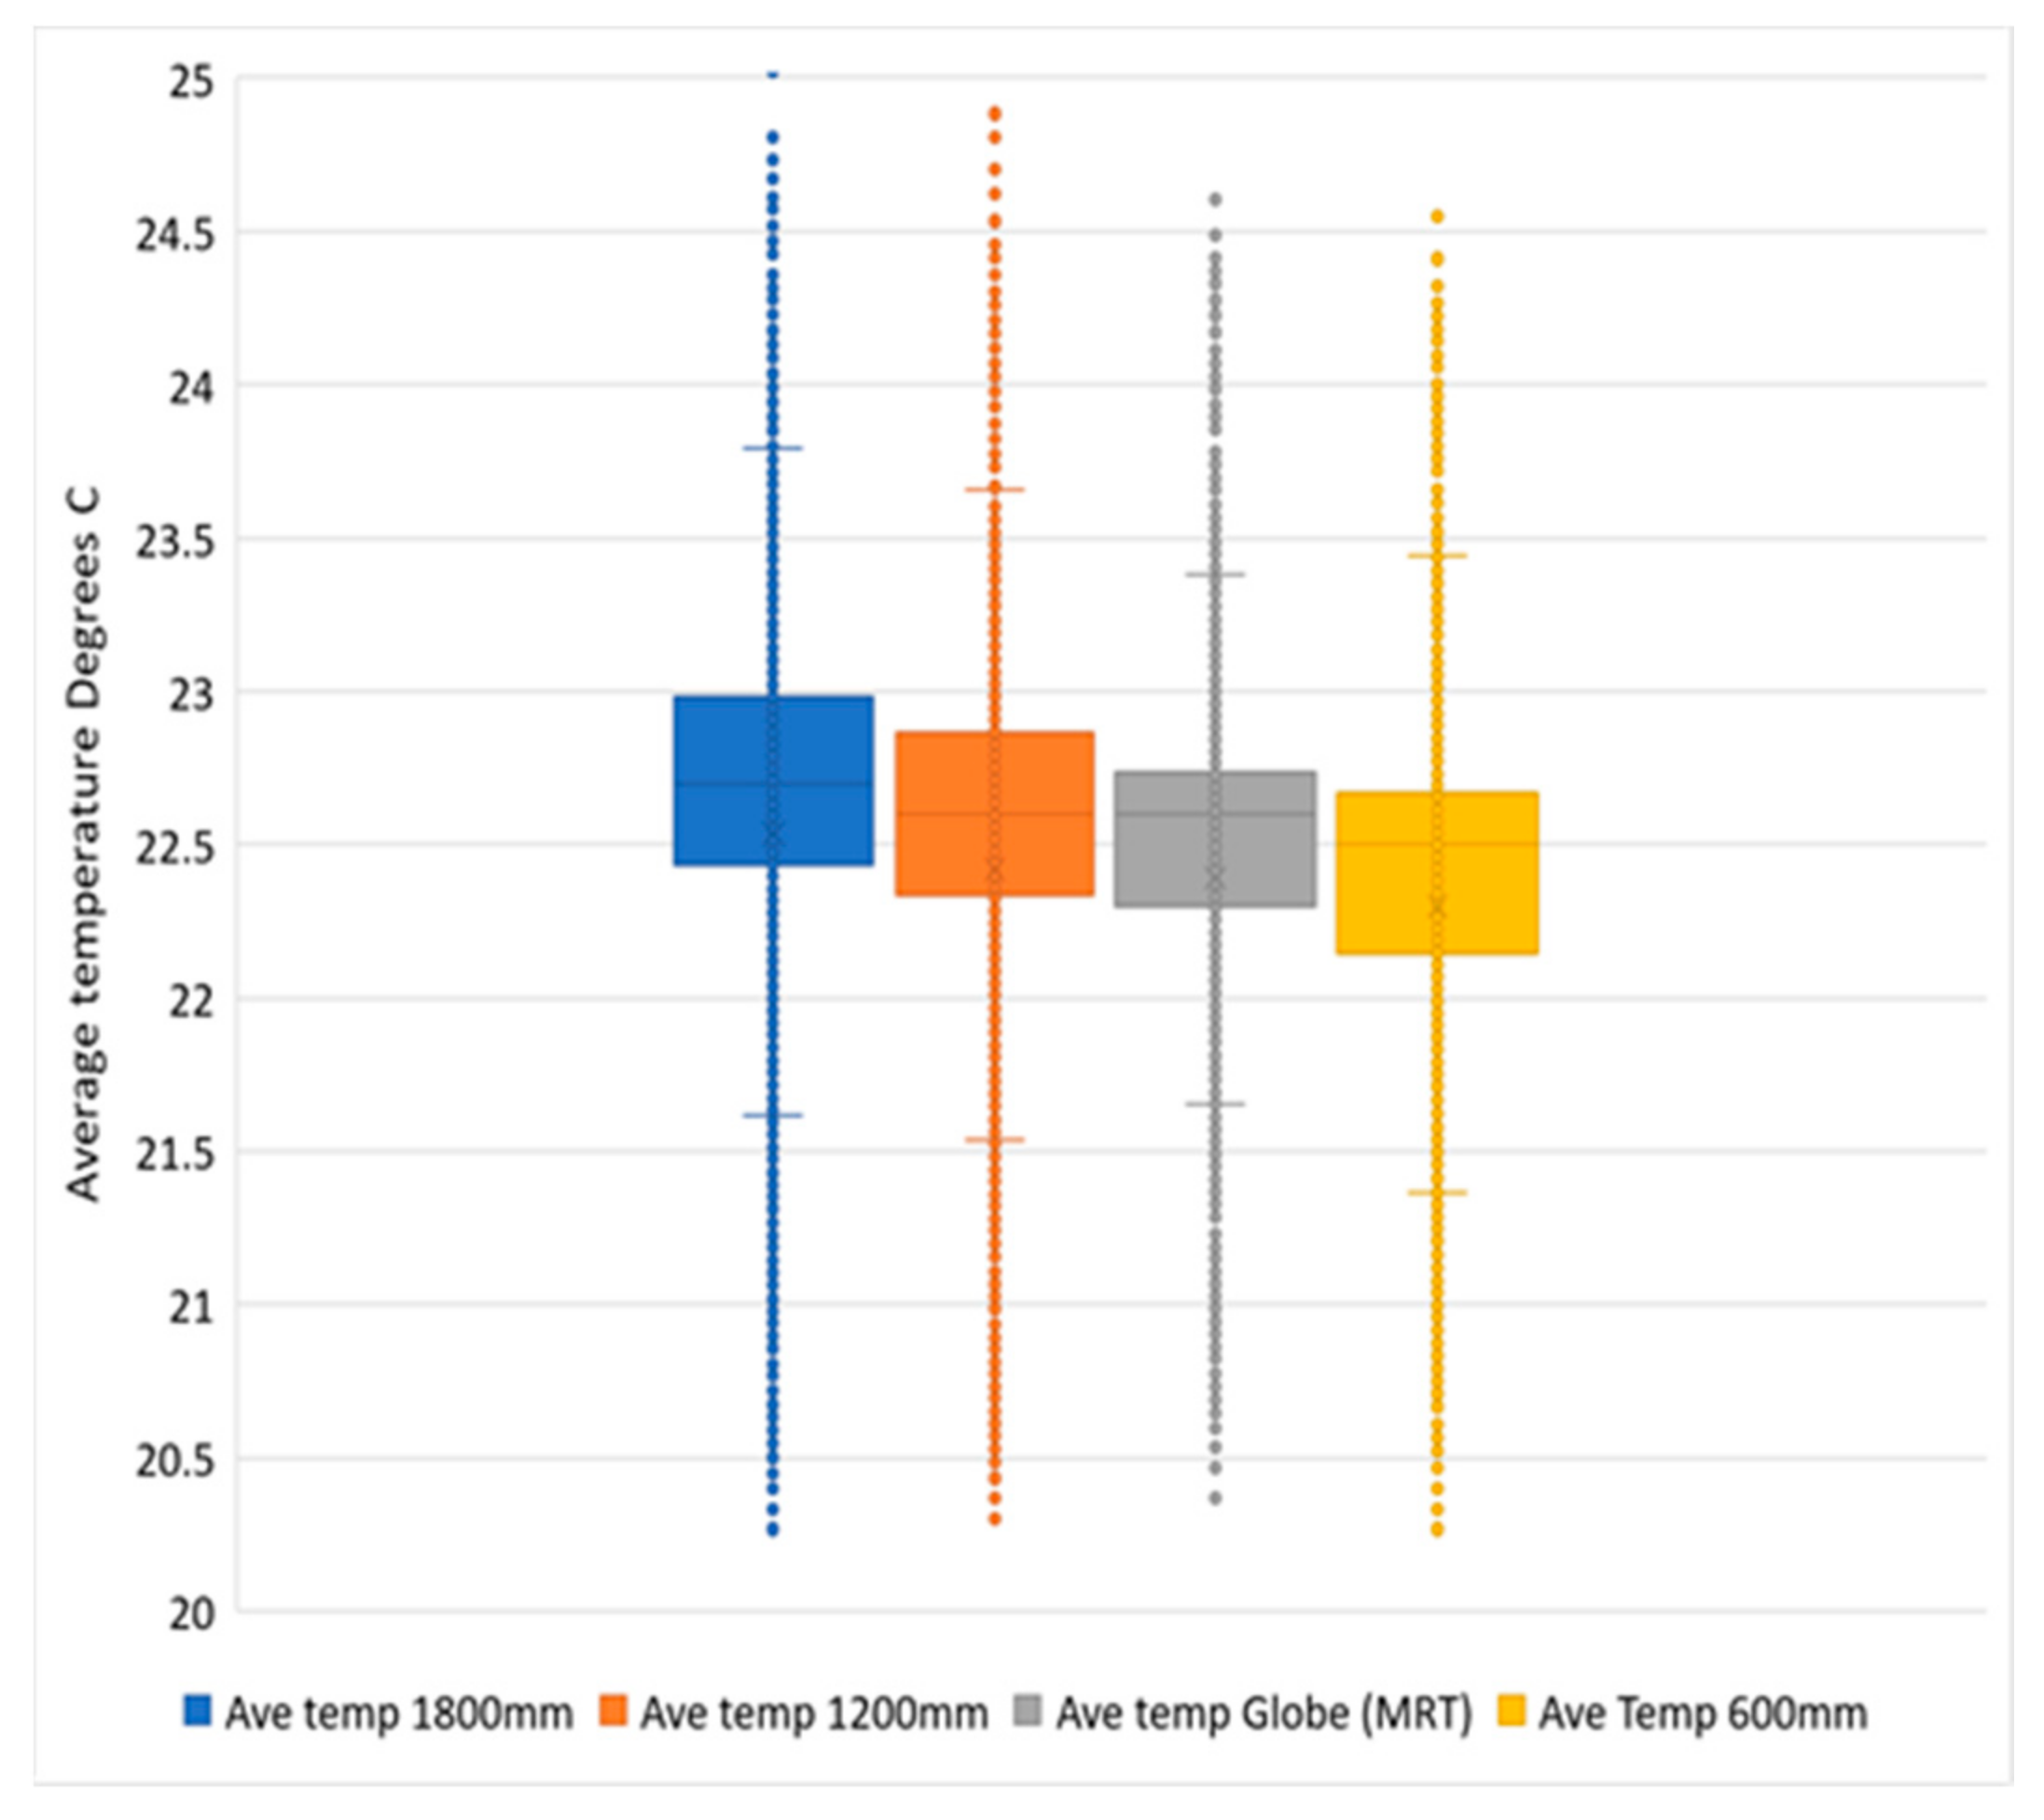
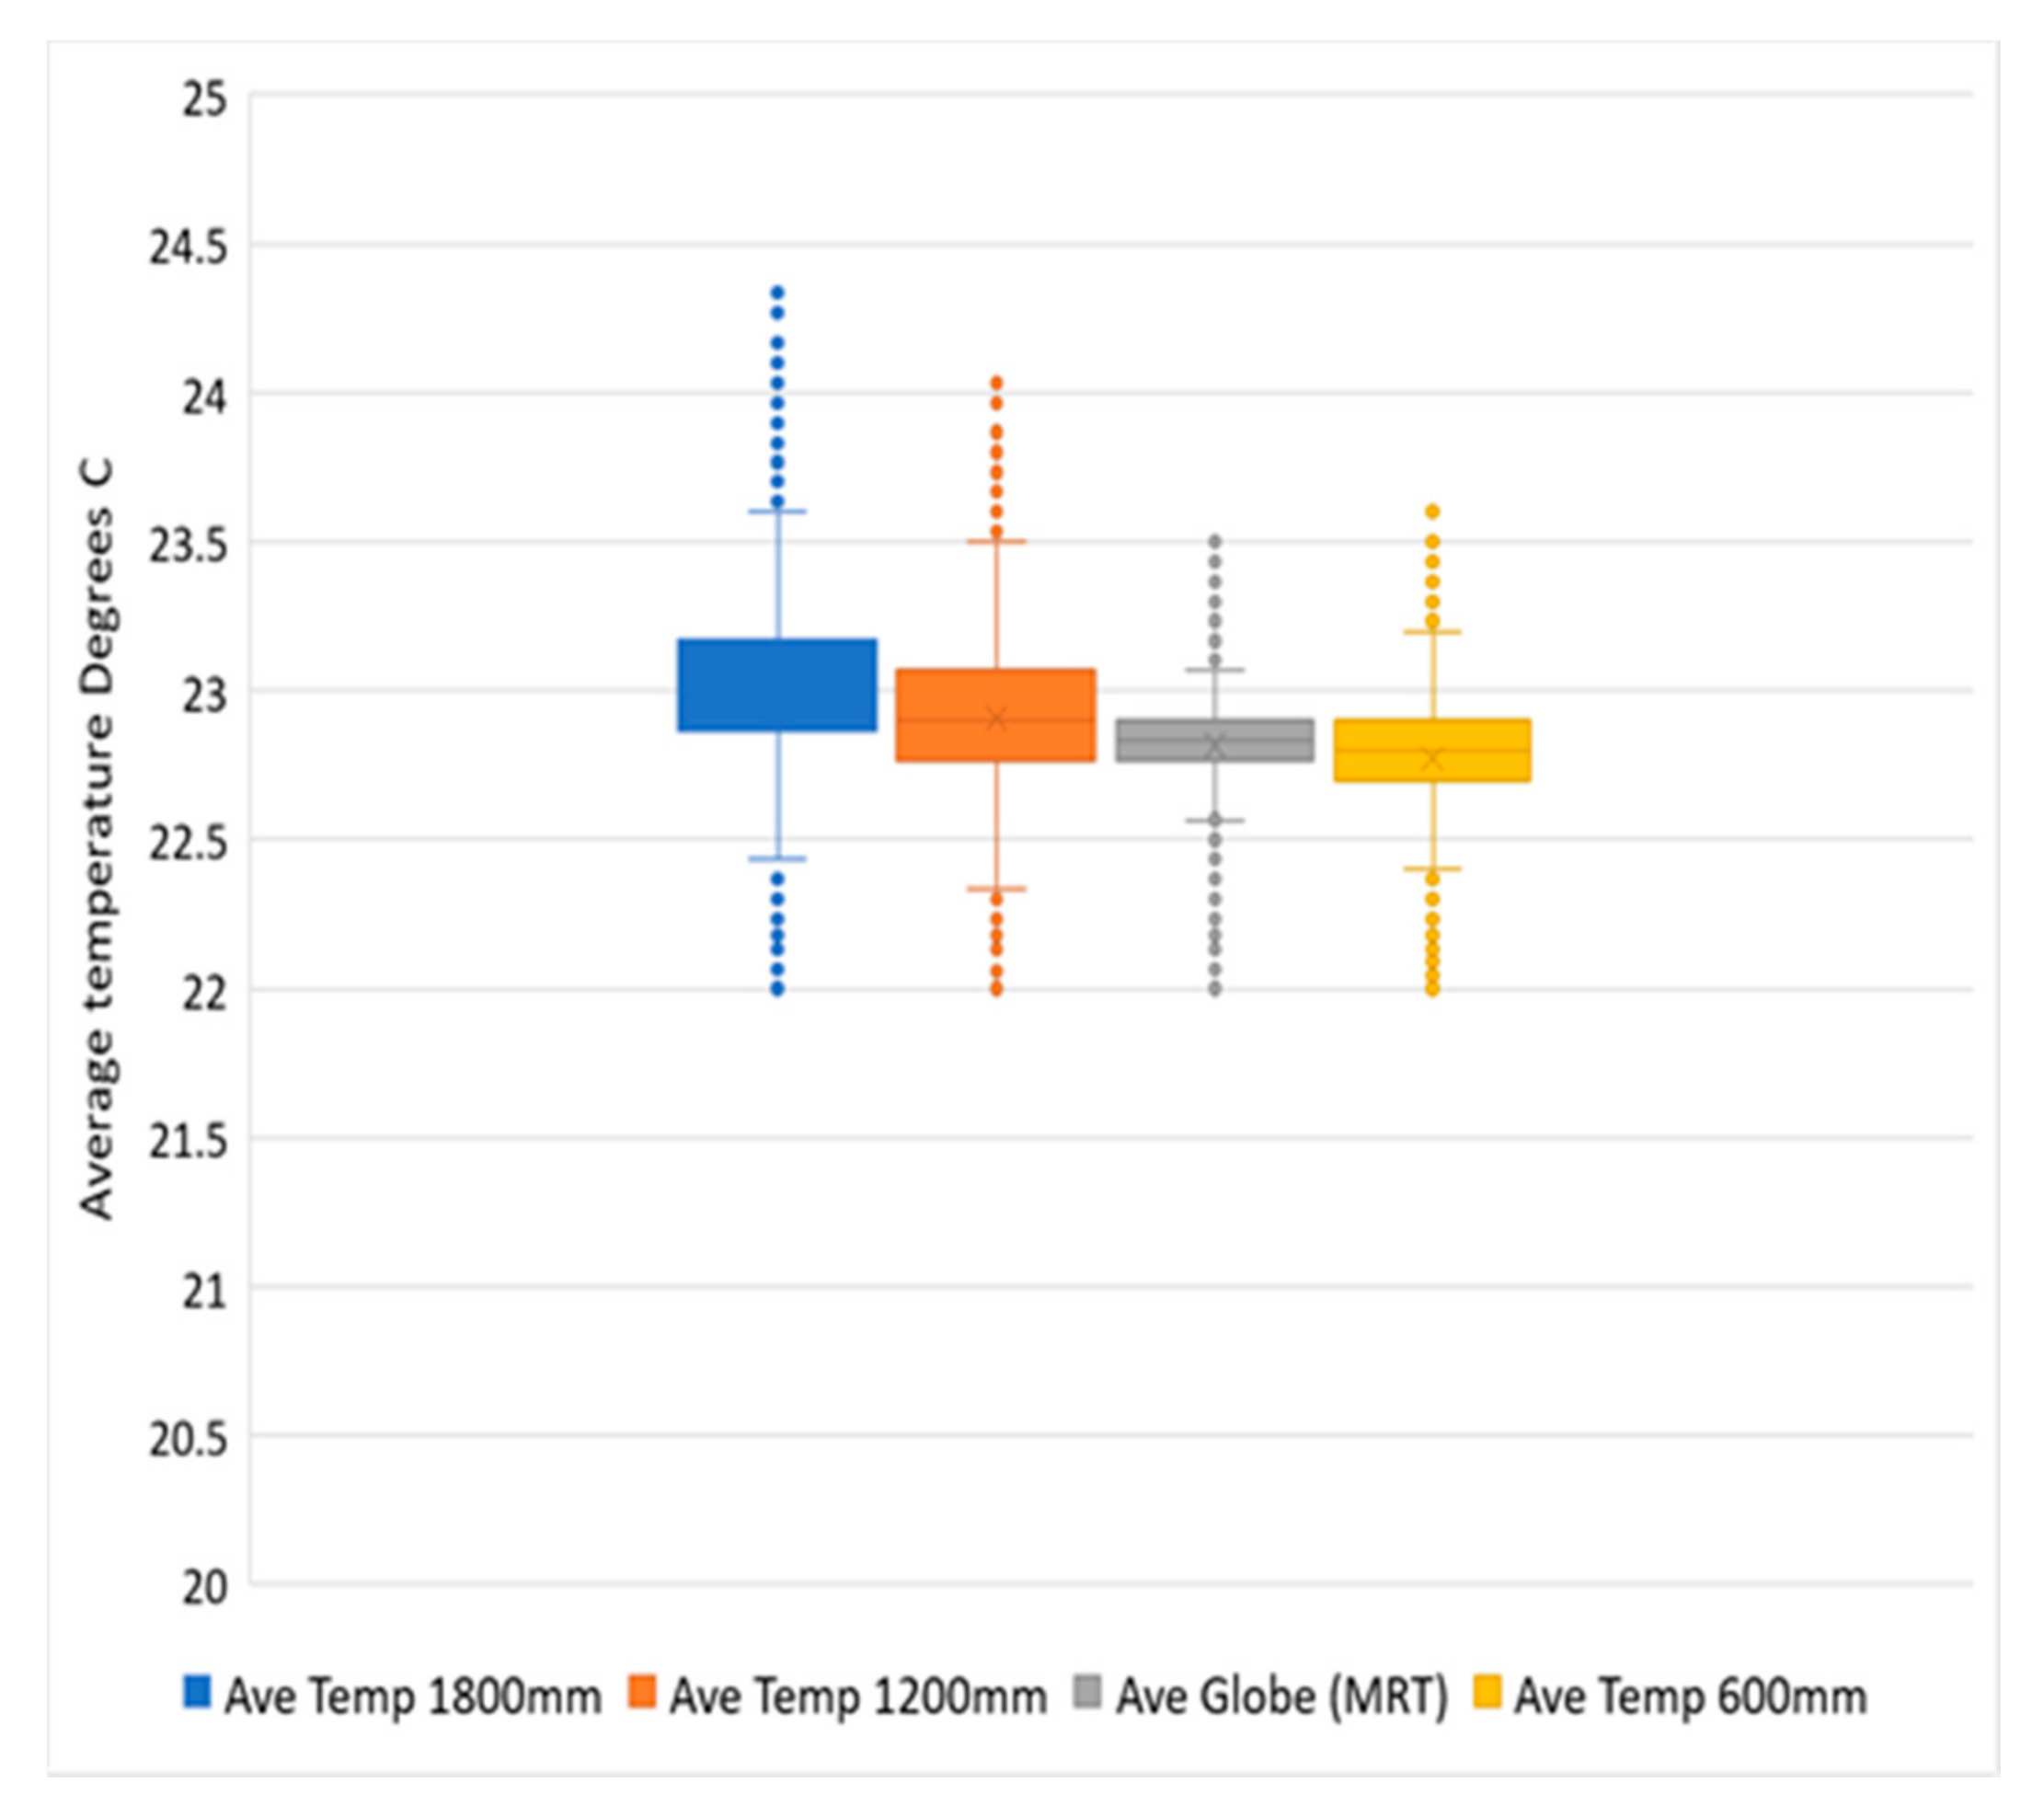
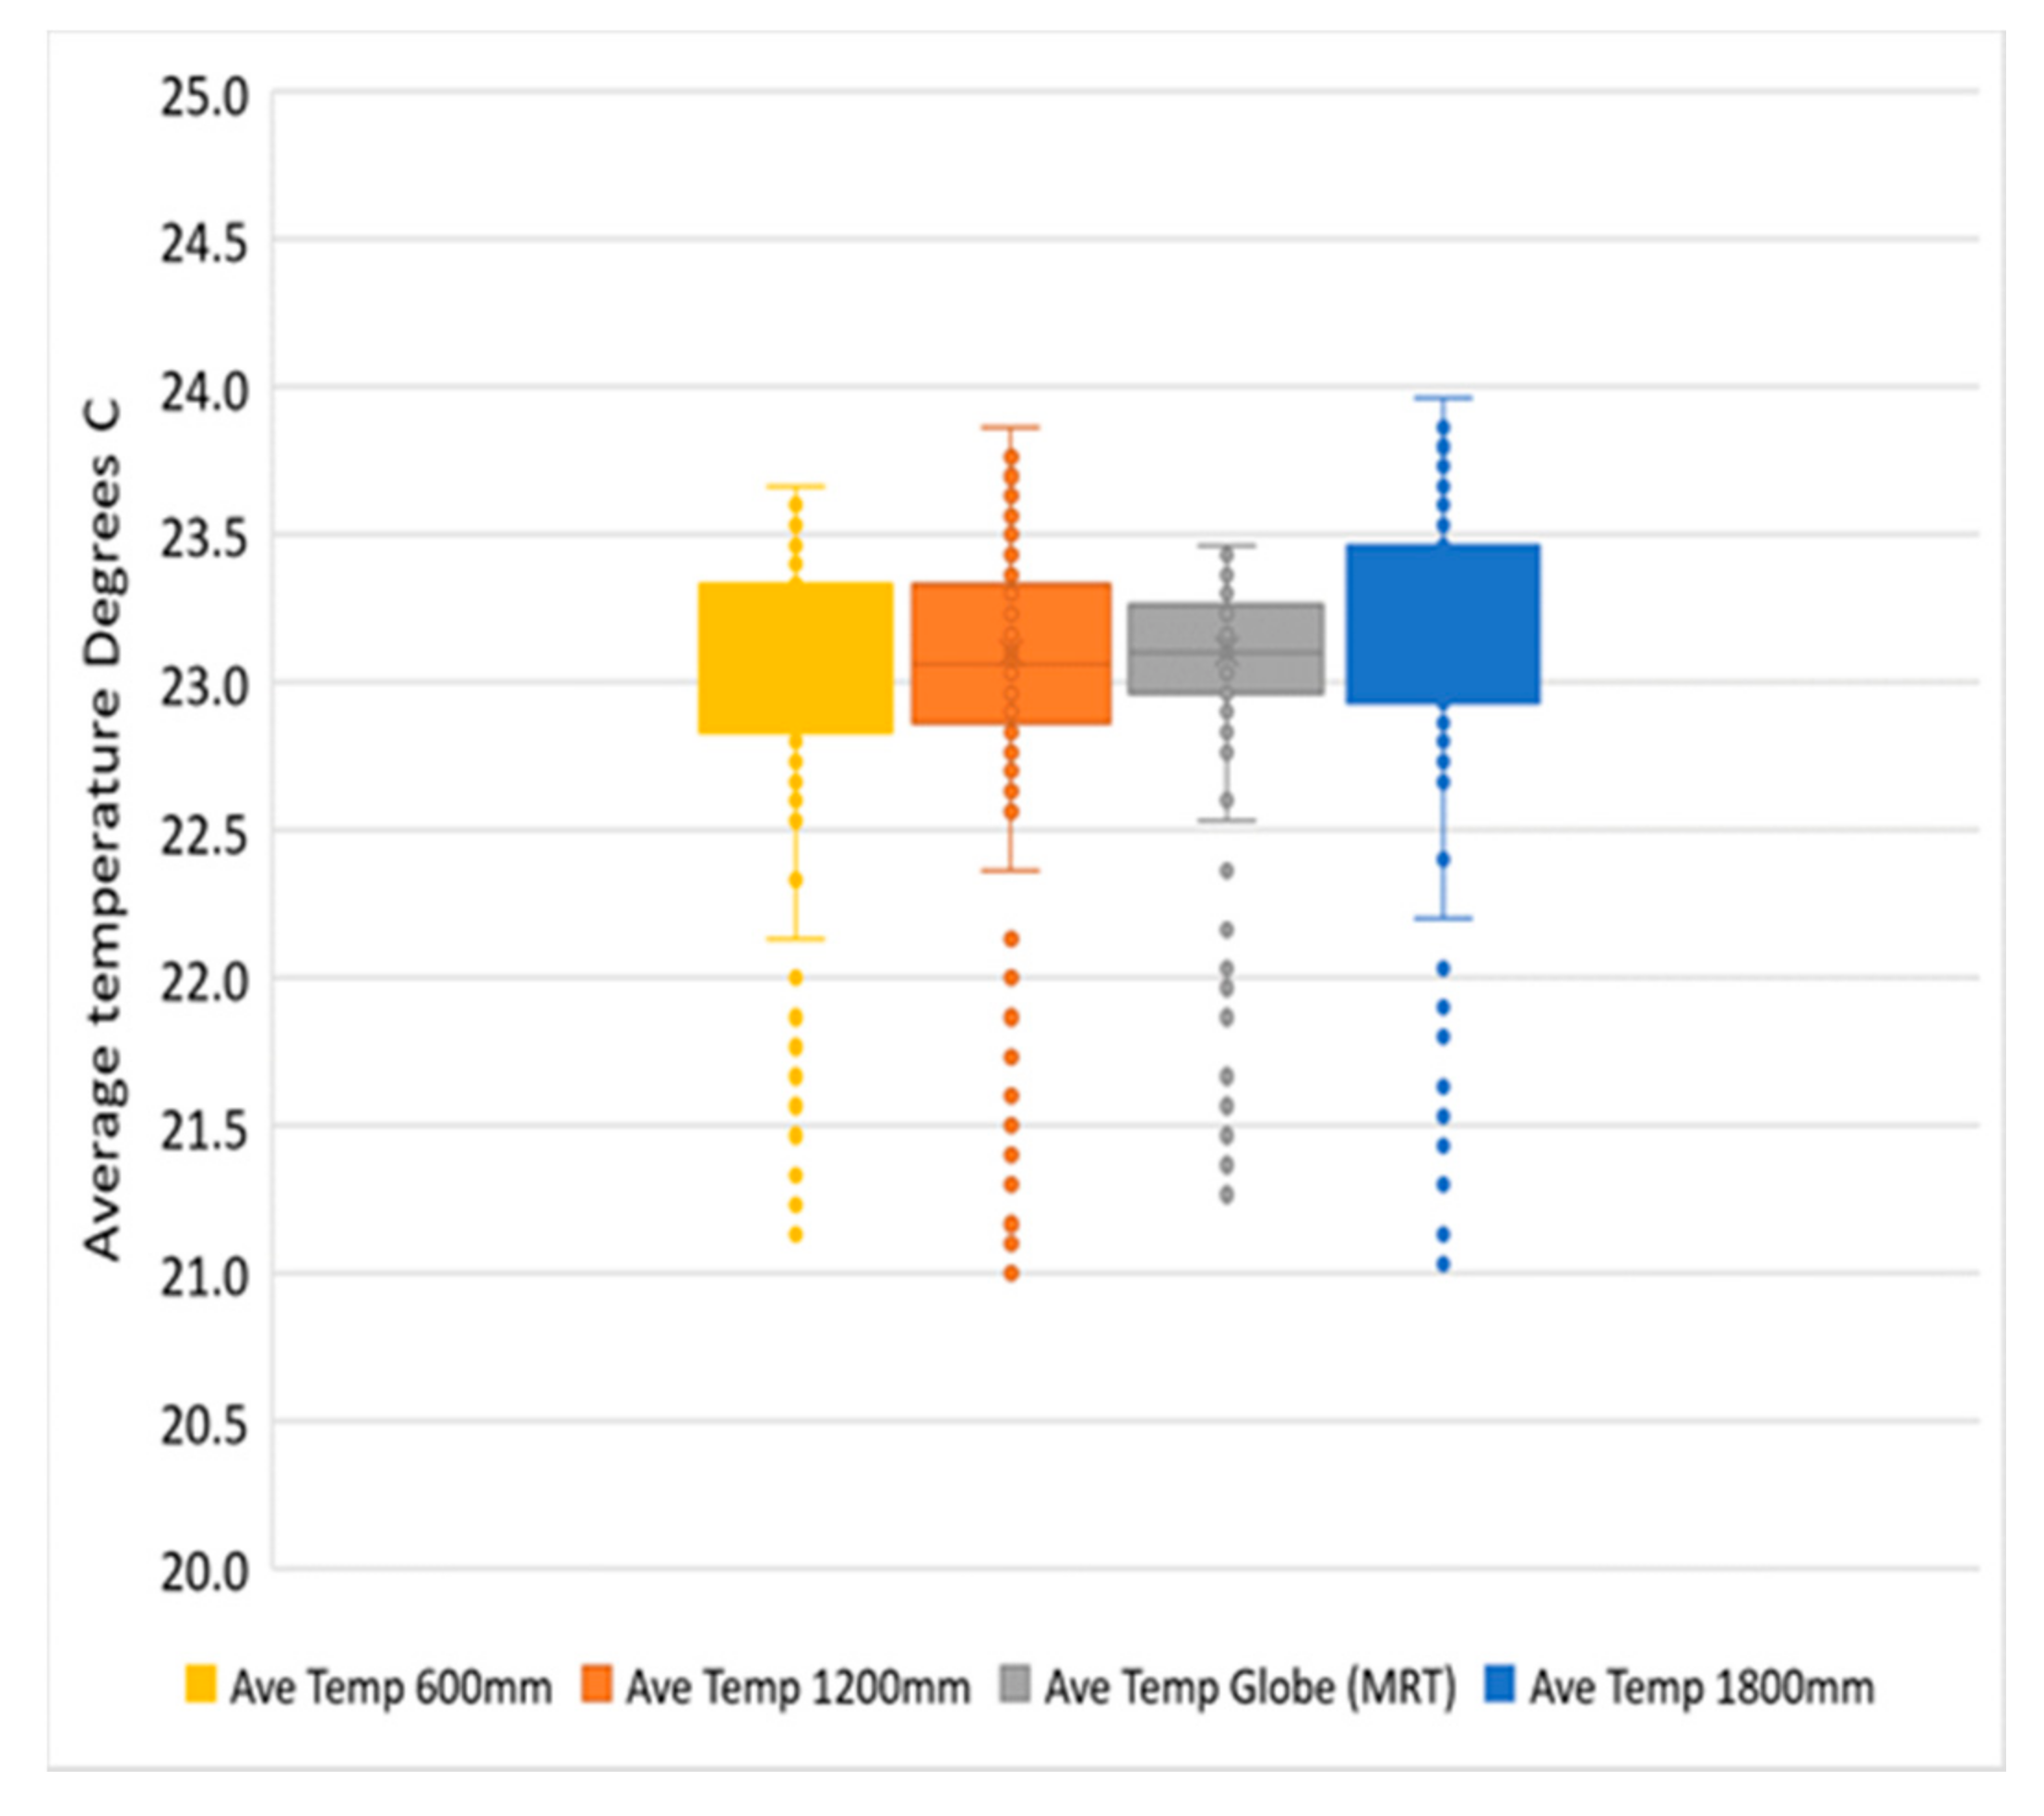
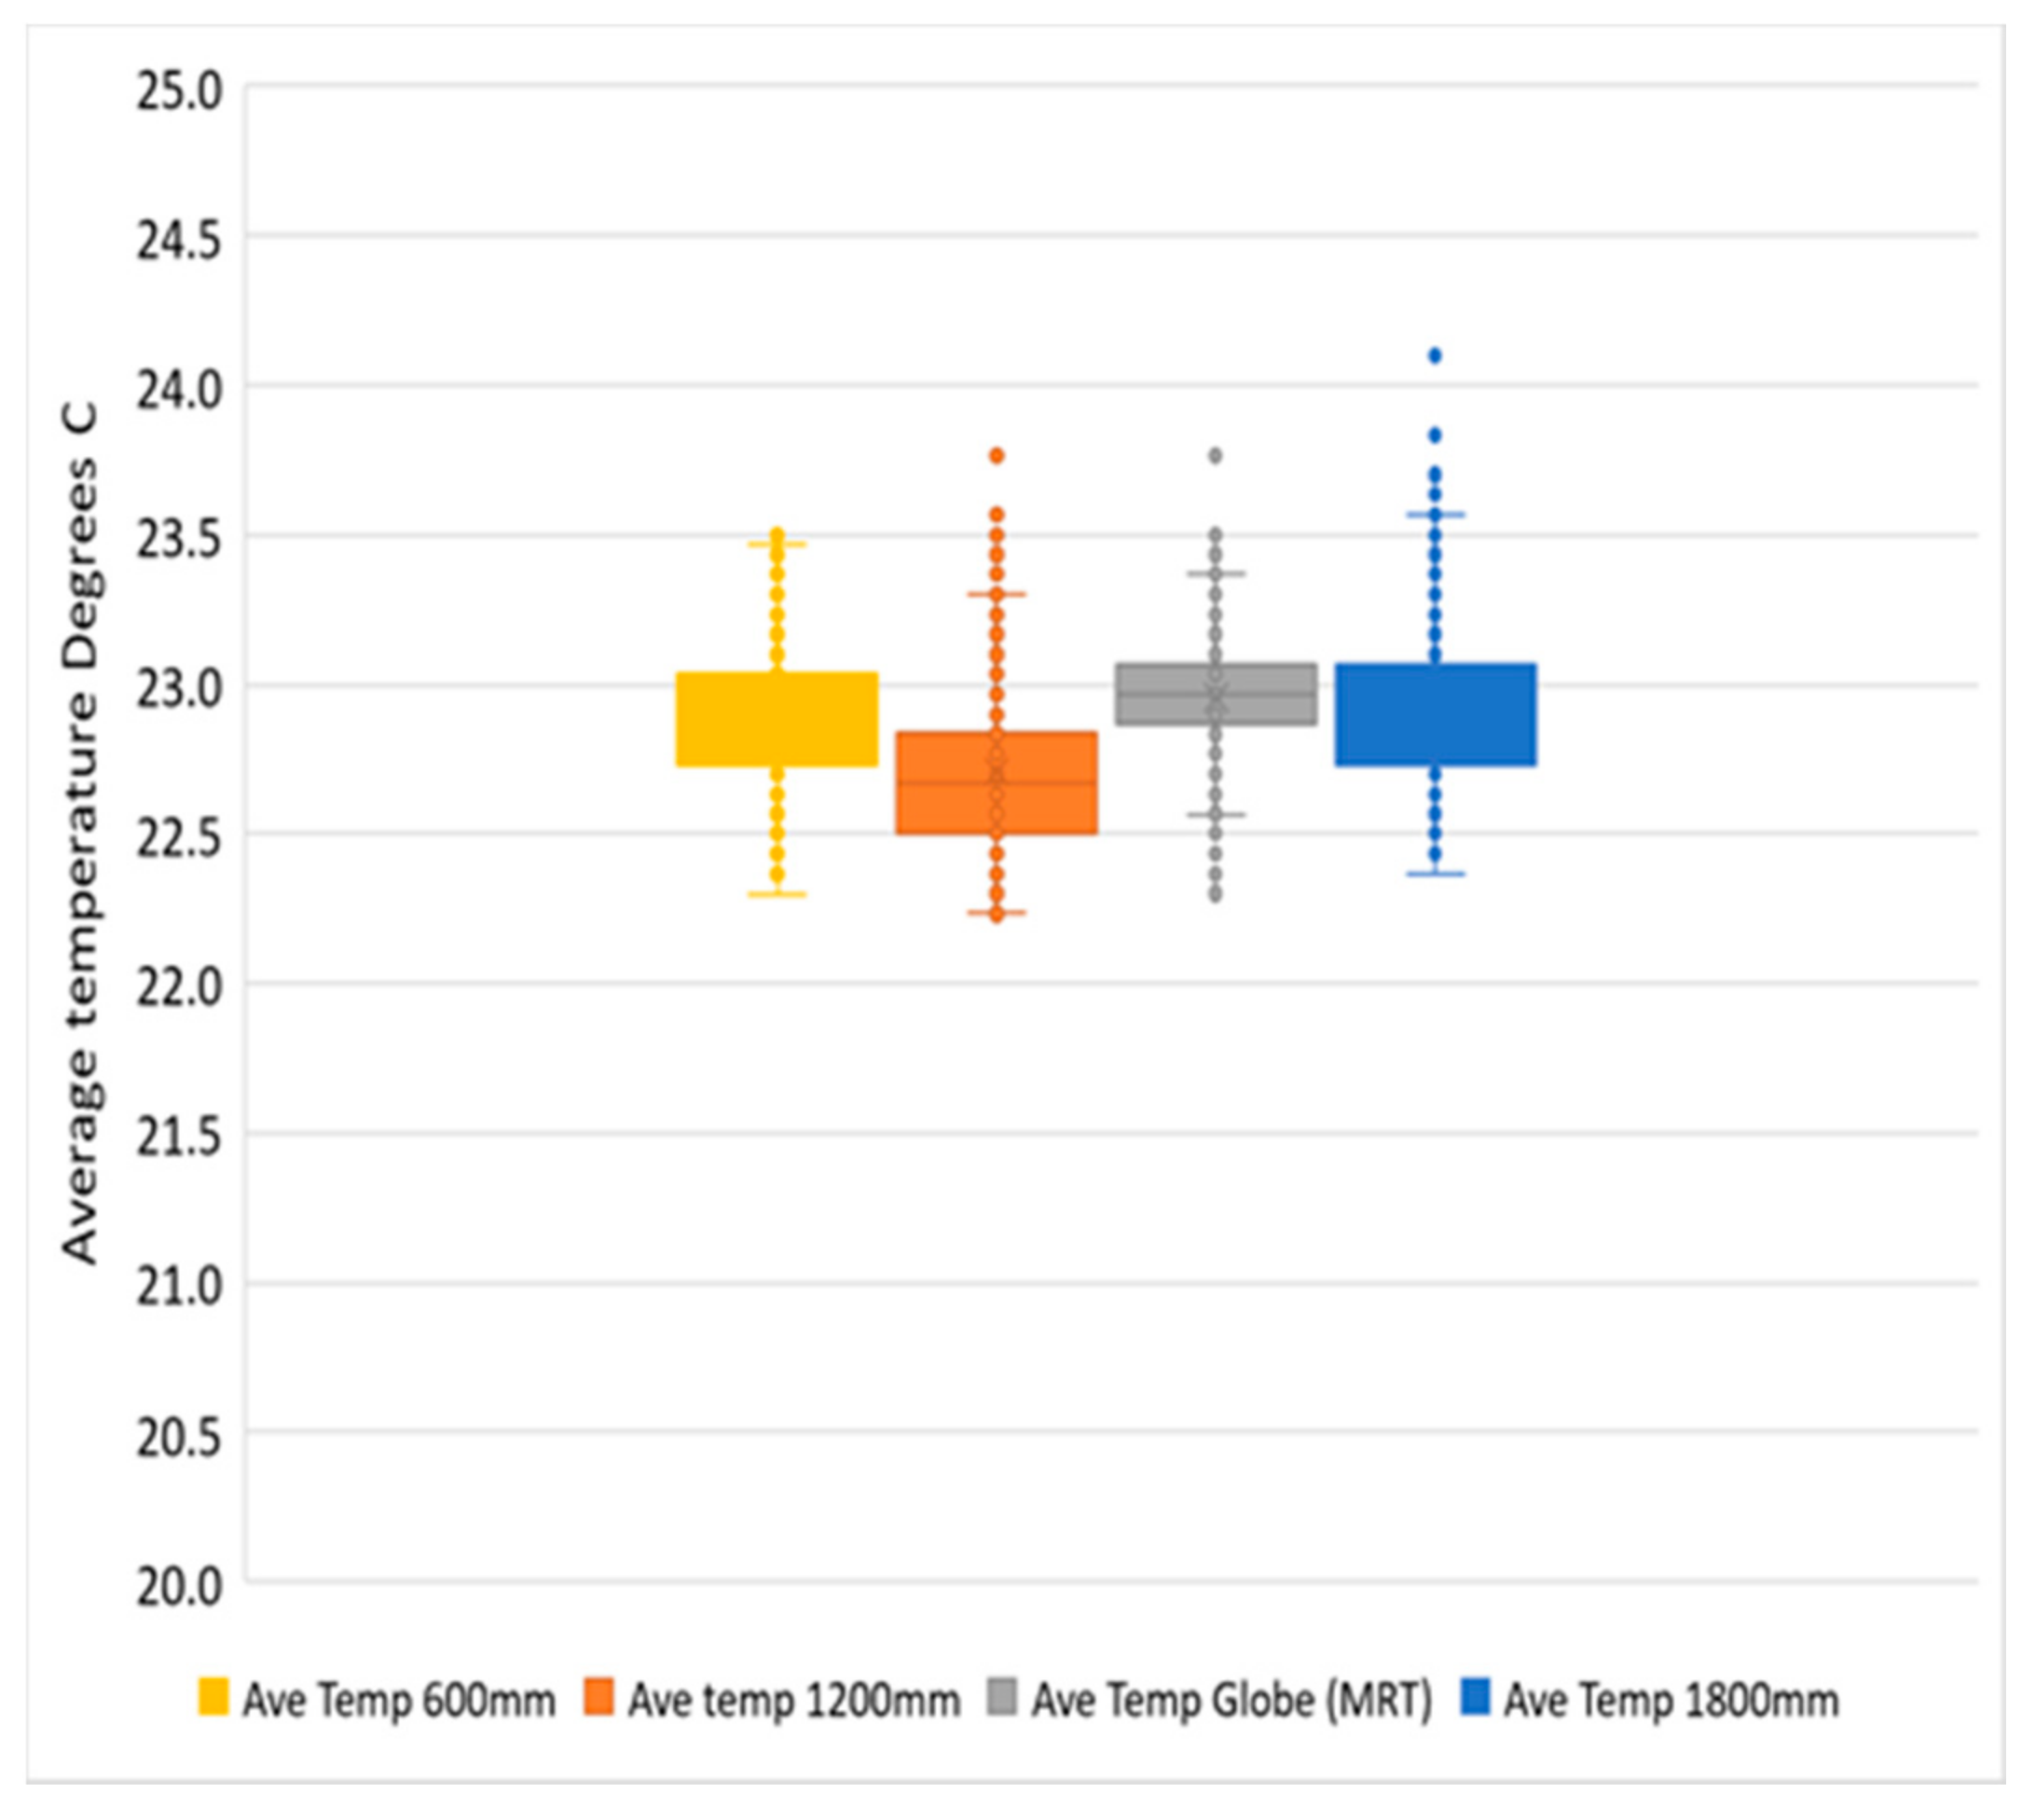
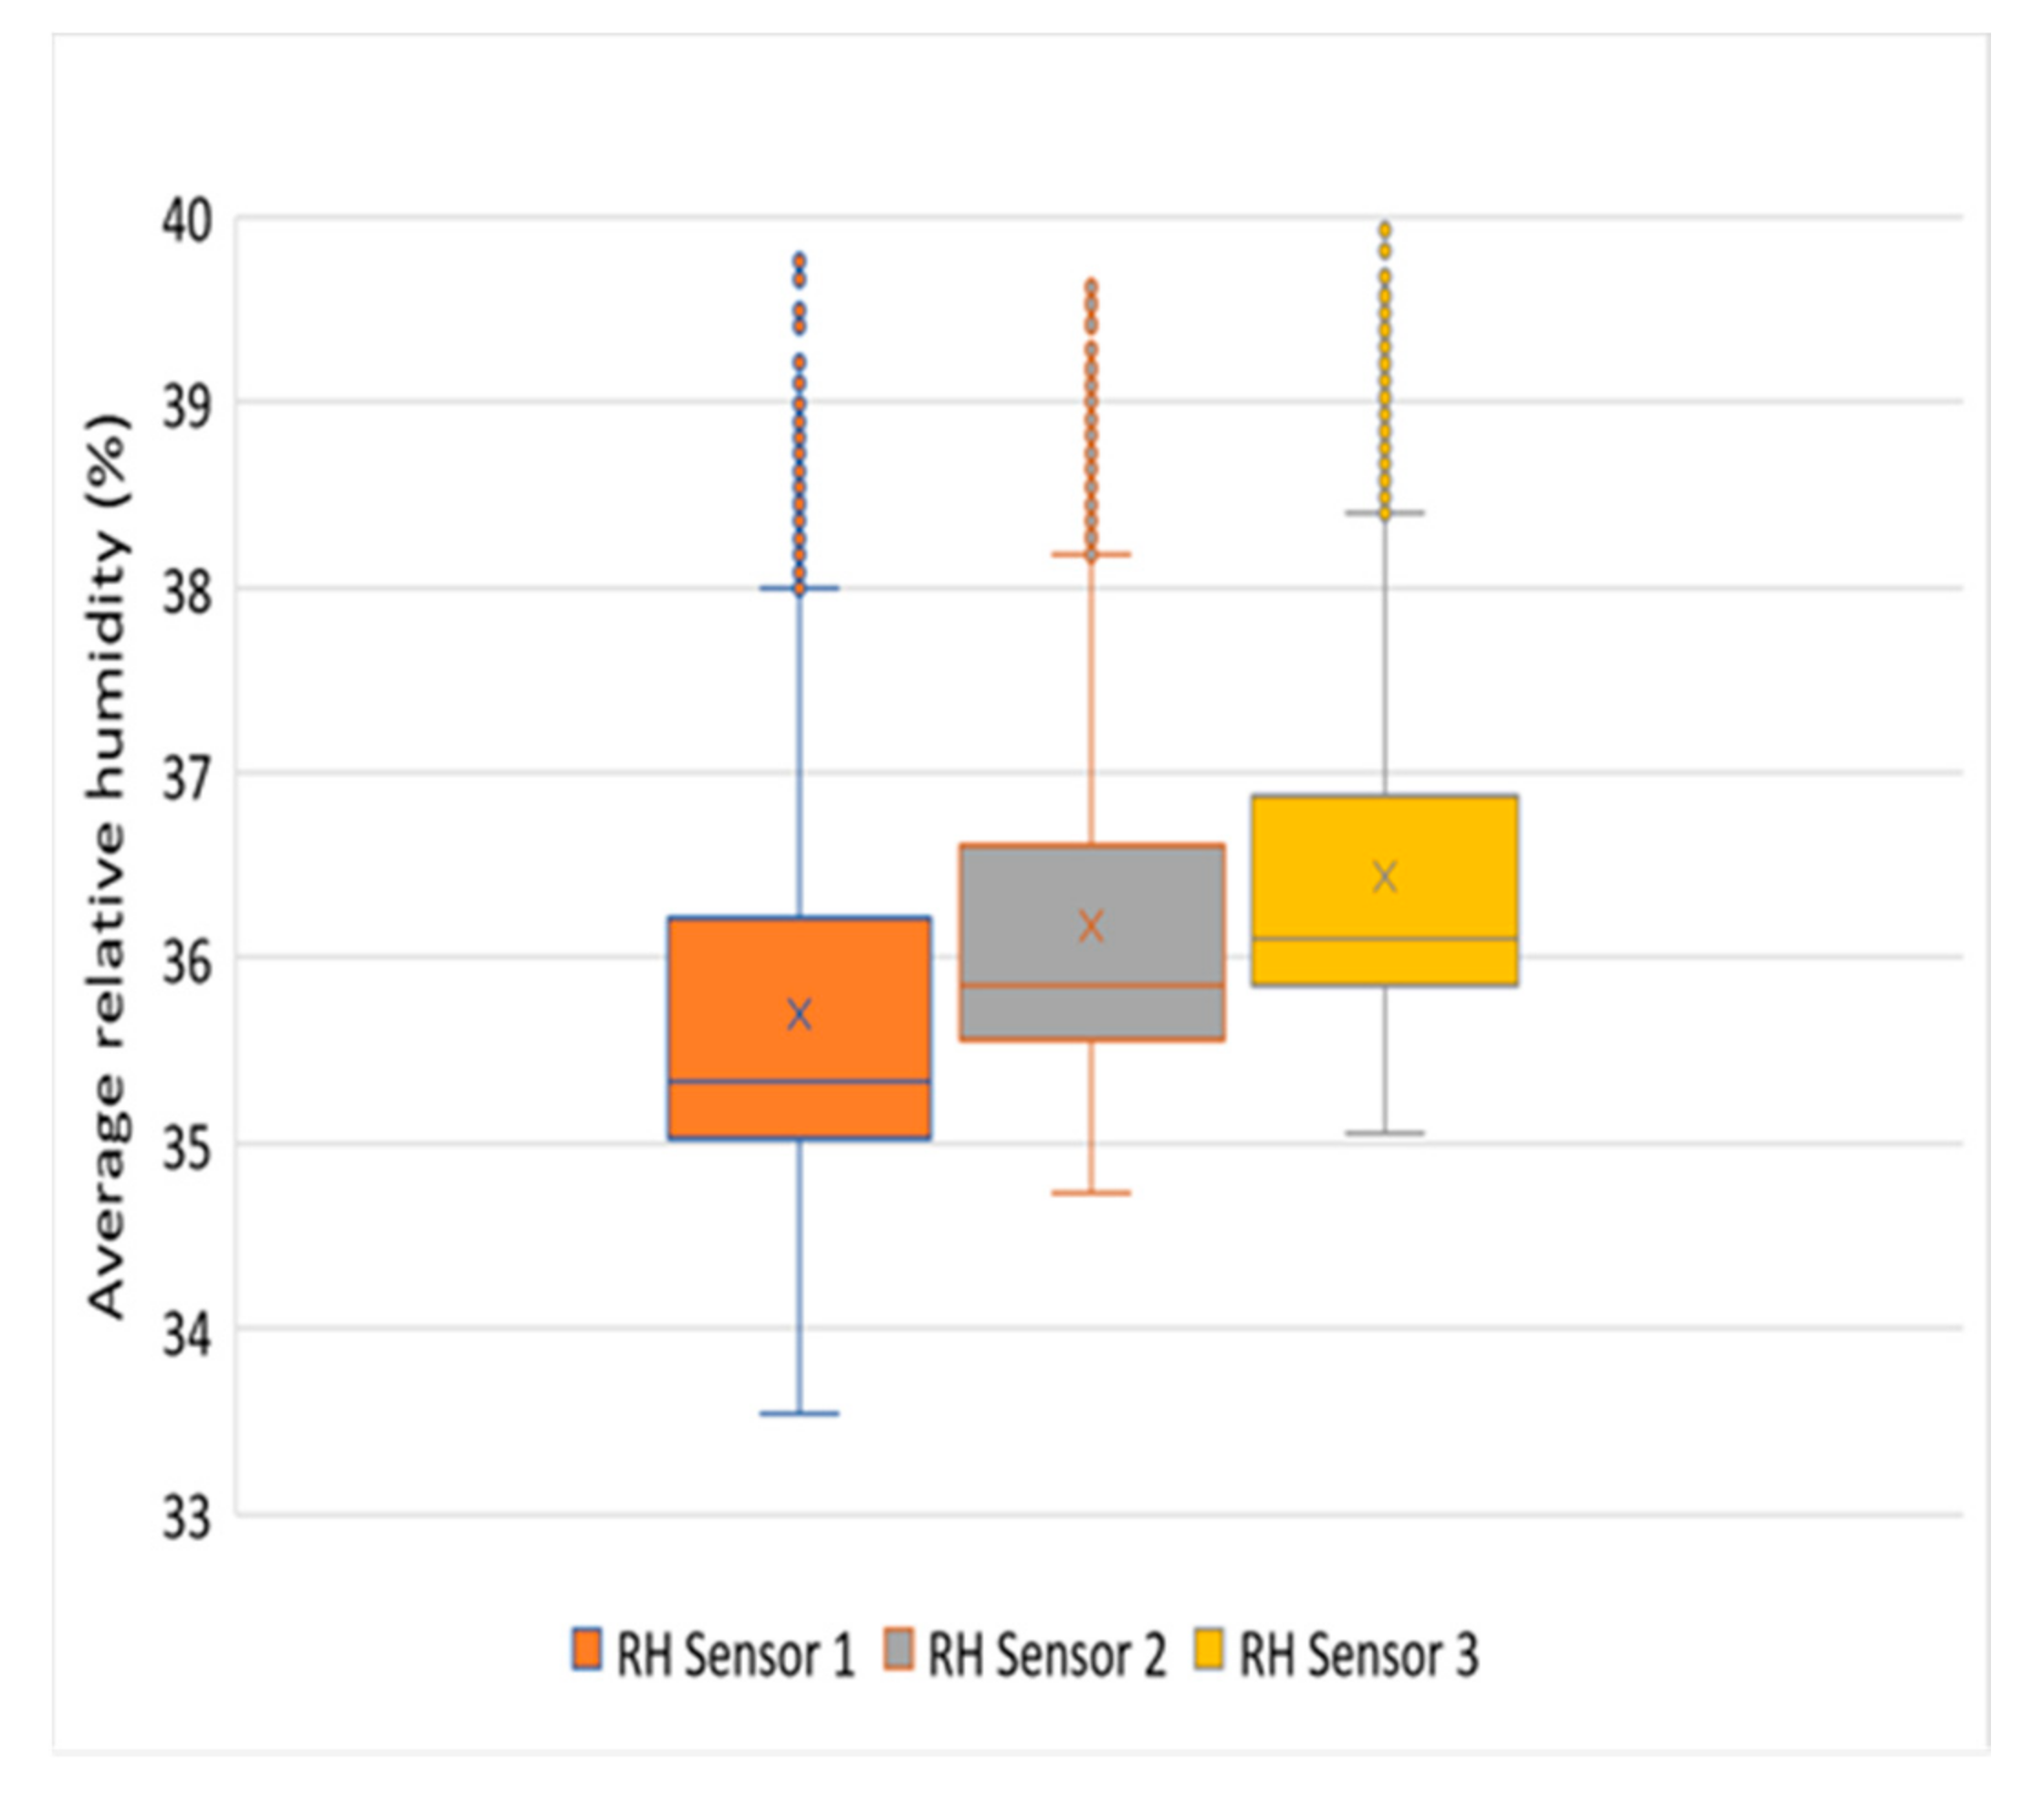
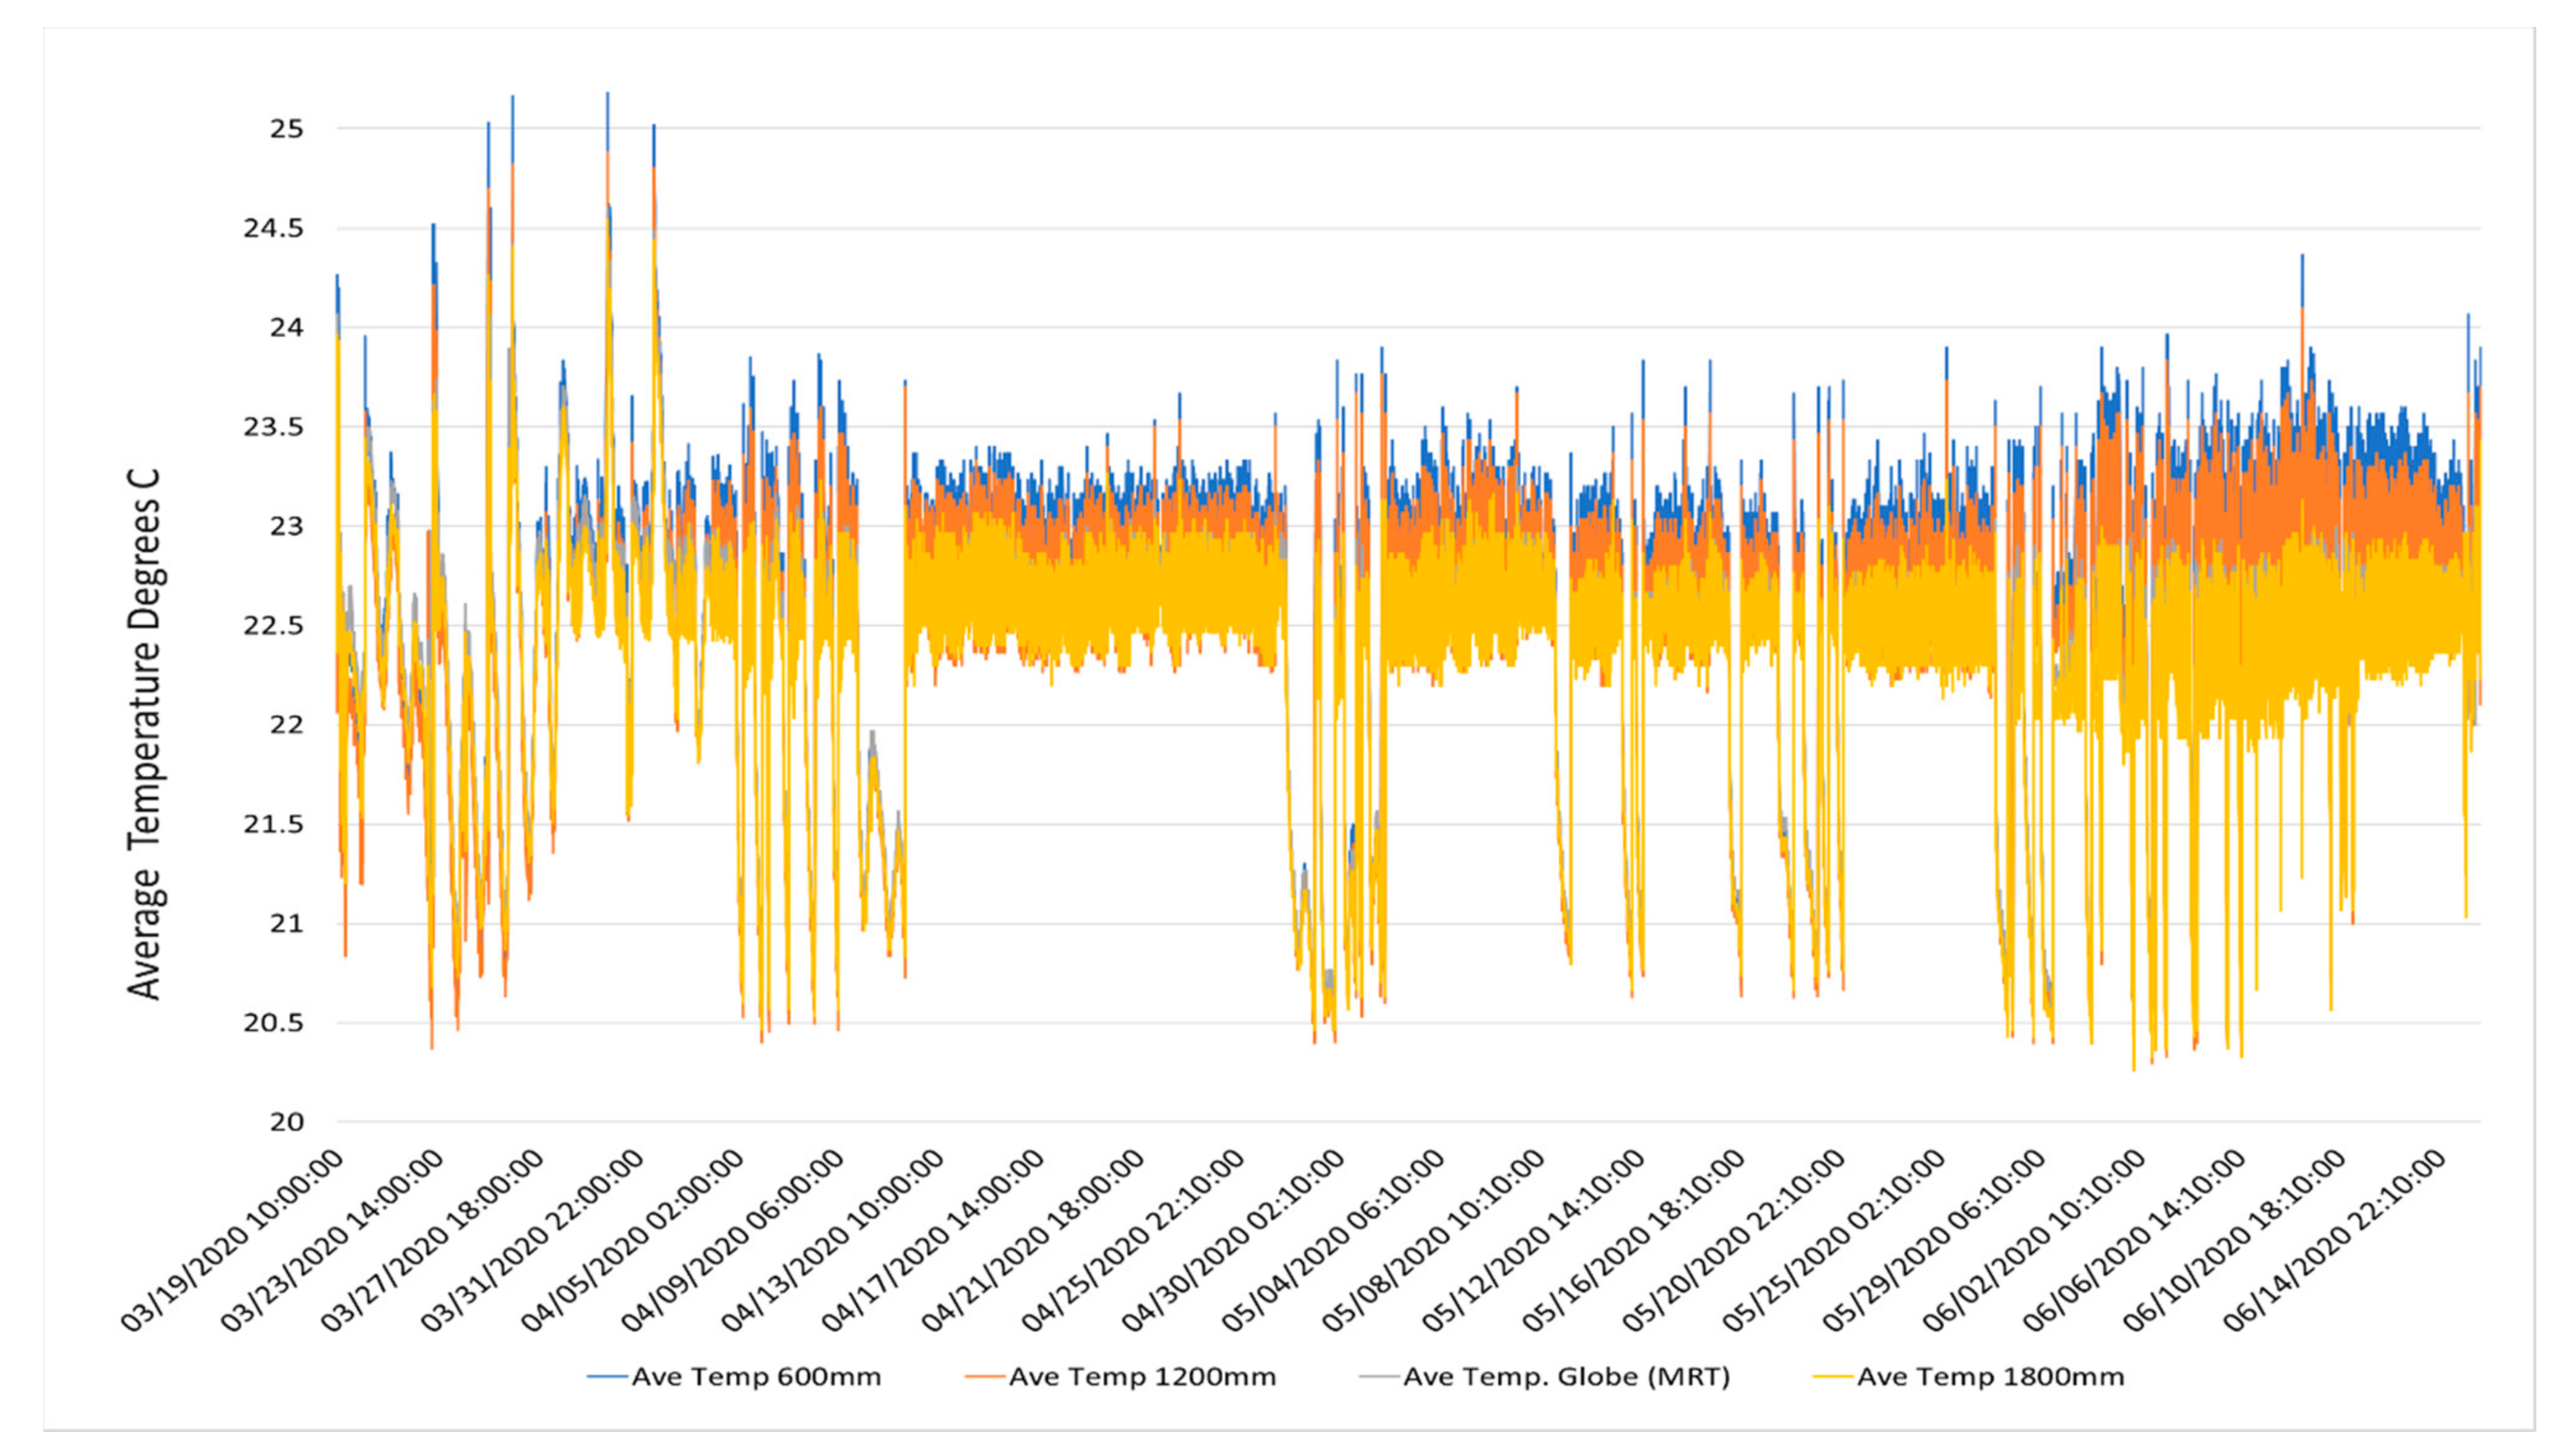
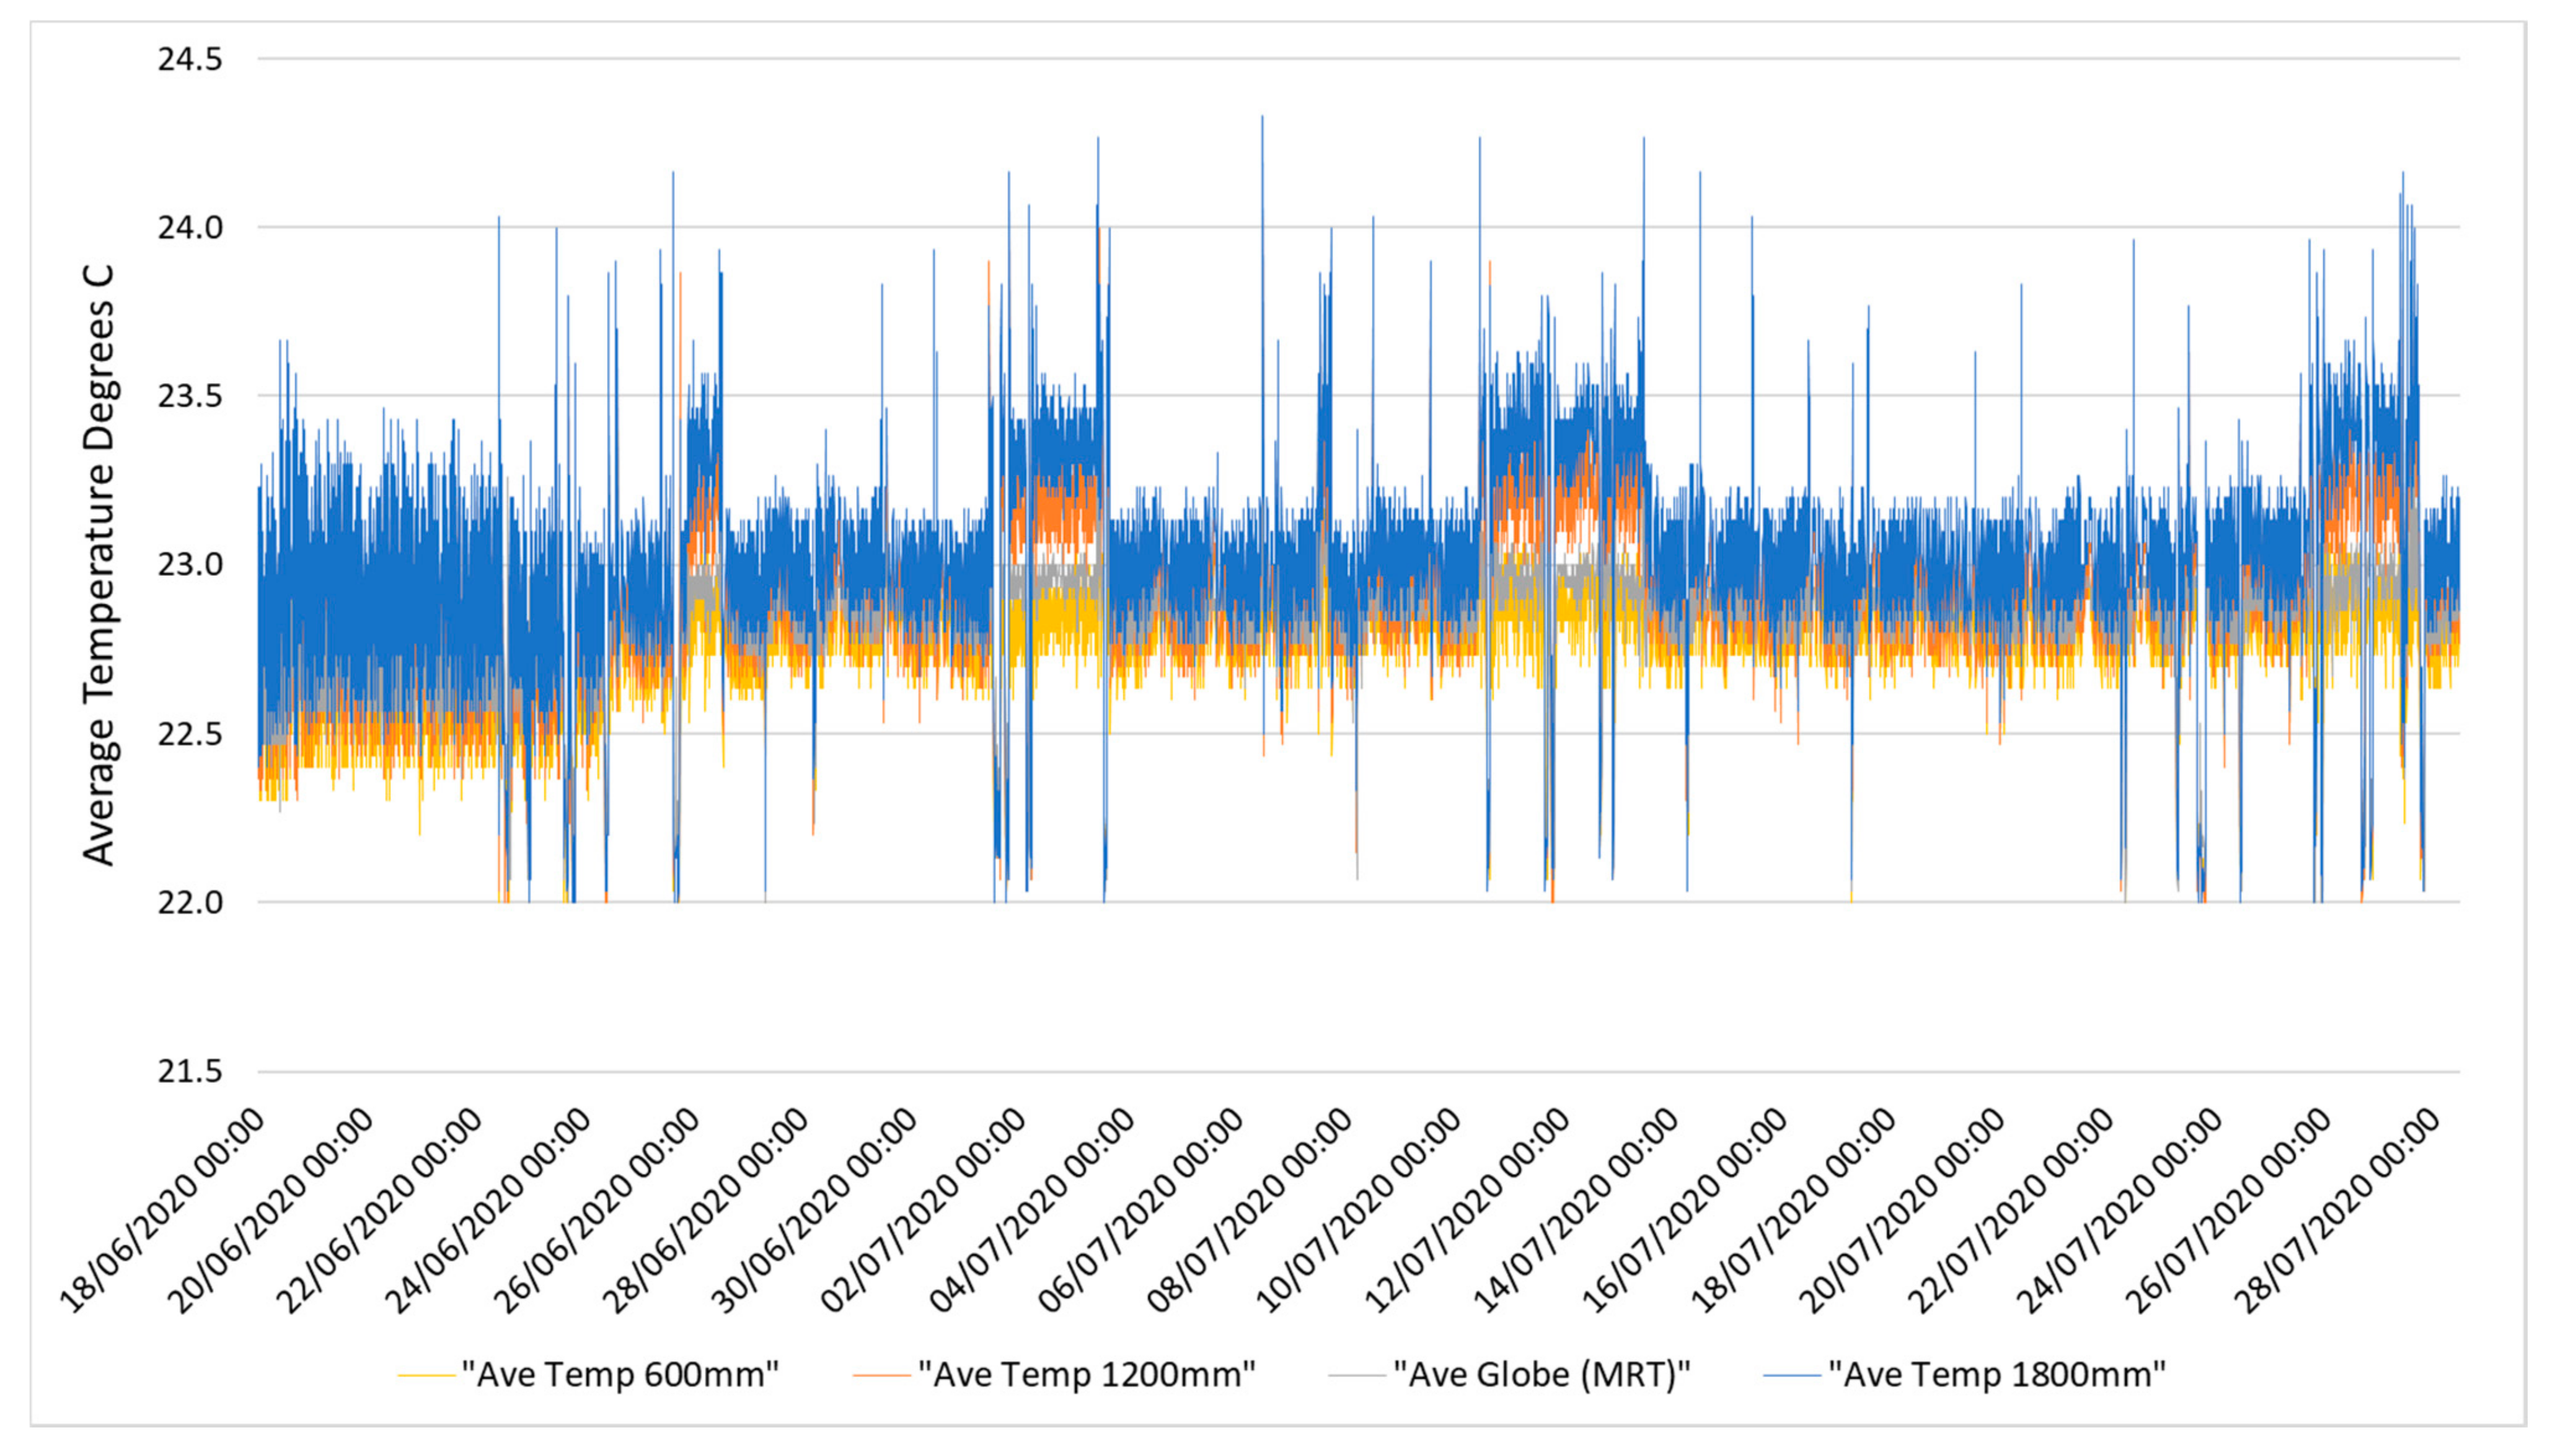
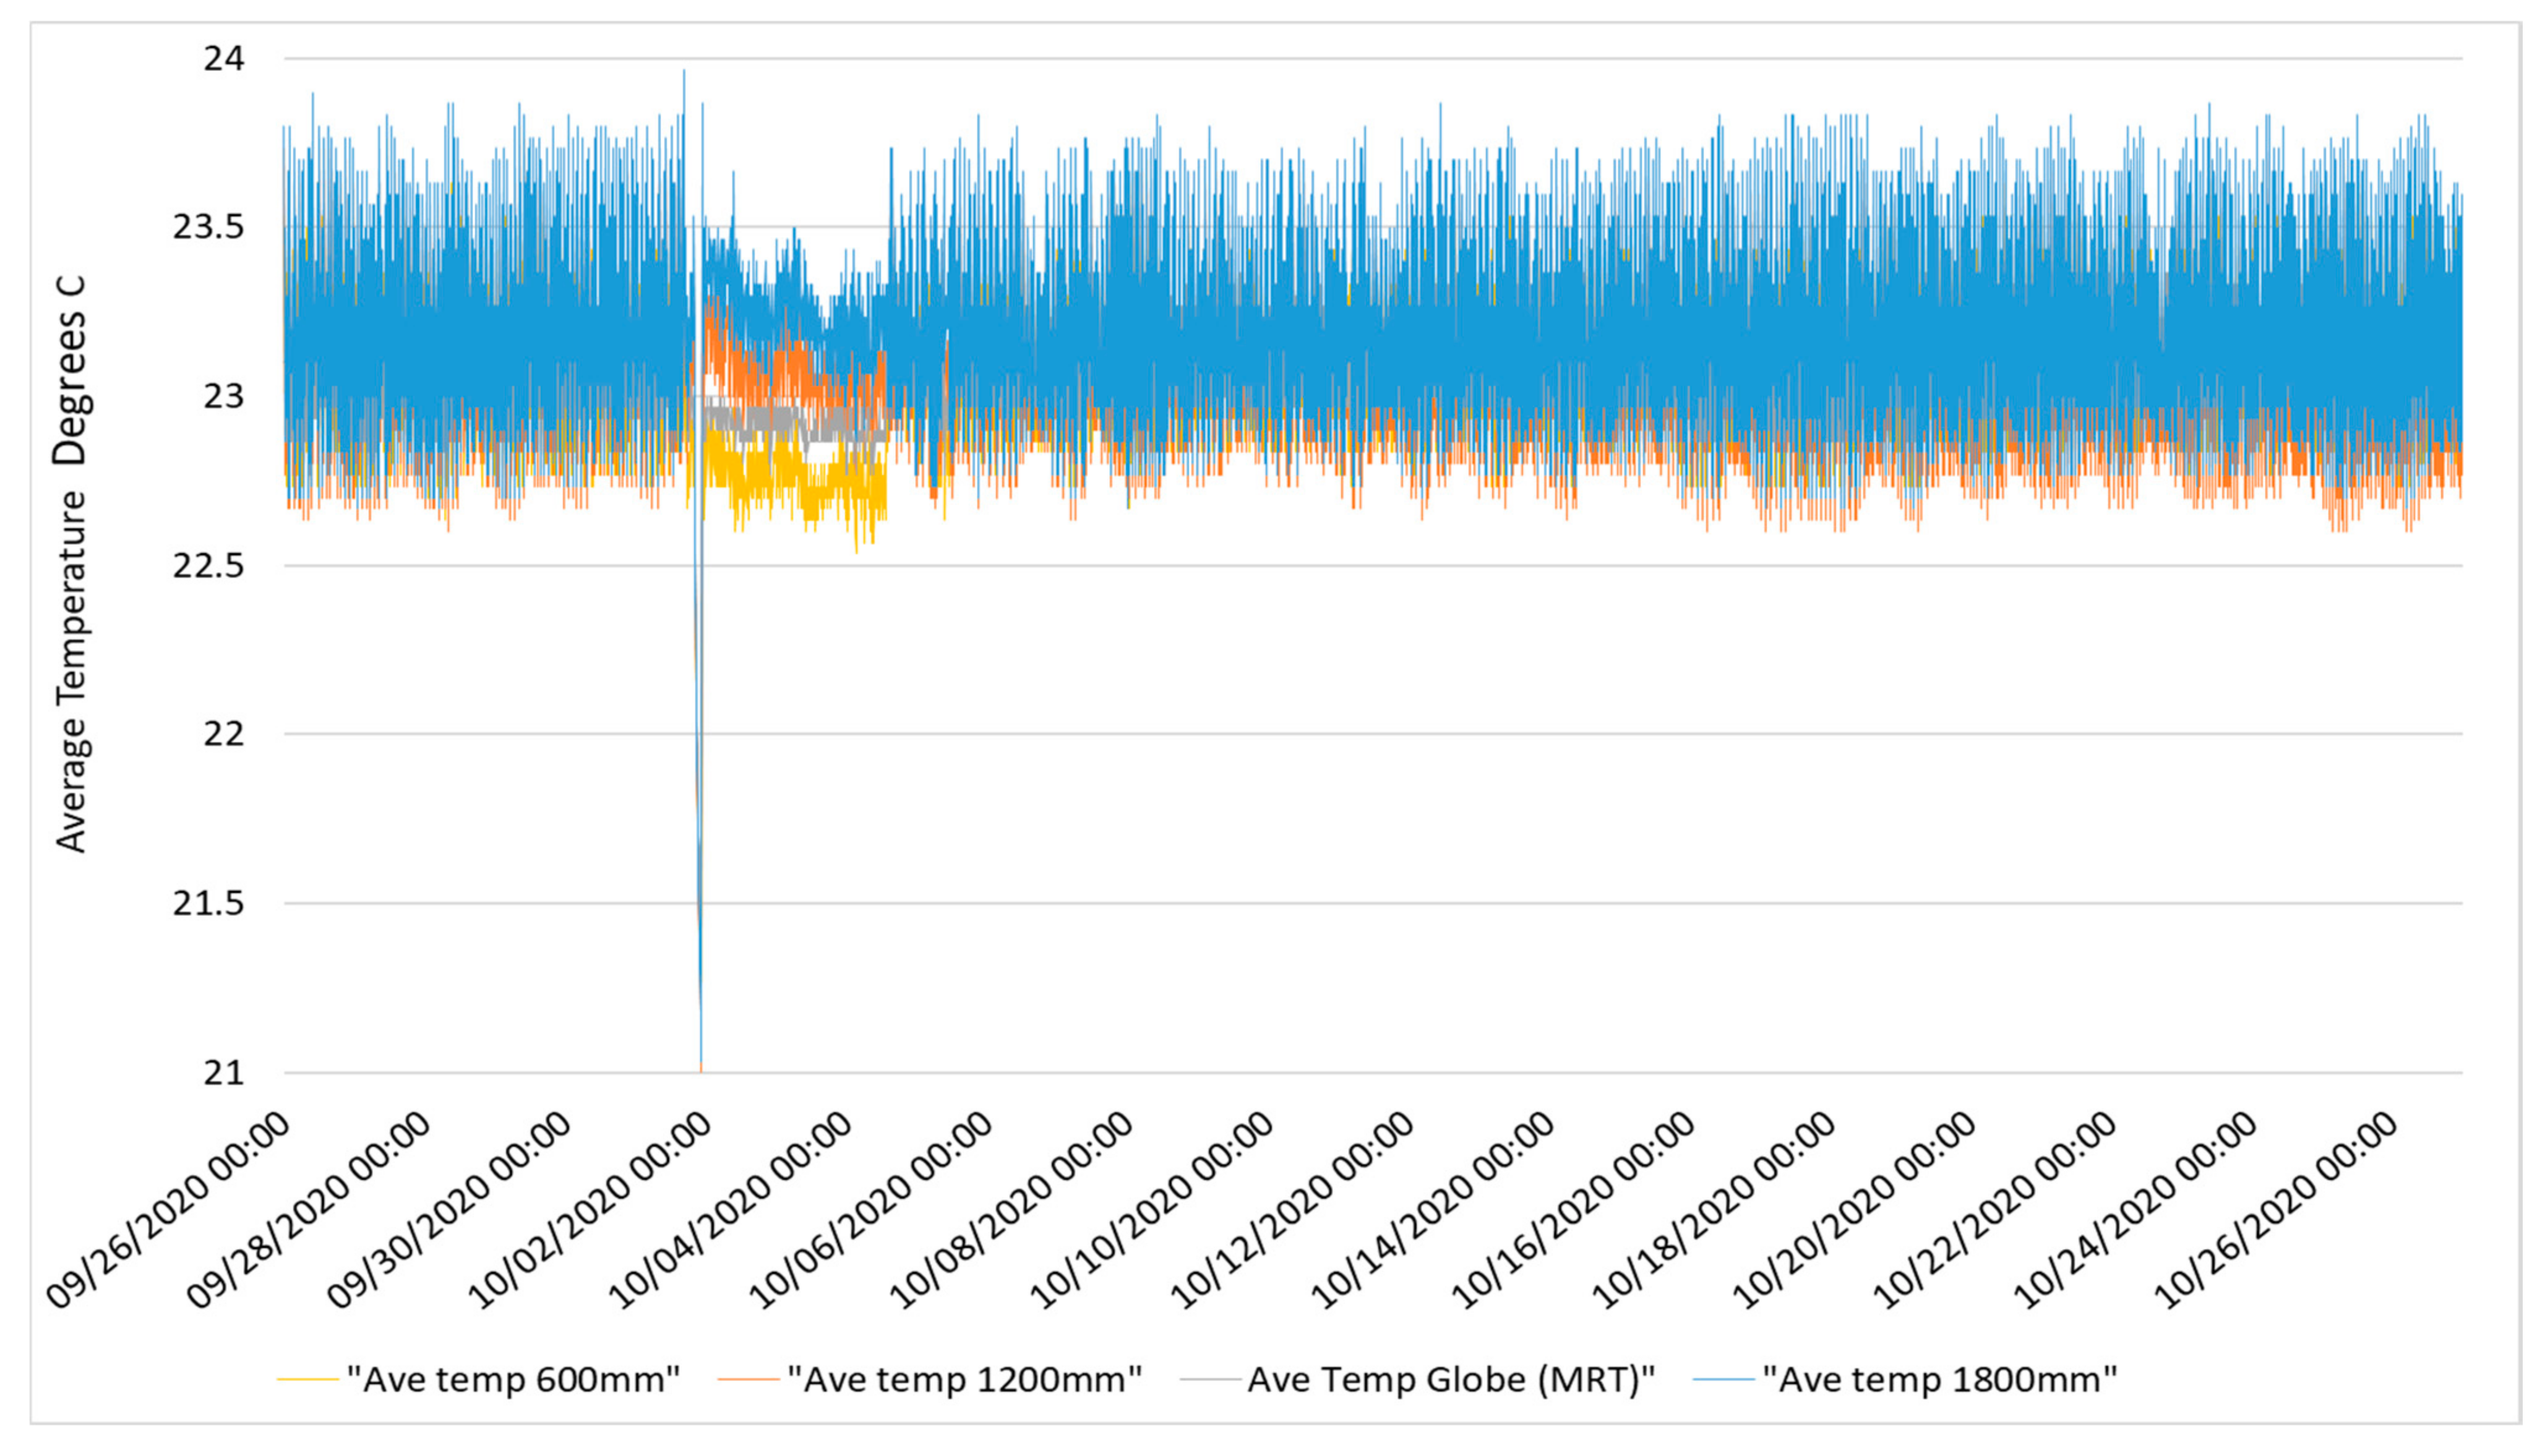
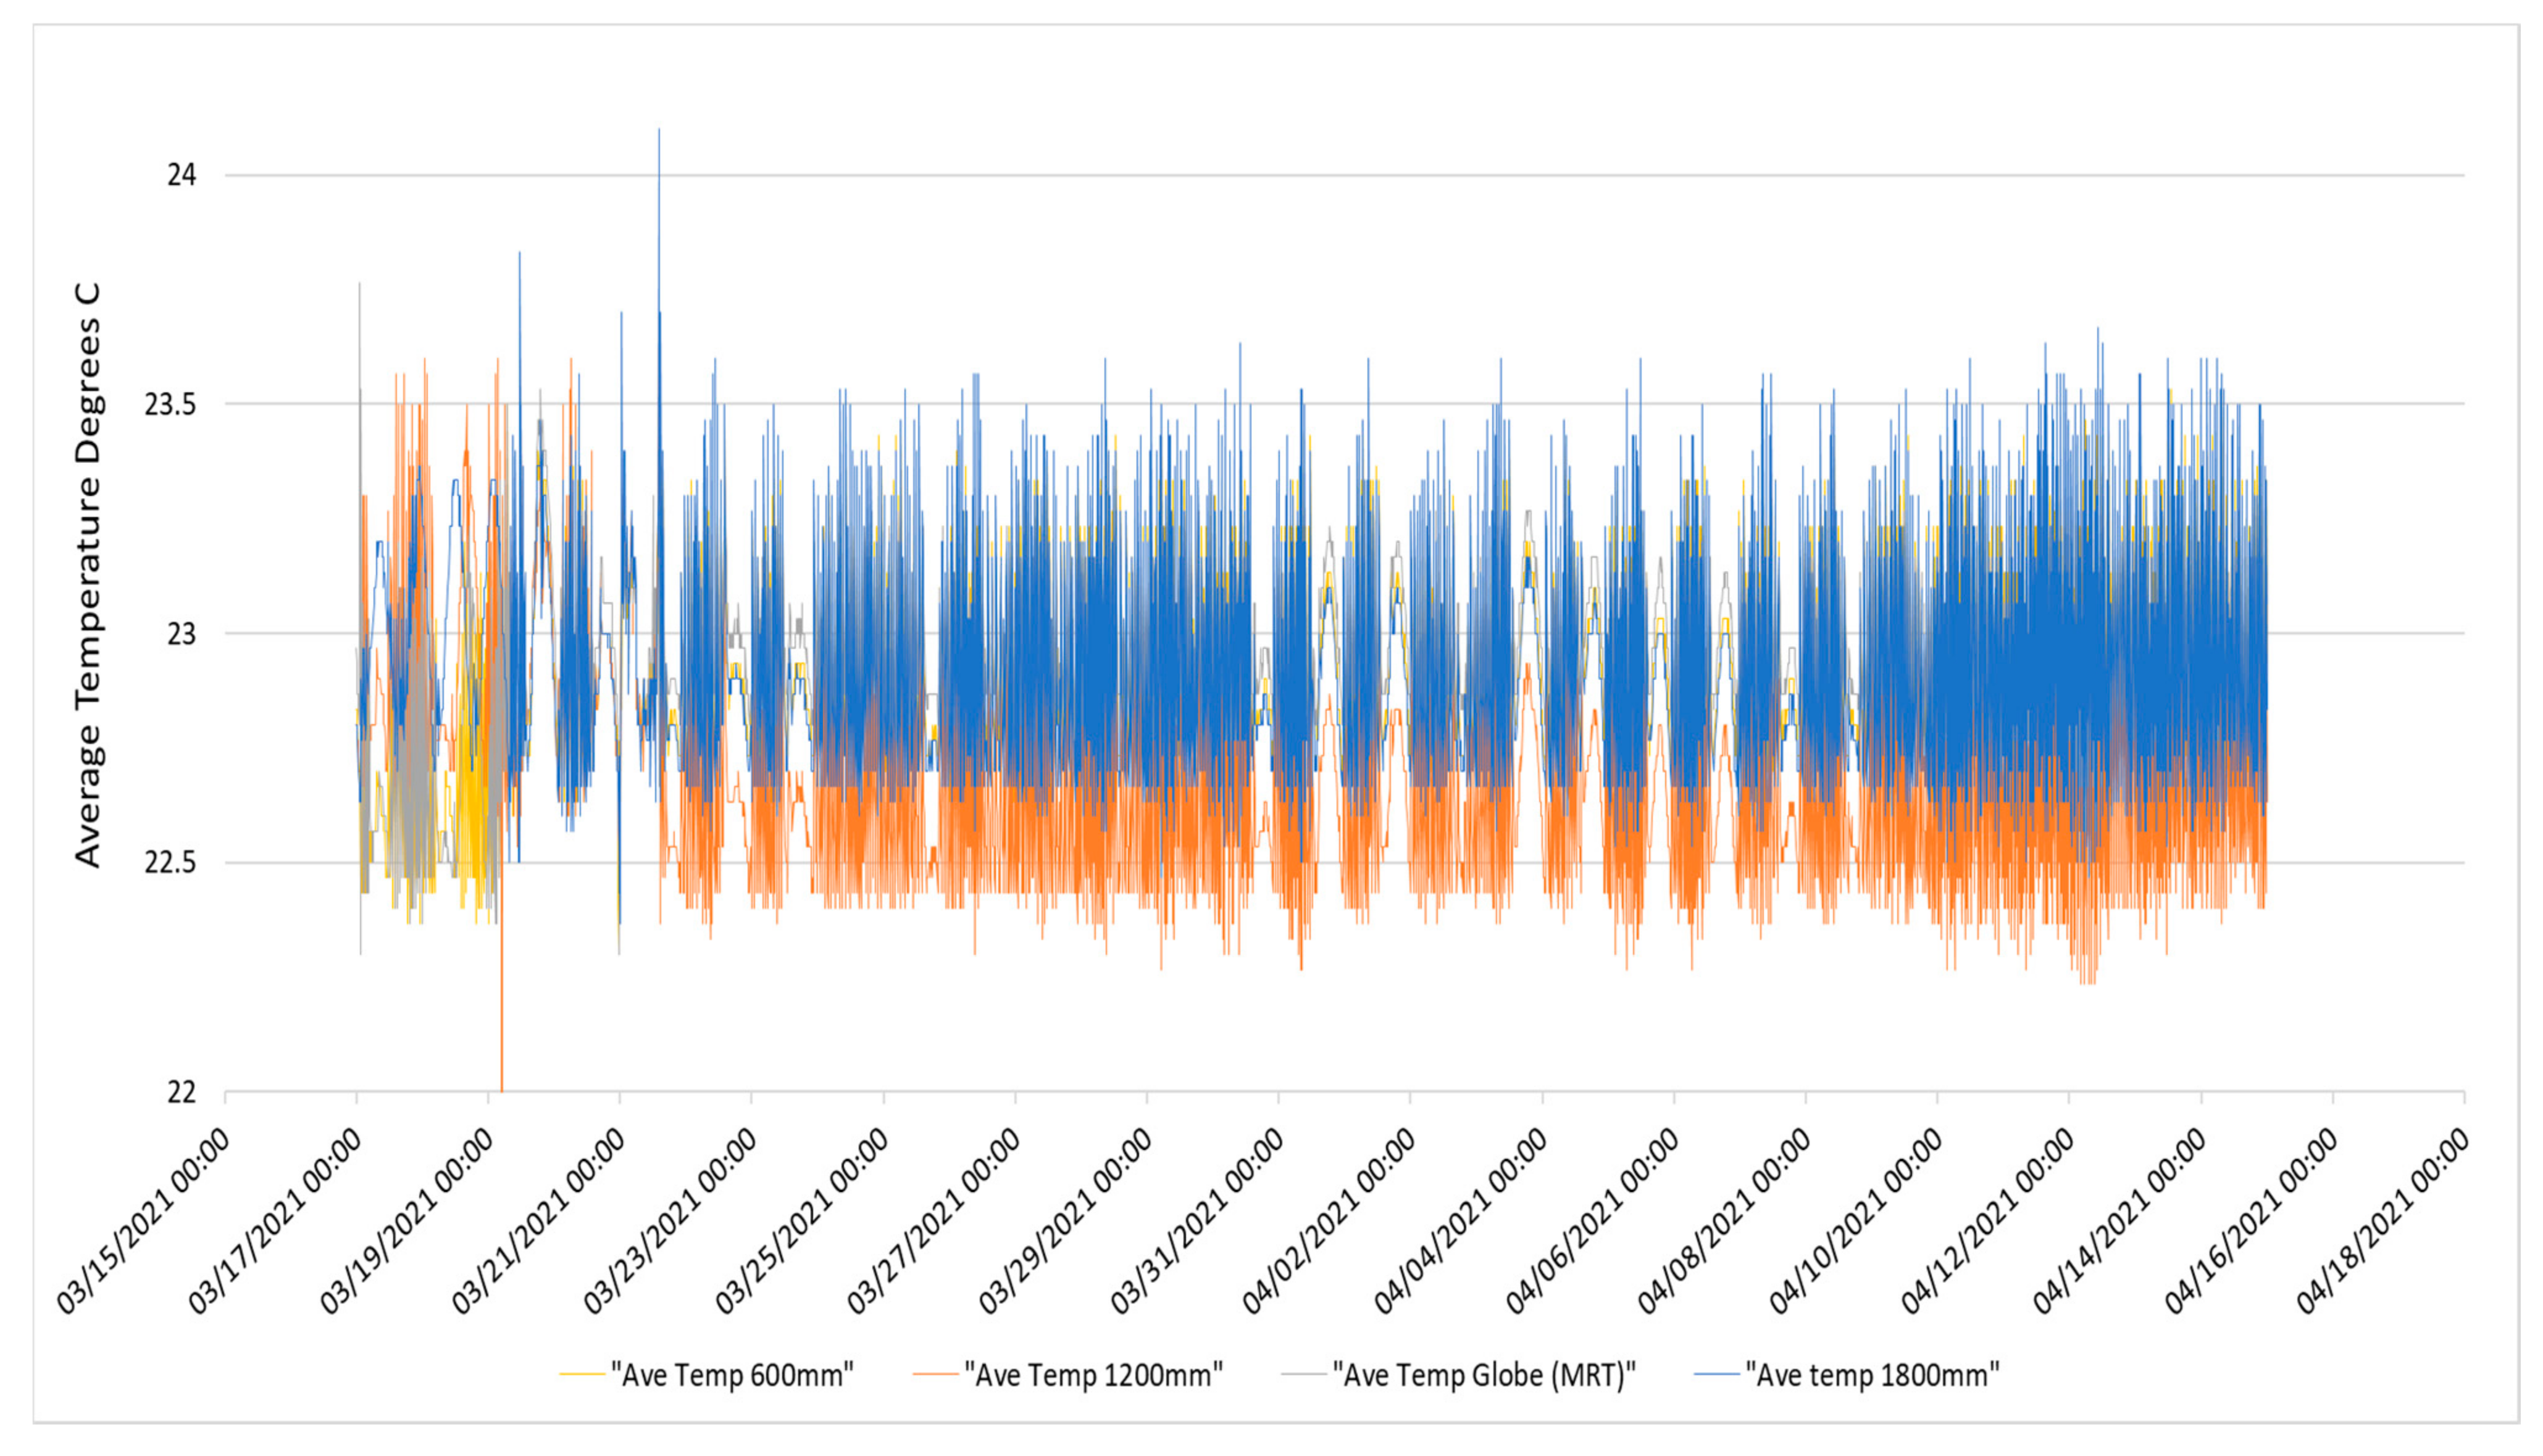
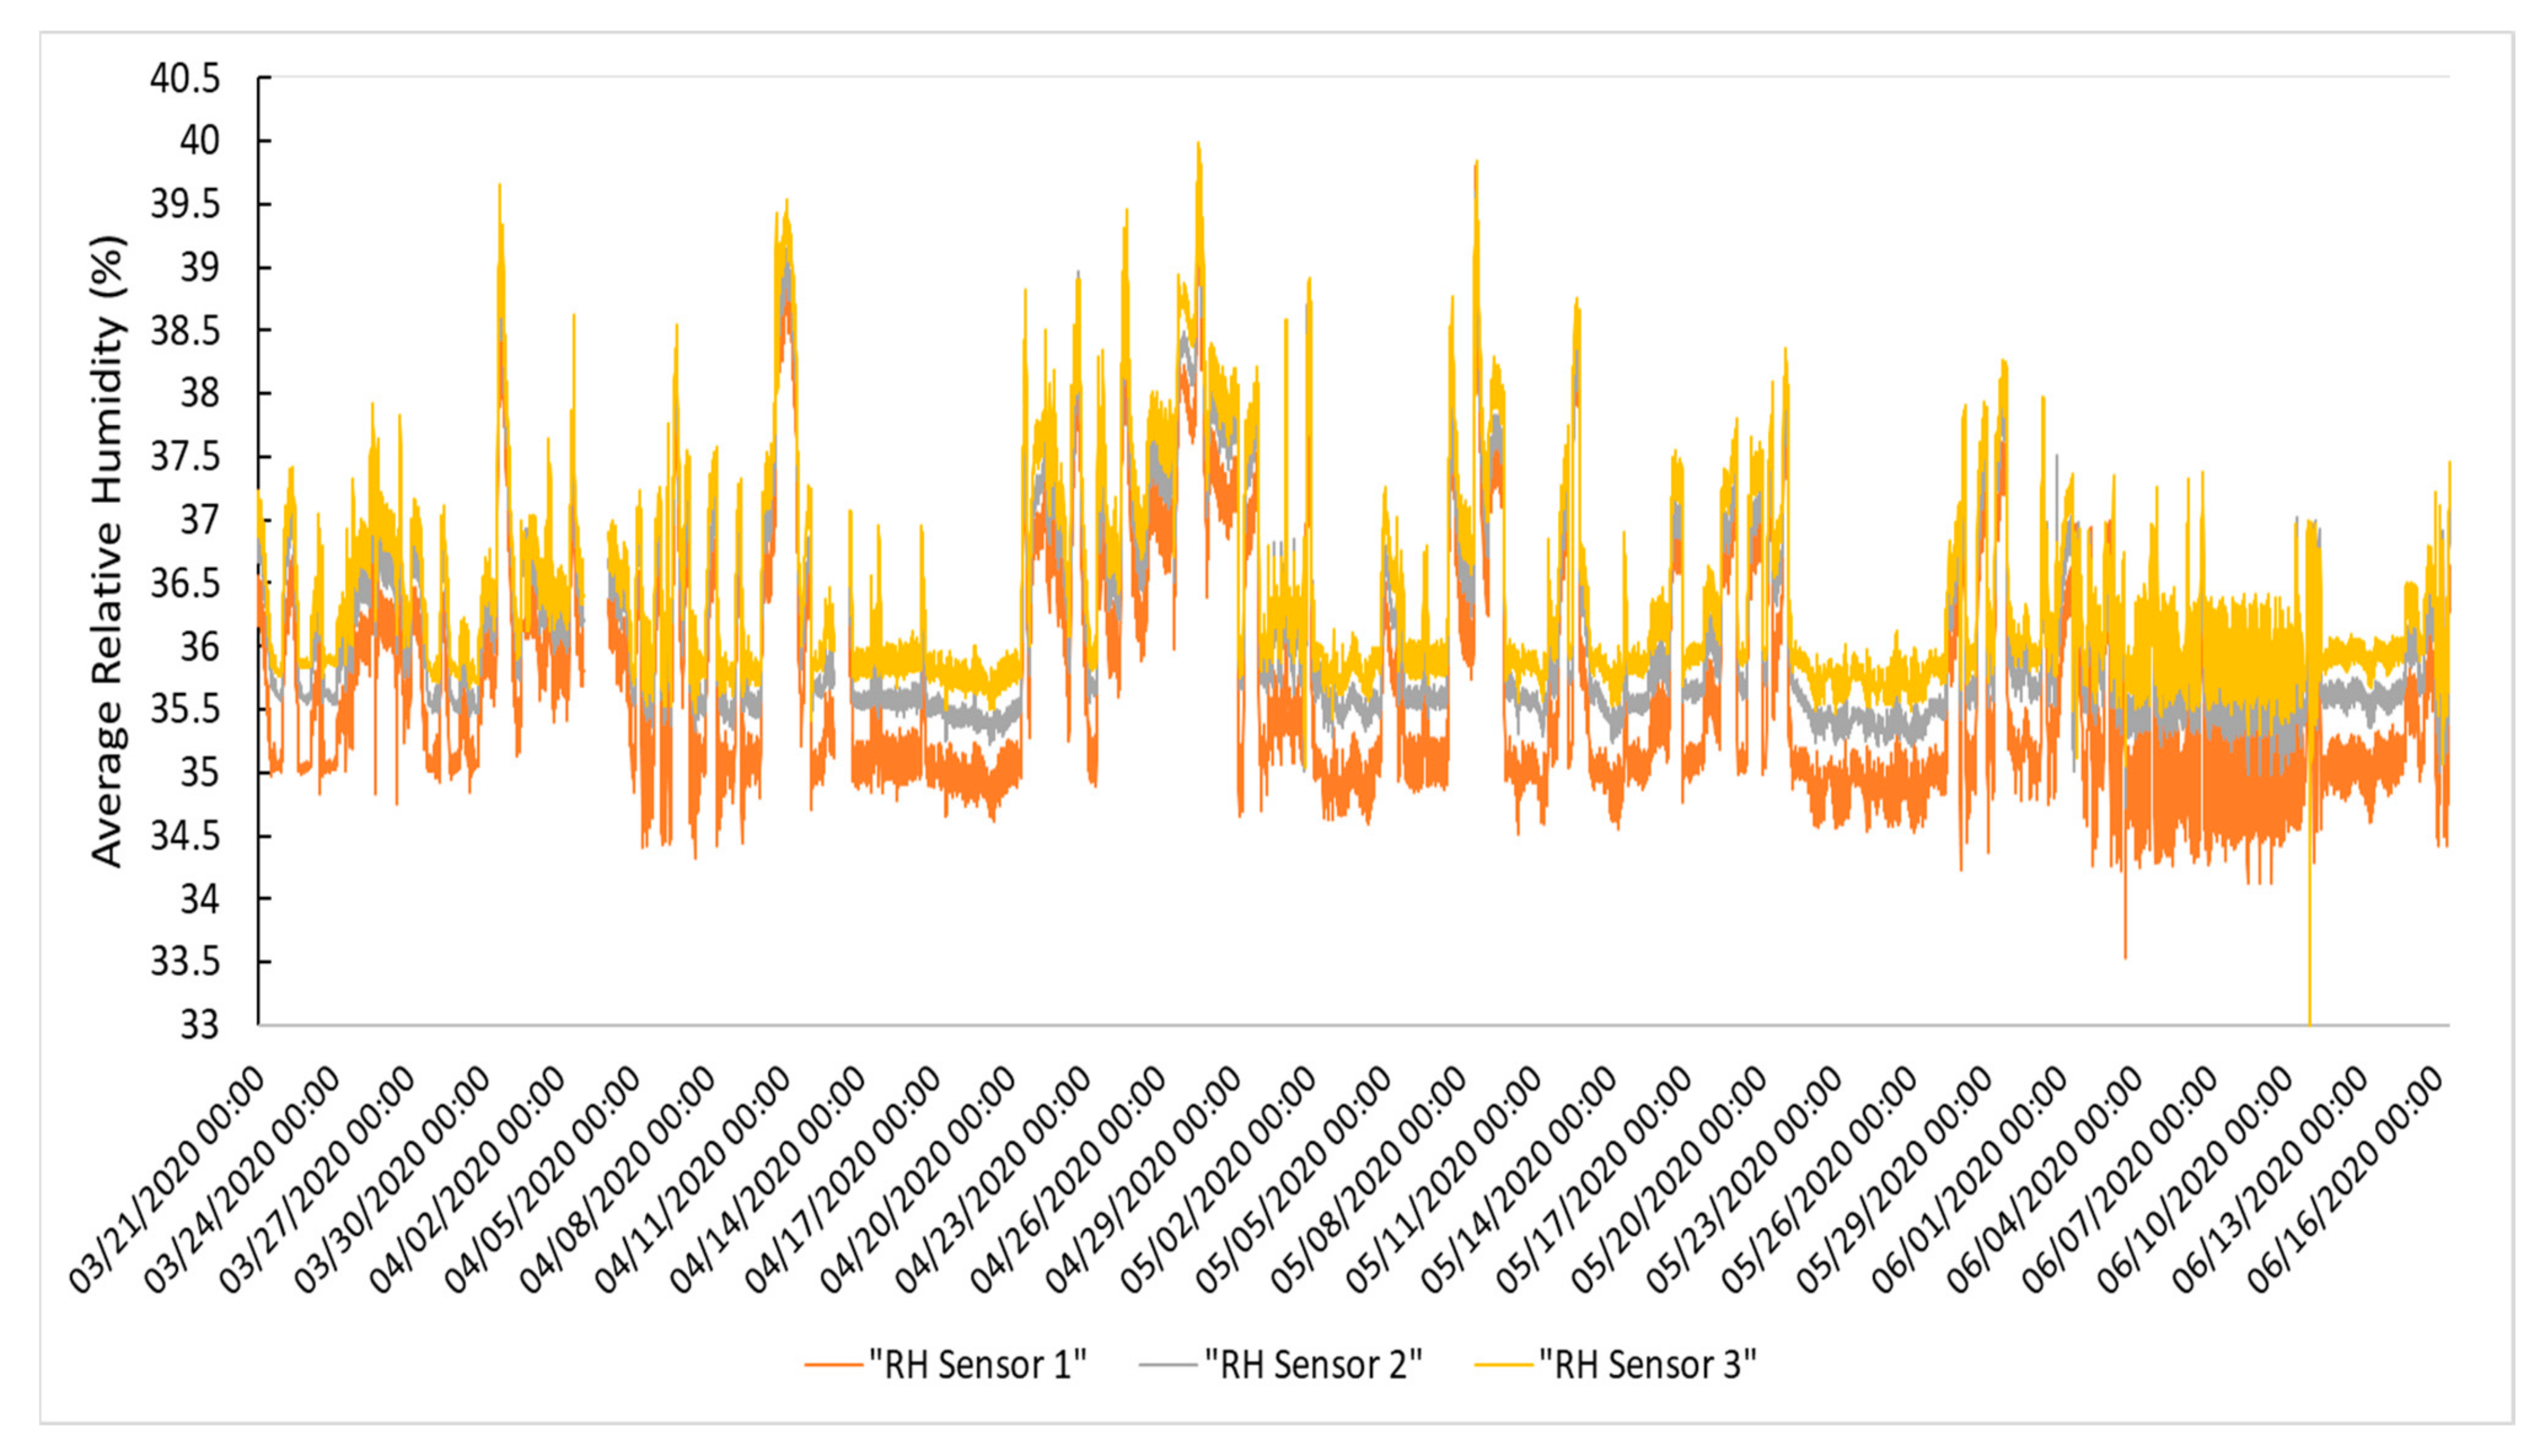
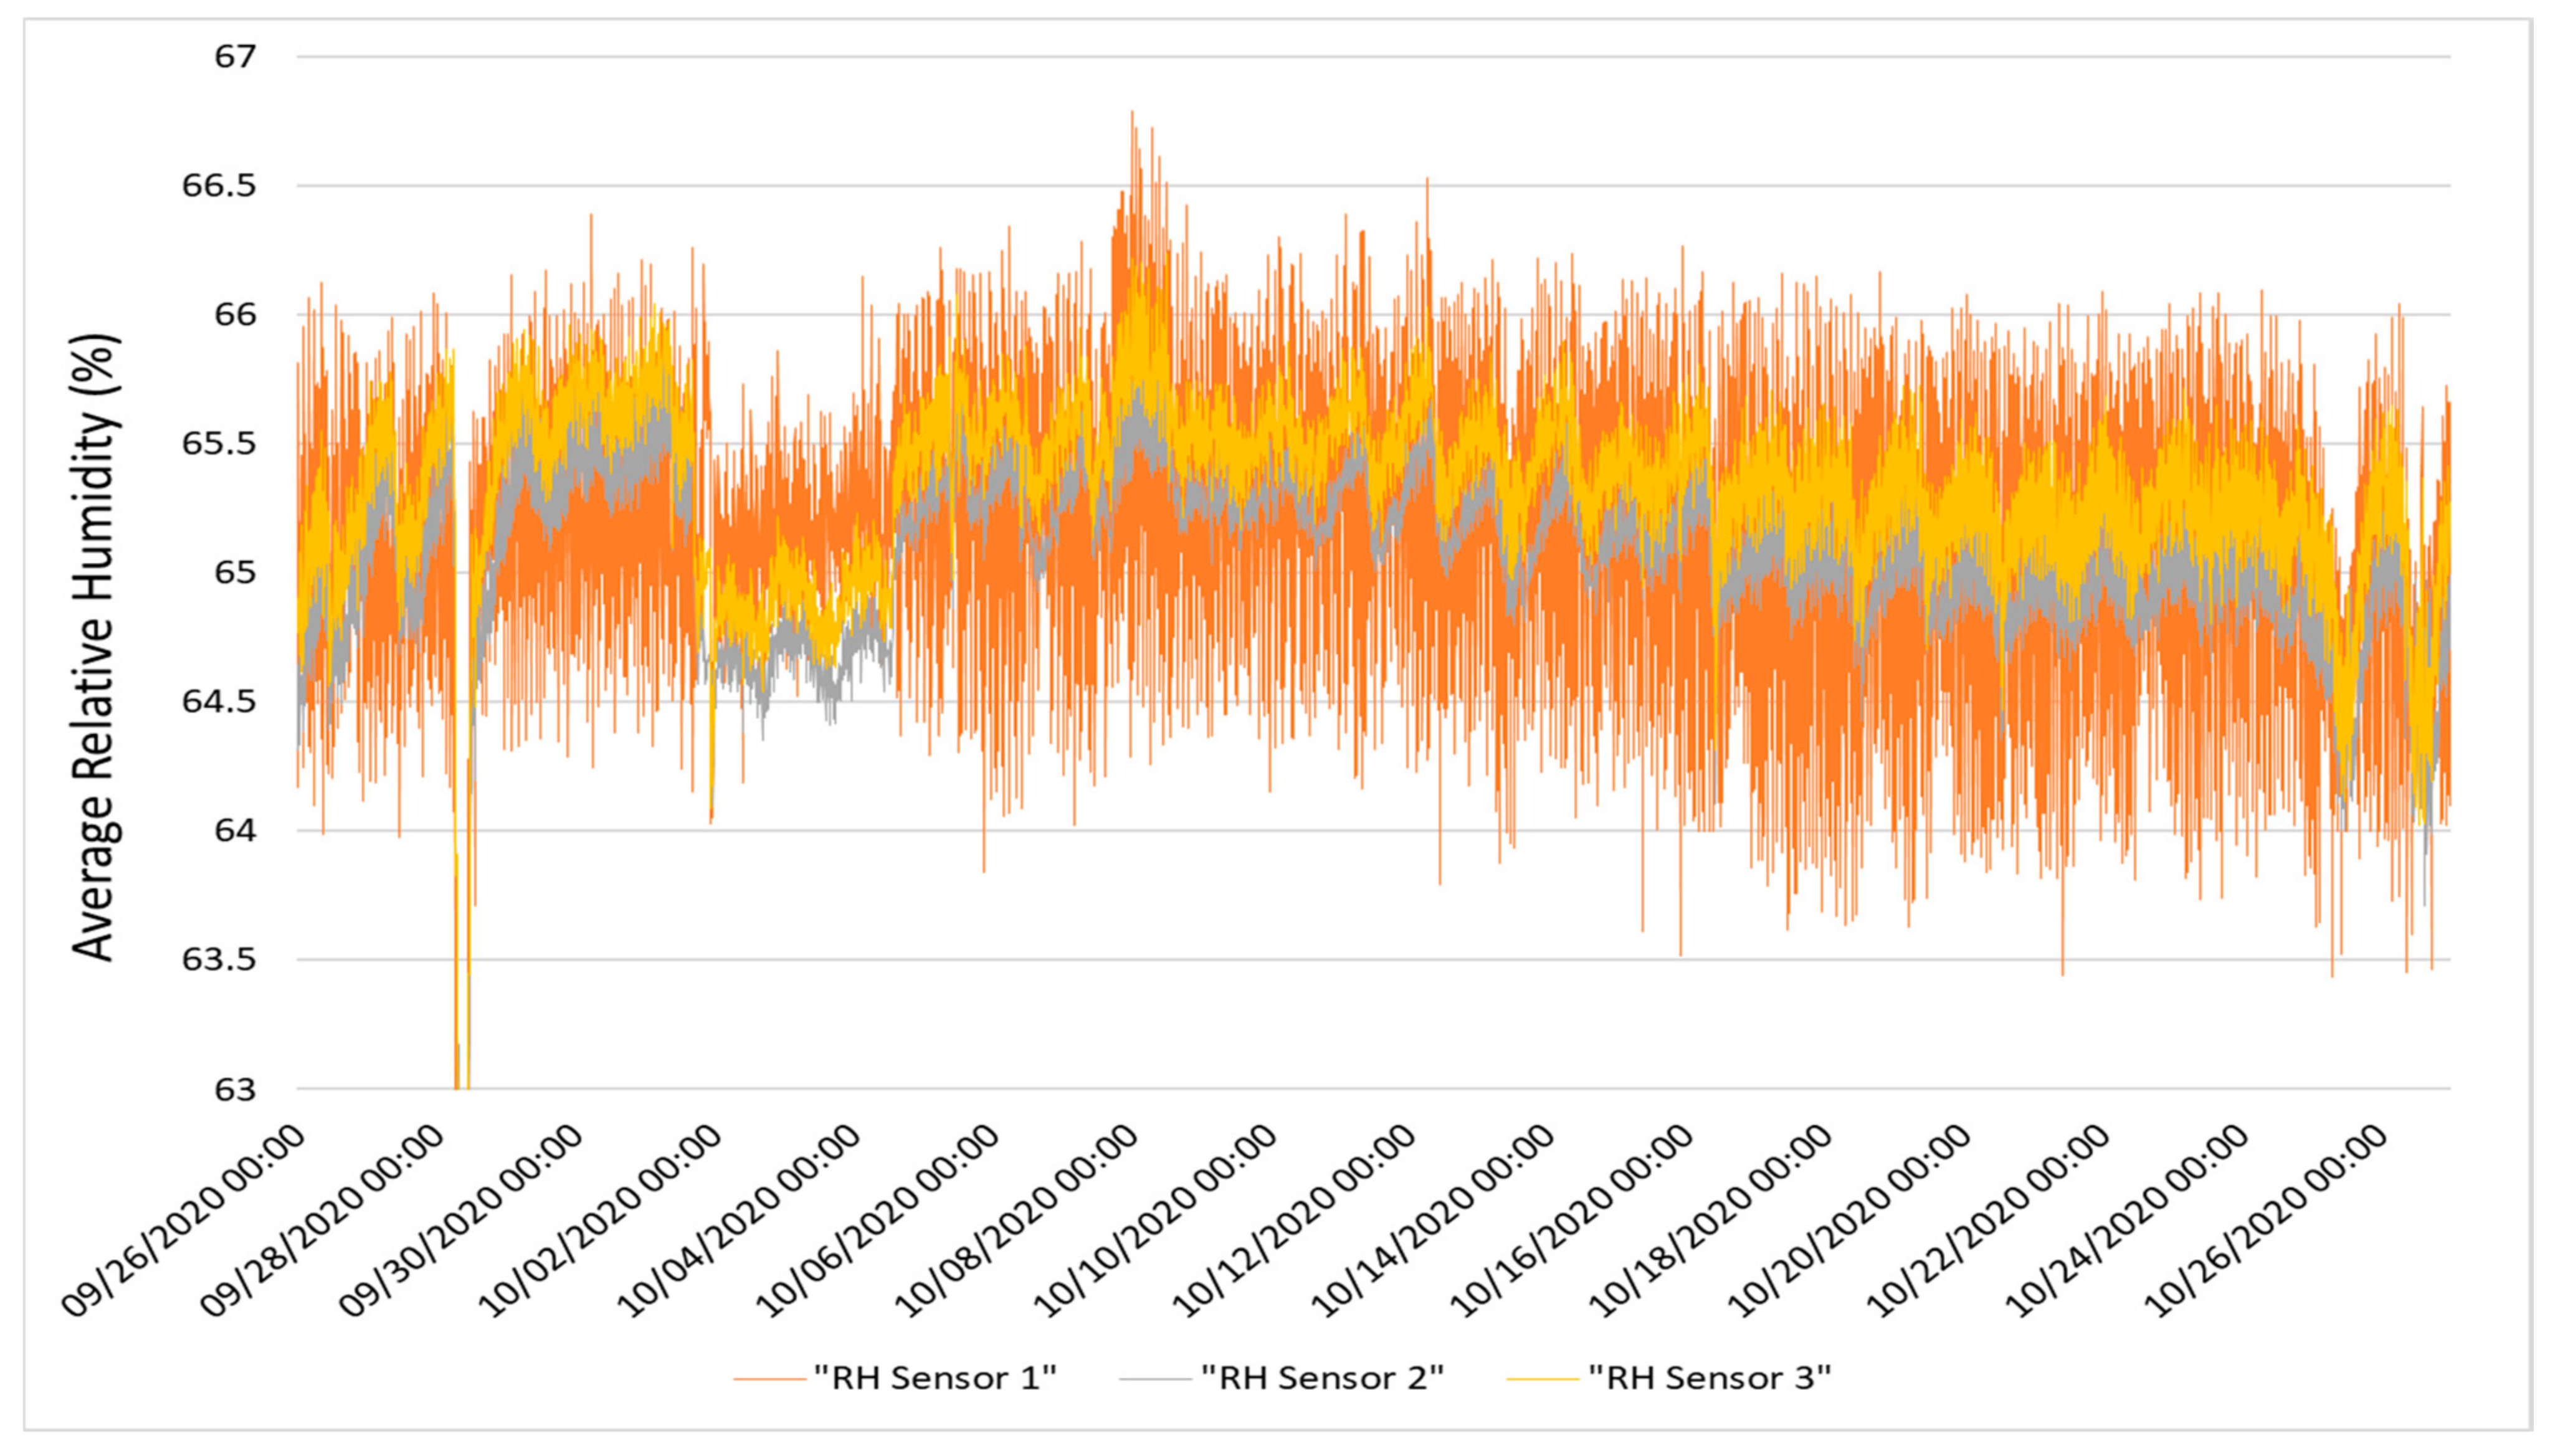
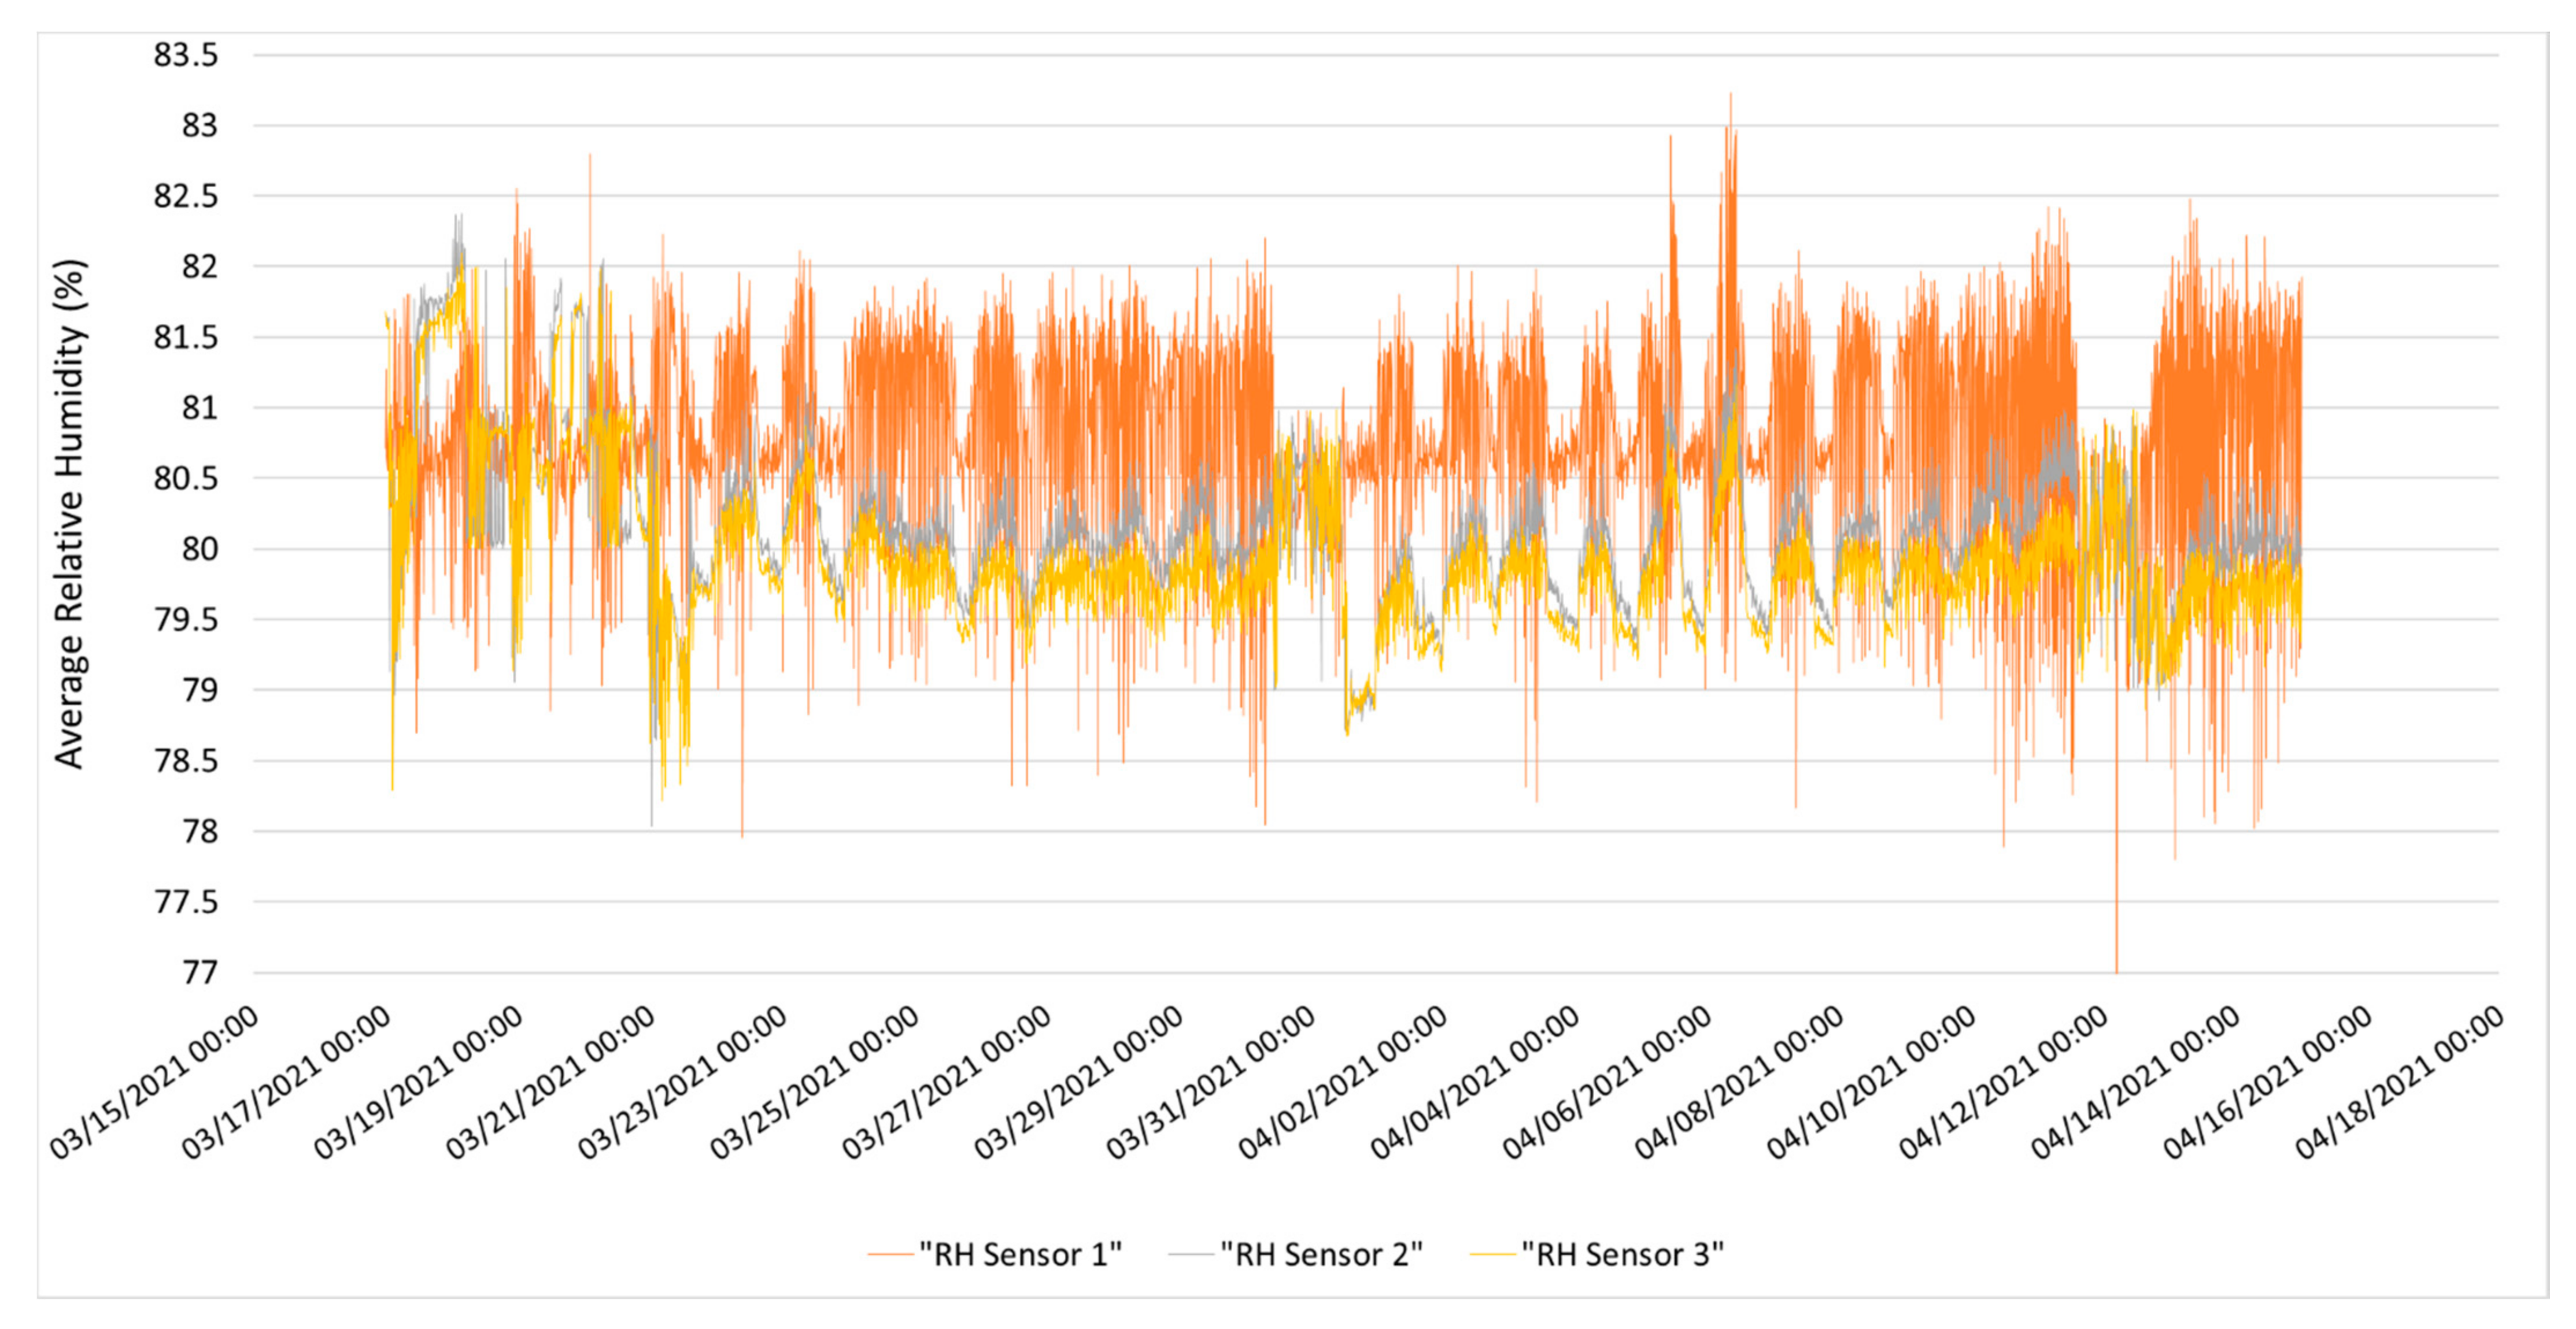
3.1. Results from Hygrothermally Controlled Test Room Conditioning
- -
- 35.0% to 36.9%, with an average of 36% in the first test period;
- -
- 49.8.% to 50.8%, with an average humidity of 50.4% in the second test period;
- -
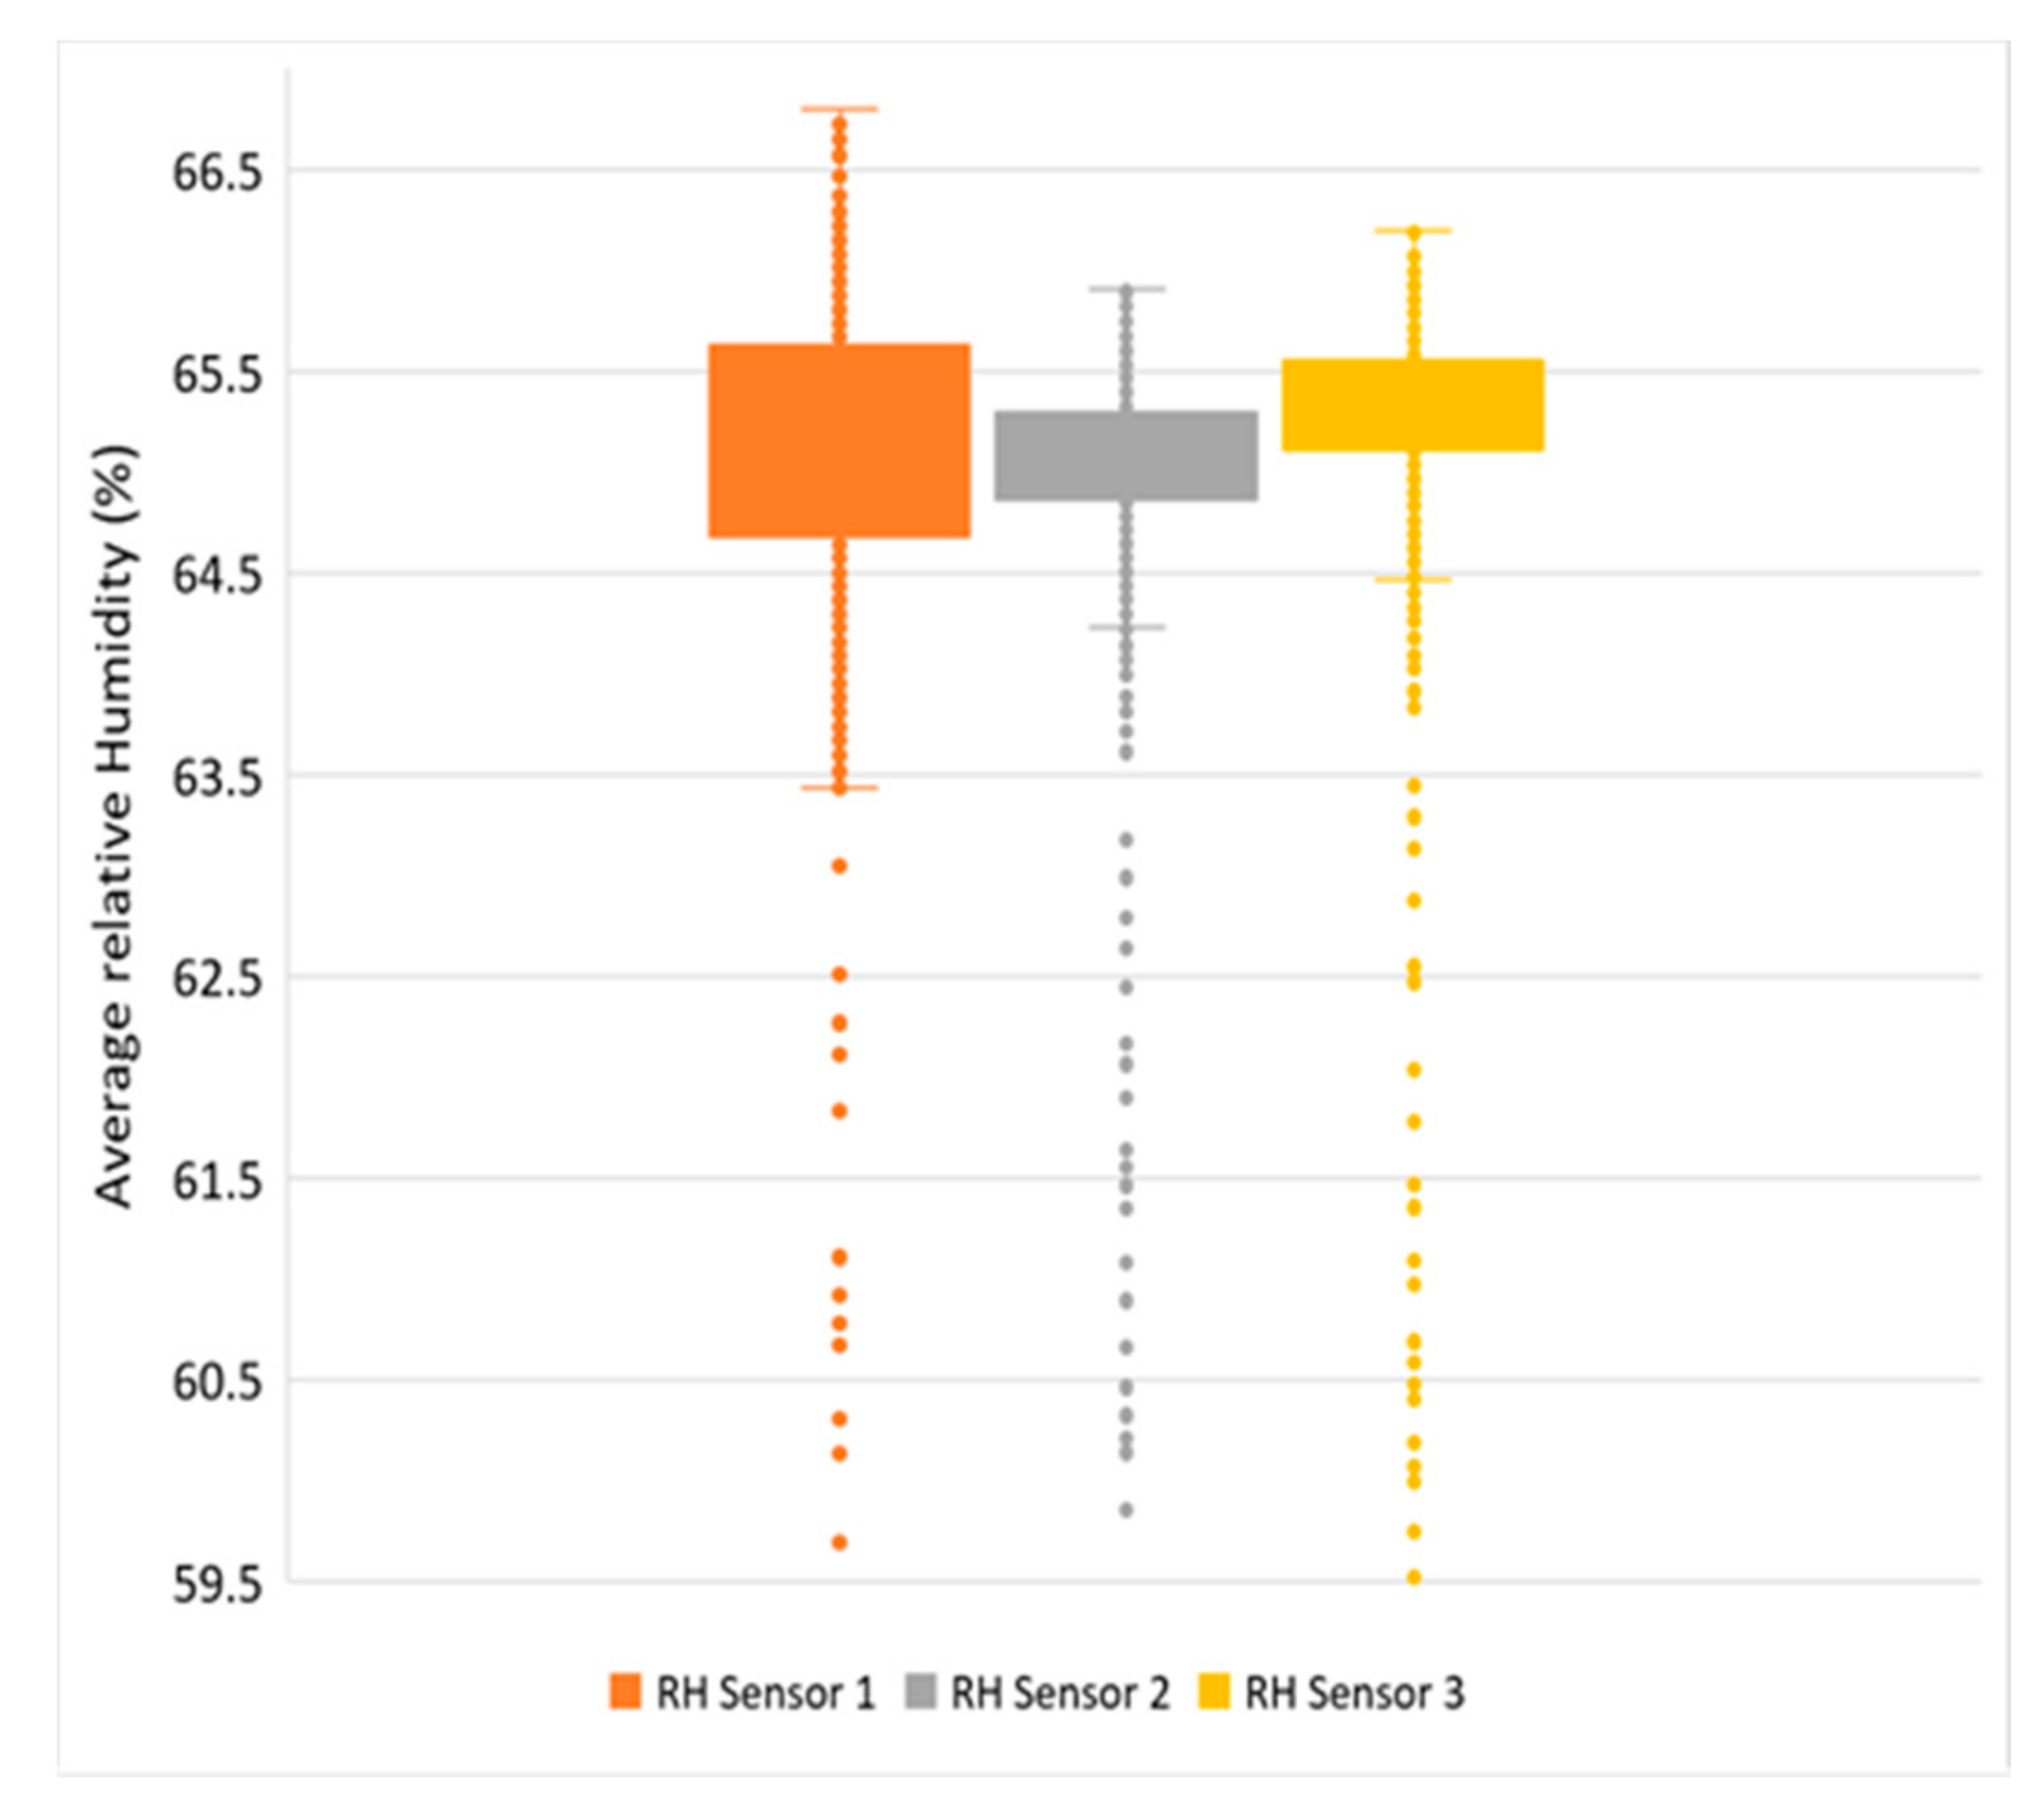
- 64.5% to 65.2%, with an average relative humidity of 65.12% in the third test period; and
- -
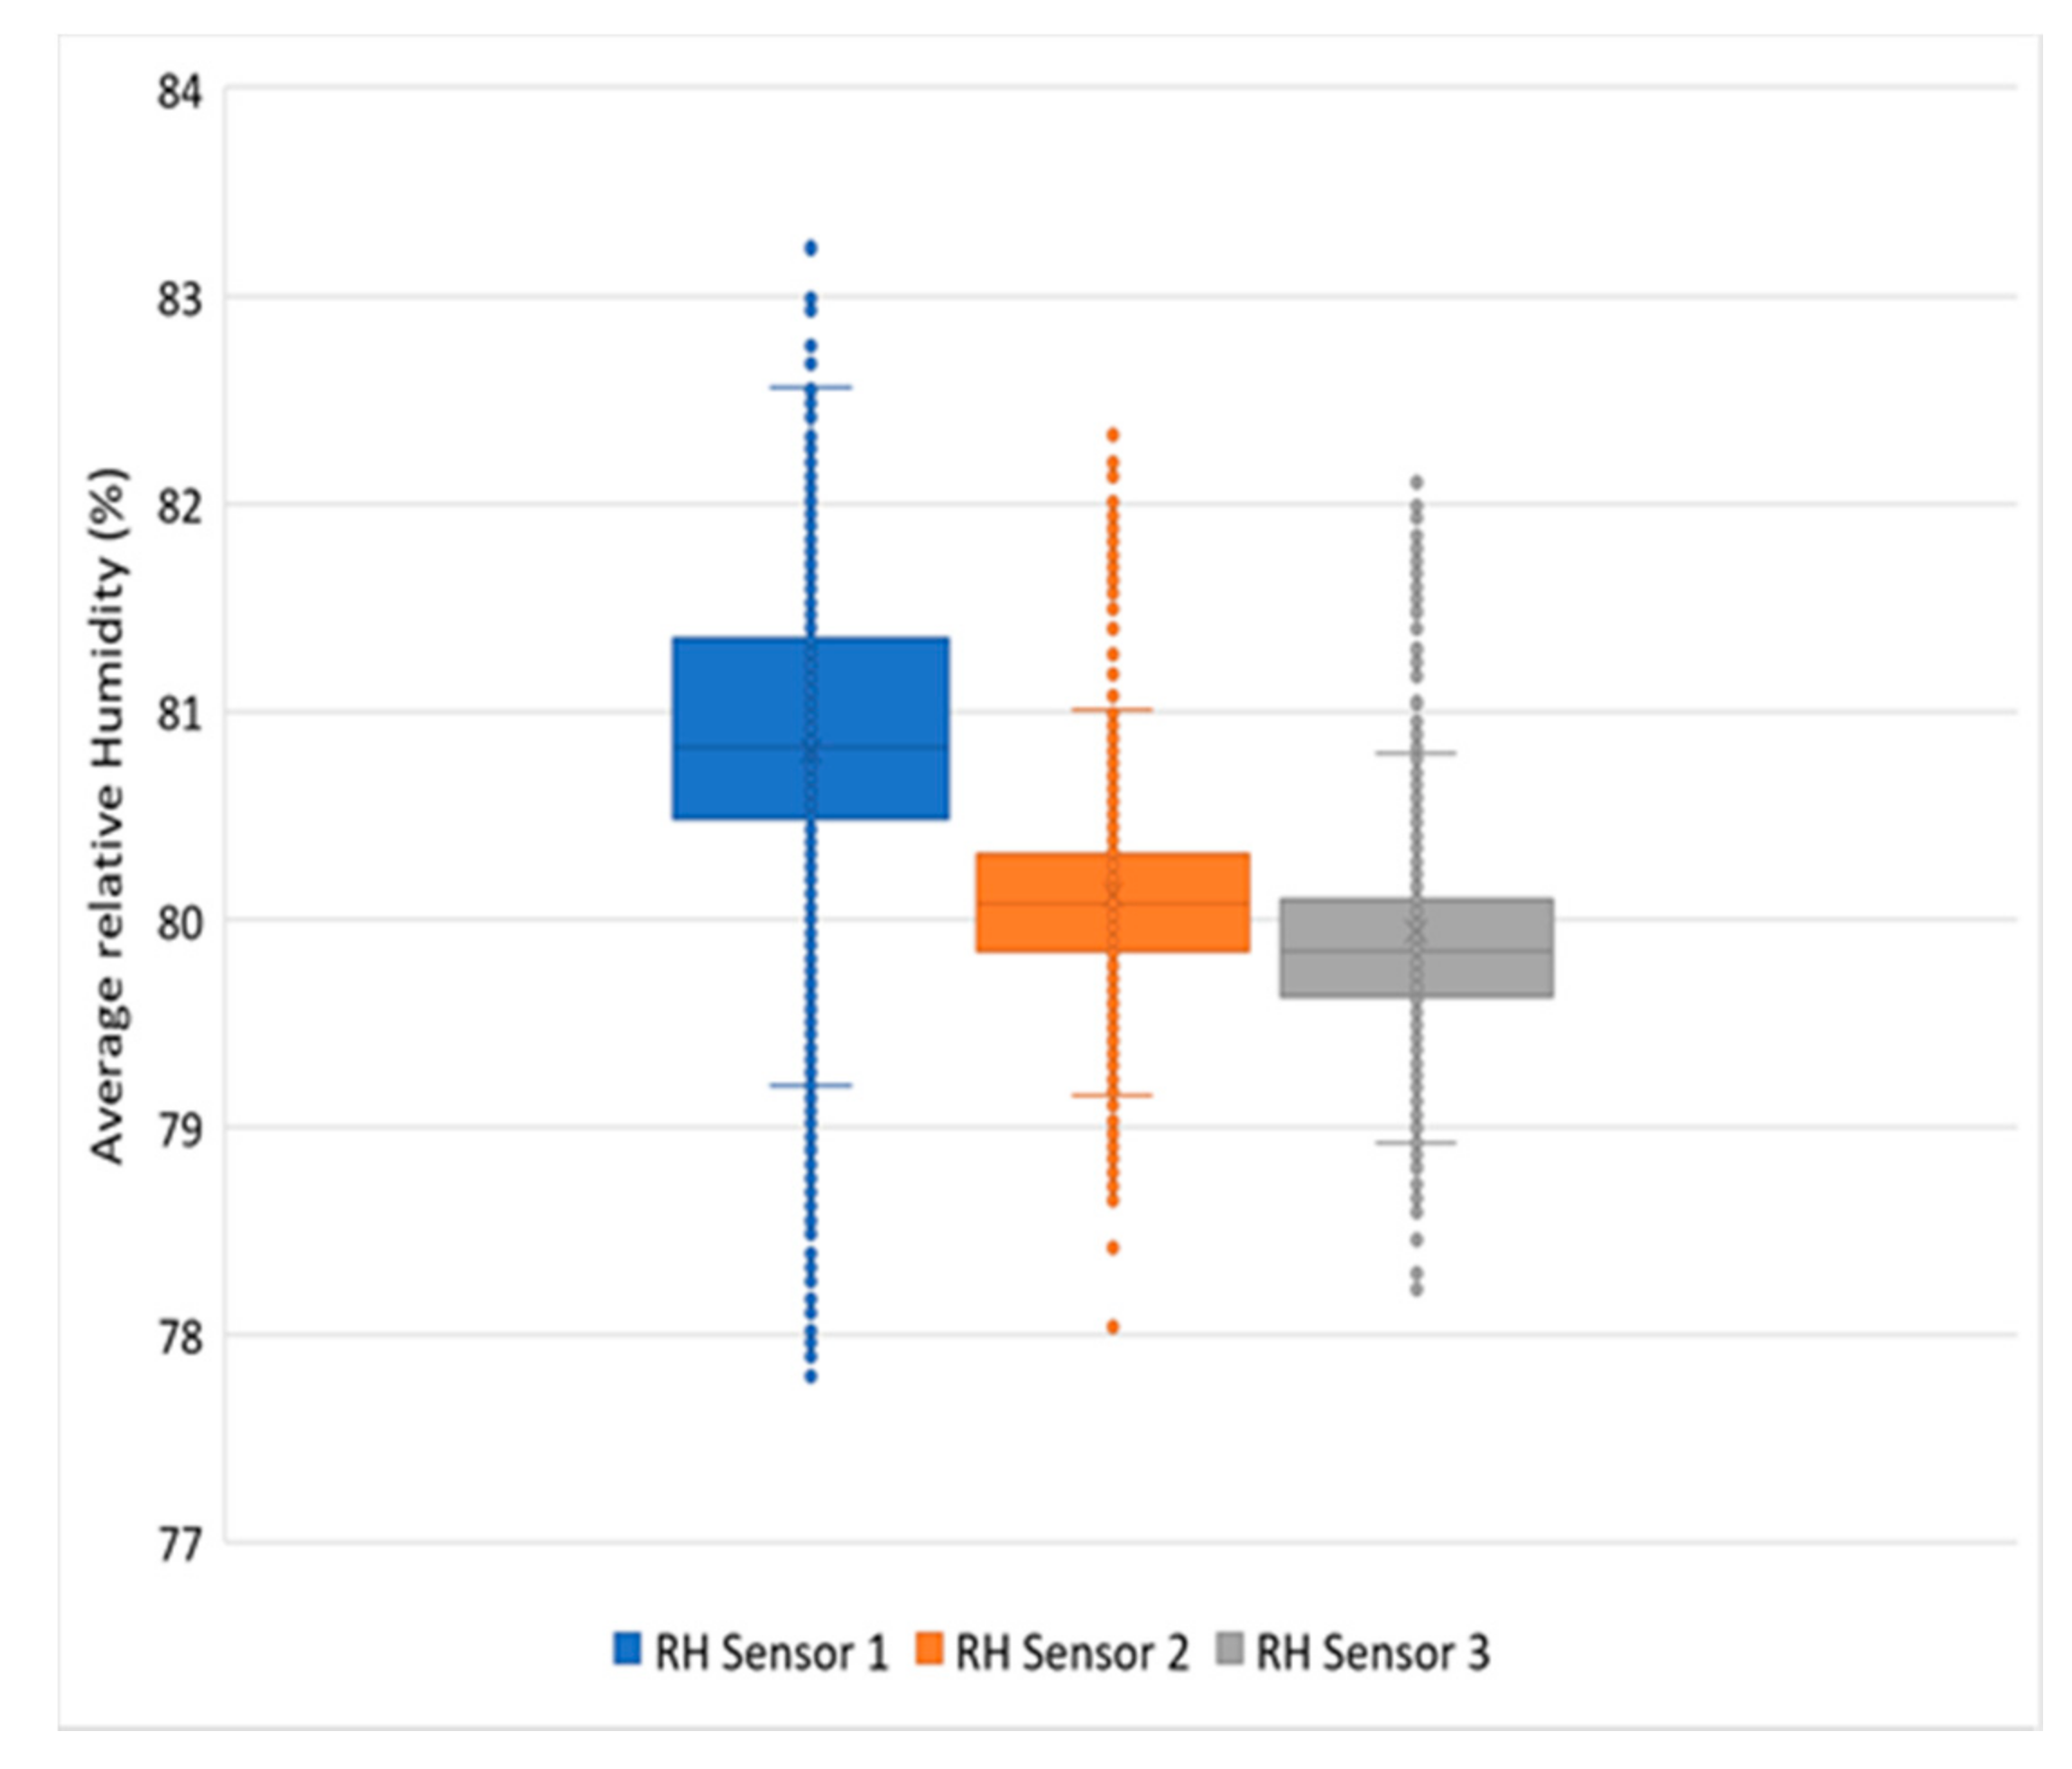
- 77.84% to 83.2%, with an average relative humidity of 80.29% in the fourth test period.
3.2. Results of the Water Vapour Resistivity Properties
4. Discussion
5. Conclusions
Author Contributions
Funding
Institutional Review Board Statement
Informed Consent Statement
Acknowledgments
Conflicts of Interest
Appendix A

| Sample @23 °C 35%RH | Mean Thickness d (m) | Mass Change Rate/Time (G in kg/s) | Area m2 | Water Vapour Flux g = G/A in kg/(s × m2) | Water Vapour Permeance W = g/dp in kg/ (s × m2 × Pa) | Water Vapour Resistance Z = 1/W in (s × m2 × Pa)/kg | Water Vapour Permeability δ = W × d in kg/(s × m × Pa) | Water Vapour Resistance Factor µ | Diffusion-Equivalent Air Layer Thickness Sd |
|---|---|---|---|---|---|---|---|---|---|
| Dry cup test | |||||||||
| A-1 | 0.000818 | 4.8 × 10⁻⁸ | 0.02745 | 1.7 × 10⁻⁶ | 1.9 × 10⁻⁹ | 5.2 × 10⁸ | 1.6 × 10⁻¹² | 99.5800 | 0.0815 |
| A-2 | 0.000832 | 5.3 × 10⁻⁸ | 0.02690 | 2.0 × 10⁻⁶ | 2.2 × 10⁻⁹ | 4.6 × 10⁸ | 1.8 × 10⁻¹² | 83.2100 | 0.0692 |
| A-3 | 0.000806 | 5.4 × 10⁻⁸ | 0.02690 | 2.0 × 10⁻⁶ | 2.2 × 10⁻⁹ | 4.5 × 10⁸ | 1.8 × 10⁻¹² | 84.3770 | 0.0680 |
| A-4 | 0.000813 | 5.2 × 10⁻⁸ | 0.02690 | 1.9 × 10⁻⁶ | 2.1 × 10⁻⁹ | 4.7 × 10⁸ | 1.7 × 10⁻¹² | 88.0300 | 0.0716 |
| A-5 | 0.000804 | 5.1 × 10⁻⁸ | 0.02660 | 1.9 × 10⁻⁶ | 2.1 × 10⁻⁹ | 4.7 × 10⁸ | 1.7 × 10⁻¹² | 89.2200 | 0.0717 |
| Mean | 0.000815 | 5.1 × 10⁻⁸ | 0.02695 | 1.9 × 10⁻⁶ | 2.1 × 10⁻⁹ | 4.7 × 10⁸ | 1.7 × 10⁻¹² | 88.8834 | 0.0724 |
| Wet cup test | |||||||||
| A-6 | 0.000825 | 7.5 × 10⁻⁸ | 0.02690 | 2.8 × 10⁻⁶ | 1.7 × 10⁻⁹ | 5.8 × 10⁸ | 1.4 × 10⁻¹² | 113.9300 | 0.0939 |
| A-7 | 0.000825 | 1.0 × 10⁻⁷ | 0.02660 | 3.8 × 10⁻⁶ | 2.4 × 10⁻⁹ | 4.2 × 10⁸ | 1.9 × 10⁻¹² | 76.4600 | 0.0631 |
| A-8 | 0.000804 | 9.0 × 10⁻⁸ | 0.02630 | 3.4 × 10⁻⁶ | 2.1 × 10⁻⁹ | 4.8 × 10⁸ | 1.7 × 10⁻¹² | 91.8400 | 0.0735 |
| A-9 | 0.000824 | 9.8 × 10⁻⁸ | 0.02745 | 3.6 × 10⁻⁶ | 2.2 × 10⁻⁹ | 4.5 × 10⁸ | 1.8 × 10⁻¹² | 83.6100 | 0.0689 |
| A-10 | 0.000801 | 8.2 × 10⁻⁸ | 0.02834 | 2.9 × 10⁻⁶ | 1.8 × 10⁻⁹ | 5.7 × 10⁸ | 1.4 × 10⁻¹² | 113.1600 | 0.0906 |
| Mean | 0.000816 | 8.9 × 10⁻⁸ | 0.02712 | 3.3 × 10⁻⁶ | 2.0 × 10⁻⁹ | 5.0 × 10⁸ | 1.7 × 10⁻¹² | 95.8000 | 0.0780 |
| Sample Tested @23 °C 50%RH | Mean Thickness d (m) | Mass Change Rate/Time (G in kg/s) | Area m2 | Water Vapour Flux g = G/A in kg/(s × m2) | Water Vapour Permeance W = g/dp in kg/ (s × m2 × Pa) | Water Vapour Resistance Z = 1/W in (s × m2 × Pa)/kg | Water Vapour Permeability δ = W × d in kg/(s × m × Pa) | Water Vapour Resistance Factor µ | Diffusion-Equivalent Air Layer Thickness Sd |
|---|---|---|---|---|---|---|---|---|---|
| Dry cup test | |||||||||
| A-1 | 0.000804 | 5.7 × 10⁻⁸ | 0.02775 | 2.1 × 10⁻⁶ | 1.6 × 10⁻⁹ | 6.4 × 10⁸ | 1.3 × 10⁻¹² | 128.3300 | 0.1032 |
| A-2 | 0.000819 | 8.5 × 10⁻⁸ | 0.02750 | 3.1 × 10⁻⁶ | 2.3 × 10⁻⁹ | 4.3 × 10⁸ | 1.9 × 10⁻¹² | 76.0200 | 0.0623 |
| A-3 | 0.000794 | 8.1 × 10⁻⁸ | 0.02660 | 3.0 × 10⁻⁶ | 2.3 × 10⁻⁹ | 4.4 × 10⁸ | 1.8 × 10⁻¹² | 80.0900 | 0.0636 |
| A-4 | 0.000784 | 1.0 × 10⁻⁷ | 0.02600 | 4.0 × 10⁻⁶ | 3.0 × 10⁻⁹ | 3.3 × 10⁸ | 2.4 × 10⁻¹² | 55.7600 | 0.0437 |
| A-5 | 0.000808 | 5.2 × 10⁻⁸ | 0.02750 | 1.9 × 10⁻⁶ | 1.4 × 10⁻⁹ | 6.9 × 10⁸ | 1.2 × 10⁻¹² | 139.8500 | 0.1131 |
| Mean | 0.000802 | 7.6 × 10⁻⁸ | 0.02707 | 2.8 × 10⁻⁶ | 2.1 × 10⁻⁹ | 5.1 × 10⁸ | 1.7 × 10⁻¹² | 96.0100 | 0.0772 |
| Wet cup test | |||||||||
| A-6 | 0.000836 | 7.4 × 10⁻⁸ | 0.02775 | 2.3 × 10⁻⁶ | 2.2 × 10⁻⁹ | 4.5 × 10⁸ | 1.8 × 10⁻¹² | 85.3400 | 0.0680 |
| A-7 | 0.000824 | 9.2 × 10⁻⁸ | 0.02750 | 3.3 × 10⁻⁶ | 2.8 × 10⁻⁹ | 3.6 × 10⁸ | 2.8 × 10⁻¹² | 60.9900 | 0.0503 |
| A-8 | 0.000808 | 1.0 × 10⁻⁷ | 0.02775 | 3.6 × 10⁻⁶ | 3.0 × 10⁻⁹ | 3.4 × 10⁸ | 2.4 × 10⁻¹² | 55.9800 | 0.0452 |
| A-9 | 0.000804 | 9.9 × 10⁻⁸ | 0.02775 | 3.6 × 10⁻⁶ | 2.9 × 10⁻⁹ | 3.4 × 10⁸ | 2.4 × 10⁻¹² | 57.1540 | 0.0459 |
| A-10 | 0.000805 | 9.3 × 10⁻⁸ | 0.02745 | 3.4 × 10⁻⁶ | 2.8 × 10⁻⁹ | 3.6 × 10⁸ | 2.3 × 10⁻¹² | 60.8100 | 0.0490 |
| Mean | 0.000815 | 9.1 × 10⁻⁸ | 0.02764 | 3.2 × 10⁻⁶ | 2.7 × 10⁻⁹ | 3.7 × 10⁸ | 2.3 × 10⁻¹² | 64.0548 | 0.0517 |
| Sample Tested @23 °C 65%RH | Mean Thickness d (m) | Mass Change Rate/Time (G in kg/s) | Area m2 | Water Vapour Flux g = G/A in kg/(s × m2) | Water Vapour Permeance W = g/dp in kg/ (s × m2 × Pa) | Water Vapour Resistance Z = 1/W in (s × m2 × Pa)/kg | Water Vapour Permeability δ = W × d in kg/(s × m × Pa) | Water Vapour Resistance Factor µ | Diffusion-Equivalent Air Layer Thickness Sd |
|---|---|---|---|---|---|---|---|---|---|
| Dry cup test | |||||||||
| A-1 | 0.000819 | 1.4 × 10⁻⁷ | 0.02778 | 5.0 × 10⁻⁶ | 2.9 × 10⁻⁹ | 3.5 × 10⁸ | 2.4 × 10⁻¹² | 57.7200 | 0.0473 |
| A-2 | 0.000795 | 1.4 × 10⁻⁷ | 0.02750 | 4.9 × 10⁻⁶ | 2.8 × 10⁻⁹ | 3.5 × 10⁸ | 2.3 × 10⁻¹² | 61.3300 | 0.0488 |
| A- 3 | 0.000793 | 1.0 × 10⁻⁷ | 0.02750 | 3.8 × 10⁻⁶ | 2.2 × 10⁻⁹ | 4.6 × 10⁸ | 1.7 × 10⁻¹² | 87.6300 | 0.0695 |
| A- 4 | 0.000795 | 1.4 × 10⁻⁷ | 0.02750 | 5.0 × 10⁻⁶ | 2.9 × 10⁻⁹ | 3.5 × 10⁸ | 2.3 × 10⁻¹² | 58.3500 | 0.0464 |
| A- 5 | 0.000790 | 1.1 × 10⁻⁷ | 0.02720 | 4.1 × 10⁻⁶ | 2.3 × 10⁻⁹ | 4.3 × 10⁸ | 1.8 × 10⁻¹² | 80.2200 | 0.0634 |
| Mean | 0.000798 | 1.3 × 10⁻⁷ | 0.02750 | 4.6 × 10⁻⁶ | 2.6 × 10⁻⁹ | 3.9 × 10⁸ | 2.1 × 10⁻¹² | 69.0500 | 0.0551 |
| Wet cup test | |||||||||
| A-6 | 0.000772 | 5.5 × 10⁻⁸ | 0.02750 | 2.0 × 10⁻⁶ | 2.5 × 10⁻⁹ | 3.9 × 10⁸ | 2.0 × 10⁻¹² | 73.9300 | 0.0571 |
| A-7 | 0.000798 | 5.2 × 10⁻⁸ | 0.02630 | 2.0 × 10⁻⁶ | 2.5 × 10⁻⁹ | 3.9 × 10⁸ | 2.1 × 10⁻¹² | 70.3900 | 0.0562 |
| A-8 | 0.000814 | 4.3 × 10⁻⁸ | 0.02780 | 1.5 × 10⁻⁶ | 2.0 × 10⁻⁹ | 5.1 × 10⁸ | 1.6 × 10⁻¹² | 98.7200 | 0.0804 |
| A-9 | 0.000793 | 4.9 × 10⁻⁸ | 0.02750 | 1.8 × 10⁻⁶ | 2.3 × 10⁻⁹ | 4.4 × 10⁸ | 1.8 × 10⁻¹² | 83.4000 | 0.0662 |
| A-10 | 0.000791 | 6.1 × 10⁻⁸ | 0.02780 | 2.2 × 10⁻⁶ | 2.8 × 10⁻⁹ | 3.6 × 10⁸ | 2.2 × 10⁻¹² | 64.0990 | 0.0507 |
| Mean | 0.000794 | 5.2 × 10⁻⁸ | 0.02738 | 1.9 × 10⁻⁶ | 2.4 × 10⁻⁹ | 4.2 × 10⁸ | 1.9 × 10⁻¹² | 78.1078 | 0.0621 |
| Sample Tested @23°C 80%RH | Mean Thicknessd (m) | Mass Change Rate/Time (G in kg/s) | Area m2 | Water Vapour Fluxg g = G/A in kg/(s × m2) | Water Vapour Permeance W = g/dp in kg/ (s × m2 × Pa) | Water Vapour Resistance Z = 1/W in (s × m2 × Pa)/kg | Water Vapour Permeability δ = W × d in kg/(s × m × Pa) | Water Vapour Resistance Factor µ | Diffusion Equivalent Air Layer Thickness Sd |
|---|---|---|---|---|---|---|---|---|---|
| Dry cup test | |||||||||
| A-1 | 0.000774 | 1.4 × 10⁻⁷ | 0.02780 | 4.7 × 10⁻⁶ | 2.3 × 10⁻⁹ | 4.4 × 10⁸ | 1.8 × 10⁻¹² | 83.4000 | 0.0646 |
| A-2 | 0.000765 | 1.7 × 10⁻⁷ | 0.02720 | 6.1 × 10⁻⁶ | 2.8 × 10⁻⁹ | 3.5 × 10⁸ | 2.2 × 10⁻¹² | 63.3200 | 0.0484 |
| A-3 | 0.000773 | 1.6 × 10⁻⁷ | 0.02720 | 5.9 × 10⁻⁶ | 2.7 × 10⁻⁹ | 3.7 × 10⁸ | 2.1 × 10⁻¹² | 65.7200 | 0.0508 |
| A-4 | 0.000764 | 1.8 × 10⁻⁷ | 0.02780 | 6.4 × 10⁻⁶ | 2.9 × 10⁻⁹ | 3.4 × 10⁸ | 2.2 × 10⁻¹² | 60.2000 | 0.0460 |
| A-5 | 0.000775 | 1.8 × 10⁻⁷ | 0.02750 | 6.4 × 10⁻⁶ | 3.0 × 10⁻⁹ | 3.4 × 10⁸ | 2.3 × 10⁻¹² | 58.2000 | 0.0451 |
| Mean | 0.000770 | 1.6 × 10⁻⁷ | 0.02750 | 5.9 × 10⁻⁶ | 2.8 × 10⁻⁹ | 3.7 × 10⁸ | 2.1 × 10⁻¹² | 66.1680 | 0.0510 |
| Wet cup test | |||||||||
| A-6 | 0.000835 | 2.0 × 10⁻⁸ | 0.02780 | 7.0 × 10⁻⁷ | 1.9 × 10⁻⁹ | 5.2 × 10⁸ | 1.6 × 10⁻¹² | 97.5100 | 0.0815 |
| A-7 | 0.000829 | 2.1 × 10⁻⁸ | 0.02810 | 7.5 × 10⁻⁷ | 2.0 × 10⁻⁹ | 4.9 × 10⁸ | 1.7 × 10⁻¹² | 91.0000 | 0.0754 |
| A-8 | 0.000807 | 1.8 × 10⁻⁸ | 0.02750 | 6.6 × 10⁻⁷ | 1.8 × 10⁻⁹ | 5.6 × 10⁸ | 1.5 × 10⁻¹² | 109.4600 | 0.0883 |
| A-9 | 0.000833 | 2.3 × 10⁻⁸ | 0.02780 | 8.2 × 10⁻⁷ | 2.2 × 10⁻⁹ | 4.5 × 10⁸ | 1.9 × 10⁻¹² | 80.1300 | 0.0668 |
| A-10 | 0.000823 | 2.4 × 10⁻⁸ | 0.02750 | 8.8 × 10⁻⁷ | 2.4 × 10⁻⁹ | 4.1 × 10⁸ | 2.0 × 10⁻¹² | 73.7500 | 0.0507 |
| Mean | 0.000825 | 4.6 × 10⁻⁷ | 0.02774 | 7.6 × 10⁻⁷ | 2.1 × 10⁻⁹ | 4.9 × 10⁸ | 1.7 × 10⁻¹² | 90.3700 | 0.0725 |
| Sample Tested @23 °C 35%RH | Mean Thickness d (m) | Mass Change Rate/Time (G in kg/s) | Area m2 | Water Vapour Flux g = G/A in kg/(s × m2) | Water Vapour Permeance W = g/dp in kg/ (s × m2 × Pa) | Water Vapour Resistance Z = 1/W in (s × m2 × Pa)/kg | Water Vapour Permeability δ = W × d in kg/(s × m × Pa) | Water Vapour Resistance Factor µ | Diffusion- Air Layer Thickness Sd |
|---|---|---|---|---|---|---|---|---|---|
| Dry cup test | |||||||||
| B-1 | 0.000449 | 2.0 × 10⁻⁸ | 0.02745 | 7.4 × 10⁻⁷ | 8.2 × 10⁻¹⁰ | 1.2 × 10⁹ | 3.7 × 10⁻¹³ | 488.37 | 0.2193 |
| B-2 | 0.000449 | 2.0 × 10⁻⁸ | 0.02745 | 7.2 × 10⁻⁷ | 8.0 × 10⁻¹⁰ | 1.2 × 10⁹ | 3.6 × 10⁻¹³ | 499.37 | 0.2242 |
| B-3 | 0.000479 | 2.1 × 10⁻⁸ | 0.02686 | 8.0 × 10⁻⁷ | 8.8 × 10⁻¹⁰ | 1.1 × 10⁹ | 4.2 × 10⁻¹³ | 421.93 | 0.2021 |
| B-4 | 0.000457 | 2.6 × 10⁻⁸ | 0.02629 | 9.8 × 10⁻⁷ | 1.1 × 10⁻¹⁰ | 9.2 × 10⁹ | 4.9 × 10⁻¹³ | 352.68 | 0.1612 |
| B-5 | 0.000476 | 1.7 × 10⁻⁸ | 0.02629 | 6.5 × 10⁻⁷ | 7.3 × 10⁻¹⁰ | 1.4 × 10⁹ | 3.5 × 10⁻¹³ | 525.07 | 0.2499 |
| Mean | 0.000462 | 2.1 × 10⁻⁸ | 0.026868 | 7.8 × 10⁻⁷ | 8.6 × 10⁻¹⁰ | 1.2 × 10⁹ | 4.0 × 10⁻¹³ | 457.484 | 0.21134 |
| Wet cup test | |||||||||
| B-6 | 0.000412 | 3.0 × 10⁻⁸ | 0.02629 | 1.1 × 10⁻⁶ | 7.0 × 10⁻¹⁰ | 1.4 × 10⁹ | 2.9 × 10⁻¹³ | 611.33 | 0.2519 |
| B-7 | 0.000472 | 3.0 × 10⁻⁸ | 0.02572 | 1.2 × 10⁻⁶ | 7.2 × 10⁻¹⁰ | 1.4 × 10⁹ | 3.4 × 10⁻¹³ | 521.32 | 0.2461 |
| B-8 | 0.000487 | 3.4 × 10⁻⁸ | 0.02629 | 1.3 × 10⁻⁶ | 8.0 × 10⁻¹⁰ | 1.2 × 10⁹ | 3.9 × 10⁻¹³ | 447.98 | 0.2182 |
| B-9 | 0.000468 | 3.6 × 10⁻⁸ | 0.02804 | 1.3 × 10⁻⁶ | 7.9 × 10⁻¹⁰ | 1.3 × 10⁹ | 3.7 × 10⁻¹³ | 472.68 | 0.2213 |
| B-10 | 0.000465 | 4.1 × 10⁻⁸ | 0.02745 | 1.5 × 10⁻⁶ | 9.3 × 10⁻¹⁰ | 1.1 × 10⁹ | 4.3 × 10⁻¹³ | 400.86 | 0.1864 |
| Mean | 0.0004608 | 3.4 × 10⁻⁸ | 0.026758 | 1.3 ×10⁻⁶ | 7.9 × 10⁻¹⁰ | 1.3 × 10⁹ | 3.6 × 10⁻¹³ | 490.834 | 0.22478 |
| Sample Tested @23 °C 50%RH | Mean Thickness d (m) | Mass Change Rate/Time (G in kg/s) | Area m2 | Water Vapour Flux g = G/A in kg/ (s × m2) | Water Vapour Permeance W = g/dp in kg/ (s × m2 × Pa) | Water Vapour Resistance Z = 1/W in (s × m2 × Pa)/kg | Water Vapour Permeability δ = W × d in kg/(s × m × Pa) | Water Vapour Resistance Factor µ | Diffusion Air Layer Thickness Sd |
|---|---|---|---|---|---|---|---|---|---|
| Dry cup test | |||||||||
| B-1 | 0.000473 | 2.2 × 10⁻⁸ | 0.0275 | 7.9 × 10⁻⁷ | 6.0 × 10⁻¹⁰ | 1.7 × 10⁹ | 2.8 × 10⁻¹³ | 634.39 | 0.3001 |
| B-2 | 0.000467 | 2.0 × 10⁻⁸ | 0.02745 | 7.4 × 10⁻⁷ | 5.9 × 10⁻¹⁰ | 1.8 × 10⁹ | 2.6 × 10⁻¹³ | 695.09 | 0.325 |
| B-3 | 0.00047 | 2.4 × 10⁻⁸ | 0.02775 | 8.6 × 10⁻⁷ | 6.5 × 10⁻¹⁰ | 1.5 × 10⁹ | 3.1 × 10⁻¹³ | 583.59 | 0.274 |
| B-4 | 0.000485 | 2.6 × 10⁻⁸ | 0.02775 | 9.4 × 10⁻⁷ | 7.1 × 10⁻¹⁰ | 1.4 × 10⁹ | 3.5 × 10⁻¹³ | 512.54 | 0.2483 |
| B-5 | 0.000478 | 2.4 × 10⁻⁸ | 0.02775 | 8.6 × 10⁻⁷ | 6.5 × 10⁻¹⁰ | 1.5 × 10⁹ | 3.1 × 10⁻¹³ | 572.39 | 0.2736 |
| Mean | 0.0004746 | 2.3 × 10⁻⁸ | 0.02764 | 8.4 × 10⁻⁷ | 6.4 × 10⁻¹⁰ | 1.6 × 10⁹ | 3.0 × 10⁻¹³ | 599.6 | 0.2842 |
| Wet cup test | |||||||||
| B-6 | 0.000481 | 3.4 × 10⁻⁸ | 0.027745 | 1.2 × 10⁻⁶ | 1.0 × 10⁻⁹ | 1.0 × 10⁹ | 4.8 × 10⁻¹³ | 355.59 | 0.171 |
| B-7 | 0.00049 | 2.6 × 10⁻⁸ | 0.02745 | 9.4 × 10⁻⁷ | 7.8 × 10⁻¹⁰ | 1.3 × 10⁹ | 3.8 × 10⁻¹³ | 464.12 | 0.2274 |
| B-8 | 0.000462 | 4.2 × 10⁻⁸ | 0.02745 | 1.5 × 10⁻⁶ | 1.3 × 10⁻⁹ | 7.8 × 10⁸ | 5.9 × 10⁻¹³ | 282.09 | 0.1303 |
| B-9 | 0.000477 | 2.7 × 10⁻⁸ | 0.028 | 9.6 × 10⁻⁷ | 7.9 × 10⁻¹⁰ | 1.3 × 10⁹ | 3.8 × 10⁻¹³ | 465.67 | 0.2221 |
| B-10 | 0.000461 | 4.5 × 10⁻⁸ | 0.02745 | 1.6 × 10⁻⁶ | 1.4 × 10⁻⁹ | 7.3 × 10⁸ | 6.3 × 10⁻¹³ | 262.034 | 0.121 |
| Mean | 0.0004742 | 3.5 × 10⁻⁸ | 0.027619 | 1.3 × 10⁻⁶ | 1.0 × 10⁻⁹ | 1.0 × 10⁹ | 4.9 × 10⁻¹³ | 365.9008 | 0.17436 |
| Sample Tested @23 °C 65%RH | Mean Thickness d (m) | Mass Change Rate/Time (G in kg/s) | Area m2 | Water Vapour Flux g = G/A in kg/ (s × m2) | Water Vapour Permeance W = g/dp in kg/ (s × m2 × Pa) | Water Vapour Resistance Z = 1/W in (s × m2 × Pa)/kg | Water Vapour Permeability δ = W × d in kg/(s × m × Pa) | Water Vapour Resistance Factor µ | Diffusion Air Layer Thickness Sd |
|---|---|---|---|---|---|---|---|---|---|
| Dry cup test | |||||||||
| B-1 | 0.000446 | 3.6 × 10⁻⁸ | 0.0275 | 1.3 × 10⁻⁶ | 7.5 × 10⁻¹⁰ | 1.3 × 10⁹ | 3.3 × 10⁻¹³ | 547.89 | 0.2444 |
| B-2 | 0.000454 | 4.4 × 10⁻⁸ | 0.0284 | 1.6 × 10⁻⁶ | 8.9 × 10⁻¹⁰ | 1.1 × 10⁹ | 4.0 × 10⁻¹³ | 442.91 | 0.2011 |
| B-3 | 0.00045 | 4.2 × 10⁻⁸ | 0.02778 | 1.5 × 10⁻⁶ | 8.7 × 10⁻¹⁰ | 1.2 × 10⁹ | 3.9 × 10⁻¹³ | 459.47 | 0.2068 |
| B-4 | 0.000464 | 4.2 × 10⁻⁸ | 0.0269 | 1.6 × 10⁻⁶ | 9.0 × 10⁻¹⁰ | 1.1 × 10⁹ | 4.2 × 10⁻¹³ | 326.97 | 0.1981 |
| B-5 | 0.000455 | 4.1 × 10⁻⁸ | 0.0275 | 1.5 × 10⁻⁶ | 8.5 × 10⁻¹⁰ | 1.2 × 10⁹ | 3.9 × 10⁻¹³ | 463.78 | 0.2110 |
| Mean | 0.0004538 | 4.1 × 10⁻⁸ | 0.0276 | 1.5 × 10⁻⁶ | 8.5 × 10⁻¹⁰ | 1.2 × 10⁹ | 3.9 × 10⁻¹³ | 448.204 | 0.2123 |
| Wet cup test | |||||||||
| B-6 | 0.000445 | 2.1 × 10⁻⁸ | 0.0275 | 7.7 × 10⁻⁷ | 9.7 × 10⁻¹⁰ | 1.0 × 10⁹ | 4.3 × 10⁻¹³ | 405 | 0.1803 |
| B-7 | 0.000445 | 2.0 × 10⁻⁸ | 0.0281 | 7.1 × 10⁻⁷ | 9.0 × 10⁻¹⁰ | 1.1 × 10⁹ | 4.0 × 10⁻¹³ | 440.52 | 0.196 |
| B-8 | 0.000458 | 2.2 × 10⁻⁸ | 0.0275 | 8.1 × 10⁻⁷ | 1.0 × 10⁻⁹ | 9.7 × 10⁸ | 4.7 × 10⁻¹³ | 368.78 | 0.1689 |
| B-9 | 0.00044 | 2.6 × 10⁻⁸ | 0.0275 | 9.5 × 10⁻⁷ | 1.2 × 10⁻⁹ | 8.3 × 10⁸ | 5.3 × 10⁻¹³ | 322.8 | 0.142 |
| B-10 | 0.000447 | 2.5 × 10⁻⁸ | 0.02778 | 9.0 × 10⁻⁷ | 1.1 × 10⁻⁹ | 8.8 × 10⁸ | 5.1 × 10⁻¹³ | 338.42 | 0.121 |
| Mean | 0.000447 | 2.3 × 10⁻⁸ | 0.0278 | 8.3 × 10⁻⁷ | 1.1 × 10⁻⁹ | 9.6 × 10⁸ | 1.1 × 10⁻¹³ | 375.104 | 0.16164 |
| Sample Tested @23 °C 80%RH | Mean Thickness d (m) | Mass Change Rate/Time (G in kg/s) | Area m2 | Water Vapour Flux g = G/A in kg/ (s × m2) | Water Vapour Permeance W = g/dp in kg/ (s × m2 × Pa) | Water Vapour Resistance Z = 1/W in (s × m2 × Pa)/kg | Water Vapour Permeability δ = W × d in kg/(s × m × Pa) | Water Vapour Resistance Factor µ | Diffusion Air Layer Thickness Sd |
|---|---|---|---|---|---|---|---|---|---|
| Dry cup test | |||||||||
| B-1 | 0.000454 | 5.8 × 10⁻⁸ | 0.0284 | 2.0 × 10⁻⁶ | 9.4 × 10⁻¹⁰ | 1.1 × 10⁹ | 4.3 × 10⁻¹³ | 409 | 0.1861 |
| B-2 | 0.000456 | 5.2 × 10⁻⁸ | 0.0272 | 1.9 × 10⁻⁶ | 8.8 × 10⁻¹⁰ | 1.1 × 10⁹ | 4.0 × 10⁻¹³ | 437.96 | 0.1997 |
| B-3 | 0.000464 | 5.2 × 10⁻⁸ | 0.0275 | 1.9 × 10⁻⁶ | 8.7 × 10⁻¹⁰ | 1.2 × 10⁹ | 4.0 × 10⁻¹³ | 438.79 | 0.2036 |
| B-4 | 0.000468 | 5.1 × 10⁻⁸ | 0.0275 | 1.9 × 10⁻⁶ | 8.6 × 10⁻¹⁰ | 1.2 × 10⁹ | 4.0 × 10⁻¹³ | 440.36 | 0.2061 |
| B-5 | 0.000461 | 5.3 × 10⁻⁸ | 0.0278 | 1.9 × 10⁻⁶ | 8.8 × 10⁻¹⁰ | 1.1 × 10⁹ | 4.0 × 10⁻¹³ | 436.21 | 0.2011 |
| Mean | 0.000461 | 5.3 × 10⁻⁸ | 0.02768 | 1.9 × 10⁻⁶ | 8.9 × 10⁻¹⁰ | 1.1 × 10⁹ | 4.1 × 10⁻¹³ | 432.464 | 0.19932 |
| Wet cup test | |||||||||
| B-6 | 0.000458 | 9.9 × 10⁻⁹ | 0.0278 | 3.6 × 10⁻⁷ | 9.8 × 10⁻¹⁰ | 1.0 × 10⁹ | 4.5 × 10⁻¹³ | 365.99 | 0.1676 |
| B-7 | 0.000456 | 9.3 × 10⁻⁹ | 0.0275 | 3.4 × 10⁻⁷ | 9.2 × 10⁻¹⁰ | 1.1 × 10⁹ | 4.2 × 10⁻¹³ | 419.08 | 0.1911 |
| B-8 | 0.000459 | 9.3 × 10⁻⁹ | 0.0272 | 3.4 × 10⁻⁷ | 9.3 × 10⁻¹⁰ | 1.1 × 10⁹ | 4.3 × 10⁻¹³ | 411.16 | 0.1887 |
| B-9 | 0.000468 | 9.4 × 10⁻⁹ | 0.0275 | 3.4 × 10⁻⁷ | 9.4 × 10⁻¹⁰ | 1.1 × 10⁹ | 4.4 × 10⁻¹³ | 402.45 | 0.1884 |
| B-10 | 0.000455 | 8.9 × 10⁻⁹ | 0.0275 | 3.2 × 10⁻⁷ | 8.8 × 10⁻¹⁰ | 1.1 × 10⁹ | 4.0 × 10⁻¹³ | 442.24 | 0.2012 |
| Mean | 0.000459 | 9.3 × 10⁻⁹ | 0.0275 | 3.4 × 10⁻⁷ | 9.3 × 10⁻¹⁰ | 1.1 × 10⁹ | 4.3 × 10⁻¹³ | 408.184 | 0.1874 |


References
- Baker, P.H.; Galbraith, G.H.; McLean, R.C. Temperature gradient effects on moisture transport in porous building materials. Build. Serv. Eng. Res. Technol. 2009, 30, 37–48. [Google Scholar] [CrossRef]
- Olaoye, T.S.; Dewsbury, M.; Kunzel, H.; Nolan, G. An empirical measurement of the water vapour resistivity properties of typical australian pliable membrane. In Proceedings of the 54th International Conference of the Architectural Science Association (ANZAScA), Auckland, New Zealand, 25–28 November 2020. [Google Scholar]
- Valovirta, I.; Vinha, J. Water Vapor Permeability and Thermal Conductivity as a Function of Temperature and Relative Humidity. In Performance of Exterior Envelopes of Whole Buildings, Proceedings of the IX International Conference, Florida, FL, USA, 5–10 December 2004; ASHRAE: Atlanta, GA, USA, 2004. [Google Scholar]
- Couturier, M.; Boucher, C. Dynamic water vapor permeance of building materials and the benefits to buildings. In Proceedings of the 26th RCI International convention and trades show, Reno, NY, USA, 7–12 April 2011. [Google Scholar]
- ASTM. Standard test methods for water vapor transmission of materials. In E96/E96M; ASTM International: West Conshohocken, PA, USA, 2010. [Google Scholar]
- ISO. International Standard Organization EN. Hygrothermal Performance of Building Materials and Products—Determination of Water Vapour Transmission Properties—Cup Method ISO 12572. In EVS-EN ISO 12572:2016; Estonian Centre or Standardization: Brussels, Belgium, 2016. [Google Scholar]
- Viljanen, K.; Lu, X. An Experimental Study on the Drying-Out Ability of Highly Insulated Wall Structures with Built-In Moisture and Rain Leakage. Appl. Sci. 2019, 9, 1222. [Google Scholar] [CrossRef] [Green Version]
- Bomberg, M.; Furtak, M.; Yarbrough, D. Buildings with environmental quality management: Part 1: Designing multifunctional construction materials. J. Build. Phys. 2017, 41, 193–208. [Google Scholar] [CrossRef]
- Nath, S.; Dewsbury, M.; Orr, K. Is New Housing Health Hazard? In Engaging Architectural Science: Meeting the Challenges of Higher Density, Proceedings of the 52nd International Conference of the Architectural Science Association, Melbourne, Australia, 28 November–1 December 2018; RMIT University: Melbourne, Australia, 2018. [Google Scholar]
- Olaoye, T.S.; Dewsbury, M.; Kunzel, H. A Method for Establishing a Hygrothermally Controlled Test Room for Measuring the Water Vapor Resistivity Characteristics of Construction Materials. Energies 2020, 14, 4. [Google Scholar] [CrossRef]
- WHO. WHO Guidelines for Indoor Air Quality: Dampness and Mould; WHO Regional Office for Europe: Copenhagen, Denmark, 2009. [Google Scholar]
- Arman, H.; Narguess, K. The Effects of Air Permeability, Background Ventilation and Lifestyle on Energy Performance, Indoor Air Quality and Risk of Condensation in Domestic Buildings. Sustainability 2015, 7, 4022–4034. [Google Scholar]
- Jensen, N.F.; Bjarløv, S.P.; Rode, C.; Andersen, B.; Møller, E.B. Hygrothermal performance of six insulation systems for internal retrofitting solid masonry walls. J. Build. Phys. 2021, 44, 539–573. [Google Scholar] [CrossRef]
- Kaynakli, Ö.; Bademlioglu, A.H.; Ufat, H.T. Determination of optimum insulation thickness for different insulation applications considering condensation. Teh. Vjesn. Tech. Gaz. 2018, 25, 32–42. [Google Scholar]
- Fořt, J.; Šál, J.; Kočí, J.; Černý, R. Energy efficiency of novel interior surface layer with improved thermal characteristics and its effect on hygrothermal performance of contemporary building envelopes. Energies 2020, 13, 2012. [Google Scholar] [CrossRef] [Green Version]
- Künzel, H.M.; Zirkelbach, D. Advances in hygrothermal building component simulation: Modelling moisture sources likely to occur due to rainwater leakage. J. Build. Perform. Simul. 2013, 6, 346–353. [Google Scholar] [CrossRef]
- Langmans, J.; Klein, R.; Roels, S. Numerical and experimental investigation of the hygrothermal response of timber frame walls with an exterior air barrier. J. Build. Phys. 2013, 36, 375–397. [Google Scholar] [CrossRef]
- Wanghee, C.; Shizuo, I.; Shinsuke, K. Condensation Risk Due to Variations in Airtightness and Thermal Insulation of an Office Building in Warm and Wet Climate. Energies 2016, 9, 875. [Google Scholar]
- Woloszyn, M.; Rode, C. Tools for performance simulation of heat, air and moisture conditions of whole buildings. Build. Simul. 2008, 1, 5–24. [Google Scholar] [CrossRef]
- ANSI/ASHRAE. Criteria for moisture-control design analysis in buildings. In ASHRAE Standard 160; American Society of Heating, Refrigerating and Air-Conditioning Engineers: Atlanta, GA, USA, 2009. [Google Scholar]
- AIRAH. Criteria for moisture control design analysis in buildings. In DA07; Australian Institute of Refrigeration, Air Conditioning and Heating: Melbourne, Australia, 2020. [Google Scholar]
- Künzel, H.M. Adapted vapour control for durable building enclosures. In Proceedings of the 10th International Conference on Durability of Building Materials & Components, Lyon, France, 17–20 April 2005. [Google Scholar]
- Künzel, H.M.; Zirkelbach, D.; Sedlbauer, K. Predicting indoor temperature and humidity conditions including hygrothermal interactions with the building envelope. In Proceedings of the 1st International Conference on Sustainable Energy and Green Architecture, Building Scientific Research Center (BSRC), King Mongkut’s University Thonburi Bangkok, Bangkok, Thailand, 8–10 October 2003. [Google Scholar]
- Torres-Ramo, J.; González-Martínez, P.; Arriazu-Ramos, N.; Sánchez-Ostiz, A. Influence of the Water Vapour Permeability of Airtight Sheets on the Behaviour of Facade. Sustainability 2020, 12, 10480. [Google Scholar] [CrossRef]
- Mukhopadhyaya, P.M.; Kumaran, K.; Lackey, J.; Normandin, N.; van Reenen, D.; Tariku, F. Hygrothermal Properties of Exterior Claddings, Sheathing Boards, Membranes, and Insulation Materials for Building Envelope Design; ASHRAE: Atlanta, GA, USA, 2007. [Google Scholar]
- Dewsbury, M.; Law, T.; Potgieter, J.; Fitzgerald, D.; McComish, B.; Chandler, T.; Soudan, A. Scoping Study of Condensation in Residential Buildings: Final Report; Department of Industry Innovation and Science, Australian Building Codes Board: Canberra, Australia, 2016. [Google Scholar]
- Dewsbury, M.; Soudan, A.; Su, F.; Geard, D.; Cooper, A.; Law, T. Condensation Risk Mitigation for Tasmanian Housing; Department of Justice Tasmania: Hobart, Australia, 2018. [Google Scholar]
- AS/NZS. Pliable building membranes and underlays. In AS/NZS 4200:1; Council of Standards Australia: Sydney, Australia; SAI Global Limited and Standards: Auckland, New Zealand, 2017. [Google Scholar]
- Olaoye, T.S.; Dewsbury, M. Australian building materials and vapour resistivity. In Building Physics Forum; AIRAH: Wollogong, Australia, 2018. [Google Scholar]
- Olaoye, T.S.; Dewsbury, M. Establishing an Environmentally Controlled Room to Quantify Water Vapour Resistivity Properties of Construction Materials. In Revisiting the Role of Architecture for ‘Surviving’ Development, Proceedings of the 53rd International Conference of the Architectural Science Association 2019, Roorkee, India, 28–30 November 2019; Agrawal, A., Gupta, R., Eds.; Architectural Science Association (ANZAScA): Auckland, New Zealand, 2019; pp. 675–684. [Google Scholar]
- ABCB. Ncc 2019 Building Code of Australia; Australia Building Code Board: Canberra, Australia, 2019; Volume 2. [Google Scholar]


| Vapour Impermeable | Vapour Semi-Impermeable | Vapour Semi-Permeable | Vapour Permeable |
|---|---|---|---|
| Polyethylene | Oil based paints | Wood | Unpainted, paper-faced plasterboard |
| Vinyl | Some vinyl wall coverings | Plywood | Unpainted plaster |
| Glass | Extruded polystyrene | Expanded polystyrene | Bulk insulation (rock wool, glass wool and polyester) |
| Sheet metal | Paper-facedbulk insulation | Most plastic paints | Cellulose insulation, timber,clay bricks and concrete blocks |
| Vapour Permeance (See Note) μg/N. s | |||
|---|---|---|---|
| Class | VCM category | Min. (≥) | Max. (<) |
| Class 1 | Vapour barrier | 0.0000 | 0.0022 |
| Class 2 | 0.0022 | 0.1429 | |
| Class 3 | Vapour-permeable | 0.1429 | 1.1403 |
| Class 4 | No max. | ||
| ASTM-E96 Method B Wet Cup-23 °C 50%RH | |||
| Method | Test Period 1 (35%) | Test Period 2 (50%) | Test Period 3 (65%) | Test Period 4 (80%) |
|---|---|---|---|---|
| Material 1(A) | ||||
| Dry test | 1025.03 | 1030.5 | 1020.40 | 1033.46 |
| Wet test | 1014.26 | 1020.35 | 1017.27 | 1022.5 |
| Material 2 (B) | ||||
| Dry test | 1013.6 | 1030.1 | 1014.7 | 1033.1 |
| Wet test | 1022.23 | 1030.03 | 1022.1 | 1022.5 |
| Parameter | Values |
|---|---|
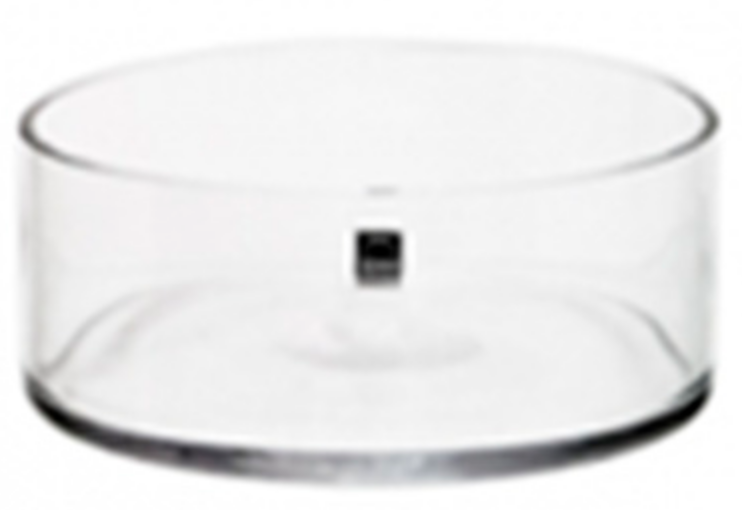
| Dishes | Round glass dish (60 × 195 mm) |
| Air space | 20 mm |
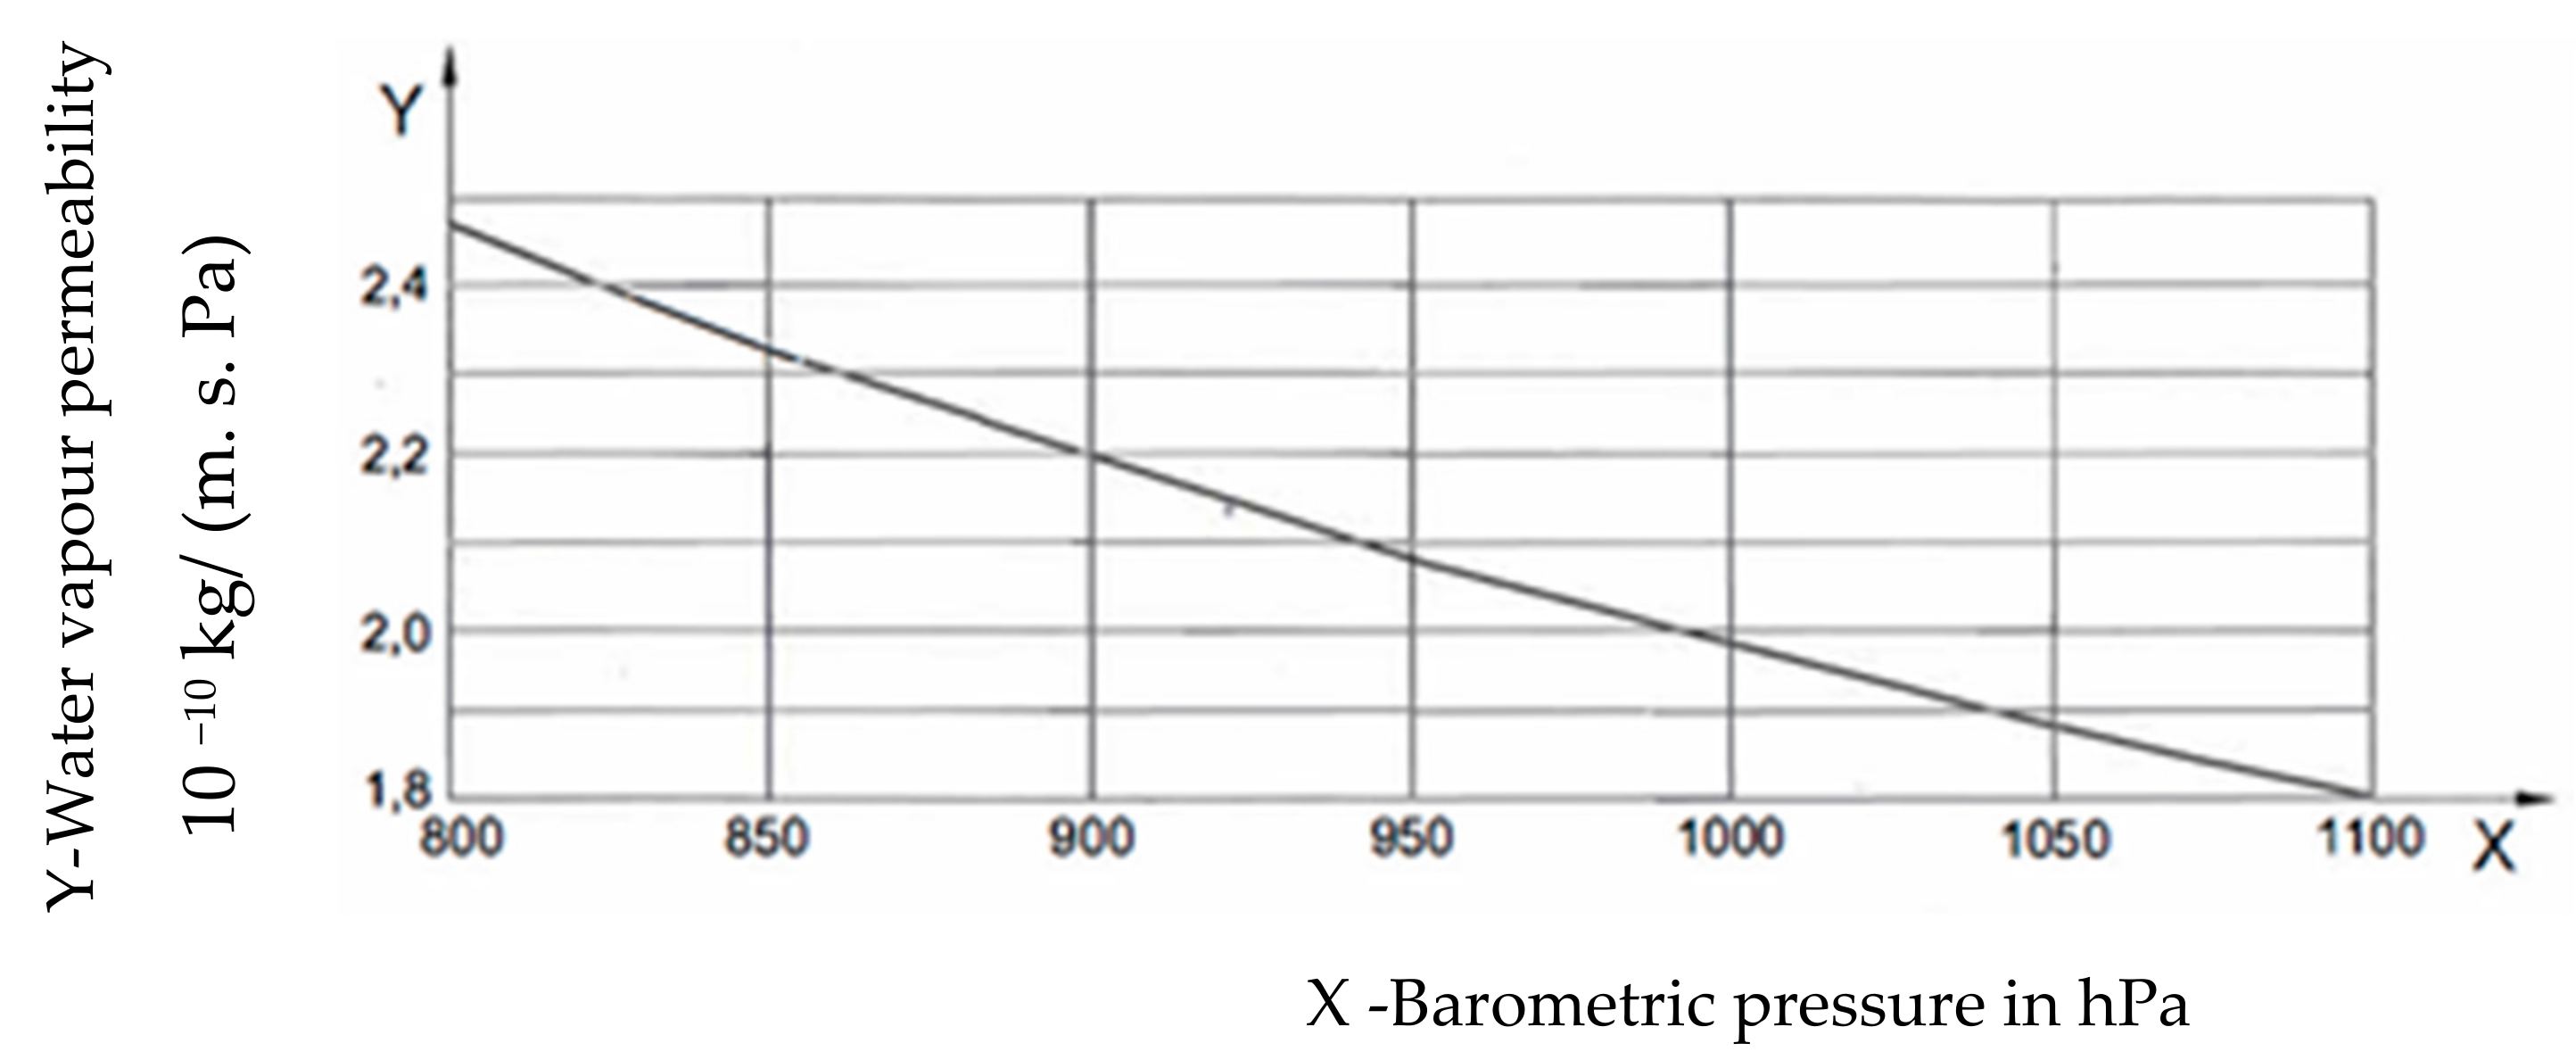
| Water vapor permeability of air | 1.92 × 10⁻¹⁰ kg/(m. s. Pa) |
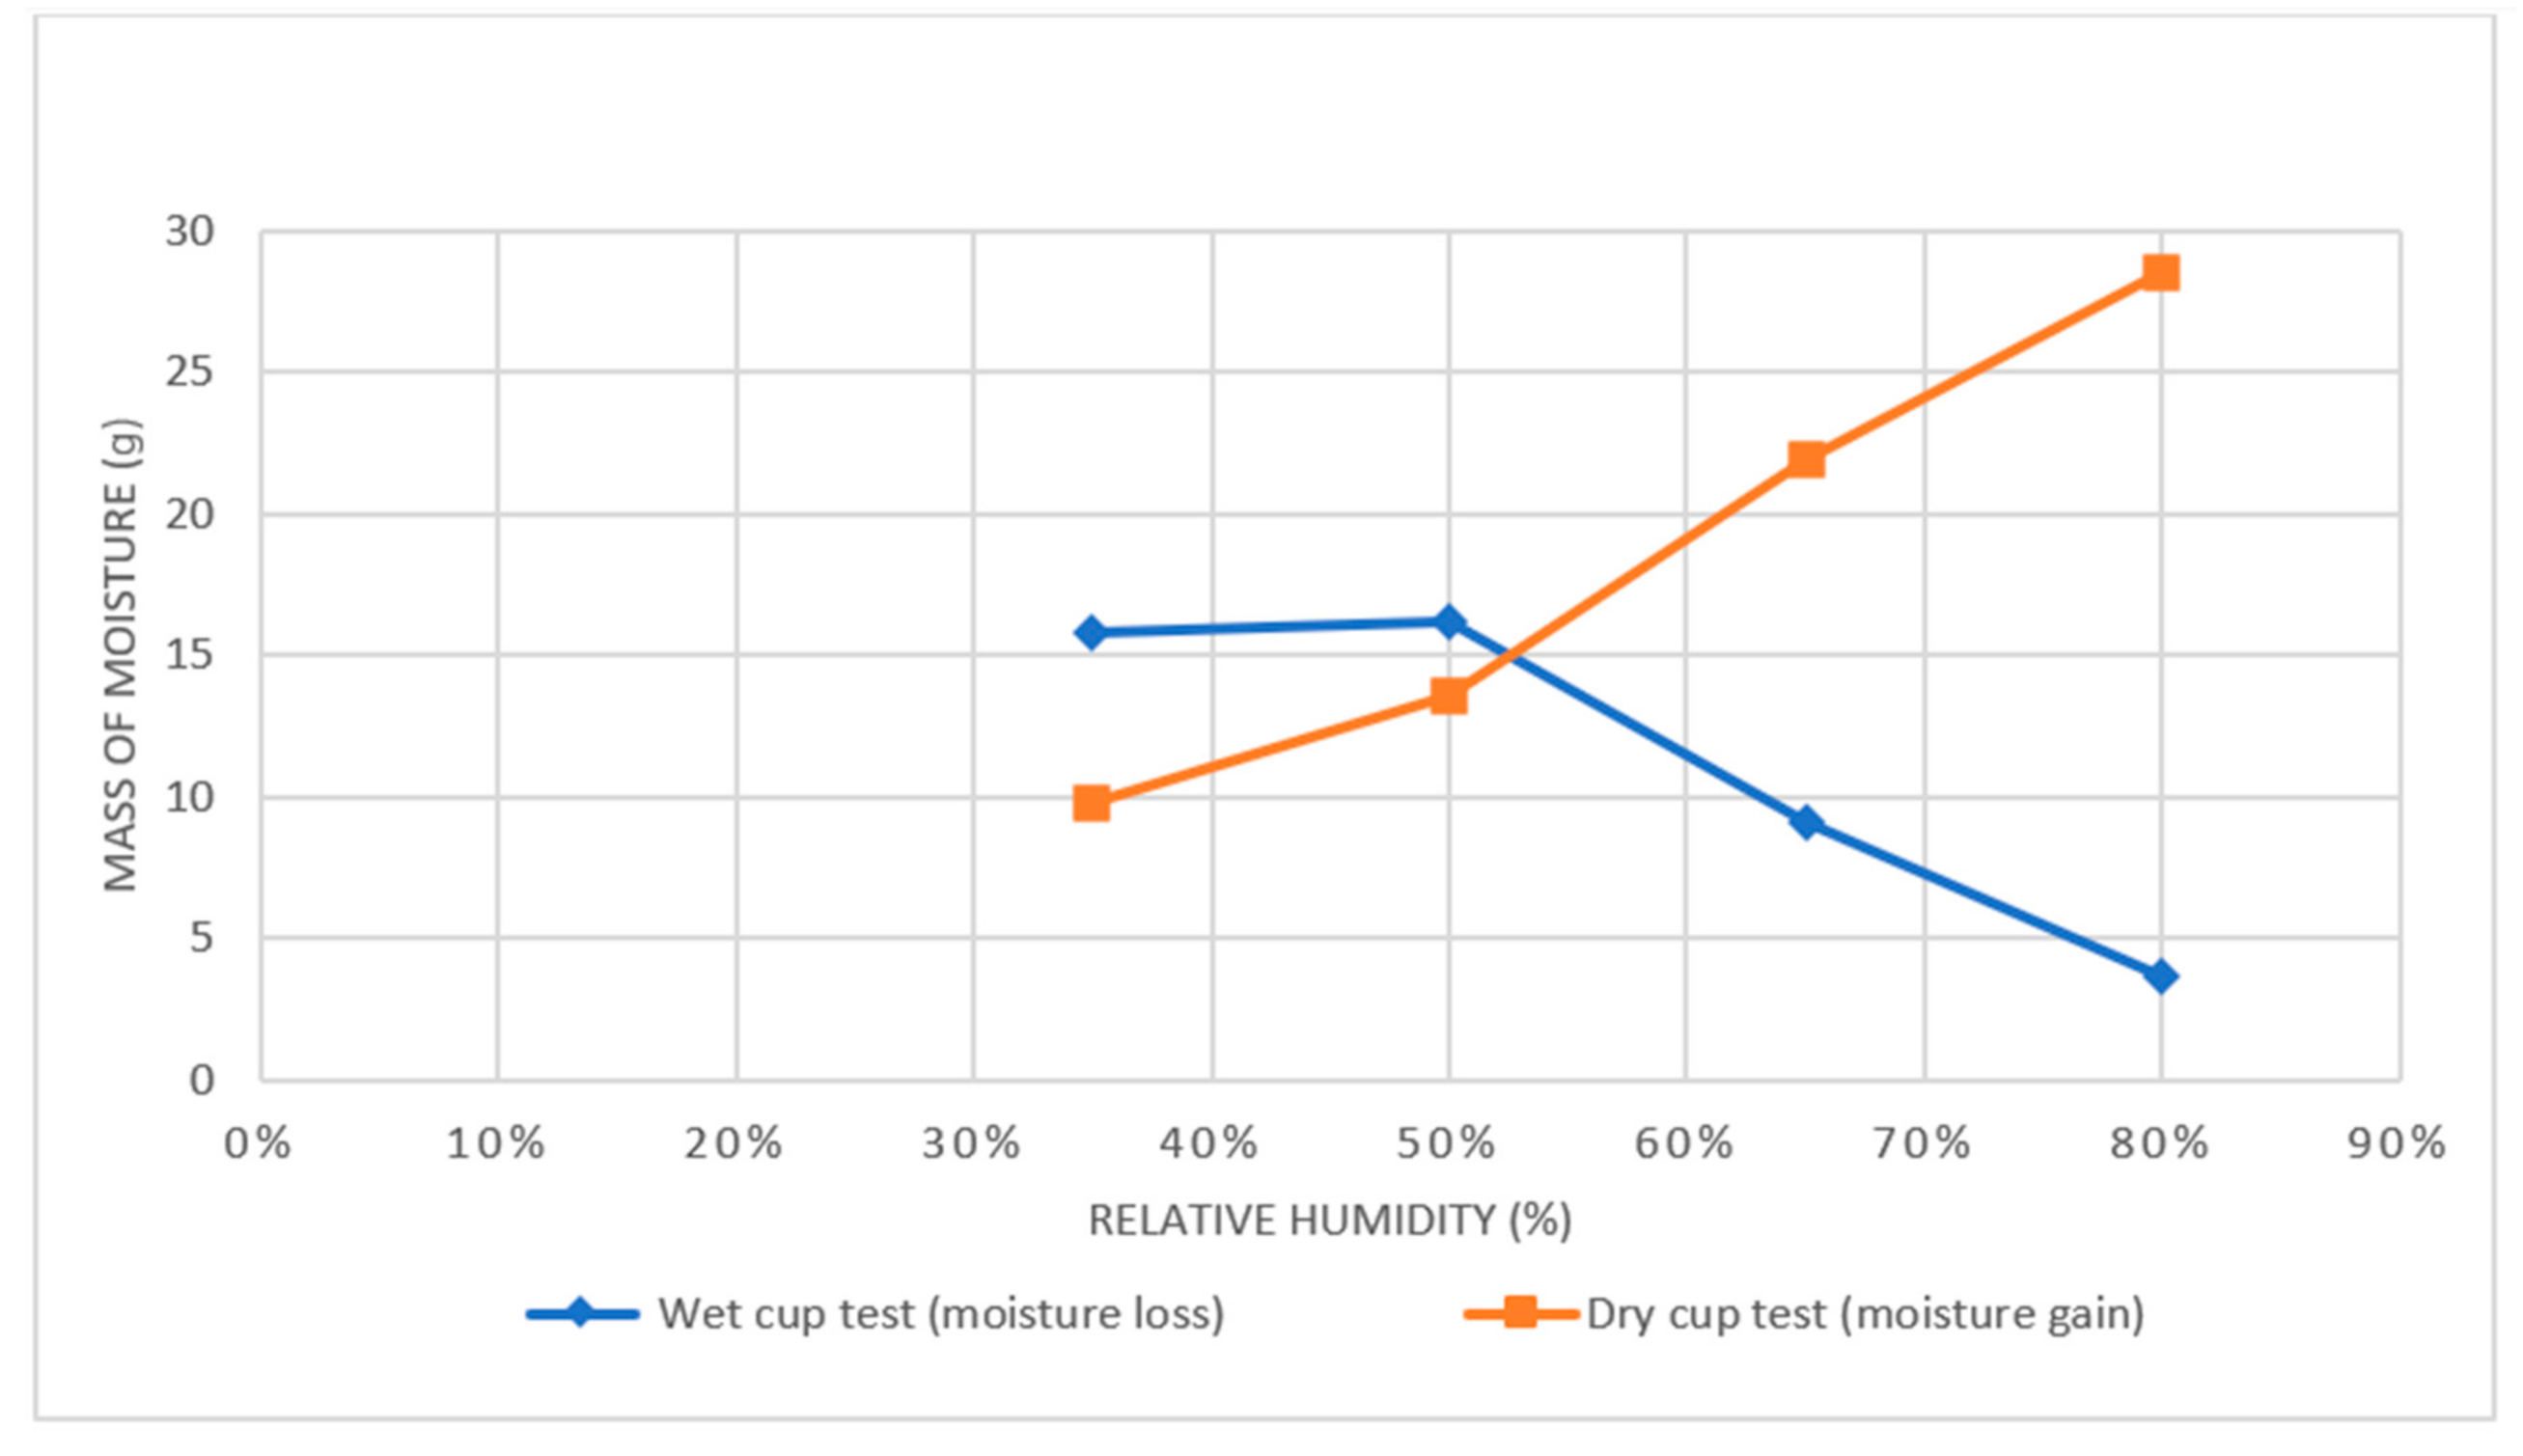
| Relative Humidity (%) | Moisture Loss (g) Wet Test | Moisture Gain (g) Dry Test |
|---|---|---|
| 35% | 15.8 | 9.75 |
| 50% | 16.21 | 13.6 |
| 65% | 9.08 | 21.9 |
| 80% | 3.65 | 28.53 |
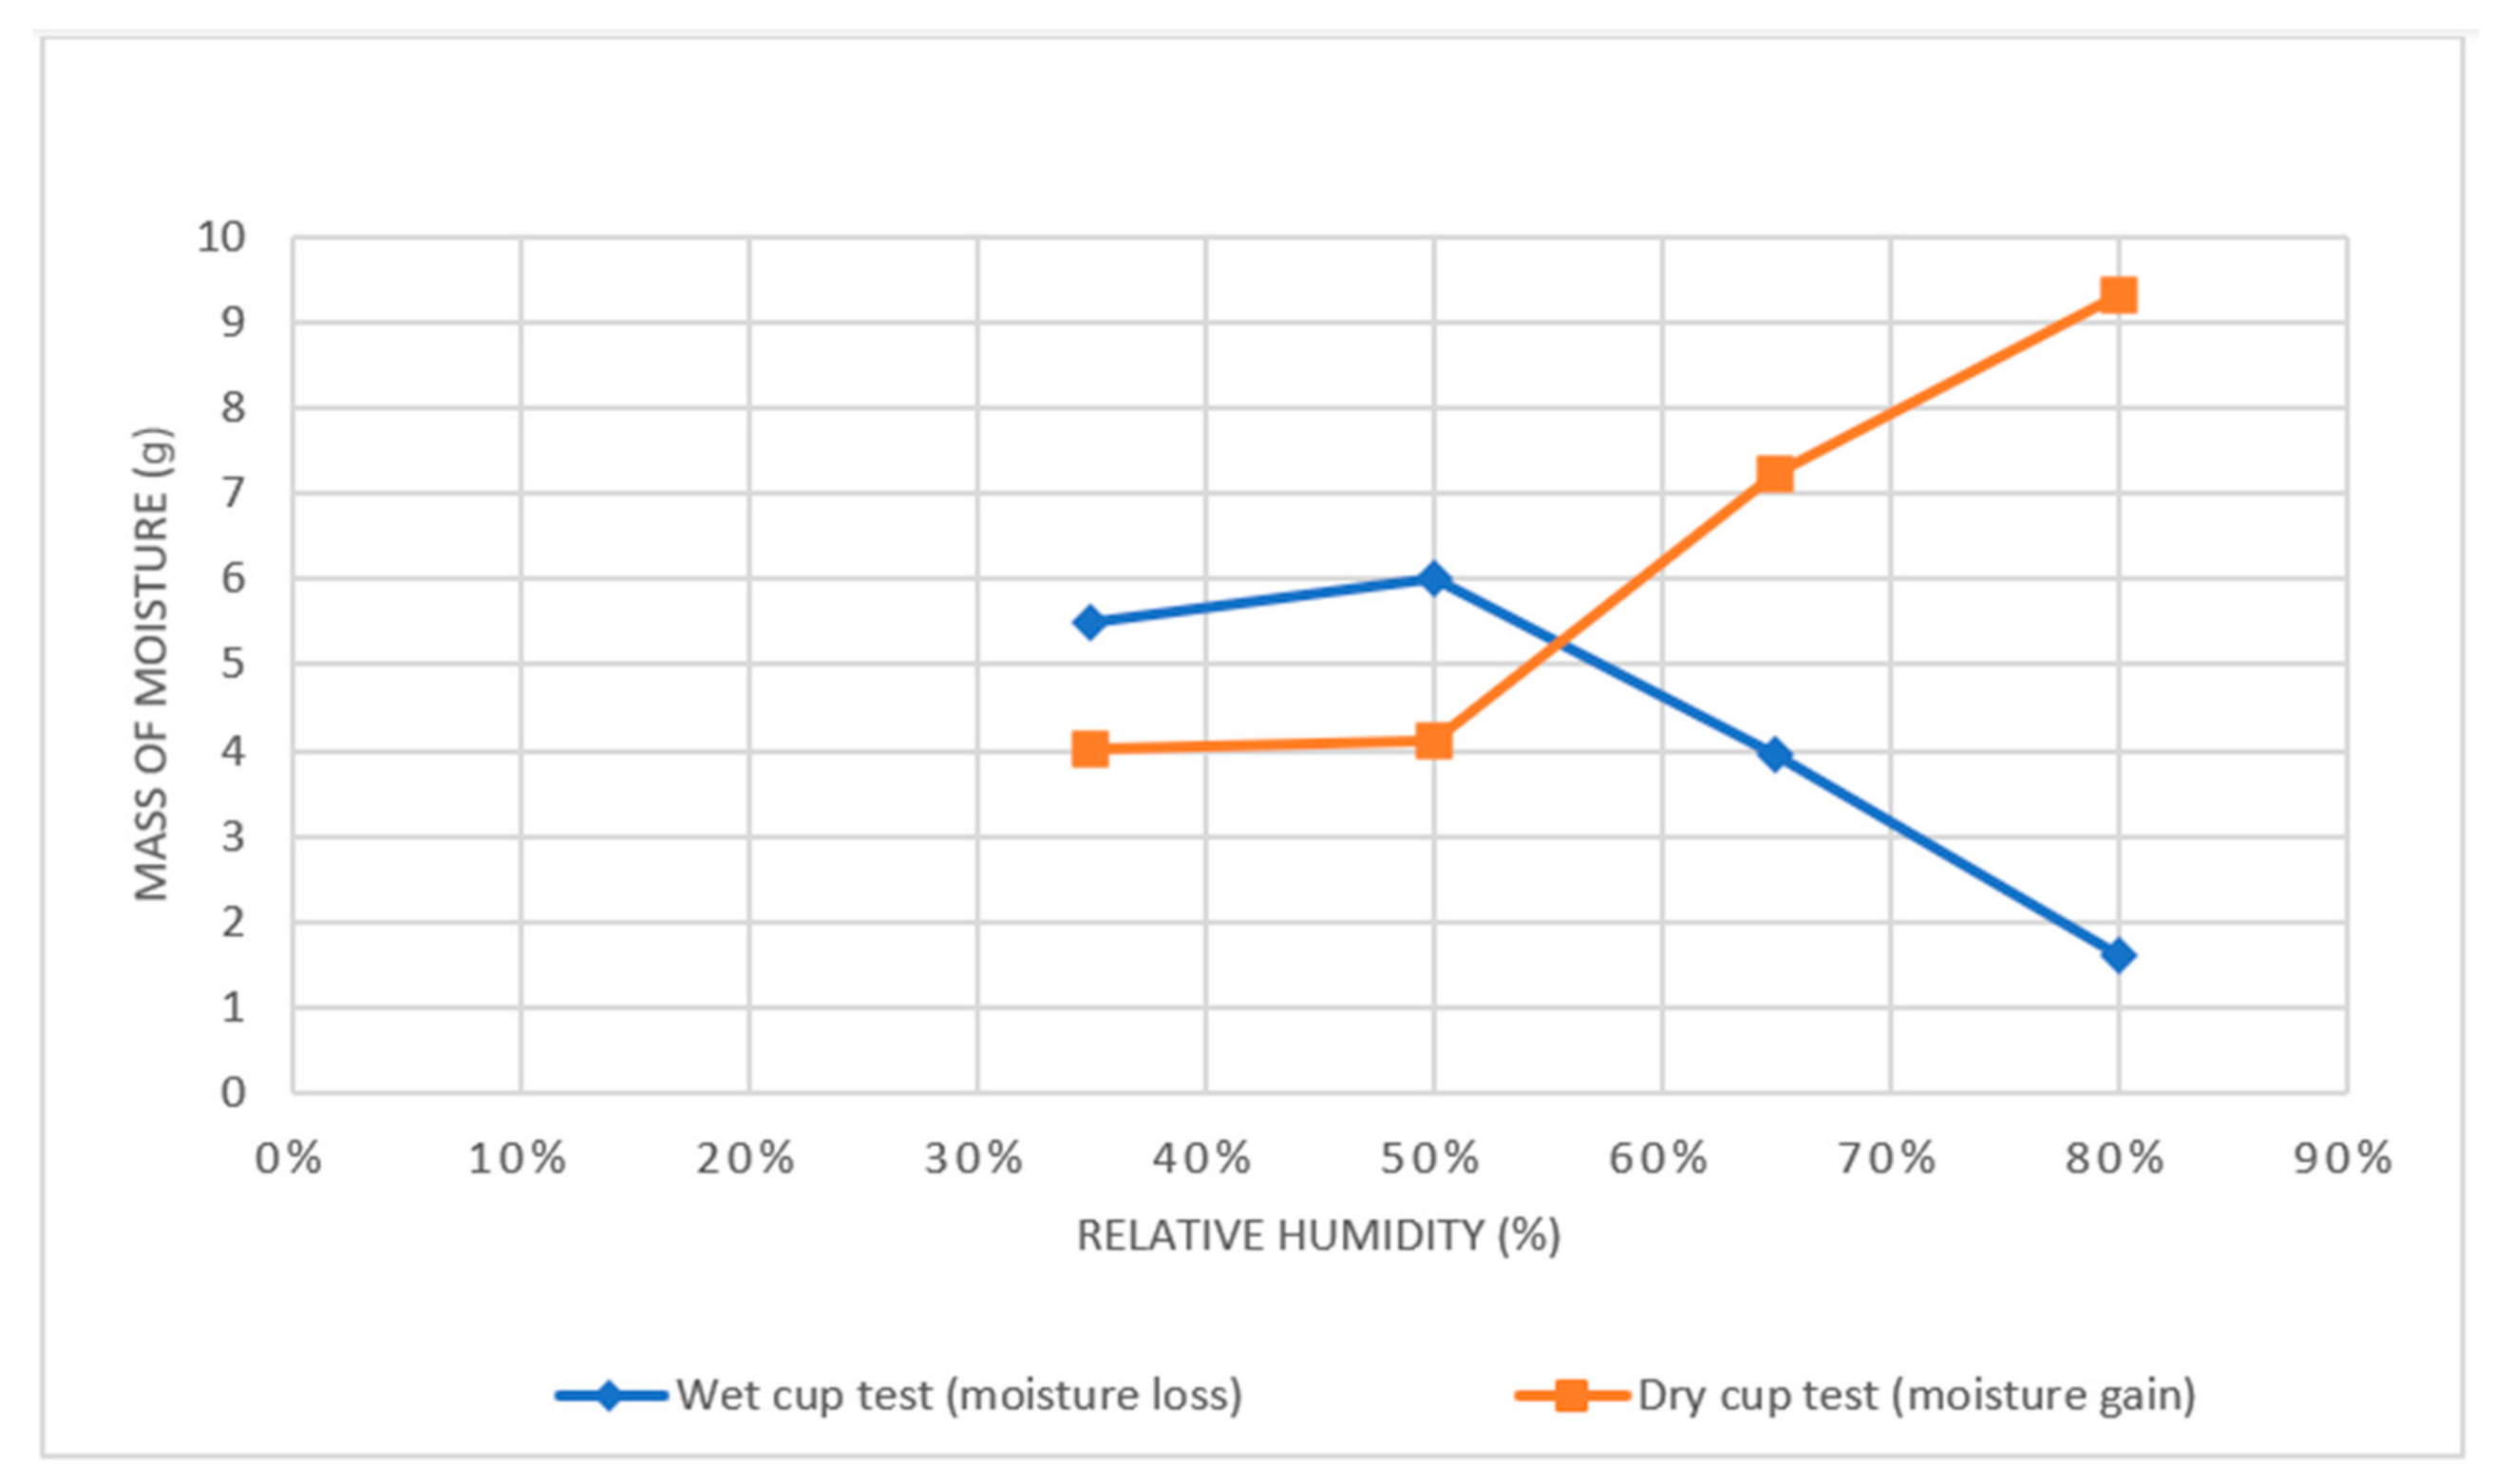
| Relative Humidity (%) | Moisture Loss (g) Wet Test | Moisture Gain (g) Dry Test |
|---|---|---|
| 35% | 5.5 | 4.01 |
| 50% | 6.0 | 4.1 |
| 65% | 3.95 | 7.22 |
| 80% | 1.61 | 9.33 |
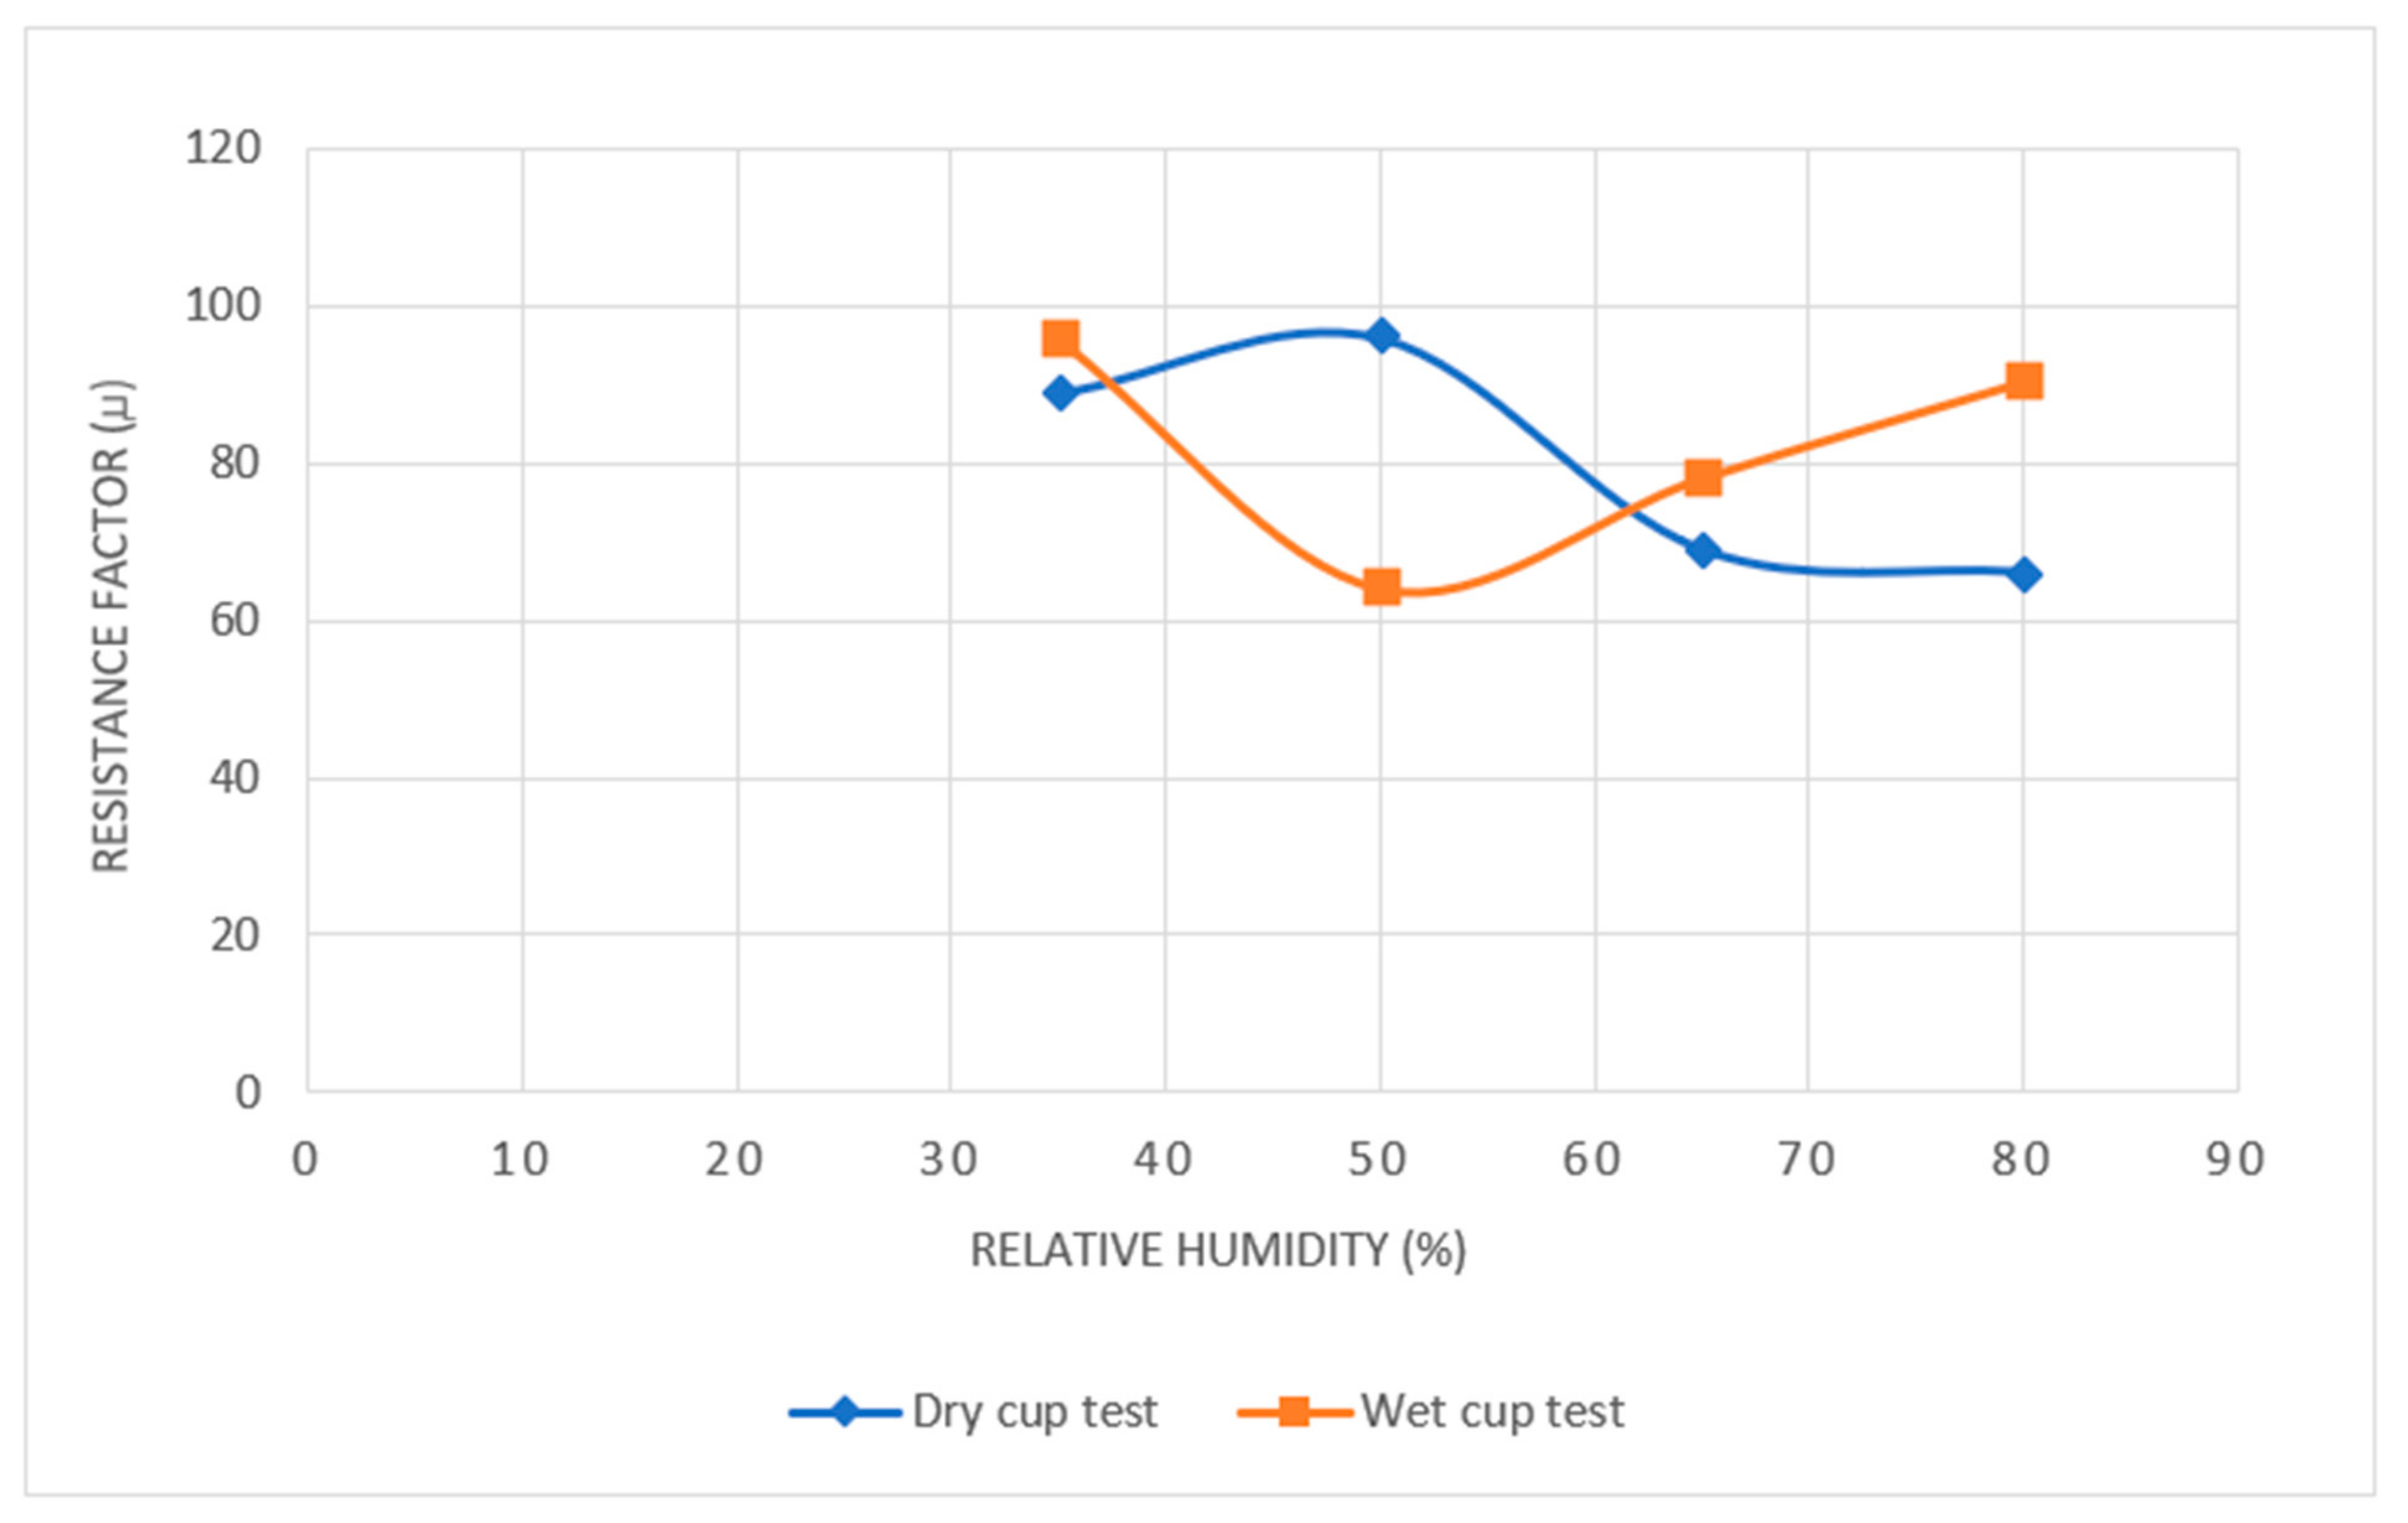
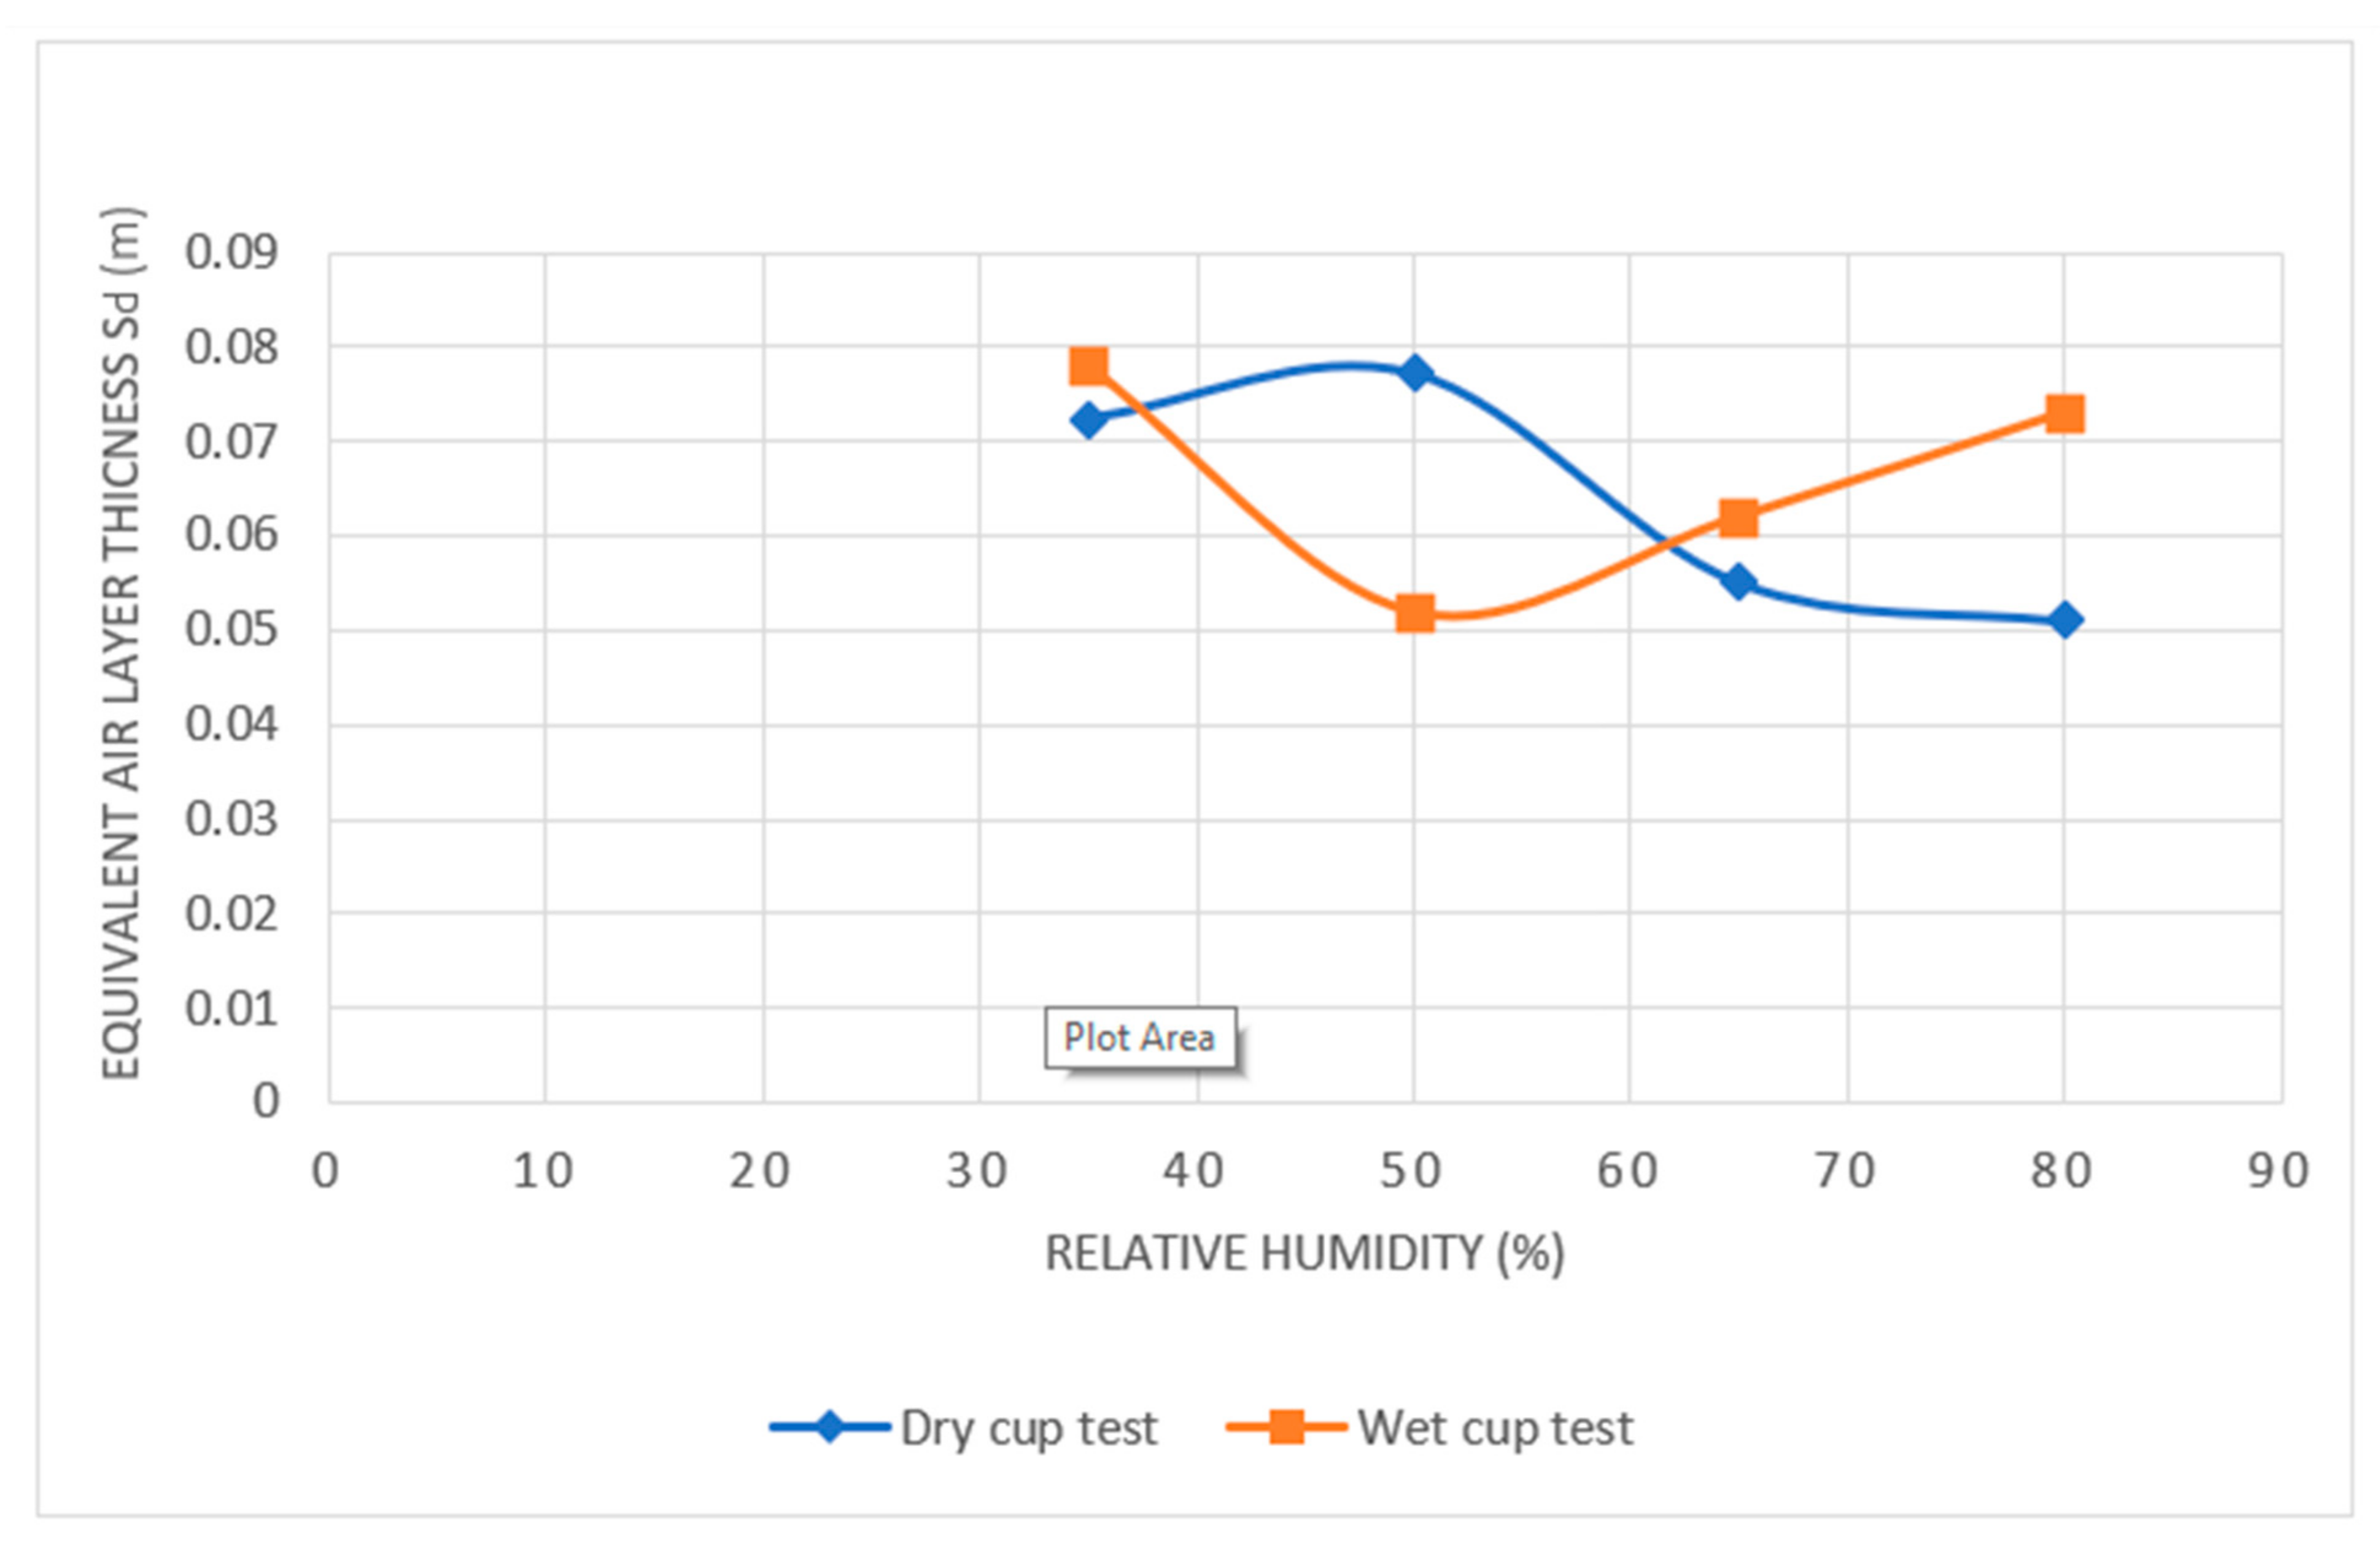
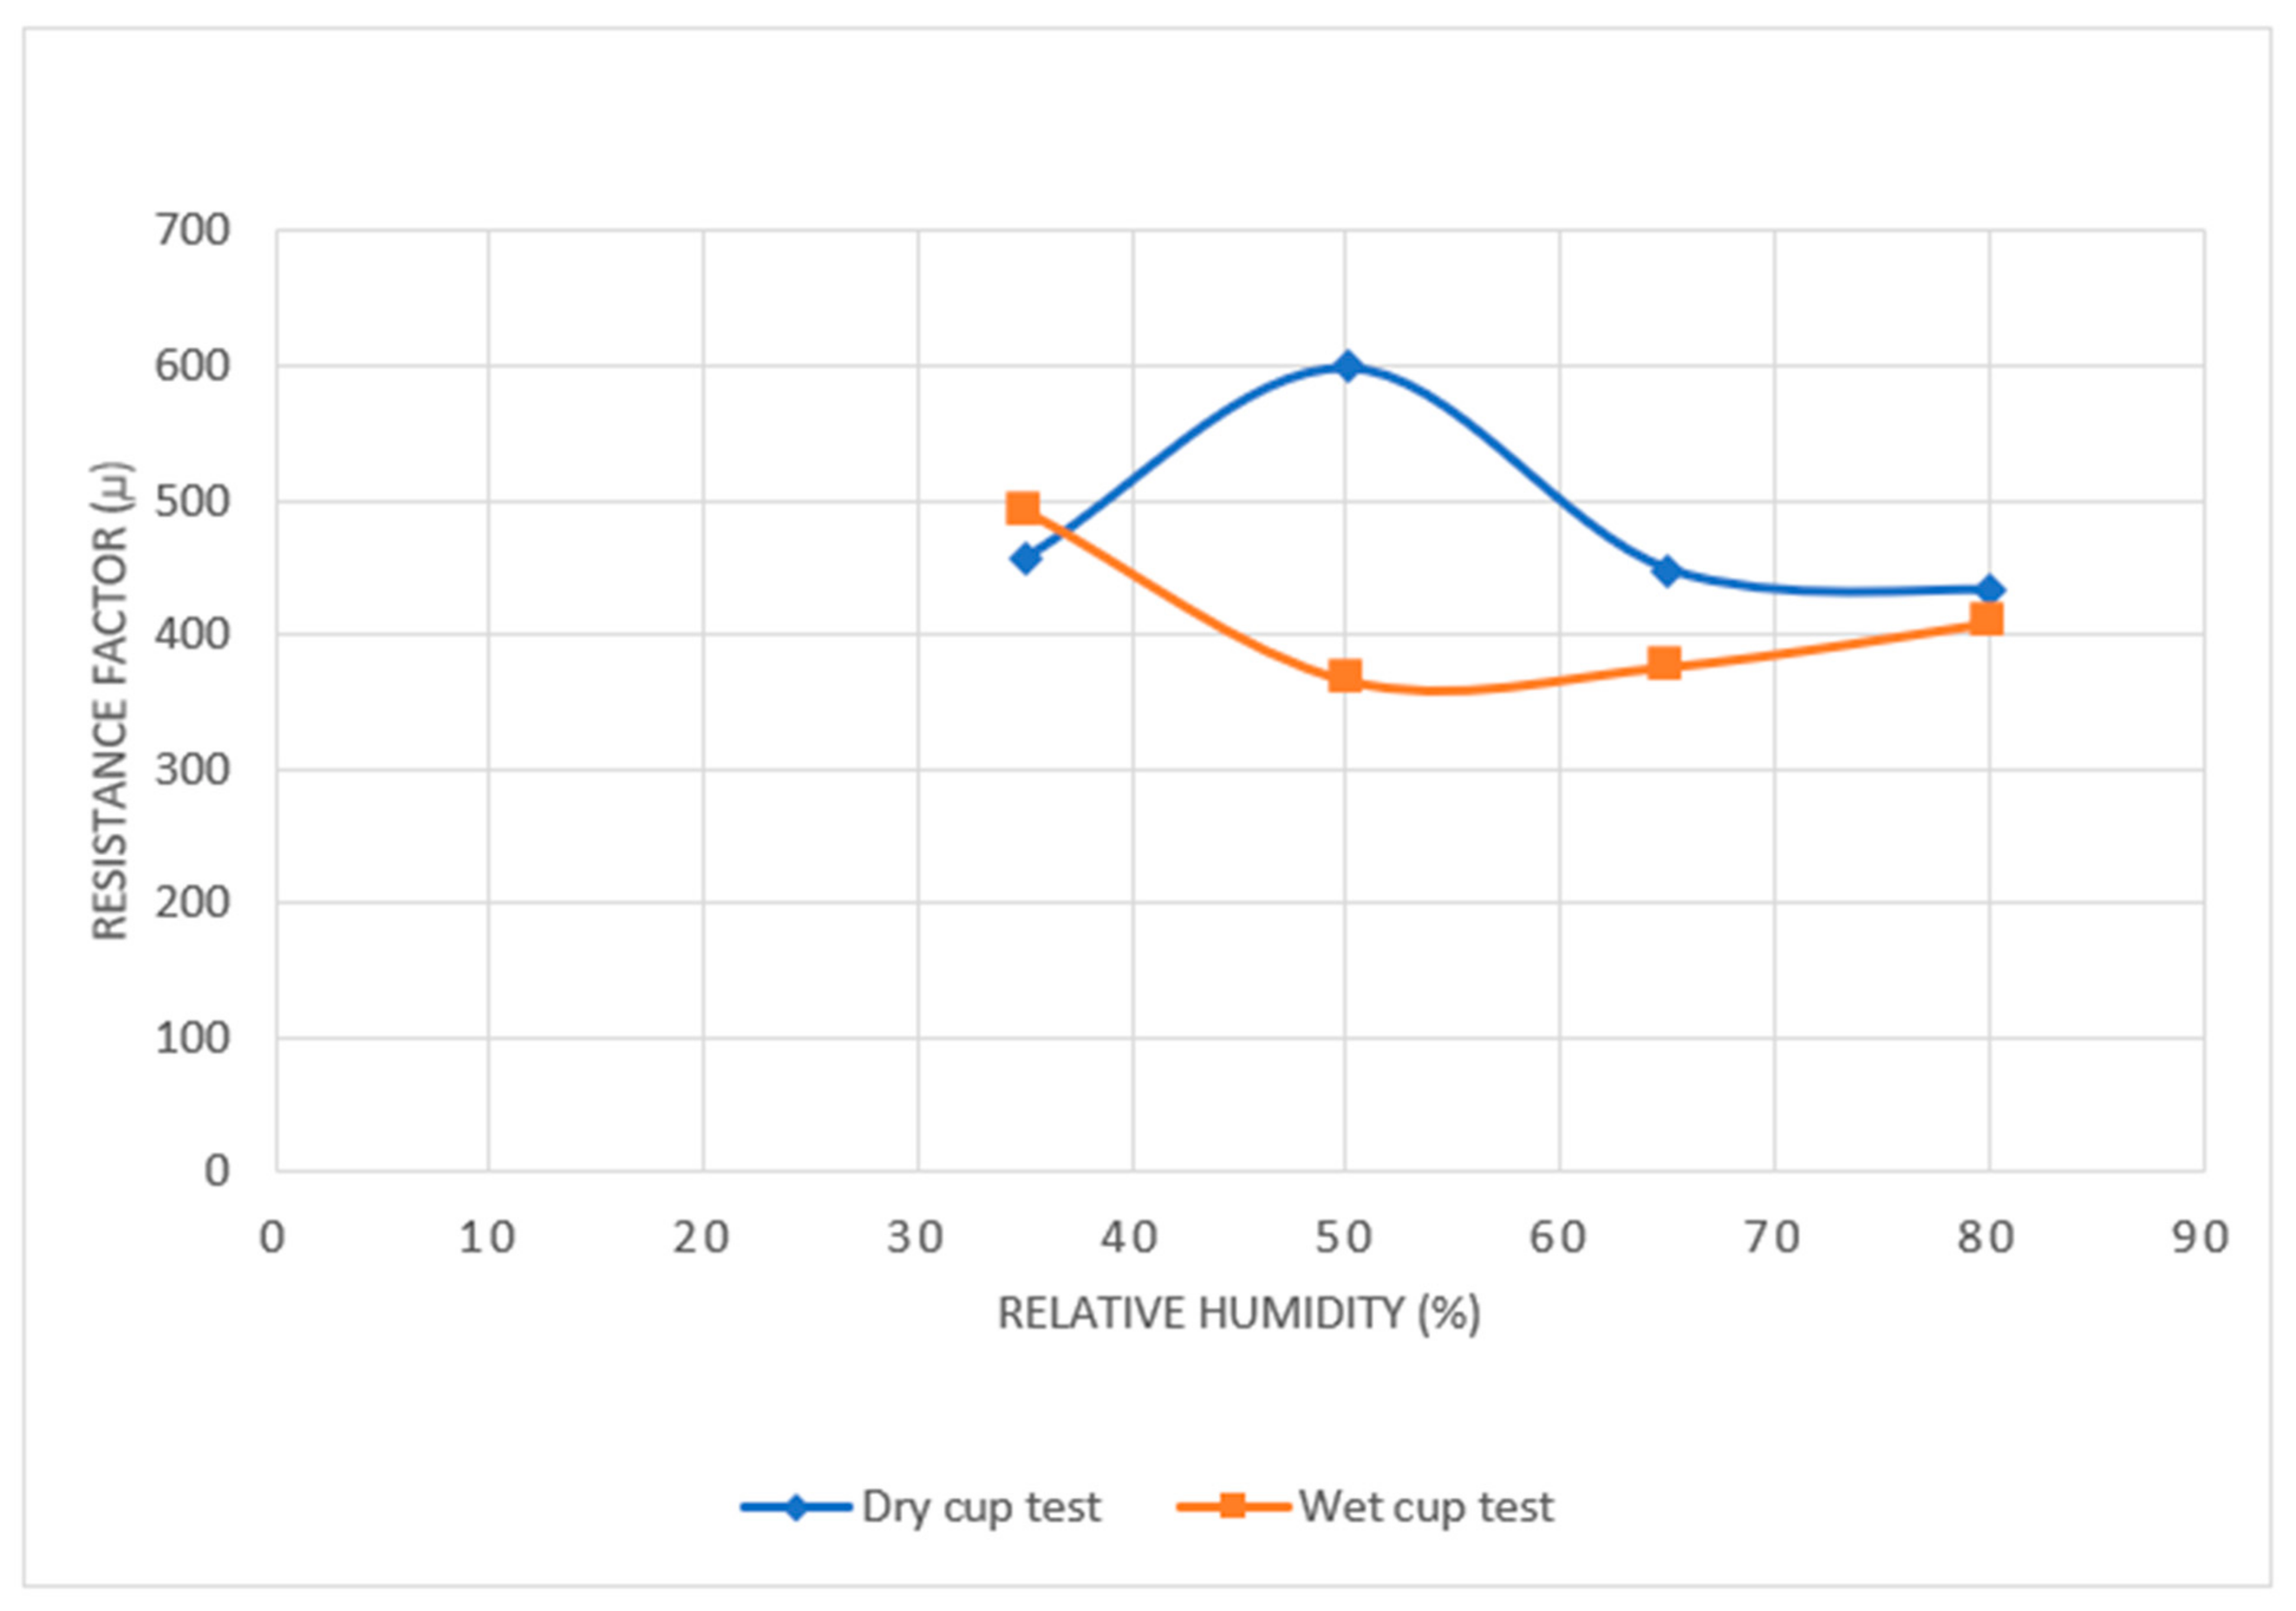
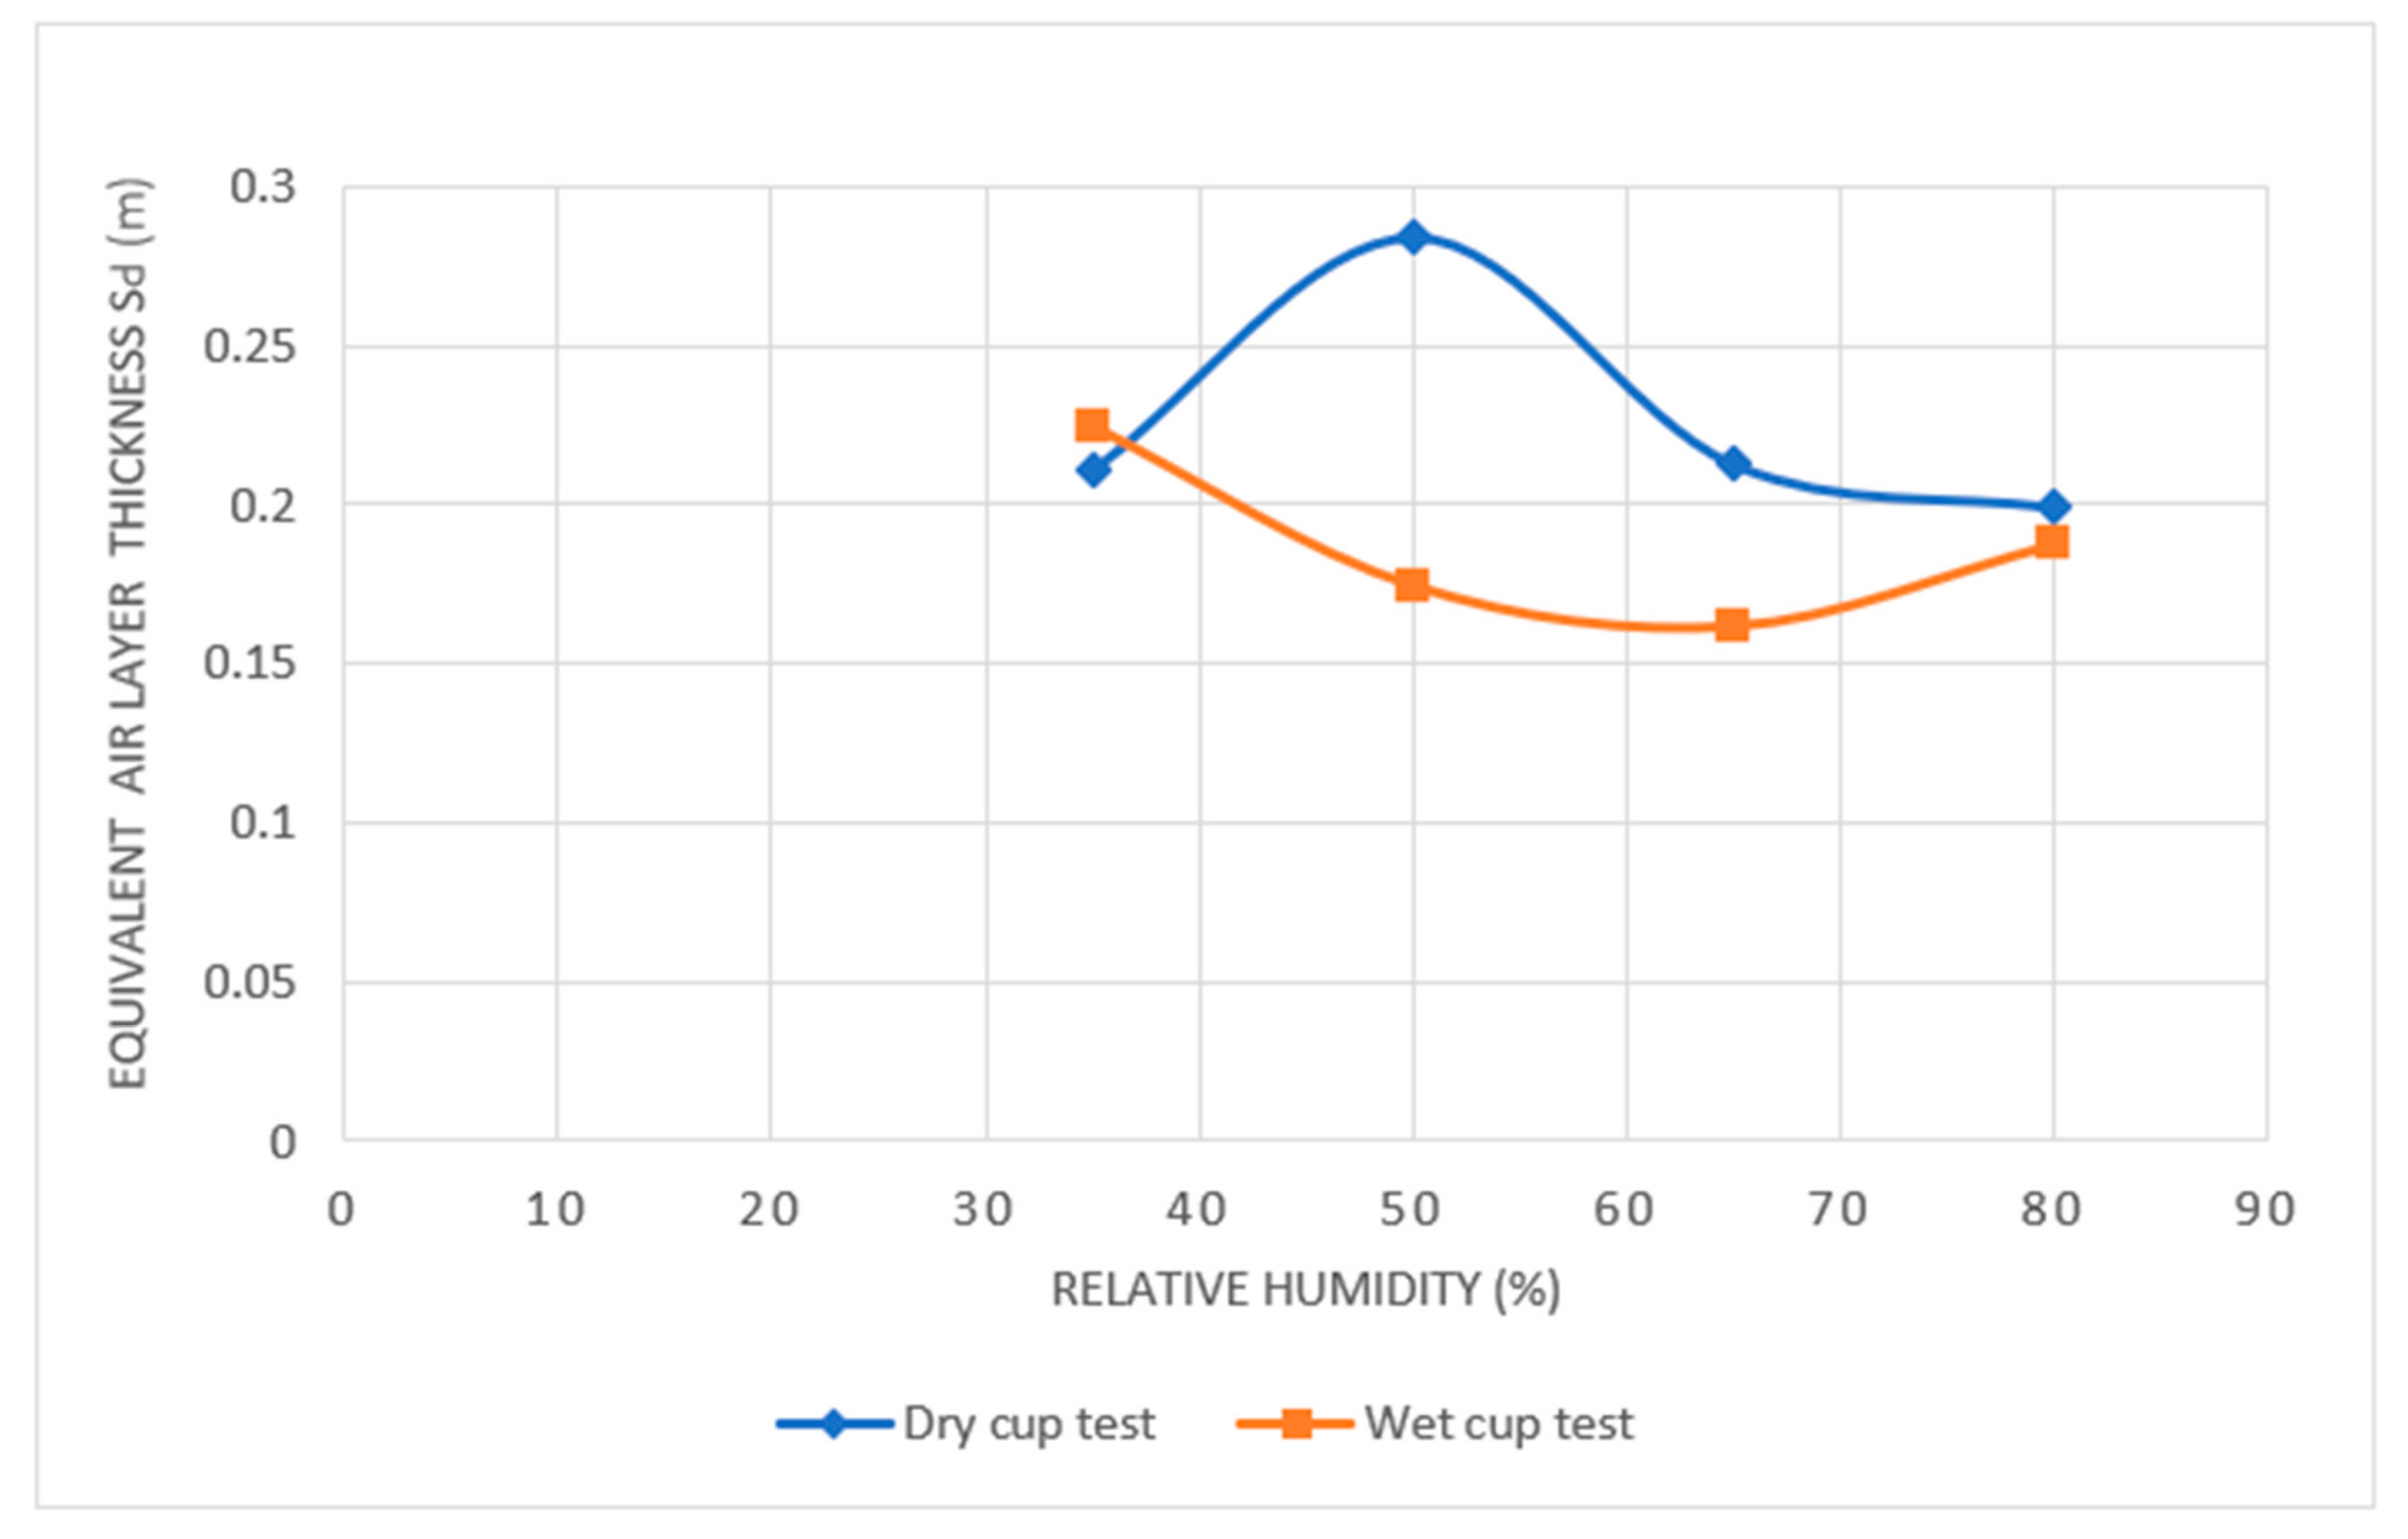
| RH% | Dry Test Resistance Factor µ | Wet Test Resistance Factor µ | Dry Test Sd (m) | Wet Test Sd (m) |
|---|---|---|---|---|
| Sample A | ||||
| 35 | 88.88 | 95.8 | 0.0724 | 0.078 |
| 50 | 96.01 | 64.04 | 0.0772 | 0.052 |
| 65 | 69.05 | 78.11 | 0.0551 | 0.062 |
| 80 | 66.17 | 90.37 | 0.051 | 0.073 |
| Sample B | ||||
| 35 | 457 | 490.83 | 0.2113 | 0.2248 |
| 50 | 599.6 | 365.9 | 0.2842 | 0.1744 |
| 65 | 448.2 | 375.9 | 0.2128 | 0.1616 |
| 80 | 432.5 | 408 | 0.1993 | 0.1874 |
Publisher’s Note: MDPI stays neutral with regard to jurisdictional claims in published maps and institutional affiliations. |
© 2021 by the authors. Licensee MDPI, Basel, Switzerland. This article is an open access article distributed under the terms and conditions of the Creative Commons Attribution (CC BY) license (https://creativecommons.org/licenses/by/4.0/).
Share and Cite
Olaoye, T.S.; Dewsbury, M.; Künzel, H. Empirical Investigation of the Hygrothermal Diffusion Properties of Permeable Building Membranes Subjected to Variable Relative Humidity Condition. Energies 2021, 14, 4053. https://doi.org/10.3390/en14134053
Olaoye TS, Dewsbury M, Künzel H. Empirical Investigation of the Hygrothermal Diffusion Properties of Permeable Building Membranes Subjected to Variable Relative Humidity Condition. Energies. 2021; 14(13):4053. https://doi.org/10.3390/en14134053
Chicago/Turabian StyleOlaoye, Toba Samuel, Mark Dewsbury, and Hartwig Künzel. 2021. "Empirical Investigation of the Hygrothermal Diffusion Properties of Permeable Building Membranes Subjected to Variable Relative Humidity Condition" Energies 14, no. 13: 4053. https://doi.org/10.3390/en14134053