
Turkmenistan’s Gas Sector Development Scenarios Based on Econometric and SWOT Analysis


1
Faculty of Management, AGH University of Science and Technology, Mickiewicza Av. 30, 30-059 Krakow, Poland
2
College of Social Sciences, Cracow University of Technology, Warszawska Str. 24, 31-155 Krakow, Poland
*
Author to whom correspondence should be addressed.
Energies 2021, 14(10), 2740; https://doi.org/10.3390/en14102740
Submission received: 23 February 2021
/
Revised: 6 May 2021
/
Accepted: 7 May 2021
/
Published: 11 May 2021
(This article belongs to the Special Issue Application of Management Tools in the Energy Sector)
Abstract
:Turkmenistan is currently one of the key suppliers in the global natural gas market, and it is important to examine its competitive position in the world. The aim of this article is to forecast the development strategy of its gas sector. To achieve this aim, the authors first examined: (1) Turkmenistan’s position in the global gas market and the structure of its oil and gas sector; (2) the share of gas in Turkmenistan’s exports. They then conducted an analysis of the causal relationship between FDI and GDP. The above research made it possible to conduct a comprehensive SWOT analysis. Based on the SWOT analysis, three sector development scenarios were developed: pessimistic, realistic, and optimistic. On their basis, the gas sector in Turkmenistan can build strategies for its development, considering the impact of market and non-market factors.
1. Introduction
The dynamic economic development observed since the early 1990s and the growth of the population on the planet, as well as the increase in their income and living comfort, has contributed to the rise in demand for energy by 70%. Demand for gas has increased even more (by as much as 83%), with the greatest growth dynamic after the last economic crisis (in 2008), when its consumption increased by more than 30% [1,2].
The 1990s are also notable for the political and economic changes that took place in the territory of the former Soviet Union. Its break-up began in 1991, and as a result several countries regained independence. In December of that year, some of these became part of a regional association called the Commonwealth of Independent States (CIS). Among them was Turkmenistan, a country with a relatively small population (3.772 million at the time) and a large territory (488 × 100 km2), which is rich in hydrocarbons [3]. They have a major export commodity (mainly gas), which is the primary source of foreign currency revenue for the state budget.
The natural gas market has long been the subject of scientific research. However, the study of the gas potential of the Central Asian countries that were previously part of the Soviet Union (Azerbaijan, Turkmenistan, Kazakhstan, Uzbekistan, Kyrgyzstan, and Tajikistan) came much later. As for Turkmenistan, its important role as a potential gas supplier to Europe and Asia has been recognized only since 2007.
In his new concept of the Caspian energy system and transit routes through Turkey, Bilgin [4] took into account, among other things, hydrocarbon supplies from Turkmenistan to Europe. In another article [5], the author discussed Europe’s energy security issues in relation to natural gas supplies caused by the gas conflicts between Russia and Ukraine in January 2006 and January 2009. He also discussed the opportunities and barriers for Europe’s further cooperation with Azerbaijan, Kazakhstan, Turkmenistan, Iran, Iraq, and Egypt. According to the author, the best strategy for the EU would be to secure gas supplies from Azerbaijan and Turkmenistan using the gas pipelines of Iran and Iraq. In turn, Cobaneli [6] analyzed various gas pipeline projects for the landlocked Central Asian states and showed that demand competition with China is not necessarily a disadvantage for the West, and that the Turkmenistan-China pipeline does not have the impact of the West-bound projects aimed between Europe and Turkey. For Turkmenistan, i.e., the main supplier in the region, a link via the Caspian Sea to Turkey is the most beneficial Westbound option.
Lee [7] showed that the competition for Turkmenistan’s gas pipeline system between Russia, China, the EU, and India has strengthened the country’s bargaining power on the world gas market. Heinrich and Pleines [8] gave a short overview of the pipeline options available for Azerbaijan, Kazakhstan, and Turkmenistan, and their public assessment by the ruling elites of these countries is given. In turn, Esen and Oral [9], based on changes in natural gas reserve/production ratios of the four countries having the highest natural gas reserves (Russia, Iran, Qatar, Turkmenistan), forecast higher importance of these countries on the global gas market with the development of technology and the increase in demand for clean energy.
To the best of our knowledge, none of the previous studies and scenarios have examined and predicted the complex socio-economic impacts of the changes that are taking place in the external environment of the gas sector in Turkmenistan, considering both domestic and international factors. These factors are measurable and non-measurable in nature. In the case of measurable factors, we decided to use econometric analysis. On the other hand, we use foresight methods to study the influence of non-measurable factors.
Turkmenistan is a developing country where economic growth is based on the exploitation of natural resources, in particular gas and oil exports. A serious limitation in the export of minerals is the lack of appropriate infrastructure [9]. In recent years, it has been developed based on the inflow of FDI, which largely comes from China [7].
In the literature on the subject, there is an extensive discussion on the relationship between FDI and economic growth measured by GDP. The results obtained by the authors do not clearly indicate the direction of the causal relationships, and in the case of Turkmenistan, the authors reached one study [10] which, using multiple regression, indicated that GDP influences the value of FDI in this country. Research shows that this approach is not sufficient due to the expected non-stationarity of the time series under consideration.
In this article, we propose to investigate the relationship between FDI and GDP using the Toda-Yamamoto [11] procedure for the VAR methodology. This study is based on annual data for 1995–2018 on FDI and GDP in Turkmenistan, obtained from the World Data Bank [12]. The advantage of this approach is drawing conclusions on the basis of more recent data, while taking into account the nature of the variables under consideration and the absence of assumptions about the direction of potential relationships.
The obtained results are the basis for further research based upon immeasurable factors. The novelty of this approach is the combination of econometric analysis with SWOT analysis. Such a study enables a comprehensive approach to the study of the impact of external factors on the gas sector in Turkmenistan, and also the formulation of scenarios for its future development.
The rest of this study is organized as follows. Section 2 describes the gas sector in Turkmenistan and its position in the global market. In Section 3 the authors explain the theoretical background and the methodology. Section 4 discusses the results (causal relationships between FDI and GDP, SWOT analysis and scenario analyses based on earlier results), and the last Section 5 gives the summary of the study.
2. Background
2.1. Turkmenistan on the Global Gas Market
Turkmenistan is one of the largest exporters of gas, known as “blue fuel”. This is due to its large geological reserves, estimated at approximately 20 trillion cubic meters [13]. In a country with a population currently estimated at 5.7 million people [3], these reserves exceed internal demand for this resource many times. Therefore, natural gas export is the main pillar of the state’s economic policy, which is the majority shareholder in companies involved in gas extraction—Turkmengaz and Turkmengeology.
Although Turkmenistan ranked seventeenth in blue fuel production in 2018 and 2019, it ranked third among the countries with the largest exported surplus compared to domestic demand (Table 1).
To increase gas exports, Turkmenistan has invested in constructing a new gas pipeline (Turkmenistan–Afghanistan–Pakistan–India, TAPI), which will soon become operational. Other export projects are currently being discussed, including the construction of the Trans-Caspian gas pipeline—this will allow Turkmen gas to reach Europe through the Russian joint-stock company Southern Gas Company, and the fourth section of the Central Asia–China gas pipeline. Moreover, in July 2019, Turkmenistan signed a five year agreement with Gazprom to supply 5.5 bcm of gas [14]. To fill all pipelines with gas, Turkmenistan will have to significantly increase production, provided that gas demand remains at its current level.
The national program for the development of the oil and gas industry aims to increase the annual production of natural gas to 250 bcm, of which more than 70% will be for export. In doing so, great emphasis has been placed on foreign investment and the participation of international oil companies, especially in the exploration of the offshore fields in the Turkmen sector of the Caspian Sea. In 2017, the share of foreign companies in oil production was about 56%, while in gas production there was only half as much (28%) [13]. Because Turkmenistan is not a rich country, its development depends on external financing, including Foreign Direct Investment (FDI). However, access to the domestic economy for foreign investors is not easy. Since all land in Turkmenistan belongs to the state, it is the government that decides who can invest in the economy, limiting foreign investment to a few select partners. Currently, the main investors are China, Russia, Kazakhstan, and Uzbekistan.
2.2. Turkmenistan Oil and Gas Complex
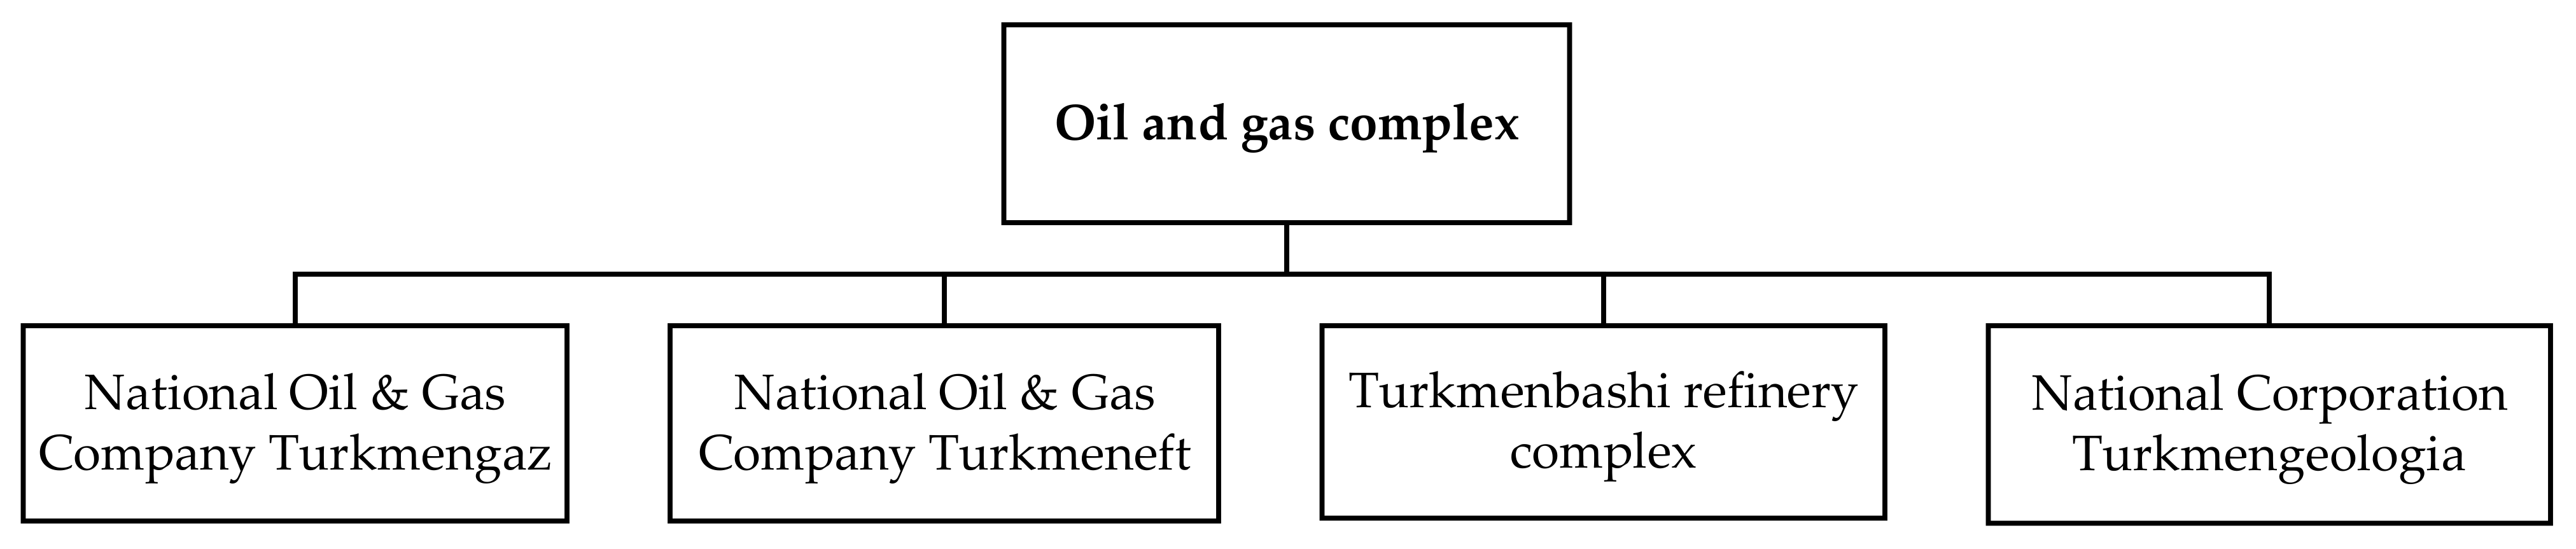
Until 15 July 2016, Turkmenistan’s governing body, which provided a unified policy on exploration, development, production of gas, oil, and other mineral resources, was the Ministry of Oil and Gas of Turkmenistan. It also dealt with the issues of their processing, transportation, and rational use. Currently, the abolished Ministry’s main functions have been transferred to the Department of the Cabinet of Ministers of Turkmenistan, which falls under the Deputy Prime Minister, who is responsible for the oil and gas complex. Some organizations and enterprises reporting to this Ministry have been transferred under the jurisdiction of the National Oil & Gas Company Turkmengaz and the National Oil & Gas Company Turkmenneft [16]. The history of changes in this sector (after the country’s independence) is presented in Table 2, while the current composition of Turkmenistan’s oil and gas complex is shown in Figure 1.
Since the raw natural gas produced from Turkmenistan’s main gas fields (Galkynysh, Dovletabat, and others) is one of the gases with a high sulfide content, the government places great emphasis on its purification, to enable the production of high-quality fuel for export. At the same time, the government plans to develop technologies focused on processing the gas and then pumping it back to the underground rock formations, and disinfecting the sour gases separated from the raw gas. Another task of the government is to create and develop large-scale gas-chemical complexes with enhanced gas processing to establish the production of liquefied gas, motor fuel, polymer materials, synthetic fibers, high-capacity organic products, synthetic detergents, surfactants, and other products.
Due to the limitations associated with gas transportation through pipelines, Turkmenistan is actively seeking alternative methods of selling this resource. One of these is converting natural gas into liquid hydrocarbons and the production of liquefied natural gas (LNG). Some steps have already been taken. In 2014, construction of a large-scale gas-chemical complex to produce synthetic gasoline from natural gas began in the Achal region. The complex can produce up to 600,000 Mg of high-quality gasoline per year by processing 1.7 bcm of natural gas in an innovative (thermocatalytic) way. The uniqueness of the method is the production of gasoline from natural gas and not from crude oil [18].
2.3. Share of Hydrocarbons in Turkmenistan’s Exports
In terms of Turkmenistan’s export potential, the leading export is natural gas, exported mainly to China. The gas is transported through the Central Asia–China pipeline, which passes through Uzbekistan and Kazakhstan. The three completed sections of the pipeline have a capacity of 55 bcm per year. The opening of the fourth section should increase this to 85 bcm per year—Turkmenistan authorities, together with representatives of the Chinese corporation China National Petroleum Corporation (CNPC), started work on this part of the project in July 2019. Two other sections of this pipeline (with a total capacity of 20 bcm per year) are linked to industrial centers and other locations in Iran [19].
Turkmenistan’s export potential is also rapidly gaining momentum thanks to the construction of the TAPI gas pipeline with a length of about 1800 km and a capacity of about 33 bcm of per year. The completion of its construction (which began on 13 December 2015) was scheduled for the end of 2020, while the construction of the Afghan section of the pipeline was to start at the beginning of 2021. The implementation of this project (worth a total of US $10 billion) will bring long-term benefits not only to the exporter but also to the countries along the pipeline route. Turkmenistan will cover 85% of the pipeline’s construction costs, with the remaining 15% shared between Afghanistan, Pakistan, and India. Loans, in the amount of US $1 billion from the Asian Development Bank and US $500 million from the Islamic Development Bank [20], also play an important role in financing the project.
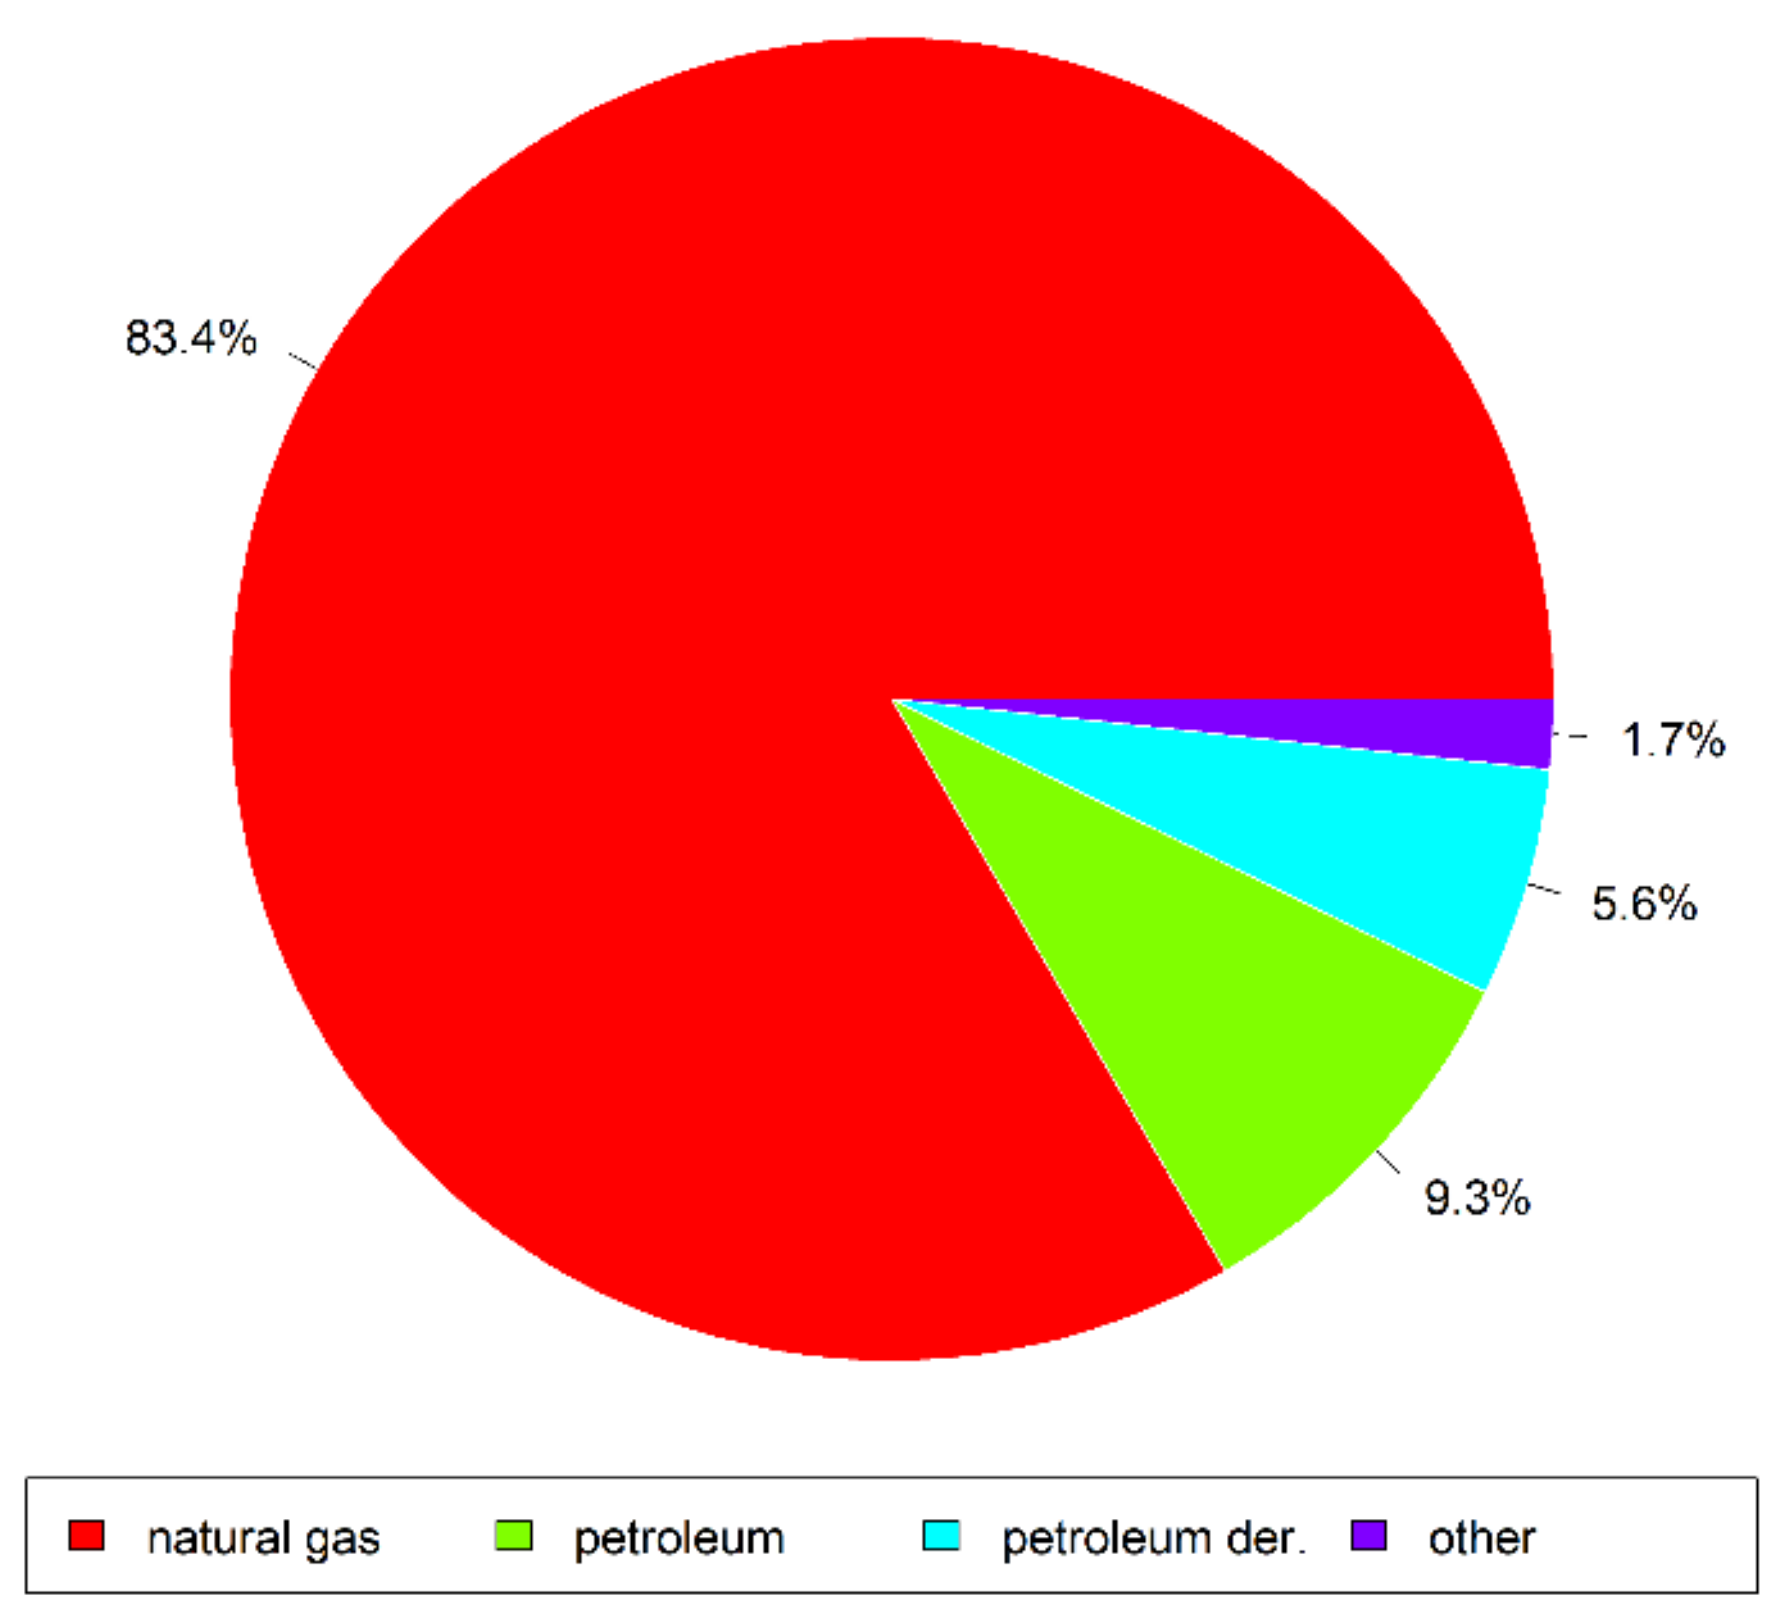
Although Turkmenistan’s main export commodity is natural gas, one should not overlook oil and petroleum products, ranked second among the country’s exports. For example, 18 million Mg of oil and 16 million Mg of petroleum products were exported between 2012 and 2014. However, in recent years, oil production and sales of petroleum products in Turkmenistan began to decline [13]. The export structure of the country in 2018 is presented in Figure 2.
The Organization for Economic Co-Operation and Development (OECD) reports that 90% of Turkmenistan’s export revenue comes from the sale of gas, oil, and petroleum products. However, oil production has started to decline in recent years. According to unofficial data, the decline exceeded 5% in 2019. Over the past decade, oil production had declined from 6.7 million Mg in 2008 to 4 million Mg in 2018. Nearly half of the oil produced by Ashkhabad are sold mainly to China. However, most of the revenue from exports goes to repay the loans taken out in China by the National Oil & Gas Company Turkmengaz, and to recover the cost of investments (tied to the extraction and processing of Turkmen methane) by the Chinese oil corporation (CNPC) [21].
Until recently, the issue of the status of the Caspian Sea was a major obstacle to the export of Turkmen gas, since according to the projects, the pipeline was to be laid along the seabed to Azerbaijan and Turkey and then, through Turkish infrastructure, to the EU via the so-called Southern Corridor. However, these projects did not materialize due to international law nuances and due to the opposition of several Caspian countries, primarily Russia. However, there is currently another problem: Turkmenistan has fallen into deep dependence on Chinese creditors. To get out of this stalemate, the government needs to find new markets for hydrocarbons, which is quite a challenge in the face of the worldwide economic slowdown caused by the coronavirus pandemic.
In addition to exporting energy resources, Turkmenistan is also focused on selling electricity and heat derived from natural gas to foreign customers (mainly neighboring countries). For this, over the past decade, the country has doubled its electricity production to 23 billion kWh. This was the first step in implementing a comprehensive plan to modernize the country’s electricity capacity with a total investment of $5 billion. Moreover, 14 combined cycle gas turbine power plants are scheduled to be put into operation by the end of 2020, which will increase electricity production to 27.4 billion kWh per year and its export to 6 billion kWh. It is assumed that the volume of electricity generated will increase to 35.5 billion kWh by 2030. Currently, the export destination countries are Iran and Afghanistan, but there is also a possibility of supplying Pakistan, Turkey, and Armenia [13].
Evidently, the sale of hydrocarbons has a strategic importance for the economy of Turkmenistan. However, their prices are constantly fluctuating, influenced by many market and non-market factors. Therefore, when building a strategy for the development of the oil and gas sector, it is necessary to consider the risk of price changes [22,23] in the commodity markets.
3. Theoretical Concept and Methods
3.1. Relationship between FDI and GDP
Economic growth is among the main determinants of a country’s economic development, and its changes can be measured in GDP. Of great interest among researchers is the analysis of the relationship between GDP and various macroeconomic variables.
The search for the relationship between FDI and GDP originates in both neoclassical and endogenous growth models. Neoclassical models assume that FDI is a key factor influencing investment volume and efficiency, which in turn promotes economic growth. Endogenous models, on the other hand, recognize that long-term economic growth is the result of technological progress. This implies that FDI influences the economic growth of the host country [24].
Economic theory does not rule out the reciprocal relationship, and causation can work in both directions. The causality from economic growth to FDI can be explained on the basis of “cumulative causality”. The long-term process of economic growth based on the development of production capacities may create new directions of economic activity, open new markets, and translate into higher consumer demand; as a result, by making the host party more attractive, this will affect the inflow of FDI [25].
The relationship between GDP and FDI is studied using different models. Studying the impact of GDP and other macroeconomic factors on FDI, based on annual data from 1991–2009 using log-log models, Azam [10] shows a positive impact of GDP on FDI in Armenia, Kyrgyzstan, and Turkmenistan. Based on annual data from 1990–2012, using multiple regression, Azam et al. [26] examine the impact of various factors on both GDP and FDI. The results for the selected seven Asian countries show a statistically significant positive relationship between these variables.
Another approach is represented by papers that focus on identifying causal relationships between FDI and GDP using the VAR model with Toda–Yamamoto correction and the VECM model for time series or panel data.
To detect the causal relationship between FDI and economic growth in Chile, Malaysia and Thailand, the authors of [27] apply the Toda–Yamamoto correction for the VAR model. The results they obtain are not conclusive. While for Malaysia and Thailand a strong bi-directional relationship can be seen, for Chile GDP affects FDI, but the inverse relationship does not exist. A similar methodology was used in other studies, which showed no causal relationship between GDP and FDI in India [28] or Ghana [29].
Using data from 1992–2012, applying the VECM model, Kosztowniak [30] shows a statistically significant bi-directional relationship between FDI and GDP for Poland, and in [31] the use of an analogous methodology for data from 1980–2013 led to the indication of the existence of a one-directional relationship of GDP to FDI for Oman.
In [32], the causal relationships between GDP, FDI and exports for eight Southeast Asian countries were examined using a panel vector autoregression model. The results prove the existence of a unidirectional effect of FDI on GDP directly and indirectly through exports, as well as the existence of a bidirectional causal relationship between exports and GDP for the whole group of considered countries. A similar method for Central and Eastern European countries was also used in the work [33] where a unidirectional dependence from FDI to GDP was shown.
A brief analysis of the results obtained leads to the conclusion that the cause-and-effect relationship between FDI inflows and economic growth is an individual matter for a given economy, and largely depends on the specific factors of a given host economy (as well as the period of analysis).
To the best of the authors’ knowledge, the hypothesis regarding the causality between FDI and size of the market for Turkmenistan has been verified based only on OLS regression in terms of the impact of GDP on FDI [10]. Therefore, it is reasonable to ask about the causal relationships according to Granger, which will be obtained using models adapted to the non-stationary nature of both time series (i.e., Toda–Yamamoto procedure for VAR model). It is expected that there will be a statistically significant positive relationship between GDP and the inflow of FDI.
3.2. Granger Causality and VAR Methodology
The starting point for the analysis of the causality relationship is the verification of the assumption about the stationarity of the time series. In this study, the degree of integration was examined by means of two tests of different designs: the ADF test and the KPSS test. The first one examines the null hypothesis of the considered time series at non-stationarity, while the KPSS test assumes the stationarity of data.
In the case of stationary data, the VAR methodology [34] proposed in 1980 by Sims can be directly applied. If non-stationarity is detected, the VAR methodology can still be used thanks to a procedure developed by Toda–Yamamoto [11]. It uses a modified Wald test to test restriction on the parameters of the VAR model.
Estimation is realized in two steps. The first step includes determination of the lag length (k) and the maximum order of integration (d) of the variables in the system. Next, the VAR model can be estimated with a total of (p = k + d) lags. The second step is to apply standard Wald tests to the first k VAR coefficient matrix to conduct inference on Granger causality.
3.3. SWOT and Scenario Analysis
SWOT analysis is often used in scientific research relating to the energy sector. For example, the problems of management in the energy sector have been the subject of research, among others in publications [35,36,37,38,39]. In turn, the publications [40,41,42,43,44,45,46] examined the problems related to renewable energy.
The formulated scenarios can be used by managers in the gas sector in Turkmenistan, as well as by example in other countries. Scenario analysis is often used by scientists and international organizations to forecast the future development of various sectors of the economy and to solve problems of its sustainable development. For example, it has been used in publications concerning: the natural gas market [47,48,49,50], the reduction of greenhouse gas emissions [51,52,53,54,55], waste management [56,57,58], electricity [59], renewable energy [60,61,62], transport [63,64,65] and others [66,67,68].
Since there are few publications on a given topic, most of the information and empirical data was obtained from the websites of Turkmenistan and international organizations.
4. Results and Discussion
4.1. Causality Relationship between Foreign Direct Investment and GDP in Turkmenistan
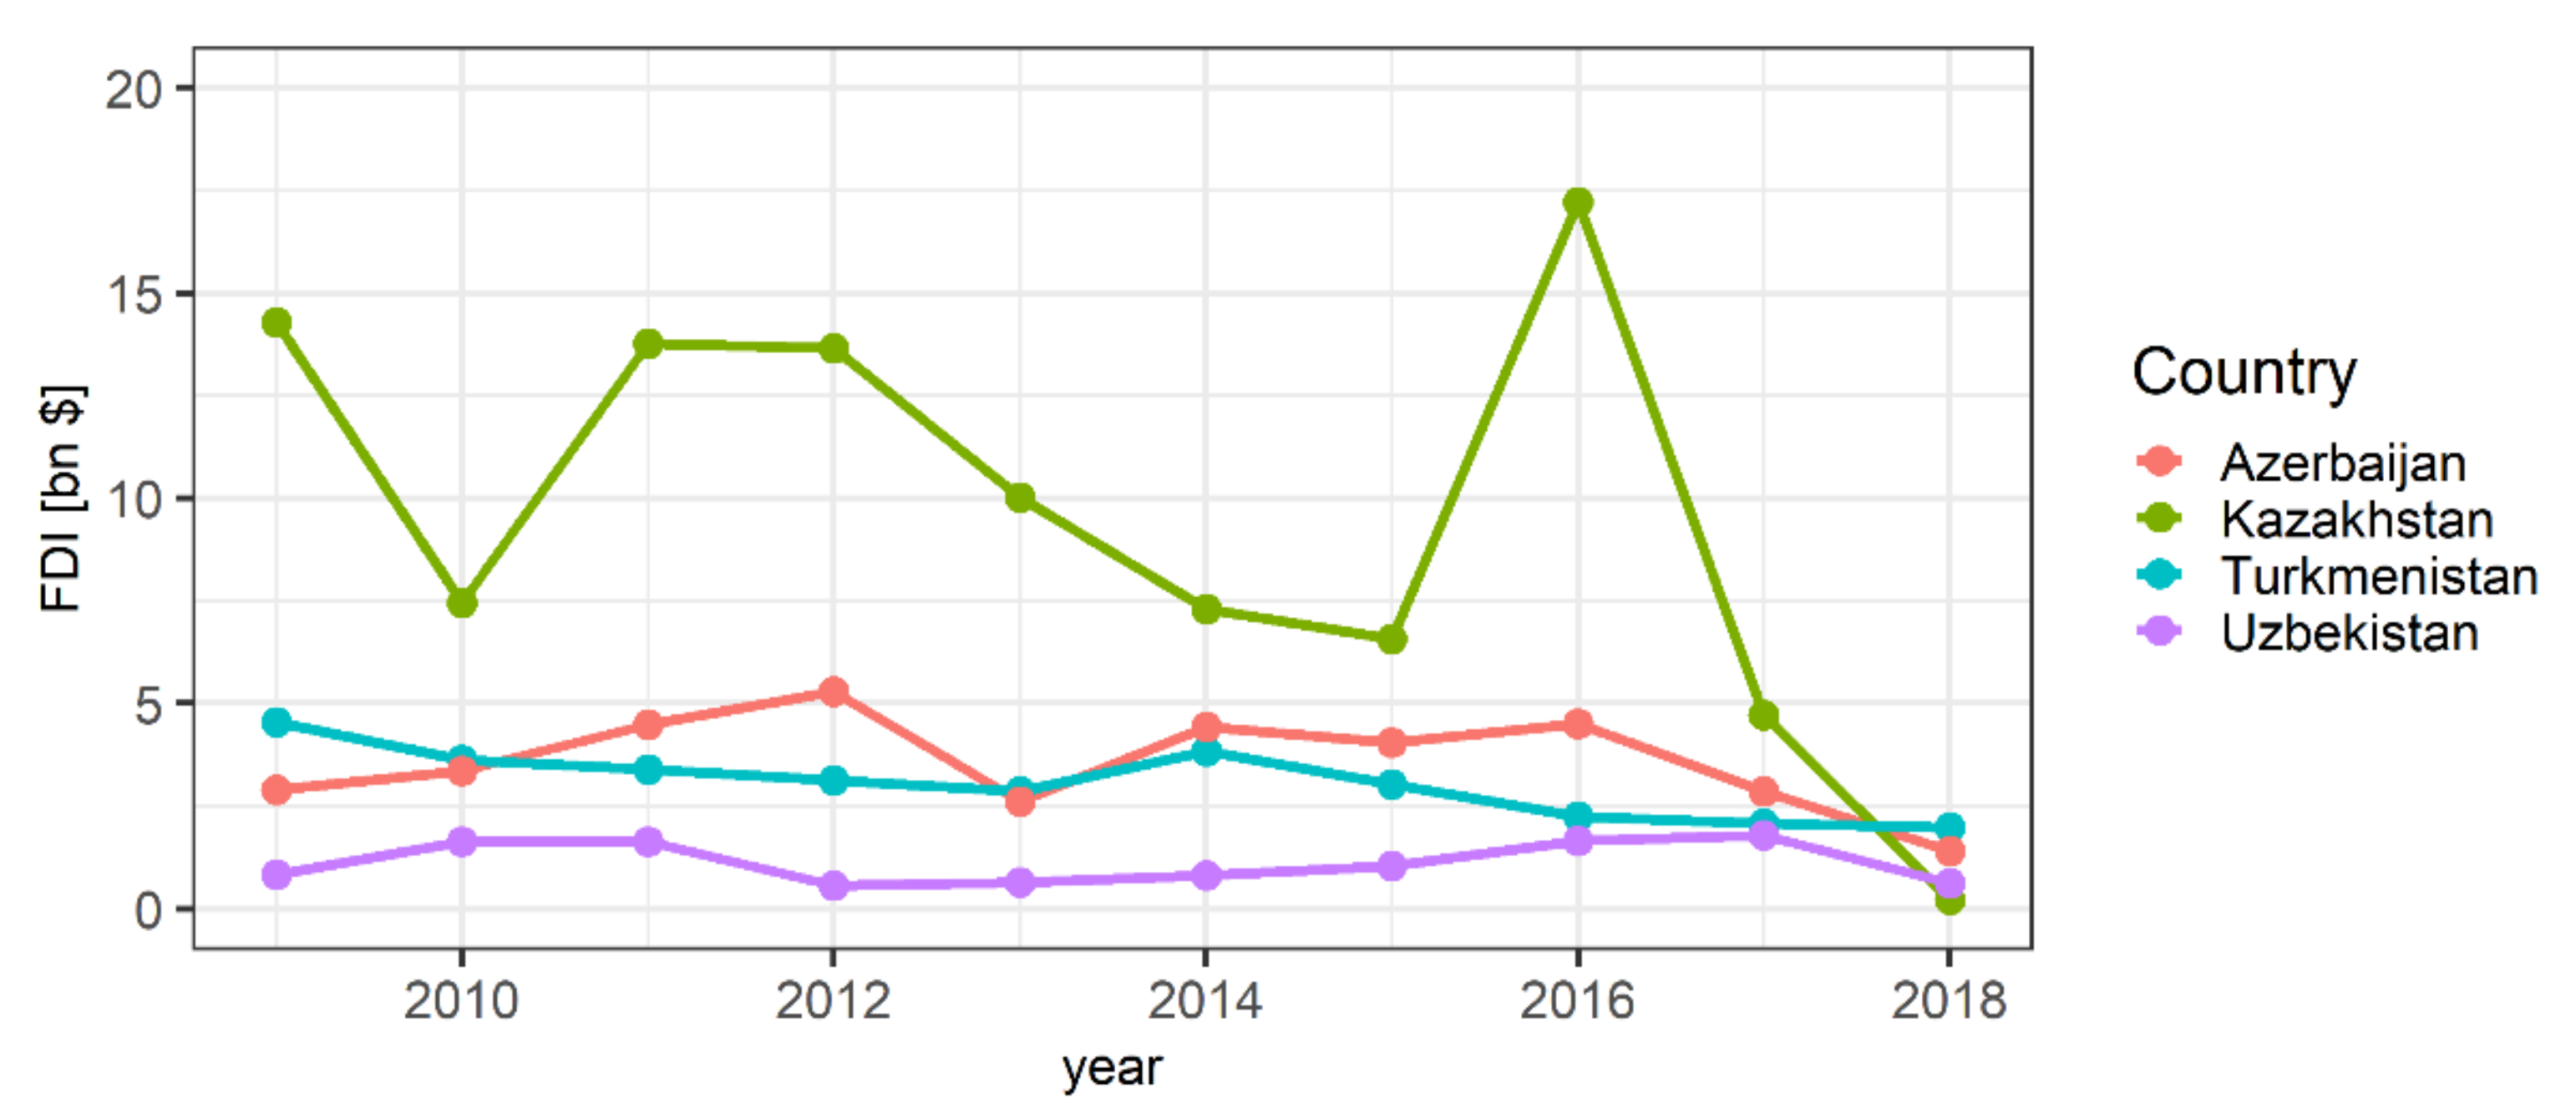
Analysis of the size of foreign direct investment (FDI) to date (after the 2008 crisis) showed that Turkmenistan occupied the 4th–5th place among post-Soviet countries (excluding Lithuania, Latvia, and Estonia—members of the EU). The lead in this area in 2019 belonged to Russia with the amount of 31 735 million USD, while Turkmenistan took fifth place with the figure of 2166 million USD. The largest inflow of investments to this country took place in 2009 (4553 million USD), after which they began to decline, reaching the lowest level in 2018 (1985 million USD) (Figure 3) [69,70].
Due to the very important role of the gas sector in Turkmenistan and significant foreign investments related to its development, the question of the causal relations between FDI and GDP is interesting.
The empirical results on the existence of causal relationships between GDP and FDI will be presented in three steps. First, using ADF and KPSS tests, we will determine the order of integration for both variables under consideration. Then, using the Akaike information criteria (AIC), we will determine the optimal lag structure of the model. Finally, we will perform the Toda–Yamamoto test and evaluate the statistical significance of the results obtained.
This study uses data from 1995 to 2018 on GDP and FDI, which are defined as the logarithm of gross domestic product and the logarithm of foreign direct investment, respectively. Descriptive statistics of both time series are presented in Table 3.
To assess the stationarity of the time series under consideration, the ADF unit root test will be used. It’s results for the levels of variables do not give an argument to reject the null hypothesis of non-stationarity. Another ADF test was conducted on the first differences of GDP and FDI, and suggests a rejection of the null hypothesis, which means that the variables are integrated of the first order.
To check the robustness of the ADF test results, the KPSS test was performed, which tests the stationarity of the analyzed time series. The results shown in Table 4 confirm that GDP and FDI are I (1).
Then, using the information criteria AIC, we determined the optimal lag value of the VAR model. The results shown in Table 5 indicate that according to this criterion, it is optimal to adopt the third order (AIC) lag.
According to the Toda–Yamamoto test, we involved the addition of one extra lag of each of the variables to each equation, and the use of a standard Wald test to see if the coefficients of the lagged ‘other’ variables (excluding the additional one) were jointly zero in the equation.
Next, we performed the diagnostic Lagrange multiplier (LM) test that revealed (LM = 4.896, p-value = 0.298) there is no serial correlation. JB test results (JB = 2.016, p-value = 0.733) showed that all residuals are normally distributed, and the ARCH test showed (LM = 12.74, p-value = 0.175) that there is no heteroscedasticity problem in our model. The results of the Wald test are presented in Table 6.
The results obtained in the estimation of the model VAR with Toda–Yamamoto correction indicate the existence of a relationship between GDP and FDI, which should be included in the SWOT analysis.
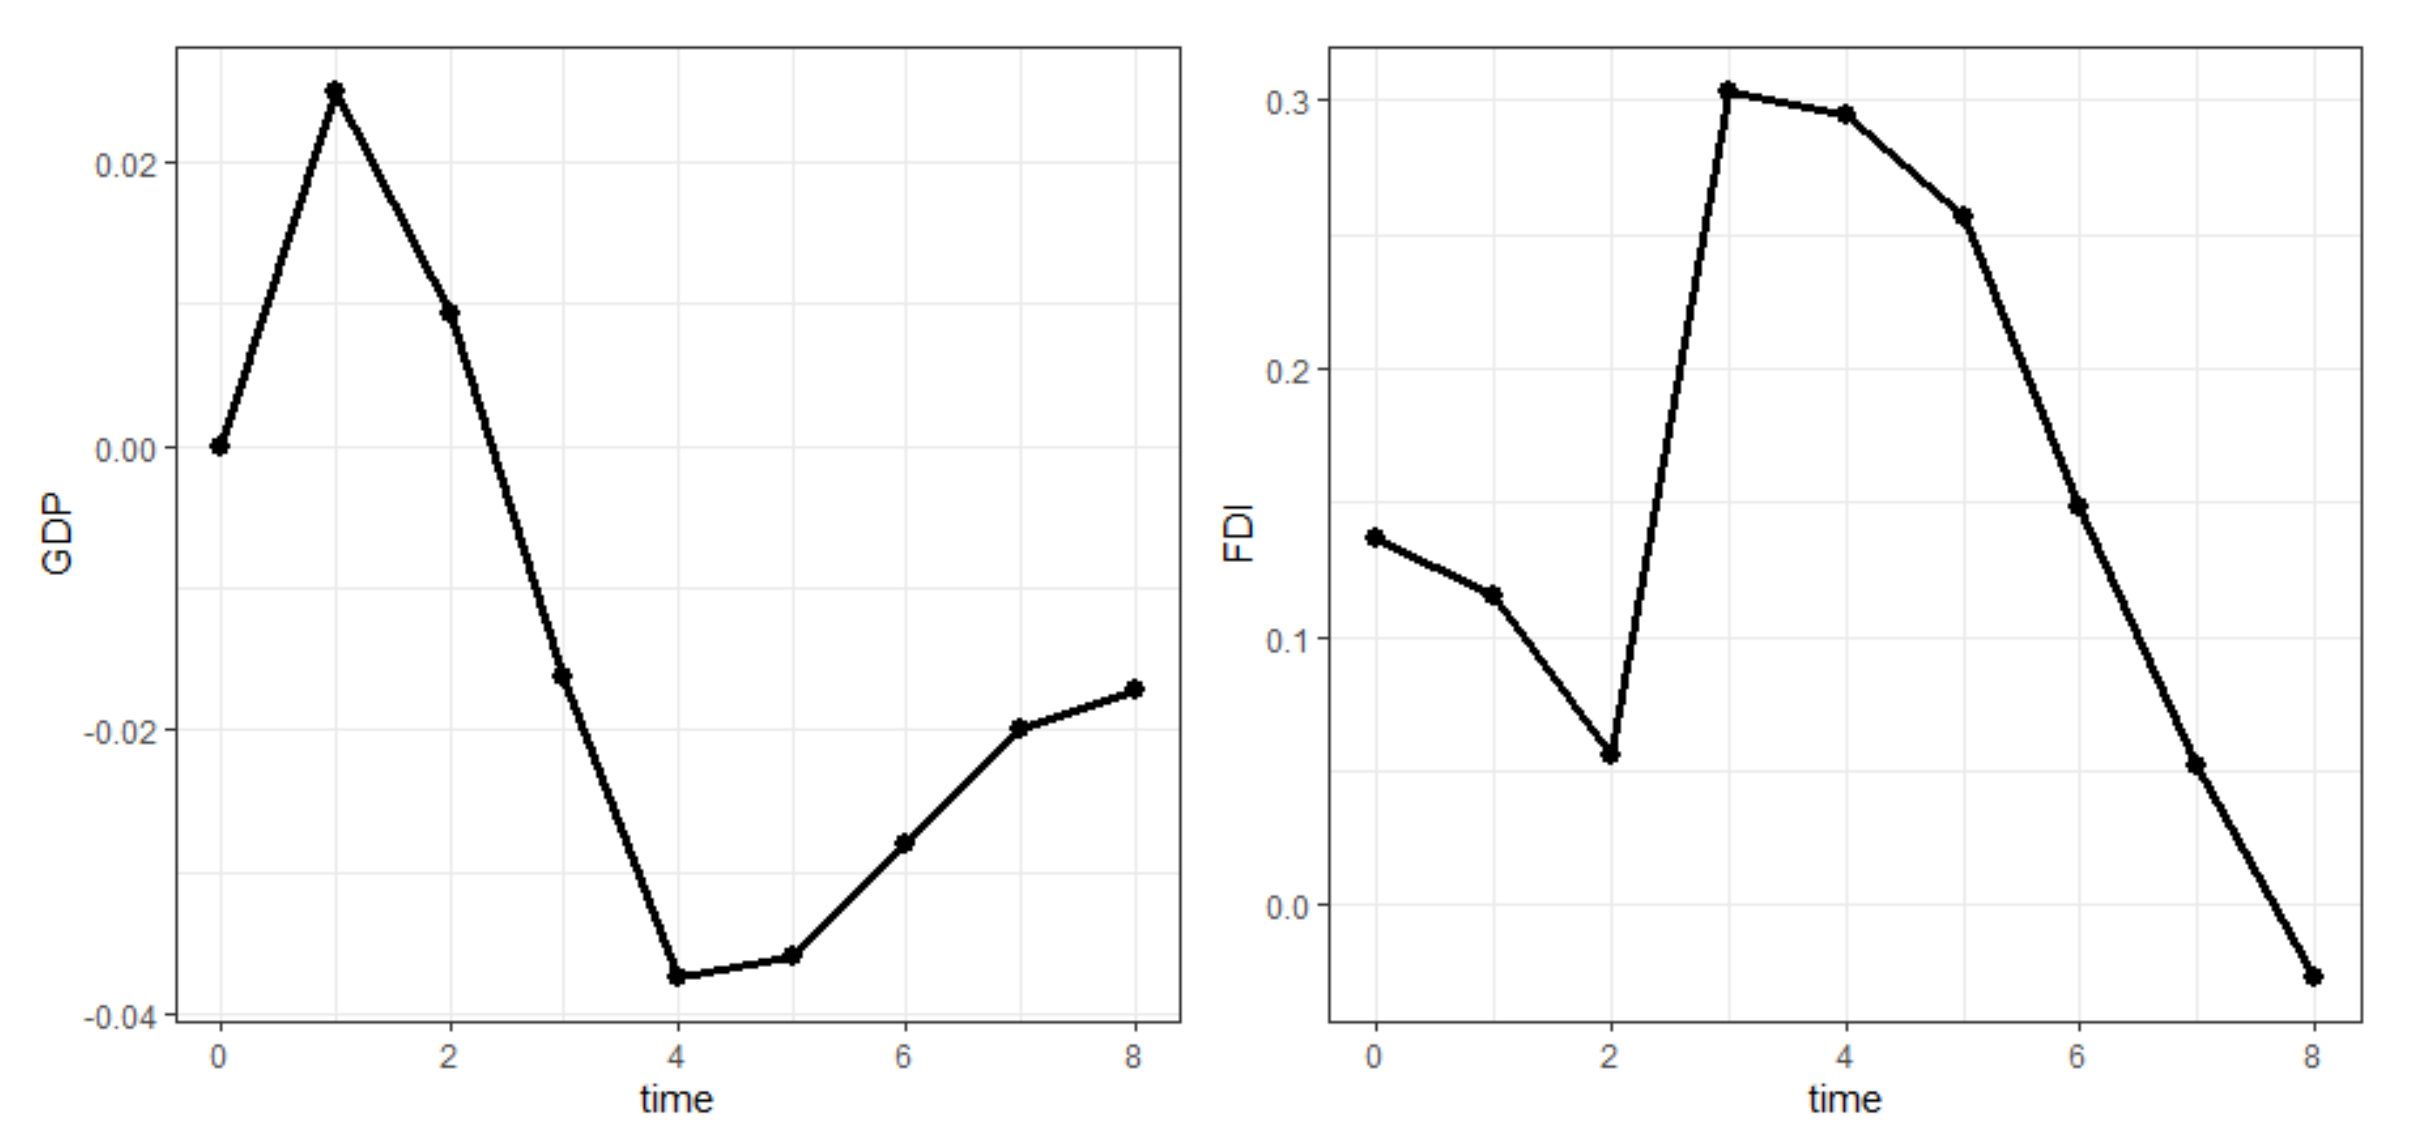
Based on the obtained results, the orthogonalized impulse response functions are presented, which are calculated as the response of each endogenous variable to a unit shock in the system variables. The analysis was performed for the eight year prognostic period (Figure 4).
The results of the impulse response function (IRF) confirm the results obtained with the Granger causality test. The shock caused by a change in one standard deviation in FDI has practically no impact on GDP, while a change in GDP causes a fairly significant growth impulse for FDI. Impact reaches maximum for k = 3, and then expires.
4.2. SWOT Analysis of Turkmenistan’s Gas Sector
In the previous sections, using econometric tools, we analyzed the relationship between Turkmenistan’s GDP and FDI. Unfortunately, a deeper quantitative analysis of the impact of the gas sector on the economy of this country, due to problems with access to sufficiently long and reliable data, is very difficult. Therefore, we decided to investigate in more detail what factors affect the competitive potential of Turkmenistan’s gas sector by using a SWOT analysis (Table 7).
4.2.1. Strengths
The strengths of Turkmenistan’s gas sector include, first of all, rich deposits of natural gas, which makes it possible to benefit from its production for years to come. It also pays to invest in the development of this branch of the economy. At the same time, the country’s advantage is its low domestic consumption of blue fuel. Turkmenistan has a network of gas pipelines, which is effectively developing to expand its export markets. Simultaneously, tremendously important is the fact that the government is creating a favorable climate for foreign investors.
Since the gas sector is owned by the state, the government has many instruments to support it, ranging from fiscal policy through legislation to cheap loans and subsidies. Also, not without significance is the increased rate of government representatives’ participation in conferences and international meetings, which promotes the gas sector and increases the interest of potential investors and buyers.
Another key strength, which may determine the development of the gas sector, is the overproduction of cheap electricity used in gas liquefaction technology, which lowers its costs. The country has several LNG terminals, including one seaport built in 2009 on the Caspian Sea coast (in the port of Kiyanly). LNG is supplied to Afghanistan, Georgia, Iran, Tajikistan, Pakistan, Japan, and other countries.
4.2.2. Weaknesses
The sector’s weaknesses include the dependence of the state budget on foreign currency revenues from hydrocarbon exports. In the event of a downturn in the global economy (for example, falling gas prices in world markets), such dependence may threaten the stability of the functioning of the entire national economy. As a consequence, GDP per capita will fall, i.e., the standard of living of the country’s population will decrease.
A poorly developed network of cross-border gas pipelines limits the possibilities of selling such a specific commodity as natural gas. To reach new markets, Turkmenistan needs to expand its network, which requires large investments. On the other hand, the government does not have adequate financial resources, as is shown by repeated loans taken abroad. Although they make it possible to develop the gas industry, they also push the country into long-term dependence on creditors. At the same time, there are no funds for the necessary modernization of the sector—the outdated technologies and faulty machinery result in production stoppages, lower efficiency, and lower competitiveness.
Despite the government’s efforts to increase LNG production, the lack of access to open sea routes (through the seas and oceans) significantly limits the possibility of selling the commodity to new buyers and increases its transportation cost. There are two ways of supplying LNG: by land (the more expensive way) and by sea (the cheaper way). Currently, LNG supplies from Turkmenistan are limited to countries in the Caspian Sea basin.
The high average annual temperature (+22 °C) in the country makes it difficult to liquefy the gas, which is done at −162 °C. To liquefy the gas under such conditions, a very energy-intensive technology is used, which increases the production cost and the price of the final product. Under certain circumstances, this price may become uncompetitive in the global market.
Another weakness is the country’s unstable internal economic and political situation, which may adversely affect not only the gas sector but also the inflow of new foreign investment. Potential investors may be deterred by, among other things: state control measures; exchange rate restrictions; excessive and inconsistent regulations; corruption; lack of the established rule of law; lack of experience in serving foreign investors in international trade; and underdeveloped basic communication technologies, such as the Internet and mobile telephony. Although the government encourages foreign companies to invest directly, so far the existing structures in the country are not compliant with international trade standards [71]. A deeper analysis of political, legal and economic factors is important and should be conducted by some researchers; we will pursue this in further research.
4.2.3. Opportunities
As a result of the rise in global energy demand, the increase in global demand for gas can be considered an opportunity for the development of the gas sector in Turkmenistan. This growth is a consequence of many countries shifting to a new model, i.e., diversification of energy suppliers. This is related to governments’ concerns about energy security, especially after the aforementioned gas conflicts between Ukraine and Russia, when many European countries felt threatened. The increase in demand has also been influenced by international climate policy. This is aimed at reducing greenhouse gas emissions that have led to climate change across the globe. Scientists also conduct research on the negative impact of climate change on the economy [72,73,74,75] and other spheres of social life [76,77,78,79,80,81,82,83,84,85].
Climate policy prioritizes the development of clean energy sources. Since renewable and alternative energy sources are unable to meet current energy demands, the best alternative is natural gas, which is less carbon-intensive compared to other fossil fuels.
For the gas sector (which until recently was focused solely on pipeline transport), the construction of liquefaction terminals has become an excellent development alternative. The choice of the optimal (in given climatic conditions) technology will provide the sector with a broader geography of supplies and an increase in sales and competitiveness. At the same time, it is important for a landlocked country to establish good relations and cooperation with transit countries (to expand LNG supply routes, whether by sea or land).
Currently, Turkmenistan produces a lot of cheap electricity, which makes LNG production relatively inexpensive, increasing the competitiveness of the gas sector. There may also be an opportunity for the sector to reduce LNG transportation costs when the competition among suppliers increases. Since the construction of new LNG terminals and the modernization of the traditional gas sector requires financial investments, it is necessary to ensure the largest possible share of own capital contribution in order to not fall into dependence on lenders and investors. Expansion of other sectors of the economy will provide such opportunities and make the country independent of hydrocarbon exports as its main source of income.
4.2.4. Threats
In recent years, relations in the global gas market have become increasingly “market-driven.” Two major technological advancements have contributed to this: the technology for extracting hydrocarbons from shale, and the technology for liquefying gas. The result has been a sharp increase in global gas production and a shift of the gas price away from its oil price dependence. The gas price began to respond to several market and non-market factors. Thus, it is not predetermined by long-term contracts as it was in the case of traditional supply through pipelines. However, a consequence of these changes may be an economic downturn for those gas producers who rely on traditional technologies of gas extraction and delivery. A threat may also be posed by changes in the phases of the business cycle, as well as utterly unexpected market or non-market events (e.g., volcanic eruption or pandemic).
So far, shale gas production costs have been higher than traditional gas production costs. However, the former case’s production cost decrease may contribute to the deterioration of competitiveness in the latter case. Thus, a decrease in shale gas production cost can be seen as a threat to Turkmenistan’s gas sector, which produces gas mainly in a traditional way. Similar consequences will see a decrease in the cost of transporting LNG by tankers versus the cost of transporting gas by pipeline. Also, it cannot be ruled out that the cost of transporting gas via pipelines through transit territories will increase, which will also reduce the competitiveness of the traditional gas sector.
Liquefied gas production is an excellent prospect for the development of the gas sector in Turkmenistan. However, in this case, it is also necessary to analyze the risks. One of these may be the increase in the price of refrigerant and other materials used in the gas liquefaction technology. As this technology is relatively energy-intensive, the price of electricity will have a significant impact; its increase will translate into higher production costs and thus into LNG’s price.
When natural gas is used for energy production, competition from alternative and renewable energy can be a threat. In the first case, energy is obtained from waste: agricultural biogas, biogas from sewage treatment plants, biogas from landfills, combustion in thermal waste conversion plants, etc. In the second case, energy is obtained from the energy of the sun, water, wind, and earth. Lowering the cost of obtaining green energy (mainly from recently popular hybrid systems and solar photovoltaic technology) is a threat to the energy industry based on traditional fossil energy sources. The rise of nuclear power (the second-largest source of low-carbon electricity, after hydropower) could also pose a competitive threat.
From the economic side, the profitability of investments in the sector should be closely monitored, since a reduction in return rate may discourage foreign investors from further investments. The risks associated with the unstable political and economic situation in the transit and destination countries should also be taken into account.
Since the SWOT analysis shows that all sides (strengths, weaknesses, opportunities, and threats) have almost equal influence, it will be difficult to identify the best strategy for developing the gas sector in Turkmenistan. Under these circumstances, an aggressive-conservative strategy can be recommended. The sector’s management and the government should implement a strong expansion into the global gas market, using their strengths and taking advantage of the opportunities (chances). However, they also need to be mindful of the weaknesses and risks, which need to be addressed in variant solutions based on different future scenarios for the sector. Such an approach will help to react quickly to the occurring changes, and to not lose potential opportunities and protect against possible risks.
4.3. Scenario Analysis
Scenario analysis involves forecasting the development of a given business entity’s situation and its external environment in which it will operate in the future. In doing so, many factors, both market and non-market, must be considered.
Based on the performed analysis of the current state and trends of changes in the Turkmen gas sector environment, we can forecast three scenarios of its development:
- pessimistic;
- realistic;
- optimistic.
The foundation of the gas sector in Turkmenistan is formed by its strengths, primarily: large reserves of natural gas; small domestic demand; the existence of an extensive gas pipeline network; investments in the construction of new sections of transnational gas pipelines; the start of liquefied gas production.
In the face of the COVID-19 pandemic, we will start with a pessimistic scenario. The impact of a prolonged pandemic will be a reduction in economic activity and recession around the world. As a result, there will be a decrease in gas demand and a decrease in its price. On the one hand, this will reduce Turkmenistan’s gas export revenues; on the other hand, it will reduce competition from shale gas producers. However, it is unclear which factor will have a more significant impact on the country’s budget revenues. Even with declining shale gas production, LNG will still remain on the market as a more mobile product. Therefore, Turkmenistan’s gas sector should bet on increasing its own LNG production and expanding the number of customers. As for traditional gas supplies, the pandemic and the slowdown in economic activity may delay the commissioning of the next sections of gas pipelines (as is already evident), which will reduce Turkmenistan’s chances of expanding the geography of supplies by traditional means.
The recession may exacerbate the changes currently taking place in the country’s economy for the worse. This will result in an outflow of foreign investment, on which the country is dependent and which the gas sector very much needs. This will jeopardize the modernization of the existing extraction potential and the construction of new processing capacities, resulting in a decrease in gas and oil production. Equally dangerous is the country’s dependence on a limited circle of foreign creditors, which should be diversified. A good solution would be to raise funds on international capital markets.
A deteriorating economic situation and weaknesses in the gas sector may lead to deterioration of the competitive position in the global hydrocarbons market, reduction of export volumes, reduction of foreign currency revenues to the state budget and reduction of the standard of living in Turkmenistan.
In a realistic scenario, we assume that the pandemic will last, but not too long. However, the currently imposed restrictions on economic activity will lead to a crisis. Breaking the business cycle’s downward trend will require large amounts of money, which Turkmenistan’s economy currently does not have. If the government goes down the road of issuing fiat money, it will contribute to a spike in inflation. As a result, potential investors will be cautious and flee to “safe havens,” investing in precious metals and real estate. Inflation also means an outflow of savings from the banking sector, which could provide loans to save the economy. Unfortunately, even a strong expansionary economic policy will not be able to stop these processes.
However, it is highly likely that the global economy, freed from restrictions (due to the pandemic), will quickly gain momentum and move into a recovery phase. It will then need more energy from renewable and conventional sources. Increased demand for energy means an optimistic outlook on the growth of demand for blue fuel and its price. This, in turn, raises hopes that Turkmenistan’s gas sector will continue to grow, at least at the same pace as before the pandemic.
The best-case scenario would be the optimistic one. Assuming the pandemic subsides quickly due to mass vaccination, it can be expected that the economy recovers quickly and regains momentum. Then, there will be a surge in demand for energy and energy commodities, including natural gas and oil. The recovery of the economy may affect the GDP growth and this, in the light of the research conducted, will also affect value of the FDI index. Turkmenistan should also not be threatened by the increased supply of shale gas on the global market, provided that it develops its own LNG production.
If the time of the pandemic coincides with a period of economic crisis and depression, it will be immediately followed by a recovery, because people are hungry for normalcy. They will spend their “forced” savings with redoubled force. Consumer demand will rise sharply, as is the “engine” of the economy. Increased demand will stimulate production and investment. Unemployment will fall, and state budget revenues from direct taxes (on income) and indirect taxes (on purchases) will increase. A well-supplied budget, in turn, means more government spending on goods and services and transfer payments. As such, the economy gains momentum in an unwinding spiral.
During an economic rebound, investors’ sentiments also change, and they are more willing to take risks and invest in industries yielding stable high returns. Here we can see an opportunity for Turkmenistan’s gas sector to attract foreign investment, both direct and indirect. Increased investment is an opportunity to rapidly expand and modernize the sector, which will bring more revenue to the state, increase GDP and improve the living conditions of the country’s residents.
5. Summary
In many countries, natural gas plays an important role in mitigating climate change, mainly due to coal replacement with gas. It also ensures an uninterrupted energy supply as a back-up to renewable energy sources. For this reason, demand for this resource has been increasing in recent years. The supply of gas in the global market comes from traditional production and shale. Since one of the key suppliers of natural gas is Turkmenistan, it was important to examine its current and prospective potential in relation to the natural gas supply.
This analysis revealed the most important trends of changes in the global gas market in recent decades. Mainly, this has been an increase in demand for gas, linked to new climate policies aimed at reducing the share of polluting fossil fuels. As gas performs better than other fossil fuels in this respect, demand for it continues to grow. Other important developments include the extraction of gas from shale and the development of gas liquefaction technology. As a result, competition in the global gas market and the share of LNG delivered by tankers around the world has increased. All this has changed the way that gas price is determined, which used to be firmly linked to the price of crude oil. Currently, it is shaped independently, influenced by many market and non-market factors. This increases the amplitude of its fluctuations and the price risk for producers of this resource.
The main objective of this paper was to examine selected influencing factors on Turkmenistan’s gas sector to shed light on new research perspectives on its future development and role in the global gas market. Unlike previous approaches, we consider both quantitative and qualitative data.
We have analyzed the causal relationship between FDI and GDP for annual data from 1995–2018 using the Toda–Yamamoto procedure for VAR model. Our approach is tailored to the non-stationary nature of the data, and fills a gap in the existing literature on the topic. The analysis of annual data for the period from 1995 to 2018 allowed for the determination of a statistically significant one-way causal relationship from GDP to FDI. This means that while the FDI inflow has not been found to have a significant impact on Turkmenistan’s GDP, the country’s real economic growth may result in an inflow of FDI. The persistence of the effect will not be long-term as the impulse response analysis suggests that GDP growth has the greatest effect in the period between three and four, and then expires.
The analysis of the current state of Turkmenistan’s gas sector, the publicized plans for its development, and the study of the dependencies of important economic indicators made it possible to perform a SWOT analysis. It has become the basis for the formulation of three scenarios of economic development of Turkmenistan. The proposed scenarios can serve as a basis for the development strategy of individual entities of the country’s gas sector. This is because they consider the events that may occur and that are important for the selected entity. It should be remembered that the scenarios and development strategies should be updated in situations of sudden, unforeseen changes in the external environment.
Point to the fact that in the case of Turkmenistan, the idea that the direction of causality runs from FDI to the economic growth is not confirmed. The lack of this direction of causality is often associated with the characteristics of FDI inflows [27,31,86,87]. Therefore, it seems that policymakers should take steps to create conditions for greater diversification of the inflows of FDI, e.g., by improving human resources, conducting a transparent economic policy and introducing incentives for investment supporting sectors of the economy not related to gas exports.
In this way, Turkmenistan could at least partially eliminate the economy’s dependence on the export of natural resources, but also positively affect economic development, which—according to the results obtained by us—will increase the country’s attractiveness among potential foreign investors.
This article is limited to an analysis of the gas sector of Turkmenistan. However, the scenarios discussed above can be recommended as a starting point for managers of gas sector companies in other countries. For the authors of the publication, the main limitation was the lack of complete data on the gas sector in Turkmenistan. Secondary data (obtained from publications and websites) were often contradictory.
In the future, the authors plan to use PESTEL analysis and other foresight methods in order to perform a more deep and reliable analysis.
Author Contributions
Conceptualization, N.I. and A.I.; methodology, J.W. and A.I.; software, J.W.; validation, N.I., A.I. and J.W.; formal analysis, J.W.; investigation, J.W. and A.I.; resources, J.W. and A.I.; data curation, J.W. and A.I.; writing—original draft preparation, J.W. and A.I.; writing—review and editing, N.I.; visualization, J.W.; supervision, N.I.; project administration, N.I.; funding acquisition, N.I. and J.W. All authors have read and agreed to the published version of the manuscript.
Funding
The APC was funded under subvention funds for the Faculty of Management of the AGH University of Science and Technology and by program. Excellence Initiative—Research University for the AGH University of Science and Technology.
Institutional Review Board Statement
Not applicable.
Informed Consent Statement
Not applicable.
Data Availability Statement
The data presented in this study are available on request from the authors.
Conflicts of Interest
The authors declare no conflict of interest.
References
- British Petroleum. BP Statistical Review of World Energy 2002. Available online: https://www.griequity.com/resources/industryandissues/Energy/bp2002statisticalreview.pdf (accessed on 15 June 2020).
- British Petroleum. BP Statistical Review of World Energy 2019. Available online: https://www.bp.com/content/dam/bp/business-sites/en/global/corporate/pdfs/energy-economics/statistical-review/bp-stats-review-2019-full-report.pdf (accessed on 15 June 2020).
- Population City. Available online: http://populacja.population.city/turkmenistan/ (accessed on 15 June 2020).
- Bilgin, M. New prospects in the political economy of inner-Caspian hydrocarbons and western energy corridor through Turkey. Energy Policy 2007, 35, 6383–6394. [Google Scholar] [CrossRef]
- Bilgin, M. Geopolitics of European natural gas demand: Supplies from Russia, Caspian and the Middle East. Energy Policy 2009, 37, 4482–4492. [Google Scholar] [CrossRef]
- Cobanli, O. Central Asian Gas in Eurasian Power Game. Energy Policy 2014, 68, 348–370. [Google Scholar] [CrossRef]
- Lee, Y. Opportunities and risks in Turkmenistan’s quest for diversification of its gas export routes. Energy Policy 2014, 74, 330–339. [Google Scholar] [CrossRef]
- Heinrich, A.; Pleines, H. Mixing geopolitics and business: How ruling elites in the Caspian states justify their choice of export pipelines. J. Eurasian Stud. 2015, 6, 107–113. [Google Scholar] [CrossRef] [Green Version]
- Esen, V.; Oral, B. Natural gas reserve/production ratio in Russia, Iran, Qatar and Turkmenistan: A political and economic perspective. Energy Policy 2016, 93, 101–109. [Google Scholar] [CrossRef]
- Azam, M. Economic Determinants of Foreign Direct Investment in Armenia, Kyrgyz Republic and Turkmenistan: Theory and Evidence. Eurasian J. Bus. Econ. 2010, 3, 27–40. [Google Scholar]
- Toda, H.Y.; Yamamoto, T. Statistical Inference in Vector Autoregressions with Possibly Integrated Processes. J. Econom. 1995, 66, 225–250. [Google Scholar] [CrossRef]
- World Bank Open Data. Available online: https://data.worldbank.org/indicator/BX.KLT.DINV.WD.GD.ZS?locations=HU-TM (accessed on 10 January 2021).
- Neftegaz.RU. Available online: https://neftegaz.ru/analisis/world_market/328583-turkmenistan-istochnik-energii-shelkovogo-puti/ (accessed on 12 February 2020).
- Neftegaz.RU. Available online: https://neftegaz.ru/news/dobycha/479557-turkmenistan-dobyl-35-6-mlrd-m3-gza-za-1-e-polugodie-2019-g (accessed on 14 March 2020).
- British Petroleum. BP Statistical Review of World Energy 2020. Available online: https://www.bp.com/content/dam/bp/business-sites/en/global/corporate/pdfs/energy-economics/statistical-review/bp-stats-review-2020-full-report.pdf?utm_source=BP_Global_GroupCommunications_UK_external&utm_medium=email&utm_campaign=11599394_Statistical%20Review%202020%20-%20on%20the%20day%20reminder&dm_i=1PGC%2C6WM5E%2COV0LQ4%2CRQW75%2C1 (accessed on 23 January 2021).
- Nebit Gaz1. Available online: https://www.oilgas.gov.tm/m/page/page/22 (accessed on 30 July 2020).
- Nebit Gaz2. Available online: https://www.oilgas.gov.tm/ (accessed on 30 August 2020).
- Nebit Gaz3. Available online: https://oilgas.gov.tm/compositions/28 (accessed on 22 July 2020).
- Sputnik. Uzbekistan. Available online: https://uz.sputniknews.ru/economy/20190719/12045250/Uzbekistan-i-Kitay-namereny-uskorit-stroitelstvo-IV-nitki-gazoprovoda.html (accessed on 22 July 2020).
- Neftegaz.RU. Available online: https://neftegaz.ru/news/transport-and-storage/651439-stroitelstvo-gazoprovoda-tapi-na-territorii-afganistana-nachnetsya-v-2021-g/ (accessed on 26 November 2020).
- Neft Capital. Available online: https://oilcapital.ru/article/general/02-08-2019/turkmenistan-bez-nefti-no-s-gazom (accessed on 30 August 2020).
- Lamasz, B.; Iwaszczuk, N. The impact of implied volatility fluctuations on vertical spread option strategies: The case of WTI crude oil market. Energies 2020, 13, 5323. [Google Scholar] [CrossRef]
- Lamasz, B.; Iwaszczuk, N. Crude oil option market parameters and their impact on the cost of hedging by long strap strategy. Int. J. Energy Econ. Policy 2020, 10, 471–480. [Google Scholar] [CrossRef]
- Chu, A.M.; Lv, Z.; Wagner, N.F.; Wong, W.K. Linear and nonlinear growth determinants: The case of Mongolia and its connection to China. Emerg. Mark. Rev. 2020, 43, 100693. [Google Scholar] [CrossRef] [Green Version]
- Tekin, R.B. Economic growth, exports and foreign direct investment in Least Developed Countries: A panel Granger causality analysis. Econ. Model. 2012, 29, 868–878. [Google Scholar] [CrossRef]
- Azam, M.; Ibrahim, Y.; Bakhtyar, B. Foreign direct investment and economic growth in Asia. Actual Probl. Econ. 2014, 11, 58–67. [Google Scholar]
- Chowdhury, A.; Mavrotas, G. FDI and growth: A causal relationship. WIDER Res. Pap. 2005, 25, 1–10. [Google Scholar]
- Sharma, A.; Rishad, A.; Gupta, S. Relationship between FDI, export and economic growth in India: Evidence from Toda and Yamamoto approach. J. Acad. Res. Econ. 2018, 10, 17–29. [Google Scholar]
- Frimpong, J.M.; Oteng-Abayie, E.F. Bivariate causality analysis between FDI inflows and economic growth in Ghana. In Proceedings of the 3rd African Finance Journal Conference, Accra, Ghana, 12–13 July 2006. [Google Scholar]
- Kosztowniak, A. Verification of the relationship between FDI and GDP in Poland. Acta Oeconomica 2016, 66, 307–332. [Google Scholar] [CrossRef]
- Ibrahim, O.A.; Abdel-Gadir, S.E.M. Motives and Determinants of FDI: A VECM Analysis for Oman. Glob. Bus. Rev. 2015, 16, 936–946. [Google Scholar] [CrossRef]
- Hsiao, F.S.; Hsiao, M.C.W. FDI, exports, and GDP in East and Southeast Asia—Panel data versus time-series causality analyses. J. Asian Econ. 2006, 17, 1082–1106. [Google Scholar] [CrossRef]
- Gherghina, Ș.C.; Simionescu, L.N.; Hudea, O.S. Exploring Foreign Direct Investment–Economic Growth Nexus—Empirical Evidence from Central and Eastern European Countries. Sustainability 2019, 11, 5421. [Google Scholar] [CrossRef] [Green Version]
- Baltagi, B.H. Econometrics, 4th ed.; Springer: New York, NY, USA, 2008; ISBN 978-3-540-76515-8. [Google Scholar]
- Jeleński, T.; Dendys, M.; Tomaszewska, B.; Pająk, L. The Potential of RES in the Reduction of Air Pollution: The SWOT Analysis of Smart Energy Management Solutions for Krakow Functional Area (KrOF). Energies 2020, 13, 1754. [Google Scholar] [CrossRef] [Green Version]
- Ervural, B.C.; Zaim, S.; Demirel, O.F.; Aydin, Z.; Delen, D. An ANP and fuzzy TOPSIS-based SWOT analysis for Turkey’s energy planning. Renew. Sustain. Energy Rev. 2018, 82, 1538–1550. [Google Scholar] [CrossRef]
- Ishola, F.A.; Olatunji, O.O.; Ayo, O.O.; Akinlabi, S.A.; Adedeji, P.A.; Inegbenebor, A.O. Sustainable Nuclear Energy Exploration in Nigeria–A SWOT Analysis. Procedia Manuf. 2019, 35, 1165–1171. [Google Scholar] [CrossRef]
- Haque, H.M.E.; Dhakal, S.; Mostafa, S.M.G. An assessment of opportunities and challenges for cross-border electricity trade for Bangladesh using SWOT-AHP approach. Energy Policy 2020, 137, 111118. [Google Scholar] [CrossRef]
- Agyekum, E.B.; Ansah, M.N.S.; Afornu, K.B. Nuclear energy for sustainable development: SWOT analysis on Ghana’s nuclear agenda. Energy Rep. 2020, 6, 107–115. [Google Scholar] [CrossRef]
- Nezhad, M.M.; Shaik, R.U.; Heydari, A.; Razmjoo, A.; Arslan, N.; Garcia, D.A. A SWOT Analysis for Offshore Wind Energy Assessment Using Remote-Sensing Potential. Appl. Sci. 2020, 10, 6398. [Google Scholar] [CrossRef]
- Alvarez, D.B.; Sugiyama, M. A SWOT Analysis of Utility-Scale Solar in Myanmar. Energies 2020, 13, 884. [Google Scholar] [CrossRef] [Green Version]
- Lei, Y.; Lu, X.; Shi, M.; Wang, L.; Lv, H.; Chen, S.; Hu, C.; Yu, Q.; da Silveira, S.D.H. SWOT analysis for the development of photovoltaic solar power in Africa in comparison with China. Environ. Impact Assess. Rev. 2019, 77, 122–127. [Google Scholar] [CrossRef]
- Kamran, M.; Fazal, M.R.; Mudassar, M. Towards empowerment of the renewable energy sector in Pakistan for sustainable energy evolution: SWOT analysis. Renew. Energy 2020, 146, 543–558. [Google Scholar] [CrossRef]
- Elavarasan, R.M.; Afridhis, S.; Vijayaraghavan, R.R.; Subramaniam, U.; Nurunnabi, M. SWOT analysis: A framework for comprehensive evaluation of drivers and barriers for renewable energy development in significant countries. Energy Rep. 2020, 6, 1838–1864. [Google Scholar] [CrossRef]
- Irfan, M.; Hao, Y.; Panjwani, M.K.; Khan, D.; Chandio, A.A.; Li, H. Competitive assessment of South Asia’s wind power industry: SWOT analysis and value chain combined model. Energy Strategy Rev. 2020, 32, 100540. [Google Scholar] [CrossRef]
- Agyekum, E.B. Energy poverty in energy rich Ghana: A SWOT analytical approach for the development of Ghana’s renewable energy. Sustain. Energy Technol. Assess. 2020, 40, 100760. [Google Scholar] [CrossRef]
- Lustenberger, P.; Schumacher, F.; Spada, M.; Burgherr, P.; Stojadinovic, B. Assessing the Performance of the European Natural Gas Network for Selected Supply Disruption Scenarios Using Open-Source Information. Energies 2019, 12, 4685. [Google Scholar] [CrossRef] [Green Version]
- Hafezi, R.; Wood, D.A.; Akhavan, A.N.; Pakseresht, S. Iran in the emerging global natural gas market: A scenario-based competitive analysis and policy assessment. Resour. Policy 2020, 68, 101790. [Google Scholar] [CrossRef]
- Scharf, H.; Arnold, F.; Lencz, D. Future natural gas consumption in the context of decarbonization–A meta-analysis of scenarios modeling the German energy system. Energy Strategy Rev. 2021, 33, 100591. [Google Scholar] [CrossRef]
- Kolb, S.; Plankenbühler, T.; Frank, J.; Dettelbacher, J.; Ludwig, R.; Karl, J.; Dillig, M. Scenarios for the integration of renewable gases into the German natural gas market–A simulation-based optimisation approach. Renew. Sustain. Energy Rev. 2021, 139, 110696. [Google Scholar] [CrossRef]
- Zhou, I.; Jin, B.; Du, S.; Zhang, P. Scenario Analysis of Carbon Emissions of Beijing-Tianjin-Hebei. Energies 2018, 11, 1489. [Google Scholar] [CrossRef] [Green Version]
- Wu, Q.; Peng, C. Scenario Analysis of Carbon Emissions of China’s Electric Power Industry Up to 2030. Energies 2016, 9, 988. [Google Scholar] [CrossRef] [Green Version]
- Kim, S.H.; Lee, S.; Han, S.Y.; Kim, J.H. Scenario Analysis for GHG Emission Reduction Potential of the Building Sector for New City in South Korea. Energies 2020, 13, 5514. [Google Scholar] [CrossRef]
- Yao, X.; Lei, H.; Yang, I.; Shao, S.; Ahmed, D.; Ismaail, M.G.A. Low-carbon transformation of the regional electric power supply structure in China: A scenario analysis based on a bottom-up model with resource endowment constraints. Resour. Conserv. Recycl. 2021, 167, 105315. [Google Scholar] [CrossRef]
- Leo, S.D.; Pietrapertosa, F.; Salvia, M.; Cosmi, C. Contribution of the Basilicata region to decarbonisation of the energy system: Results of a scenario analysis. Renew. Sustain. Energy Rev. 2021, 138, 110544. [Google Scholar] [CrossRef]
- Facchini, F.; Mummolo, G.; Vitti, M. Scenario Analysis for Selecting Sewage Sludge-to-Energy/Matter Recovery Processes. Energies 2021, 14, 276. [Google Scholar] [CrossRef]
- Lederer, J.; Gassner, A.; Fellner, J.; Mollay, U.; Schremmer, C. Raw materials consumption and demolition waste generation of the urban building sector 2016-2050: A scenario-based material flow analysis of Vienna. J. Clean. Prod. 2021, 288, 125566. [Google Scholar] [CrossRef]
- Tosoni, E.; Salo, A.; Govaerts, J.; Zio, E. Definition of the data for comprehensiveness in scenario analysis of near-surface nuclear waste repositories. Data Brief 2020, 31, 105780. [Google Scholar] [CrossRef] [PubMed]
- Westgaard, S.; Fleten, S.E.; Negash, A.; Botterud, A.; Bogaard, K.; Verling, T.H. Performing price scenario analysis and stress testing using quantile regression: A case study of the Californian electricity market. Energy 2021, 214, 118796. [Google Scholar] [CrossRef]
- Cieplinski, A.; D’Alessandro, S.; Marghella, F. Assessing the renewable energy policy paradox: A scenario analysis for the Italian electricity market. Renew. Sustain. Energy Rev. 2021, 142, 110838. [Google Scholar] [CrossRef]
- Javed, M.S.; Ma, T.; Jurasz, J.; Mikulik, J. A hybrid method for scenario-based techno-economic-environmental analysis of off-grid renewable energy systems. Renew. Sustain. Energy Rev. 2021, 139, 110725. [Google Scholar] [CrossRef]
- Li, T.; Li, Z.; Li, W. Scenarios analysis on the cross-region integrating of renewable power based on a long-period cost-optimization power planning model. Renew. Energy 2020, 156, 851–863. [Google Scholar] [CrossRef]
- Salvucci, R.; Petrović, S.; Karlsson, K.; Wråke, M.; Uteng, T.P.; Balyk, O. Energy Scenario Analysis for the Nordic Transport Sector: A Critical Review. Energies 2019, 12, 2232. [Google Scholar] [CrossRef] [Green Version]
- Song, Y.; Li, G.; Wang, Q.; Meng, X.; Wang, H. Scenario analysis on subsidy policies for the uptake of electric vehicles industry in China. Resour. Conserv. Recycl. 2020, 161, 104927. [Google Scholar] [CrossRef]
- Keseru, I.; Coosemans, T.; Macharis, C. Stakeholders’ preferences for the future of transport in Europe: Participatory evaluation of scenarios combining scenario planning and the multi-actor multi-criteria analysis. Futures 2021, 127, 102690. [Google Scholar] [CrossRef]
- Dzikuć, M.; Piwowar, A.; Szufa, S.; Adamczyk, J.; Dzikuć, M. Potential and Scenarios of Variants of Thermo-Modernization of Single-Family Houses: An Example of the Lubuskie Voivodeship. Energies 2021, 14, 191. [Google Scholar] [CrossRef]
- Alshammari, Y.M. Scenario analysis for energy transition in the chemical industry: An industrial case study in Saudi Arabia. Energy Policy 2021, 150, 112128. [Google Scholar] [CrossRef]
- Borghino, N.; Corson, M.; Nitschelm, L.; Wilfart, A.; Fleuet, J.; Moraine, M.; Breland, T.A.; Lescoat, P.; Godinot, O. Contribution of LCA to decision making: A scenario analysis in territorial agricultural production systems. J. Environ. Manag. 2021, 287, 112288. [Google Scholar] [CrossRef] [PubMed]
- UNCTAD. World Investment Report 2014. United Nations Conference on Trade and Development. Available online: https://unctad.org/system/files/official-document/wir2014_en.pdf (accessed on 12 March 2020).
- UNCTAD. World Investment Report 2020, United Nations Conference on Trade and Development. Available online: https://unctad.org/system/files/official-document/wir2020_overview_en.pdf (accessed on 10 January 2021).
- Santander Trade Markets. Available online: https://santandertrade.com/en/portal/establish-overseas/turkmenistan/investing-3 (accessed on 28 December 2020).
- Borowski, P.F. Nexus between Water, Energy, Food and Climate Change as Challenges Facing the Modern Global, European and Polish economy. AIMS Geosci. 2020, 6, 397–421. [Google Scholar] [CrossRef]
- Borowski, P.F. Zonal and Nodal Models of Energy Market in European Union. Energies 2020, 13, 4182. [Google Scholar] [CrossRef]
- ÓhAiseadha, C.; Quinn, G.; Connolly, R.; Connolly, M.; Soon, W. Energy and Climate Policy–An Evaluation of Global Climate Change Expenditure 2011–2018. Energies 2020, 13, 4839. [Google Scholar] [CrossRef]
- Gouel, C.; Laborded, D. The crucial role of domestic and international market-mediated adaptation to climate change. J. Environ. Econ. Manag. 2021, 106, 102408. [Google Scholar] [CrossRef]
- Chen, X.; Fu, Q.; Chang, C.P. What are the shocks of climate change on clean energy investment: A diversified exploration. Energy Econ. 2021, 95, 105136. [Google Scholar] [CrossRef]
- Dovì, V.; Battaglini, A. Energy Policy and Climate Change: A Multidisciplinary Approach to a Global Problem. Energies 2015, 8, 13473–13480. [Google Scholar] [CrossRef] [Green Version]
- Jiang, S.; Deng, X.; Liu, G.; Zhang, F. Climate change-induced economic impact assessment by parameterizing spatially heterogeneous CO2 distribution. Technol. Forecast. Soc. Chang. 2021, 167, 120668. [Google Scholar] [CrossRef]
- Scott, C.A.; Sugg, Z.P. Global Energy Development and Climate-Induced Water Scarcity–Physical Limits, Sectoral Constraints, and Policy Imperatives. Energies 2015, 8, 8211–8225. [Google Scholar] [CrossRef] [Green Version]
- Krishna, A. Understanding the differences between climate change deniers and believers’ knowledge, media use, and trust in related information sources. Public Relat. Rev. 2021, 47, 101986. [Google Scholar] [CrossRef]
- Silveira, I.H.; Cortes, T.R.; de Oliveira, B.F.A.; Junger, W.L. Projections of excess cardiovascular mortality related to temperature under different climate change scenarios and regionalized climate model simulations in Brazilian cities. Environ. Res. 2021, 197, 110995. [Google Scholar] [CrossRef] [PubMed]
- Jones, C.A.; Davison, A. Disempowering emotions: The role of educational experiences in social responses to climate change. Geoforum 2021, 118, 190–200. [Google Scholar] [CrossRef]
- Lupi, V.; Marsiglio, S. Population growth and climate change: A dynamic integrated climate-economy-demography model. Ecol. Econ. 2021, 184, 107011. [Google Scholar] [CrossRef]
- Yang, Y.; Xu, H.; Wang, J.; Liu, T.; Huanzhi, W. Integrating climate change factor into strategic environmental assessment in China. Environ. Impact Assess. Rev. 2021, 89, 106585. [Google Scholar] [CrossRef]
- Poitras, G. Rhetoric, epistemology and climate change economics. Ecol. Econ. 2021, 184, 106985. [Google Scholar] [CrossRef]
- Herzer, D. How Does Foreign Direct Investment Really Affect Developing Countries’ Growth? Rev. Int. Econ. 2012, 20, 396–414. [Google Scholar] [CrossRef] [Green Version]
- Sothan, S. Causality between foreign direct investment and economic growth for Cambodia. Cogent Econ. Financ. 2017, 5, 1277860. [Google Scholar] [CrossRef]
Figure 1.
The structure of the oil and gas complex of Turkmenistan. Source: [17].
Figure 1.
The structure of the oil and gas complex of Turkmenistan. Source: [17].

Figure 2.
Share of hydrocarbons in Turkmenistan’s exports in 2018. Source: [18].
Figure 2.
Share of hydrocarbons in Turkmenistan’s exports in 2018. Source: [18].


Figure 4.
Orthogonalized impulse response GDP on FDI and FDI on GDP.


Table 1.
Countries with the largest surplus of gas produced in 2018 and 2019.
| Country | 2018 | 2019 | ||||
|---|---|---|---|---|---|---|
| Production (bcm) | Consumption (bcm) a | Production/ Consumption (%) | Production (bcm) | Consumption (bcm) | Production/ Consumption (%) | |
| Norway | 120.6 | 4.5 | 2680.00 | 114.4 | 4.5 | 2542.22 |
| Qatar | 175.5 | 41.4 | 423.91 | 178.1 | 41.1 | 433.33 |
| Turkmenistan | 61.5 | 28.5 | 215.79 | 63.2 | 31.5 | 200.64 |
| Total World | 3867.9 | 3848.9 | 3989.3 | 3929.2 | ||
Table 2.
Turkmenistan’s governing bodies responsible for the oil and gas complex.
| Period of Operation | Authority |
|---|---|
| 23.04.1993–30.06.1996 | Ministry of Oil and Gas of Turkmenistan |
| 01.07.1996–07.01.2016 | Ministry of oil and gas industry and mineral resources of Turkmenistan |
| 08.01.2016–14.07.2016 | Ministry of Oil and Gas of Turkmenistan |
| Until 15.07.2016 | Department of the Cabinet of Ministers of Turkmenistan |
Source: [16].
Table 3.
Descriptive statistics of variables.
| Variable | N | Mean | Sd | Min | Max | Skew | Kurtosis |
|---|---|---|---|---|---|---|---|
| GDP | 24 | 23.098 | 1.119 | 21.590 | 24.497 | −0.124 | −1.705 |
| FDI | 24 | 20.106 | 1.493 | 17.947 | 22.239 | 0.127 | −1.666 |
Source: own calculations based on World Data Bank data.
Table 4.
Results of the stationarity test of the variables used in the analysis.
| Variable | Value | ADF Test | KPSS Test | ||
|---|---|---|---|---|---|
| Levels | Diff. | Levels | Diff. | ||
| GDP | Statistic | −2.214 | −3.208 | 0.865 | 0.191 |
| p-value | 0.460 | 0.033 a | <0.01 a | >0.10 | |
| FDI | Statistic | −0.988 | −5.218 | 0.825 | 0.125 |
| p-value | 0.740 | <0.01 a | <0.01 a | >0.10 | |
a Indicate statistical significance at the 0.05 significance level.
Table 5.
Selecting the number of lags for the VAR model.
| Lag | 1 | 2 | 3 | 4 | 5 |
|---|---|---|---|---|---|
| AIC | −6.204 | −5.912 | −6.270 a | −6.033 | −6.141 |
a The number of delays selected by the information criterion.
Table 6.
Wald test results.
| Variable | Wald Statistics | p-Value | Causality |
|---|---|---|---|
| GDP causes FDI | 14.1 a | 0.0028 | GDP → FDI |
| FDI causes GDP | 1.4 | 0.71 | - |
a Indicate statistical significance at the 0.05 significance level.
Table 7.
SWOT analysis for the gas sector in Turkmenistan
| Strengths | Weaknesses |
|---|---|
| Large deposits of natural gas. Low domestic demand. Oil deposits—an alternative to gas. FExistence of an extensive gas pipeline network. Construction of new gas pipelines—a way to expand export markets. Financial support from the state—subsidies, legal regulations, cheap loans. National fiscal policy favoring the sector. Favorable investment climate—for selected foreign investors. Activity of representatives of the gas sector and government—to promote the sector and attract potential buyers of natural gas and investors. Production of other products from hydrocarbons. Overproduction of cheap electric energy, which is used in the technological process of gas liquefaction (LNG). | State budget dependence on hydrocarbon exports. Lack of internal resources to implement investment projects. Dependence on foreign creditors from a single country (China). Poorly developed gas pipeline network. Lack of access to open sea routes, resulting in a more expensive way of LNG delivery—by land. Outdated technologies and faulty machinery in the extraction sector, which require modernization and new investments. High energy consumption of gas liquefaction technologies Weak development of other sectors of the economy, which makes it a resource-based economy. High volatility of the exchange rate. Lack of structures compliant with international trade standards to support foreign investors. Political and economic instability of the country. |
| Opportunities | Threats |
| Increase in global gas demand due to rise in energy demand. Climate policy that prioritizes the development of RES and the use of less carbon-intensive fossil fuels. Gas is a greener fuel compared to other fossil fuels Construction of new facilities for liquefying natural gas LNG. Cheap domestic electricity means lower costs of LNG production. Decrease in LNG transportation costs due to increased competition in the carrier market. Selection of a gas liquefaction technology adapted to climatic conditions. Establishing cooperation with transit countries. Finding new gas customers. Developing the domestic economy with a focus on investments in other sectors of the domestic economy. Commissioning of new gas pipelines. Increasing investment in the oil and gas sector. National energy policy focused on the development of the gas sector. | Increase in global gas production, especially from non-traditional sources (shale gas). Economic downturn on the gas market and decline in gas prices. Reduced costs of shale gas production—risk of competition. Increase in LNG transportation costs—given the limited number of carriers. Increase in prices of raw materials and materials used in the gas liquefaction technology. Increase in the cost of gas transport through foreign territories (transit costs). Development of alternative and renewable energy sources. Decrease in costs of green energy production. Increase in the share of power generation from nuclear power plants. Low rate of return on investment. Supply risks due to the unstable political and economic situation in the transit and destination countries. |
Publisher’s Note: MDPI stays neutral with regard to jurisdictional claims in published maps and institutional affiliations. |
© 2021 by the authors. Licensee MDPI, Basel, Switzerland. This article is an open access article distributed under the terms and conditions of the Creative Commons Attribution (CC BY) license (https://creativecommons.org/licenses/by/4.0/).
Share and Cite
MDPI and ACS Style
Iwaszczuk, N.; Wolak, J.; Iwaszczuk, A. Turkmenistan’s Gas Sector Development Scenarios Based on Econometric and SWOT Analysis. Energies 2021, 14, 2740. https://doi.org/10.3390/en14102740
AMA Style
Iwaszczuk N, Wolak J, Iwaszczuk A. Turkmenistan’s Gas Sector Development Scenarios Based on Econometric and SWOT Analysis. Energies. 2021; 14(10):2740. https://doi.org/10.3390/en14102740
Chicago/Turabian StyleIwaszczuk, Natalia, Jacek Wolak, and Aleksander Iwaszczuk. 2021. "Turkmenistan’s Gas Sector Development Scenarios Based on Econometric and SWOT Analysis" Energies 14, no. 10: 2740. https://doi.org/10.3390/en14102740
Note that from the first issue of 2016, this journal uses article numbers instead of page numbers. See further details here.