
Multi-Criteria Method for the Selection of Renewable Energy Sources in the Polish Industrial Sector
by
 , , , and
Robert Ulewicz
1,* ,
,
Dominika Siwiec
2,* ,
,
Andrzej Pacana
2 ,
,
Magdalena Tutak
3 and
and
Jarosław Brodny
4,* 1
Department of Production Engineering and Safety, Faculty of Management, Czestochowa University of Technology, 42-201 Częstochowa, Poland
2
Faculty of Mechanical Engineering and Aeronautics, Rzeszow University of Technology, 35-959 Rzeszow, Poland
3
Faculty of Mining, Safety Engineering and Industrial Automation, Silesian University of Technology, 44-100 Gliwice, Poland
4
Faculty of Organization and Management, Silesian University of Technology, 44-100 Gliwice, Poland
*
Authors to whom correspondence should be addressed.
Energies 2021, 14(9), 2386; https://doi.org/10.3390/en14092386
Submission received: 2 March 2021
/
Revised: 13 April 2021
/
Accepted: 20 April 2021
/
Published: 22 April 2021
Abstract
:Rational decision-making requires assessing the advantages and disadvantages of options, including nonmarket effects (such as environmental effects). This also applies to strategic decision-making in the industrial sector to select alternative renewable energy source (RES). Often, a variety of criteria can be used to select a renewable energy source, whereas no ideal family of criteria for renewable energy selection for industry has been defined in the literature. It was concluded that there is a need to support the actions of industrial development based on RES, which will contribute significantly to overcoming the limitations of the negative effect on the environment in terms of greenhouse gas emissions. There is a clear need for a systematic and polyvalent multicriteria approach to planning in industry. Therefore, a method for choosing the preferred renewable source of electricity for industry has been developed, which considers key criteria of RES choice: Expert opinions, the costs of obtaining the energy and maintaining energy installations, and the volume of electricity from RES. This article offers a modified multicriteria selection method based on a fuzzy analytic hierarchy process (fuzzy AHP) and the technique for preference by similarity to an ideal solution (TOPSIS), integrated with a qualitative price analysis (ACJ). This new method was tested through a case study on selecting a preferred RES in Polish industrial conditions. The research results indicate that the proposed method of choosing the preferred renewable energy source can be used in industrial enterprises that strive to meet their energy needs in accordance with the principles of social responsibility.
1. Introduction
Climate change and air pollution, which have increased since the start of the fourth industrial revolution (Industry 4.0) [1,2], are among the main threats of the 21st century. From this time on, anthropogenic climate change became increasingly important, with about 90% of it generated by greenhouse gases [3,4,5]. Such changes make it impossible to guarantee a sustainable environment, as well as safe and healthy life for human beings [6,7]. The problem of greenhouse emissions has been analyzed by governments of more than 190 UNFCCC (United Nations Framework Convention on Climate Change) countries [8], with about 60% of world greenhouse emissions coming from energy production [7]. In relation to energy, China is considered the largest consumer, and thus, a major producer of greenhouse gases [9,10,11]. More than 75% of China’s greenhouse gases come from energy consumption based on coal [11]. Another example is greenhouse emissions in Poland, where the total emissions of CO2 comprised about 81% of total greenhouse emissions in 2017 [12]. Although greenhouse gases have been reduced in Poland (for example, CO2 was reduced by around 30% between 1988 and 2017) [13], their quantity is still significant. This results from the fact that the Polish energy sector is still 90% based on coal-burning [14], with mainly industrial power plants generating greenhouse gases. For example, in Poland, the energy industry burns fuel (accounting for about 93% of total CO2 emissions) to create 50% of energy [15]. Climate models are based on the maximum greenhouse gas emissions (mainly CO2), which are predicted to fall in 2020–2030, but their satisfactory reduction will only be achieved in this scenario in 2100 [12]. Reducing greenhouse emissions will require the use of renewable energy sources (RES) [16], e.g., renewable energy in the form of sun, wind, water, biomass, or geothermal energy [7].
In the context of RES, it is important to mention that it has hitherto constituted only 15% of world energy production, and a rise of 30–80% is predicted for 2100 [7,17]. Among the countries leading in the use of renewable energy are Norway, New Zealand, and Iceland, which cover most of their energy demand through RES [7]. For example, in 2018, Norway and Iceland obtained about 73% of their energy from hydropower and geothermal energy. Denmark has achieved a share of RES of about 30% through wind energy (mainly sea energy), and in Norway, solar energy is used. Positive changes are also taking place outside of the EU [18], for example, in Ukraine [19] and Slovakia [20,21]. However, as far as European Union countries (EU) are concerned, one of the key producers of CO2 is Poland, achieving the worst result in the use of RES (11.28% in 2018) [7]. At the same time, Poland has not met its target of 15% RES [7]. Additionally, during the current analysis of the latest available data, it was observed that there is a downward trend in the share of energy from renewable sources in the total final energy demand in Poland in comparison to other EU countries in 2014–2017. In Poland, this share in 2014 was about 8.7%, while for other EU countries, it was about 8.9%. In 2017, the share for Poland was about 8.5%, while for other EU countries, it was about 9.5% [22]. The main reasons why Poland is a major producer of CO2 [23] and did not achieve its energy target for 2020 are the long process of implementing new support systems and the blocked development of some promising technologies, e.g., wind energy [24] and biomass potential [25]. In addition, there is a continuous increase in energy demand in Poland (on average, 0.8% annually), and the biggest demand, excluding households, is from the industrial sector [26], in which the use of nonrenewable fuels still prevails [26]. Therefore, it is necessary to support a process that will contribute to increase the use of RES, mainly in industry, whose demand for energy is greater than that of other sectors (i.e., transport, service, and agriculture) [26,27]. Industrial development must proceed without damaging the environment, so should include RES. This need was also signaled by the authors of [7]. As indicated by the literature review, analyses in a similar context were made, mainly as part of decision-making [28,29,30,31]. Nevertheless, these analyses were not the only coherent method, as all key criteria of RES must be included simultaneously. Additionally, the choice of RES should be carried out in the context of electricity, which has been shown to generate, in particular, greenhouse gases [7,9,10,11,15]. Therefore, the lack of such a method has been shown to constitute a research gap.
Hence, the research aims to develop a method for choosing the preferred RES for industry in the context of electricity, so industrial development would be possible without environmental degradation. The method will allow for choosing the proper RES through all key criteria for RES choice, i.e.,
- (1)
- (2)
- (3)
- (4)
In line with these assumptions, two research hypotheses were created, i.e.,:
Hypothesis 1 (H1).
The simultaneous inclusion of all the key criteria provides the conditions necessary for making an effective RES choice for industry in the electricity context; this choice will support industrial development without destroying the environment.
Hypothesis 2 (H2).
The application as part of the proposed method of the three combined decision-making methods—i.e., fuzzy analytic hierarchy process (fuzzy AHP) and technique for order of preference by similarity to ideal solution (TOPSIS), which were integrated with a qualitative price analysis (ACJ)—ensures an effective RES choice for industry in the electricity context, including all the key criteria; at the same time, it allows for a reduction in ambiguity when assessing the RES by experts.
Although studies have, to date, taken into account the mentioned criteria, they have not integrated these criteria in a consistent and comprehensive manner. In the proposed method, it is possible to combine the key criteria of RES choice and the actual values. For this reason, the rankings of RES choice obtained by this method differ from those published so far. These aspects are the main aspects that conditioned the novelty of the proposed method, and thus, the area for scientific discussion.
The research and testing of the proposed method were carried out as part of a choice of renewable energy sources for use by industry in Poland, as it is considered to be one of the EU countries generating the highest amount of greenhouse gas emissions [7,15,26]. The results presented in the article may be useful in many energy-intensive branches of science and industry, where it is increasingly necessary to simultaneously analyze various risks related to both penalties for greenhouse gas emissions and the process of investing in RES. The presented analysis scheme is applicable to the metal industry, especially alloy production, e.g., as shown by the authors of [38,39], and shown in the machinery industry [40,41,42].
2. Literature Review
The literature review has shown that the choice of RES should reduce costs and maximize energy production [34]. Additionally, the authors of [34] used simulation models and tools to choose the optimal wind farm location. The costs incurred as part of RES were also discussed, for example, by the authors of [32,35]. In Ref. [32], based on survey results from a team of experts, it was shown that one of the most important factors influencing the choice of RES is their cost. In turn, the author of [35] concluded that the costs incurred as part of obtaining energy from renewable sources is constantly growing; therefore, they should not be underestimated. Referring to obtaining energy from RES, it was concluded that this criterion in the process of choice of RES was often included, e.g., by the authors of [35], and also by the authors of [26,33]. For example, the authors of [26] show that the development of technology to obtain energy from RES allows us to produce energy from the wind or sun [43] in similar amounts to hydropower. It was also indicated that the most frequently used energy generation technology among Polish investors is an installation powered by a biomass boiler. It is also important to select an effective method of remote monitoring and control of the RES installation. The authors of [44] proposed a remote monitoring and control system with interfaces and data collectors. This system enables the analysis of centralized energy and CO2 consumption data. In this way, the measurable nature, data transparency, company acceptance, planning, and visibility of renewable energy in industry can be improved. The authors of [45] drew attention to another problem related to the monitoring of the technical conditions of the installation, as well as problems with data transmission resulting from communication disruptions. Based on the IoT communication framework, a fusion algorithm was used to exploit observations from multiple sensors while considering the unpredictable nature of the wireless channel. The authors of [33] conducted a survey aimed at assessing the awareness and attitudes of people about obtaining energy from renewable energy. It was shown that almost every third respondent declared a lack of interest in obtaining energy from RES. Additionally, it is important to return to the previously mentioned production of energy from RES [36], which, as was demonstrated, is also one of the main criteria of RES choice [30,36,37]. For example, the authors of [30] combined methods that were used to produce electricity in Turkey. These methods were Delphi [46], Fuzzy Analytical Hierarchy Process (FAHP) [31,47,48,49,50], and Fuzzy Weighted Aggregated Sum Product Assessment (FWASPAS) [30]. The criteria and subcriteria of the analysis were chosen using the Delphi method, and their evaluation was made using the FAHP method. By the FWASPAS method, the best RES to produce electricity was identified—wind energy. The authors of [37], using artificial neural networks, predicted the RES production volume in Poland until 2025. It was concluded that, in addition to criteria relatively often included in the analysis of RES choice, i.e., the energy obtained from RES [26,33,35], energy production via RES [30,36,37], and costs incurred by using RES [32,35,36], efforts were made to improve the choice of RES in the context of eliminating the ambiguities that occurred while making decisions concerning the choice of the preferred RES. An example is [31], in which the authors used a multistage framework for selecting the most advantageous RES in China by integrating pictorial linguistic fuzzy numbers (PLFN) [51], preference ranking organization methods for the assessment of enrichment II (PROMETHEE II) [52], and perspective theory (PT) [53]. It was shown that the best choice is solar energy, followed by wind, water, and biomass energy. In a similar vein, the authors of [31] proposed a probabilistic set of linguistic terms about interval values (IVPLTS) [54], which was supposed to support the choice of the most favorable RES.
In summary, after the literature review, it was concluded that greenhouse gas emissions, which are a current global problem [8], are mainly generated in the context of electricity [7,9,10,11,15], and the biggest demand for electricity comes from the industry sector [26]. There is a need to support the development of industry without damaging the environment [7,16], mainly by using methods to solve the decision problems [30,31,36,54]. The following criteria have been included: Energy obtained from RES [26,33,35], energy production via RES [30,36,37], and costs incurred by using RES [32,35,36]. Also, the choice of RES was made as part of survey research [32,33,34], after which we used different methods with the aim of eliminating the ambiguities in the responses [31,54].
3. Materials
The testing of the proposed method was done as part of the process of identifying the preferred RES for industry in Poland, so the RES that were analyzed in the context of electricity were solid biofuels, solar energy, hydropower, wind energy, biogas, liquid biofuels, geothermal energy, and renewable municipal waste. The choice was conditioned because electricity is obtained from these RES in Poland [15,22]. These renewable energy sources are described in the literature [27,55]. However, as part of the proposed method, it is possible to analyze any number and type of RES, and the choice depends on the entity using the method.
4. Methods
The proposed method included combined decision-making methods. These methods were among the most commonly used methods of making a multicriteria decision (MCDM): The fuzzy analytic hierarchy process (fuzzy AHP) and technique for order of preference by similarity to ideal solution (TOPSIS) [56,57,58]. These methods were integrated with a qualitative price analysis (ACJ) [1,59,60,61,62,63,64].
The chosen methods, i.e., FAHP and TOPSIS, were conditioned by the fact that these methods are the most commonly used in making multicriteria decisions [47,48,50,57,65,66,67,68]. The ACJ method was chosen, due to the fact that it is relatively simple. In addition, it allows one to make the best choice by taking into account both the quality of the product and its cost. Additionally, it can be integrated with other methods, e.g., methods for calculating product quality, including decision-making methods, such as the AHP method, as indicated by the authors of [1]. In turn, the ability to combine these methods as part of making the best decision was confirmed by the authors of [69,70,71]. However, previous studies were in fields unrelated to energy. The methodology of choosing the preferred RES for industry is shown in Figure 1.
The proposed method included obtaining preference assessments of the RES used in industry in the context of electricity. In accordance with the authors of [31,32,33,54], these assessments will be obtained via survey research. Subsequently, the assessments obtained will be transformed using the FAHP method into so-called RES weights, which will indicate the favored RES to be used in industry in the context of electricity. At this stage, the first key RES choice criterion is considered, i.e., expert opinion [32,33,34]. Next, we combined methods, i.e., FAHP with TOPSIS. At this stage, the results showed the ranking of RES by expert opinion, the actual amount of potential RES electrical resources [26,33,35], and actual amount of energy from RES converted to power [30,36,37]. Therefore, to include prices for meeting the demand for electricity with RES (the fourth key criterion) [32,35,36], it was assumed adequate to integrate this result with a qualitative price analysis (ACJ), which can include the product quality and price simultaneously [1,59,60,61,62,63,64]. The method of their implementation is presented in the remainder of the article and in Figure 2.
4.1. Obtain and Transform Experts’ Assessments
The first stage of the proposed method was to obtain and transform expert assessments about the preference of RES for industry in the context of electricity, where this preference refers to ways to reduce the negative effect of using nonrenewable energy sources in industry. However, it is possible to make expert assessments dependent on other criteria, e.g., social or location. It is necessary to remember that we are only aiming to obtain the weights (importance) of RES. For this reason, RES ratings in relation to various criteria generate different RES weights depending on the criterion against which they were assessed. To obtain the experts’ assessments, following [31,32,33,54], we decided it was effective to conduct a survey.
In this case, a questionnaire was used to obtain the assessment of preferences for RES to be used in the Polish industry in the context of electricity. The survey was conducted in October 2020 in accordance with the adopted assumptions. Because the research was a test of the proposed method, assessments were obtained from a sample of 39 randomly selected experts. Among them were 34 experts from Polish production companies, some of them dealing with photovoltaics, heat pumps, wind turbines, or pellet heating from their own by-production. The remaining respondents, including the authors of this article, are experts, among others in the fields of mechanical engineering and production engineering. In accordance with the authors of [72,73], in this stage of research, this sample can be considered representative. For example, the authors of [72,74,75,76] proved that, as part of the AHP method (and also the FAHP method), the precision of results is achieved even in groups of three experts [76]. In turn, the authors of [73] confirmed that an approach based on AHP is a subjective methodology that allows for data collection and analysis from a small group of experts. A similar conclusion was presented by the author of [74], who confirmed that the AHP method (and thus, also the FAHP) does not require statistical significance for the sample. Another important conclusion of the author of [77] was the proposed combination of the FAHP method with other methods (in the analyzed case, TOPSIS and ACJ). He pointed out that, in such a case, other attributes of the combined methods are not directly compared, and thus, this eliminates the need for a large sample (in extreme cases, it is even possible to obtain correct results for a sample consisting of one expert) [77]. Therefore, it was considered that the sample size is sufficient as a part of the proposed, integrated methods (FAHP, TOPSIS, and ACJ). However, we plan to expand the sample in subsequent studies and verify the results. This is due to the advisability of taking into account factors related to the turbulent economic environment. Additionally, the small sample size limits the possibility of generalizing results [73].
The survey was made in simplified form (Table 1), but it is possible to use a questionnaire for obtaining expert assessments, which is applicable in the FAHP method [78,79].
We adopted Saaty’s preferred nine-point rating scale for the survey (Table 2).
However, it is possible to use other scales, e.g., 1–5 or 1–7, where the choice depends on the entity performing the research [1]. In accordance with the methodology described by the authors of [47], it was assumed that ambiguities in assessments could be reduced by transforming the assessments expressed in the classic Saaty scale into triangular fuzzy numbers. In the case of a large sample, it is possible to use formulas in a calculation program, e.g., Excel. With this aim, it is necessary to enter all the survey data into the calculation program sheet and create a table that contains the assessments in a classical Saaty scale and triangular fuzzy numbers. Then, it is necessary to use a function, e.g., vertical search, that will attribute each assessment in the classical Saaty scale a triangular fuzzy number. After transforming all expert assessments obtained from the survey, it is possible to use these assessments to estimate the weights of RES, which are shown in the next stage of the proposed method.
4.2. Using the FAHP Method
As part of the second stage of the proposed method, we used the fuzzy AHP method. The aim was to estimate, based on the results of the survey research, the weights of RES chosen to analyze. These weights, as part of the FAHP method, are defined by the values of a normalized, nonfuzzy vector of weight. This process includes six main steps.
4.2.1. Development of the Combined Matrix
In the first step, expert assessments (obtained from the survey in Section 4.1), transformed into triangular fuzzy numbers, should be summarized in a decision matrix, which is the so-called combined matrix. With this aim, and in accordance with the proposition made by the authors of [47], an algorithm should be used for the conversion of language variables (Equation (1)):
where:
= the value obtained after multiple comparisons of the opinions of experts in relation to the ith assessing element and the jth assessing element;
= the Tth expert.
After developing the combined matrix, it is possible to create a fuzzy matrix of pairwise comparisons.
4.2.2. Create the Fuzzy Matrix of Pairwise Comparisons
Then, as part of the second step, a fuzzy matrix of pairwise comparisons is created, , which refers to ambiguities that arose during assessments of the RES by experts [47,48,80]. This step consists of writing the triangular fuzzy numbers in the matrix of pairwise comparisons, i.e., A = [aij] (2) [47]:
Then, on the diagonal, there are always values equal to 1 (i.e., in triangular fuzzy numbers, it is 1.1.1), while above the diagonal are values of pairwise comparisons, and under the diagonal, there are reciprocal values [1]. Then, it is necessary to calculate the relative fuzzy weight values, which is shown in the next step.
4.2.3. Calculation of the Relative Fuzzy Weight Values
4.2.4. Calculation of the Possibility Degree
In this step, it is necessary to calculate the possibility that fuzzy number is greater than or equal to the fuzzy number using Equation (4) [48,80]:
where and are two fuzzy numbers. In turn, is the degree of affiliation d to (Figure 3).
Subsequently, it is necessary to determine the least possible degree, as shown in the next step.
4.2.5. Determine the Least Possible Degree
Next, to determine the least possible degree, i.e., fuzzy number relative to all other fuzzy numbers , it is necessary to use Equation (5) [48,80]:
After determining the least possible degree of fuzzy number relative to all other fuzzy numbers, it is necessary to complete the next step.
4.2.6. Calculation of the Weight Vector and Normalized Nonfuzzy Weight Vector
Subsequently, the aim is the calculation of weight vector and normalized nonfuzzy weight vector . The weight vector is determined by all the least possible degrees (n), which were appointed in Section 4.2.5. Therefore, the weight vector is determined as in Equation (6) [48,49]:
Next, to calculate the normalized nonfuzzy weight vector, it is necessary to add up all the least possible degrees using Equation (7) [48]:
Then, it is possible to compute the normalized nonfuzzy weight vector using Equation (8) [48]:
The values of the normalized, nonfuzzy weight vector create the weight ranking of expert opinions about preferred RES for use in industry. The maximum value is the maximum weight, which indicates the preferred RES, and the minimum value is the minimum weight, hence the least preferred RES. Therefore, to include other key criteria, it is necessary to integrate the obtained values of a normalized, nonfuzzy weight vector with the actual values of energy production from RES and with the amount of potential RES electrical resource. For this purpose, the TOPSIS method was used, as discussed in Section 4.3.
4.3. Using the TOPSIS Method
The analyzed problem is a decision problem dependent on different alternatives (RES) and different criteria (i.e., weights of RES, actual values of electricity production from RES, and amount of potential RES electrical resource), which are shown as real number values (obtained and produced). It is adequate to use the TOPSIS method. This method is preferred for decision-making [47,48,50,57,65,66], and is effective when combined with the FAHP method [69,70,71]. This process is realized in six steps.
4.3.1. Construction of the Decision Matrix and Adopting RES Weights
Initially, a decision matrix was created, which included actual values of RES choice criteria (i.e., amount of potential RES electrical resource and electricity production from RES). In accordance with [57], it was assumed that a decision matrix is determined as X and has the form in Equation (9) [50,57]:
where:
, and = actual value of production or obtained electricity from RES.
Then, it is necessary to calculate the normalized decision matrix, as shown in the next step.
4.3.2. Calculation of the Normalized Decision Matrix
It is possible to calculate the normalized decision matrix, which is indispensable when analyzing different criteria (also with different units of measurement). In the analyzed case, such a situation occurred because the values of electricity production from RES were expressed in GWh, and the values of potential RES electrical resource were expressed as percentages. Therefore, it was necessary to normalize the results [57].
Hence, the values from the decision matrix were transformed into a normalized scale, creating a normalized decision matrix. In accordance with the authors of [57,65,66], the calculation of the normalized decision matrix (nij) was performed using Equation (10):
After calculating the normalized decision matrix, it is necessary to calculation of the weighted normalized decision matrix.
4.3.3. Calculation of the Weighted Normalized Decision Matrix
Subsequently, the weighted normalized decision matrix was calculated () by Equation (11) [57,65,66]:
.
Next, the positive ideal and negative ideal solutions were determined, as shown in next step.
4.3.4. Determining the Positive Ideal and Negative Ideal Solutions
With this step a positive ideal solution () and a negative ideal solution were determined () in accordance with Equations (12–13) [57,65,66]:
where I concerns the benefit criteria, J concerns cost criteria, i = 1, …, m; and j = 1, …, n.
Therefore, the positive ideal solution concerns the maximum of results in each analyzed criterion, maximizing benefits and minimizing costs. In turn, the negative ideal solution concerns the minimum results in all the analyzed criteria, maximizing costs and minimizing benefits. The function criteria can be beneficial functions, i.e., more is better, or the cost functions, i.e., less is better [57].
In the analyzed case, in accordance with the drive toward sustainability [1,81,82], it was assumed that the values of production and the amount of potential RES electrical resource are determined by the benefit function, so more electricity production from RES is better, and also, a greater amount of potential RES electrical resource is better.
After determining the positive and negative ideal solutions, it is necessary to calculate the separation measures.
4.3.5. Calculation of the Separation Measures
In accordance with the TOPSIS method [83], in this step the separation measures are calculated from the positive ideal solution ( and the negative ideal solution (). With this aim, the n-dimensional Euclidean distance is calculated, which is expressed by Equations (14)–(15) [57,65,66]:
Subsequently, it is necessary to calculate the relative proximity to the positive ideal solution.
4.3.6. Calculation of the Relative Proximity to the Positive Ideal Solution
In this step, we calculated the relative proximity to the positive ideal solution, which means the relative proximity of alternative with estimates to by Equation (16) [57,65,66]:
where j = 1, …, n, since .
Then, it is possible to organize the obtained results, which at the same time, organizes the RES from the most preferred to the least preferred one for use in industry. However, in this stage, these preferences included three key criteria of RES choice, i.e., expert opinion, actual values of potential RES electrical resource, and actual values of electricity from RES converted to power. Therefore, to include the price of meeting the demand for electricity with RES, it is necessary to integrate the combined methods (FAHP and TOPSIS) with a qualitative price analysis (ACJ). This integration is presented in Section 4.4.
4.4. Using the Qualitative Price Analysis (ACJ)
The fourth step of the proposed method includes use Quality Prices Analysis (ACJ), to determine the preferred RES for industry in the context of electricity. This choice will include all four key criteria of RES choice [1,59,60,61,62,63,64]. The process is presented in 10 steps, and starts with the estimation of the average (annual) cost of meeting the demand for electricity with RES.
4.4.1. Estimate of the Average (Annual) Cost of Meeting the Demand for Electricity with RES
In the first step, for all the analyzed RES, it is necessary to estimate the average (annual) costs of meeting the demand for electricity with RES. Therefore, initially, it is necessary to establish, e.g., reference costs of electricity from RES for all the analyzed RES. The average industrial prices should be used because electricity prices may be significantly lower for industrial customers than residential and commercial/public sector customers. Similarly, the average annual consumption of electricity from RES sources should be the average consumption of industrial users only. In the analyzed case, these costs were obtained from the current regulation of the Minister of Climate of 24 April 2020 on the reference cost of electricity from renewable energy sources in 2020 and the periods applicable to producers who won auctions in 2020 [84]. The values of demand for electricity from RES are based on, for example, forecast data or data about the average consumption of electricity from renewable energy sources. In this case, they were based on currently available data on the average consumption of electricity from RES in Poland, obtained from a reliable source, i.e., the Central Statistical Office [22].
Having established costs ( and the average annual consumption of electricity from renewable energy sources , it is possible to estimate the average costs of meeting the demand for electricity with RES, which is determined by Equation (17):
where:
Pj = the reference cost of electricity from RES (MWh/year)
Cj = the amount of average annual consumption of electricity from RES (MWh/year)
j = renewable energy source; j = 1, 2, …, n.
Because the average consumption of electricity was expressed in terajoules (TJ), this amount was presented in megawatt-hours (MWh), where:
where:
TJ = terajoule,
MWh = megawatt-hour.
Therefore, the average cost of meeting the demand for electricity with RES is estimated as MWh/year. After estimating the average costs of all RES, it is possible to convert the value of relative proximity of the positive ideal solution.
4.4.2. Conversion of the Value of Relative Proximity of the Positive Ideal Solution
As part of a qualitative price analysis (ACJ), it is necessary to establish the so-called product quality. This is the value of the relative proximity of the positive ideal solution (calculated in Section 4.3.6). Therefore, as part of the ACJ, the values of the relative proximity of the positive ideal solution should be converted to percentages as follows:
where:
Rj = the relative proximity of the positive ideal solution (calculated in Section 4.3.6),
j = renewable energy source, and j = 1, …, n.
Then it is possible to proceed to the calculation of the cost–quality index.
4.4.3. Calculation of the Cost–Quality Index
The index of the cost (cp) determines the cost of one percent of product quality, where the higher the index value, the better the product. As adopted, this index refers to the average costs of meeting the demand for electricity with RES (calculated in Section 4.4.1) and the relative proximity of the positive ideal solution (calculated in Section 4.4.2). Therefore, in accordance with [1,59,60,61,62,63,64], calculation of the cost–quality index is determined by Equation (20):
where:
Dj = the average costs of meeting the demand for electricity with RES (MWh/year),
= the product quality, so the relative proximity of the positive ideal solution (%),
j = renewable energy source; j = 1, …, n.
Then, it is necessary to calculate the relative cost, as shown in the next step.
4.4.4. Calculation of the Relative Cost
In accordance with [1,59,60,61,62,63,64], the calculation of the relative cost (p) is realized by Equation (21):
where:
Dj = the average cost of meeting the demand for electricity with RES (MWh/year),
Dmax = the maximum average cost of meeting the demand for electricity with RES (MWh/year),
Dmin = the minimum average cost of meeting the demand for electricity with RES (MWh/year),
and j = renewable energy source; j = 1, …, n.
Then, it is possible to calculate the cost–quality proportionality index.
4.4.5. Calculation of the Cost–Quality Proportionality Index
To calculate the cost–quality proportionality index, it is necessary to calculate the quotient of the relative cost and product quality, which is expressed as a decimal. Therefore, in accordance with the research concept, the decimal of product quality is equivalent to the value of the relative proximity of the positive ideal solution (Rj). Then, the formula for calculating the cost–quality proportionality index takes the form of Equation (22) [1,59,60,61,62,63,64]:
where:
pj = relative cost (calculated in Section 4.4.4.) (MWh/year),
Rj = the relative proximity of the positive ideal solution (calculated in Section 4.3.6),
and j = renewable energy source; j = 1, …, n.
Then we proceeded to calculate the decision interpretation index in the next step.
4.4.6. Calculation of the Decision Interpretation Index
In accordance with [1,59,60,61,62,63,64], it was necessary to calculate the decision interpretation index using Equations (23–24):
where:
ej = the cost–quality proportionality index (calculated in Section 4.4.5) (MWh/year),
and j = renewable energy source; j = 1, …, n.
Based on Kolman’s assumptions [1,59,60,61,62,63,64], the verbal interpretation of the decision interpretation index values (dj) for values of the cost–quality proportionality index (e) is shown in Figure 4.
In accordance with the ACJ methodology [1,59,60,61,62,63,64], it was assumed that the values of the cost–quality proportionality index (ej) in a coordinate system (p − q) are values of the decision function:
where angle δ is considered to be the accuracy angle.
After calculating the decision interpretation index for each of the analyzed RES, it is possible to calculate the relative cost index.
4.4.7. Calculation of the Relative Cost Index
To calculate the relative cost index, it is necessary to determine the maximum ( and minimum index of relative cost from all cost–quality indexes (calculated in Section 4.4.3). Then, it is possible to calculate the relative cost index with Equation (26) [1,59,60,61,62,63,64]:
where:
= the maximum index of relative cost from all cost–quality indexes,
= the minimum index of relative cost from all cost–quality indexes,
= the cost–quality index,
j = renewable energy source; j = 1, …, n.
Then we proceeded to calculate the settlement index for technical preference, as shown in the next step.
4.4.8. Calculation of the Settlement Index for Technical Preference
In order to calculate the settlement index for technical preference , according to the creator of the ACJ method [1,59,60,61,62,63,64], it is necessary to adopt dependence:
where:
Rj = the quality product, so the relative proximity to the positive ideal solution (calculated in Section 4.3.6),
dj = the decision interpretation index (calculated in 3.4.6 step),
cj = the relative cost index (calculated in 4.4.7. step),
= the importance factors to be substituted into Equation (28),
j = renewable energy source; j = 1, …, n.
In accordance with the author of the ACJ method [1,59,60,61,62,63,64], the importance coefficients should be substituted into Equation (28):
Then, Equation (27) for the settlement index for technical preference has the form [1,59,60,61,62,63,64]:
where:
Rj, dj, cj, j = as for Equation (27), and j = 1, …, n.
Based on the adopted proportions, the settlement index for economic preference was calculated.
4.4.9. Calculation of the Settlement Index for Economic Preference
As part of the calculation of the settlement index for economic preference (re), in accordance with [1,59,60,61,62,63,64], it is necessary to use Equation (30):
where:
Rj = the product quality, i.e., the relative proximity to the positive ideal solution (calculated in Section 4.3.6),
dj = the decision interpretation index (calculated in Section 4.4.6),
cj = the relative cost index (calculated in Section 4.4.7),
= the importance factors to be substituted into Equation (28),
j = renewable energy source; j = 1, …, n.
In this case, the indexes of importance are synonymous with the coefficients of the index of technical preference, so they are equal [1,59,60,61,62,63,64]:
Then, Equation (30) for the settlement index for economic preference has the form [1,59,60,61,62,63,64]:
where:
Rj, dj, cj, j—as for Equation (30); and j = 1, …, n.
Then, it is necessary to calculate the decision settlement index.
4.4.10. Calculation of the Decision Settlement Index
In order to verify the results, it is necessary to calculate the decision settlement index (rd), which is presented by Equation (33) [1,59,60,61,62,63,64]:
where:
= the settlement index for technical preference (calculated in Section 4.4.8),
= the settlement index for economic preference (calculated in Section 4.4.9),
j = renewable energy sources, and j = 1, …, n.
Owing to the decision settlement index, it is possible to verbally interpret decisions in accordance with the unity scale of relative states [1,59,60,61,62,63,64], which is presented in Section 4.4.6 and Figure 2. The values of the obtained decision settlement ratios should be organized by creating a preference ranking, where a higher is more favorable, as indicated in Section 4.5.
4.5. Determination of RES Preferences for Use in Industry in the Context of Electricity
The last step is the determination of RES preferences for use in industry in the context of electricity. This step is realized based on the results of the decision settlement index (Section 4.4.10), which should be sorted in descending order. The maximum value is the first position in the ranking, which is the preferred RES for use in industry in the context of electricity. By contrast, the minimum value is the last position in the ranking, which is the least preferred RES for use in industry in the context of electricity. Additionally, in the context of the proposed method, a global sensitivity analysis was performed using Statistica 13.3.
5. Results
5.1. Obtain and Transform Experts’ Assessments
The collective results of the respondents’ assessments from the survey are presented in Table 3.
Then, in accordance with the proposed method, the ambiguity in expert assessments was reduced by transforming the assessments from a classical Saaty scale to triangular fuzzy numbers. The function “vertically search” of the Excel calculation program was used for this.
5.2. Using the FAHP Method
Subsequently, using the algorithm by converting language variables, the transformed assessments have been combined into one decision matrix, which is the so-called combined matrix (Table 4).
Based on the combined matrix, a fuzzy matrix of pairwise comparisons was created, which is presented in Table 5.
Then, the relative fuzzy weight values were calculated as a part of the normalization of the average in the row, because it was necessary to obtain the fuzzy weight values from the fuzzy comparison matrix. With this aim, the sum of values from each row of fuzzy comparison matrix was calculated, and the sum achieved from values in rows was normalized by calculation of fuzzy numbers. The results from the calculation are shown in Table 6.
After computing the relative weights, calculations were performed to determine the degree of the possibility that the fuzzy number is greater than or equal to the fuzzy number and the smallest degree of the fuzzy number relative to all other fuzzy numbers. The results are shown in Table 7.
Then, in accordance with the accepted procedure and based on the results, the weight vector and normalized nonfuzzy weight vector were determined:
The sum of all the lowest possible degrees was:
Therefore, the normalized nonfuzzy weight vector was:
Normalized nonfuzzy weight vector values were ordered to create the ranking of RES preferred in the Polish industry in the context of electricity. It is shown in Table 8.
At this stage, it was shown that, according to expert opinion, the preferred RES in the Polish industry is solar energy, which came first in the ranking (with a weight of 0.17). In second place was solid biofuels, which had a slightly lower weight, i.e., 0.15. However, in order to include other key criteria, the TOPSIS method was used.
5.3. Using the TOPSIS Method
Initially, a decision matrix was created considering the actual values of key criteria of RES choice (Table 9).
In the analyzed case, the volumes of electricity from RES converted to power, and the amount of potential RES electrical resource in the context of electricity were expressed in different measurement units (i.e., GWh and %). Therefore, the normalized decision matrix was created in accordance with step 4.3.2 of the proposed method (Table 10).
Then, the weighted normalized decision matrix was calculated, and the positive ideal () and negative ideal solutions () were determined (Table 11).
Next, by using Equations (14–16), the separation measures and the relative proximity to the positive ideal solution (Rj) were calculated. After making calculations, the obtained results were ordered to create a preference ranking (Table 12).
At this stage, it was possible to conclude that solid biofuels are preferred in the Polish industry in the context of electricity (i.e., first place in the rankings, Rj = 0.83). Other RES have much smaller values of Rj, so solid biofuels are clearly the best. The choice of solid biofuels was supported by expert opinion, the amount of potential RES electrical resource, and the amount of potential RES electrical resource converted to power. Then, to determine the price of meeting the demand for electricity with RES, it was necessary to integrate the combined methods (FAHP and TOPSIS) with a qualitative price analysis (ACJ).
5.4. Using the Qualitative Price Analysis (ACJ)
In this stage, it was necessary to estimate the average (annual) cost of meeting the demand for electricity with RES in Poland for all analyzed RES (as shown in step 4.4.1.). Based on established costs ( and the volume of average annual electricity consumption from RES, the average cost of meeting the demand for electricity with RES in Poland were estimated (Table 13). These costs were estimated in MWh/year (according to Section 4.4.1), but it is possible to present values in TJ/year, as shown in Table 13.
Then, as part of the ACJ method (Section 4.4), the product was assumed to be RES, and the mentioned quality product is the value of relative closeness to the positive ideal solution. Therefore, the values of relative closeness to the positive ideal solution were transformed into percentage values (according to Equation (19)). Next, in accordance with the method (Section 4.4.3, Section 4.4.4, Section 4.4.5, Section 4.4.6, Section 4.4.7, Section 4.4.8, Section 4.4.9 and Section 4.4.10), we made a calculation for each analyzed RES (Table 14).
The obtained results were ordered from maximum to minimum based on the values of the decision settlement index (rd). The maximum value (first position in the rankings) was achieved by solid biofuels. This renewable energy source has an rd value of 0.87. This means that solid biofuels are preferred for Polish industry in the context of electricity. Second place in the ranking was achieved by wind energy (rd = 0.65), so the choice of this RES is a satisfactory decision. The following RES in the ranking were: Biogas (rd = 0.37—unsatisfactory decision), solar energy (rd = 0.34—unsatisfactory decision), liquid biofuels (rd = 0.34—unsatisfactory decision), renewable municipal waste (rd = 0.32—unsatisfactory decision), hydropower (rd = 0.08—bad decision), and geothermal energy (rd = 0.00—bad decision).
5.5. Determination of RES Preferences for Use in Industry in the Context of Electricity
According to the results obtained from the proposed method (i.e., combined FAHP and TOPSIS, integrated with ACJ), solid biofuels are preferred for Polish industry in the context of electricity (rd = 0.87). Solid biofuels can support the development of industry without environmental degradation (Table 15).
After comparing the results obtained for each step of the research, it was concluded that the solid biofuels in each case were one of the preferred RES. Although solar energy, according to expert opinion, was the most advantageous, the values of obtained and produced energy from this RES were not satisfactory in comparison to other RES (i.e., it had the sixth position in the ranking). At the same time, it resulted in a lower position of this RES after taking into account the reference prices (fourth position in the ranking), which were not so high compared to other RES. Additionally, the ranking for biogas and liquid biofuels was relatively unchanged (i.e., third and fourth positions).
Additionally, as part of evaluating the influence of the analyzed criteria on the choice of RES, a sensitivity analysis of the proposed method was performed, and its results are given in the next section.
6. Discussion
The research and testing of the proposed method were carried out as part of the choice of RES preferred for use in industry in Poland, because the country is considered to be one of the EU countries generating the highest amount of greenhouse gas emissions [7,15,26]. After an analysis, it was concluded that solid biofuels are preferred for Polish industry in the context of electricity, and solid biofuels can support the development of industry without environmental degradation. It is important to mention that the preference ranking of RES use in industry in the context of electricity can be different, and its results are influence by values of criteria of RES choice, for example, (such as values of production energy, values of the amount of potential RES electrical resource, or costs). In addition, depending on the needs of the entity applying the method, it is possible to take into account other RES choice criteria, e.g., RES location [36]. Therefore, to analyze the effectiveness of the proposed method, the global sensitivity analysis was performed. This analysis was carried out using Statistica 13.3 [85,86].
The purpose of the sensitivity analysis was to determine postfactum whether, in the proposed method, it was reasonable to take into account all the key criteria for the choice of RES (i.e., the input variables). Also, the motivation for performing a sensitivity analysis of the proposed method was to consider which of the key criteria of RES choice had the largest or smallest influence on the RES choice. In order to perform a sensitivity analysis of the proposed method with the use of Statistica, a neural network model was built. Then, the key criteria of RES choice were adopted as input (explanatory) variables. At the same time, taking into account the weights of RES in the context of preferences for their use in industry, this variable was included as the value of the normalized nonfuzzy RES weight vector.
In turn, the output variable (explained) was the decision settlement index (rd), based on which we could determine the preferred RES for industry in the context of electricity.
According to the author of [85], these variables have a nonlinear character; therefore, it was a regression problem. There were four neurons in the input layer subjected to network analysis (i.e., number of input variables). It was assumed that these variables have an influence on the output variable (i.e., the decision settlement index), which was one neuron at the outlet of the network. A simplified diagram of the method of processing the input variables into the output variable by the artificial neural network is presented in Figure 5.
In order to carry out the sensitivity analysis of the proposed method, the selected input and output variables were quantitative variables that were equivalent to the values obtained from research about the preferred RES for use in the Polish industry in the context of electricity. The set of data, with input variables and output variables (i.e., decision settlement index rd) that were used as part of the sensitivity analysis, is shown in Table 16.
The sensitivity analysis was performed with the use of advanced and multidimensional tools of Statistica, i.e., neural networks (for regression analysis). Therefore, the model was created by the random sampling method as part of multisampling. In order to increase the network’s ability to generalize data, according to the author of [85], the training set was divided into a training sample (70%), test sample (15%), and validation sample (15%), and the initial generator value was 1000. The choice of the final neural network consisted of multiple tests for different models—for example, of the number of neurons in the hidden layer or the type of activation function. As a result, the multilayer perceptron (MLP) network was selected [85]. It was an MLP 4-4-1 network, characterized by four input neurons, four hidden layer neurons, and one network output neuron. This network was characterized by 90% of the quality of learning. For the constructed neural network, a global sensitivity analysis was performed, and the results are presented in Table 17.
It was shown that all the key criteria of RES choice obtained a global value of sensitivity analysis above 1, so these criteria have a significant impact on the preferred RES for industry in the context of electricity [85]. The highest impact was shown for the first criterion (i.e., expert opinion), based on which the RES weights were determined. The lowest impact was shown for the fourth criterion, the average prices of meeting the demand for electricity with RES (but this criterion still has a significant impact on RES choice because its value is above 1). Owing to this, the research hypotheses were confirmed. However, the MCDM methods are created for dealing with many variables, both qualitative and quantitative, and it is possible to implement in this proposed method other criteria that will be important during the choice of RES, e.g., localization of RES.
The benefit of using the proposed method to support the choice of RES for industry in the context of electricity is that it acknowledges the process of RES choice is part of a single, coherent method. The choice of RES by this method allows for simultaneous consideration of all the key criteria [26,30,32,33,34,35,36,37]. Additionally, the proposed method allows for a reduction of the ambiguity in expert assessments as a part of transforming these assessments into a classical Saaty scale with triangular fuzzy numbers, which are more effective than a traditional scale, e.g., the Likert scale [87]. Moreover, an advantage of the proposed method is the possibility of analyzing actual values of potential RES electrical resource and actual values of electricity from RES converted to power (by the TOPSIS method), as is the possibility of analyzing the actual price of meeting the demand for electricity with RES (by the ACJ method). Therefore, this method could fill an identified research gap—the lack of a single, coherent method, including all the key criteria of RES choice [26,30,32,33,34,35,36,37]. Thus, it would support the development of industry without environmental degradation. This method would best be implemented in commercial software packages, for example, in R software [88], Expert Choice software [78,89], Super Decisions software [77], or the PyTOPS tool [90]. Implementation in commercial software packages would be a practical way for people, such as consultants, to use the method. The planned implementation of the method will be a topic for future research.
The drawback of the proposed method is that the results can vary over time because they are dependent on the actual amount of electricity obtained and produced from RES, as well as the price of meeting the demand for electricity with RES. Additionally, the key criteria of RES selected can be different over time, because a turbulent environment can cause them to change.
Additionally, it is important to mention that, based on our literature review, we did not identify studies whose results could be compared with the results obtained here. This is due to a lack of publications in which rankings were obtained after the integration of all the indicated key criteria. However, it is important to make a comparison with other, traditional techniques. Therefore, the problems connected with a diversified approach to methodology and the resulting differences in rankings are an important topic for future research.
7. Conclusions
The selection of RES preferred in industry in the context of electricity can be realized as part of supporting a process of industrial development without damaging the environment. It was achieved by using the proposed method, which allowed for RES choice, taking into account the key criteria (i.e., expert opinion, electricity obtained from RES, electricity produced by RES, price of meeting the demand for electricity with RES). These criteria concern RES, of which electricity is the largest producer of greenhouse gases and is in greatest demand from industry. In this context, a low environmental impact is understood as the use of renewable energy sources in industry instead of nonrenewable sources. It was shown that this is possible using our method, which was based on combined decision-making methods—FAHP and TOPSIS, integrated with a qualitative price analysis (ACJ). As part of the test of the proposed method, an analysis was made in the context of Poland, a key producer of greenhouse gases.
Therefore, using the FAHP method, the RES weights were determined, which were established based on assessments of RES preference for industry in the context of electricity. These assessments were obtained from 39 randomly selected experts (among them were 34 experts from Polish production companies, and some of the surveyed companies produced photovoltaics, heat pumps, wind turbines, or pellet heating). After analysis by the FAHP method, it was shown that solar energy (weight: 0.17) is the preferred RES for industry in the context of electricity. However, this choice included only one key criterion (i.e., expert opinion). Therefore, using the TOPSIS method, obtained weights were combined with actual values of the amount of potential RES electrical resource in Poland, and actual values of electricity from RES converted to power in Poland, in the context of electricity. These values were obtained from a reliable source, i.e., the Central Statistical Office. This combination made it possible to indicate that solid biofuels (Rj = 0.83) are the preferred RES for Polish industry in the context of electricity. However, these preferences included three key criteria of RES choice, i.e., expert opinion, actual values of the amount of potential RES electrical resource, and actual values of electricity from RES converted to power. Therefore, to include the price of meeting the demand for electricity with RES, it was necessary to integrate the combined methods (FAHP and TOPSIS) with a qualitative price analysis (ACJ). As a result, solid biofuels were shown to be the preferred RES for Polish industry in the context of electricity, a clear decision (rd = 0.87). As part of a global sensitivity analysis, it was shown that this method is effective for RES choice for industry in the context of electricity. This decision includes all key criteria, i.e., expert opinion, actual values of potential RES electrical resource, actual values of electricity from RES converted to power, and the price of meeting the demand for electricity with RES.
The test of the proposed method made it possible to demonstrate its effectiveness, the purpose of which is to support the choice of preferred RES for industry in the context of electricity. This method also fills the research gap about a single consistent method, which considers the key criteria for RES choice. Therefore, the proposed method can be used, for example, by production companies that strive to develop without degrading the environment, and thus, consider the practice of renewable energy in the context of electricity.
Author Contributions
Conceptualization, R.U., D.S. and A.P.; methodology, R.U. and D.S.; software, D.S. and A.P.; formal analysis, D.S. and R.U.; investigation, A.P. and D.S.; resources, D.S., J.B., M.T., A.P. and R.U.; data curation, D.S., M.T. and A.P.; writing—original draft preparation, D.S., R.U., A.P., J.B. and M.T.; writing—review and editing, D.S. and R.U.; visualization, D.S.; supervision, A.P. and D.S.; project administration, D.S. and R.U.; funding acquisition, R.U. All authors have read and agreed to the published version of the manuscript.
Funding
Research and publication financed from the statutory research fund of Czestochowa University of Technology SPB-600/3016/2021.
Institutional Review Board Statement
Not applicable.
Informed Consent Statement
Not applicable.
Data Availability Statement
Not applicable.
Conflicts of Interest
The authors declare no conflict of interest.
References
- Pacana, A.; Siwiec, D.; Bednárová, L. Method of Choice: A Fluorescent Penetrant Taking into Account Sustainability Criteria. Sustainability 2020, 12, 5854. [Google Scholar] [CrossRef]
- Bukosa, B.; Deutscher, N.M.; Fisher, J.A.; Kubistin, D.; Paton-Walsh, C.; Griffith, D.W.T. Simultaneous shipborne measurements of CO2, CH4 and CO and their application to improving greenhouse-gas flux estimates in Australia. Atmos. Chem. Phys. Discuss. 2019, 19, 7055–7072. [Google Scholar] [CrossRef] [Green Version]
- Wu, B.; Mu, C. Effects on Greenhouse Gas (CH4, CO2, N2O) Emissions of Conversion from Over-Mature Forest to Secondary Forest and Korean Pine Plantation in Northeast China. Forests 2019, 10, 788. [Google Scholar] [CrossRef] [Green Version]
- Uprety, S.; Cao, C. Radiometric Comparison of 1.6-μm CO2 Absorption Band of Greenhouse Gases Observing Satellite (GOSAT) TANSO-FTS with Suomi-NPP VIIRS SWIR Band. J. Atmos. Ocean. Technol. 2016, 33, 1443–1453. [Google Scholar] [CrossRef]
- Liebermann, R.; Breuer, L.; Houska, T.; Kraus, D.; Moser, G.; Kraft, P. Simulating Long-Term Development of Greenhouse Gas Emissions, Plant Biomass, and Soil Moisture of a Temperate Grassland Ecosystem under Elevated Atmospheric CO2. Agronomy 2019, 10, 50. [Google Scholar] [CrossRef] [Green Version]
- Adiaha, M.S.; Buba, A.H.; Tangban, E.E. Mitigating Global Greenhouse Gas Emission: The Role of Trees as a Clean Mechanism For CO2 Sequestration. J. Agric. Sci. Sri Lanka 2020, 15, 101. [Google Scholar] [CrossRef] [Green Version]
- Liczmańska-Kopcewicz, K.; Pypłacz, P.; Wiśniewska, A. Resonance of Investments in Renewable Energy Sources in Industrial Enterprises in the Food Industry. Energies 2020, 13, 4285. [Google Scholar] [CrossRef]
- Wamsler, C.; Schäpke, N.; Fraude, C.; Stasiak, D.; Bruhn, T.; Lawrence, M.; Schroeder, H.; Mundaca, L. Enabling new mindsets and transformative skills for negotiating and activating climate action: Lessons from UNFCCC conferences of the parties. Environ. Sci. Policy 2020, 112, 227–235. [Google Scholar] [CrossRef] [PubMed]
- Lin, J.; Khanna, N.; Liu, X.; Teng, F.; Wang, X. China’s Non-CO2 Greenhouse Gas Emissions: Future Trajectories and Mitigation Options and Potential. Sci. Rep. 2019, 9, 1–10. [Google Scholar] [CrossRef]
- Zhang, B.; Zhang, Y.; Zhao, X.; Meng, J. Non-CO2 Greenhouse Gas Emissions in China 2012: Inventory and Supply Chain Analysis. Earth’s Futur. 2018, 6, 103–116. [Google Scholar] [CrossRef] [Green Version]
- Liu, X. A Grey Neural Network and Input-Output Combined Forecasting Model and Its Application in Primary Energy Related CO2 Emissions Estimation by Sector in China. Energy Proc. 2013, 36, 815–824. [Google Scholar] [CrossRef] [Green Version]
- Stan Środowiska w Polsce Raport 2018. Główny Inspektorat Ochrony Środowiska, Biblioteka Monitoringu Środowiska, Inspekcja Ochrony Środowiska, Warszawa. 2018. Available online: https://www.gios.gov.pl/images/dokumenty/pms/raporty/Stan_srodowiska_w_Polsce-Raport_2018.pdf (accessed on 17 October 2020).
- Krajowy Raport Inwentaryzacyjny. Available online: https://www.kobize.pl/uploads/materialy/materialy_do_pobrania/krajowa_inwentaryzacja_emisji/NIR_2018_raport_syntetyczny_PL.pdf (accessed on 20 December 2020).
- Węgiel Zabija. Analiza Kosztów Zdrowotnych Emisji Zanieczyszczeń z Polskiego Sektora Energetycznego. Greenpeace. 2013. Available online: https://www.banktrack.org/download/greenpeace_wegiel_zabija_report/raportgp_wegiel_zabija.pdf (accessed on 17 October 2020).
- Environment. Statistic Poland, Warsaw. 2019. Available online: https://stat.gov.pl (accessed on 20 April 2020).
- Owusu, P.A.; Asumadu-Sarkodie, S. A review of renewable energy sources, sustainability issues and climate change mitigation. Cogent Eng. 2016, 3, 1–14. [Google Scholar] [CrossRef]
- Fridleifsson, I.B. Geothermal energy for the benefit of the people. Renew. Sustain. Energy Rev. 2001, 5, 299–312. [Google Scholar] [CrossRef] [Green Version]
- Tutak, M.; Brodny, J.; Siwiec, D.; Ulewicz, R.; Bindzár, P. Studying the Level of Sustainable Energy Development of the European Union Countries and Their Similarity Based on the Economic and Demographic Potential. Energies 2020, 13, 6643. [Google Scholar] [CrossRef]
- Sabishchenko, O.; Rębilas, R.; Sczygiol, N.; Urbański, M. Ukraine Energy Sector Management Using Hybrid Renewable Energy Systems. Energies 2020, 13, 1776. [Google Scholar] [CrossRef] [Green Version]
- Mikita, M.; Kolcun, M.; Spes, M.; Vojtek, M.; Ivančák, M. Impact of electrical power load time management at sizing and cost of hybrid renewable power system. Pol. J. Manag. Stud. 2017, 15, 154–162. [Google Scholar] [CrossRef]
- Janekova, J.; Fabianova, J.; Rosova, A. Environmental and economic aspects in decision making of the investment project “wind park”. Pol. J. Manag. Stud. 2016, 13, 90–100. [Google Scholar] [CrossRef]
- Energy from Renewable Sources in 2018. Statistics Poland, Warsaw. 2019. Available online: https://stat.gov.pl (accessed on 20 April 2020).
- Brodny, J.; Tutak, M. The analysis of similarities between the European Union countries in terms of the level and structure of the emissions of selected gases and air pollutants into the atmosphere. J. Clean. Prod. 2021, 279, 123641. [Google Scholar] [CrossRef]
- Kluczek, A. Multi-criteria decision analysis for simplified evaluation of clean energy technologies. Prod. Eng. Arch. 2019, 23, 3–11. [Google Scholar] [CrossRef] [Green Version]
- Paska, J.; Surma, T.; Terlikowski, P.; Zagrajek, K. Electricity Generation from Renewable Energy Sources in Poland as a Part of Commitment to the Polish and EU Energy Policy. Energies 2020, 13, 4261. [Google Scholar] [CrossRef]
- Bajor, M. Innowacyjne metody pozyskiwania energii z odnawialnych źródeł energii. Zeszyty Naukowe Politechniki Śląskiej. Organ. Zarz. 2017, 114, 11–21. [Google Scholar]
- Ingaldi, M.; Klimecka-Tatar, D. People’s Attitude to Energy from Hydrogen—From the Point of View of Modern Energy Technologies and Social Responsibility. Energies 2020, 13, 6495. [Google Scholar] [CrossRef]
- Solé, J.; Samsó, R.; García-Ladona, E.; García-Olivares, A.; Ballabrera-Poy, J.; Madurell, T.; Turiel, A.; Osychenko, O.; Álvarez, D.; Bardi, U.; et al. Modelling the renewable transition: Scenarios and pathways for a decarbonized future using pymedeas, a new open-source energy systems model. Renew. Sustain. Energy Rev. 2020, 132, 110105. [Google Scholar] [CrossRef]
- Busu, M. Analyzing the Impact of the Renewable Energy Sources on Economic Growth at the EU Level Using an ARDL Model. Mathematics 2020, 8, 1367. [Google Scholar] [CrossRef]
- Solangi, Y.A.; Longsheng, C.; Shah, S.A.A.; AlSanad, A.; Ahmad, M.; Akbar, M.A.; Gumaei, A.; Ali, S. Analyzing Renewable Energy Sources of a Developing Country for Sustainable Development: An Integrated Fuzzy Based-Decision Methodology. Processes 2020, 8, 825. [Google Scholar] [CrossRef]
- Chen, T.; Wang, Y.-T.; Wang, J.-Q.; Li, L.; Cheng, P.-F. Multistage Decision Framework for the Selection of Renewable Energy Sources Based on Prospect Theory and PROMETHEE. Int. J. Fuzzy Syst. 2020, 22, 1535–1551. [Google Scholar] [CrossRef]
- Yi, S.-K.; Sin, H.-Y.; Heo, E. Selecting sustainable renewable energy source for energy assistance to North Korea. Renew. Sustain. Energy Rev. 2011, 15, 554–563. [Google Scholar] [CrossRef]
- Skoczko, I.; Szatyłowicz, E.; Barszczewska, I.; Biedrzycki, T.; Mielniczuk, P.; Wysocka, M.; Załuska, M.; Myszkowska, A.; Osipiuk, J.; Boguszewska, M.; et al. Wykorzystanie i rozwój odnawialnych źródeł energii. In Inżynieria Środowiska—Młodym Okiem Tom 33 Ekoinżynieria; Skoczko, I., Siemieniuk, A., Osipiuk, J., Myszkowska, A., Eds.; Oficyna Wydawnicza Politechniki Białostockiej: Miasto Białystok, Poland, 2017; pp. 172–189. [Google Scholar]
- Nigim, K.; Munier, N.; Green, J. Pre-feasibility MCDM tools to aid communities in prioritizing local viable renewable energy sources. Renew. Energy 2004, 29, 1775–1791. [Google Scholar] [CrossRef]
- Wójcicki, Z. Znaczenie biomasy i innych odnawialnych zasobów energii. Probl. Agric. Eng. 2012, 4, 5–13. [Google Scholar]
- Rasheed, M.B.; Qureshi, M.A.; Javaid, N.; Alquthami, T. Dynamic Pricing Mechanism With the Integration of Renewable Energy Source in Smart Grid. IEEE Access 2020, 8, 16876–16892. [Google Scholar] [CrossRef]
- Brodny, J.; Tutak, M.; Saki, S.A. Forecasting the Structure of Energy Production from Renewable Energy Sources and Biofuels in Poland. Energies 2020, 13, 2539. [Google Scholar] [CrossRef]
- Lipiński, T. Double Modification of AlSi9Mg Alloy With Boron, Titanium And Strontium. Arch. Met. Mater. 2015, 60, 2415–2419. [Google Scholar] [CrossRef] [Green Version]
- Lipiński, T.; Wach, A. Dimensional Structure of Non-Metallic Inclusions in High-Grade Medium Carbon Steel Melted in an Electric Furnace and Subjected to Desulfurization. Solid State Phenom. 2014, 223, 46–53. [Google Scholar] [CrossRef]
- Radek, N.; Bartkowiak, K. Laser Treatment of Electro-Spark Coatings Deposited in the Carbon Steel Substrate with using Nanostructured WC-Cu Electrodes. Phys. Proc. 2012, 39, 295–301. [Google Scholar] [CrossRef] [Green Version]
- Jonšta, P.; Váňová, P.; Brožová, S.; Pustějovská, P.; Sojka, J.; Jonšta, Z.; Ingaldi, M. Hydrogen Embrittlement of Welded Joint Made of Supermartensitic Stainless Steel in Environment Containing Sulfane. Arch. Met. Mater. 2016, 61, 709–712. [Google Scholar] [CrossRef]
- Pacana, A.; Czerwińska, K.; Bednárová, L. Discrepancies analysis of casts of diesel engine piston. Metalurgija 2018, 57, 324–326. [Google Scholar]
- Zhelykh, V.; Venhryn, I.; Kozak, K.; Shapoval, S. Solar collectors integrated into transparent facades. Prod. Eng. Arch. 2020, 26, 84–87. [Google Scholar] [CrossRef]
- Enescu, F.M.; Ionescu, V.M.; Marinescu, C.N.; Stirbu, C. System for monitoring and controlling renewable energy sources. In Proceedings of the ECAI 2017 International Conference-9th Edition Electronics, Computers and Artificial Intelligence, Targoviste, Romania, 29 June–1 July 2017. [Google Scholar]
- Rahim, N.-A.; Khyam, M.O.; Li, X.; Pesch, D. Sensor Fusion and State Estimation of IoT Enabled Wind Energy Conversion System. Sensors 2019, 19, 1566. [Google Scholar] [CrossRef] [Green Version]
- Hirschhorn, F. Reflections on the application of the Delphi method: Lessons from a case in public transport research. Int. J. Soc. Res. Methodol. 2019, 22, 309–322. [Google Scholar] [CrossRef]
- Tsai, H.-C.; Lee, A.-S.; Lee, H.-N.; Chen, C.-N.; Liu, Y.-C. An Application of the Fuzzy Delphi Method and Fuzzy AHP on the Discussion of Training Indicators for the Regional Competition, Taiwan National Skills Competition, in the Trade of Joinery. Sustainability 2020, 12, 4290. [Google Scholar] [CrossRef]
- Chang, D.-Y. Applications of the extent analysis method on fuzzy AHP. Eur. J. Oper. Res. 1996, 95, 649–655. [Google Scholar] [CrossRef]
- Sofyalioğlu, Ç.; Öztürk, Ş. Application of Grey Relational Analysis with Fuzzy AHP to FMEA Method. Doğuş Üniv. Derg. 2012, 1, 114–130. [Google Scholar] [CrossRef]
- Chen, C.-T. Extensions of the TOPSIS for group decision-making under fuzzy environment. Fuzzy Sets Syst. 2000, 114, 1–9. [Google Scholar] [CrossRef]
- Wu, C.; Qin, Z.; Huang, J.; Zhou, R. Characterization of Microbial Community in Daqu by PLFA Method. Food Sci. Technol. Res. 2014, 20, 147–154. [Google Scholar] [CrossRef] [Green Version]
- Stecyk, A.; Szczeciński, U. Zastosowanie metody PROMETHEE II do wyboru kursu e-learningowego w przedsiębiorstwie. E-mentor 2019, 2019, 39–45. [Google Scholar] [CrossRef]
- Michalska, E. Ocena Efektywności Wariantów Decyzyjnych Na Gruncie Teorii Perspektywy. Zesz. Nauk. Politech. Śląskiej Organ. Zarz. 2017, 113, 315–325. [Google Scholar]
- KrishanKumar, R.; Mishra, A.R.; Ravichandran, K.S.; Peng, X.; Zavadskas, E.K.; Cavallaro, F.; Mardani, A. A Group Decision Framework for Renewable Energy Source Selection under Interval-Valued Probabilistic linguistic Term Set. Energies 2020, 13, 986. [Google Scholar] [CrossRef] [Green Version]
- Halkos, G.E.; Gkampoura, E.-C. Reviewing Usage, Potentials, and Limitations of Renewable Energy Sources. Energies 2020, 13. [Google Scholar] [CrossRef]
- Wu, Z.; Abdul-Nour, G. Comparison of Multi-Criteria Group Decision-Making Methods for Urban Sewer Network Plan Selection. CivilEng 2020, 1, 3. [Google Scholar] [CrossRef]
- Roszkowska, E. Multi-Criteria Decision Making Models by Applying the TOPSIS Method to Crisp and Interval Data. Available online: http://www.mcdm.ue.katowice.pl/files/papers/mcdm11(6)_11.pdf (accessed on 19 October 2020).
- Siwiec, D.; Bednárová, L.; Pacana, A. Metoda doboru penetrantów dla przemysłowych badań nieniszczących. Przem. Chem. 2020, 99, 771–773. [Google Scholar] [CrossRef]
- Kolman, R.R. Quality Engineering; PWE: Warsaw, Poland, 1992; pp. 1–292. (In Polish) [Google Scholar]
- Ulewicz, R.; Nový, F. Quality management systems in special processes. Transp. Res. Proc. 2019, 40, 113–118. [Google Scholar] [CrossRef]
- Amineha, H.; Kosach, N. Assessment of Consumers’ Satisfaction with the Automotive Product Quality. Int. J. Environ. Sci. Educ. 2016, 11, 8726–8739. [Google Scholar]
- Joanna, M.; Marek, G.; Władysław, M. The concept of the qualitology and grey system theory application in marketing information quality cognition and assessment. Cent. Eur. J. Oper. Res. 2019, 28, 817–840. [Google Scholar] [CrossRef] [Green Version]
- Kijewska, J.; Mierzwiak, R. The Empirical Verification of the Kolman’s Universal Interpretative Scale. Przeds. Zarz. 2014, 15, 335–350. [Google Scholar]
- Kosacka, M.; Golinska-Dawson, P.; Mierzwiak, R. Sustainability Classification for SMEs from the Remanufacturing Sector. Chiang Mai Univ. J. Nat. Sci. 2015, 14, 321–338. [Google Scholar] [CrossRef]
- Jahanshahloo, G.; Lotfi, F.H.; Izadikhah, M. Extension of the TOPSIS method for decision-making problems with fuzzy data. Appl. Math. Comput. 2006, 181, 1544–1551. [Google Scholar] [CrossRef]
- Jahanshahloo, G.; Lotfi, F.H.; Izadikhah, M. An algorithmic method to extend TOPSIS for decision-making problems with interval data. Appl. Math. Comput. 2006, 175, 1375–1384. [Google Scholar] [CrossRef]
- Hussain, H.I.; Slusarczyk, B.; Kamarudin, F.; Thaker, H.M.T.; Szczepańska-Woszczyna, K. An Investigation of an Adaptive Neuro-Fuzzy Inference System to Predict the Relationship among Energy Intensity, Globalization, and Financial Development in Major ASEAN Economies. Energies 2020, 13, 850. [Google Scholar] [CrossRef] [Green Version]
- Osocha, P.; Ulewicz, R.; Szataniak, P.; Pietraszek, M.; Kołomycki, M.; Radek, N.; Pasieczyński, Ł. The Empirical Assessment of the Convergence Rate for the Bootstrap Estimation in Design of Experiment Approach. Solid State Phenom. 2015, 235, 16–23. [Google Scholar] [CrossRef]
- Kusumawardani, R.P.; Agintiara, M. Application of Fuzzy AHP-TOPSIS Method for Decision Making in Human Resource Manager Selection Process. Procedia Comput. Sci. 2015, 72, 638–646. [Google Scholar] [CrossRef] [Green Version]
- Esmaili-Dooki, A.; Bolhasani, P.; Fallah, M. An Integrated Fuzzy AHP and Fuzzy TOPSIS Approach for Ranking and Selecting the Chief Inspectors of Bank: A Case Study. J. Appl. Res. Ind. Eng. 2016, 4, 8–23. [Google Scholar] [CrossRef]
- Basahel, A.; Taylan, O. Using fuzzy ahp and fuzzy topsis approaches for assessing safety conditions at worksites in construction industry. Int. J. Saf. Secur. Eng. 2016, 6, 728–745. [Google Scholar] [CrossRef]
- Gawilk, R. Stratification of research target group and selection of experts for AHP-based decision making model. In The Application of Analytic Hierarchy Process for Analyzing Material and Non-material Determinants of Life Quality of Young Europeans. Miscellanea Oeconomicae 2016, 3, 193–200. [Google Scholar]
- SoonHu, S. A decision model for evaluating third-party logistics providers using fuzzy analytic hierarchy process. Afr. J. Bus. Manag. 2010, 4, 339–349. [Google Scholar]
- Chan, F.T.; Kumar, N. Global supplier development considering risk factors using fuzzy extended AHP-based approach. Omega 2007, 35, 417–431. [Google Scholar] [CrossRef]
- Wang, L.; Chu, J.; Wu, J. Selection of optimum maintenance strategies based on a fuzzy analytic hierarchy process. Int. J. Prod. Econ. 2007, 107, 151–163. [Google Scholar] [CrossRef]
- Libby, R.; Blashfield, R.K. Performance of a composite as a function of the number of judges. Organ. Behav. Hum. Perform. 1978, 21, 121–129. [Google Scholar] [CrossRef]
- Baby, S. AHP Modeling for Multicriteria Decision-Making and to Optimise Strategies for Protecting Coastal Landscape Resources. Int. J. Innov. Manag. Technol. 2013, 4, 218–227. [Google Scholar] [CrossRef] [Green Version]
- Harputlugil, T. Analytic Hierarchy Process (AHP) as an Assessment Approach for Architectural Design: Case Study of Ar-chitectural Design Studio. Int. J. Archit. Plan. 2018, 6, 217–245. [Google Scholar] [CrossRef] [Green Version]
- Sato, Y. Questionnaire Design for Survey Research: Employing Weighting Method. ISAHP 2005. Available online: http://www.isahp.org/2009Proceedings/Final_Papers/76_SatoY_QuestionnaireDesign_REV_FIN.pdf (accessed on 6 November 2020).
- Łuczak, A. Ocena ważności czynników strategicznych w gminie wiejskiej z wykorzystaniem rozmytego analitycznego procesu hierarchicznego. J. Agribus. Rural Dev. 2012, 4, 43–56. [Google Scholar]
- Jianzhong, X.; Assenova, A.; Erokhin, V. Renewable Energy and Sustainable Development in a Resource-Abundant Country: Challenges of Wind Power Generation in Kazakhstan. Sustainability 2018, 10, 3315. [Google Scholar] [CrossRef] [Green Version]
- Pacana, A.; Siwiec, D.; Bednárová, L. Analysis of the incompatibility of the product with fluorescent method. Metalurgija 2019, 58, 337–340. Available online: https://hrcak.srce.hr/218422 (accessed on 28 April 2020).
- Behzadian, M.; Otaghsara, S.K.; Yazdani, M.; Ignatius, J. A state-of the-art survey of TOPSIS applications. Exp. Syst. Appl. 2012, 39, 13051–13069. [Google Scholar] [CrossRef]
- Rozporządzenie Ministra Klimatu z Dnia 24 Kwietnia 2020 r. w Sprawie Ceny Referencyjnej Energii Elektrycznej z Odnawialnych Źródeł Energii w 2020 r. Oraz Okresów Obowiązujących Wytwórców, Którzy Wygrali Aukcje w 2020 r. Available online: http://isap.sejm.gov.pl/isap.nsf/download.xsp/WDU20200000798/O/D20200798.pdf (accessed on 20 October 2020).
- Siderska, J. Analysis of the possibilities of using artificial neural networks to model social capital values in IT companies. Econ. Manag. 2013, 1, 84–97. [Google Scholar]
- Luta, P. Wybrane Możliwości Zastosowań Sieci Neuronowych i Program Statistica Neural Networks. StatSoft. Available online: https://media.statsoft.pl/_old_dnn/downloads/wybrane_mozliwosci_zastosowan_sieci_neuronowych.pdf (accessed on 26 October 2020).
- Gil, M.Á.; González-Rodríguez, G. Fuzzy vs. Likert Scale in Statistics. In Computational Intelligence; Springer Science and Business Media LLC: Berlin/Heidelberg, Germany, 2012; Volume 271, pp. 407–420. [Google Scholar]
- Dudek, A.; Jefmański, B. The fuzzy TOPSIS method and its implementation in the R programme. Inform. Èkon. 2015, 1, 19–27. [Google Scholar] [CrossRef]
- The Expert Choice Software. Available online: https://www.expertchoice.com/2021 (accessed on 30 January 2021).
- Yadav, V.; Karmakar, S.; Kalbar, P.P.; Dikshit, A. PyTOPS: A Python based tool for TOPSIS. SoftwareX 2019, 9, 217–222. [Google Scholar] [CrossRef]
Figure 1.
The methodology of choosing the preferred RES for use in industry.

Figure 2.
The algorithm for choosing the preferred RES in industry in the context of electricity.


Figure 4.
The scale of mutual relations and interpretation of cost–quality ratio and decision-making. Own study based on the work in [1,59,60,61,62,63,64].

Figure 5.
A simplified diagram of the method of processing input variables into the output variable.
Figure 5.
A simplified diagram of the method of processing input variables into the output variable.


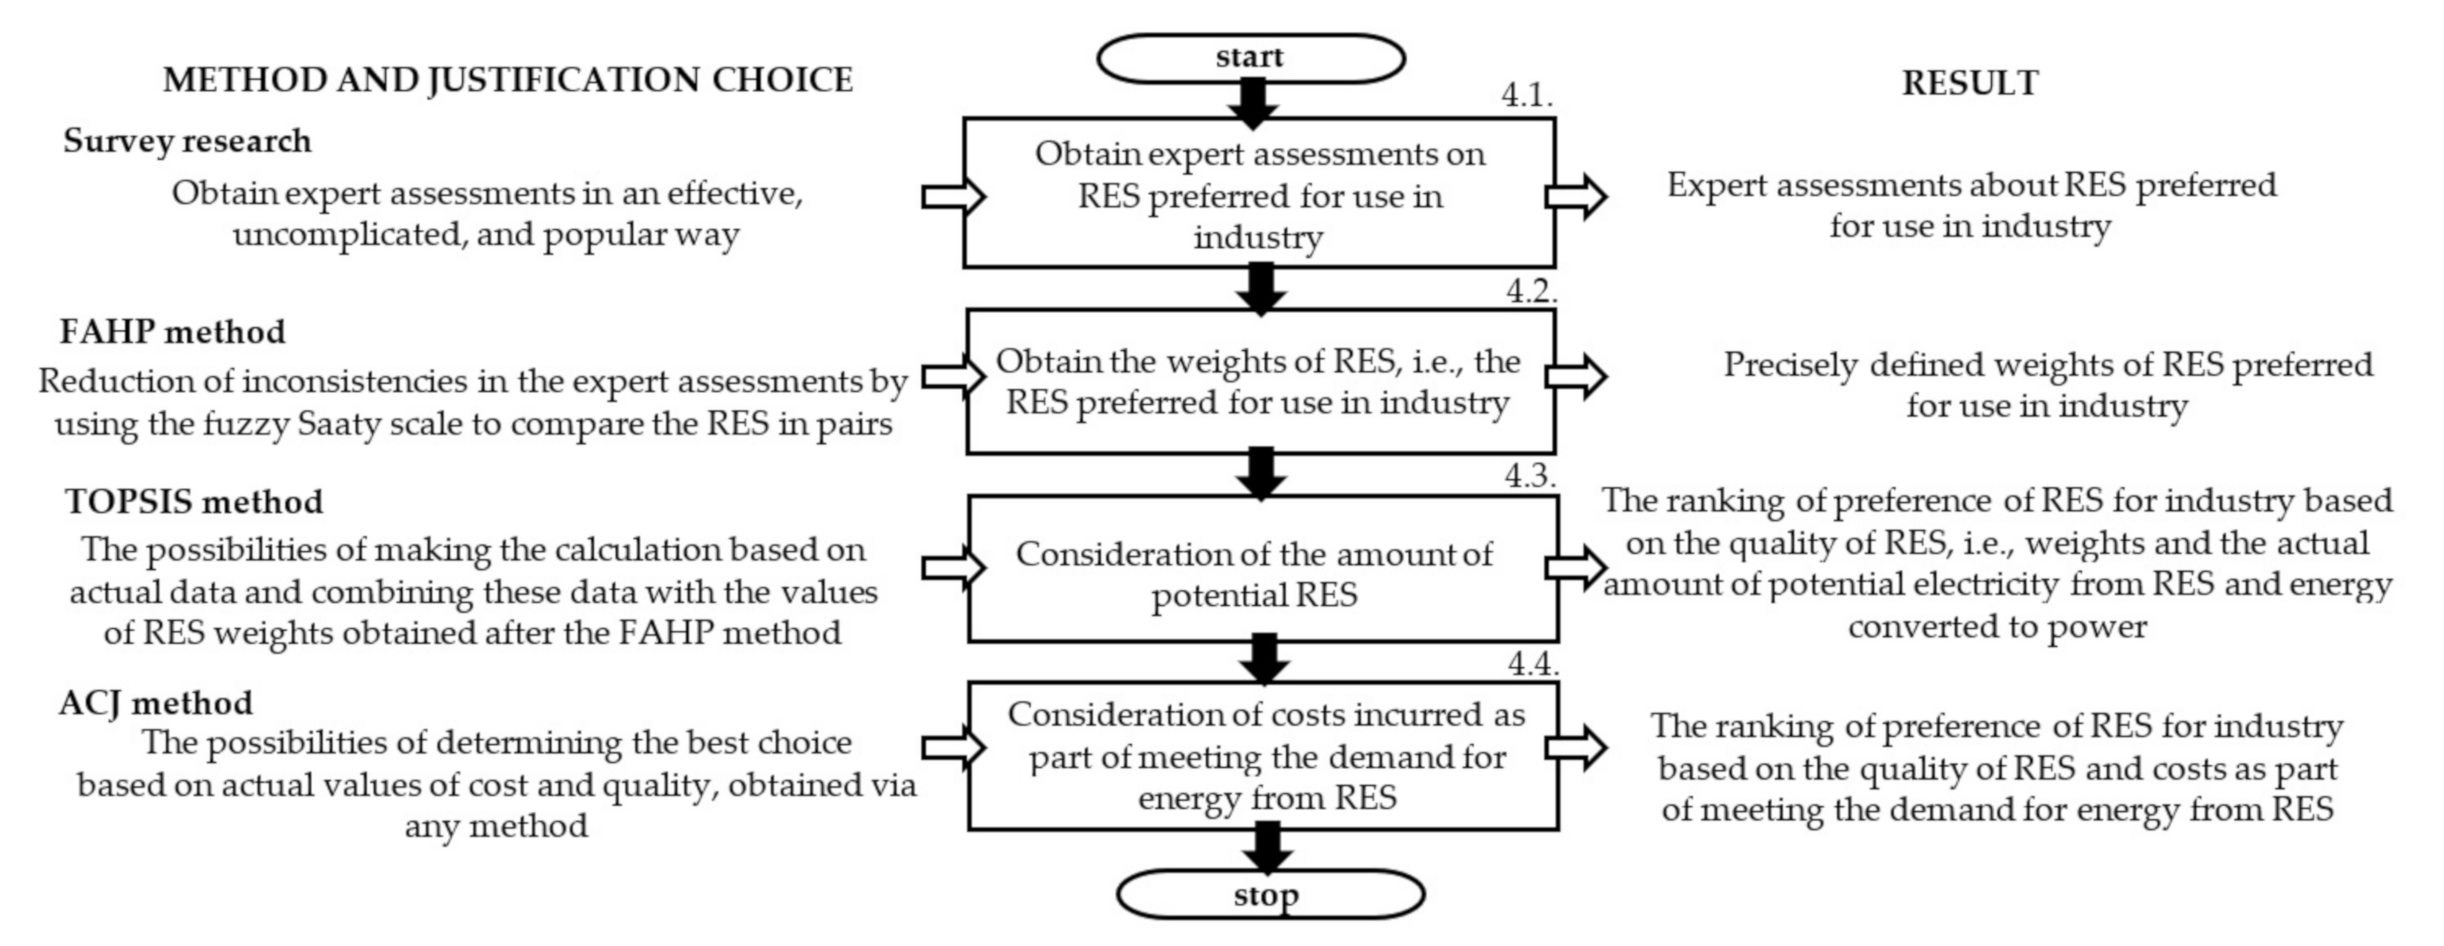
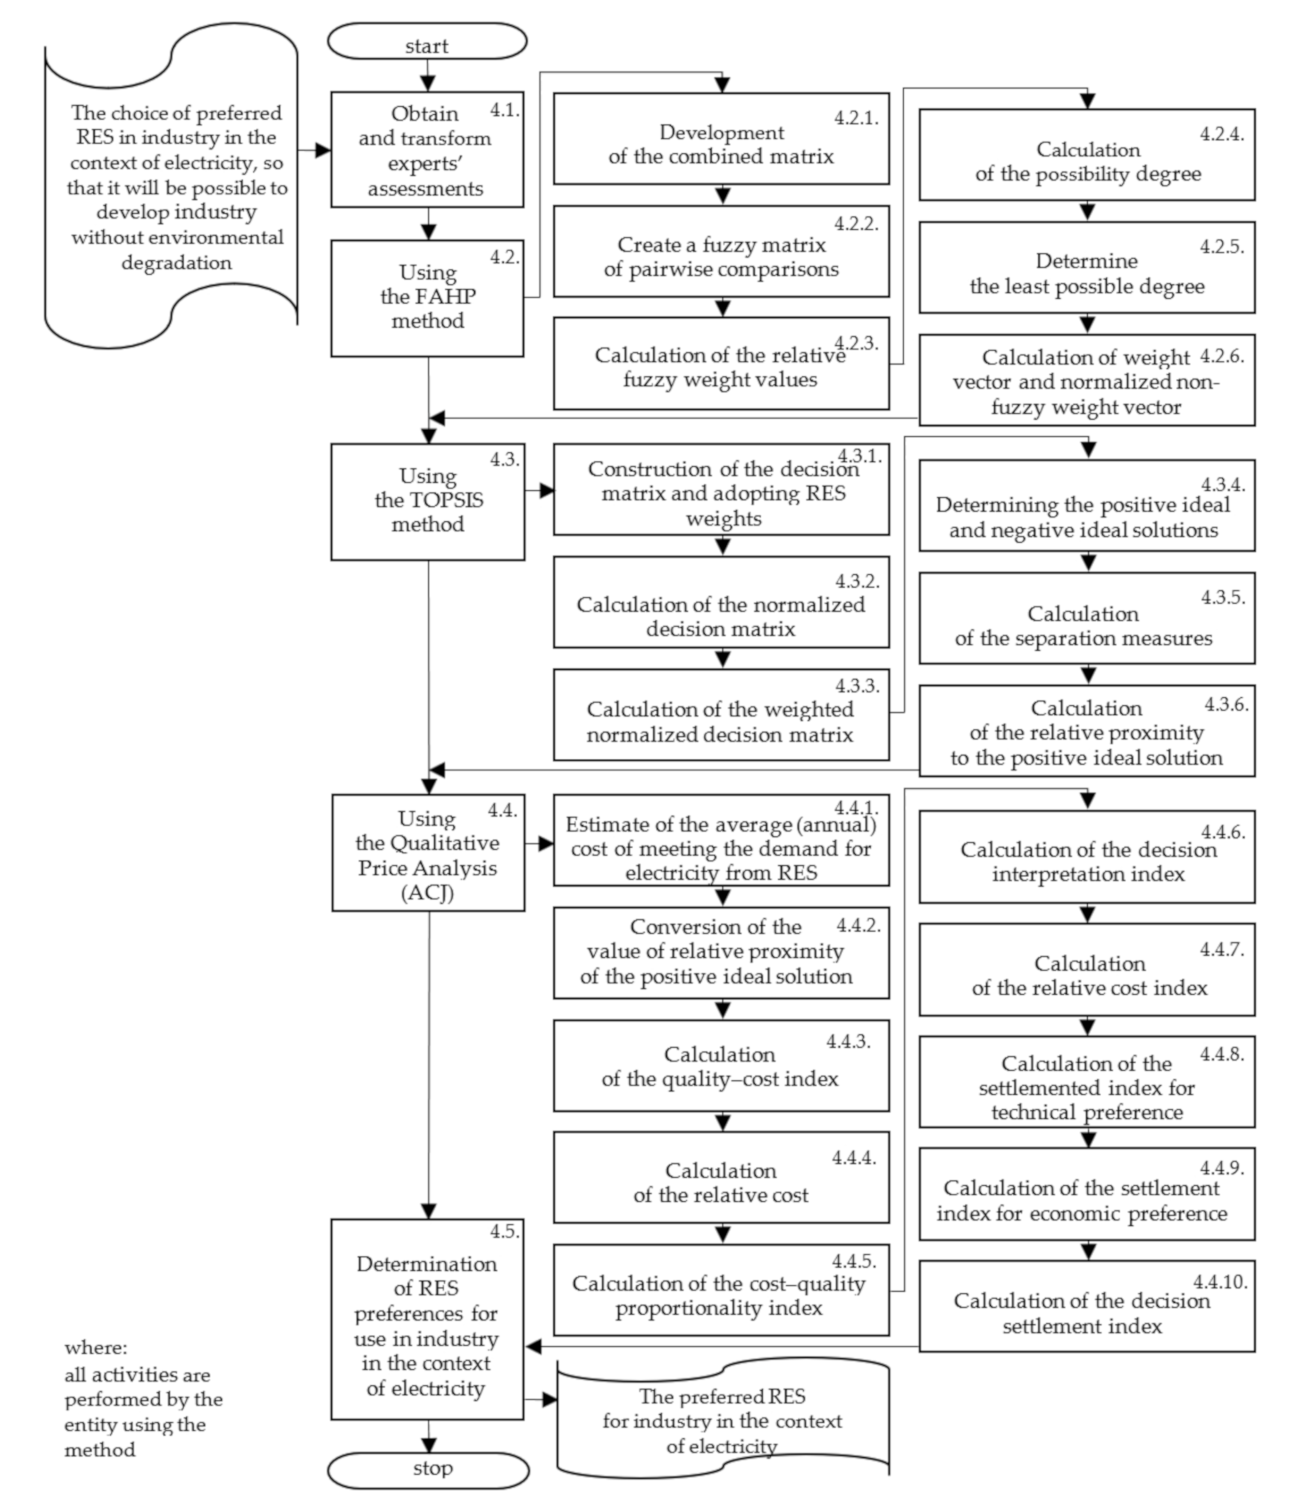
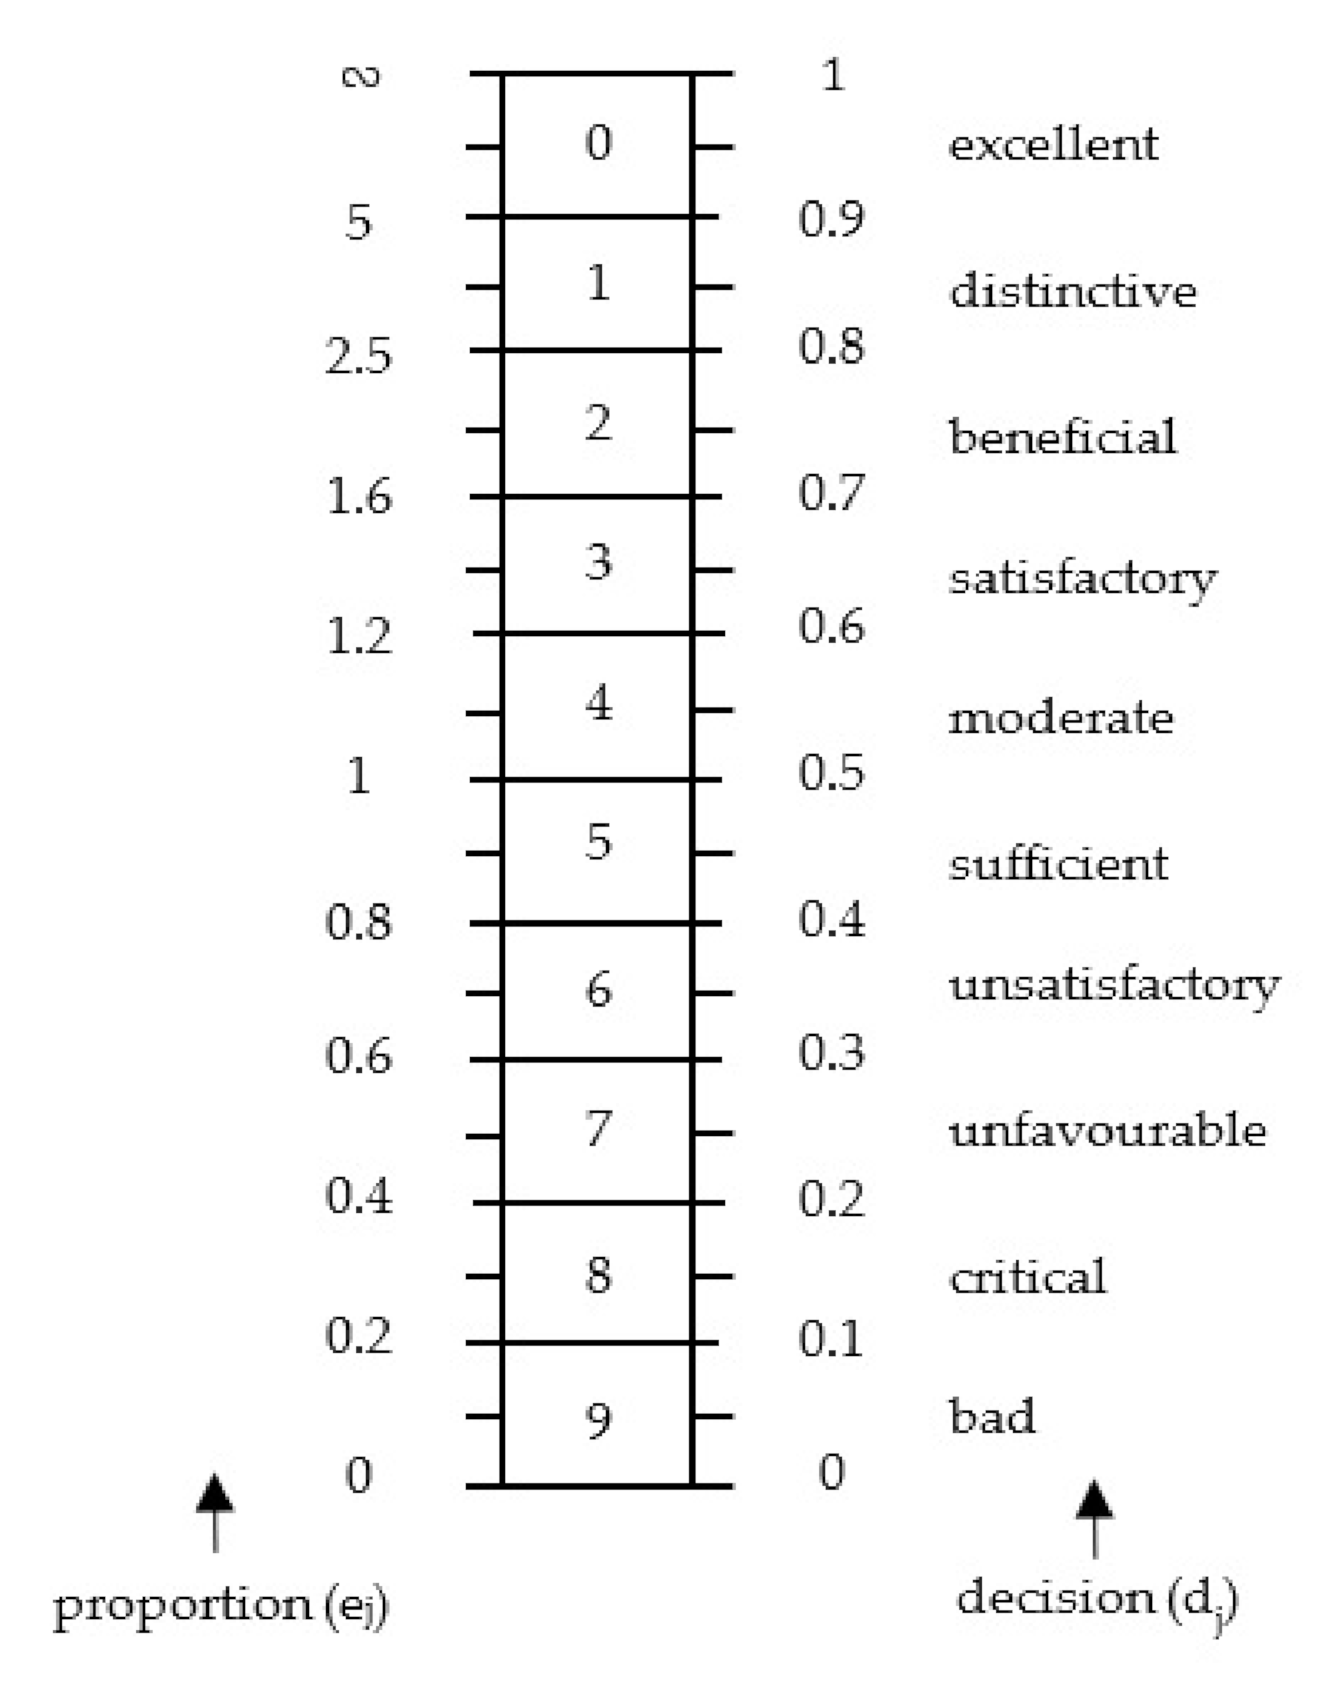
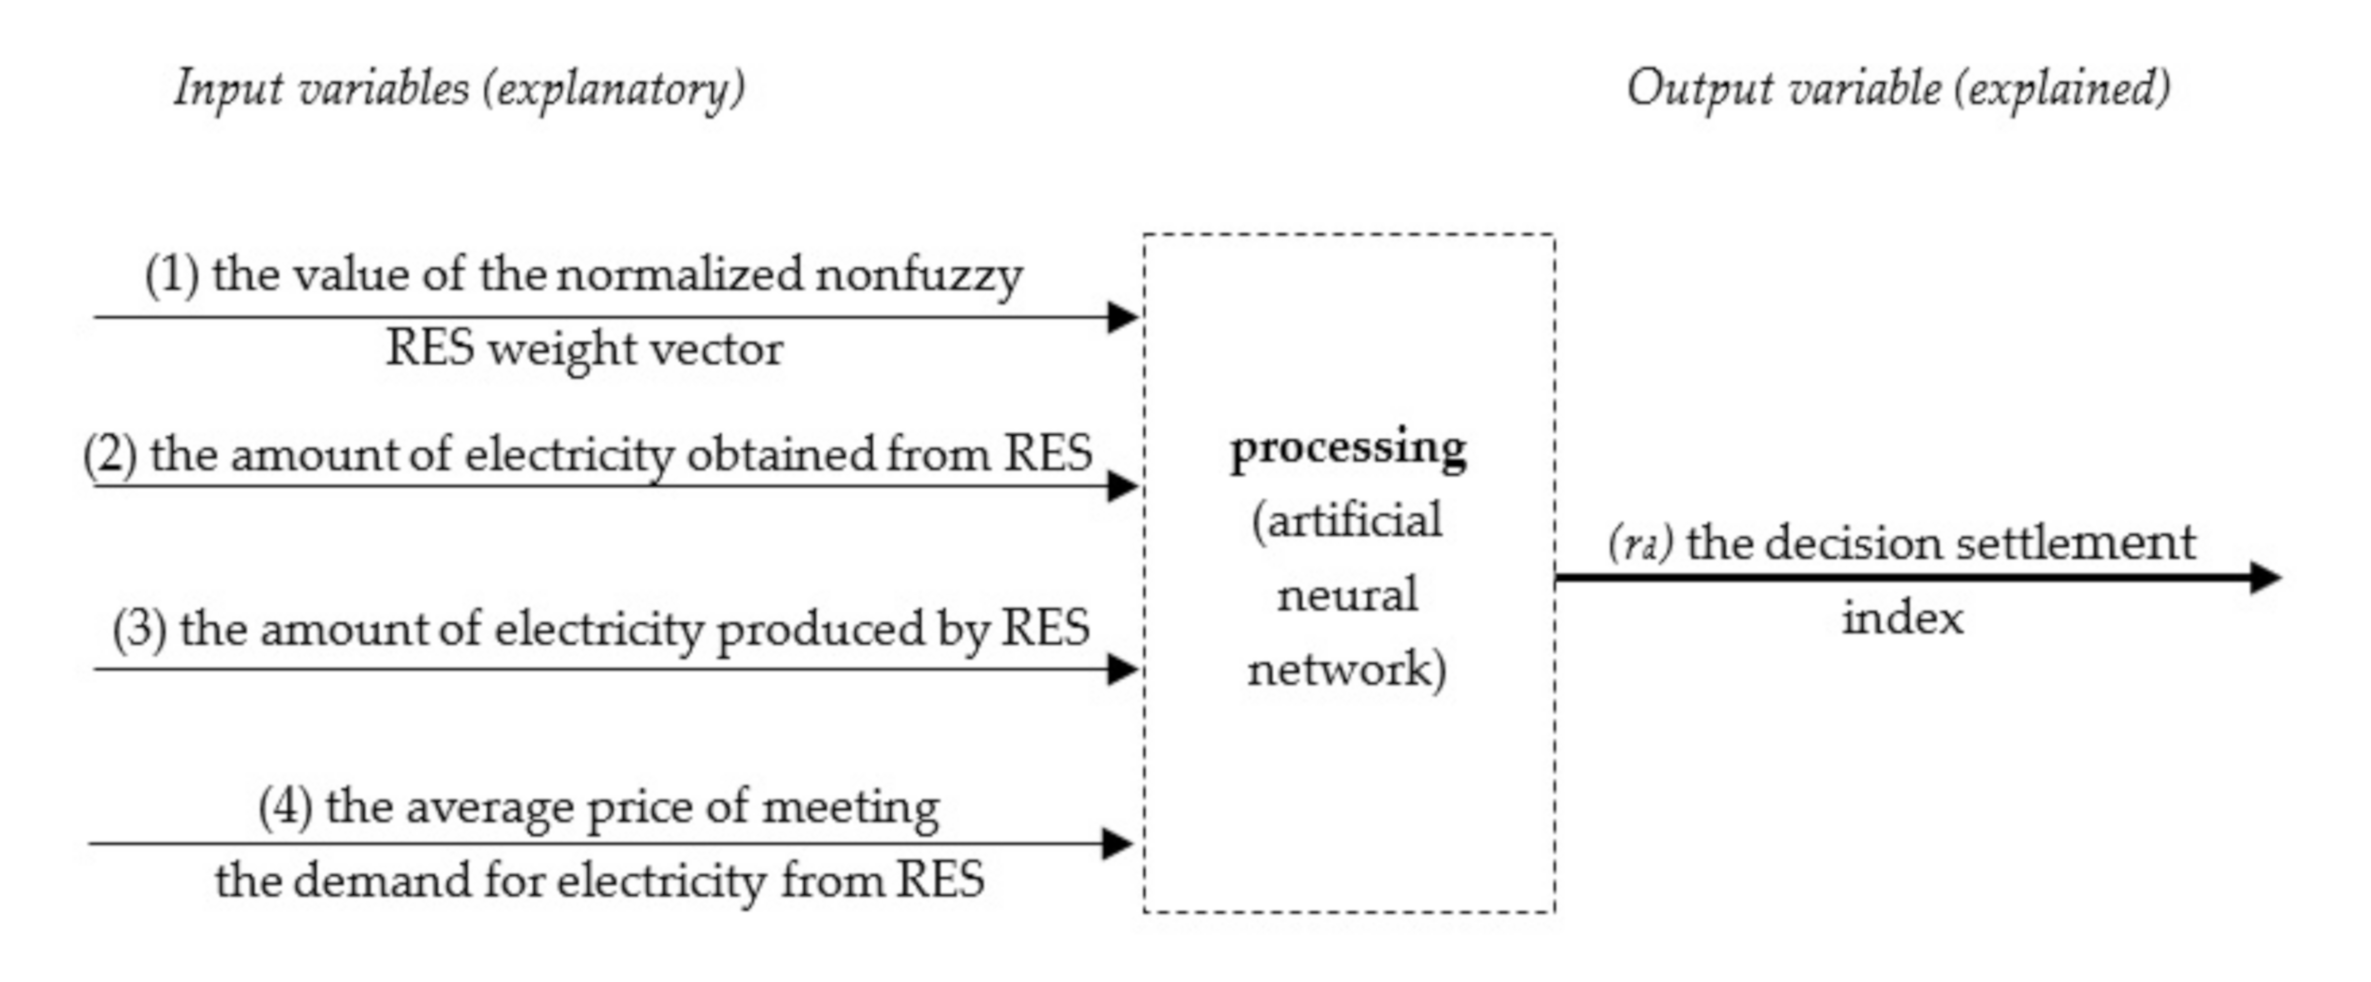
Table 1.
Example of the survey form.
| No. | Renewable Energy Source | Rating (19) |
| 1 | Solid biofuels | |
| 2 | Solar energy | |
| 3 | Hydropower | |
| 4 | Wind energy | |
| 5 | Biogas | |
| 6 | Liquid biofuels | |
| 7 | Geothermal energy | |
| 8 | Renewable municipal waste |
| Classic Saaty Scale | Description | Triangular Fuzzy Number | Triangular Fuzzy Reciprocal Number |
|---|---|---|---|
| 1 | Equally important | (1.1.1) | (1.1.1) |
| 2 | Moderately important | (1.2.3) | (1/3.1/2.1) |
| 3 | Moderately more important | (2.3.4) | (1/4.1/3.1/2) |
| 4 | Moderately to definitely more important | (3.4.5) | (1/5.1/4.1/3) |
| 5 | Much more important | (4.5.6) | (1/6.1/5.1/4) |
| 6 | Preferred to very much more important | (5.6.7) | (1/7.1/6.1/5) |
| 7 | Very much more important | (6.7.8) | (1/8.1/7.1/6) |
| 8 | Preferred to extremely important | (7.8.9) | (1/9.1/8.1/7) |
| 9 | Extremely important | (8.9.9) | (1/9.1/9.1/8) |
Table 3.
The collective results of the respondents’ assessments about RES preference in Polish industry in the context of electricity.
Table 3.
The collective results of the respondents’ assessments about RES preference in Polish industry in the context of electricity.
| No. | Renewable Energy Source | The Sum of the Respondents’ Ratings, Given on a 1–9 Scale | ||||||||
|---|---|---|---|---|---|---|---|---|---|---|
| 1 | 2 | 3 | 4 | 5 | 6 | 7 | 8 | 9 | ||
| 1 | Solid biofuels | 20 | 2 | 2 | 2 | 1 | 1 | 2 | 4 | 6 |
| 2 | Solar energy | 7 | 1 | 2 | 3 | 5 | 5 | 1 | 3 | 13 |
| 3 | Hydropower | 33 | 0 | 2 | 1 | 2 | 0 | 0 | 1 | 1 |
| 4 | Wind energy | 28 | 1 | 0 | 3 | 1 | 1 | 4 | 1 | 1 |
| 5 | Biogas | 25 | 0 | 1 | 2 | 4 | 3 | 2 | 2 | 1 |
| 6 | Liquid biofuels | 24 | 1 | 3 | 4 | 3 | 2 | 0 | 2 | 1 |
| 7 | Geothermal energy | 30 | 0 | 2 | 2 | 2 | 0 | 0 | 0 | 4 |
| 8 | Renewable municipal waste | 28 | 1 | 2 | 5 | 2 | 1 | 0 | 0 | 1 |
Table 4.
The combined matrix containing the values from the comparison of expert assessments.
| Renewable Energy Source | |||
| Solid biofuels | 1.00 | 2.25 | 9.00 |
| Solar energy | 1.00 | 4.47 | 9.00 |
| Hydropower | 1.00 | 1.25 | 9.00 |
| Wind energy | 1.00 | 1.59 | 9.00 |
| Biogas | 1.00 | 1.80 | 9.00 |
| Liquid biofuels | 1.00 | 1.72 | 9.00 |
| Geothermal energy | 1.00 | 1.46 | 9.00 |
| Renewable municipal waste | 1.00 | 1.48 | 9.00 |
Table 9.
Volumes of produced and amount of potential RES electrical resource in Poland for 2018 in the context of electricity.
Table 9.
Volumes of produced and amount of potential RES electrical resource in Poland for 2018 in the context of electricity.
| Renewable Energy Source | Volumes of Electricity from RES Converted to Power (GWh) | Volumes of the Amount of Potential RES Electrical Resource (%) |
|---|---|---|
| Solid biofuels | 5333.20 | 69.30 |
| Solar energy | 300.50 | 0.90 |
| Hydropower | 1970.00 | 1.90 |
| Wind energy | 12798.80 | 12.40 |
| Biogas | 1127.60 | 3.20 |
| Liquid biofuels | 2.00 | 10.20 |
| Geothermal energy | 0.00 | 0.30 |
| Renewable municipal waste | 85.00 | 1.10 |
Table 10.
The results of the normalized decision matrix.
| Renewable Energy Source | Volumes of Electricity from RES Converted to Power | Volumes of the Amount of Potential RES Electrical Resource |
|---|---|---|
| Solid biofuels | 0.38 | 0.97 |
| Solar energy | 0.02 | 0.01 |
| Hydropower | 0.14 | 0.03 |
| Wind energy | 0.91 | 0.17 |
| Biogas | 0.08 | 0.04 |
| Liquid biofuels | 0.00 | 0.14 |
| Geothermal energy | 0.00 | 0.00 |
| Renewable municipal waste | 0.01 | 0.02 |
Table 11.
The results of the weighted normalized decision matrix and determined positive ideal solution (
) and negative ideal solution ().
Table 11.
The results of the weighted normalized decision matrix and determined positive ideal solution (
) and negative ideal solution ().
| Renewable Energy Source | Volumes of Electricity from RES Converted to Power | Volumes of the Amount of Potential RES Electrical Resource |
|---|---|---|
| Solid biofuels | 0.06 | 0.15 |
| Solar energy | 0.00 | 0.00 |
| Hydropower | 0.01 | 0.00 |
| Wind energy | 0.09 | 0.02 |
| Biogas | 0.01 | 0.01 |
| Liquid biofuels | 0.00 | 0.02 |
| Geothermal energy | 0.00 | 0.00 |
| Renewable municipal waste | 0.00 | 0.00 |
| 0.09 | 0.15 | |
| 0.00 | 0.00 |
Table 12.
The separation measures, relative proximity, and preference ranking.
| Renewable Energy Source | Rj | Ranking | ||
|---|---|---|---|---|
| Solid biofuels | 0.03 | 0.16 | 0.83 | 1 |
| Solar energy | 0.17 | 0.00 | 0.02 | 6 |
| Hydropower | 0.16 | 0.01 | 0.05 | 5 |
| Wind energy | 0.13 | 0.09 | 0.41 | 2 |
| Biogas | 0.16 | 0.01 | 0.07 | 4 |
| Liquid biofuels | 0.15 | 0.02 | 0.11 | 3 |
| Geothermal energy | 0.17 | 0.00 | 0.00 | 8 |
| Renewable municipal waste | 0.17 | 0.00 | 0.01 | 7 |
Table 13.
The average costs of meeting the demand for electricity with RES in Poland.
| Renewable Energy Source | The Average Cost (MWh/Year) | The Average Cost (TJ/Year) |
|---|---|---|
| Solid biofuels | 7,753,336,114.42 | 127,800,000 |
| Solar energy | 70,071,230.14 | 1,155,000 |
| Hydropower | 11,618,578,466.05 | 191,511,668 |
| Wind energy | 7,753,336,114.42 | 11,934,000 |
| Biogas | 294,626,772.35 | 4,856,400 |
| Liquid biofuels | 7,753,336,114.42 | 17,081,475 |
| Geothermal energy | 27,603,817.93 | 455,000 |
| Renewable municipal waste | 115,875,367.59 | 1,910,000 |
Table 14.
The results of a qualitative price analysis and the final ranking of RES preference for the Polish industry in the context of electricity.
Table 14.
The results of a qualitative price analysis and the final ranking of RES preference for the Polish industry in the context of electricity.
| Renewable Energy Source | Solid Biofuels | Solar Energy | Hydropower | Wind Energy | Biogas | Liquid Biofuels | Geothermal Energy | Renewable Municipal Waste |
|---|---|---|---|---|---|---|---|---|
| Average costs (MWh/year) | 7,753,336,114.42 | 70,071,230.14 | 11,618,578,466.05 | 7,753,336,114.42 | 294,626,772.35 | 7,753,336,114.42 | 27,603,817.93 | 115,875,367.59 |
| 0.83 | 0.02 | 0.05 | 0.41 | 0.07 | 0.11 | 0.00 | 0.01 | |
| (%) | 83.44 | 2.35 | 5.14 | 40.92 | 7.48 | 10.96 | 0.01 | 0.98 |
| 92,920,978.96 | 29,801,251.34 | 2,260,692,697.12 | 189,474,142.79 | 39,390,867.89 | 707,196,446.02 | 2,760,381,793.00 | 118,667,408.68 | |
| p | 0.33 | 1.00 | 0.00 | 0.33 | 0.98 | 0.33 | 1.00 | 0.99 |
| e | 2.50 | 0.02 | 0.00 | 1.23 | 0.08 | 0.33 | 0.00 | 0.01 |
| d | 0.80 | 0.01 | 0.00 | 0.59 | 0.04 | 0.16 | 0.00 | 0.00 |
| c | 0.98 | 0.99 | 0.18 | 0.93 | 0.99 | 0.74 | 0.00 | 0.96 |
| 0.85 | 0.18 | 0.06 | 0.56 | 0.21 | 0.23 | 0.00 | 0.17 | |
| 0.90 | 0.50 | 0.10 | 0.73 | 0.52 | 0.45 | 0.00 | 0.48 | |
| 0.87 | 0.34 | 0.08 | 0.65 | 0.37 | 0.34 | 0.00 | 0.32 | |
| Ranking | 1 | 4 | 6 | 2 | 3 | 4 | 7 | 5 |
| Decision | distinctive | unsatisfactory | bad | satisfactory | unsatisfactory | unsatisfactory | bad | unsatisfactory |
Table 15.
The comparison of the RES ranking achieved by the proposed methods.
| Renewable Energy Source | FAHP | TOPSIS | ACJ | |||
|---|---|---|---|---|---|---|
| Comparison of Results | Ranking | Rj | Ranking | rd | Ranking | |
| Solid biofuels | 0.15 | 2 | 0.83 | 1 | 0.87 | 1 |
| Solar energy | 0.17 | 1 | 0.02 | 6 | 0.34 | 4 |
| Hydropower | 0.06 | 7 | 0.05 | 5 | 0.08 | 6 |
| Wind energy | 0.10 | 6 | 0.41 | 2 | 0.65 | 2 |
| Biogas | 0.14 | 3 | 0.07 | 4 | 0.37 | 3 |
| Liquid biofuels | 0.14 | 3 | 0.11 | 3 | 0.34 | 4 |
| Geothermal energy | 0.12 | 5 | 0.00 | 8 | 0.00 | 7 |
| Renewable municipal waste | 0.13 | 4 | 0.01 | 7 | 0.32 | 5 |
Table 16.
The dataset included in the sensitivity analysis of the proposed method.
| Renewable Energy Source | 1 | 2 | 3 | 4 | rd |
|---|---|---|---|---|---|
| Solid biofuels | 0.15 | 69.30 | 5333.20 | 7,753,336,114.42 | 0.87 |
| Solar energy | 0.17 | 0.90 | 300.50 | 70,071,230.14 | 0.34 |
| Hydropower | 0.06 | 1.90 | 1970.00 | 11,618,578,466.05 | 0.08 |
| Wind energy | 0.10 | 12.40 | 12,798.80 | 7,753,336,114.42 | 0.65 |
| Biogas | 0.14 | 3.20 | 1127.60 | 294,626,772.35 | 0.37 |
| Liquid biofuels | 0.14 | 10.20 | 2.00 | 7,753,336,114.42 | 0.34 |
| Geothermal energy | 0.12 | 0.30 | 0.00 | 27,603,817.93 | 0.00 |
| Renewable municipal waste | 0.13 | 1.10 | 85.00 | 115,875,367.59 | 0.32 |
Table 17.
The results of sensitivity analysis (in the training sample).
| Network | 1 | 2 | 3 | 4 |
|---|---|---|---|---|
| MLP 4-4-1 | 2.84 | 2.26 | 1.70 | 1.05 |
Table 5.
Fuzzy matrix of RES pairwise comparisons.
| Renewable Energy Source | Solid Biofuels | Solar Energy | Hydropower | Wind Energy | ||||||||
| Solid biofuels | 1.00 | 1.00 | 1.00 | 0.11 | 0.22 | 1.00 | 1.00 | 2.25 | 9.00 | 1.00 | 2.25 | 9.00 |
| Solar energy | 1.00 | 4.47 | 9.00 | 1.00 | 1.00 | 1.00 | 1.00 | 4.47 | 9.00 | 1.00 | 4.47 | 9.00 |
| Hydropower | 0.11 | 0.44 | 1.00 | 0.11 | 0.22 | 1.00 | 1.00 | 1.00 | 1.00 | 0.11 | 0.63 | 1.00 |
| Wind energy | 0.11 | 0.44 | 1.00 | 0.11 | 0.22 | 1.00 | 1.00 | 1.59 | 9.00 | 1.00 | 1.00 | 1.00 |
| Biogas | 0.11 | 0.44 | 1.00 | 0.11 | 0.22 | 1.00 | 1.00 | 1.80 | 9.00 | 1.00 | 1.80 | 9.00 |
| Liquid biofuels | 0.11 | 0.44 | 1.00 | 0.11 | 0.22 | 1.00 | 1.00 | 1.72 | 9.00 | 1.00 | 1.72 | 9.00 |
| Geothermal energy | 0.11 | 0.44 | 1.00 | 0.11 | 0.22 | 1.00 | 1.00 | 1.46 | 9.00 | 1.00 | 1.59 | 9.00 |
| Renewable municipal waste | 0.11 | 0.44 | 1.00 | 0.11 | 0.22 | 1.00 | 1.00 | 1.48 | 9.00 | 1.00 | 1.59 | 9.00 |
| Renewable Energy Source | Biogas | Liquid Biofuels | Geothermal Energy | Renewable Municipal Waste | ||||||||
| Solid biofuels | 1.00 | 2.25 | 9.00 | 1.00 | 2.25 | 9.00 | 1.00 | 2.25 | 9.00 | 1.00 | 2.25 | 9.00 |
| Solar energy | 1.00 | 4.47 | 9.00 | 1.00 | 4.47 | 9.00 | 1.00 | 4.47 | 9.00 | 1.00 | 4.47 | 9.00 |
| Hydropower | 0.11 | 0.56 | 1.00 | 0.11 | 0.58 | 1.00 | 0.11 | 0.69 | 1.00 | 0.11 | 0.67 | 1.00 |
| Wind energy | 0.11 | 0.56 | 1.00 | 0.11 | 0.58 | 1.00 | 0.11 | 0.63 | 1.00 | 0.11 | 0.63 | 1.00 |
| Biogas | 1.00 | 1.00 | 1.00 | 1.00 | 1.80 | 9.00 | 1.00 | 1.80 | 9.00 | 1.00 | 1.80 | 9.00 |
| Liquid biofuels | 0.11 | 0.56 | 1.00 | 1.00 | 1.00 | 1.00 | 1.00 | 1.72 | 9.00 | 1.00 | 1.72 | 9.00 |
| Geothermal energy | 0.11 | 0.56 | 1.00 | 0.11 | 0.58 | 1.00 | 1.00 | 1.00 | 1.00 | 0.11 | 0.67 | 1.00 |
| Renewable municipal waste | 0.11 | 0.56 | 1.00 | 0.11 | 0.58 | 1.00 | 1.00 | 1.48 | 9.00 | 1.00 | 1.00 | 1.00 |
Table 6.
The results from the calculation as part of achieving the fuzzy weight values from the fuzzy comparison matrix.
Table 6.
The results from the calculation as part of achieving the fuzzy weight values from the fuzzy comparison matrix.
| Renewable Energy Source | ||||||
|---|---|---|---|---|---|---|
| Solid biofuels | 7.11 | 14.74 | 56.00 | 0.02 | 0.16 | 1.43 |
| Solar energy | 8.00 | 32.32 | 64.00 | 0.03 | 0.35 | 1.64 |
| Hydropower | 1.78 | 4.80 | 8.00 | 0.01 | 0.05 | 0.20 |
| Wind energy | 2.67 | 5.65 | 16.00 | 0.01 | 0.06 | 0.41 |
| Biogas | 6.22 | 10.65 | 48.00 | 0.02 | 0.12 | 1.23 |
| Liquid biofuels | 5.33 | 9.11 | 40.00 | 0.02 | 0.10 | 1.02 |
| Geothermal energy | 3.56 | 6.52 | 24.00 | 0.01 | 0.07 | 0.61 |
| Renewable municipal waste | 4.44 | 7.36 | 32.00 | 0.02 | 0.08 | 0.82 |
| Sum | 39.11 | 91.14 | 288.00 | 0.14 | 1.00 | 7.36 |
| Results | - | |||||
| 0.00 | 0.01 | 0.03 | ||||
Table 7.
Determined degree of the possibility and the smallest degree of fuzzy number.
| Solid Biofuels | Solar Energy | Hydropower | Wind Energy | ||||
| W1 | W2 | W3 | W4 | ||||
| W1 ≥ W2 | 0.88 | W2 ≥ W1 | 1 | W3 ≥ W1 | 0.62 | W4 ≥ W1 | 0.79 |
| W1 ≥ W3 | 1 | W2 ≥ W3 | 1 | W3 ≥ W2 | 0.37 | W4 ≥ W2 | 0.57 |
| W1 ≥ W4 | 1 | W2 ≥ W4 | 1 | W3 ≥ W4 | 0.95 | W4 ≥ W3 | 1 |
| W1 ≥ W5 | 1 | W2 ≥ W5 | 1 | W3 ≥ W5 | 0.74 | W4 ≥ W5 | 0.88 |
| W1 ≥ W6 | 1 | W2 ≥ W6 | 1 | W3 ≥ W6 | 0.8 | W4 ≥ W6 | 0.91 |
| W1 ≥ W7 | 1 | W2 ≥ W7 | 1 | W3 ≥ W7 | 0.91 | W4 ≥ W7 | 0.98 |
| W1 ≥ W8 | 1 | W2 ≥ W8 | 1 | W3 ≥ W8 | 0.87 | W4 ≥ W8 | 0.95 |
| min. | 0.88 | min. | 1 | min. | 0.37 | min. | 0.57 |
| Biogas | Liquid Biofuels | Geothermal Energy | Renewable Municipal Waste | ||||
| W5 | W6 | W7 | W8 | ||||
| W5 ≥ W1 | 0.96 | W6 ≥ W1 | 0.94 | W7 ≥ W1 | 0.87 | W8 ≥ W1 | 0.91 |
| W5 ≥ W2 | 0.83 | W6 ≥ W2 | 0.8 | W7 ≥ W2 | 0.67 | W8 ≥ W2 | 0.74 |
| W5 ≥ W3 | 1 | W6 ≥ W3 | 1 | W7 ≥ W3 | 1 | W8 ≥ W3 | 1 |
| W5 ≥ W4 | 1 | W6 ≥ W4 | 1 | W7 ≥ W4 | 1 | W8 ≥ W4 | 1 |
| W5 ≥ W6 | 1 | W6 ≥ W5 | 0.98 | W7 ≥ W5 | 0.93 | W8 ≥ W5 | 0.96 |
| W5 ≥ W7 | 1 | W6 ≥ W7 | 1 | W7 ≥ W6 | 0.95 | W8 ≥ W6 | 0.98 |
| W5 ≥ W8 | 1 | W6 ≥ W8 | 1 | W7 ≥ W8 | 0.98 | W8 ≥ W7 | 1 |
| min. | 0.83 | min. | 0.8 | min. | 0.67 | min. | 0.74 |
Table 8.
The ranking of RES preferred in the Polish industry in the context of electricity in accordance with the normalized nonfuzzy weight vector.
Table 8.
The ranking of RES preferred in the Polish industry in the context of electricity in accordance with the normalized nonfuzzy weight vector.
| Renewable Energy Source | Ranking | |
|---|---|---|
| Solid biofuels | 0.15 | 2 |
| Solar energy | 0.17 | 1 |
| Hydropower | 0.06 | 7 |
| Wind energy | 0.10 | 6 |
| Biogas | 0.14 | 3 |
| Liquid biofuels | 0.14 | 3 |
| Geothermal energy | 0.12 | 5 |
| Renewable municipal waste | 0.13 | 4 |
Publisher’s Note: MDPI stays neutral with regard to jurisdictional claims in published maps and institutional affiliations. |
© 2021 by the authors. Licensee MDPI, Basel, Switzerland. This article is an open access article distributed under the terms and conditions of the Creative Commons Attribution (CC BY) license (https://creativecommons.org/licenses/by/4.0/).
Share and Cite
MDPI and ACS Style
Ulewicz, R.; Siwiec, D.; Pacana, A.; Tutak, M.; Brodny, J. Multi-Criteria Method for the Selection of Renewable Energy Sources in the Polish Industrial Sector. Energies 2021, 14, 2386. https://doi.org/10.3390/en14092386
AMA Style
Ulewicz R, Siwiec D, Pacana A, Tutak M, Brodny J. Multi-Criteria Method for the Selection of Renewable Energy Sources in the Polish Industrial Sector. Energies. 2021; 14(9):2386. https://doi.org/10.3390/en14092386
Chicago/Turabian StyleUlewicz, Robert, Dominika Siwiec, Andrzej Pacana, Magdalena Tutak, and Jarosław Brodny. 2021. "Multi-Criteria Method for the Selection of Renewable Energy Sources in the Polish Industrial Sector" Energies 14, no. 9: 2386. https://doi.org/10.3390/en14092386
Note that from the first issue of 2016, this journal uses article numbers instead of page numbers. See further details here.