
Considering the Environmental Impacts of Bioenergy Technologies to Support German Energy Transition

 , , and
Abstract
:1. Introduction
1.1. Aim and Objectives
- To assess the environmental effect of alternative energy technologies on land-use, sedimentation, water, and nutrient delivery.
- To evaluate the potentiality of energy feedstock/substrates such as manure and biomass (e.g., maize, forest residue, and short-rotation plant) and suitable land space.
1.2. Overview of SustainableGAS Project
1.3. InVEST Model
2. Methodology
2.1. Data Sets and Analysis


2.2. InVEST Input Data
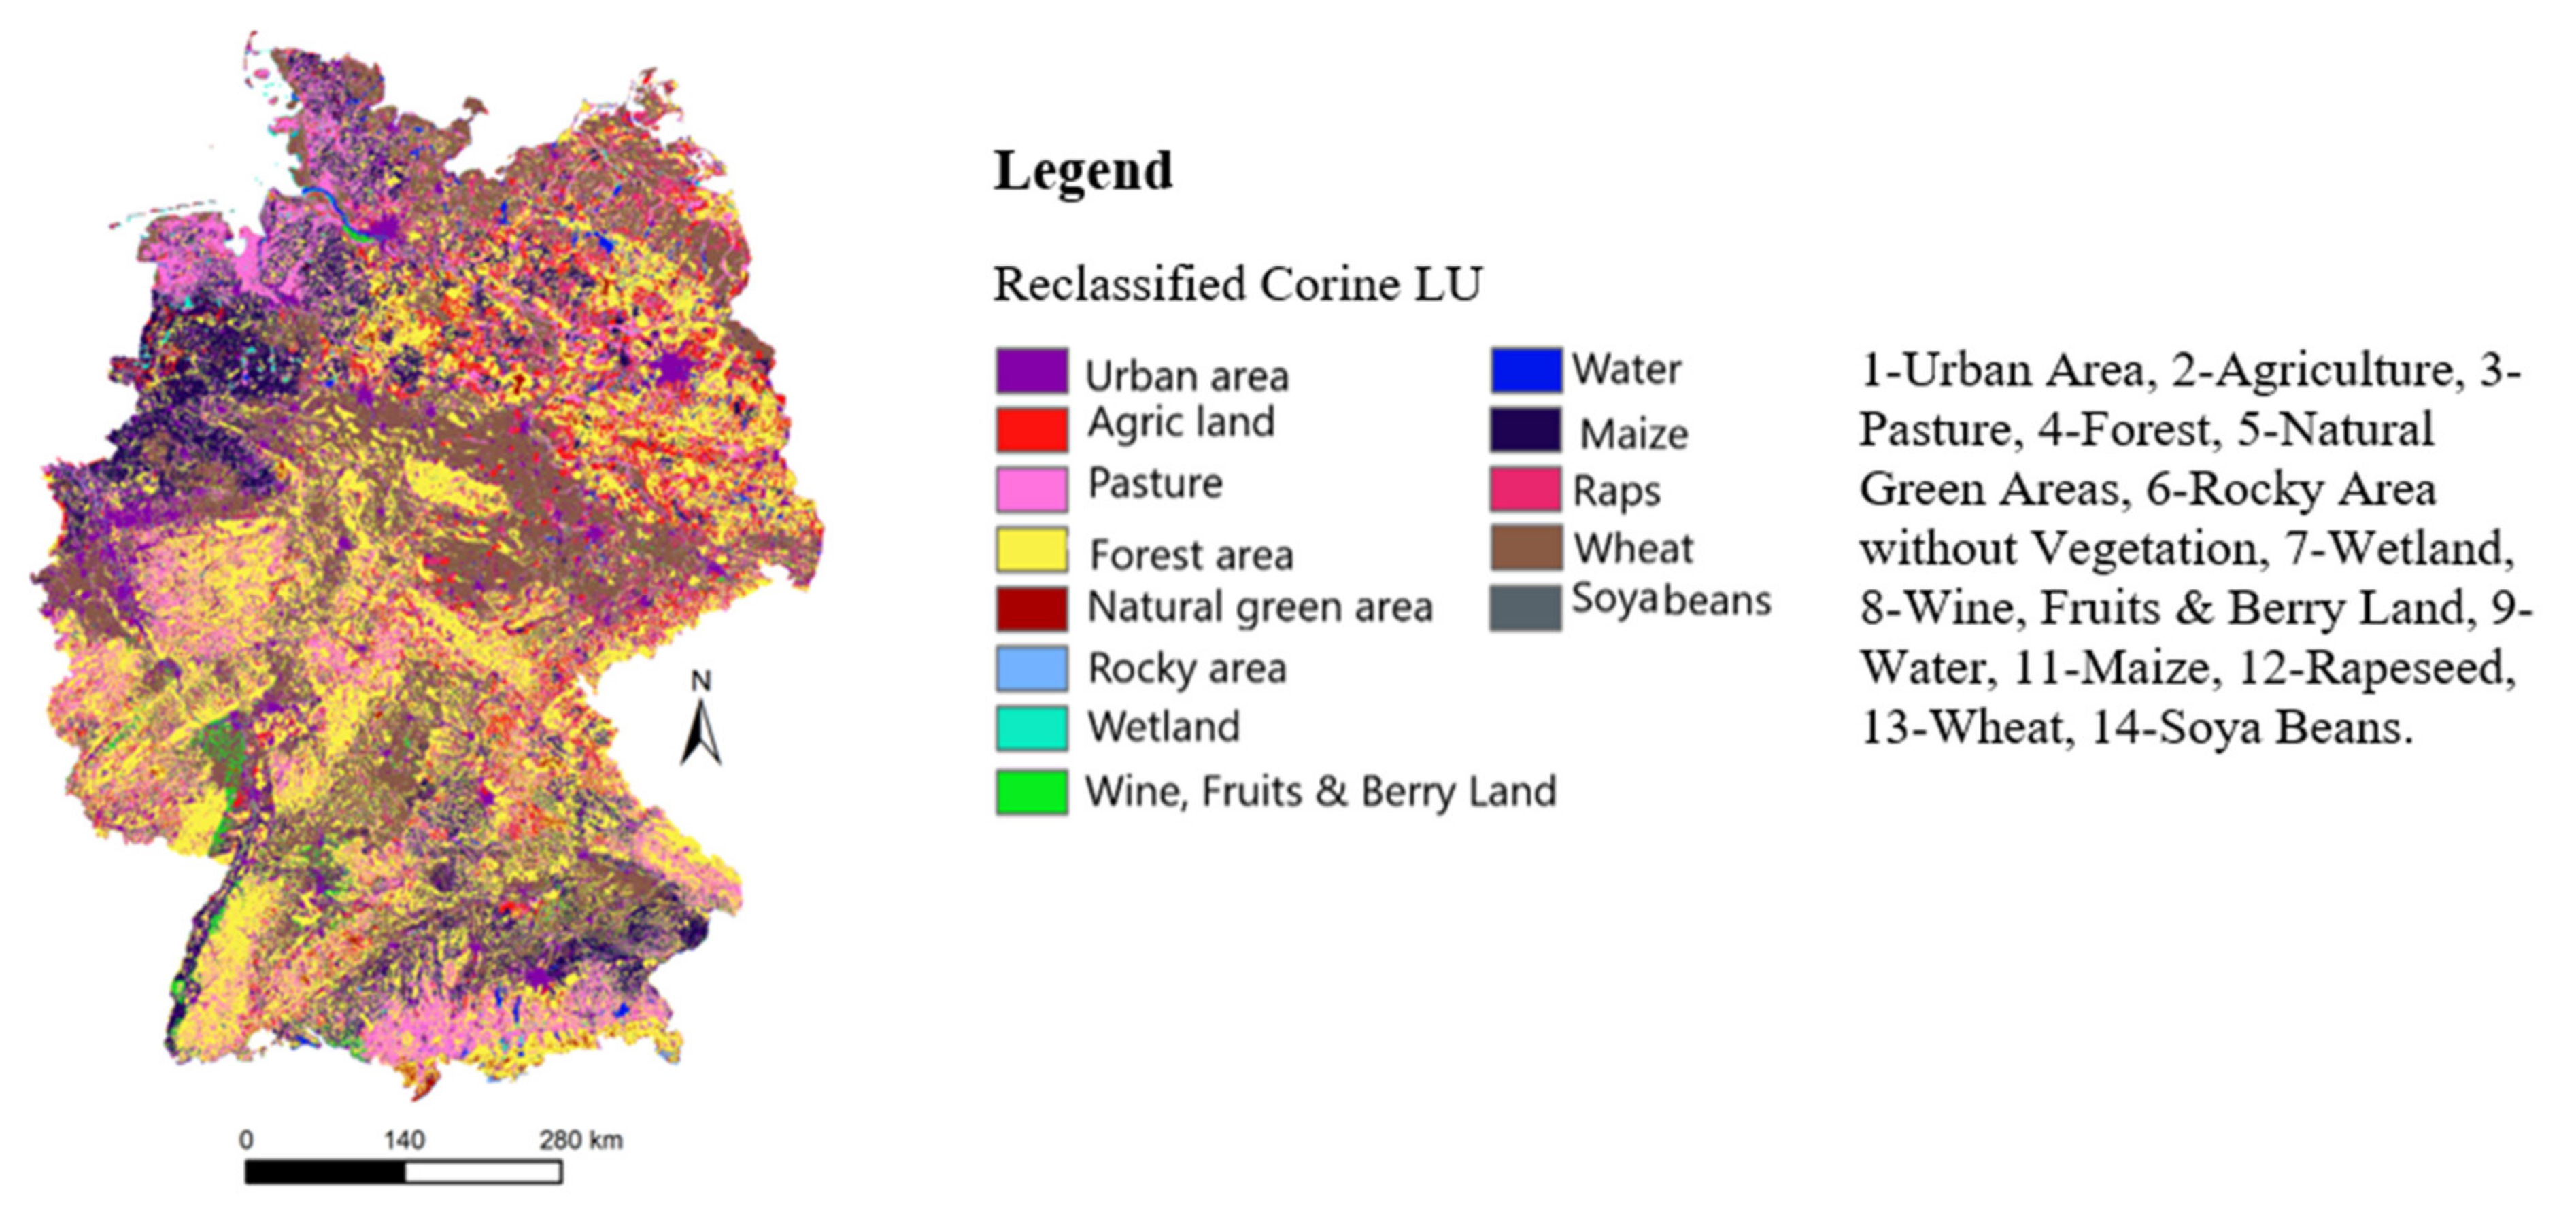
2.3. Land Use Map Reclassification
3. Result
3.1. Feedstock’s with Direct Environmental Impacts

| RGP’s Type | Biomass per RGP [t y−1] | Type of Biomass | Harvest [t/ha−1] Source |
|---|---|---|---|
| Bio-methane Maize RGP: Manure RGP: | 52,414.8 | Maize | 93.3 [37] |
| 5783.7 | |||
| SNG Forest Residue: | 51,923.1 | Forest residues | 1.5 |
| Syngas Forest Residue: | 51,923.1 | ||
| SNGSRPs: | 52,597.4 | Short rotation forestry | 12 |
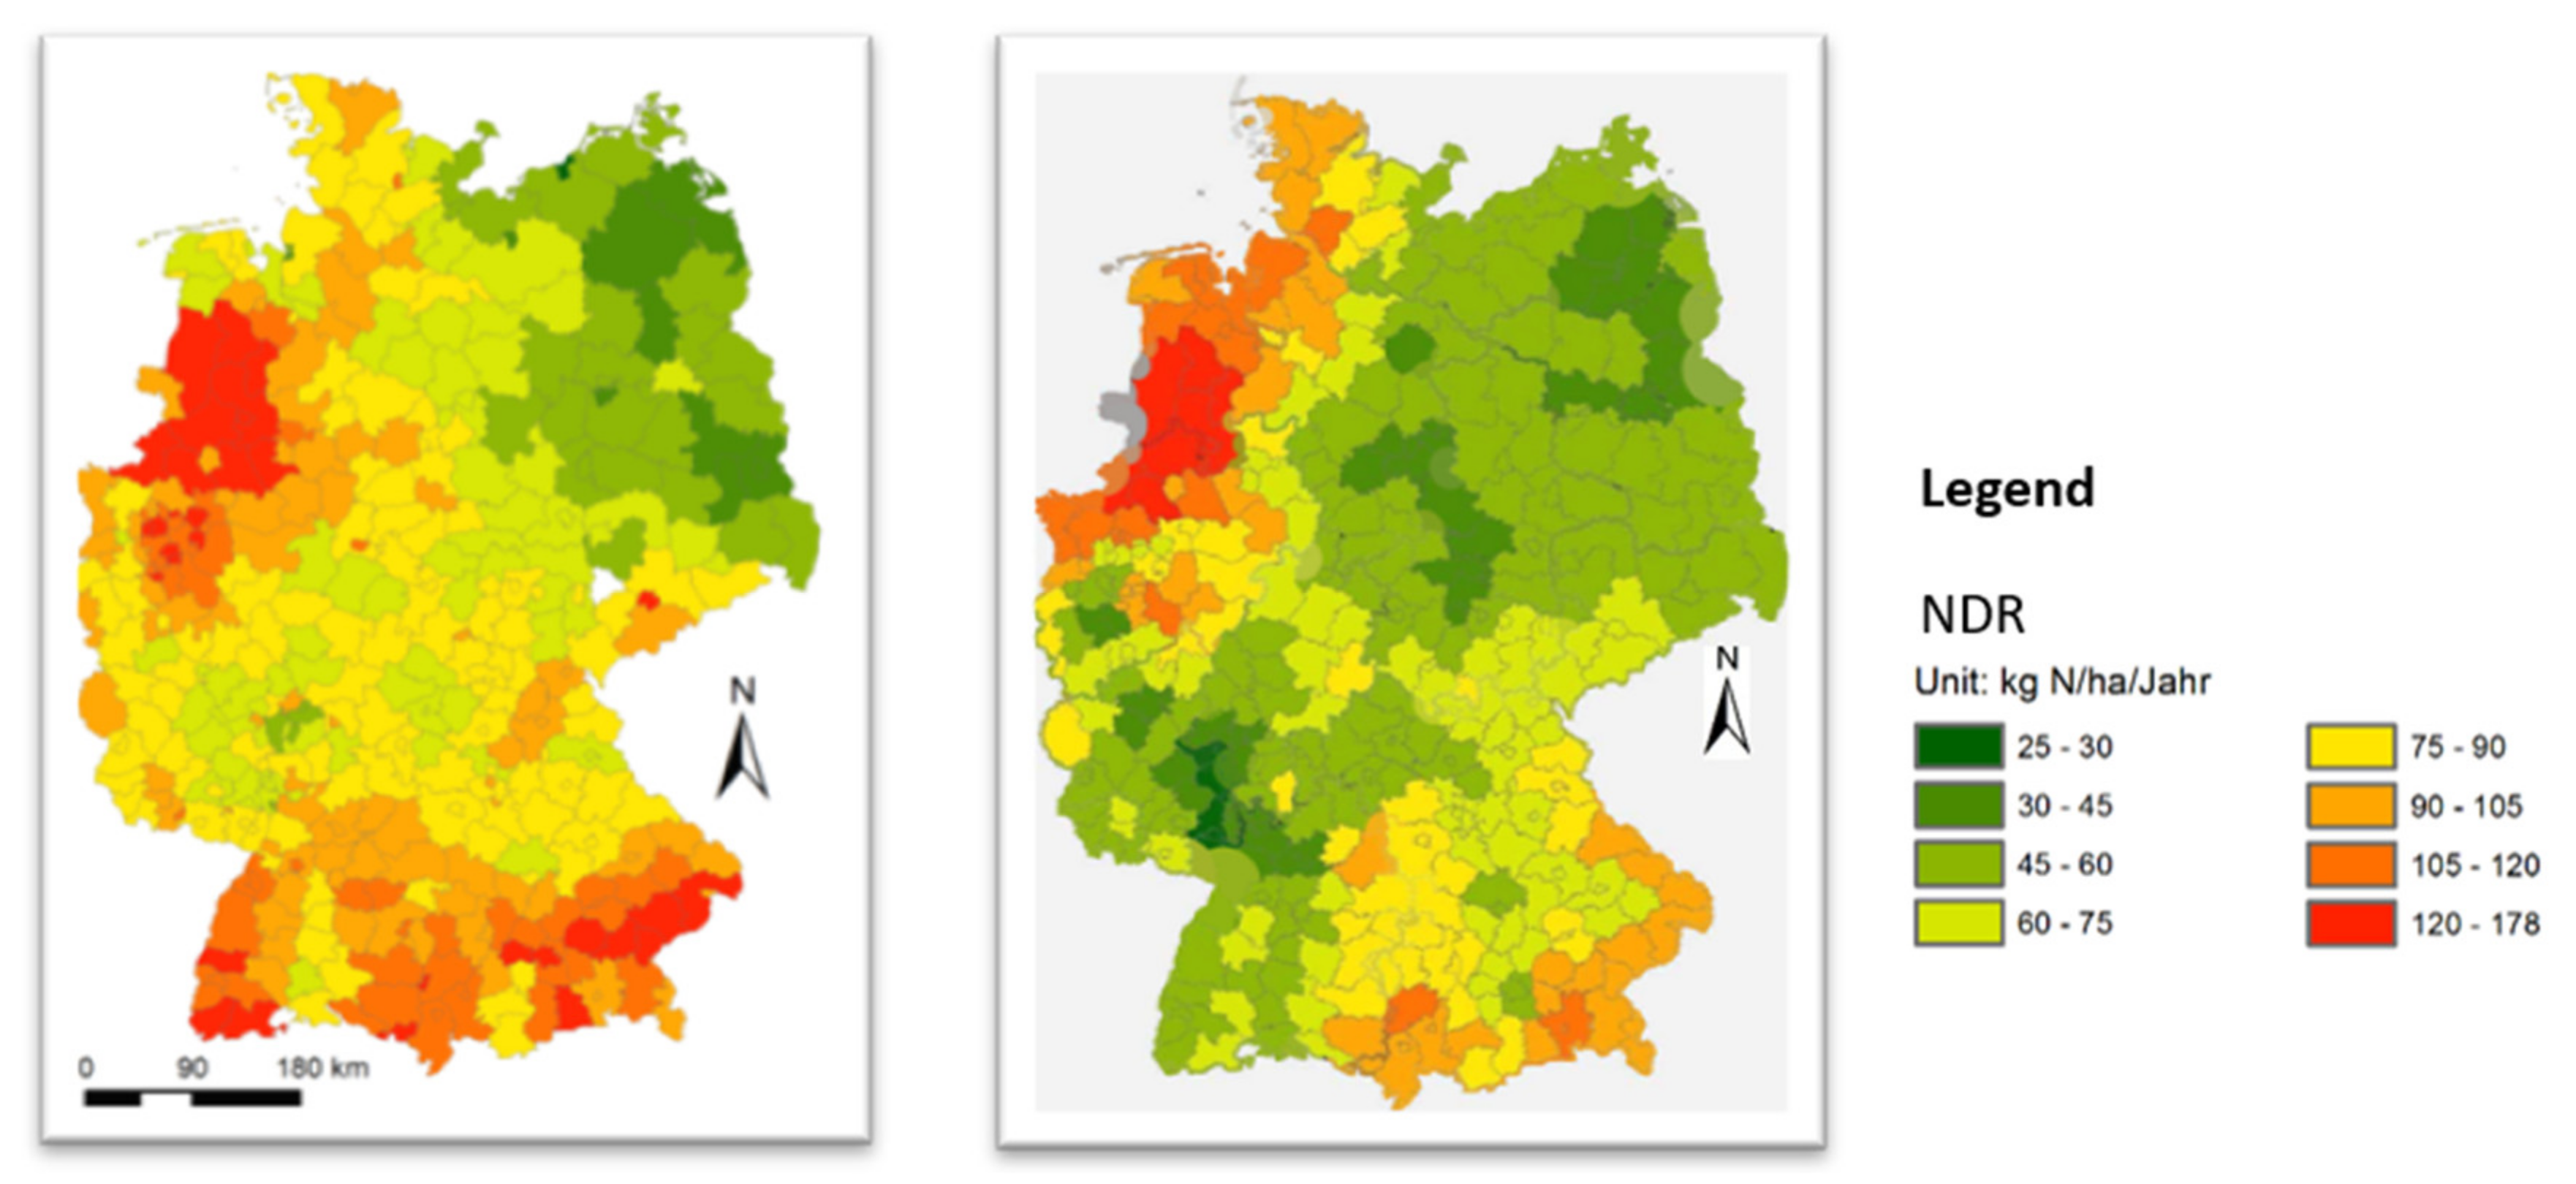
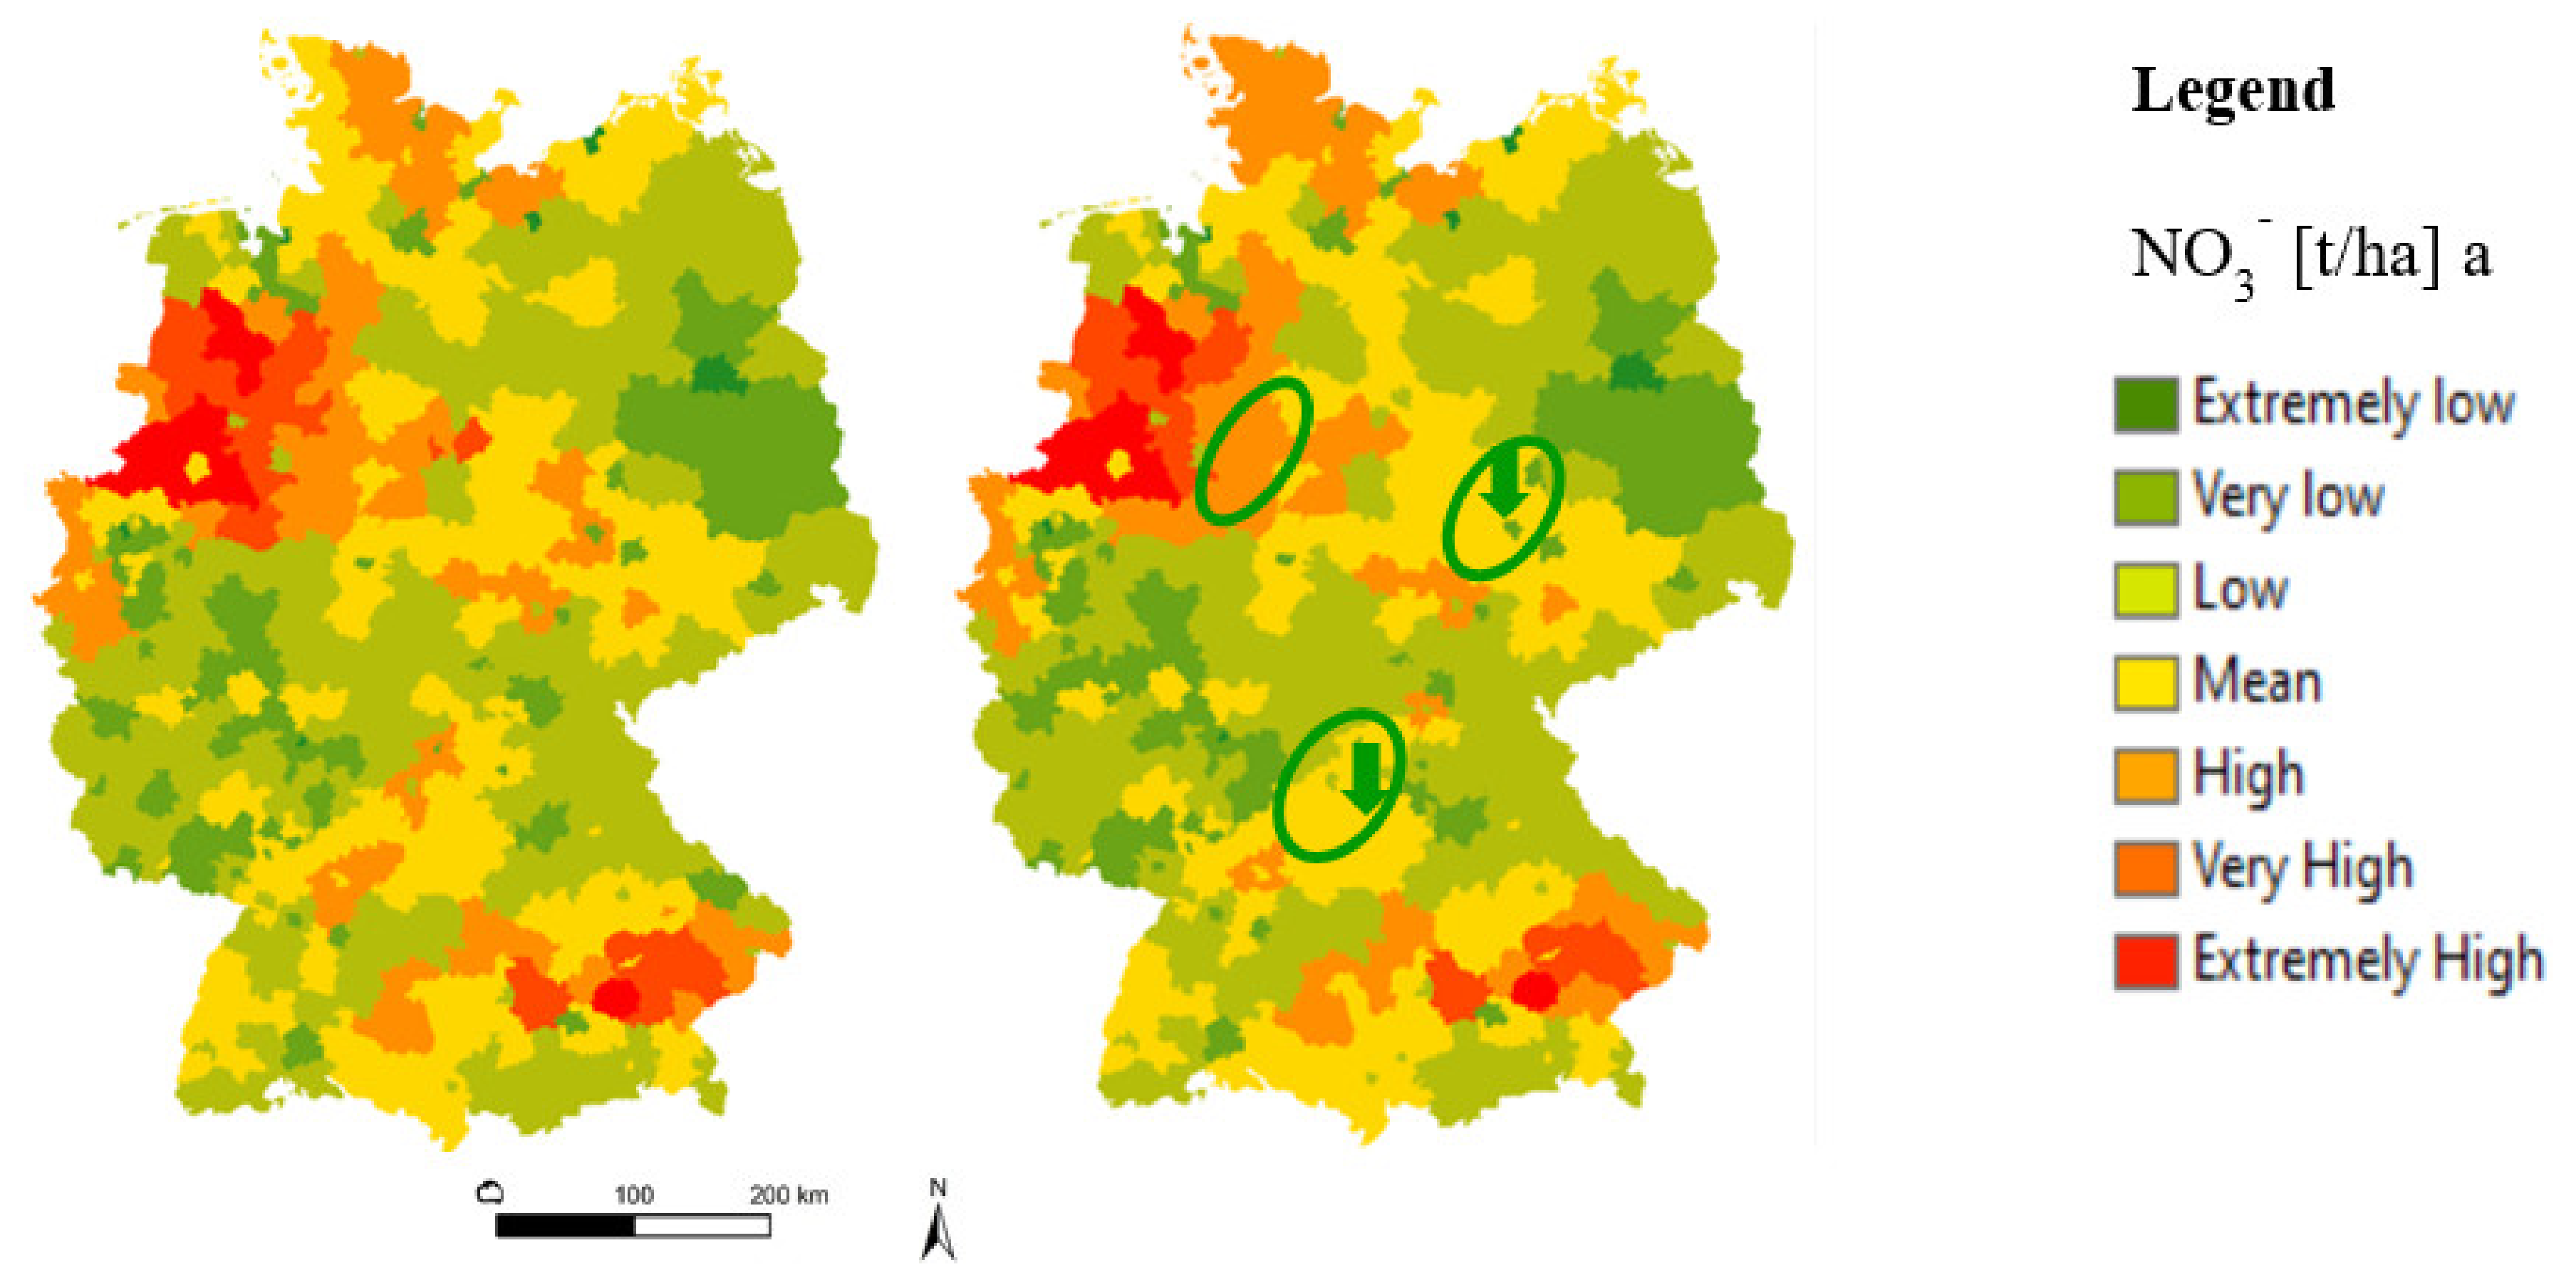
3.2. Nitrate Vulnerable Zones Assessment
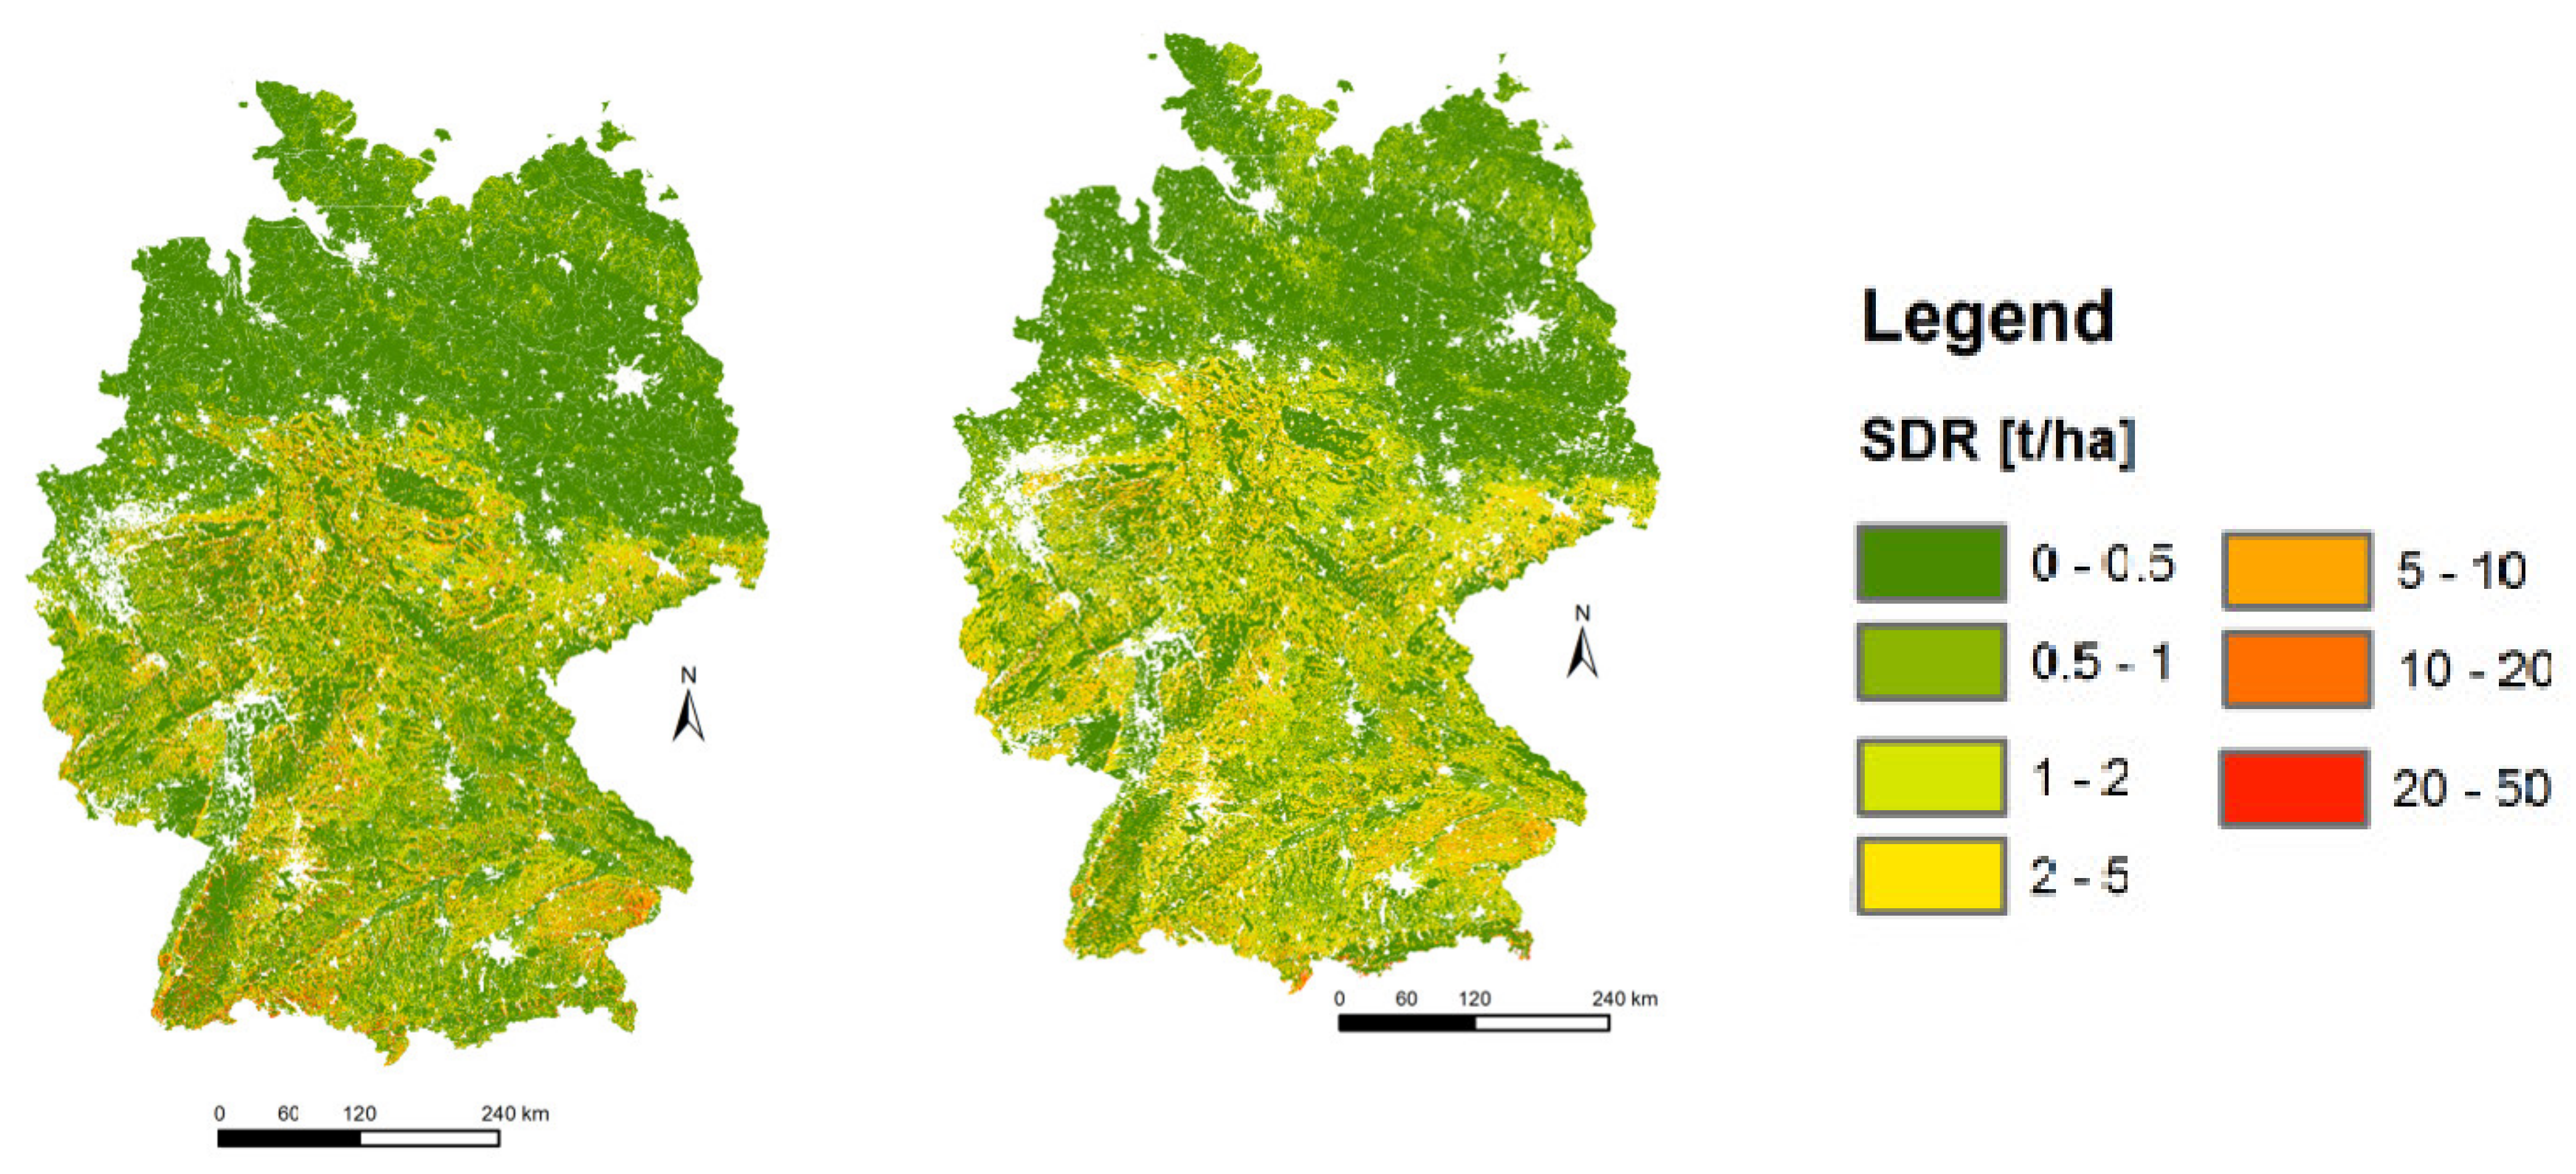
3.3. Impact of Land Use Change on Erosion
4. Discussion
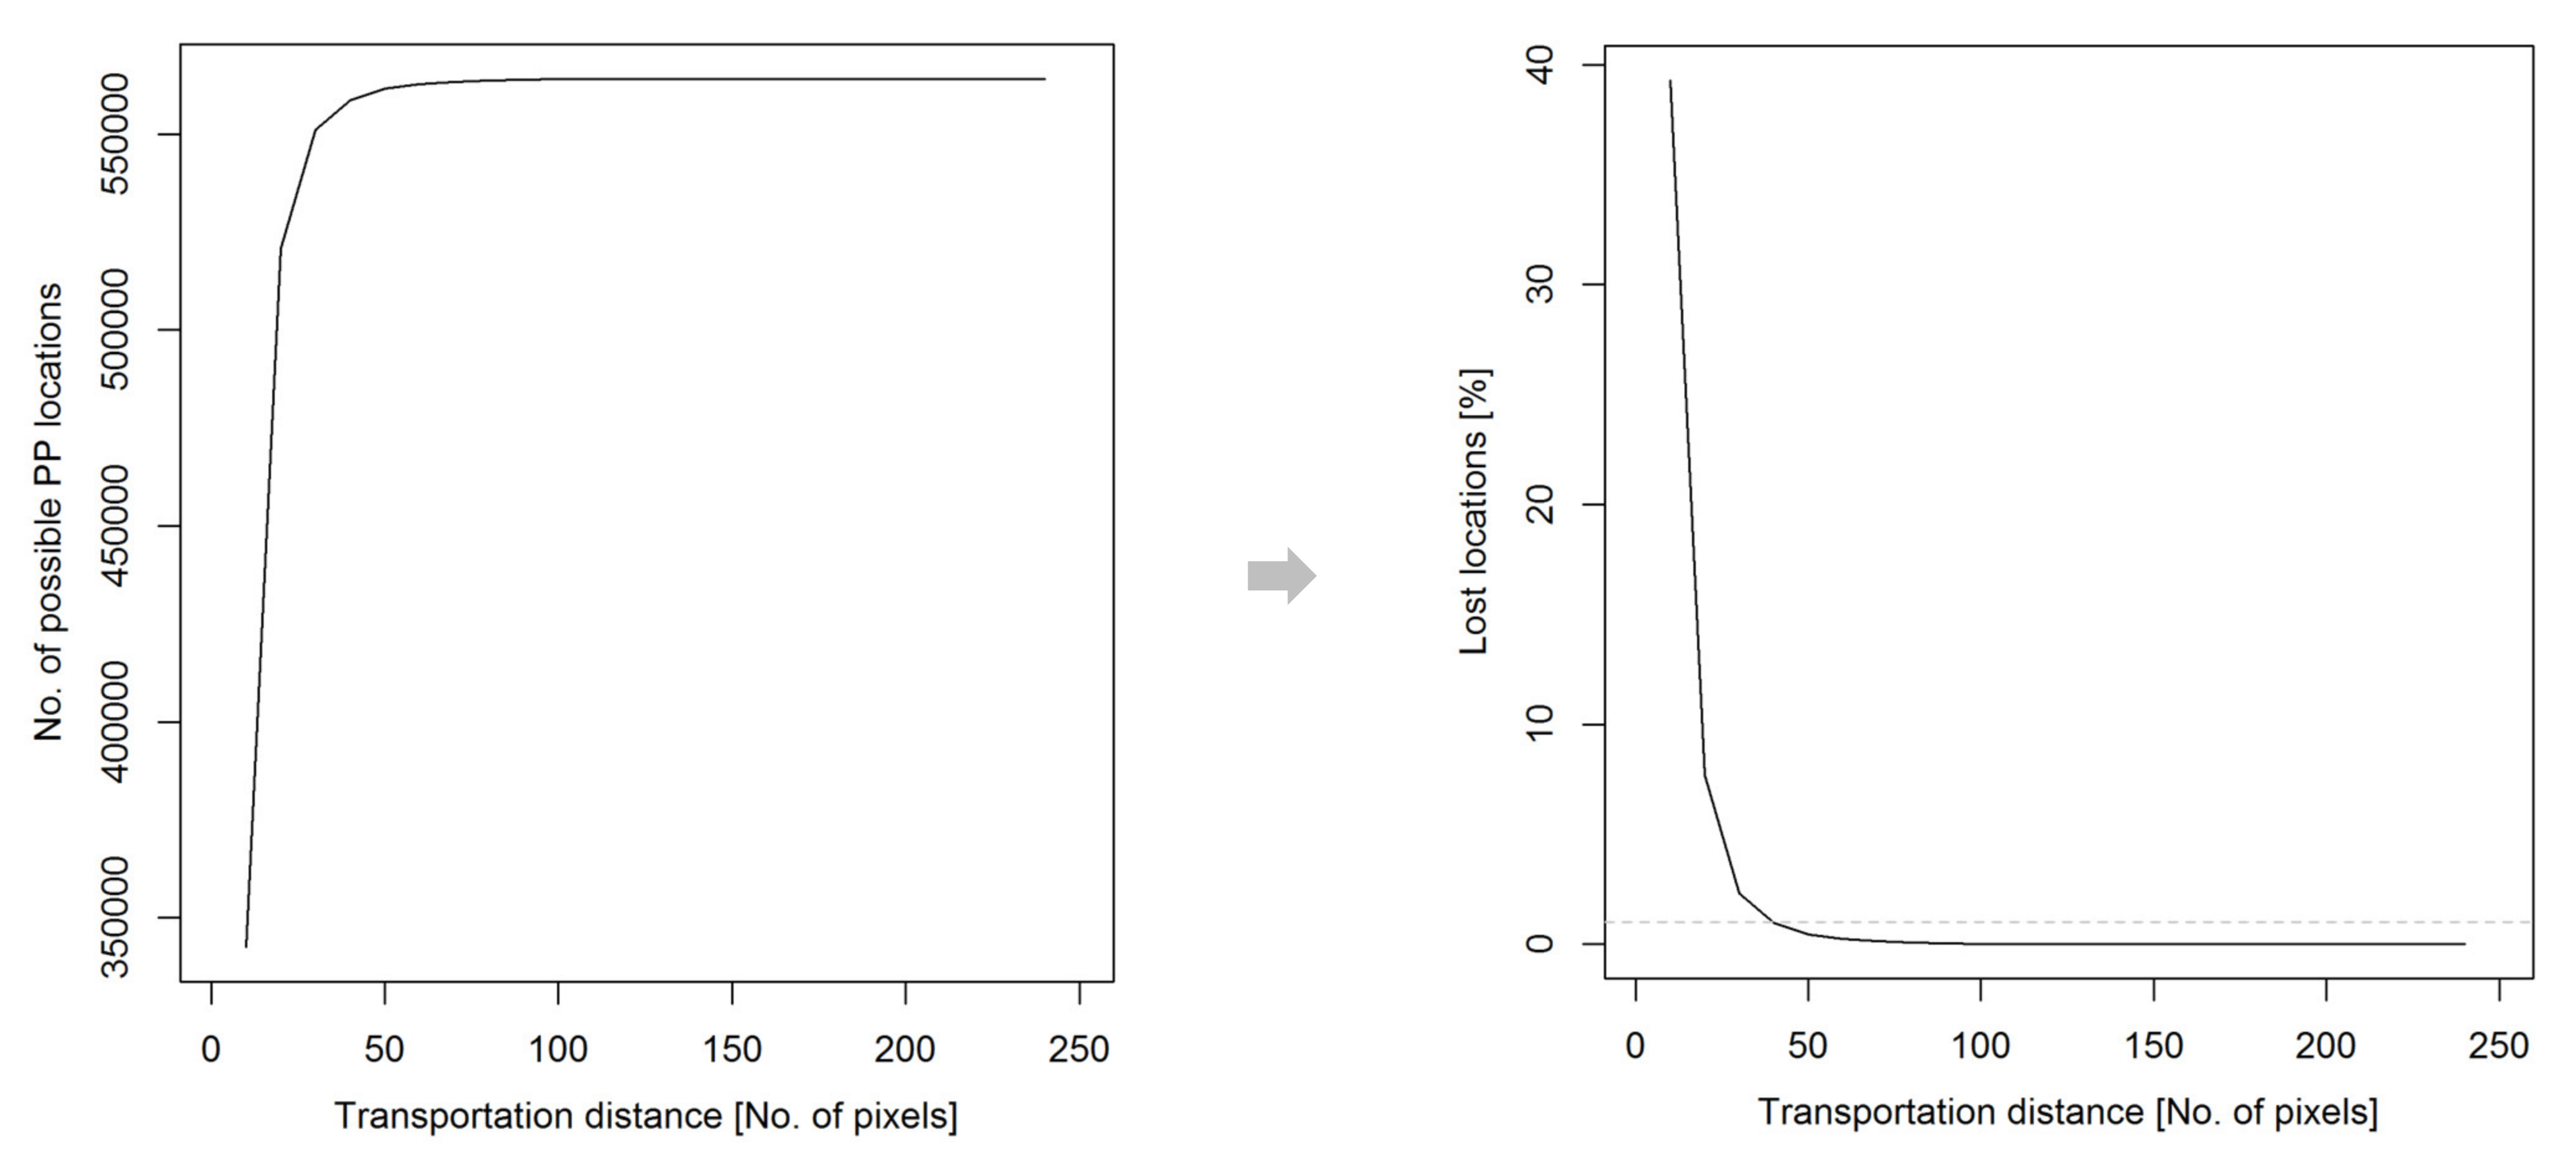
4.1. Sitting of RGPs
4.2. Environmental Impacts of Manure
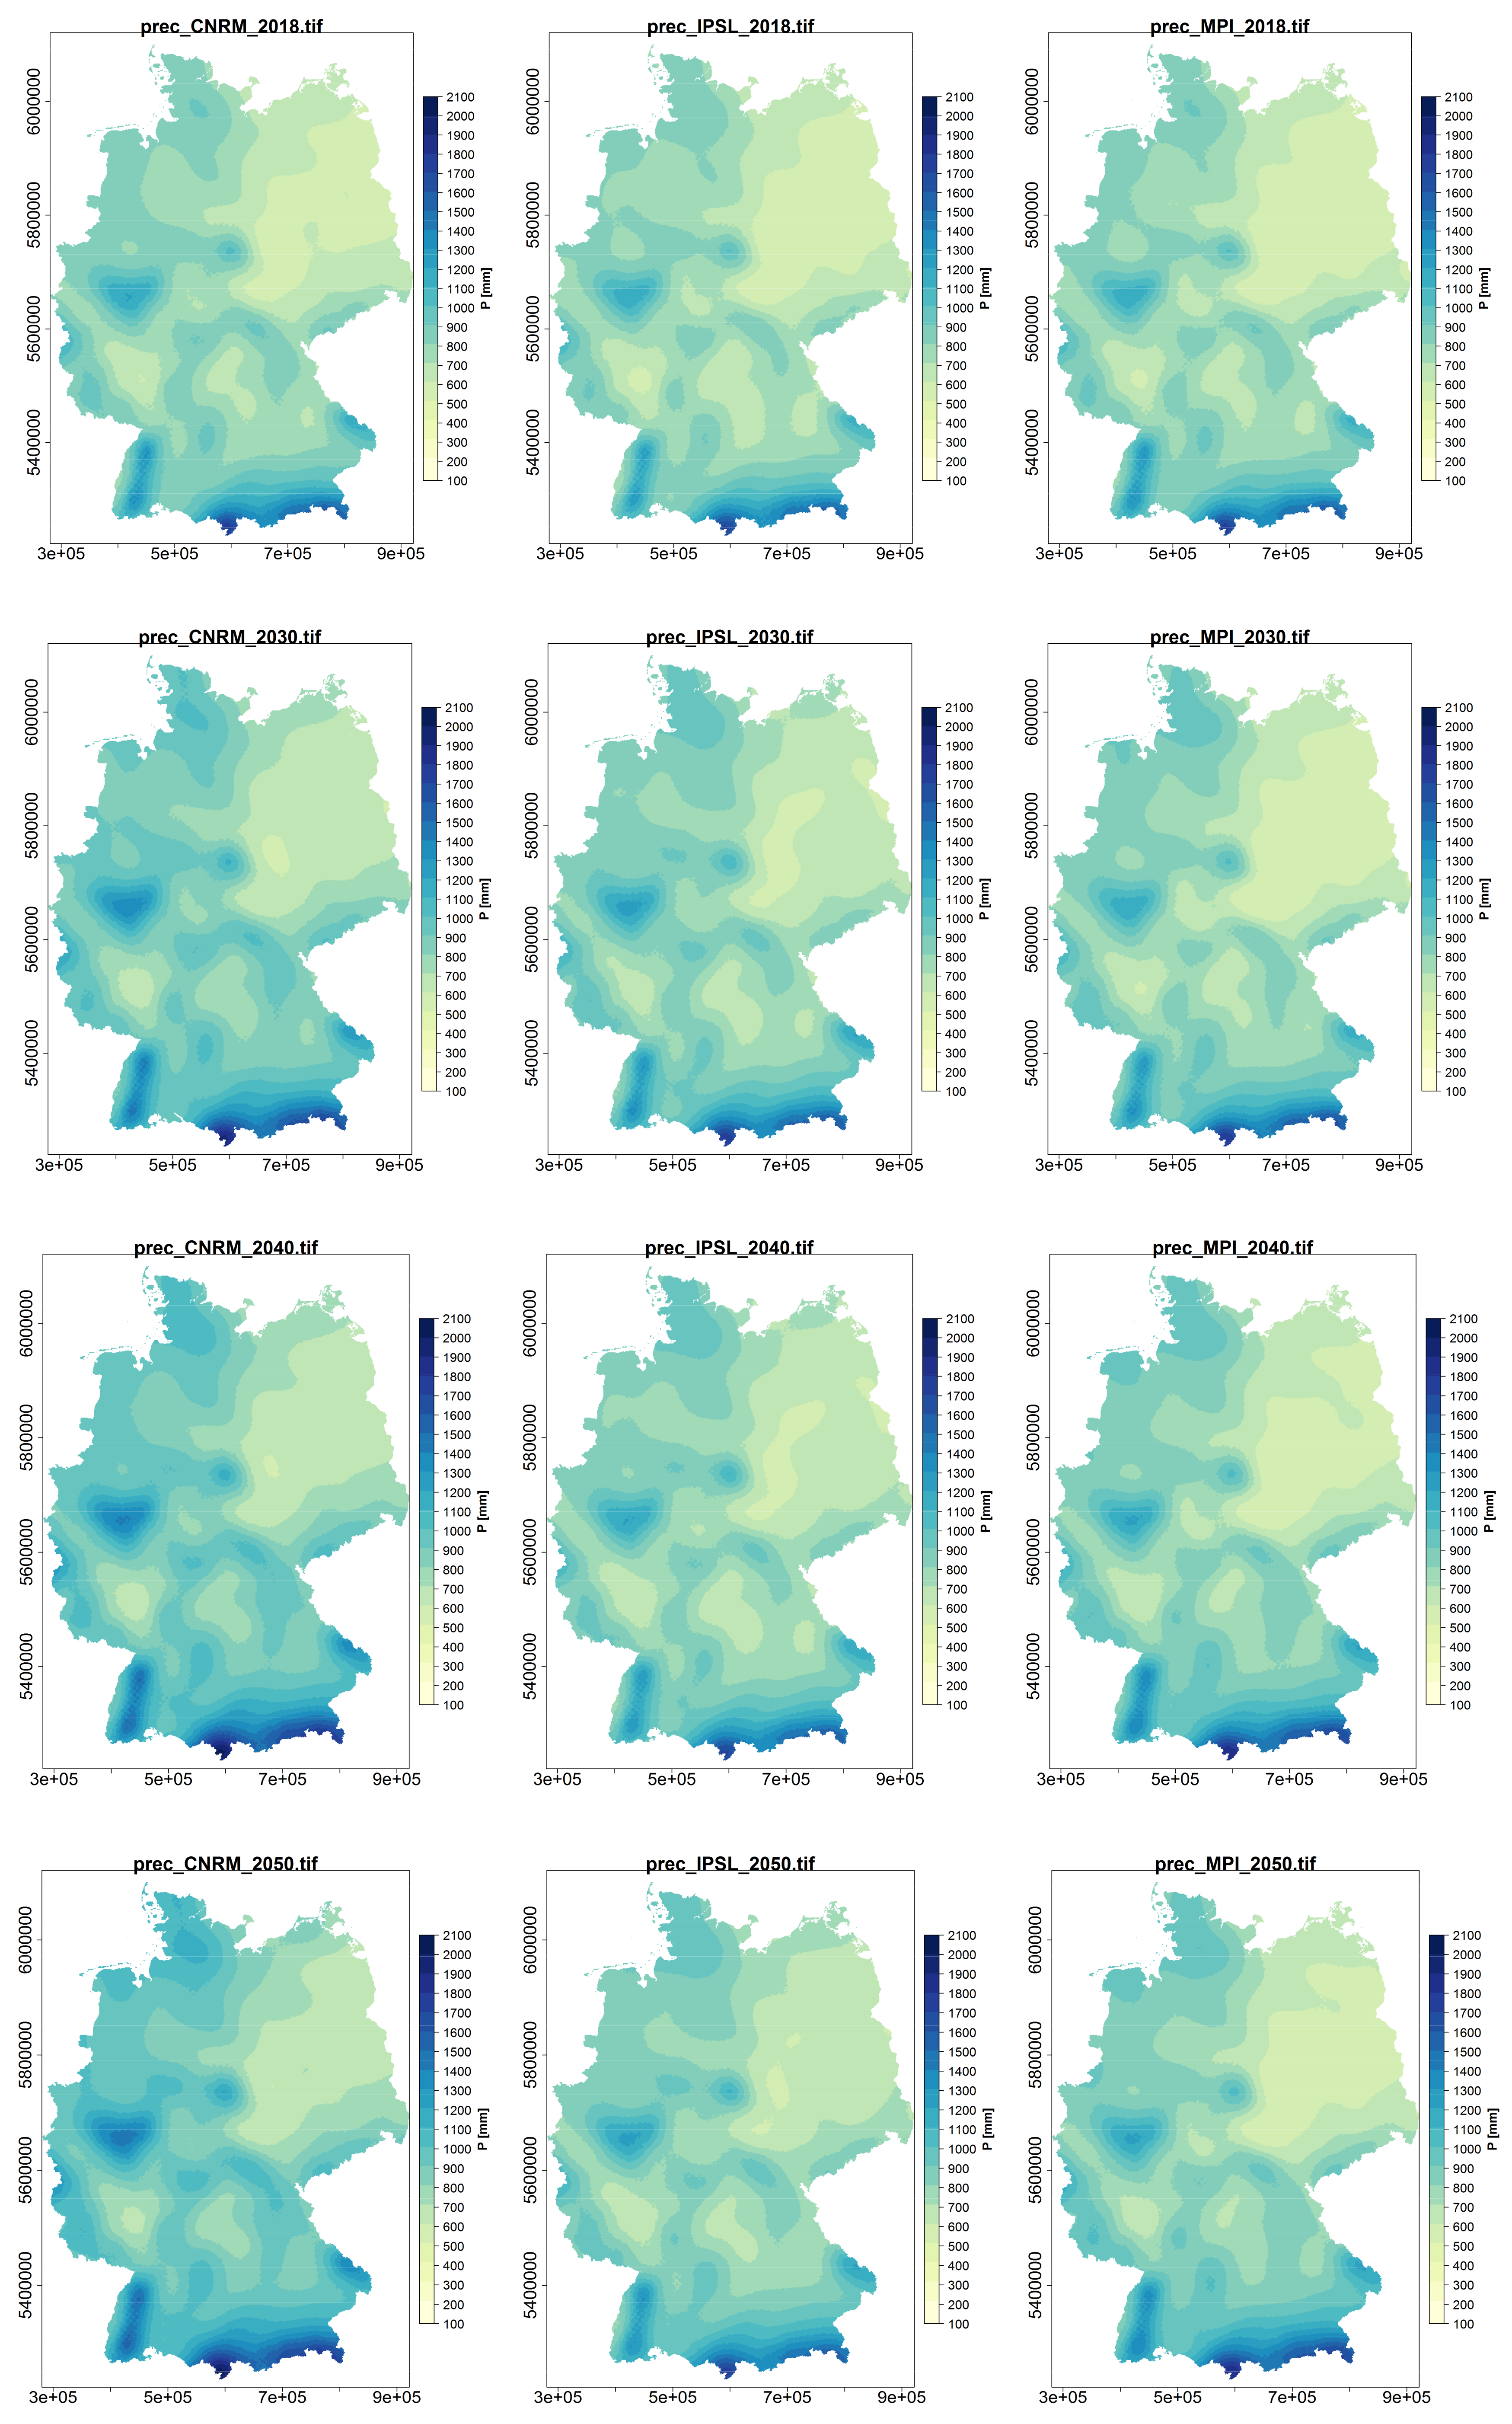
4.3. Modifications of Climate Data
4.4. Recalculation of Precipitation and Erosivity Index in Steps
5. Conclusions
Author Contributions
Funding
Institutional Review Board Statement
Informed Consent Statement
Data Availability Statement
Acknowledgments
Conflicts of Interest
Abbreviations
| CORDEX | Coordinated Regional Climate Downscaling Experiment |
| ESGF | Earth System Grid Federation |
| ER | Erosion |
| ES | Ecosystem services |
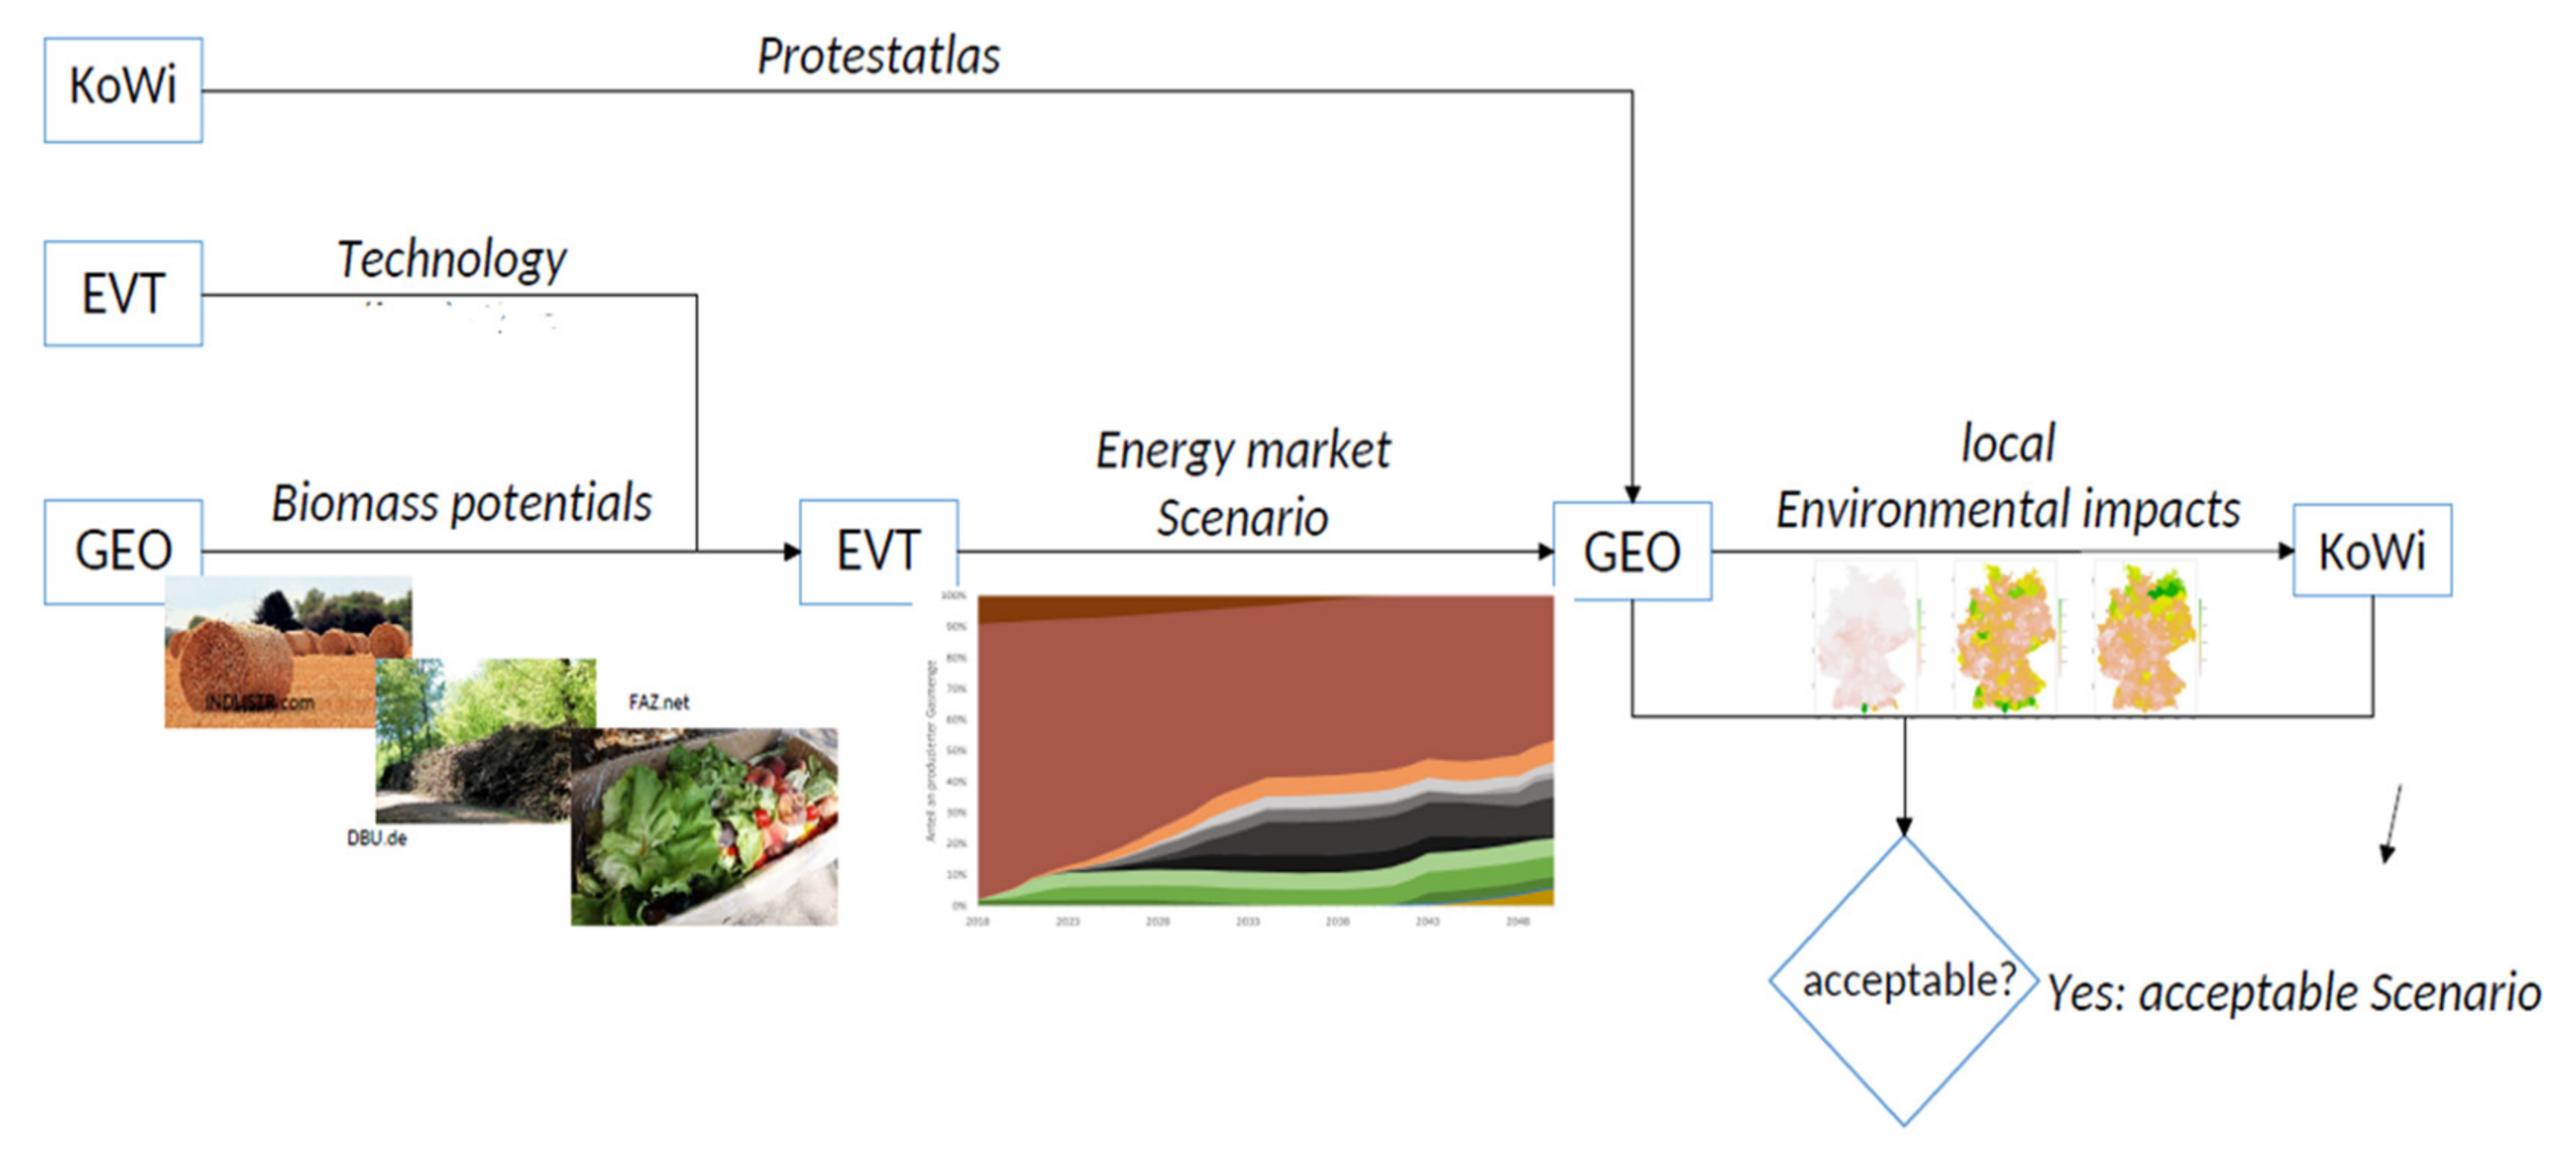
| EVT | Energy/Process Engineers |
| GCMs | General Circulation Models |
| GEO | Geographer/Environmental Professionals |
| GIS | Geographical information technology |
| InVEST | Integrated Valuation of Ecosystem Services and Trade-offs |
| JRC | Joint Research Center |
| KoWi | Communication/Social Scientists |
| MWel | Mega Watt Equivalent of Electricity |
| M | Meter |
| NDR | Nutrient delivery ratio |
| PEM | Proton Exchange Membrane |
| PtG-CH4 | Power-to-Methane |
| PtG-H2 | Power-to-Hydrogen |
| RCMs | Regional Climate Models |
| RCP 8.5 | Representative Concentration Pathway |
| RGP | Renewable gas plants |
| SDR | Sediment delivery ratio |
| SNG | substitute natural gas |
| SOEC | Solid Oxide Electrolyze Cell |
| SRF | short rotation forestry |
| SynGas | synthesis gas |
| SMHI | Swedish Meteorological and Hydrological Institute |
| TRL | Technology Readiness Level |
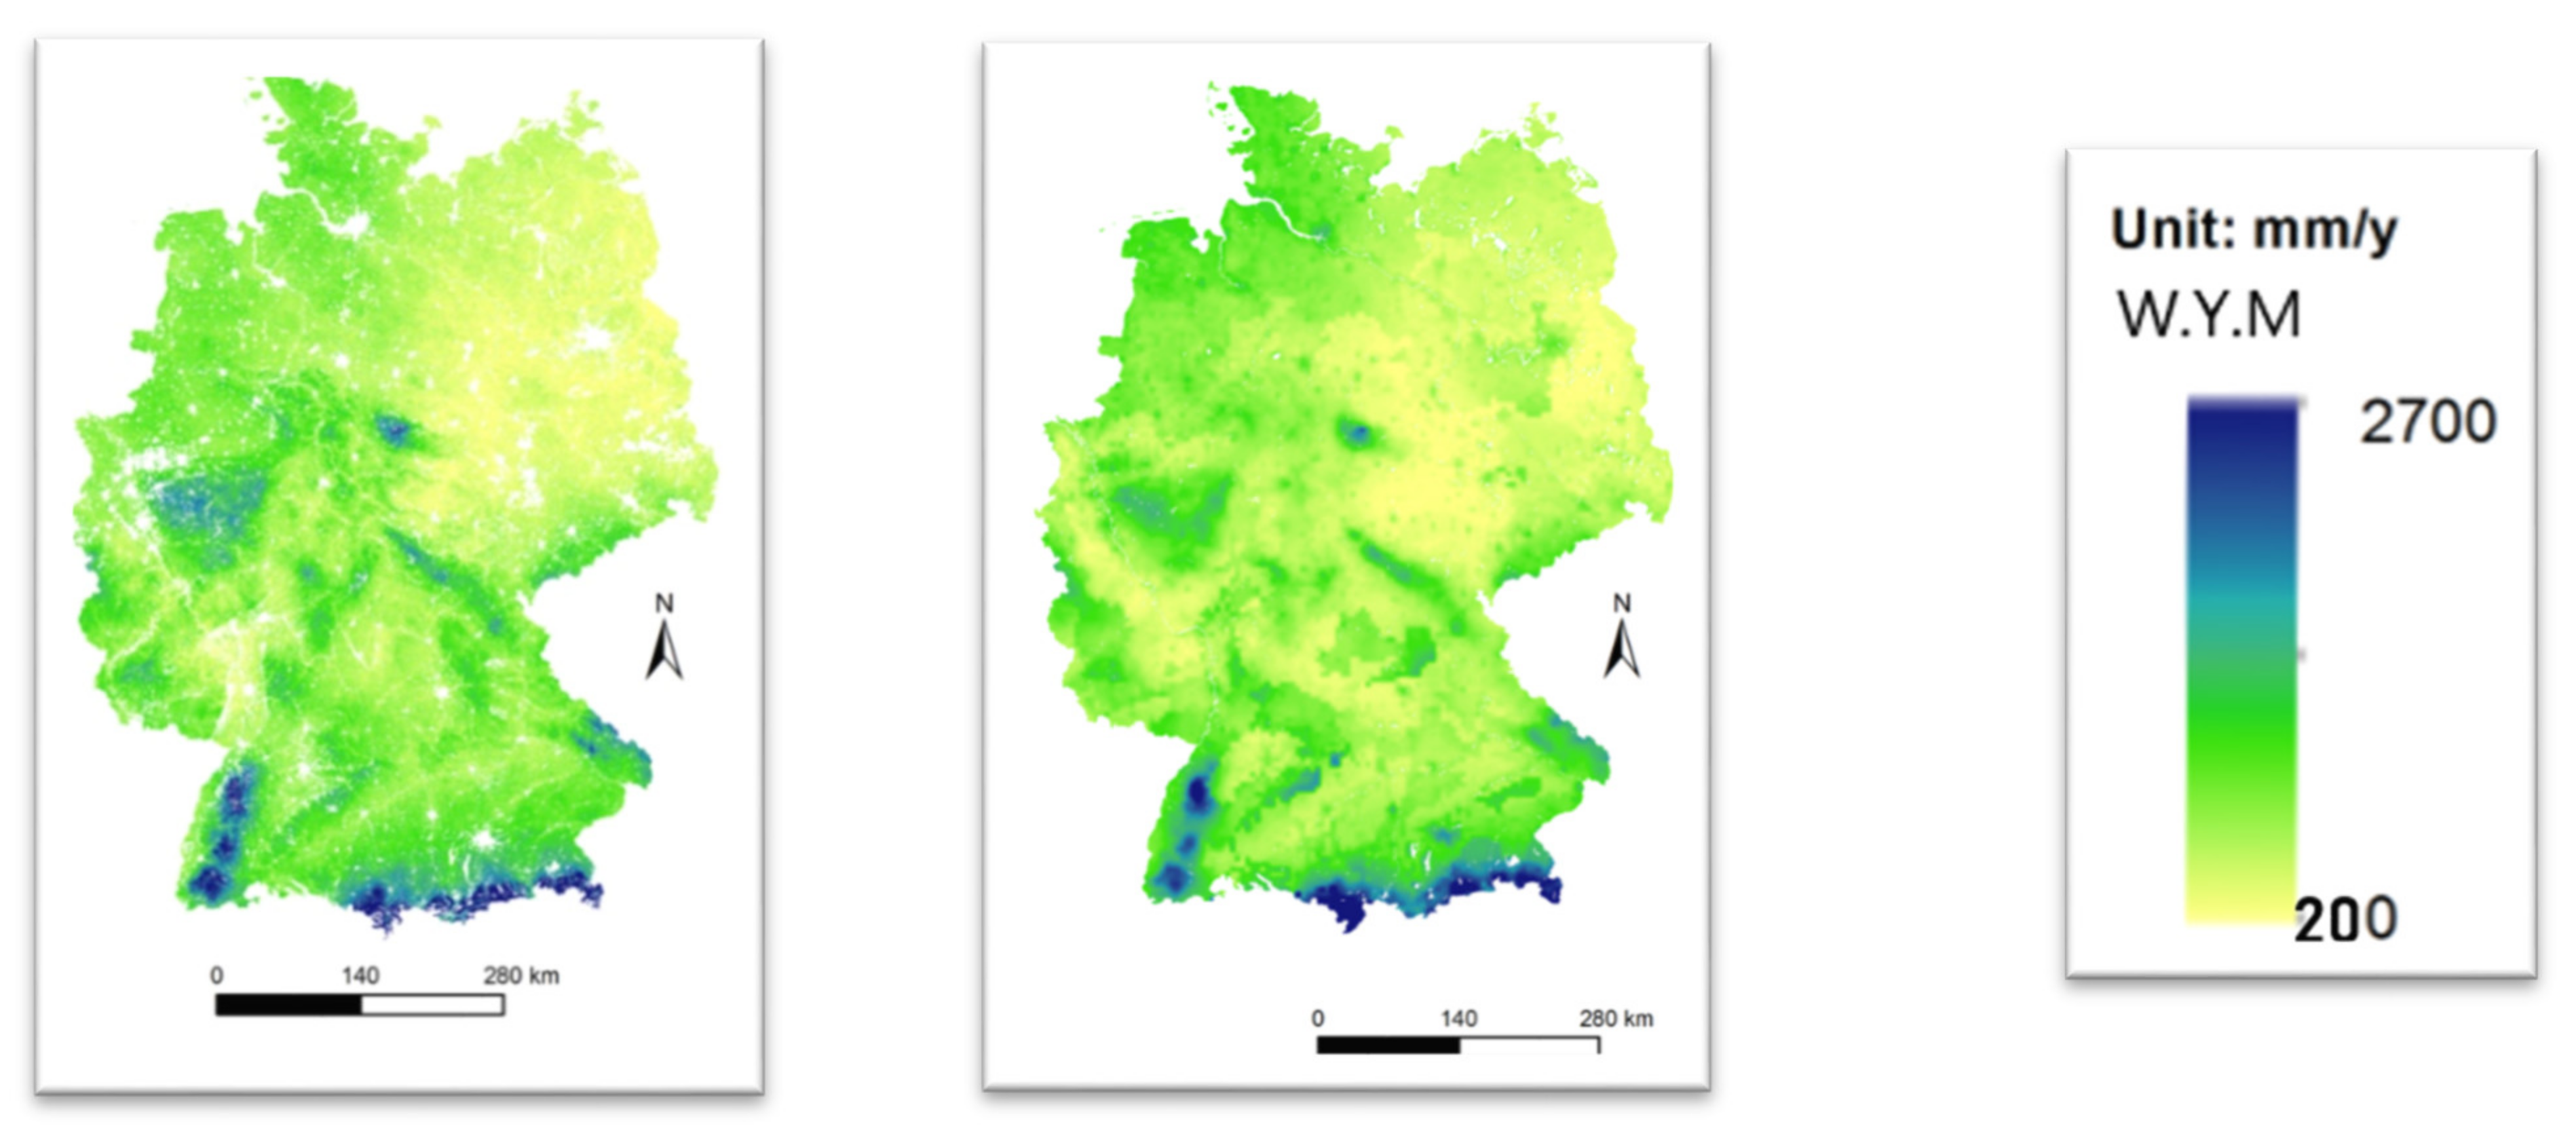
| WYM | Water yield model |
Appendix A
| Input Data | Sources | Description |
|---|---|---|
| (Digital Elevation Model) The DEM is a GIS raster file. We made sure the DEM is corrected by filling in sinks. To ensure proper flow routing which helps to determine the slope. | COPERNICUS (DEM E4030 + E4020) http://land.copernicus.eu | Or. Resolution.: User Res.: 250 m |
| (Rainfal erosivity index) GIS raster which variables depends on the duration and intensity of rainfall in a location. The higher the rain stom, the greater the erosion potentials. | JRC https://esdac.jrc.ec.europa.eu/ (Roose, 1996): http://www.fao.org/docrep/t1765e/t1765e0e.htm | Time period: 1981–2010 |
| (Soil erodibility); K is a measure of the soil particle susceptibility to detachment and transported by runoff and rainfall. The unit index values are ton·ha·(ha·MJ mm)−1 | JRC: http://eusoils.jrc.ec.europa.eu/Library/Themes/Erosion/Erodibility/Data/Index.cfm (500 m resolution) | Or. Res.: 500 m User. Res.: 250 m |
| (Land use land cover); is a GIS raster file, the integer code is LULC for each cell (e.g., 11 = maize). It shows different land use classes of an area | CORINE 2012 | Or. Res.: 1 km grids/year User. Res.: 250 m |
| (river network) | http://www.mapcruzin.com/free-germany-arcgis-maps-shapefiles.htm | |
| (Precipitation) is a GIS raster dataset with a non-zero value for average annual precipitation for each cell. The precipitation values should be in millimeters. | ||
| Deutsche weather service (https://www.dwd.de) | Or. Res.: 1 km grids/year User. Res.: 250 m Period: 1981–2010 | |
| Reference Evapotranspiration (reference evapotranspiration); is the potential loss of water from soil by both evaporations from the soil and transpiration by healthy plant (or grass) if sufficient water is available. The reference evapotranspiration values should be in millimeters and it is a raster dataset too. | Or. Res.: 1 km grids/year User. Res. 250 m Period: 1991–2010 | |
| (Depth to root restricting layer); root restricting layer depth is the soil depth at which root penetration is strongly inhibited because of chemical or physical characteristics. It is a GIS raster dataset valuing each cell. | German federal ministry for geosciences and raw materials (BGR) (https://geoviewer.bgr.de/mapapps/)  | Or. Res.: 250 m grid User. Res. 250 m |
| (Plant available water fraction); is the fraction of water that can be stored in the soil profile that is available for plants’ use. PAWC is a fraction from 0 to 1. Also, a raster file. | German federal ministry for geosciences and raw materials (BGR) (https://geoviewer.bgr.de/mapapps/)  | Or. Res.: 250 m grid User. Res. 250 m |
| (land use map) | CORINE 2012 | Or. Res.: 1 km grids/Jahr Benutz. Res.: 250 m |
| (Watersheds) Shape file; is a layer of watersheds that shows what each watershed contributes to a point of interest where water quality will be analyzed? It is a file of polygons | Vigiak et al. 2012 | Or. Res.: 1 km grids/Jahr user. Res.: 250 m |
| Biophysical table; is a csv table of LULC classes in an excel format with water quality coefficients data showing attributes of each class rather than showing individual cells in a raster map | http://www.fao.org/geonetwork/srv/en/main.home. Hamel P., Chaplin-Kramer,R.,Sim,S.,Mueller,C.,2015. A new approach to modelling the sediment retention service (InVEST 3.0): Case study of the Cape Fear catchment, North Carolina, USA. Sci. Total Environ. 166–177. |
| Model | INPUT DATA | Data Sources | Description |
|---|---|---|---|
| SDR | (Soil erosion map) | European Soil Data Centre (ESDAC), European Commission, Joint Research Centre https://esdac.jrc.ec.europa.eu/tmp_dataset_access_req_17702#tabs-0-filters=2 | Or. Res.: 100 m user. Res.: 250 m |
| WY | Durchschnittlicher jährlicher Nettoabfluss Water content) (1990–2010),simulated with LISFLOOD-Modell. | EC-JRC LISFLOOD model output 1990–2014 (De Roo, 2014) (Average annual net runoff (freshwater availability) (1990–2010), simulated using the LISFLOOD model.) | Or. Res.: 5 km User. Res.: 250 m |
| NDR | Different Regional NDR-Model | Bach, M., 2015. Stickstoff-Bilanzierungen Notwendigkeit harmonisierter Ansätze. http://docplayer.org/64047928-Stickstoff-bilanzierungen-notwendigkeit-harmonisierter-ansaetze.html | Municipality |
References
- Aly, A.I.M.; Hussien, R.A. Environmental Impacts of Nuclear, Fossil and Renewable Energy Sources: A Review. Nuclear Energy 2000, 3, 73–93. [Google Scholar]
- Federal Ministry for Economic Affairs and Energy, Energy Data. 2019. Available online: https://www.bmwi.de/Redaktion/EN/Artikel/Energy/energy-data.html (accessed on 20 January 2020).
- Tamanini, J.; Bassi, A.; Hoffman, C.; Valenciano, J. Global Green Economy Index: Measuring National Performance in the Green Economy; United Nations: Washington, DC, USA, 2014. [Google Scholar]
- Pndolfi, J.M.; Connolly, S.R.; Marshall, D.J.; Cohen, A.L. Projecting coral reef futures under global warming and ocean acidification. Science 2011, 333, 418–422. [Google Scholar] [CrossRef] [Green Version]
- Mehdi, B.; Ludwig, R.; Lehner, B. Evaluating the impacts of climate change and crop land use change on streamflow, nitrates and phosphorus: A modeling study in Bavaria. J. Hydrol. 2015, 4, 60–90. [Google Scholar] [CrossRef] [Green Version]
- FNR-Agency of the Renewable Resources Fachagentur Nachwachsende Rohstoffe e.V. 2017. Available online: https://www.fnr.de/ (accessed on 15 February 2021).
- Thran, D.; Schaubach, K.; Majer, S.; Horschig, T. Governance of sustainability in the German biogas sector—Adaptive management of the Renewable Energy Act between agriculture and the energy sector. Energy Sustain. Soc. 2020, 10, 1–18. [Google Scholar] [CrossRef]
- Bouguerra, S.; Jebari, S.; Tarhouni, J. Spatiotemporal analysis of landscape patterns and its effect on soil loss in the Rmel river basin, Tunisia. Soil Water Res. 2020, 16, 39–49. [Google Scholar] [CrossRef]
- Bouguerra, S.; Jebari, S. Identification and prioritization of sub-watersheds for land and water management using InVEST SDR model: Rmel river basin, Tunisia. Arab. J. Geosci. 2017, 10, 34. [Google Scholar] [CrossRef]
- Weber, G.; Cabras, I. The transition of Germany’s energy production, green economy, low-carbon economy, socio-environmental conflicts, and equitable society. J. Clean. Prod. 2017, 167, 1222–1231. [Google Scholar] [CrossRef]
- Kühn, M.; Ask, M.; Juhlin, C.; Bruckman, V.J.; Kempka, T.; Martens, S. Interdisciplinary Approaches in Resource and Energy Research to Tackle the Challenges of the Future. Energy Procedia 2016, 97, 1–6. [Google Scholar] [CrossRef]
- Martens, S.; Hangx, S.; Juhlin, C.; Kühn, M.; Kempka, T. Energy, Resources and the Environment: Meeting the challenges of the future. 2017, European Geosciences Union General Assembly 2016, EGU Division Energy. Resour. Environ. 2017. [Google Scholar] [CrossRef]
- Euliss, N.; Smith, L.; Duffy, W.; Faulkner, S.; Gleason, R.; Eckles, S. Integrating estimates of ecosystem services from conservation programs and practices into models for decision makers. Ecol. Appl. 2011, 21, 128–134. [Google Scholar] [CrossRef] [Green Version]
- Hamel, P.; Falinski, K.; Sharp, R.; Auerbach, D.A.; Sánchez-Canales, M.; Dennedy-Frank, P.J. Sediment delivery modeling in practice: Comparing the effects of watershed characteristics and data resolution across hydroclimatic regions. Sci. Total Environ. 2017, 580, 1381–1388. [Google Scholar] [CrossRef]
- Walston, L.J.; Li, Y.; Hartmann, H.M.; Macknick, J.; Hanson, A.; Nootenboom, C.; Hellmann, J. Modeling the ecosystem services of native vegetation management practices at solar energy facilities in the Midwestern United States. Ecosyst. Serv. 2021, 47, 101227. [Google Scholar] [CrossRef]
- Piyathilake, I.D.U.H.; Sumudumali, R.G.I.; Udayakumara, E.P.N.; Ranaweera, L.V.; Jayawardana, J.M.C.K.; Gunatilake, S.K. Modeling predictive assessment of soil erosion related hazards at the Uva province in Sri Lanka. Modeling Earth Syst. Environ. 2020. [Google Scholar] [CrossRef]
- Bagstad, K.J.; Semmens, D.J.; Waage, S.; Winthrop, R. A comparative assessment of decision-support tools for ecosystem services quantification and valuation. Ecosyst. Serv. 2013, 5, 27–39. [Google Scholar] [CrossRef]
- Grafius, D.R.; Corstanje, R.; Warren, P.H.; Evans, K.L.; Hancock, S.; Harris, J.A. The impact of land use/land cover scale on modelling urban ecosystem services. Landsc. Ecology 2016, 31, 1509–1522. [Google Scholar] [CrossRef] [Green Version]
- Sharp, R.; Tallis, H.T.; Ricketts, T.; Guerry, A.D.; Wood, S.A.; Chaplin-Kramer, R.; Nelson, E.; Ennaanay, D.; Wolny, S.; Olwero, N.; et al. InVEST+ VERSION+ User’s Guide; The Natural Capital Project: Morges, Switzerland, 2016. [Google Scholar]
- Redhead, J.W.; May, L.; Oliver, T.H.; Hamel, P.; Sharp, R.; Bullock, J.M. National scale evaluation of the InVEST nutrient retention model in the United Kingdom. Sci. Total Environ. 2018, 610, 666–677. [Google Scholar] [CrossRef] [PubMed]
- Leh, M.D.; Matlock, M.D.; Cummings, E.C.; Nalley, L.L. Quantifying and mapping multiple ecosystem services change in West Africa. Agric. Ecosyst. Environ. 2013, 165, 6–18. [Google Scholar] [CrossRef]
- Terrado, M.; Acuña, V.; Ennaanay, D.; Tallis, H.; Sabater, S. Impact of climate extremes on hydrological ecosystem services in a heavily humanized Mediterranean basin. Ecol. Indic. 2014, 37, 199–209. [Google Scholar] [CrossRef]
- Boithias, L.; Acuña, V.; Vergoñós, L.; Ziv, G.; Marcé, R.; Sabater, S. Assessment of the water supply: Demand ratios in a Mediterranean basin under different global change scenarios and mitigation alternatives. Sci. Total Environ. 2014, 470, 567–577. [Google Scholar] [CrossRef] [PubMed]
- Peh, K.S.H.; Balmford, A.; Bradbury, R.B.; Brown, C.; Butchart, S.H.; Hughes, F.M.; Stattersfield, A.; Thomas, D.H.; Walpole, M.; Bayliss, J.; et al. TESSA: A toolkit for rapid assessment of ecosystem services at sites of biodiversity conservation importance. Ecosyst. Serv. 2013, 5, 51–57. [Google Scholar] [CrossRef] [Green Version]
- Woznicki, S.A.; Cada, P.; Wickham, J.; Schmidt, M.; Baynes, J.; Mehaffey, M.; Neale, A. Sediment retention by natural landscapes in the conterminous United States. Sci. Total Environ. 2020, 745, 140972. [Google Scholar] [CrossRef] [PubMed]
- Borselli, L.; Cassi, P.; Torri, D. Prolegomena to sediment and flow connectivity in the landscape: A GIS and field numerical assessment. Catena 2008, 75, 268–277. [Google Scholar] [CrossRef]
- Vigiak, O.; Borselli, L.; Newham, L.T.H.; McInnes, J.; Roberts, A.M. Comparison of conceptual landscape metrics to define hillslope-scale sediment delivery ratio. Geomorphology 2012, 138, 74–88. [Google Scholar] [CrossRef]
- JRC. Available online: http://eusoils.jrc.ec.europa.eu/Library/Themes/Erosion/Erodibility/Data/Index.cfm (accessed on 16 July 2020).
- Panagos, P.; Borrelli, P.; Poesen, J.; Ballabio, C.; Lugato, E.; Meusburger, K.; Montanarella, L.; Alewell, C. The new assessment of soil loss by water erosion in Europe. Environ. Sci. Policy 2015, 54, 438–447. [Google Scholar] [CrossRef]
- Pessacg, N.; Flaherty, S.; Brandizi, L.; Solman, S.; Pascual, M. Getting water right: A case study in water yield modelling based on precipitation data. Sci. Total Environ. 2015, 537, 225–234. [Google Scholar] [CrossRef] [PubMed]
- Tallis, H.; Rickets, T.; Guerry, A.; Wood, S.; Sharp, R.; Nelson, E.; Ennaanay, D.; Wolny, S.; Olwero, E.; Vigerstol, K.; et al. InVEST 3.0.1 User’s Guide 2014: Integrated Valuation of Environmental Services and Tradeoffs; The Natural Capital Project: Morges, Switzerland, 2014. [Google Scholar]
- Bach, M. Stickstoff-Bilanzierungen Notwendigkeit Harmonisierter Ansätze. 2015. Available online: http://docplayer.org/64047928-Stickstoff-bilanzierungen-notwendigkeit-harmonisierter-ansaetze.html (accessed on 10 January 2021).
- Moore, R.V.; Morris, D.G.; Flavin, R.W. Sub-Set of UK Digital 1: 50,000 Scale River Centre-Line Network; NERC: Wallingford, CT, USA, 1994. [Google Scholar]
- European Soil Data Centre (ESDAC). European Commission, Joint Research Centre. Available online: https://esdac.jrc.ec.europa.eu/tmp_dataset_access_req_17702#tabs-0-filters=2 (accessed on 20 March 2019).
- Busico, G.; Mastrocicco, M.; Cuoco, E.; Sirna, M.; Tedesco, D. Protection from natural and anthropogenic sources: A new rating methodology to delineate “Nitrate Vulnerable Zones”. Environ. Earth Sci. 2019, 78, 104. [Google Scholar] [CrossRef]
- Verkerk, P.J.; Fitzgerald, J.B.; Datta, P.; Dees, M.; Hengeveld, G.M.; Lindner, M.; Zudin, S. Spatial distribution of the potential forest biomass availability in Europe. Forest Ecosyst. 2019, 6, 1–11. [Google Scholar] [CrossRef]
- Bioenergy in Germany Facts and Figures 2019. Available online: Http://Www.Fnr.De/Fileadmin/Allgemein/Pdf/Broschueren/Broschuere_Basisdaten_Bioenergie_2018_Engl_Web_Neu.Pdf#:~:Text=Domestic%20biomass%20will%20contribute%20substantially%20to%20the%20energy,Unused%20potentials%20from%20biogenic%20residual%20and%20waste%20materials (accessed on 18 February 2021).
- Daniel-Gromke, J.; Rensberg, N.; Denysenko, V.; Stinner, W.; Schmalfuß, T.; Scheftelowitz, M.; Nelles, M.; Liebetrau, J. Current developments in production and utilization of biogas and biomethane in Germany. Chem. Ing. Tech. 2018, 90, 17–35. [Google Scholar] [CrossRef]
- Aracil, C.; Haro, P.; Giuntoli, J.; Ollero, P. Proving the climate benefit in the production of biofuels from municipal solid waste refuse in Europe. J. Clean. Prod. 2017, 142, 2887–2900. [Google Scholar] [CrossRef]
- Strzalka, R.; Schneider, D.; Eicker, U. Current status of bioenergy technologies in Germany. Renew. Sustain. Energy Rev. 2017, 72, 801–820. [Google Scholar] [CrossRef]
- WCRP CORDEX Coordinated Regional Climate Downscaling Experiment. Available online: https://cordex.org/ (accessed on 14 February 2021).
- ClimEx Project. Available online: https://www.climex-project.org/ (accessed on 14 February 2021).
- Von Trentini, F.; Leduc, M.; Ludwig, R. Assessing natural variability in RCM signals: Comparison of a multi model EURO-CORDEX ensemble with a 50-member single model large ensemble. Clim. Dyn. 2019, 53, 1–17. [Google Scholar] [CrossRef] [Green Version]
- Yang, W.; Andréasson, J.; Graham, L.P.; Olsson, J.; Rosberg, J. Wetterhall, F. Distribution-based scaling to improve usability of regional climate model projections for hydrological climate change impacts studies. Hydrol. Res. 2010, 41, 211–229. [Google Scholar] [CrossRef]
- Häggmark, L.; Ivarsson, K.I.; Gollvik, S.; Olofsson, P.O. Mesan, an operational mesoscale analysis system. Tellus A Dyn. Meteorol. Oceanogr. 2000, 52, 2–20. [Google Scholar] [CrossRef] [Green Version]
- Kolb, S.; Plankenbühler, T.; Pfaffenberger, F.; Vrzel, J.; Kalu, A.; Holtz-Bacha, C.; Dillig, M. Scenario-Based Analysis for the Integration of Renewable Gases into the German Gas Market. In European Biomass Conference and Exhibition Proceedings; Grassi, A., Carvalho, M.D.G., Helm, P., Scarlat, N., Eds.; ETA-Florence Renewable Energies: Lisbon, Portugal, 2019; pp. 1863–1868. [Google Scholar]
- Kolb, S.; Plankenbühler, T.; Frank, J.; Dettelbacher, J.; Ludwig, R.; Karl, J.; Dillig, M. Scenarios for the integration of renewable gases into the German natural gas market–A simulation-based optimisation approach. Renew. Sustain. Energy Rev. 2021, 139, 110696. [Google Scholar] [CrossRef]


| Possible Impacts | RGP (Conversion) Type | RGP Name and Size (MW1) | Substrate |
|---|---|---|---|
| Land use change, nutrient delivery (ND), water | Bio-methane | Biomethane maize (10) | Maize silage |
| Odour/H2O pollution, pest | Biomethane manure (2.5) | Manure/maize | |
| Good biomass | Biomethane residues (10) | Food residues | |
| Regional impact | SNG (substitute natural gas) Heat Pipe Reformer (HPR) technology | HPR imported pellets (1) | Imported wood pellets |
| Negligible | HPR straw (1) | Straw | |
| Land Use Change/sedimentation | SNG | forest residues (30) | Forest residues |
| ND and Erosion | SRP (30) | Short rotation plantations | |
| Low without tree cutting | Synthesis gas (SynGas) | SynGas forests Residues (30) | Forest residues |
| Regional impact | Gasifier with Absorbent Enhenced Reformer | Imported pellets (100) | Imported wood pellets |
| Medium water use | Power-to-Methane catalytic | Power-to-Methane Catalytic (6) | Electricity + water |
| Medium water usage | Power-to-Methane biologic | Power-to-Methane Biologic (1) | Electricity + water |
| High | Power-to-Hydrogen SOEC | Power-to-Hydrogen SOEC (0.1) | Electricity + water |
| CH4 emission | Power-to-Hydrogen partial stream methane reform (SMR) | Power-to-Hydrogen Steam Reformer (0.5) | Electricity + water + methane |
| High | Power-to-Hydrogen Proton Exchange Membrane (PEM) electrolysis | Power-to-Hydrogen PEM (1) | Electricity + water |
| Non-Sustainable | Sustainable | |||||
|---|---|---|---|---|---|---|
| Type of RGP | Biomethane Maize/Manure | SNG F.Residue | SNGShort Rotation.F | Biomethane Maize/Manure | SNG F.Residue | SNGShort Rotation.F |
| Biomass | Maize | FR | SRF | Maize | FR | SRF |
| LUC, which can be used for growing biomass | 2, 4, 6, 11, 12, 13, 14 | 5 | 2, 4, 6, 11, 12, 13, 14 | 2, 11, 12, 13, 14 | 5 | 2, 11, 12, 13, 14 |
| Slope | <5° | / | <5° | <5° | / | <5° |
| Soil texture | 2, 3, 4, 5, 6, 7, 8, 9, 10 | / | / | 2, 3, 4, 5, 6, 7, 8, 9, 10 | / | / |
| Protest Atlas | 1, 2, (3) | / | 1, 2, (3) | 1, 2, (3) | / | 1, 2, (3) |
| Climate Data—Input | |
|---|---|
| NDR | - Precipitation [mm] |
| SDR | - Rainfall Erosivity Index [MJ*mm/(ha*h*yr)] |
| WYM | - Precipitation [mm] - Reference evapotranspiration [mm] |
Publisher’s Note: MDPI stays neutral with regard to jurisdictional claims in published maps and institutional affiliations. |
© 2021 by the authors. Licensee MDPI, Basel, Switzerland. This article is an open access article distributed under the terms and conditions of the Creative Commons Attribution (CC BY) license (http://creativecommons.org/licenses/by/4.0/).
Share and Cite
Kalu, A.; Vrzel, J.; Kolb, S.; Karl, J.; Marzahn, P.; Pfaffenberger, F.; Ludwig, R. Considering the Environmental Impacts of Bioenergy Technologies to Support German Energy Transition. Energies 2021, 14, 1534. https://doi.org/10.3390/en14061534
Kalu A, Vrzel J, Kolb S, Karl J, Marzahn P, Pfaffenberger F, Ludwig R. Considering the Environmental Impacts of Bioenergy Technologies to Support German Energy Transition. Energies. 2021; 14(6):1534. https://doi.org/10.3390/en14061534
Chicago/Turabian StyleKalu, Amarachi, Janja Vrzel, Sebastian Kolb, Juergen Karl, Philip Marzahn, Fabian Pfaffenberger, and Ralf Ludwig. 2021. "Considering the Environmental Impacts of Bioenergy Technologies to Support German Energy Transition" Energies 14, no. 6: 1534. https://doi.org/10.3390/en14061534