A Review on CO2 Capture Technologies with Focus on CO2-Enhanced Methane Recovery from Hydrates


Energy Department, Politecnico di Torino, Via Duca degli Abruzzi 24, 10129 Torino, Italy
*
Author to whom correspondence should be addressed.
Energies 2021, 14(2), 387; https://doi.org/10.3390/en14020387
Submission received: 23 October 2020
/
Revised: 22 December 2020
/
Accepted: 8 January 2021
/
Published: 12 January 2021
(This article belongs to the Special Issue Energy Resource Potential of Gas Hydrates)
Abstract
:Natural gas is considered a helpful transition fuel in order to reduce the greenhouse gas emissions of other conventional power plants burning coal or liquid fossil fuels. Natural Gas Hydrates (NGHs) constitute the largest reservoir of natural gas in the world. Methane contained within the crystalline structure can be replaced by carbon dioxide to enhance gas recovery from hydrates. This technical review presents a techno-economic analysis of the full pathway, which begins with the capture of CO2 from power and process industries and ends with its transportation to a geological sequestration site consisting of clathrate hydrates. Since extracted methane is still rich in CO2, on-site separation is required. Focus is thus placed on membrane-based gas separation technologies widely used for gas purification and CO2 removal from raw natural gas and exhaust gas. Nevertheless, the other carbon capture processes (i.e., oxy-fuel combustion, pre-combustion and post-combustion) are briefly discussed and their carbon capture costs are compared with membrane separation technology. Since a large-scale Carbon Capture and Storage (CCS) facility requires CO2 transportation and storage infrastructure, a technical, cost and safety assessment of CO2 transportation over long distances is carried out. Finally, this paper provides an overview of the storage solutions developed around the world, principally studying the geological NGH formation for CO2 sinks.
1. Introduction
The processing of raw materials, energy production, and human activity in general has caused a rise in the temperature of about 1.0 °C above pre-industrial levels, leading to climate change at a global level. The risks for natural and human systems are obviously even higher for global warming of 1.5 °C, but still lower than in the case of a rise of 2.0 °C. Limiting global warming to 1.5 °C reduces the impacts on ocean and terrestrial ecosystems, health, food safety, water supply, and economic growth compared to 2.0 °C [1].
Global energy consumption in 2018 increased by 2.3% with respect to 2017 scenarios due to economic improvement and a higher heating and cooling requirement in some regions of the world. The increase in energy efficiency and the share of renewable energy, and the transition from coal to gas power plants, have helped to avoid a lot of CO2 emissions. Nevertheless, the CO2 emissions rose by 1.7%, reaching a total of 33.1 Gigatons (Gt). This means that energy consumption and CO2 emissions increase together, and they are not yet decoupled. The largest CO2 emitter, accounting for 30% of carbon dioxide emissions related to energy consumption, is coal-fired power generation. The growing energy demand is not totally covered by new renewable plants and, consequently, fossil fuel consumption is increasing (e.g., the consumption of natural gas rose by 4.6% in 2018) [2].
Natural gas, composed mostly of methane, is considered a helpful bridge fuel to reduce the greenhouse gas emissions of fossil fuels. It has the lowest carbon intensity (i.e., the emission rate of a given pollutant relative to a specific activity), emitting less CO2 per unit of energy generated than other fossil fuels. It burns cleanly and efficiently, and generally requires limited processing to prepare it for end-users, with lower carbon emissions in comparison to other fuels. However, the energy density of natural gas at environmental condition (i.e., between 38.15 and 40.72 MJ/m3) is lower than that of liquid petroleum fuels, which have an energy density range of 28,000 to 42,000 MJ/m3 [3]. As a result, the transportation and storage of gas fuel require a compression or liquefaction step to obtain the same quantity of energy over the same volume of liquid fuels.
The possible solutions leading to the reduction of CO2 emissions are: (i) switching to a low carbon economy; (ii) increasing system efficiency; (iii) implementing CCS technologies to allow a gradual transition from fossil fuels to other more sustainable ones. Renewable power plants cannot provide enough base-load electricity generation, and they depend on geographical location and, therefore, on the availability of resources. Thus, CCS is a feasible solution to reduce the anthropogenic CO2 emissions in a transition phase [4].
Thermogenic natural gas is formed when buried organic material is subjected to enormous heat and pressure over geological time. Natural gas reservoirs are categorised as conventional or unconventional gas reserves. Conventional resources of natural gas are accumulated in permeable rocks comprising of numerous pores which allow them to retain natural gas. This gas is trapped underground by impermeable rock strata. Natural gas can be extracted economically without specialised technologies, using vertical well bores [5]. Otherwise, unconventional resources are formed in more complex geological formations (e.g., shale gas and tight gas), trapped in rocks with lower porosity and permeability than conventional reservoirs. These rocks prevent the easy flow of the gas through the pores to the standard type of well. The extraction of gas from these reservoirs requires expensive specialised techniques, such as hydraulic fracturing [5]. NGHs are deposited both in continental sedimentary rocks, in the polar area, and marine sediments, and they form at low temperatures (≤26.85 °C) and moderate/high pressure (≥6 bar) [6]. Clathrate hydrates are solid crystalline compounds in which, typically, methane, ethane, propane and carbon dioxide are trapped inside cages of water molecules.
This work is part of a larger research project aims to develop an innovative technological solution to enhance the extraction of subsea methane from marine NGHs. CO2 is injected in subsea NGH formations to enhance methane recovery and is eventually trapped as stable gas hydrates in a substitution process. As a result, the fuel obtained is virtually neutral in terms of GHG emissions.
The replacement of CH4 with CO2 is thermodynamically favoured, and it represents a unique opportunity to recover an energy resource and to store this common greenhouse gas. Therefore, geological NGH formation can be used as an energy resource, capable of providing methane, whilst CO2 storage could contribute to reducing GHG emissions.
In this paper we review the current state-of-the-art of CO2 capture, transport and storage, focusing on hydrate storage at techno-economic level. We first discuss carbon capture processes applied to the industrial and power sector (Section 2), and highlight the CO2 capture costs and performance of different power plants (Section 3). Then in Section 4 we contextualise CO2 transportation via pipeline, neglecting other means of transport because they are less used. The sequestration of CO2 is more widespread than its reuse, therefore, conventional CO2 storage (e.g., brine aquifer and depleted oil and gas) and, in particular, clathrate hydrate formation are presented in Section 5. Section 6 concludes with the cost of the complete CCS process at different distances between the CO2 source and sink, identifying one of the possible final CCS chains.
2. CO2 Capture Systems
Many abatement technologies affect the use of fossil fuels or their emissions in the atmosphere (e.g., carbon capture, utilisation, and storage, use of nuclear power, replacement of coal by natural gas). CCS can be applied in power plants and industrial facilities and involves CO2 separation, compression, and transportation (via pipeline or shipping) and its storage in a geological site (e.g., saline aquifer, oil and/or gas reservoir).
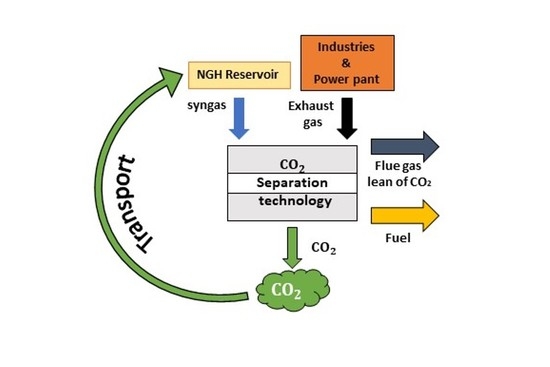
Therefore, the first step of CCS technology is sequestering CO2, and the main carbon capture processes, summarized in Figure 1, are the following:
- Oxyfuel combustion: fuel is burnt with pure oxygen instead of air, and if it is free of contaminants, the resulting flue gas contains only carbon dioxide and water, easily separated by a water condenser.
- Pre-combustion: fuel is processed in a gasifier reactor to produce a syngas rich in hydrogen and carbon monoxide. Subsequently, this syngas flows into a water gas shift reactor to produce H2 and CO2. The final process provides CO2 separation and pure hydrogen production usually via physical absorption.
- Post-combustion: the flue gas produced by conventional fuel combustion flows into a CO2 separation unit. The procedures used to sequestrate the CO2 are typically absorption by the aid of a chemical solvent, adsorption, and membrane separation.
2.1. Decarbonization of Industrial Sector
Industry covers around 25% of the economic sector in terms of global Gross Domestic Product (GDP) [7] and produced 7.8 Gt of CO2 in 2017 [8]. The Intergovernmental Panel on Climate Change (IPCC) states that direct and indirect (i.e., derived from energy use) emissions have to drop by 75–90% by 2050 [1]. CCS can be essential for industry decarbonisation, helping it to move toward sustainable mills. Nowadays, CCS technologies are mainly applied in the cement, steel and iron industries, and petrochemical and oil refining.
The cement industry contributes with 8% of global CO2 emissions [9]. The emissions of CO2 are mainly due to fuel combustion and the calcination of limestone (i.e., the main raw material for cement production). A new pilot plant called Low Emissions Intensity Lime and Cement (LEILAC) has been developed to capture over 95% of the CO2 emissions. The key innovation of this plant is the high temperature direct separation calciner that can separate the CO2 produced by the calcination reaction of the limestone [10].
The World Steel Association provides the mean value of carbon intensity, estimated to be 1.85 tonnes of CO2 per tonnes of crude steel cast in 2018 [11], and, for the same year, states that the crude steel produced amounted to 1808 million tonnes [12]. Therefore, the iron and steel industry is one of the biggest emitters in industrial sectors, producing 3.3 Gt of CO2 in 2018. Most iron and steel mills are made up of a Blast Furnace (BF) coupled with a Basic Oxygen Furnace (BOF), and they are supplied with iron ore as the raw material and coke as the reducing agent. To produce one ton of liquid steel (tLS), 1.81 tCO2 are emitted into the atmosphere [13]. Conversely, new iron and steel mills, such as the one in Abu Dhabi, are being built with a new configuration. The main components of these plants are a Direct Reduction Iron (DRI) reactor coupled with an Electric Arc Furnace (EAF). Methane replaces coal and flows into a Steam Reformer (SR). The reducing gases produced and a mix of scrap and iron ore are conveyed into the DRI reactor. Hydrogen and carbon monoxide reduce the iron and CO2 can be easily separated. At the end of this process, only 0.54 tCO2/tLS are produced, saving 70% of CO2 emissions [13].
Several large-scale CCS facilities applied to oil refining, fuel processing and fertiliser production are in operation. Most of them are in the USA (e.g., Illinois industrial CCS for Ethanol production, Century plant natural gas facility in Texas, Coffeyville gasification plant producing fertiliser) and CO2 is transported from them for Enhanced Oil Recovery (EOR).
2.2. Decarbonization of the Power Sector
Electric power plants emit the largest of CO2 into atmosphere. In the world several countries are primarily dependent upon coal-fired power plants. The first Super-Critical Pulverised Coal (SCPC) fired power plant (i.e., Philo unit 6) was built in 1957 and has been operated until the 1979 [14], while the first Ultra Super-Critical (USC) power plant was built in 1993 in Japan [15]. SCPC and USC power plants work at higher temperatures and pressure than a subcritical power plant. As a result, they achieve a higher thermodynamic efficiency. Coal is milled and burned with air (or near pure oxygen in case of oxy-fuel combustion carbon capture process) in the boiler. The heat produced by combustion is transferred to a secondary working fluid, typically water that circulates into a Rankine cycle. The steam operation conditions are above critical point (i.e., pressure 22.115 MPa and temperature 374.15 °C) and, at this state, there is no distinction between gas and liquid phase. In SCPC, steam is produced at pressure between 22.115 and 25 MPa and a temperature between 540–580 °C. In contrast, in USC power plant, water operates at pressure and temperature higher than 25 MPa and 580 °C, respectively [16]. The steam produced goes into turbines, which turns a shaft that is connected to a generator to generate electricity. The spent steam is condensed, and it flows again into the boiler.
There are only two large-scale facilities currently in operation based on post-combustion process Boundary Dam and Petra Nova coal-fired power plants are provided by a new separation unit (i.e., amine-based gas separation) used to purified the flue gas from SO2 and NOx, and separate the CO2 from gas mixture [17,18]. Another large-scale CCS facility is in construction (i.e., the ZERO project) and it captures CO2 with an oxy-fuel process. At the end, several pilot demonstration CCS facilities operate since 2010.
In the next sections, a techno-economic review is provided, showing the carbon capture cost of the different CCS processes applied to power plants.
3. Techno-Economic Considerations on CO2 Capture
The minimum thermodynamic energy demand to separate one mole of CO2 from a gas mixture is function of the CO2 capture fraction (capture rate/100), and it is calculated through Equation (1). The equation below, provided by Amel’kin et al., considers the more realistic incomplete separation of CO2, producing a pure stream of carbon dioxide and lean CO2 flue gas [19].
where R is the specific gas constant (8.314 J/(mol K)), T is the temperature (K), x is the CO2 mole fraction, and f is the CO2 capture rate. Figure 2 shows the specific energy requirement for CO2 separation as a function of the capture rate. Figure illustrates several CO2 inlet concentrations that represent capture from air (410 ppm), natural gas combined cycle (4%), coal-fired power station (12%), and EAF steel plant (20%).
The minimum energy requirement increases at high CO2 capture rate and at low inlet concentration. Nevertheless, the energy demand in a real process is always higher.
The cost of CCS is the major challenge of this technology. The price of CCS is divided into three categories (capture, compression and transportation, and storage) as reported in the next section. The CCS cost is hard to estimate, mainly due to a lack of empirical data, different operating conditions and capture processes, and different CCS plants.
The cost of CCS [20] is often expressed as an energy (power generation sector) or efficiency (both power and industrial sectors) penalty. The energy penalty and efficiency penalty are represented below:
For the power sector, another important parameter is the Levelized Cost of Electricity (LCOE) based on [$/MWh]. The electricity cost is evaluated as follows:
where: TCC is the Total Capital Cost [$]; FCF is the Fixed Charge Factor [fraction/year]; FOM is the Fixed Operating and Maintenance cost [$/year]; CF is the plant Capacity Factor; MW is the net plant capacity [MW]; VOM is the Variable non-fuel Operating and Maintenance cost [$/MWh]; HR is the net power plant Heat Rate [MJ/MWh]; FC is the unit Fuel Cost [$/MJ].
The various capture technologies are also compared by considering the cost of carbon, which may refer to both the CO2 captured and CO2 avoided costs in [$/t CO2] shown in the equations below:
where is the baseline emission [tCO2/MWh], —the baseline efficiency, —the efficiency with carbon capture, and C—the capture fraction. In future, the cost of CO2 capture is likely to go down, but the estimation of future costs is rather uncertain.
Rubin et al. [21] reported the capture cost in constant 2013 US$, whereas Merkel et al. [22] reported the capture cost with membrane separation in constant 2011 US$. In this review, we report the overall cost of CSS in 2013 US$, and therefore the costs reported in different years have to be adjusted. We have used the Power Capital Cost Index (PCCI) to escalate the capital and non-fuel operating and maintenance costs of power plants, the fuel cost index to escalate the cost of coal and natural gas, and the Chemical Engineering Plant Cost Index (CEPCI) to escalate both the transportation and storage costs shown in Section 4 and Section 5. In addition, the analysis reported in this work was performed using the First-Of-A-Kind (FOAK) CCS cost estimation, and therefore we have avoided all analyses which forecast a CCS cost reduction.
3.1. Oxy-Fuel Combustion CO2 Capture
Oxyfuel combustion is one of the most mature technologies for capturing CO2 from power plants. Near-pure oxygen is used as an oxidant to burn fuel. A fraction of flue gas composed almost entirely of CO2, H2, and oxygen in excess, is recirculated into the boiler to control the temperature in the combustion zone. Indeed, fuel combustion with pure O2 produces a high adiabatic flame temperature. The separation of CO2 occurs through dehydration of the flue gas at low temperatures. The flue gas may be purified of contaminants (e.g., SOx, NOx, HCl coming from the fuel and N2, Ar, O2 coming from the oxygen flow).
While the concentration of CO2 of conventional coal-fired power plants is approximately 12%v, for a traditional gas turbine the content of carbon molecule is lower (about 4%v) due to the high excess of air used to control the combustion temperature. Therefore, post-combustion capture (via chemical adsorption) is disadvantaged, and oxyfuel combustion can be a good strategy [23].
Generally, these plants are classified in:
- Secondary cycle: flue gas, coming from the combustion chamber, heats an external working fluid through heat exchangers (e.g., Rankine cycles).
- Direct cycle: flue gas is also the working fluid and generates power in a turbo-gas (e.g., Brayton cycles).
The main components of oxyfuel combustion power generation are [23]: (i) Air Separation Unit (ASU) to produce near pure oxygen; (ii) Boiler or gas turbine to burn fuel and to generate power heat; (iii) Flue gas processing unit to clean flue gas and control its quality; (iv) CO2 Processing Unit (CPU) for the final purification of carbon dioxide.
The main requirement for any oxyfuel combustion process is oxygen production. Conventional cryogenic multi-column distillation is currently the most efficient and cost-effective technology for producing oxygen on a large scale. The standard method consists of a double column distillation cycle with a high/low-pressure column. The gaseous air coming into a high-pressure column is separated into an overhead nitrogen vapor and oxygen-enriched bottom liquid. At the current plant size, the production of O2, at 95% of purity and low pressure, consumes 200–250 [23].
Oxyfuel combustion is applied both in coal-fired power plants and gas turbine-based power plants. In Figure 3a, the heat generated by coal combustion with near pure oxygen is supplied to a secondary cycle in the boiler. By contrast, in the gas turbine cycle shown in Figure 3b, the flue gas at high pressure and temperature produces electricity through a gas turbine (direct cycle) and provides power heat to a secondary cycle in a Heat Recovery Steam Generator (HRSG).
It is worth mentioning an emerging power plant based on the Allam cycle. The Allam cycle combines the oxy-combustion CO2 capture process with the supercritical CO2 used as working fluid at very high pressure (≃300 bar) and temperatures (≃1150 °C at the turbine inlet). An Allam cycle power plant fueled by natural gas achieves 59% LHV efficiency and captures 100% of CO2.
Before CO2 storage or recirculation, the flue gas produced in a coal-fired power plant passes through several cleaner units to remove contaminants contained in the fuel. The contaminants are usually more numerous in coal than in gas fuel, and therefore more steps are needed to obtain useful CO2.
The flue gas cleaning island is usually composed of an Electro-Static Precipitator (ESP) and a Flue Gas Desulphurisation (FGD) unit. The ESP unit removes the Particulate Matter (PM) in a coal-fired power plant with an efficiency of up to 99.5%. These devices operate at 130–150 °C, but with decreasing emission limits of PM, new low-low temperature ESPs are implemented, operating at 80–90 °C. At this range of temperatures, the electric resistivity of coal dust is lower and the precipitation efficiency can increase (until 99.9%) [25]. In the FGD unit, the flue gas interacts with an absorbing medium producing highly solid slurry. FGDs can be classified as non-regenerable and regenerable processes, depending on the absorbent compound used. Several sorbents are used during this process (e.g., limestone, magnesium lime, seawater and ammonia) and they have different desulphurisation efficiencies [26]. In a gas turbine cycle, the fuel requires a desulphurisation process before the combustion. The purified flue gas flows into a condenser to reduce its water content. Indeed, a dry CO2 stream is necessary to avoid acid formation. Finally, the temperature and pressure of CO2 is conditioned depending on the means of transport used (e.g., supercritical condition in the case of pipeline transportation).
Oxy-fuel combustion capture mainly integrates SCPC and USC power plants with low-rank coal (sub-bituminous and lignite). Table 1 shows the range of performance and cost results for new plants. A conventional cryogenic air separator is used for oxygen production, able to produce high quality CO2 (>99%).
3.2. Pre-Combustion CO2 Capture
The pre-combustion capture process covers decarbonisation by gasification or steam methane reforming of primary fuel (coal/biomass and methane, respectively), and CO2 separation. As a result, the plant produces almost pure hydrogen.
The heated primary fuel flows into a gasifier reactor with air (or O2) and water (or steam), usually pressurised. After the gasification process, the syngas is mainly composed of carbon monoxide, carbon dioxide, hydrogen and methane. At different thermodynamic conditions (pressures and temperatures), the gas composition changes. At high temperatures, the content of methane drops while the percentage of CO increases. Increasing the gasification pressure, the mole fractions of methane and carbon monoxide go up.
The gasification process does not sequester carbon molecules, but it converts carbonaceous solids into a gas product with useful chemical heating value, easily treatable for contaminant removal.
Several configurations can be proposed (e.g., gasifier + Water Gas Shift reactor (WGS) + Solid Oxide Fuel Cell (SOFC)), but the most common technology is the Integrated Gasification Combined Cycle (IGCC). In the plant shown in Figure 4, the hydrogen produced is burnt in a gas turbine to generate electricity, and the exhaust heat from the flue gas lean of CO2 is recovered to generate steam that drives a steam turbine.
The CO2 concentration of pre-combustion capture is higher than post-combustion processes, and therefore the energy required for the only CO2 separation is lower. For IGCC, the CO2 concentration can be in the range of 35–40%mol after WGS and water removal (15–25%mol if the resource is natural gas [27]) [28]. Table 2 summarized the result of new IGCC power plants with and without a pre-combustion capture system. The physical solvents (e.g., Pressure Swing Absorption (PSA) and Vacuum Pressure Swing Absorption (VPSA)) are the technology mainly used for carbon capture in IGCC plants.
3.3. Post-Combustion CO2 Capture
Post-combustion technologies allow the separation of CO2 from exhaust gases. The CO2 produced by the combustion of fossil fuels or numerous industrial processes, is purified, concentrated and dispatched to a storage unit. Conceptually, post-combustion capture is the most straightforward technology, and it can be applied in existing plants without substantial changes, only adding the capture process before the flue gases are released into the atmosphere, as illustrated in Figure 5.
The mainly post-combustion capture process can be divided into chemical and physical absorption.
The chemical absorption processes are the most used technology for post-combustion capture. They are typically a blend of aqueous amines but can also include amino acid salts, ammonia and ionic liquids, while in the case of solid sorbents they can consist of calcium looping and others.
Liquid absorption processes can treat gas streams with high or low pressure, but the capture rate is affected by thermodynamic conditions. Generally, two stages are sufficient:
- CO2 absorption from exhaust gas in an aqueous solution of the solvent in an absorber reactor (low temperatures and high pressures).
- Solvents regeneration to produce a pure CO2 stream in a stripper (high temperatures and low pressure).
An optimum solvent has a low regeneration energy demand, high capacity to absorb CO2, chemical stability, low volatility and limited solvent make-up. The state-of-the-art in solvents is represented by monoethanolamine (MEA), which has acceptably low heat requirements for regeneration, little degradation, and small amine losses. Figure 6 illustrates the block diagram scheme for the absorption/stripper system for CO2 capture.
The flue gas rich in CO2 reacts with the MEA in the absorber column producing flue gas lean of CO2 and carbon-rich amine solution at the bottom of the absorber. The rich solvent is pre-heated in the heat exchanger by the lean solvent regenerated in the stripper. The rich solvent comes into the stripper, where it reaches 120–140 °C at low pressure in order to regenerate the solution and produce a pure CO2 stream. The lean solvent supplies its heat to the rich solvent, and it is mixed with make-up MEA and water before entering the absorber column. The primary energy consumption (penalty efficiency) is attributed to the regeneration of the solvent in the stripper column [29].
Table 3 summarizes the results of new SCPC power plants, with and without a post-combustion capture system. The majority of data available for post-combustion capture plants are based on MEA solvents. Several technologies have been developed for post-combustion processes (e.g., Calcium Looping [30,31] and membrane separation [Section 3.4]). Although they offer a future reduction of capture costs, they have not yet been developed for large capture plants.
The plant with carbon capture requires about 32% of extra energy to reduce the emissions of CO2 by 87% compared to that without the carbon capture process. MEA technology has a higher Technology Readiness Level (i.e., TRL 9) than other post-combustion capture processes (e.g., chemical looping combustion TRL 6 and membrane polymeric TRL 6) [32].
3.4. Post-Combustion CO2 Capture with Membrane Technology
Recently, an increased interest in gas separation for hydrogen production, air separation, biogas upgrading, and CO2 sequestration from flue gas has been observed. Membrane-based gas separation technology can be used for the above aims. Membranes are produced as a thick film able to separate a mix of gases when there are driven forces (pressure and molar gradients).
The permeate is the gas separated from the mixture able to pass through the membrane to the low-pressure environment while the retentate is the remaining part of the original mix. Figure 7 shows the basic arrangement of this type of separation process.
Concerning the CO2 separation process, membrane technology is used to upgrade biogas, increasing methane content in Natural Gas (NG) or Synthetic Natural Gas (SNG), reaching the purity established by the gas network, or as post-combustion capture to sequestrate the CO2 from fuel combustion.
The membrane process shows several advantages compared to the other CO2 separation technologies: (i) no regeneration process; (ii) design without moving components; (iii) lower maintenance; (iv) high reliability [33]. On the contrary, the main drawbacks are higher energy requirements and as yet no process at a massive scale.
Low production costs, high gradient pressure, excellent work at the no-stress environment, and the possibility to scale-up are the main benefits of polymeric membranes, which are used mainly for gas separation despite their limited robustness, aging and swelling problems. The gas moves through the pores of the polymeric membranes. The primary mechanism of the gas separation process is dissolution on the feed side and diffusion across the membrane.
Polymeric membranes account for the main share of the global gas separation membranes market (77.46% in 2015) [34]. Nevertheless, inorganic membranes will certainly play an essential role in gas separation processes due to their significantly longer lifetime and lower environmental impacts. Inorganic membranes can be made of ceramic, metal, and carbon material and, in some cases, by a mixture of these materials. The different separating or transport mechanism depends on whether the microstructure of the membrane is dense or porous. The primary membranes for gas separation are dense ceramic membranes, dense metallic membranes, and microporous membranes.
Mixed Matrix Membranes (MMMs) consist of a continuous polymeric matrix in which nanoparticles of inorganic materials are immersed. They are considered new generation membranes for gas separation, combining the characteristics of polymer and mineral fillers. The incorporated inorganic material, such as zeolites, silica particles and Metal-Organic Framework (MOF), is added to improve the properties of the polymers [35].
The performance indicators depend on the dominant mechanism of gas permeation through the membrane. Nevertheless, permeability and selectivity are common for evaluating membrane separation, and they are the main performance indicators.
Permeance is the most common parameter used in the membrane industry, and it is defined as the rate at which gas moves through the membrane under a standard pressure driving force. It is frequently measured as a Gas Permeation Unit . Instead, the permeability is the permeance multiplied by membrane thickness, and it shows the intrinsic property of the gas to pass through the membrane and corresponds to the productivity of the membrane separation stage. It is also measured in .
The ability of a membrane to separate a target gaseous component from a mixture of two gases (i and j) is called selectivity or separation factor. It is an essential feature for separation applications, and it represents the efficiency of the membrane separation stage. Selectivity is measured by considering the molar fraction of single component on the permeate (y) side over that on the feed (x) side:
The PolarisTM membranes developed by the Membrane and Technology Research Institute (MTR) [22] overcome the main challenge of post-combustion capture. Indeed, the low partial pressure of flue gas leads to a huge membrane area. PolarisTM membranes have ten times the permeance of conventional gas separation membranes and, together with a new sweep module for the selective recycling of CO2, drive efficient overall CO2 recovery up to 90%. The main goal of MTR was to increase membrane permeance to decrease the required membrane area and reduce the capital cost of the membrane CO2 capture system. The first membrane developed had CO2 permeance of 1000 GPU and CO2/N2 selectivity of 50. Over time, the membrane performance has improved to 1700 GPU for second-generation (commercial scale) and almost 3000 GPU for the third one (only in lab-scale).
A new design for a small pilot membrane system was installed at the National Carbon Capture Center in July 2014. Several test campaigns have confirmed its efficient capacity to capture CO2 achieving 90% CO2 capture, while the very simplicity and tiny size of this technology gives it an advantage with respect to the other capture systems. The new configuration illustrated in Figure 8 was sized to treat 20 t CO2/day included in flue gas at 11% of CO2 and 50 °C, improving the TRL from 3 (lab scale) to 6 (pilot plant).
The membrane separation process designed by MTR/DOE and illustrated above is equipped with a multi-stage membrane treatment. The flue gas produced in a boiler flows into a cleaning unit in order to remove contaminants, and then it is pressurized. The pressurized flue gas flows into the first step CO2 capture module. The driven force used to separate the CO2 is mainly the gradient pressure obtained by means of a compressor on the feed side and a vacuum pump on the permeate side. In this first module, only part of the CO2 is separated from the flue gas. The remaining carbon dioxide in the depleted flue gas is sequestrated via the second sweep module. This component uses air combustion as a sweep stream to generate a driving force and therefore compressors and vacuum pumps are not used. The CO2 permeates the membrane to produce a diluted air combustion. As a result, the flue gas produced in the boiler has a higher CO2 concentration (i.e., ≈20%). With the configuration described above, the separation efficiency of the first module increases (about 90% of CO2 is captured) producing a rich mixture gas composed mainly of 71% of CO2, 9% of H2O and 18% of N2, which is sent to the CO2 purification unit.
The techno-economic analysis was performed integrating a supercritical coal power plant delivering 550 MWe with the new membrane technology of MTR, and it is summarized in the following Table 4.
4. Large-Scale Transport of CO2
CO2 can be transported in the solid, liquid, or gas phase. Liquid phase transportation is a critical method due to topographic variations that could cause pressure drop and temperature change, which leads to two-phase flow liquid-gas. Therefore, the most efficient way to transport CO2 is in the supercritical phase (pressure higher than 7.38 MPa and temperature of more than 31.2 °C). The transportation via pipeline is characterized by a steady-state supply of CO2 without temporary storage, while ship transport becomes feasible for long distances or overseas.
CO2 has been transported by pipeline for many years to industry users (e.g., food production, winemaking, oil recovery) while, in recent years, millions of tonnes of CO2 have been transported to the USA and Canada for EOR. Therefore, it is a mature technology, though a significant effort would be required to scale up the infrastructure to manage the global captured target of 7 Gt/y [36], which is much larger than the approximately 50 Mt/y transported for EOR in the USA [37].
4.1. CO2 Thermophysical Properties
The transportation chain starts from the conditioning of a CO2 rich stream from a capture process and ends with the injection into the storage sink. Between these two points, the CO2 transportation can take place via pipeline, ship or tanker trucks. Pipelines today operate as a mature market technology. The CO2 gathered from different capture technologies from sizeable stationary emission sources (e.g., industries and power plants) is conditioned, to remove impurities, and typically compressed up to 80 bar to avoid two-phase (i.e., liquid-gas phases) flow regimes and density increase. When it is transported via ship or road or rail tankers, the liquid CO2 carried is insulated at a low temperature and pressure in tanks. Usually, the thermodynamic designs for semi-refrigerant tank types are −54 °C and 6 bar or −50 °C and 7 bar [38].
CO2 can be transported in all three phases. For example, during pipeline transportation, pressure drops and temperature changes can cause a phase change. Therefore, it is crucial to know the CO2 phase diagram reported in Figure 9a. The phase diagram contains two important points: (i) triple point (−56.6 °C, 5.2 bar), the three phases of the substance coexist in thermodynamic equilibrium; (ii) critical point (31.1 °C, 73.8 bar), above which the substance exists as a supercritical fluid. In this last phase, CO2 has the density of a liquid and viscosity of a gas [39].
After purification, CO2 is dried to remove water particles and avoid corrosion to carbon and low-alloy steel lines. Indeed, moisture condensation can cause carbonic acid formation. After this process, the CO2 is pressurized to often achieve a dense phase fluid, increasing pipeline transportation efficiency.
The behavior of the captured CO2 depends on its composition. The composition relies upon the source type (e.g., power plant, industrial process), capture technology (e.g., post-combustion, oxy-combustion, pre-combustion), and fuel type. It may contain other chemical species like water vapour, CH4, N2, H2S, O2, and several other hydrocarbons. The presence of impurities has a significant impact on the physical properties (phase diagram) and hydraulic parameters (e.g., density, viscosity), as illustrated in Figure 9b. Therefore, a CO2-rich mixture diagram is necessary to design the transportation correctly.
This alteration has both technical and economic implications. The pumped system is recommended to keep the CO2 under the supercritical phase all along the pipeline. Further attention has to be paid to the depth variation, which induces temperature and pressure change.
It has been highlighted that the presence of free water in the CO2 stream should be avoided, and its content should be limited between 50–600 ppm [40]. The level of moisture depends on the quantity of SOx, NOx, and H2S contained in the CO2 stream, which can be formed in the presence of aqueous phase sulphuric and nitric acids and cause a pH drop of the solution. Therefore, the gas purification steps are essential to adjust the composition and obtain high CO2 concentration.
4.2. Economic Evaluation of CO2 Pipeline Transportation
Several works explain different cost models for pipeline transportation, but all of them give inconsistent results [41] due to different topographic conditions (e.g., onshore vs. offshore), geographical regions, which influence labour, and the right to travel under or over private land (Right-Of-Way cost (ROW)), assumption (e.g., lifetime, capacity factor), material (e.g., steel, coating, insulation), incorporated costs (e.g., initial pressure).
The transport cost model developed by the National Energy Technology Laboratory (NETL) [42] estimates the cost of transporting dense phase CO2 using a single point-to-point pipeline. The model has a level of accuracy between +50/−30%, and the analysis includes:
- Capital costs: Purchasing and installing the pipeline, surge tank, control system, and booster pump.
- Operation and Maintenance costs: For pipe, pump, and electricity to power pumps.
The costs of the material and installation of the pipeline depending on the diameter and length of the pipe.
The diameter is a function of CO2 mass flow rate, pressure losses due to elevation difference and rugosity of the material, and the number of boost pumps. The CO2 stream is assumed to be pure for the sake of simplicity.
Every segment of the pipeline is divided by pump stations and has the same length, inlet pressures equal to the initial inlet pressure, and outlet pressures identical to the end outlet pressure for each segment, while in the case of elevation difference, all the branches of the pipeline have the same variation. In this way, each pipe has the same pressure loss and elevation changes.
The transport cost model provides three methods for inner diameter calculation:
- McCollum and Ogden.
- Heddle et al. and MIT.
- McCoy and Rubin.
As a result, the inner diameter obtained in the three methods is rounded up to the near-standard diameter.
The transport cost model computes the capital cost, which is incurred only during the project construction years, and operating cost, which is incurred during the project operation years.
Detailed construction costs for CO2 pipelines are not available, and for this reason the capital cost model is based on the natural gas pipeline data set, and the numbers provided are assumed as the as-built-cost. The capital cost of the pipeline can be divided into four categories: (i) materials: pipe, coating and cathodic protection; (ii) labour costs; (iii) ROW and damage; and (iv) miscellaneous: engineering costs, supervision, contingencies, telecommunication equipment, taxes, administration and overheads, and regulatory filing fees.
Three equations provided by Parker [43], McCoy and Rubin [44], and Rui et al. [45] are taken into consideration to compute the capital cost of the pipeline,
Finding these values, the model changes them to CO2 pipeline costs through several different coefficients, depending on the equation chosen.
The following Table 5 summarises the main input parameter used in the analysis.
Figure 10a demonstrates that the method used to calculate the inside diameter of the pipeline did not affect the final result. In contrast, the three methods utilized to compute firstly the capital cost of the natural gas pipeline and then the CO2 pipeline, illustrated in Figure 10b, give significantly different results.
The Parker equation always gives the highest cost compared to the others, while the estimation cost of CO2 transportation using the Rubin method is lower. Rui and Rubin’s methods show a slightly decreasing trend with the increasing length of the pipeline; on the contrary, the Parker method does not describe cost reduction as the length of the pipe goes up. The analysis was obtained through an iterative calculation of the inner diameter, pressure drops, and several other parameters. The transportation cost also includes the optimal number of pumps used to avoid CO2 phase change.
5. CO2 Sequestration and NGH Purification
Storage of carbon dioxide from a power station or industrial facilities can be feasibly done as climate change mitigation options in subsurface formation within or below the ocean or under the ground. Considering the large-scale capture and storage, it is crucial to highlights the toxicity of CO2. The concentration in the atmosphere is around 0.04% but, if it increases up to 10%, the CO2 acts as an asphyxiant while, if it rises until 20%, the inhalation leads to rapid death. Therefore, once stored, the site will need to be monitored for many years to verify that CO2 can never be released to the atmosphere.
The main types of underground storage site are:
- Oil and gas wells. They are immediately accessible and used for EOR. During the extraction process, it is possible to achieve an oil with high viscosity (i.e., heavy oil) that it is impossible to extract with conventional methods. The injection of CO2 is one method to enhance oil recovery. The gas remains underground after pumped while the oil can be extract. The sequestered CO2 have to be monitored every days [46]. It can also be used depleted oil and gas fields, providing a storage capacity that will often have pipeline access but with limited capacity.
- Coal beds too deep to be mined. These coal beds (relatively rare) usually contain methane, and therefore carbon dioxide can replace it. The recovery methane will offset the cost of carbon dioxide sequestration.
- Brine aquifer. It is created when a cap of impermeable rock is formed deep underground and prevents water and gas seeping upwards. It can potentially be the most critical type of underground site in which CO2 can replace the brine to remain securely stored.
- Sequestrating CO2 as hydrate. Potentially, the CO2 can be trapped as clathrate hydrates into deep oceanic basins, depleted or existing natural gas hydrate reservoir, sub permafrost region with unfrozen water, and depleted oil and gas partially saturated with water.
5.1. CO2 Storage as Clathrate Hydrates
Subsurface CO2 permanent sequestration through clathrate hydrates formation is a novel method to mitigate global warming. Gas hydrate are clathrate compounds in which some guest gas molecules (e.g., CO2, CH4, C2H6) are encapsulated in water molecules. The gas hydrate form under low temperature and high-pressure conditions via hydrogen bonding between water molecules. Reserves of methane in hydrate structure are abundant in geological accumulations in offshore and permafrost environments, and they exceed the all-carbon fossil fuel [47].
Three methods are used to shift the equilibrium and produce methane from oceanic sediments: (i) thermal stimulation through direct heating or injection of heated fluid; (ii) depressurization is the preferred technique for driving gas hydrate dissociation; (iii) injection of chemical inhibitors; (iv) gas swapping [48]. The thermal stimulation method requires a continuous energy source to raise the hydrate temperature above the stability point. The depressurization method decreases the hydrate pressure under the stability point, causing hydrate dissociation. Inhibitor injection involves the injection of a compound at isobaric conditions that shift the equilibrium point to the lower temperature. The injection of CO2 molecule into NGH deposits involves the replacement of CH4 into the water cages that leads to produce methane and store carbon dioxide.
CO2 forms a stable hydrate structure at lower pressure conditions than CH4 hydrates at the same temperature, as it is showed in Figure 11. Therefore, CO2 hydrates are more stable than CH4 hydrates under certain conditions (i.e., CO2 and CH4 hydrates equilibrium curves intersect at around 10.5 °C and 75 bar), and it can displace the methane in the hydrate structure. In this way, it enables low carbon energy recovery (e.g., CH4) while offsetting capture and transportation cost. Besides, CO2 can re-occupy the pore space from methane recovery, maintaining the mechanical stability of the rock and preventing possible hazards of slope failures. Uchida et al. [49] have demonstrated via experiment and theoretical calculation that, at a temperature below 10 °C, the equilibrium pressures of the CO2 hydrates are lower than those of CH4 hydrate.
CO2 and CH4 molecules form both the type SI of crystal-structure hydrate that consists of six medium cages and two small cages. During the hydrate formation, the CO2 molecule, which is slightly larger than the CH4 molecule, only occupies the medium cages, while the methane molecule occupies both medium and small cages. As a result, more CH4 can form in the early stages. The heat of CO2 hydrate formation (−57.9 kJ/mol) is greater than the heat of dissociation of CH4 hydrates (54.5 kJ/mol). Therefore, a replacement reaction occurs in the later stages due to the favorable exothermic process [51]. The exothermic nature of the CO2 hydrates formation provides the heat of methane dissociation and increases the storage temperature. Therefore, the storage’s temperature is a critical parameter that has to remain below 10.5 °C to avoid CO2 dissociation and CH4 hydrate re-formation.
Lee et al. have examined CH4 and CO2 molecule distribution over the two cage sites (i.e., S and M) by Magic Angle Spinning Carbon-13 Nuclear Magnetic Resonance (MAS 13C NMR) into a hydrated sample. This analysis shows a limit to the CO2 replacement degree. It was estimated that 64% of methane can be recoverable from the NGH reservoir, resulting, after only via the exchange of CO2, a product hydrate with a CO2/CH4 ratio of 1.8 or greater at equilibrium condition. Otherwise, a kinetic test showed that the replacement reaction is almost complete in less than five hours, and the product hydrate results with a CO2/CH4 ratio of 1. Consequently, 50% of methane included in the reservoir can be replaced by CO2, and therefore a complete methane recovery is not possible [52].
The mixture of carbon dioxide and methane gas is present in the hydrate reservoir when the CO2 is injected into the NGH. Adisasmito et al. proposed the following polynomial equation fitted to the experimental data to measure the gas mixture’s equilibrium condition in hydrate form [53].
The equilibrium pressure is measured in MPa, the temperature is in °K, and y is the mole percent of carbon dioxide in the vapor phase. The above equation was fitted for a temperature between 273 K and 288 K, while the maximum pressure of the CO2 was selected not to exceed 4.37 MPa to avoid the formation of liquid CO2. Indeed, at a pressure higher than 4.37 MPa, the dissociation of methane hydrate occurs at a higher temperature than the hydrate formation of liquid CO2. Therefore, at high pressure, the CO2 might not sequester as hydrate and can cause instability of the seafloor. The equilibrium condition of the hydrate mixtures is shown in Figure 12.
The upper and lower limit of the phase equilibrium diagram represents the cases of pure methane and pure carbon dioxide hydrates, respectively. The equilibrium conditions for the mixed gases lie between these two limits. The figure shows that at a fixed temperature, the equilibrium conditions move to lower pressure and, at a fixed pressure, they move to a higher temperature when the CO2 mole fraction in the mixture increases.
The experiments above are conducted in the bulk phase; however, the dissociation of methane hydrate and its replacement via carbon dioxide occur in sediment reservoirs. Therefore, this process needs to be studied in porous media. Figure 13 compares the hydrates equilibrium conditions in porous media with those in the bulk phase [54].
The experimental data are measured mainly in porous silica gel and porous glass, and they are represented via symbols, while the lines represent value obtained by correlations. The figure shows that the equilibrium pressure is higher at a temperature while, at a pressure, the equilibrium temperature is lower in porous media than in the bulk phase. Besides, from the last two figures, we can deduce that increasing the CO2 mole fraction in the hydrate deposits will reduce the favorable range of temperature and pressure. Consequently, an accurate range selection is needed for simultaneous methane production and carbon dioxide sequestration [54].
The processes of hydrate formation and dissociation in porous media are different to respect those in the bulk phase. In porous media, the hydrate will first form in the smaller size pores as the temperature decrease. On the other hand, if the temperature increases, the hydrates will first dissociate in the largest pore. The injected CO2 can form hydrate into a pore throat blocking the pore. As a result, the hydrate particles can isolate large quantities of methane hydrate in a deeper pore and hampers further methane dissociation and carbon dioxide sequestration. Clennest et al. have predicted the hysteresis cycle between crystallization temperature and the dissociation of the clathrates in porous media [55]. Concerning the heat of dissociation and formation of the hydrates, several researchers have yielded conflicting results and therefore need further investigation [54].
Gambelli et al. have tested the CO2 replacement into NGH deposit via a combination of two strategies. Once the CH4 hydrate formation is carried out, the replacement phase is performed via depressurization and CO2 injection. The quantity of CO2 stored depends on the sum of two contributions: the methane replacement and an ex-novo CO2 hydrate formation. The CO2-CH4 exchange in methane hydrates is favorable; however, the new CO2 hydrate formation around and the superficial replacement process limit the transition of the CO2 into the deeper layer inside the deposits and, therefore, the overall replacement process. As a result, the storage efficiency (i.e., the ratio between the moles of CO2 permanently stored into the NGH and the total amount of CO2 injected inside the deposit) is limited at 36% with a value of sand pore saturation degree equal to 7.6% [56].
An experimental apparatus able to promote methane production via a combined CO2 replacement and depressurization was tested by Zhao et al. [57]. In this manuscript, they run two tests conducted with and without depressurization combined replacement method. This experiment shows the great benefit of the combined method, increasing methane replacement from 7% without depressurization to 25% with a mixed method [57].
Japan and China have carried out methane production testing in oceanic NGH reservoir, showing the possibility and feasibility of methane production by depressurization. Four tests are conducted, three in Nankai Trough (Japan), and one in Shenhu Area, China. The first Japanese test was done in March 2013, but the methane production was interrupted only after six days due to the abrupt sand production. The other two tests were performed in the same location in 2017 but also, in this case, the trials lasted 12 and 24 days, respectively. China has extracted from an oceanic NGH reservoir via a single vertical well by depressurisation method in the same period. China’s test was performed in the South China Sea for 60 days. The average daily gas production rate falls between 2.9 × 10³–8.3 × 10³ in both test sites, with a peak of 2 × 10⁴ m3/day [58].
5.2. Carbon Dioxide Replacement Cost and Conventional Storage Cost
The recovery of methane from NGH and its replacement with CO2 molecule remains very challenging, and no previous work on the open literature have reported its cost. Only a few studies have commented on the economics of methane production from NGH reservoirs, and one of these is used to extrapolate the infrastructure’s data cost. In fact, Vedachalam et al. [59] have analysed the techno-economic methane production based on the depressurization method. This method involves a vertical well that connects the NGH formation with a Floating Production Unit (FPU) with a pump able to depressurize the reservoir. The main cost parameters are summarized in the Table 6 below:
We have assumed that the cost data summarized in Table 6 for methane production via depressurization method are the same when a combined method (i.e., CO2 replacement + depressurization) is applied. The main financial and technical parameters used as input in this simulation are summarized in Table 7. The lifetime of the plant is set up at 15 years [58]. We have assumed that the CO2 only replaces methane hydrate and does not form a new hydrate to facilitate the economic simulation.
The tests defined the annual methane production performed both in Japan and China sites, and it was assumed that could be the same when the combined method is applied. The syngas produced from NGH is not composed only of methane but also the injected CO2 that does not participate in the reaction [56]. As a result, the produced syngas comprises 36% CH4-66% CO2 at the chosen storage efficiency. The economic analysis was conducted for different numbers of wells, and the minimum cost to store one ton of CO2 is illustrated in Figure 14.
Increasing the number of wells, the revenue derived from methane’s sale goes up because the methane production increases. Simultaneously, the amount of carbon dioxide that replaces the methane and is sequestrated as hydrate increases. As a result, the CO2 storage cost drops from 11.6 $/t to 5.8 $/t when the wells’ numbers pass from one to two, respectively. The minimum CO2 storage cost was obtained with ten wells, but there are no manuscripts that report many such wells working simultaneously to produce methane in the NGH reservoir. Therefore, the CO2 storage cost in NGH with two wells might be the representative value to compare this solution with the other possible storage sites.
Costs for geological storage are widely variable due to different reservoir types (e.g., onshore, offshore, depleted field, deep saline formation) and reservoir geology (e.g., depth, permeability). Therefore, storage cost is reported as a range, and the data are provided by different literature.
5.3. Methane Upgrade with Membrane-Based Separation Technology
Concerning the CO2 separation process, membrane technology is used to upgrade biogas, increasing methane content on NG/SNG, reaching the purity fixed by a gas network.
Natural gas is considered a helpful bridge fuel to decrease greenhouse gas emissions. Purification and quality upgrade are necessary to use several natural gas reservoirs at low methane concentration as well as several processes are enough to carbon conversion and SNG production. For this purpose, membrane technology is applied to separate CH4 from a mixture of gases composed by CO2, CH4, N2, H2O, and heavy hydrocarbons.
Commonly used glassy polymers for gas separation are polyimides (PI), polysulfone (PSF), polycarbonates (PC), while the mainly used rubber membranes are polyurethane (PU) and polydimethylsiloxane (PDMS). Among the PI polymers, Matrimid membranes are the most interesting; it is inflexible, strong and presents a CO2 permeability of 12.7 barrer and CO2/CH4 ideal selectivity near to 40, at 20 bar [61].
PSF membranes are produced in three ways (asymmetric, dense, and composite), and they have CO2 and CH4 permeability of 12.33 and 4.69, respectively, while the CO2/CH4 selectivity is equal to 3.37 [62]. Carbon dioxide sequestration is relevant nowadays, and PDMS membranes possess excellent CO2 permeability, high thermal stability, and a low rate of aging.
Also, the mixed matrix membrane is used to upgrade natural gas. Graphene oxide (GO) has been incorporated into the polyethylene oxide matrix (PEO) for sustainable CO2 capture obtaining mechanical properties improvement. Permeability is enhanced by taking advantage of increased fractional free volume. As the GO contents increase from 0 to 1.0%wt, the H2, N2, and CO2 (10 atm) permeabilities increase from 27.3, 5.84, and 280 barrer to 47.7, 8.5 and 474 barrer, respectively [63].
Simultaneous improvement in CO2 permeability and CO2/CH4 selectivity can result in dispersing NOTT-300, a new MOF, in the Pebax1657 matrix. Increasing the content of BOF CO2 permeability reached 395 barrer, while CO2/N2 and CO2/CH4 selectivity reached 61 and 36, respectively, at 10 bar [64].
Several authors have analysed the techno-economic feasibility of CO2 removal from natural gas via membrane technology, more of them with a CO2 content between 10% and 50% into the syngas. Yunhan Chu et al. have performed an HYSYS simulation and a cost evaluation. Assuming that 100 $/m2 is the carbon-based membrane cost, the use of two-stage with recycling and a feed syngas with 50% of CO2, the natural gas processing cost results in 0.044 $/Nm3 of natural gas achieving 98% of CH4 in the retentate and 2% of losses [65].
Gilassi et al. have performed a new optimization model to determine the optimum module number while minimizing the cost. The model has revealed that the use of two membrane units is enough to rich a pure output stream composed up to 98% of methane and reduce the methane losses above one percent. The biogas separation cost increases almost linearly with the content of CO2 into the feed syngas. The biogas separation cost varies from 0.045 $/Nm3 to 0.09 $/Nm3 of CH4 with 10% and 40% of CO2 contents in the feed syngas, respectively [66].
The syngas produced during the methane extraction and simultaneous carbon dioxide sequestration from the NGH reservoir might contain 64% of CO2. This value is higher than that estimated by the authors previously cited. Nevertheless, a two-stage membrane separation process to upgrade the methane content until 98% can also be used for this application, as shown in Figure 15. As a result, the separation cost can be equal to 0.126 $/Nm3 with 64% of CO2 from its linearization. Therefore, the CO2 separation cost is 0.036 $/ton of CO2 as evaluated in Equation (10).
is the cost to separate the CO2 in $/ton of CO2, is the biogas separation cost, and are the mole fractions of methane and carbon dioxide in the syngas, respectively, and is the density of carbon dioxide equal to 1.976 ton/Nm3 of CO2.
6. Comparison between the Most Promising Technologies and CCS Cost Results
Previous sections present techno-economic analysis on the full pathway that, starting from captured CO2 from power and process industries by several carbon capture technologies, will deliver it to geological sequestration by pipeline. The main carbon capture processes (oxyfuel-combustion, pre-combustion and post-combustion), the CO2 transportation to onshore/offshore storage sites, the CO2 deep marine injection into hydrates site are examined by techno-economic analysis. At the same time, several membranes with the best performance are reported for the purification of the CO2/CH4 effluent returning from the storage site in which injected CO2 replaces CH4.
The final CCS chain can be designed considering parameter specification of each component (capture, transport, and storage), incorporating relevant global parameters (e.g., electricity price, methane price) and evaluating economic outcomes of the chain, typically net present value and CO2 cost. The potential of a commercial CCS project is affected by CCS technology maturity level, business economy factors, environmental impact risk associated with the full pathway of CCS, public acceptance, regulation, and market.
We have reported the efficiency penalty of the plant with CCS, the increasing levelized cost of electricity, and CO2 capture cost. As key results, the cost of CO2 captured for oxyfuel combustion (air separation unit), pre-combustion (PSA) and post-combustion (MEA) were 52 [$/t], 63 [$/t] and 46 [$/t], respectively, while the CO2 capture cost resulted by membrane separation technology developed by MTR and NETL is 2 $/tCO2 less than MEA. Therefore, the best performance is reached by applying the membrane separation process as post-combustion capture technology resulting in cheaper CO2 capture cost. At the state of the art, MEA technology is the most used and less expansive at large scale, but the membrane capture system seems the most promising and interesting process to scale-up.
Concerning the transportation of CO2, economic analysis shows different results when different methods are applied. Among them, we have illustrated the two, which lead to lower and higher values, to report the range of CO2 cost transportation at different lengths of the pipeline. As result, for 100 [km], the range of CO2 cost transportation is between 0.8 and 1.4 [$/t].
Finally, several geological storages were analyzed, and several values are reported in the literature. The biogas separation cost has to be added when methane is produced from a NGH reservoir.
Figure 16 points out the cost of the complete CCS chain, considering conventional storage sites and NGH reservoir. CCS cost low line is composed of the cost of CO2 capture and the most economical cost of CO2 transport (using Rui et al. method) and storage (1.5 $/t CO2 see Table 8). On the contrary, the CCS cost high line takes into account the CO2 capture cost, and the higher cost of CO2 transport (using the Parker method) and storage (i.e., 30.6 $/t and 11.6 $/t for conventional site and NGH reservoir, respectively). The figure illustrates the trend of CCS cost at different distances between source and storage. As a result, the maximum price of CCS chains using membrane based-gas separation technology for CO2 capture and for storing the carbon dioxide in the NGH reservoir is lower than the value of the CCS chain when the CO2 is stored in a conventional site. The range of CCS cost at different pipeline length was evaluated, finding for CO2 store in conventional reservoir and in NGH site [46.3;76] and [46.3;57] [$/t], respectively at 100 km.
The CO2 capture is the most impacting cost item, as shown in Figure 17. This figure illustrates to what extent each step of the CCS chain affects the total cost at different pipeline length. It seems very clear that the CO2 transportation is almost neglected for low distance, while capture and storage processes play a fundamental role in the CCS chain. As a result, for 100 km between source and NGH storage site, CO2 capture with membrane technology, transport, and storage make up 86%, 2%, and 11%, respectively, of the total CCS cost.
The whole pathway of CO2 is shown in Figure 18. The exhaust gas coming from a carbon-intensive plant is pre-treated into a CO2 separation unit. The best performance technologies are the MEA process and the membrane capture process. The CO2 captured is sent to the NGH reservoir through the pipeline transportation system, both onshore and offshore. The CO2 transported before is injected into the NGH reservoir, thermodynamic condition changes, and syngas pass from hydrate to the gas phase. The produced syngas has to be treated in order to respect the regulations of the methane network. One of the best technologies to separate a gas mixture with CO2/CH4 is also the membrane separation technology.
7. Conclusions
This paper explores options for CO2-enhanced methane recovery from hydrates and clarifies the weight of each step on the overall CCS pathway. The main goal is to find the total cost of CCS to capture, transport, and store the CO2 in the hydrate phase, replacing the natural gas produced from NGHs reservoir.
A wide range of CO2 capture technologies are developed but there are only two large scale facility in operation configured to operate with MEA capture process. Several power plants equipped with different and promising carbon capture technologies have been built in order to reduce the CO2 capture cost by learning from experience and meets a sufficient abatement of the CO2 emission.
We have focused our study in one innovative capture technology, reporting membrane capture technology using the PoarisTM membrane developed by MTR. The cooperation between MTR and the Department of Energy (DOE)/NETL can help this technology became cheaper. The upgrade to plant scale is already programmed and could lead to reducing the CCS cost.
Successively, we have shifted the study on the CO2 transportation from source to sink. To find the cost of CO2 transportation, the NETL techno-economic model was used, resulting in optimal inner diameter and number of boost station. Pipeline transportation process is a mature technology but a new network that connect sources (i.e., power plants and industries) with CO2 consumers and storage sites should be implemented and financed by states.
The cost of CO2 storage in the NGH reservoir was evaluated, but this process requires new experimental tests both at laboratory and in a real reservoir. Natural gas was produced through the injection of anthropogenic CO2 in the NGH reservoir combined with a depressurization method. Future works will have the aim to find the CO2 cost separation from syngas outgoing NGH. The membrane-based CO2 separation process seems the best option to upgrade the methane stream, and new works are needed to develop membranes with higher permeability and selectivity useful for this process.
Funding
This research was funded by Ministry of Instruction, University and Research (MIUR), grant number 20173K5L3K, in the framework of the Research Project of Relevant National Interest (PRIN) called “Methane recovery and carbon dioxide disposal in natural gas hydrate reservoirs”.
Institutional Review Board Statement
Not applicable.
Informed Consent Statement
Not applicable.
Data Availability Statement
Data available on request due to privacy restrictions. The data presented in this study are available on request from the corresponding author.
Acknowledgments
The authors gratefully acknowledge the supports of the Ministry of Instruction, University and Research (MIUR), grant number 20173K5L3K, in the framework of the Research Project of Relevant National Interest (PRIN) called “Methane recovery and carbon dioxide disposal in natural gas hydrate reservoirs”.
Conflicts of Interest
The authors declare no conflict of interest.
Nomenclature
| ASU | Air Separation Unit |
| BF | Blast Furnace |
| BOF | Basic Oxygen Furnace |
| CCS | Carbon capture and storage |
| CEPCI | Chemical Engineering Plant Cost Index |
| CPU | CO2 Processing Unit |
| DOE | Department Of Energy |
| DRI | Direct Reduction Iron |
| EAF | Electric Arc Furnace |
| EOR | Enhanced Oil Recovery |
| ESP | Electro-Static Precipitator |
| FGD | Flue Gas Desulphurisation |
| FOAK | First-Of-A-Kind |
| FPU | Floating Production Unit |
| GDP | Gross Domestic Product |
| GO | Graphene oxide |
| GPU | Gas Permeation Unit |
| Gt | Giga tons |
| HHV | Higher Heating Value |
| HRSG | Heat Recovery Steam Generator |
| IGCC | Integrated Gasification Combined Cycle |
| IPCC | Intergovernmental Panel on Climate Change |
| LCOE | Levelized Cost Of Electricity |
| LEILAC | Low Emissions Intensity Lime and Cement |
| MAS 13C NMR | Magic Angle Spinning Carbon-13 Nuclear Magnetic Resonance |
| MEA | Mono-ethanolamine |
| MIUR | Ministry of Education, University and Research |
| MMMs | Mixed Matrix Membranes |
| MOF | Metal-Organic Framework |
| MTR | Membrane and Technology Research |
| MW | Net Plant Capacity |
| NETL | National Energy Technology Laboratory |
| NG | Natural Gas |
| NGH | Natural gas hydrate |
| PC | polycarbonates |
| PCCI | Power Capital Cost Index |
| PDMS | polydimethylsiloxane |
| PEO | polyethylene oxide |
| PI | polyimides |
| PM | Particulate Matter |
| PRIN | Project of Relevant National Interest |
| PSA | Pressure Swing Absorption |
| PSF | Poly-sulfone |
| PU | polyurethane |
| ROW | Right-Of-Way |
| SCPC | Super-Critical Pulverised Coal |
| SNG | Synthetic Natural Gas |
| SOFC | Solid Oxide Fuel Cell |
| SR | Steam Reformer |
| TCC [$] | Total Capital Cost |
| tLS | ton of liquid steel |
| TRL | Technology Readiness Level |
| USC | Ultra-Super-Critical |
| VPSA | Vacuum Pressure Swing Absorption |
| WGS | Water Gas Shift |
| Parameters | |
| C | Capture fraction |
| [$/t] | CO2 separation cost |
| [] | Syngas separation cost |
| CF | capacity factor |
| f | CO2 capture rate |
| FC [$/MJ] | Fuel Cost |
| FCF [fraction/year] | Fixed Charge Factor |
| FOM [$/y] | Fixed Operating and Maintenance cost |
| HR [MJ/MWh] | Heat Rate |
| Mole of CO2 injected | |
| Mole of CO2 permanently stored | |
| [MPa] | Equilibrium pressure |
| [tCO2/MWh] | Baseline emissions |
| R [J/(mol K] | specific gas constant |
| T [K] | Temperature |
| VOM [$/MWh] | Variable non-fuel Operating and Maintenance cost |
| W [J/mol] | Energy requirement |
| x | Molar Fraction on feed side |
| y | Molar Fraction on permeate side |
| α | Selectivity |
| [%] | Baseline efficiency |
| [%] | Efficiency with carbon capture |
| Storage efficiency | |
| CO2 density |
References
- Masson-Delmotte, V.; Zhai, P.; Pörtner, H.O.; Roberts, D.; Skea, J.; Shukla, P.R.; Pirani, A.; Moufouma-Okia, W.; Péan, C.; Pidcock, R.; et al. Summary for Policymakers. In Global Warming of 1.5 °C. Available online: https://www.asme.org/about-asme/engineering-history/landmarks/228-philo-6-steam-electric-generating-unit (accessed on 11 January 2021).
- IEA. Global Energy & CO2 Status Report 2019; IEA: Paris, France, 2019. [Google Scholar]
- Green, D.W.; Perry, R.H. Perry’s Chemical Engineers’ Handbook, 8th ed.; McGraw Hill Professional; McGraw-Hill Education: New York, NY, USA, 2007; ISBN 9780071593137. [Google Scholar]
- IPCC Working Group III. Climate Change 2014: Mitigation of Climate Change; IPCC: Cambridge, UK, 2014. [Google Scholar]
- MIT. The Future of Natural Gas; MIT: Cambridge, MA, USA, 2011. [Google Scholar]
- Sloan, E.D. Fundamental principles and applications of natural gas hydrates. Nature 2003, 426, 353–359. [Google Scholar] [CrossRef] [PubMed]
- Plecher, H. Share of Economic Sectors in the Global Gross Domestic Product (GDP) from 2007 to 2017. Available online: https://www.statista.com/statistics/256563/share-of-economic-sectors-in-the-global-gross-domestic-product/ (accessed on 11 January 2021).
- IEA. Global CO2 Emissions by Sector, 2017; IEA: Paris, France, 2017. [Google Scholar]
- Lehne, J.; Preston, F. Making Concrete Change Innovation in Low-carbon Cement and Concrete. Available online: https://reader.chathamhouse.org/making-concrete-change-innovation-low-carbon-cement-and-concrete# (accessed on 11 January 2021).
- Low Emission Intensity Lime and Cement (LEILAC). Public LEILAC Feed Summary Report. Available online: https://ec.europa.eu/research/participants/documents/downloadPublic?documentIds=080166e5b41458ac&appId=PPGMS (accessed on 11 January 2021).
- World Steel Association Our Indicators. Available online: https://www.worldsteel.org/steel-by-topic/sustainability/sustainability-indicators.html (accessed on 11 January 2021).
- The World Steel Association. World Steel in Figures 2019. 2019. Available online: https://www.worldsteel.org/en/dam/jcr:96d7a585-e6b2-4d63-b943-4cd9ab621a91/World%2520Steel%2520in%2520Figures%25202019.pdf (accessed on 11 January 2021).
- Paoluzzi, D.; Martinis, A.; Danieli & Office Meccaniche. Sustainable Decrease of CO2 Emissions in the Steelmaking Industry by Means of the Energiron Direct Reduction Technology. Available online: http://keepmoving.com.mx/kmt-test/energirondemouno/wp-content/uploads/2019/07/Environmental-sustainability-80-CO2-emissions-achievable.pdf (accessed on 11 January 2021).
- ASME. 228 Philo 6 Steam-Electric Generating Unit. Available online: https://www.asme.org/about-asme/engineering-history/landmarks/228-philo-6-steam-electric-generating-unit (accessed on 11 January 2021).
- IEA. Technology Roadmap—High-Efficiency, Low-Emissions Coal-Fired Power Generation; IEA: Paris, France, 2012. [Google Scholar]
- Tan, X. Supercritical and ultrasupercritical coal-fired power generation. Bus. Public Adm. Stud. 2012, 7, 53. [Google Scholar]
- Stéphenne, K. Start-up of World’s First Commercial Post-combustion Coal Fired CCS Project: Contribution of Shell Cansolv to SaskPower Boundary Dam ICCS Project. Energy Procedia 2014, 63, 6106–6110. [Google Scholar] [CrossRef] [Green Version]
- Vega, F.; Baena-Moreno, F.M.; Gallego Fernández, L.M.; Portillo, E.; Navarrete, B.; Zhang, Z. Current status of CO2 chemical absorption research applied to CCS: Towards full deployment at industrial scale. Appl. Energy 2020, 260, 114313. [Google Scholar] [CrossRef]
- Amel’kin, S.A.; Burtzler, J.M.; Hoffmann, K.H.; Tsirlin, A.M. Evaluating the Efficiency Frontier of Separation Processes. Theor. Found. Chem. Eng. 2001, 35, 217–223. [Google Scholar] [CrossRef]
- Budinis, S.; Krevor, S.; Mac Dowell, N.; Brandon, N.; Hawkes, A. An assessment of CCS costs, barriers and potential. Energy Strateg. Rev. 2018, 22, 61–81. [Google Scholar] [CrossRef]
- Rubin, E.S.; Davison, J.E.; Herzog, H.J. The cost of CO2 capture and storage. Int. J. Greenh. Gas Control 2015, 40, 378–400. [Google Scholar] [CrossRef]
- Merkel, T.; Kniep, J.; Wei, X.; Carlisle, T.; White, S.; Pande, S.; Fulton, D.; Watson, R.; Hoffman, T.; Freeman, B.; et al. Pilot Testing of a Membrane System for Postcombustion CO2 Capture; Membrane Technology and Research, Incorporated: Newark, CA, USA, 2015. [Google Scholar]
- Stanger, R.; Wall, T.; Spörl, R.; Paneru, M.; Grathwohl, S.; Weidmann, M.; Scheffknecht, G.; McDonald, D.; Myöhänen, K.; Ritvanen, J.; et al. Oxyfuel combustion for CO2 capture in power plants. Int. J. Greenh. Gas Control 2015, 40, 55–125. [Google Scholar] [CrossRef]
- Mathieu, P. Oxyfuel combustion systems and technology for carbon dioxide (CO2) capture in power plants. In Developments and Innovation in Carbon Dioxide (CO2) Capture and Storage Technology; Woodhead Publishing: Cambridge, UK, 2010; pp. 283–319. [Google Scholar] [CrossRef]
- Wang, G.; Ma, Z.; Deng, J.; Li, Z.; Duan, L.; Zhang, Q.; Hao, J.; Jiang, J. Characteristics of particulate matter from four coal–fired power plants with low–low temperature electrostatic precipitator in China. Sci. Total Environ. 2019, 662, 455–461. [Google Scholar] [CrossRef]
- Córdoba, P. Status of Flue Gas Desulphurisation (FGD) systems from coal-fired power plants: Overview of the physic-chemical control processes of wet limestone FGDs. Fuel 2015, 144, 274–286. [Google Scholar] [CrossRef]
- IEAGHG. Towards Zero Emissions CCS in Power Plants Using Higher Capture Rates or Biomass. Available online: https://climit.no/wp-content/uploads/sites/4/2019/09/IEAGHG-Report-2019-02-Towards-zero-emissions.pdf (accessed on 11 January 2021).
- Schiebahn, S.; Grube, T.; Robinius, M.; Zhao, L.; Otto, A.; Kumar, B.; Weber, M.; Stolten, D. Power to Gas. In Transition to Renewable Energy Systems; John Wiley & Sons, Ltd.: Hoboken, NJ, USA, 2013; pp. 813–848. ISBN 9783527673872. [Google Scholar]
- Desideri, U. Advanced absorption processes and technology for carbon dioxide (CO2) capture in power plants. In Developments and Innovation in Carbon Dioxide (CO2) Capture and Storage Technology; Woodhead Publishing: Cambridge, UK, 2010; pp. 155–182. [Google Scholar] [CrossRef]
- Shimizu, T.; Hirama, T.; Hosoda, H.; Kitano, K.; Inagaki, M.; Tejima, K. A Twin Fluid-Bed Reactor for Removal of CO2 from Combustion Processes. Chem. Eng. Res. Des. 1999, 77, 62–68. [Google Scholar] [CrossRef]
- Cannone, S.F.; Stendardo, S.; Lanzini, A. Solar-powered Rankine cycle assisted by an innovative calcium looping process as energy storage system. Ind. Eng. Chem. Res. 2020, 59, 6977–6993. [Google Scholar] [CrossRef]
- Bui, M.; Adjiman, C.S.; Bardow, A.; Anthony, E.J.; Boston, A.; Brown, S.; Fennell, P.S.; Fuss, S.; Galindo, A.; Hackett, L.A.; et al. Carbon capture and storage (CCS): The way forward. Energy Environ. Sci. 2018, 11, 1062–1176. [Google Scholar] [CrossRef] [Green Version]
- Calabrò, V.; Iulianelli, A.; Liguori, S.; Basile, A.; Gugliuzza, A.; Saraceno, A. State of the Art on CO2 Separation Processes with Membrane Technology (In Italian). Available online: https://www.enea.it/it/Ricerca_sviluppo/documenti/ricerca-di-sistema-elettrico/celle-a-combustibile-biomasse/rds-139-2.1.2-stato-dell2019arte-sui-processi-di-rimozione.pdf (accessed on 11 January 2021).
- Credence Research Gas Separation Membranes market, by Type, Application and Region—Growth, Future Prospects and Competitive Analysis. Available online: https://www.credenceresearch.com/report/gas-separation-membranes-market (accessed on 11 January 2021).
- Aroon, M.A.; Ismail, A.F.; Matsuura, T.; Montazer-Rahmati, M.M. Performance studies of mixed matrix membranes for gas separation: A review. Sep. Purif. Technol. 2010, 75, 229–242. [Google Scholar] [CrossRef]
- IEA. Energy Technology Perspectives 2012; IEA: Paris, France, 2012. [Google Scholar]
- Luo, X.; Wang, M.; Oko, E.; Okezue, C. Simulation-based techno-economic evaluation for optimal design of CO2 transport pipeline network. Appl. Energy 2014, 132, 610–620. [Google Scholar] [CrossRef]
- Intergovernmental Panel on Climate Change (IPCC). Carbon Dioxide Capture and Storage. Available online: https://www.ipcc.ch/site/assets/uploads/2018/03/srccs_wholereport.pdf (accessed on 11 January 2021).
- Woodhill Engineering Consultants. Pipeline Transmission of CO2 and Energy. Transmission Study Report. Prepared by Woodhill Engineering Consultants; IEA GHG. Report No.: PH4/6. 2002. Available online: https://ieaghg.org/docs/General_Docs/Reports/PH4_6%20TRANSMISSION%20REPORT.pdf (accessed on 11 January 2021).
- Onyebuchi, V.E.; Kolios, A.; Hanak, D.P.; Biliyok, C.; Manovic, V. A systematic review of key challenges of CO2 transport via pipelines. Renew. Sustain. Energy Rev. 2018, 81, 2563–2583. [Google Scholar] [CrossRef] [Green Version]
- Knoope, M.M.J.; Ramírez, A.; Faaij, A.P.C. A state-of-the-art review of techno-economic models predicting the costs of CO2 pipeline transport. Int. J. Greenh. Gas Control 2013, 16, 241–270. [Google Scholar] [CrossRef]
- National Energy Technology Laboratory (NETL). FE/NETL CO2 Transport Cost Model: Description and User’s Manual; NETL: Pittsburgh, PA, USA, 2018.
- Parker, N. Using Natural Gas Transmission Pipeline Costs to Estimate Hydrogen Pipeline Costs; Institute of Transportation Studies: UC Davis, CA, USA, 2004. [Google Scholar]
- McCoy, S.T.; Rubin, E.S. An engineering-economic model of pipeline transport of CO2 with application to carbon capture and storage. Int. J. Greenh. Gas Control 2008, 2, 219–229. [Google Scholar] [CrossRef]
- Rui, Z.; Metz, P.; Reynolds, D.; Chen, G.; Zhou, X. Regression models estimate pipeline construction costs. Oil Gas J. 2011, 109, 120–127. [Google Scholar]
- Thomas, S. Enhanced Oil Recovery—An Overview. Oil Gas Sci. Technol. Rev. IFP 2008, 63, 9–19. [Google Scholar] [CrossRef] [Green Version]
- White, M.; McGrail, P. Designing a pilot-scale experiment for the production of natural gas hydrates and sequestration of CO2 in class 1 hydrate accumulations. Energy Procedia 2009, 1, 3099–3106. [Google Scholar] [CrossRef] [Green Version]
- Kondori, J.; Zendehboudi, S.; Hossain, M.E. A review on simulation of methane production from gas hydrate reservoirs: Molecular dynamics prospective. J. Pet. Sci. Eng. 2017, 159, 754–772. [Google Scholar] [CrossRef]
- Uchida, T.; Ikeda, I.Y.; Takeya, S.; Kamata, Y.; Ohmura, R.; Nagao, J.; Zatsepina, O.Y.; Buffett, B.A. Kinetics and stability of CH4-CO2 mixed gas hydrates during formation and long-term storage. Chemphyschem 2005, 6, 646–654. [Google Scholar] [CrossRef] [PubMed]
- Le, Q.-D.; Rodriguez, C.T.; Legoix, L.N.; Pirim, C.; Chazallon, B. Influence of the initial CH4-hydrate system properties on CO2 capture kinetics. Appl. Energy 2020, 280, 115843. [Google Scholar] [CrossRef]
- McGrail, B.P.; Schaef, H.T.; White, M.D.; Zhu, T.; Kulkarni, A.S.; Hunter, R.B.; Patil, S.L.; Owen, A.T.; Martin, P.F. Using Carbon Dioxide to Enhance Recovery of Methane from Gas Hydrate Reservoirs: Final Summary Report; Pacific Northwest National Lab. (PNNL): Richland, WA, USA, 2007.
- Lee, H.; Seo, Y.; Seo, Y.-T.; Moudrakovski, I.L.; Ripmeester, J.A. Recovering Methane from Solid Methane Hydrate with Carbon Dioxide. Angew. Chem. Int. Ed. 2003, 42, 5048–5051. [Google Scholar] [CrossRef] [PubMed]
- Adisasmito, S.; Frank, R.J.; Sloan, E.D. Hydrates of carbon dioxide and methane mixtures. J. Chem. Eng. Data 1991, 36, 68–71. [Google Scholar] [CrossRef]
- Goel, N. In situ methane hydrate dissociation with carbon dioxide sequestration: Current knowledge and issues. J. Pet. Sci. Eng. 2006, 51, 169–184. [Google Scholar] [CrossRef]
- Clennell, M.B.; Hovland, M.; Booth, J.S.; Henry, P.; Winters, W.J. Formation of natural gas hydrates in marine sediments 1. Conceptual model of gas hydrate growth conditioned by host sediment properties. J. Geophys. Res. B Solid Earth 1999, 104, 22985–23003. [Google Scholar] [CrossRef]
- Gambelli, A.M.; Castellani, B.; Nicolini, A.; Rossi, F. Experimental study on natural gas hydrate exploitation: Optimization of methane recovery, carbon dioxide storage and deposit structure preservation. J. Pet. Sci. Eng. 2019, 177, 594–601. [Google Scholar] [CrossRef]
- Zhao, J.; Zhang, L.; Chen, X.; Zhang, Y.; Liu, Y.; Song, Y. Combined replacement and depressurization methane hydrate recovery method. Energy Explor. Exploit. 2016, 34, 129–139. [Google Scholar] [CrossRef] [Green Version]
- Yu, T.; Guan, G.; Abudula, A.; Yoshida, A.; Wang, D.; Song, Y. Gas recovery enhancement from methane hydrate reservoir in the Nankai Trough using vertical wells. Energy 2019, 166, 834–844. [Google Scholar] [CrossRef]
- Vedachalam, N.; Ramesh, S.; Jyothi, V.B.N.; Ramadass, G.A.; Atmanand, M.A.; Manivannan, P. Techno-economic viability studies on methane gas production from gas hydrates reservoir in the Krishna-Godavari basin, east coast of India. J. Nat. Gas Sci. Eng. 2020, 77, 103253. [Google Scholar] [CrossRef]
- Natural Gas Prices in Selected Markets from 2017 to 2030 (in Nominal U.S. Dollars per Million British Thermal Units). Available online: https://www.statista.com/statistics/444286/natural-gas-price-forecast-by-region/ (accessed on 11 January 2021).
- De Angelis, M.G.; Giacinti Baschetti, M.; Minelli, M.; Olivieri, L.; Deiana, P.; Bassano, C. Synthesis, Characterization and Testing of CO2 Separation Membranes and Purification of Synthetic Natural Gas (SNG) (In Italian). Available online: https://www.enea.it/it/Ricerca_sviluppo/documenti/ricerca-di-sistema-elettrico/combustibili-fossili-ccs/2014/rds-par2014-269.pdf (accessed on 11 January 2021).
- Mohamad, M.B.; Shariff, A. Gas Separation of Carbon Dioxide from Methane Using Polysulfone Membrane Incorporated with Zeolite-T. Procedia Eng. 2016, 148, 621–629. [Google Scholar] [CrossRef] [Green Version]
- Quan, S.; Li, S.W.; Xiao, Y.C.; Shao, L. CO2-selective mixed matrix membranes (MMMs) containing graphene oxide (GO) for enhancing sustainable CO2 capture. Int. J. Greenh. Gas Control 2017, 56, 22–29. [Google Scholar] [CrossRef]
- Habib, N.; Shamair, Z.; Tara, N.; Nizami, A.-S.; Akhtar, F.H.; Ahmad, N.M.; Gilani, M.A.; Bilad, M.R.; Khan, A.L. Development of highly permeable and selective mixed matrix membranes based on Pebax®1657 and NOTT-300 for CO2 capture. Sep. Purif. Technol. 2020, 234, 116101. [Google Scholar] [CrossRef]
- Gilassi, S.; Taghavi, S.M.; Rodrigue, D.; Kaliaguine, S. Optimizing membrane module for biogas separation. Int. J. Greenh. Gas Control 2019, 83, 195–207. [Google Scholar] [CrossRef]
- Chu, Y.; He, X. Process Simulation and Cost Evaluation of Carbon Membranes for CO2 Removal from High-Pressure Natural Gas. Membranes 2018, 8, 118. [Google Scholar] [CrossRef] [Green Version]
- ZEP. The Costs of CO2 Storage: Post-Demonstration CCS in the EU. Available online: https://www.globalccsinstitute.com/archive/hub/publications/119816/costs-co2-storage-post-demonstration-ccs-eu.pdf (accessed on 11 January 2021).
- USDOE. CO2 Saline Storage Cost Model: Model Description and Baseline Results; USDOE: Pittsburgh, PA, USA, 2014.
- GCCSI. Economic Assessment of Carbon Capture and Storage Technologies; GCCSI: Canberra, Australia, 2011. [Google Scholar]
Figure 1.
Schematic diagrams of carbon capture processes showing oxyfuel combustion, pre-combustion, and post-combustion applied to the energy sector, while the last diagram illustrates a general CO2 separation process for a net-zero industry.
Figure 1.
Schematic diagrams of carbon capture processes showing oxyfuel combustion, pre-combustion, and post-combustion applied to the energy sector, while the last diagram illustrates a general CO2 separation process for a net-zero industry.

Figure 2.
Minimum energy requirement for CO2 capture depending on the capture rate and inlet concentration of CO2 at 50 °C. [19].
Figure 2.
Minimum energy requirement for CO2 capture depending on the capture rate and inlet concentration of CO2 at 50 °C. [19].

Figure 3.
(a) Oxyfuel combustion in the Circulating Fluidised Bed (CFB) reactor with CO2 recirculation coupled with Rankine cycle (secondary cycle); (b) gas turbine cycle with CO2 recirculation (direct cycle). In both plants, the storage receives near pure excess of CO2 [24].
Figure 3.
(a) Oxyfuel combustion in the Circulating Fluidised Bed (CFB) reactor with CO2 recirculation coupled with Rankine cycle (secondary cycle); (b) gas turbine cycle with CO2 recirculation (direct cycle). In both plants, the storage receives near pure excess of CO2 [24].

Figure 4.
IGCC block flow diagram with CO2 capture.

Figure 5.
Block flow diagram of power plant with post-combustion CO2 capture technology.

Figure 6.
Scheme of post-combustion CO2 capture with a chemical absorption process using aqueous monoethanolamine (MEA) solution.
Figure 6.
Scheme of post-combustion CO2 capture with a chemical absorption process using aqueous monoethanolamine (MEA) solution.

Figure 7.
Gas mixture separation with membrane films. Only part of the gas mixture permeates through the membrane, passing from the high pressure to the low-pressure side.
Figure 7.
Gas mixture separation with membrane films. Only part of the gas mixture permeates through the membrane, passing from the high pressure to the low-pressure side.

Figure 8.
Simplified diagram of the Membrane and Technology Research Institute (MTR) selective recycle CO2 capture process at a coal-fired power plant using PolarisTM membrane in separation modules [22].
Figure 8.
Simplified diagram of the Membrane and Technology Research Institute (MTR) selective recycle CO2 capture process at a coal-fired power plant using PolarisTM membrane in separation modules [22].

Figure 9.
(a) CO2 phase diagram; (b) difference in density of pure CO2 and CO2 rich mixture [95% CO2/3% N2/2% O2] at 100 bar. International Energy Agency (IEA) [Woodhill] (2002) Pipeline transmission of CO2 and energy transmission study-report. All rights reserved [39].
Figure 9.
(a) CO2 phase diagram; (b) difference in density of pure CO2 and CO2 rich mixture [95% CO2/3% N2/2% O2] at 100 bar. International Energy Agency (IEA) [Woodhill] (2002) Pipeline transmission of CO2 and energy transmission study-report. All rights reserved [39].

Figure 10.
CO2 transport cost computed with 2013 in dollars. (a) To obtain this graph, three different methods are used to calculate the inner diameter while the same method (Rui et al.) is used for the economic analysis. (b) In this graph, we used the same method (McCoy and Rubin) to compute the inner diameter, while various ways are used to carry out the economic analysis.

Figure 11.
Phase diagram (equilibrium temperature as a function of pressure) for pure CO2 and pure CH4 gas hydrates [50]. Reprinted from Applied Energy, Vol 280/edition number 115,843, Quang-DuLe et al. Influence of the initial CH4-hydrate system properties on CO2 capture kinetics, Copyright (2020), with permission from Elsevier.

Figure 12.
Hydrate phase equilibrium of a mixture of carbon dioxide and methane from Equation (8).

Figure 13.
Equilibrium condition for methane and carbon dioxide hydrate in porous media and in bulk phase reprinted from [54] with permission from Elsevier.
Figure 13.
Equilibrium condition for methane and carbon dioxide hydrate in porous media and in bulk phase reprinted from [54] with permission from Elsevier.

Figure 14.
CO2 storage cost at different numbers of wells when a combined method that includes CO2 replacement and depressurisation of the NGH reservoir is applied to produce methane.
Figure 14.
CO2 storage cost at different numbers of wells when a combined method that includes CO2 replacement and depressurisation of the NGH reservoir is applied to produce methane.

Figure 15.
Membrane process for natural gas sweetening produced via depressurisation and CO2 replacement.
Figure 15.
Membrane process for natural gas sweetening produced via depressurisation and CO2 replacement.

Figure 16.
Cost of CCS at a different distance between source and storage. The continuous line represents the lower cost of CCS, while dashed lines are the higher value of CCS. The triangles indicate the CCS cost chain when methane is produced via depressurization and the CO2 replacement, while the circles indicate the CCS cost chain with conventional storage sites described in Table 8.

Figure 17.
Total cost of CCS chain for several pipeline length, subdivided into the three components: capture, transportation, and storage in NGH. For the transportation cost was used a mean value while for the storage cost in NGH reservoir was assumed two wells.
Figure 17.
Total cost of CCS chain for several pipeline length, subdivided into the three components: capture, transportation, and storage in NGH. For the transportation cost was used a mean value while for the storage cost in NGH reservoir was assumed two wells.

Figure 18.
Final CCS chain. The flue gas from industries and power plants is treated into the separation unit. The CO2 captured is transported via pipeline to the NGH reservoir. The injection of CO2 causes a syngas production. The syngas was purified through membrane technology, and the permeant gas-rich of CO2 will be injected another time in NGH reservoir. The fuel product rich of methane is in this way a neutral carbon fuel.


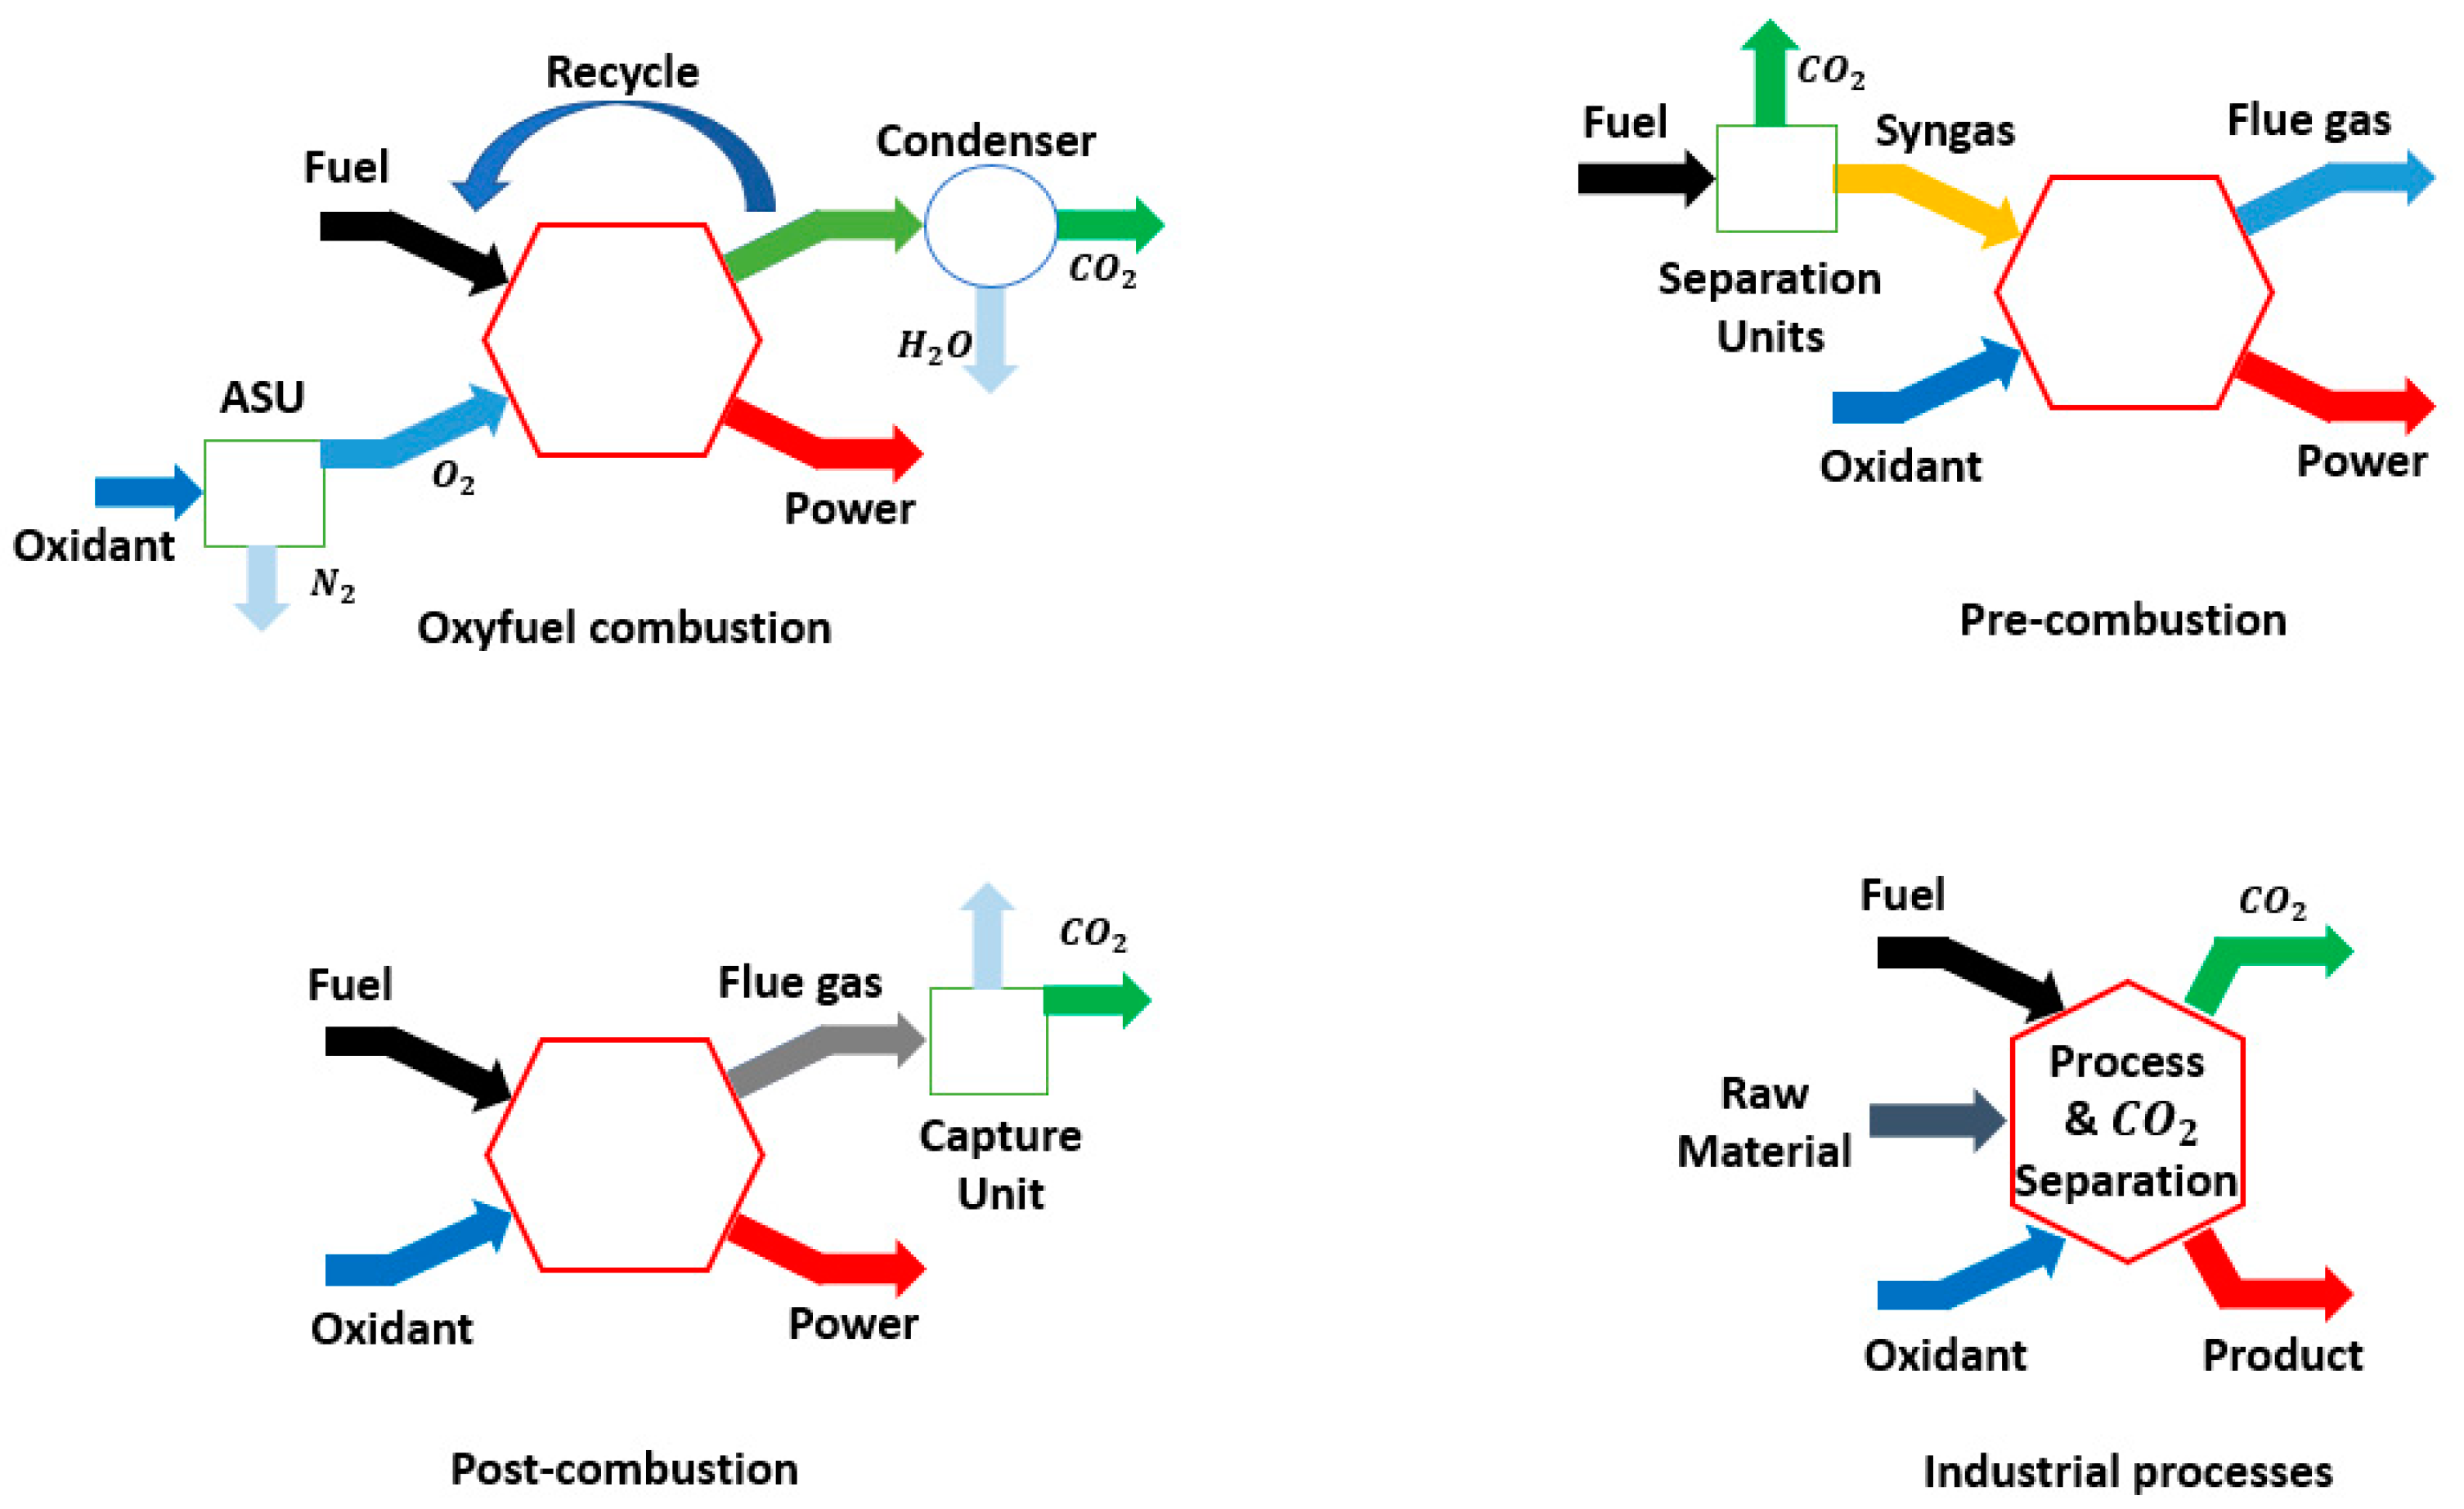
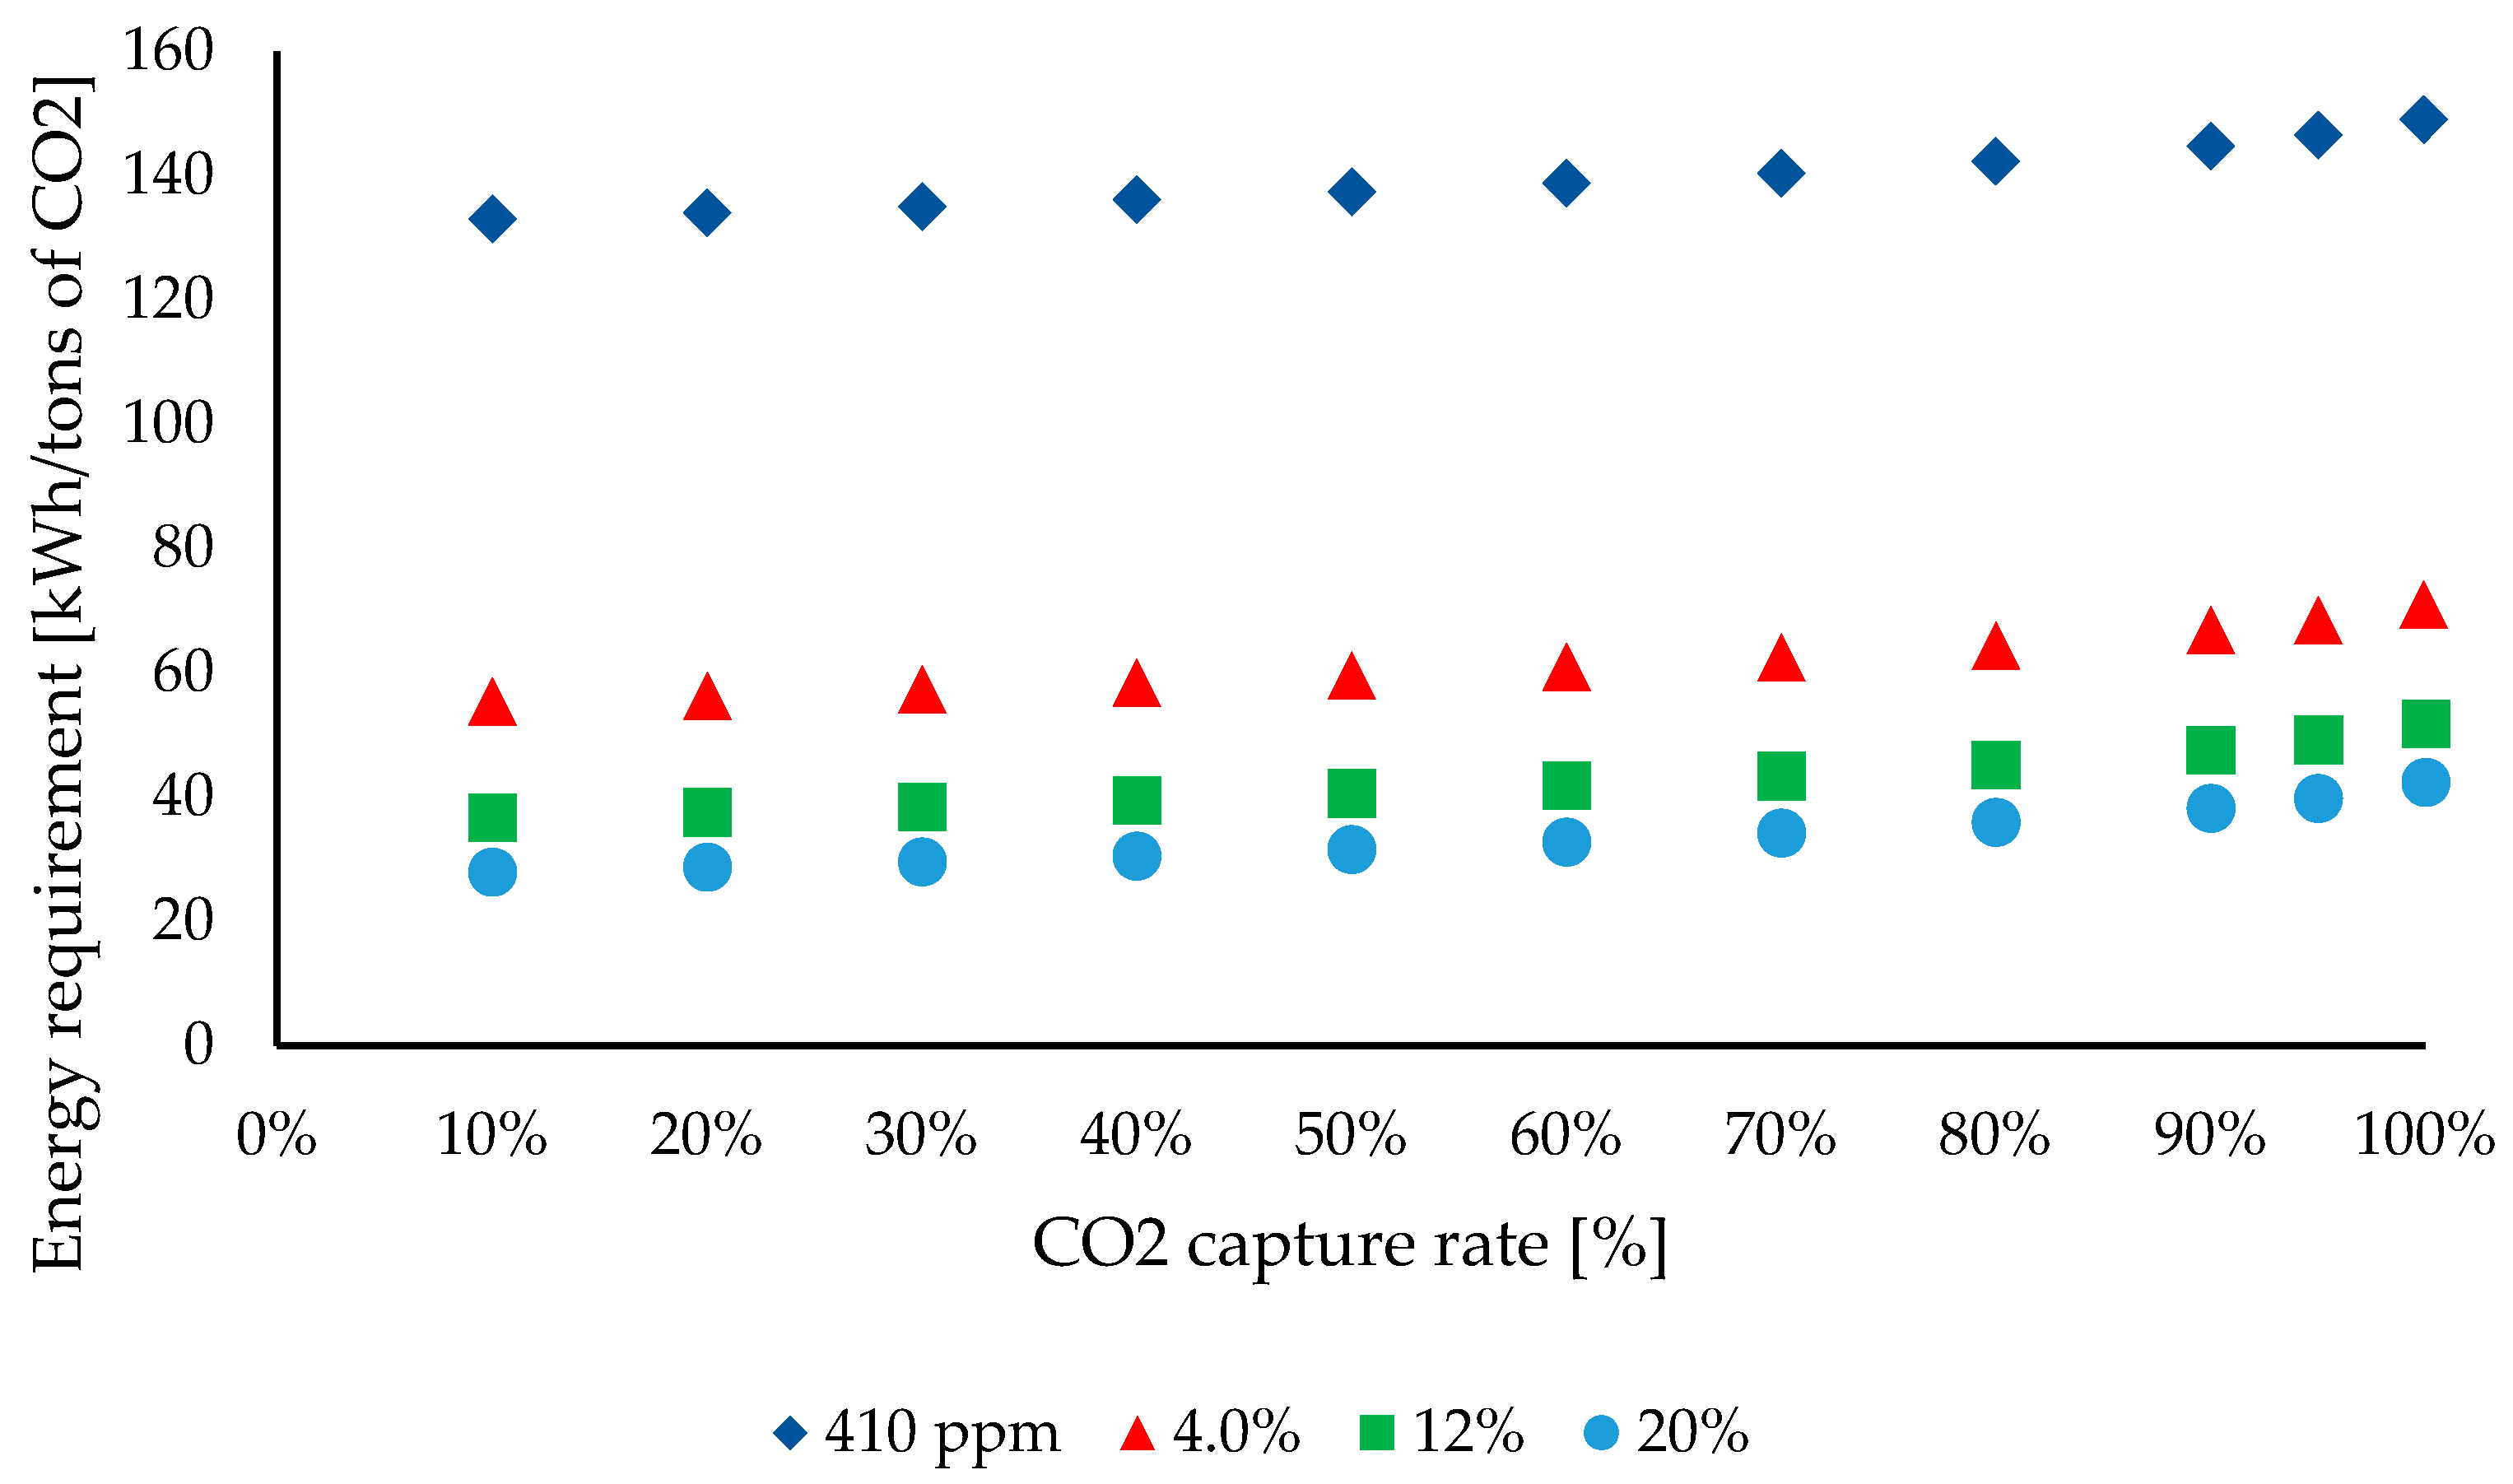
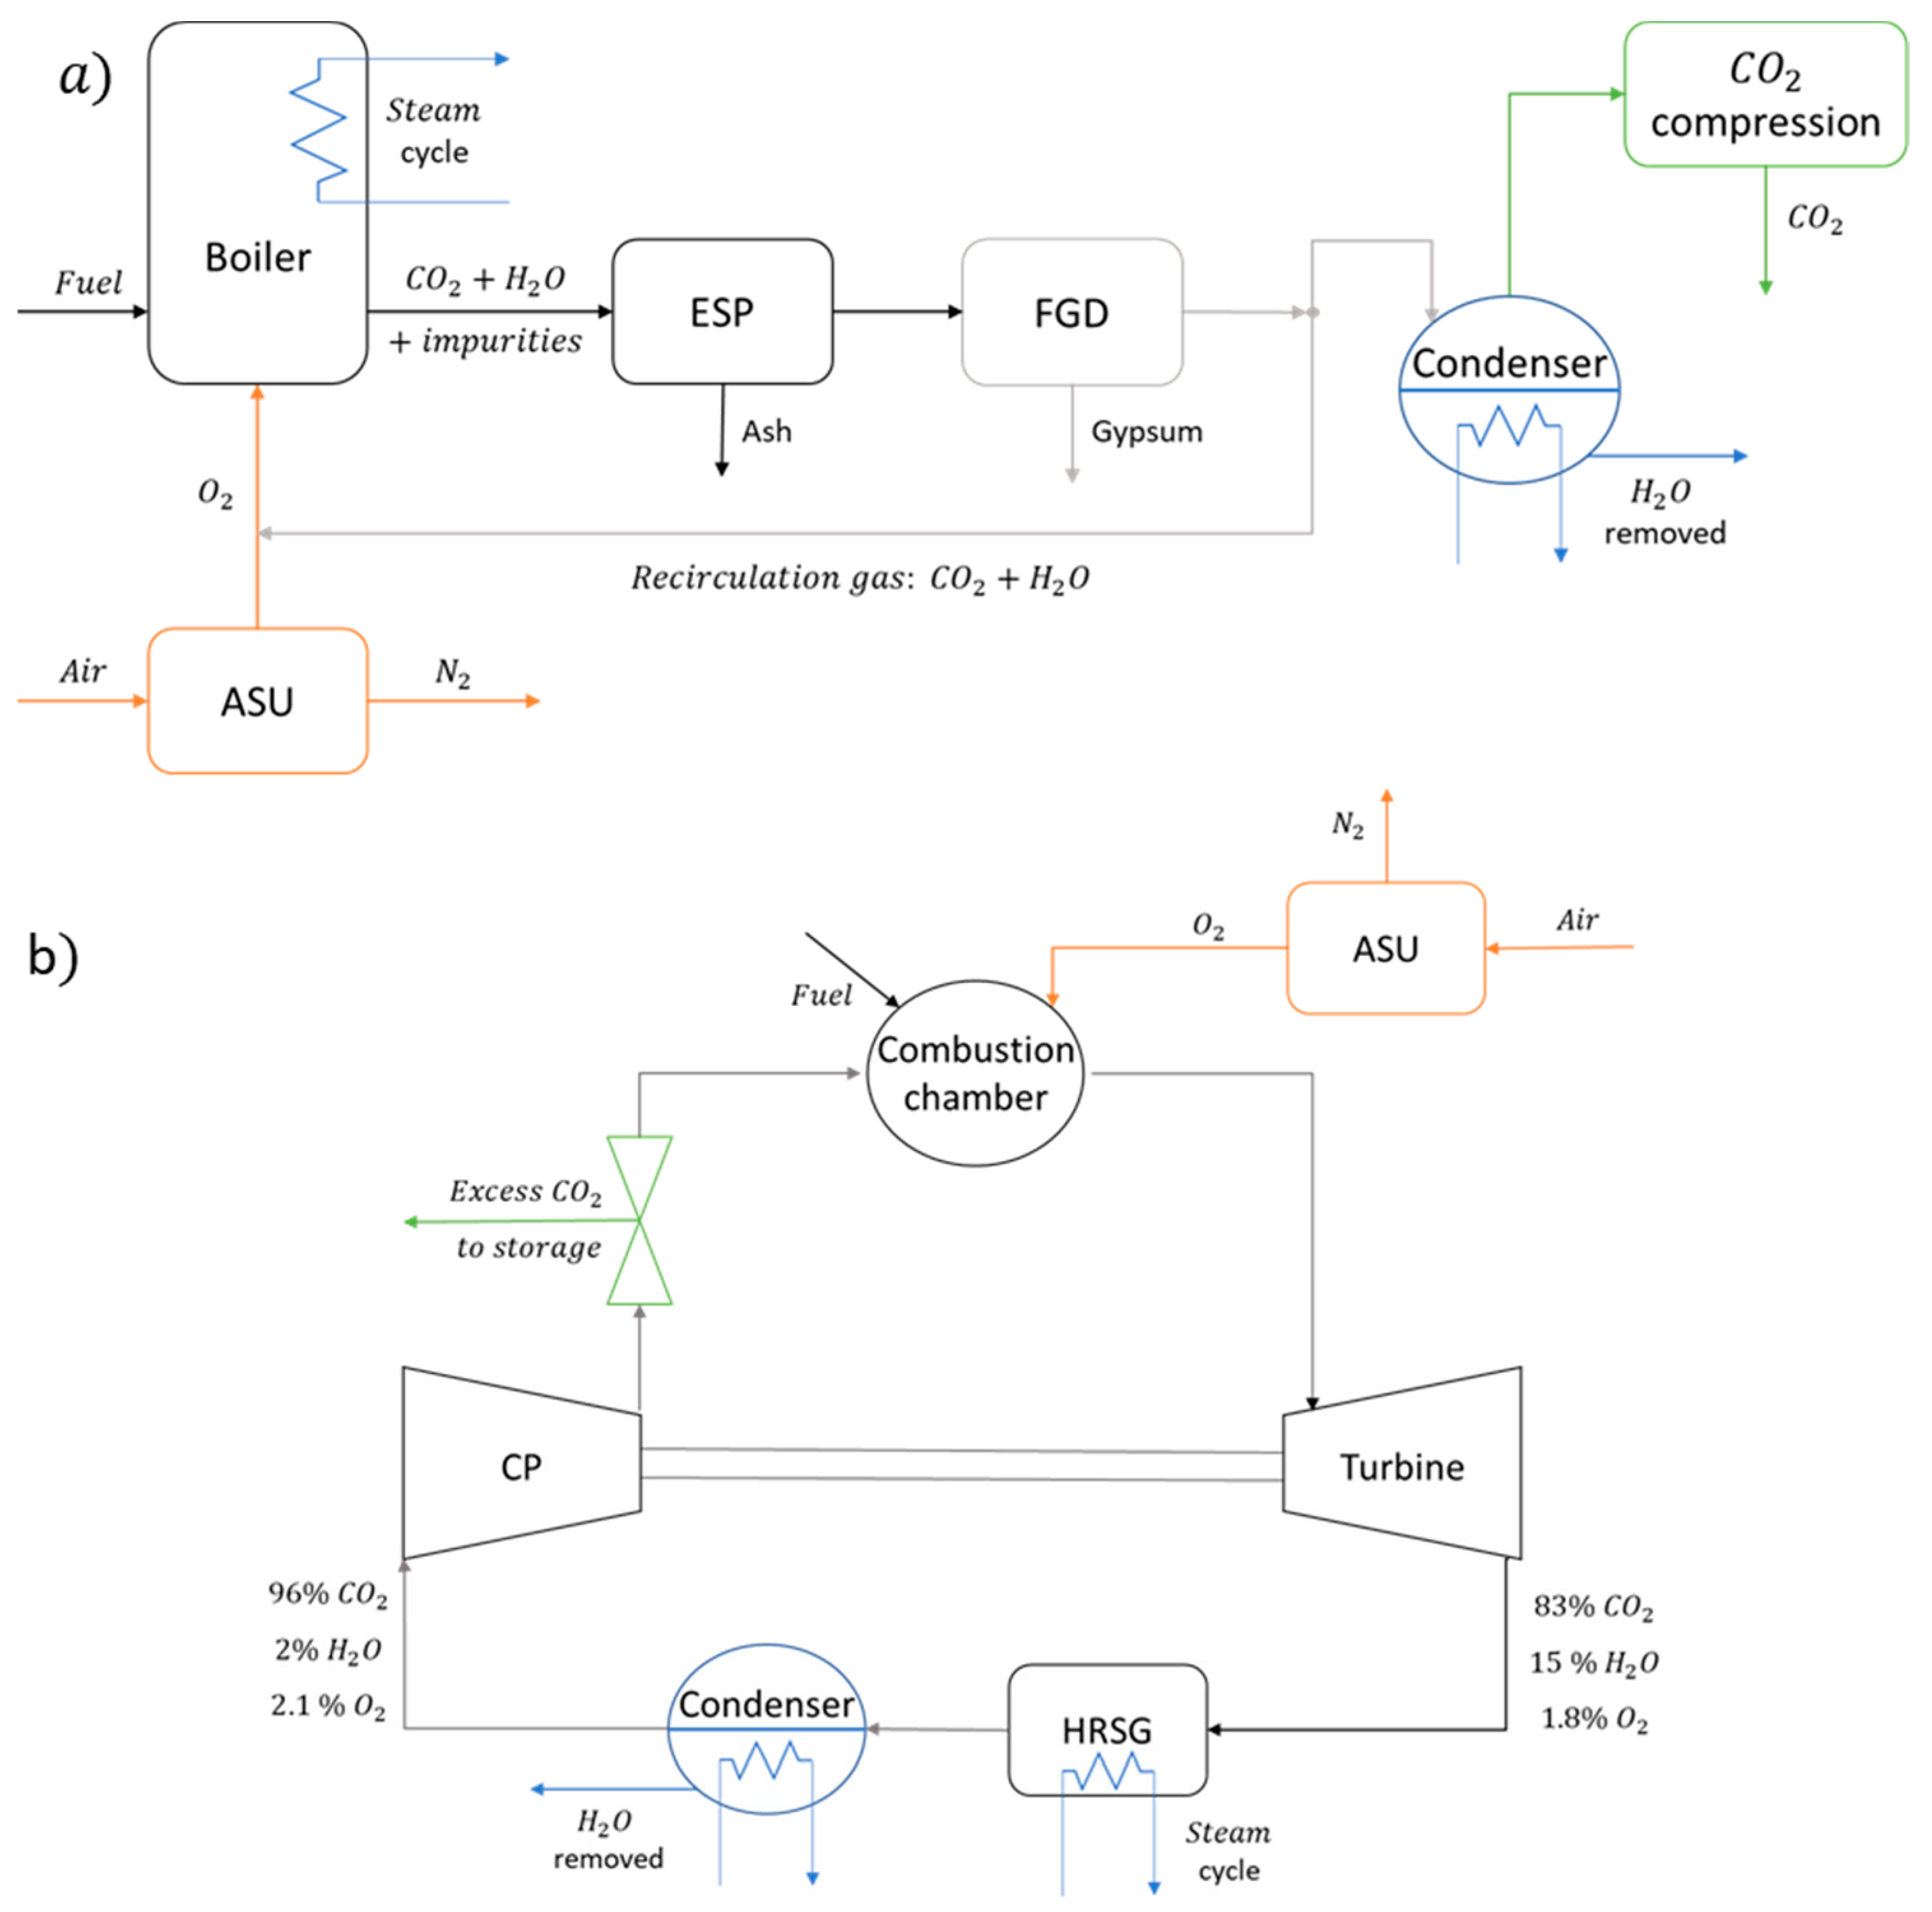
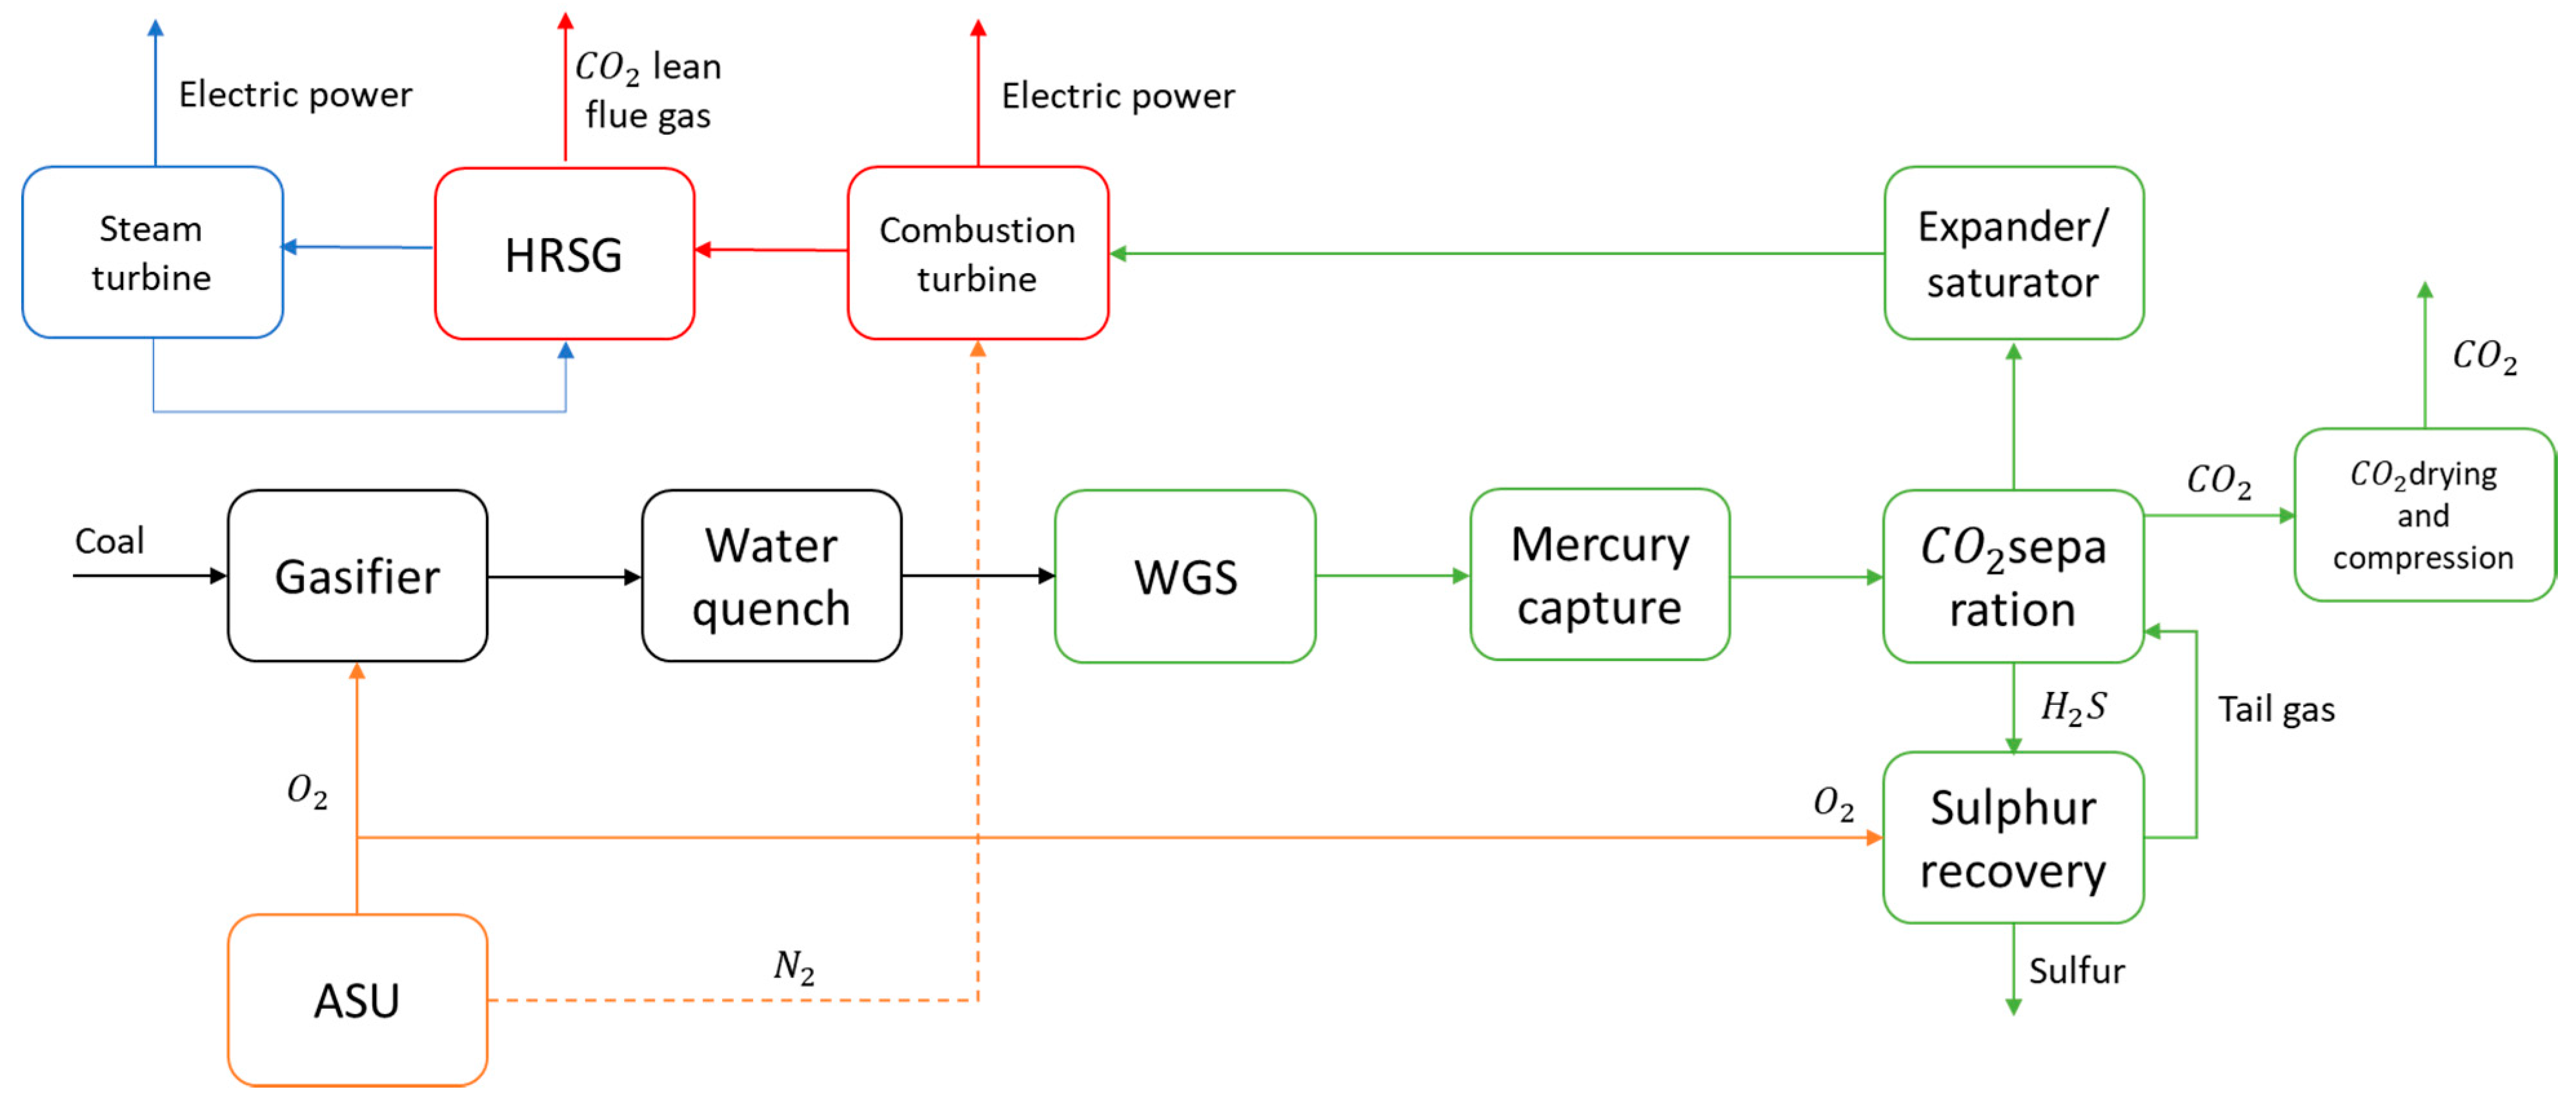
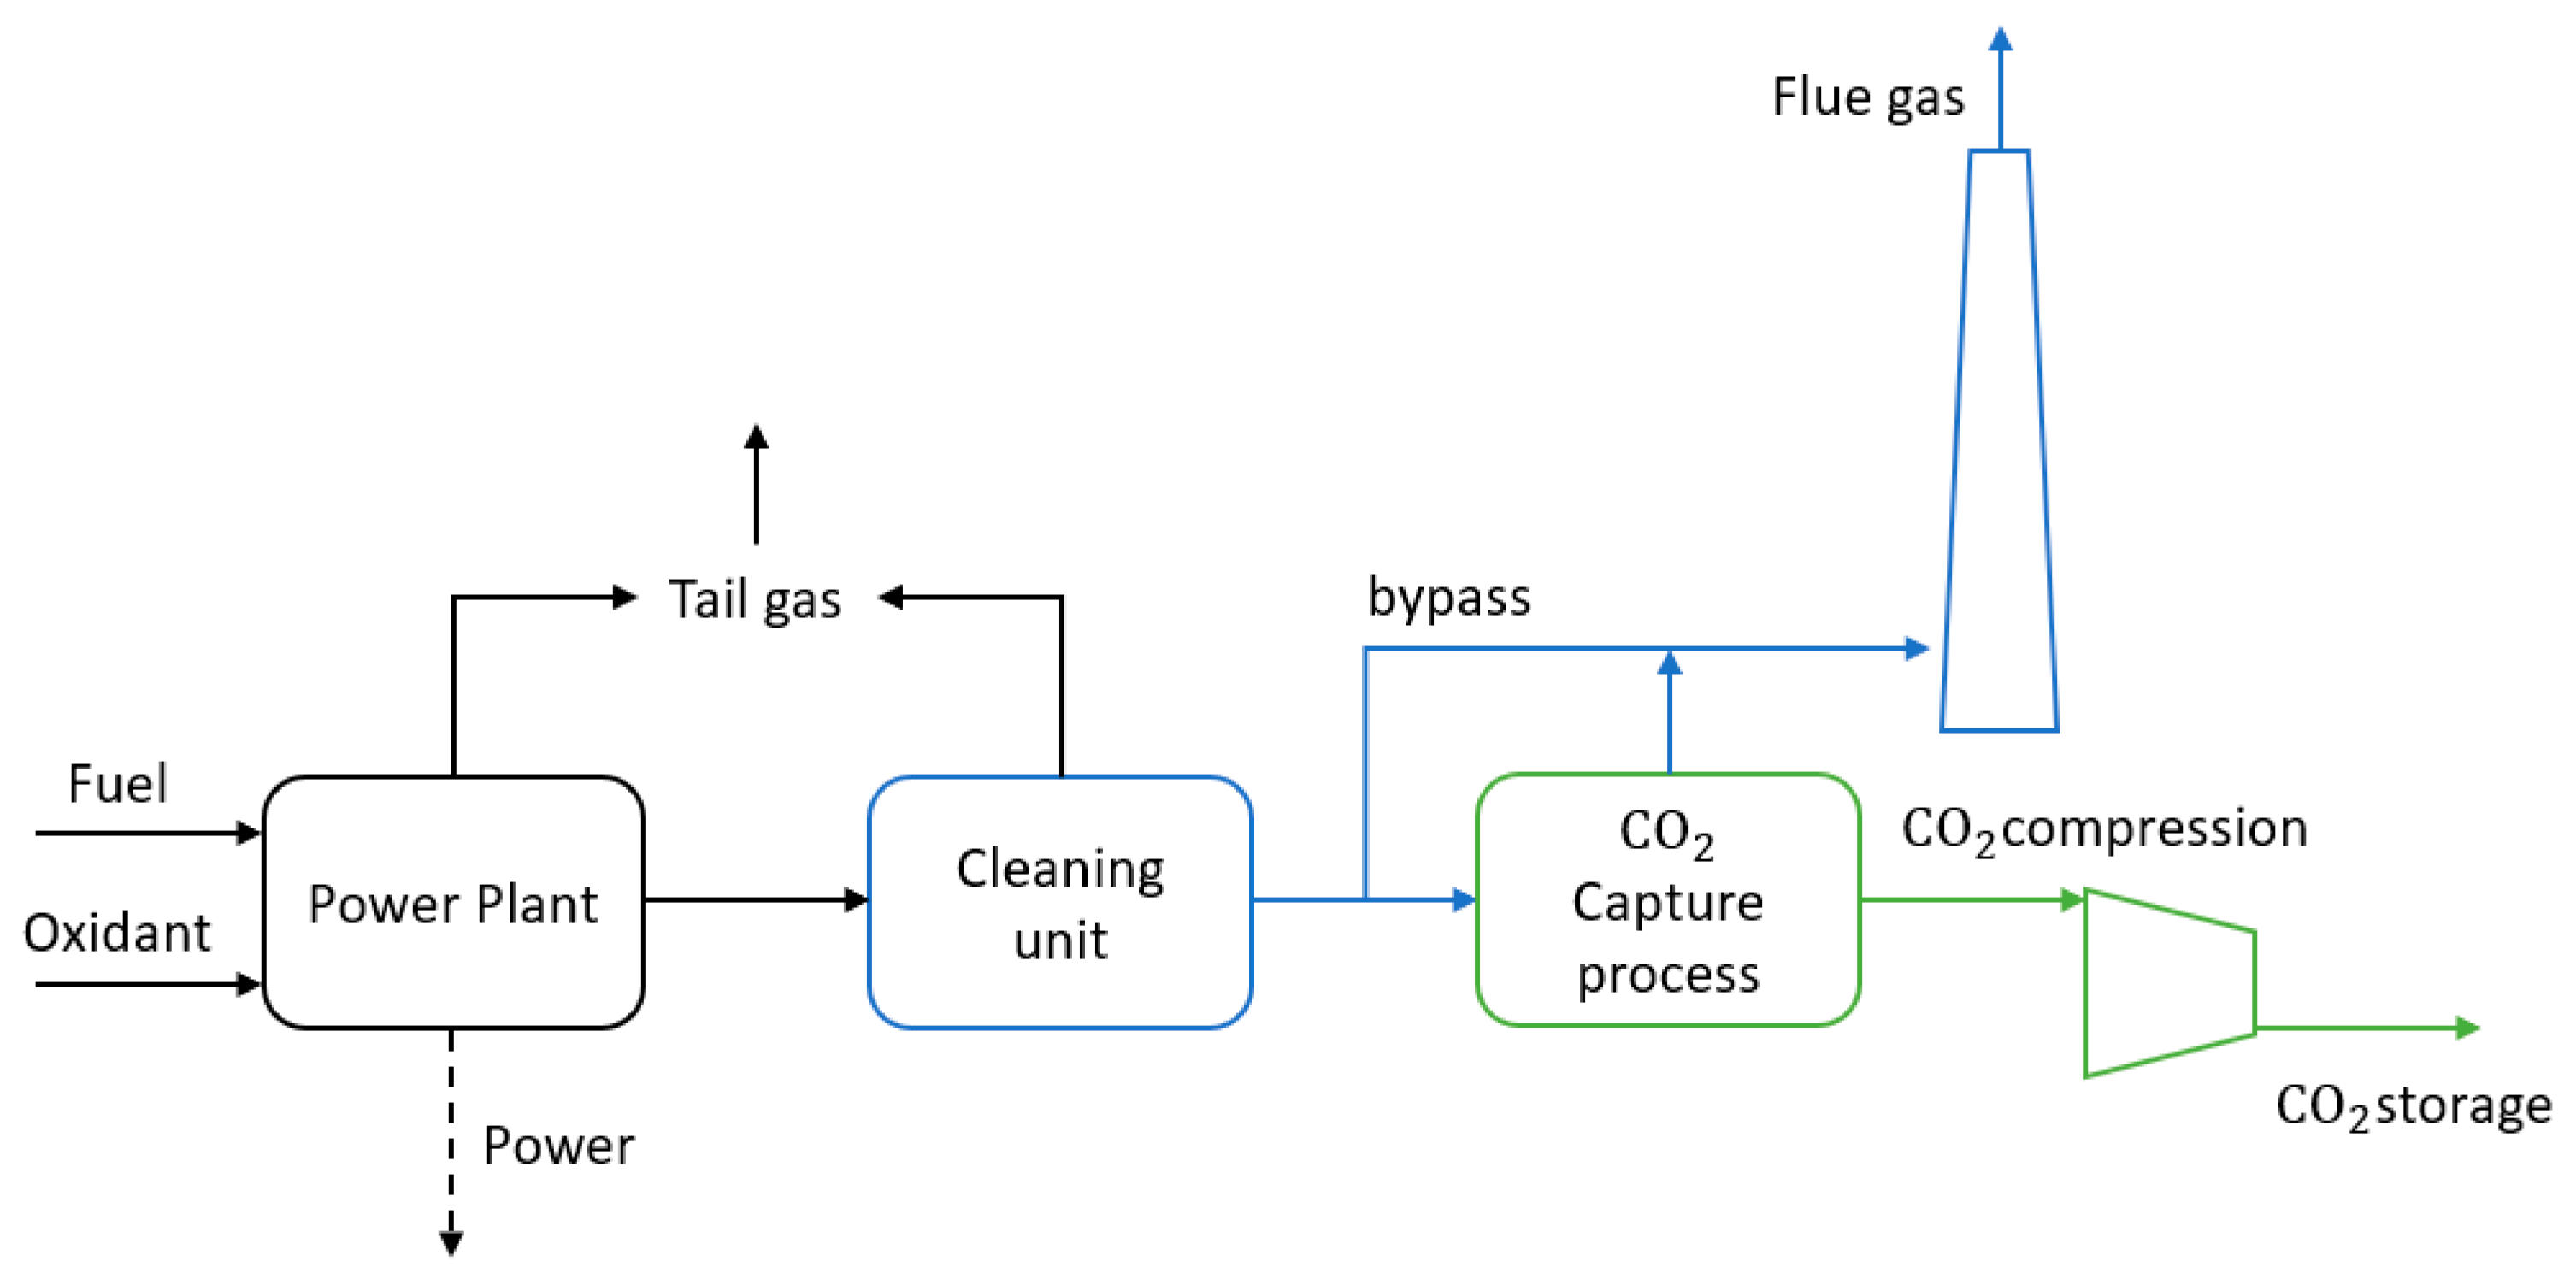
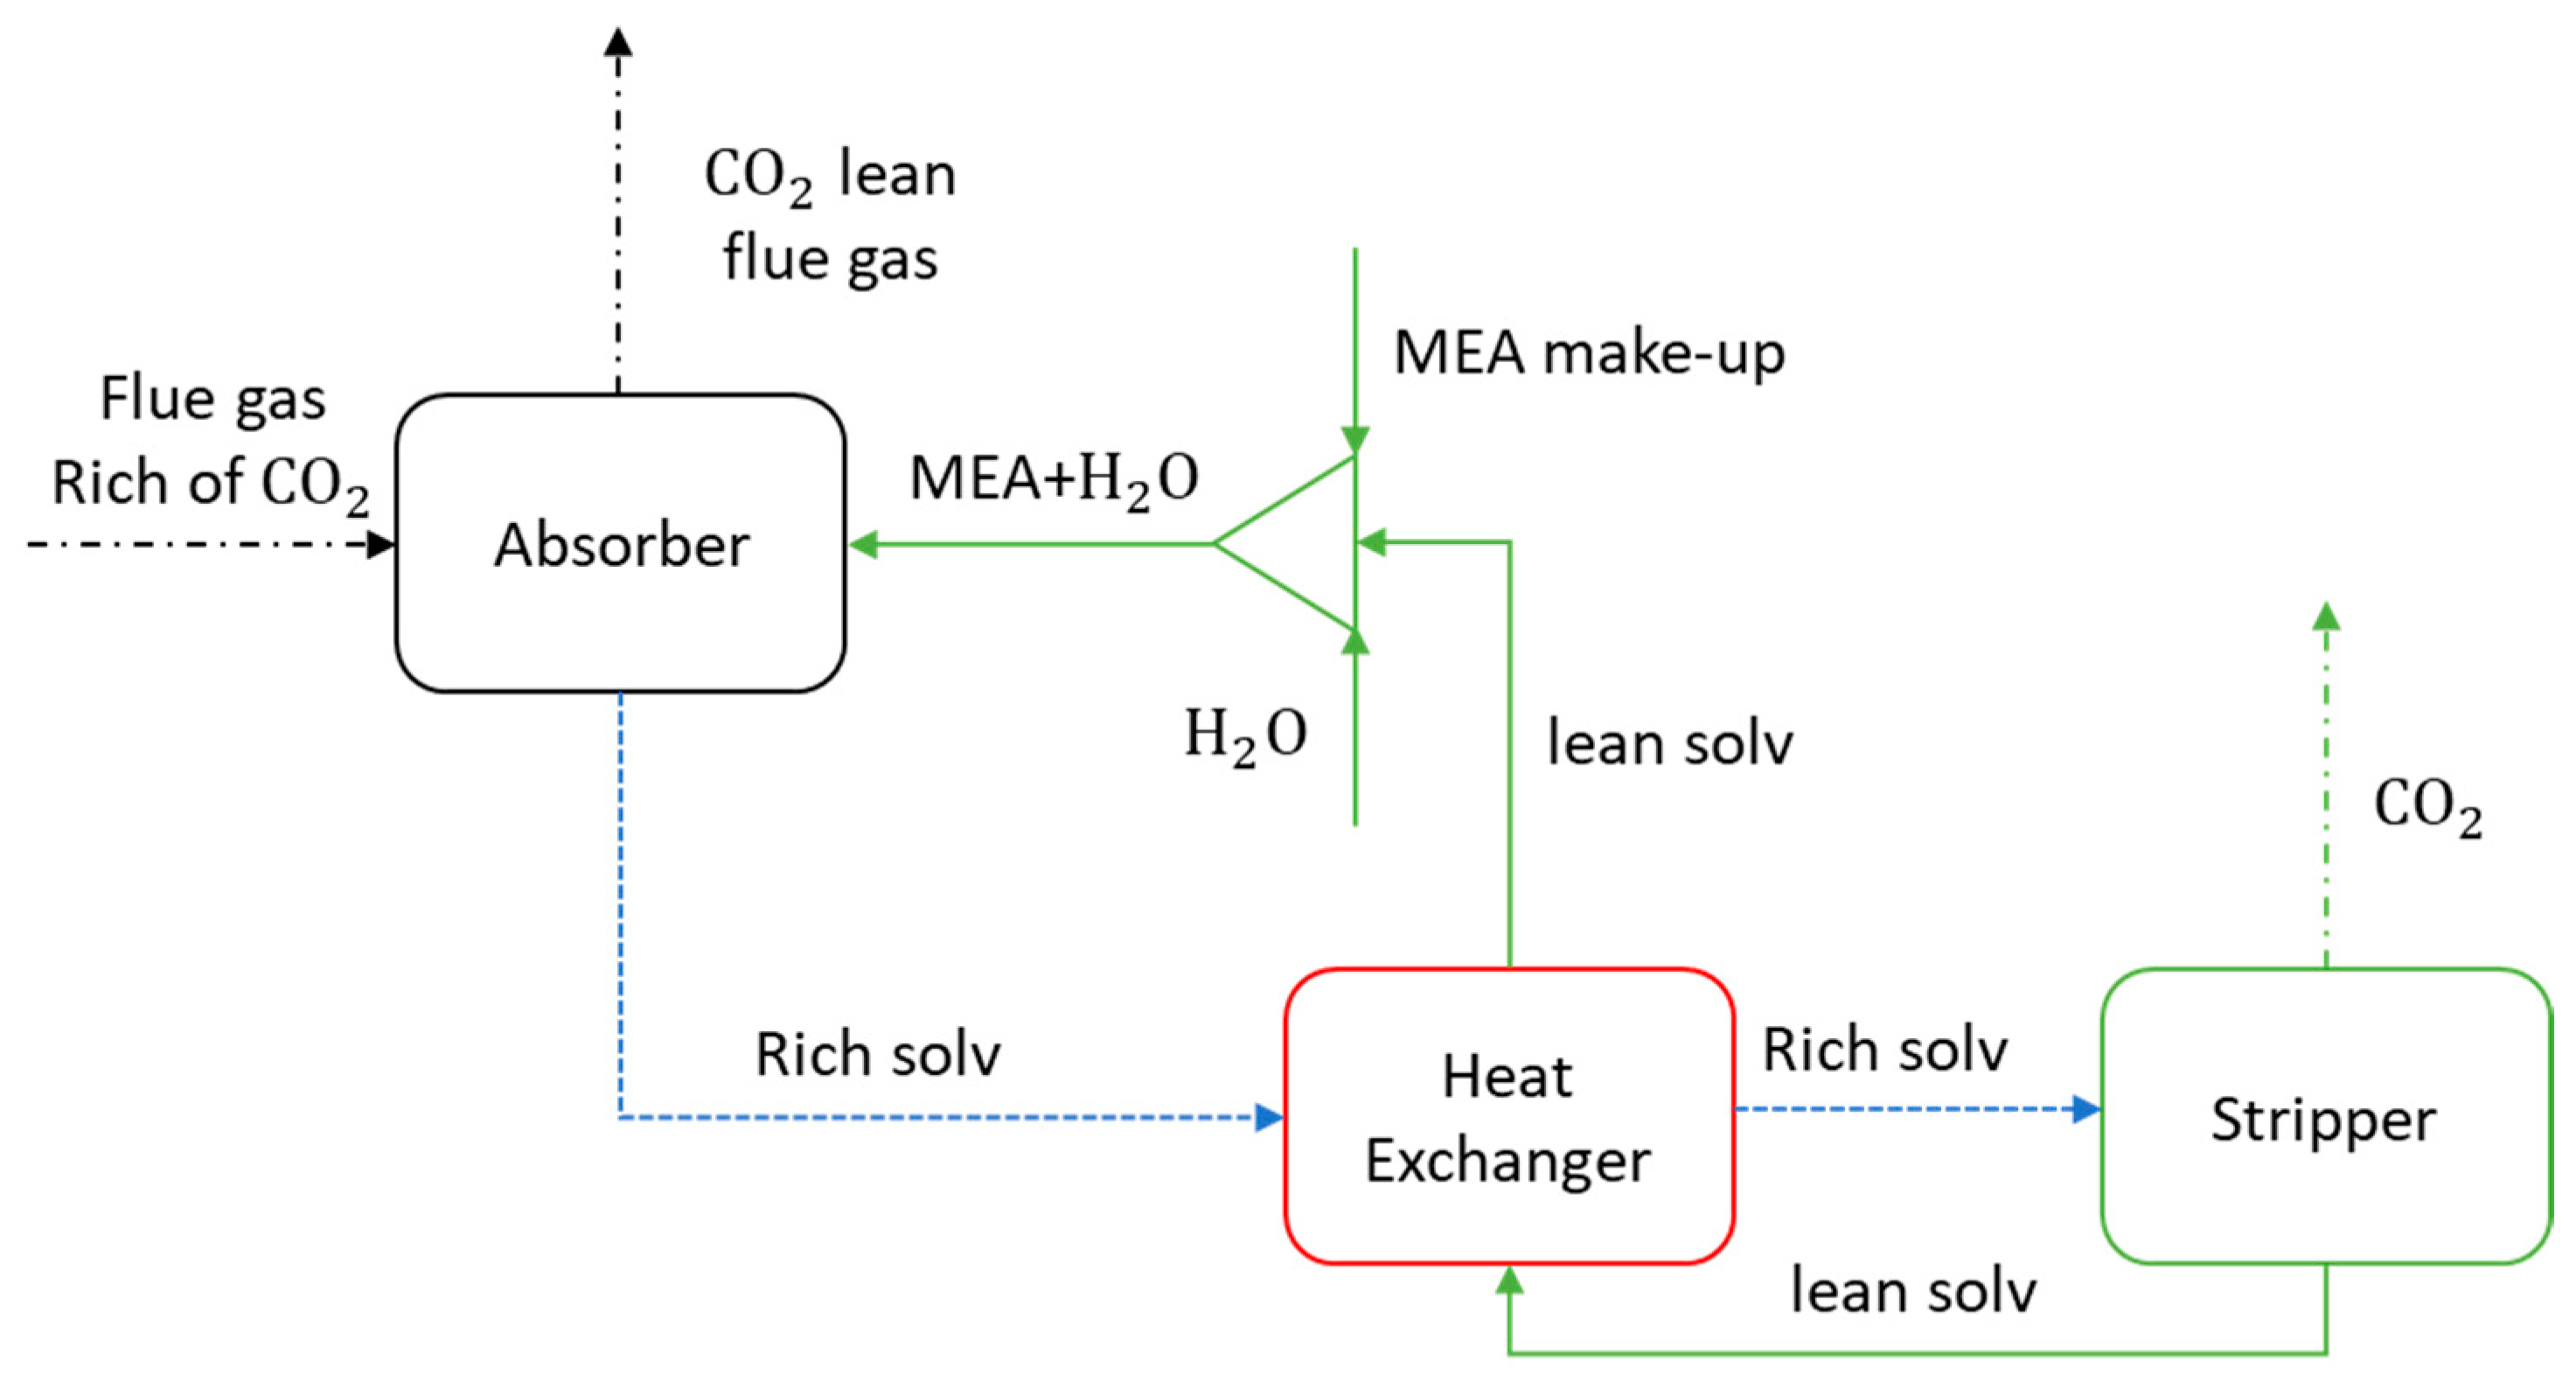
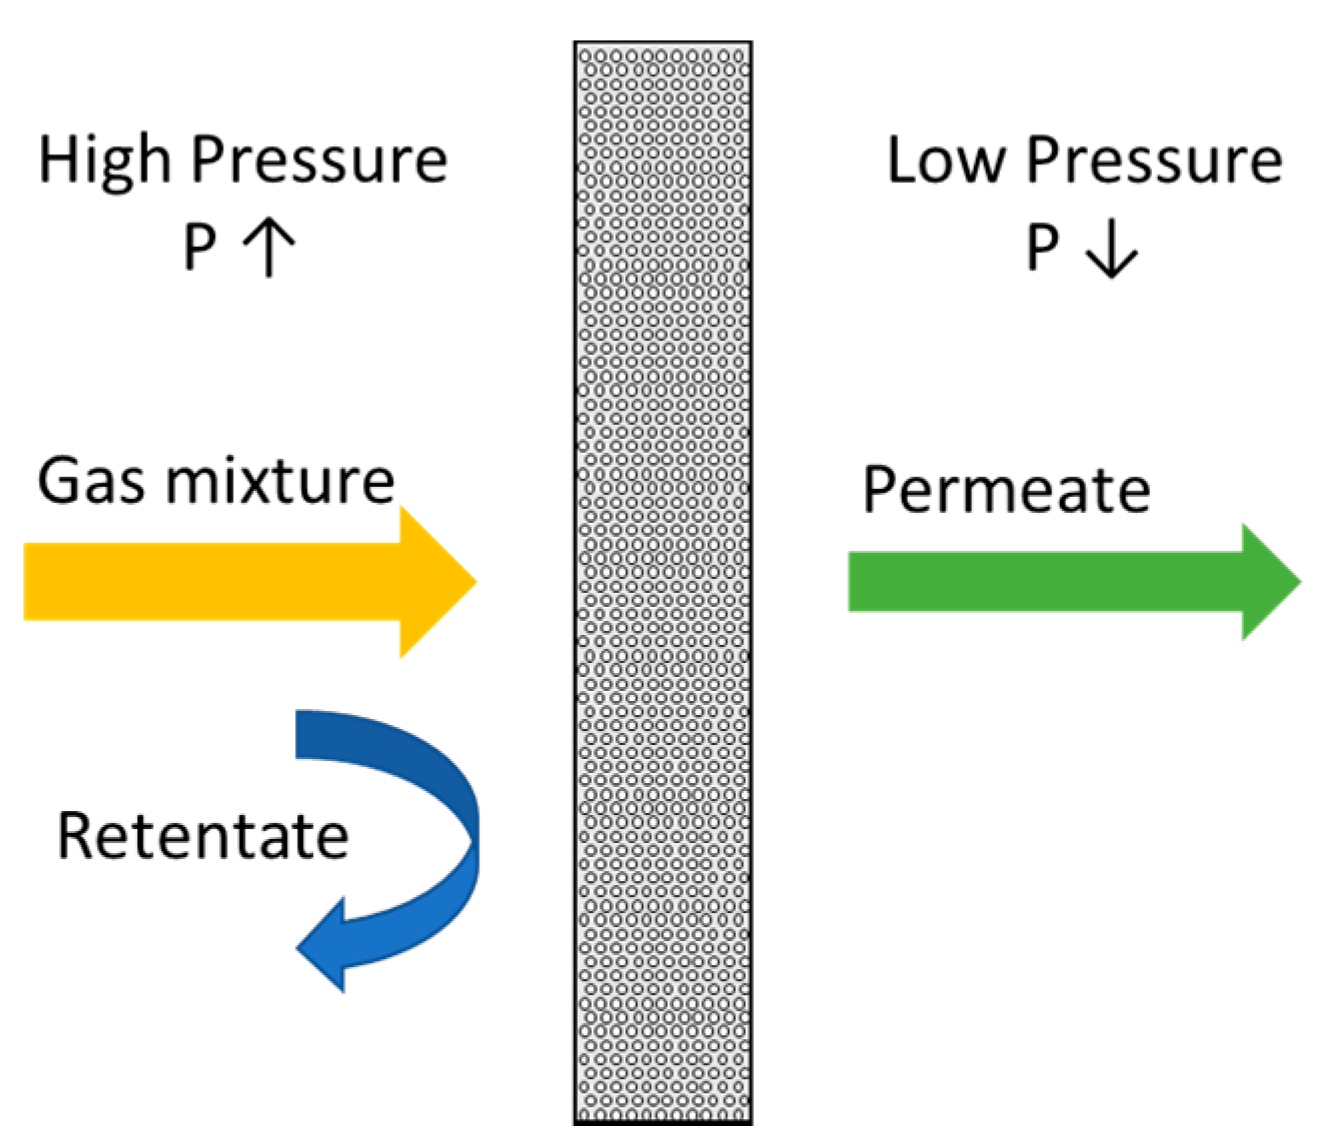
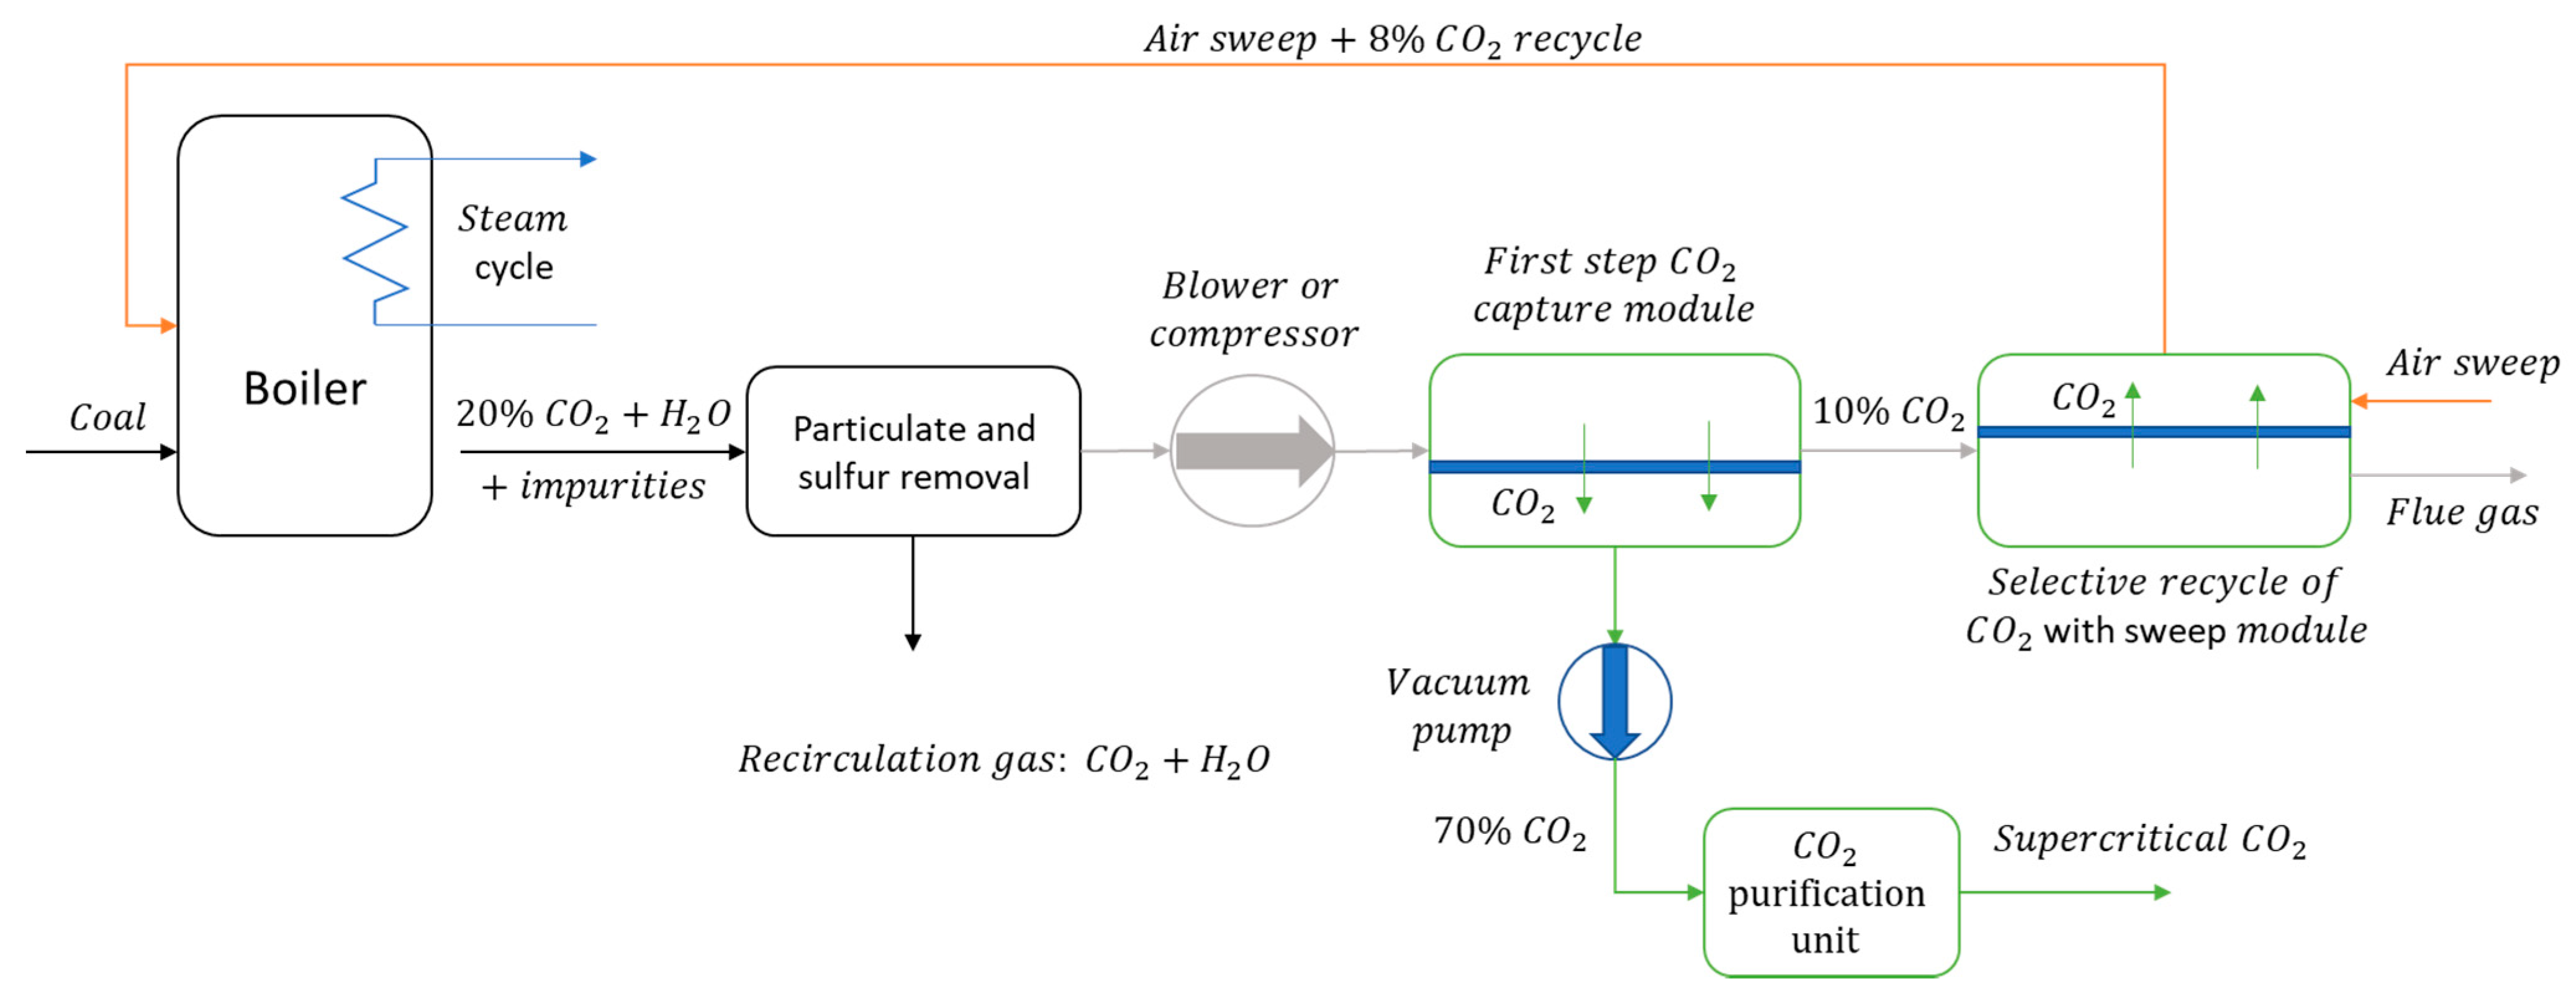
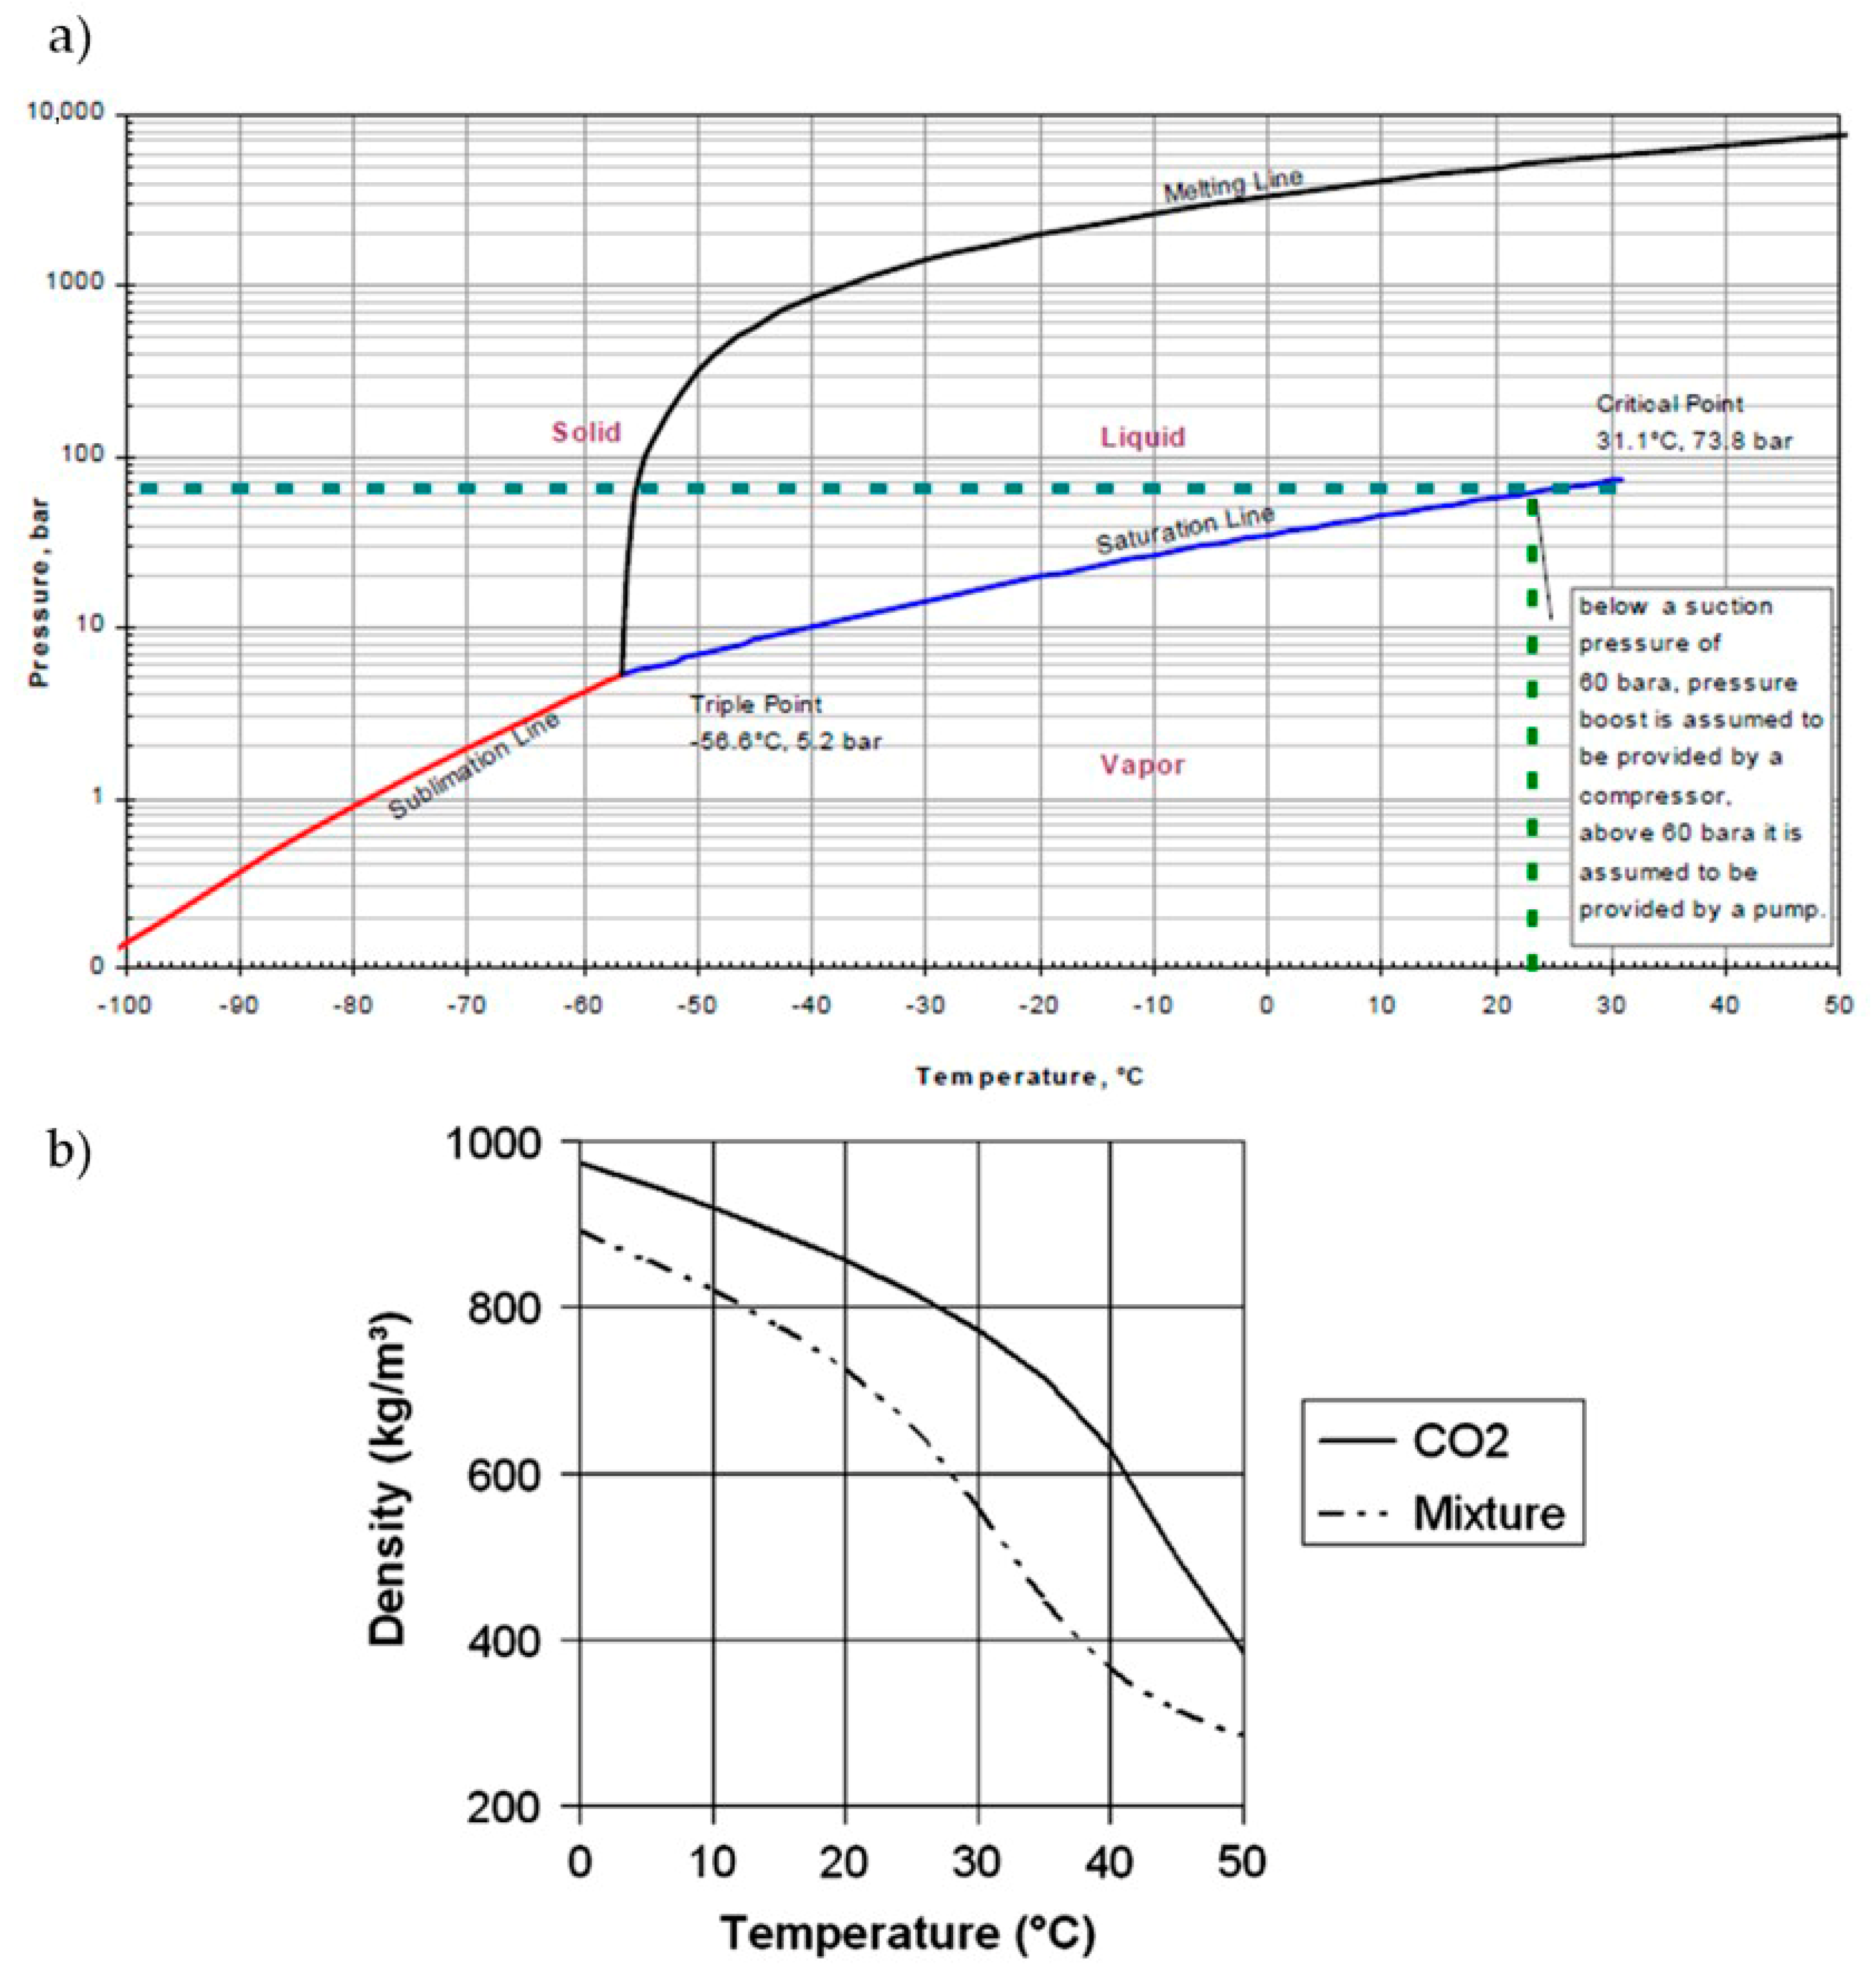
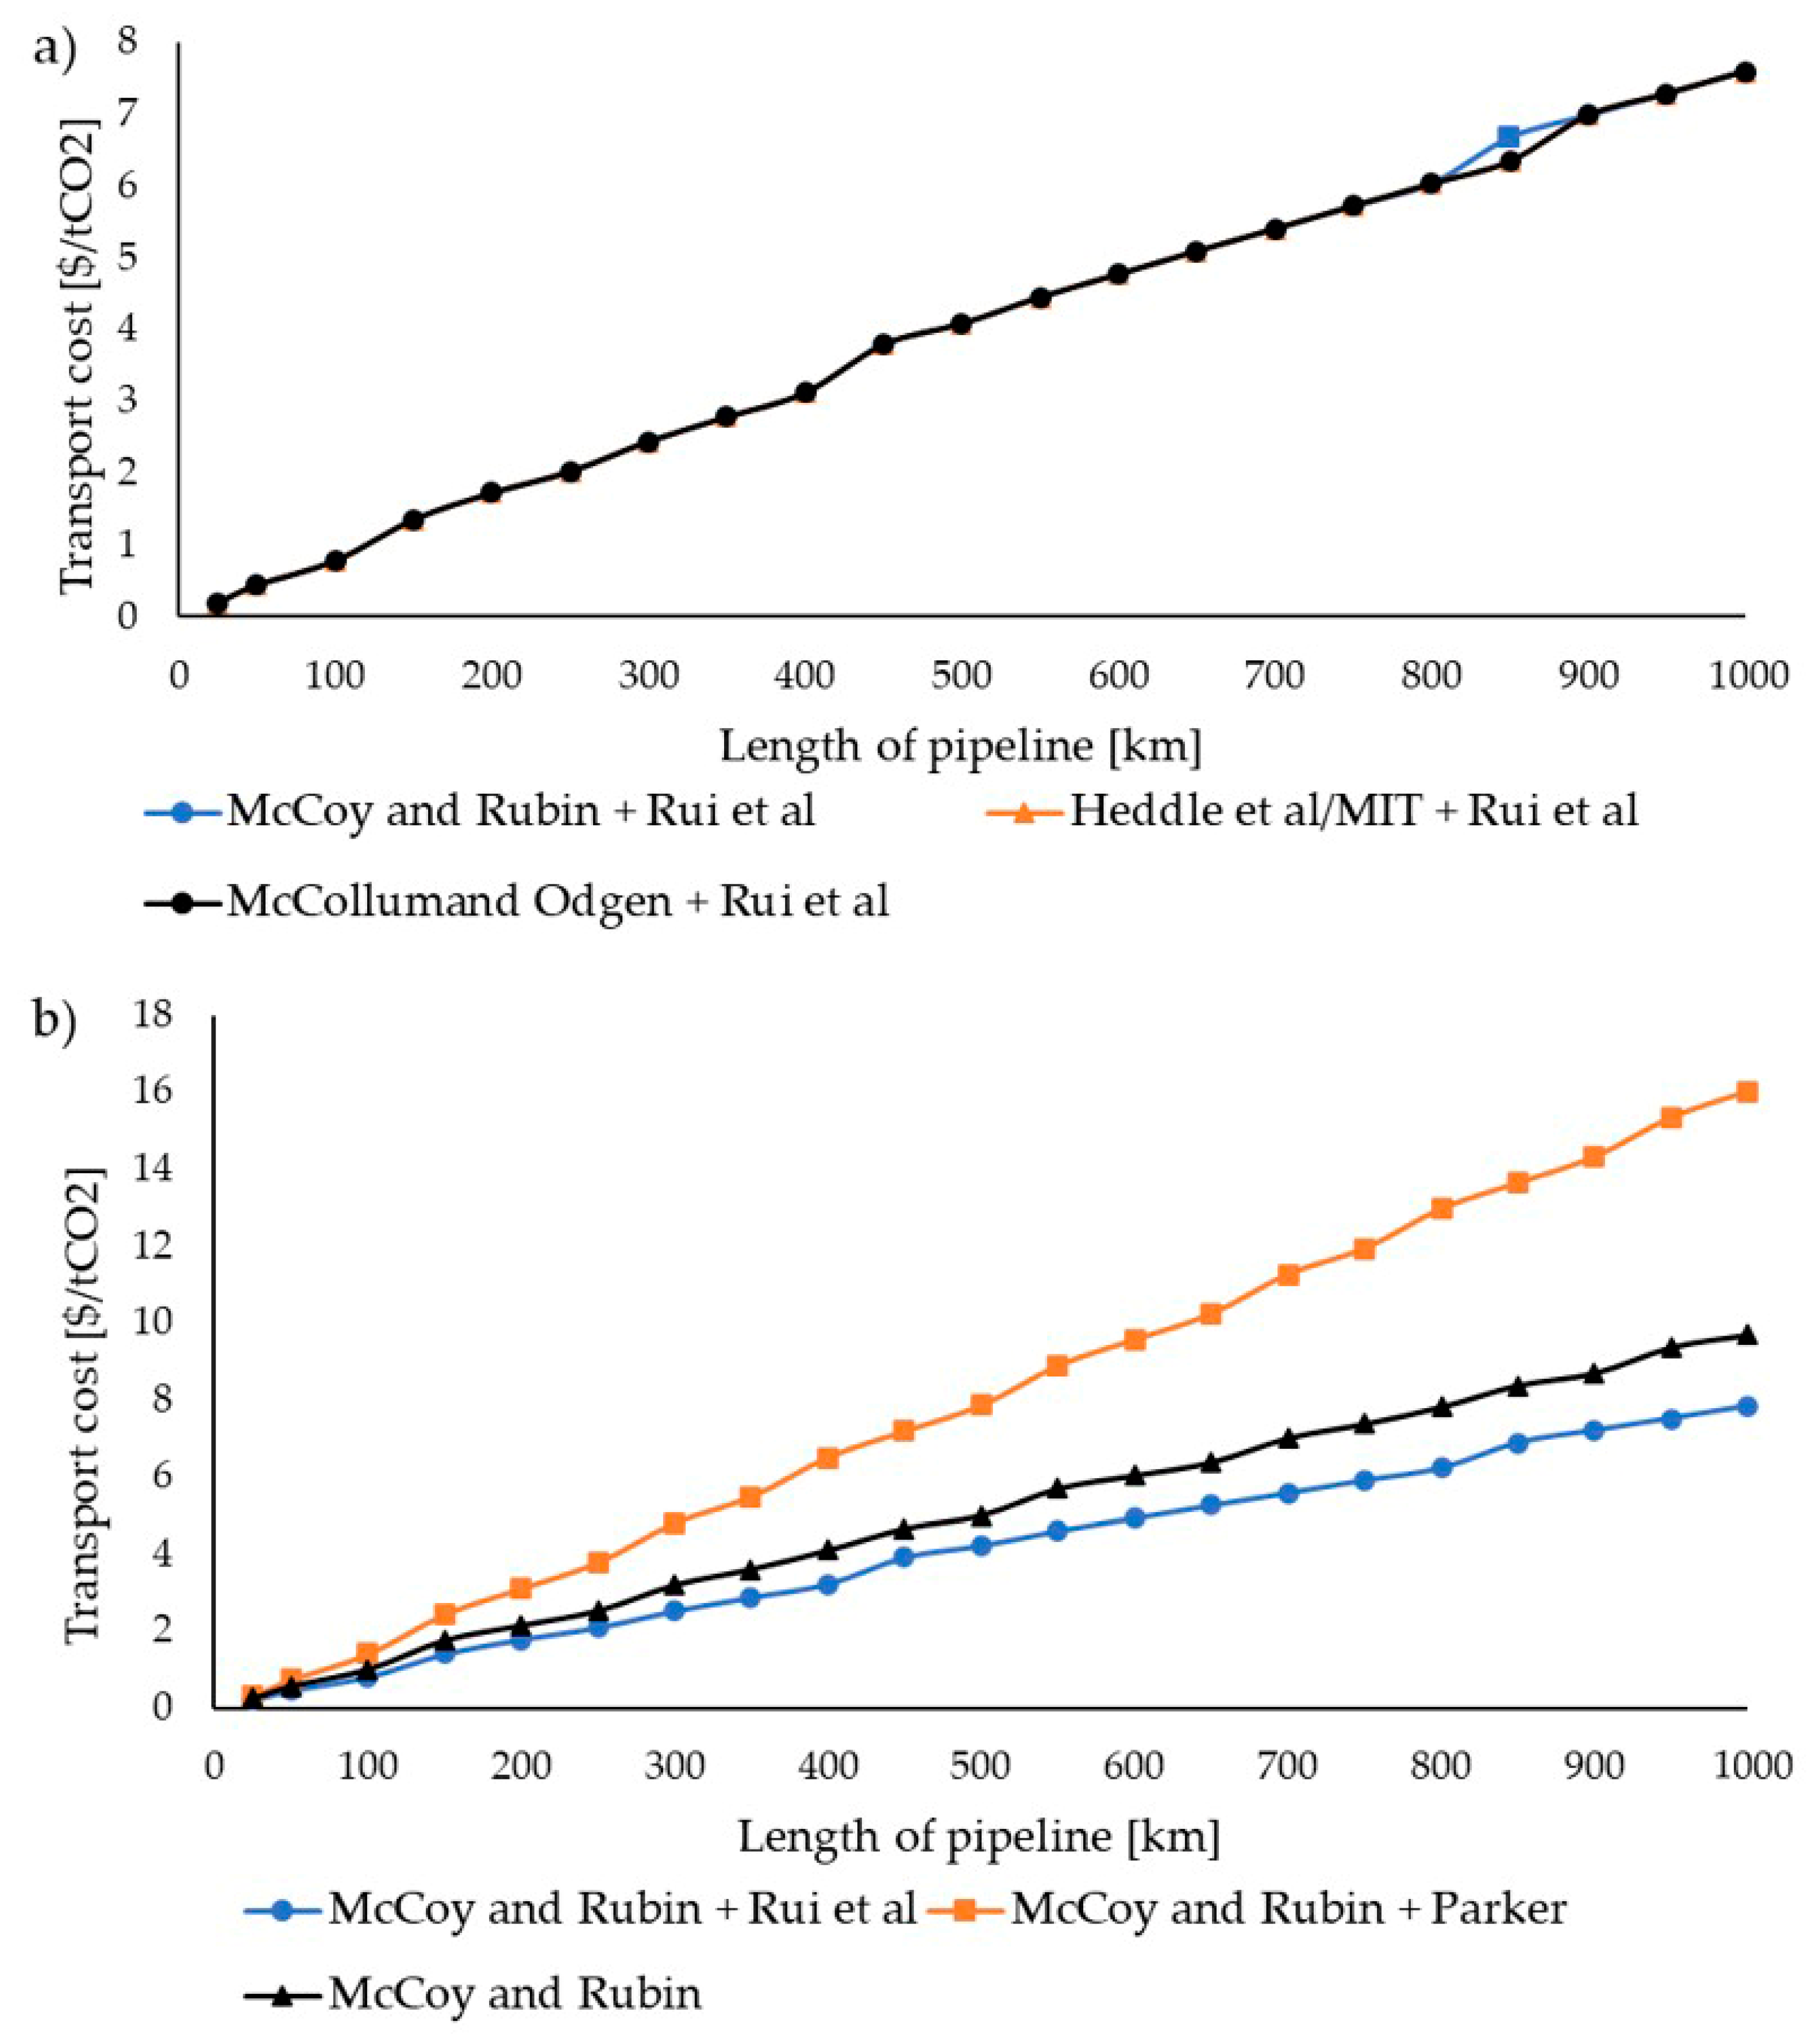
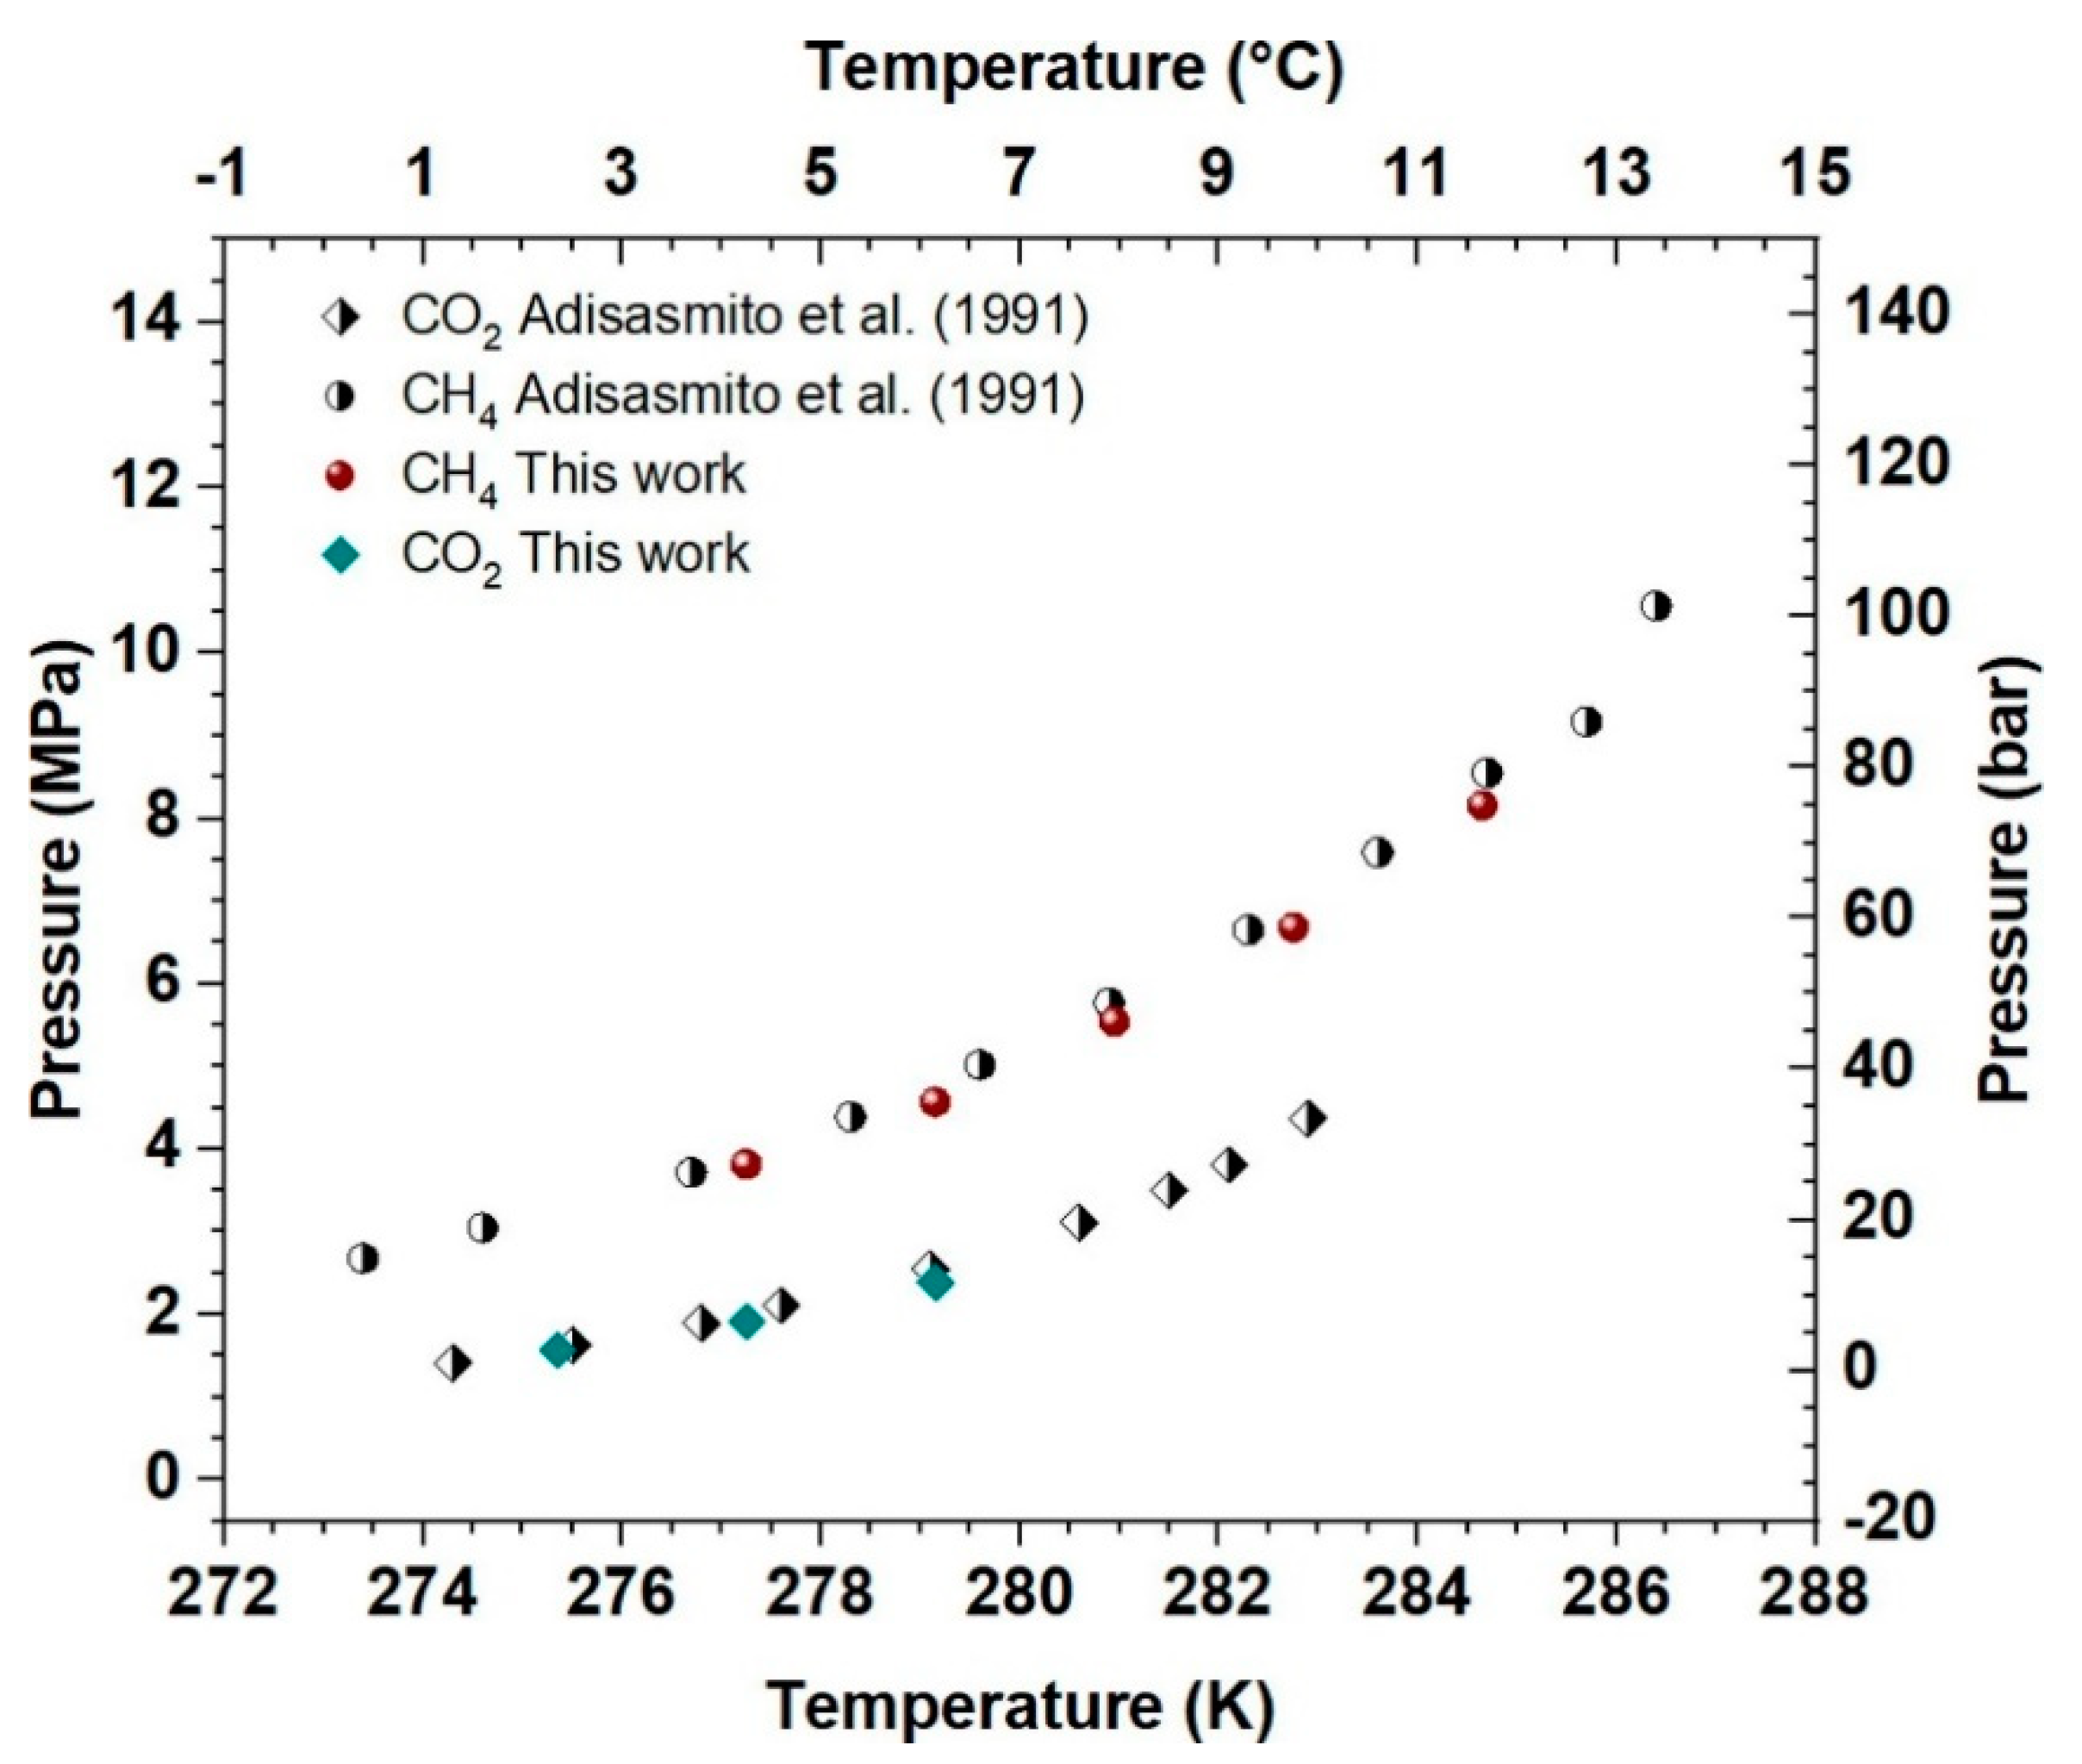
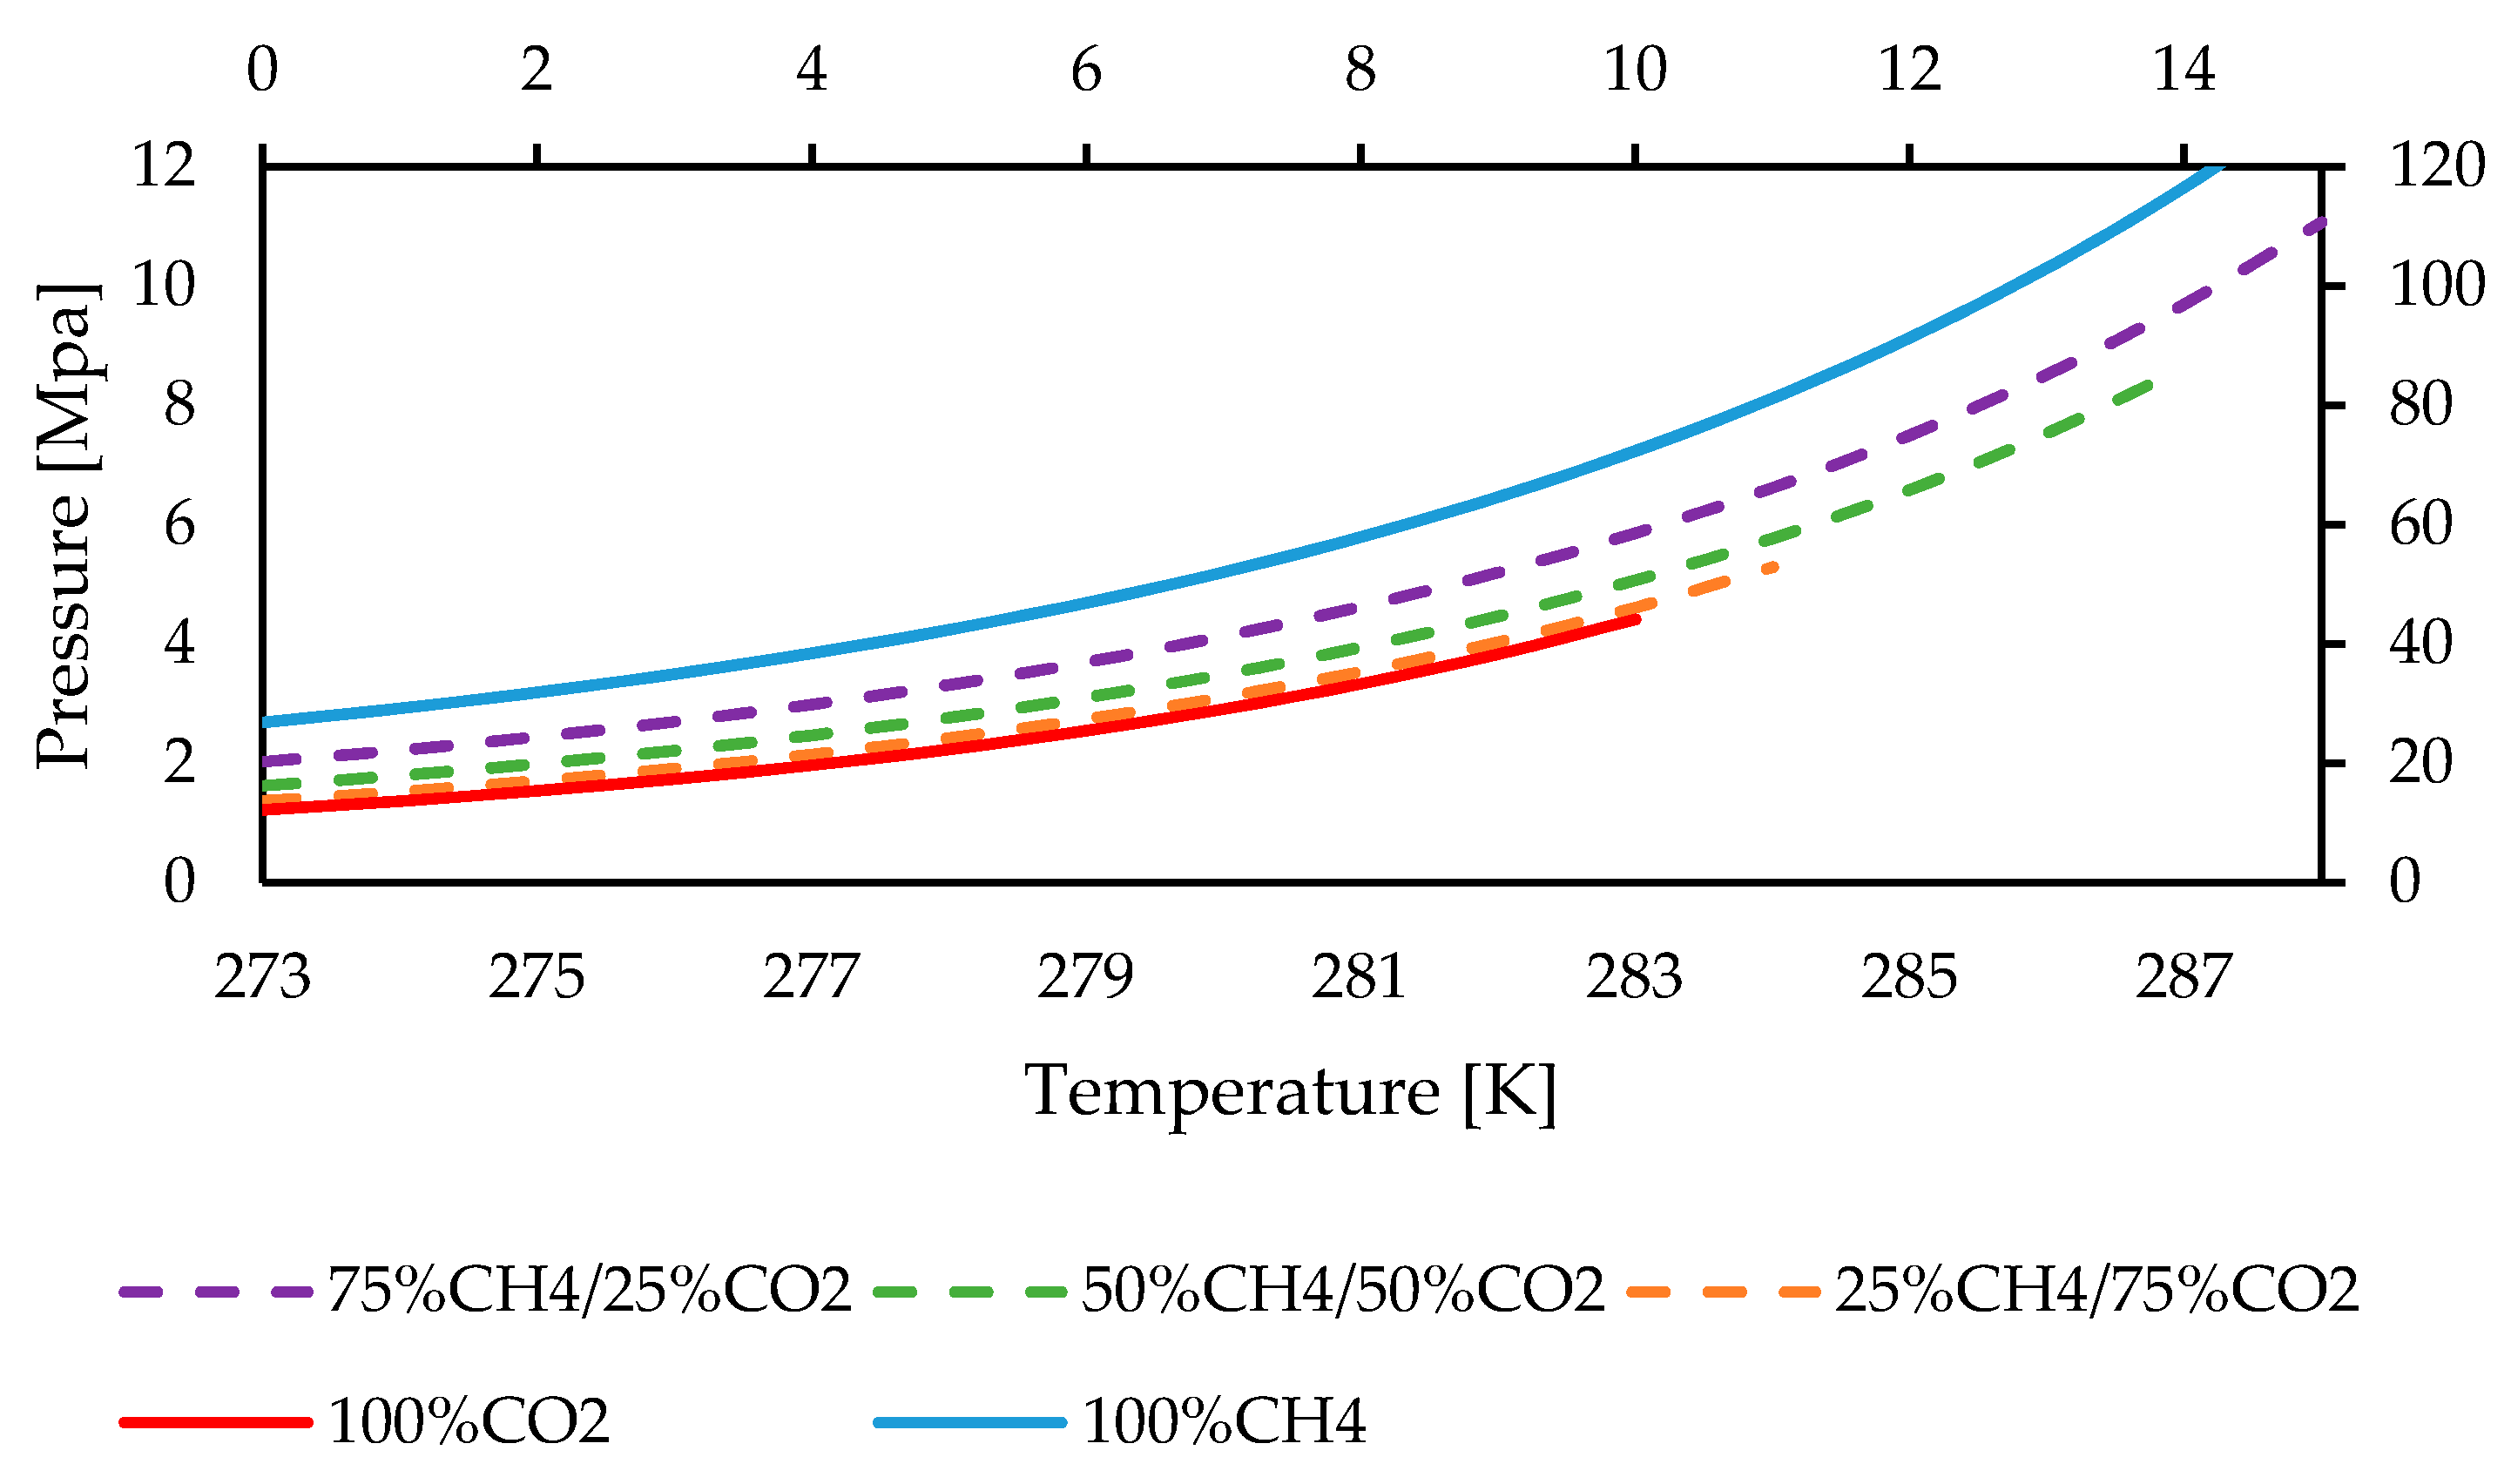
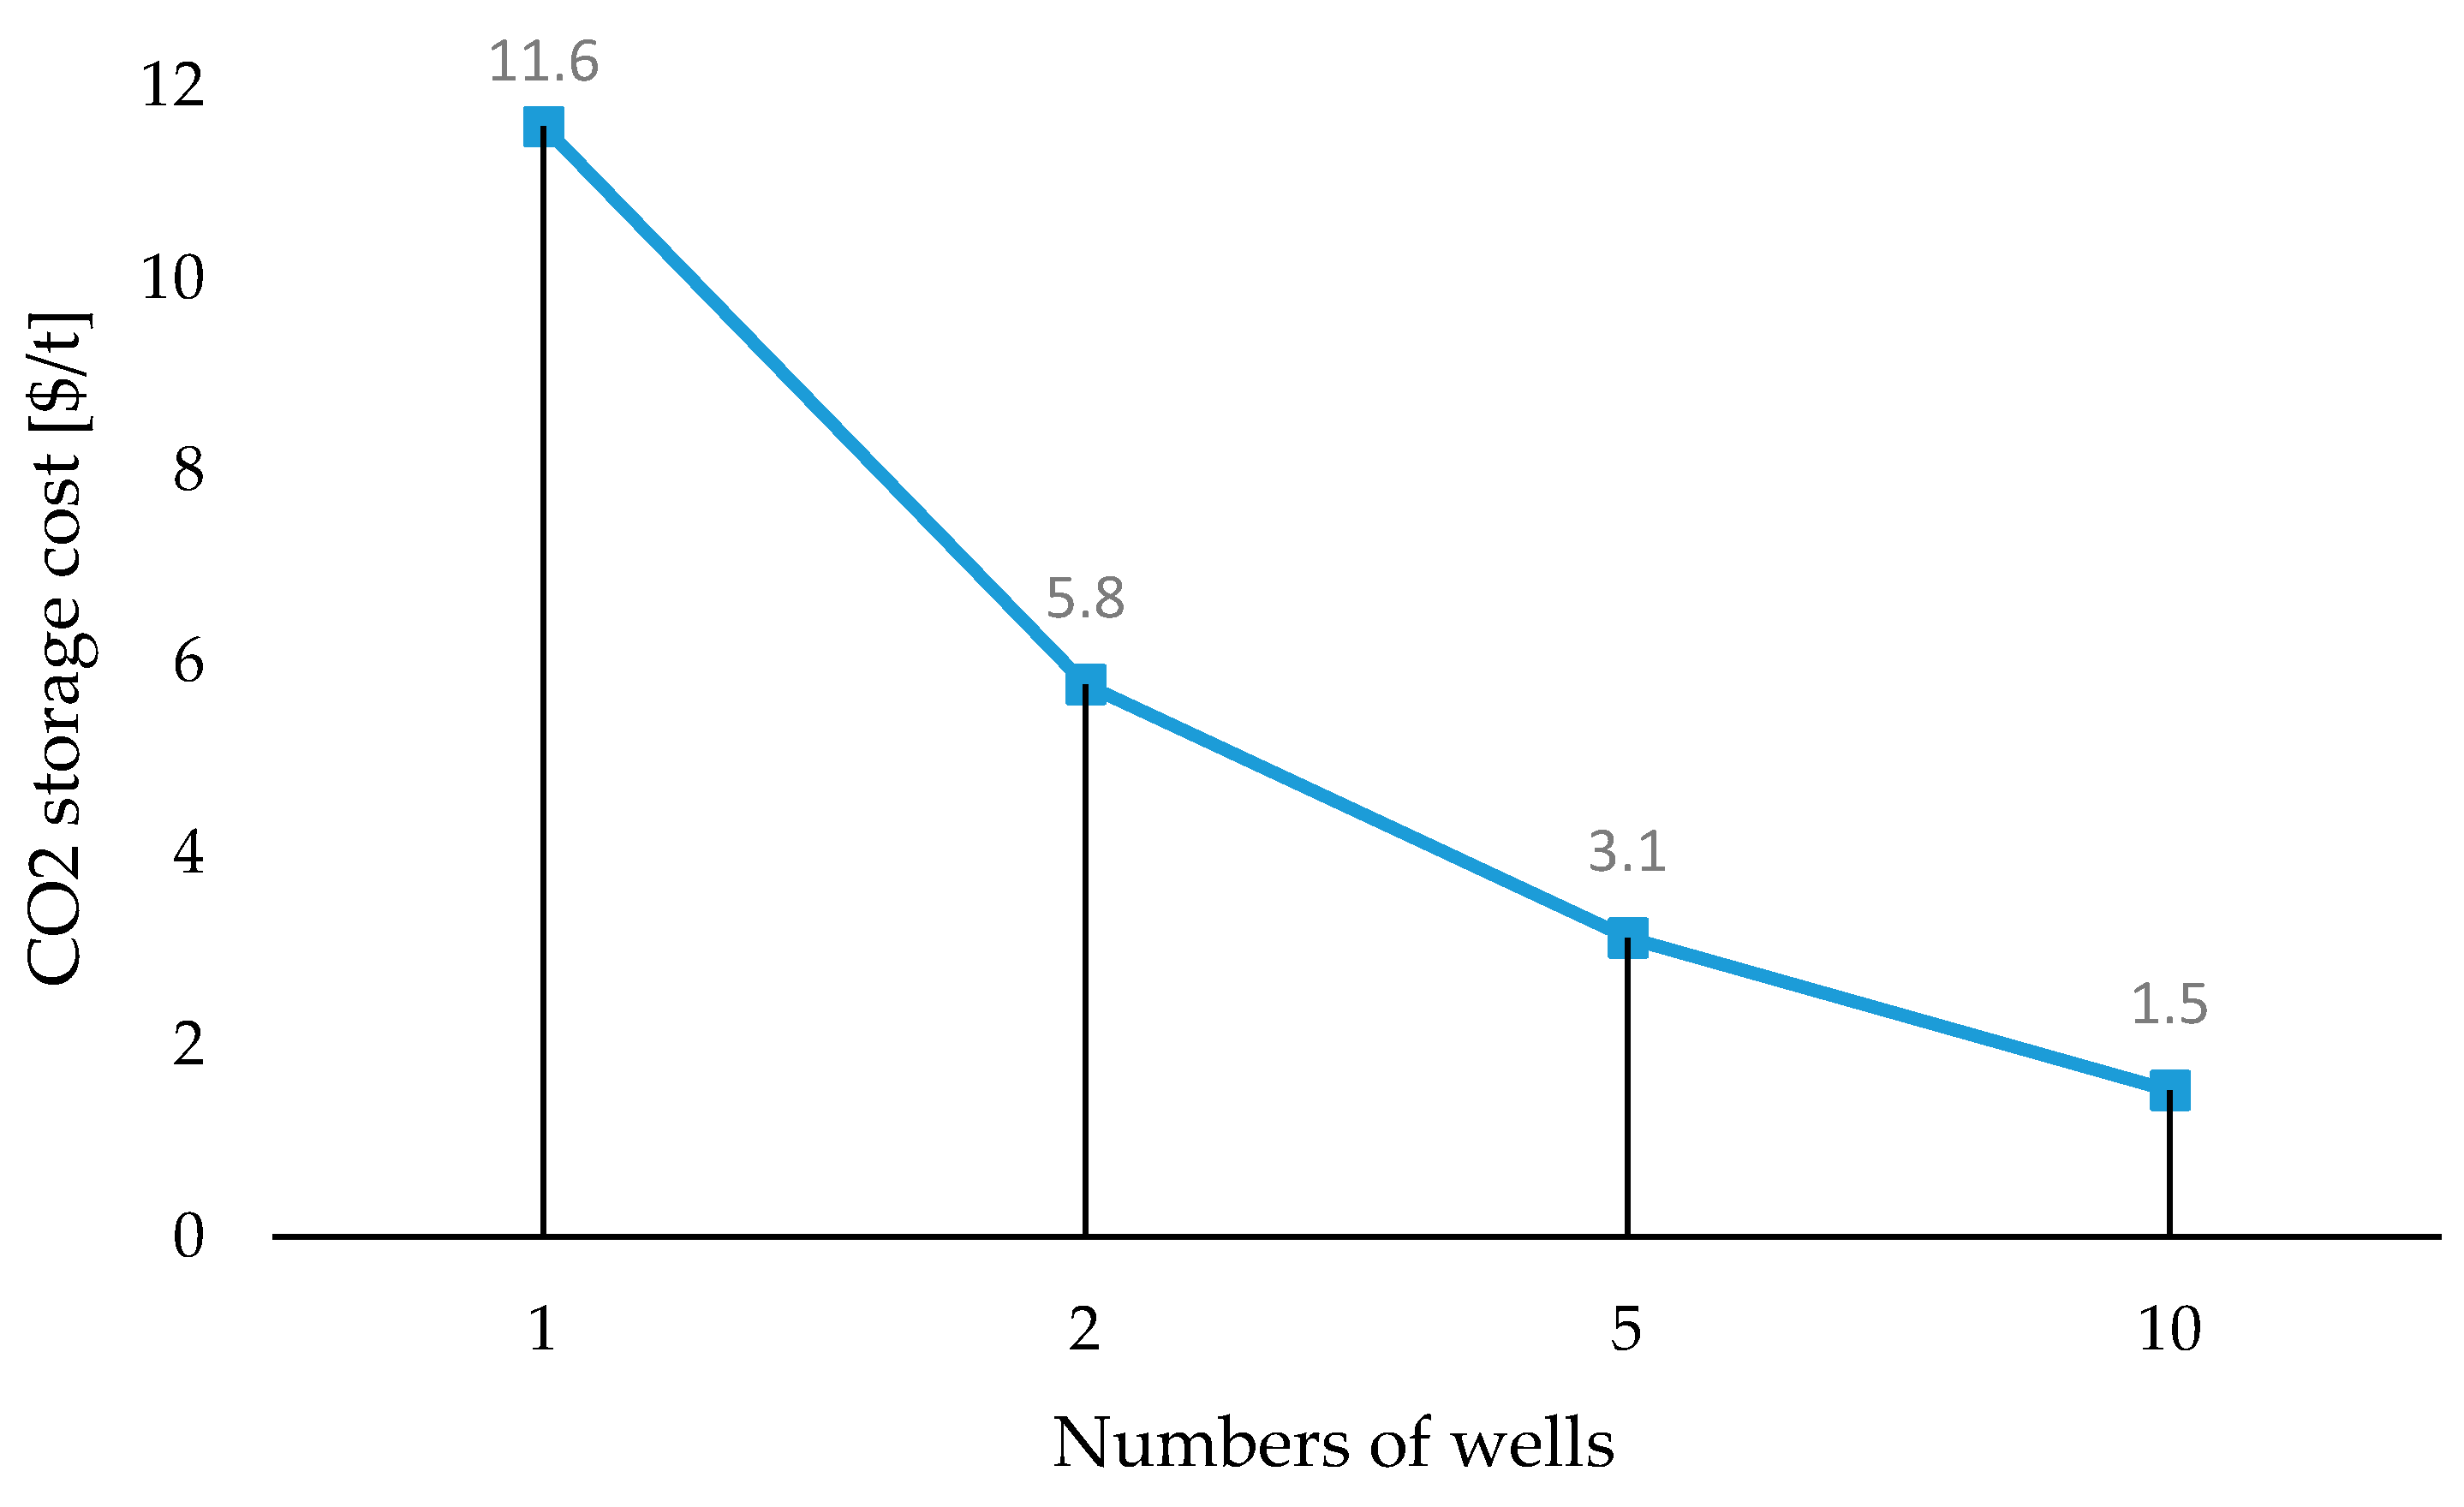
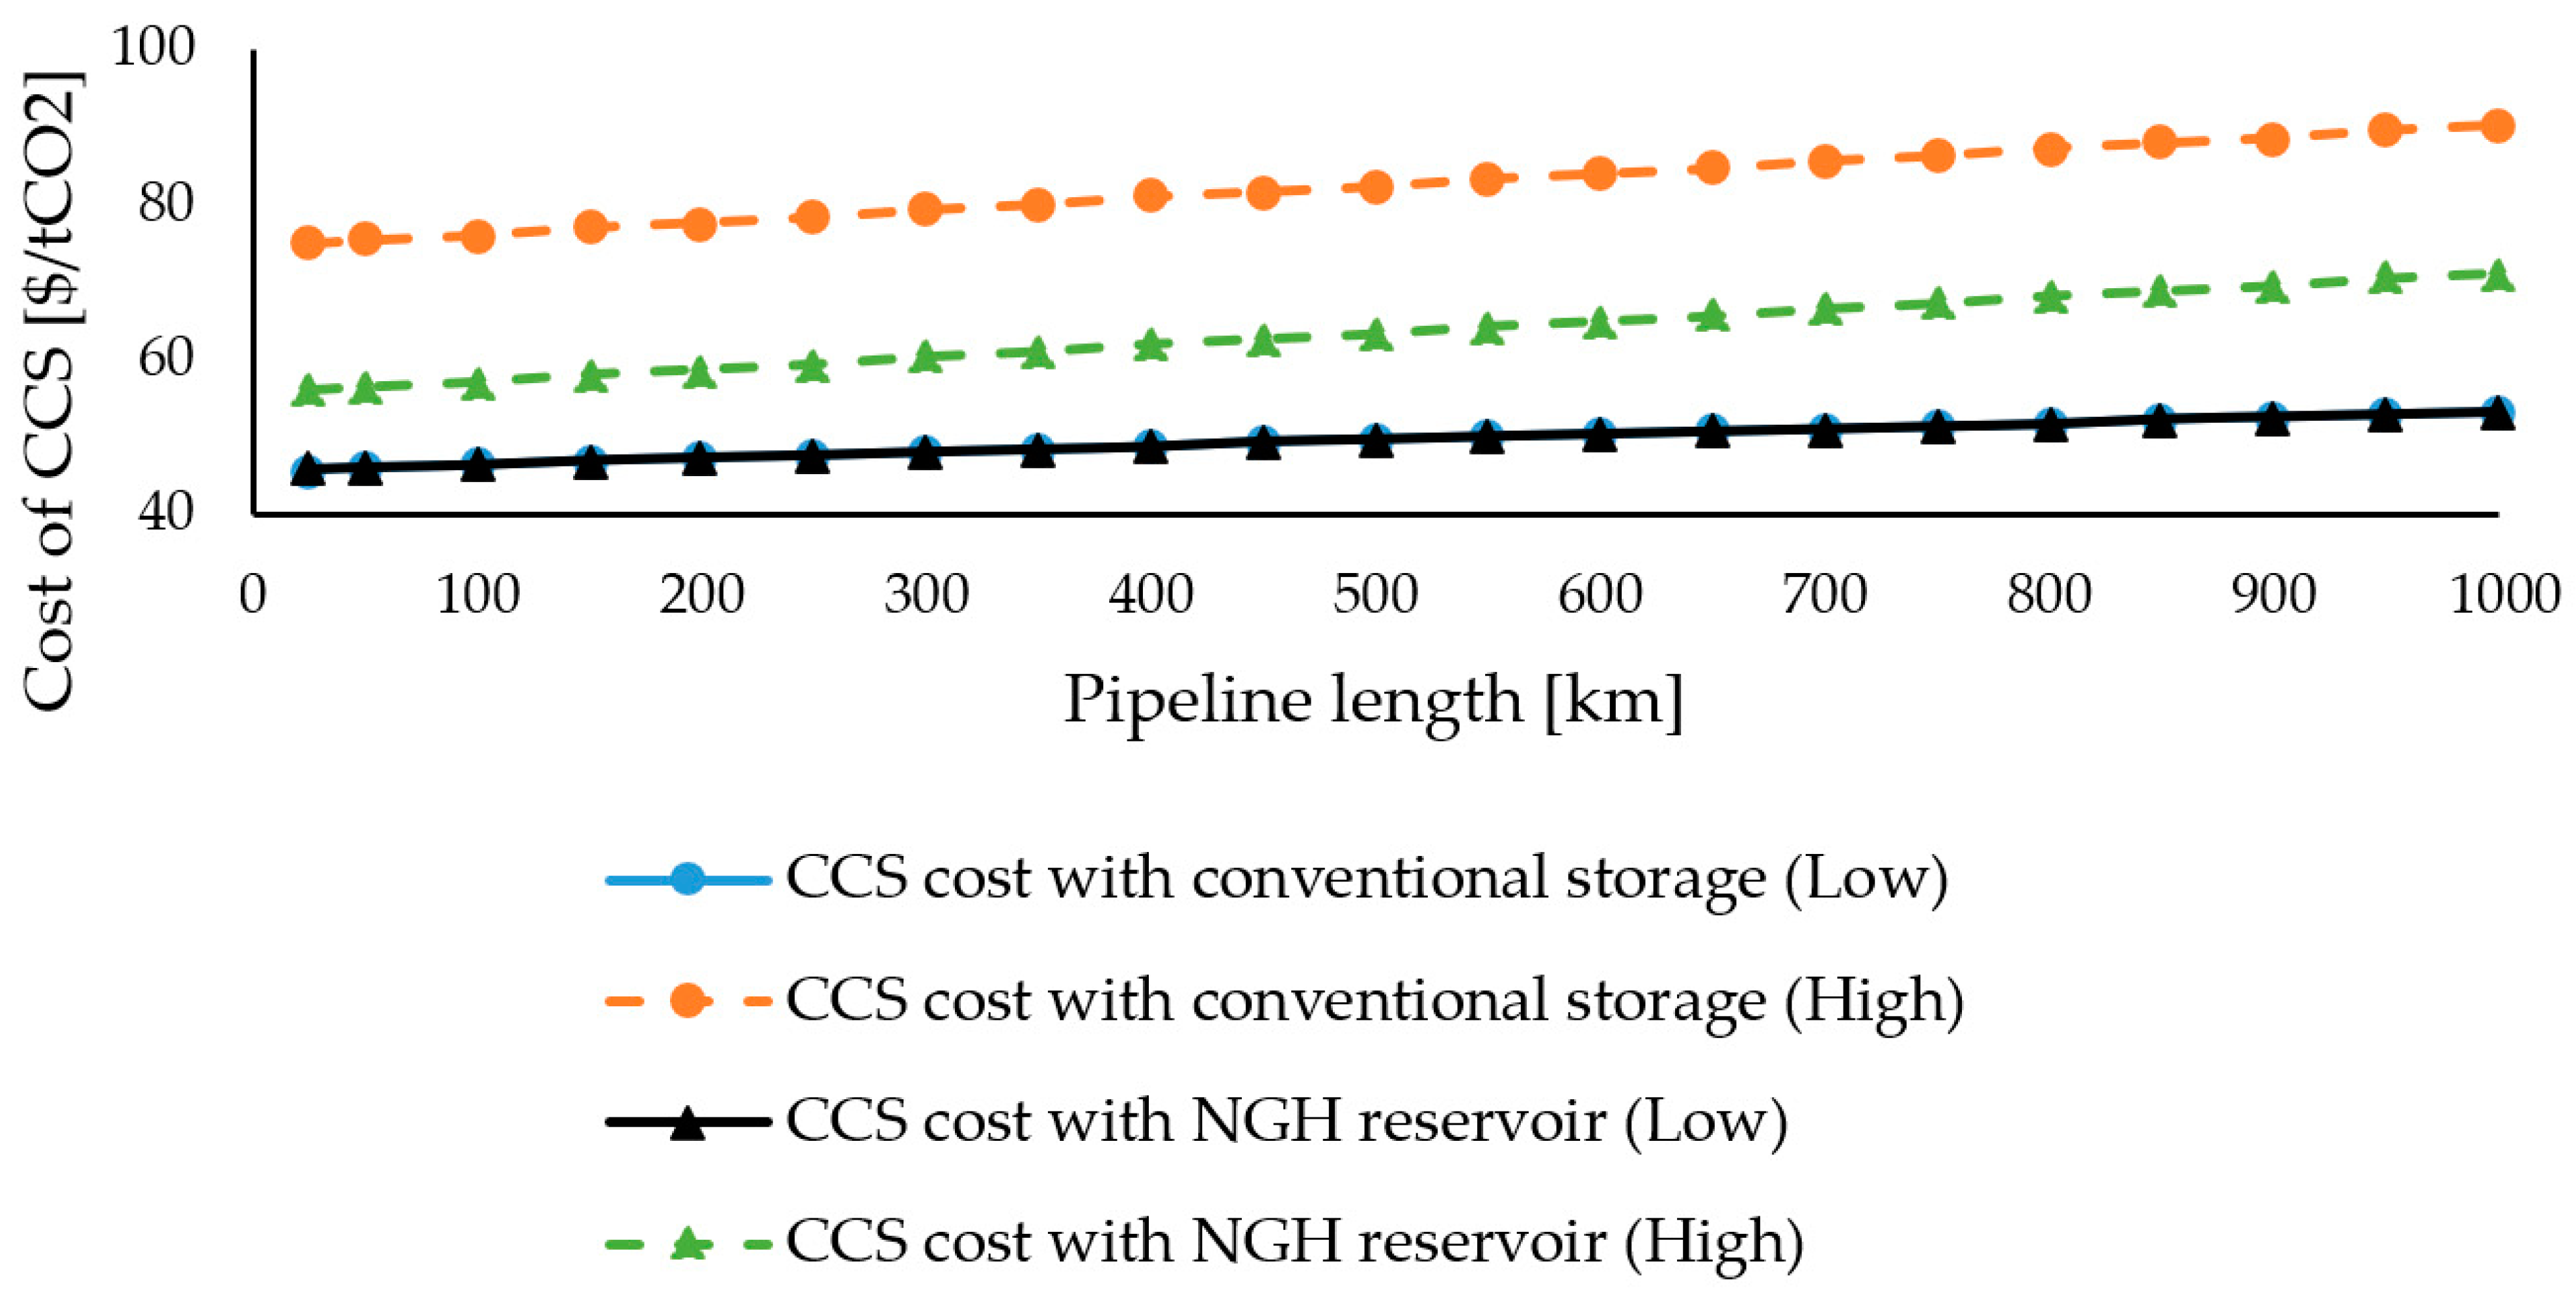
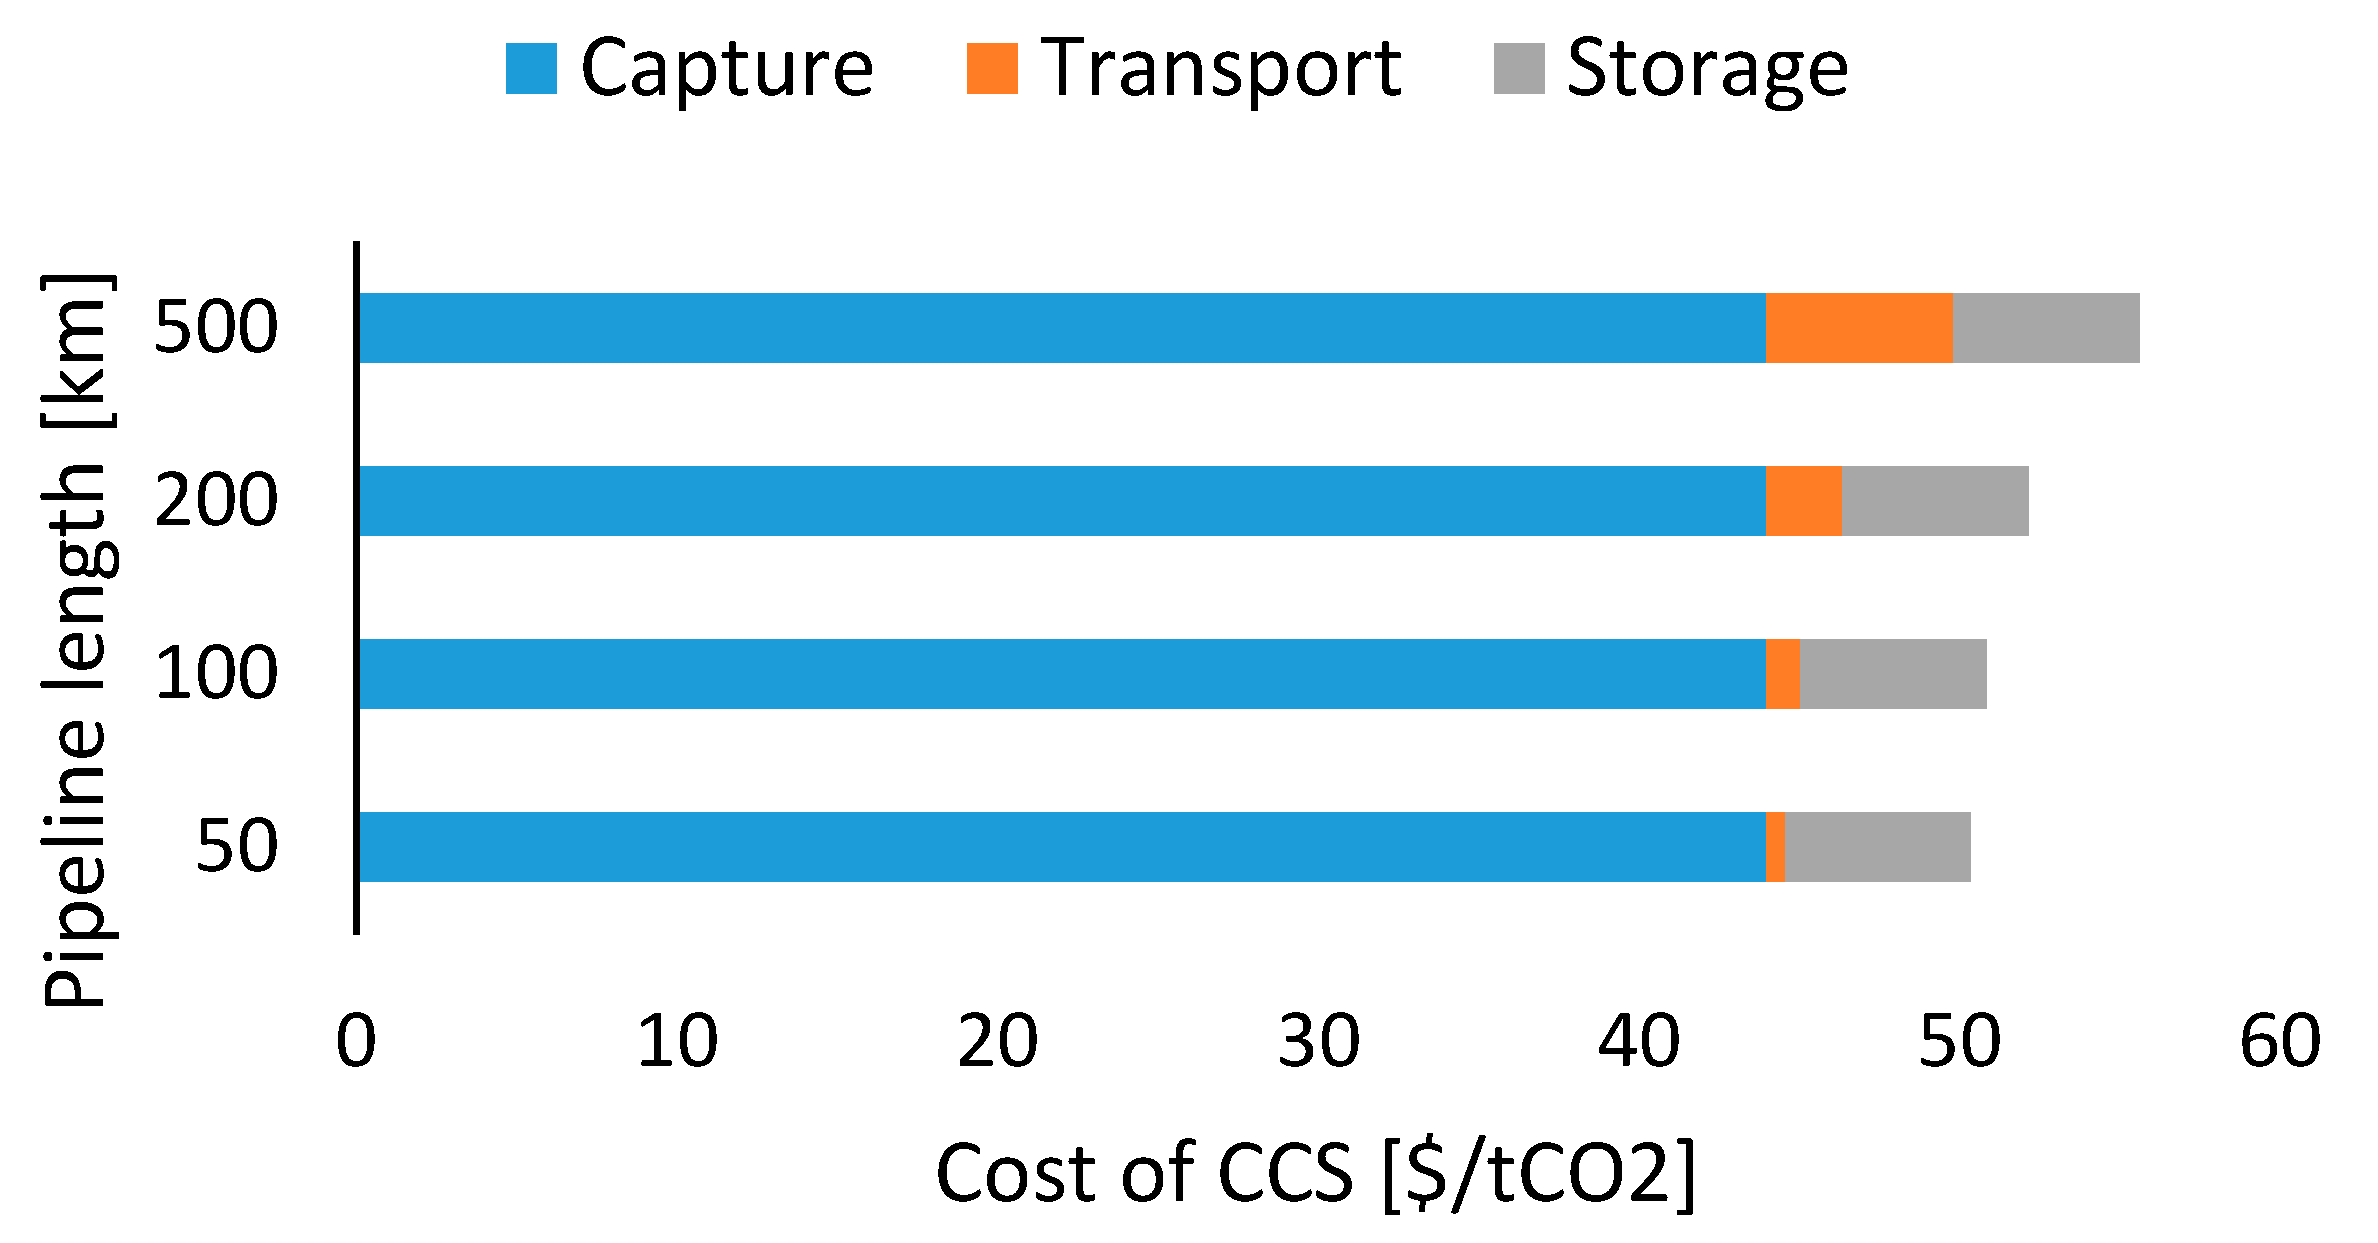
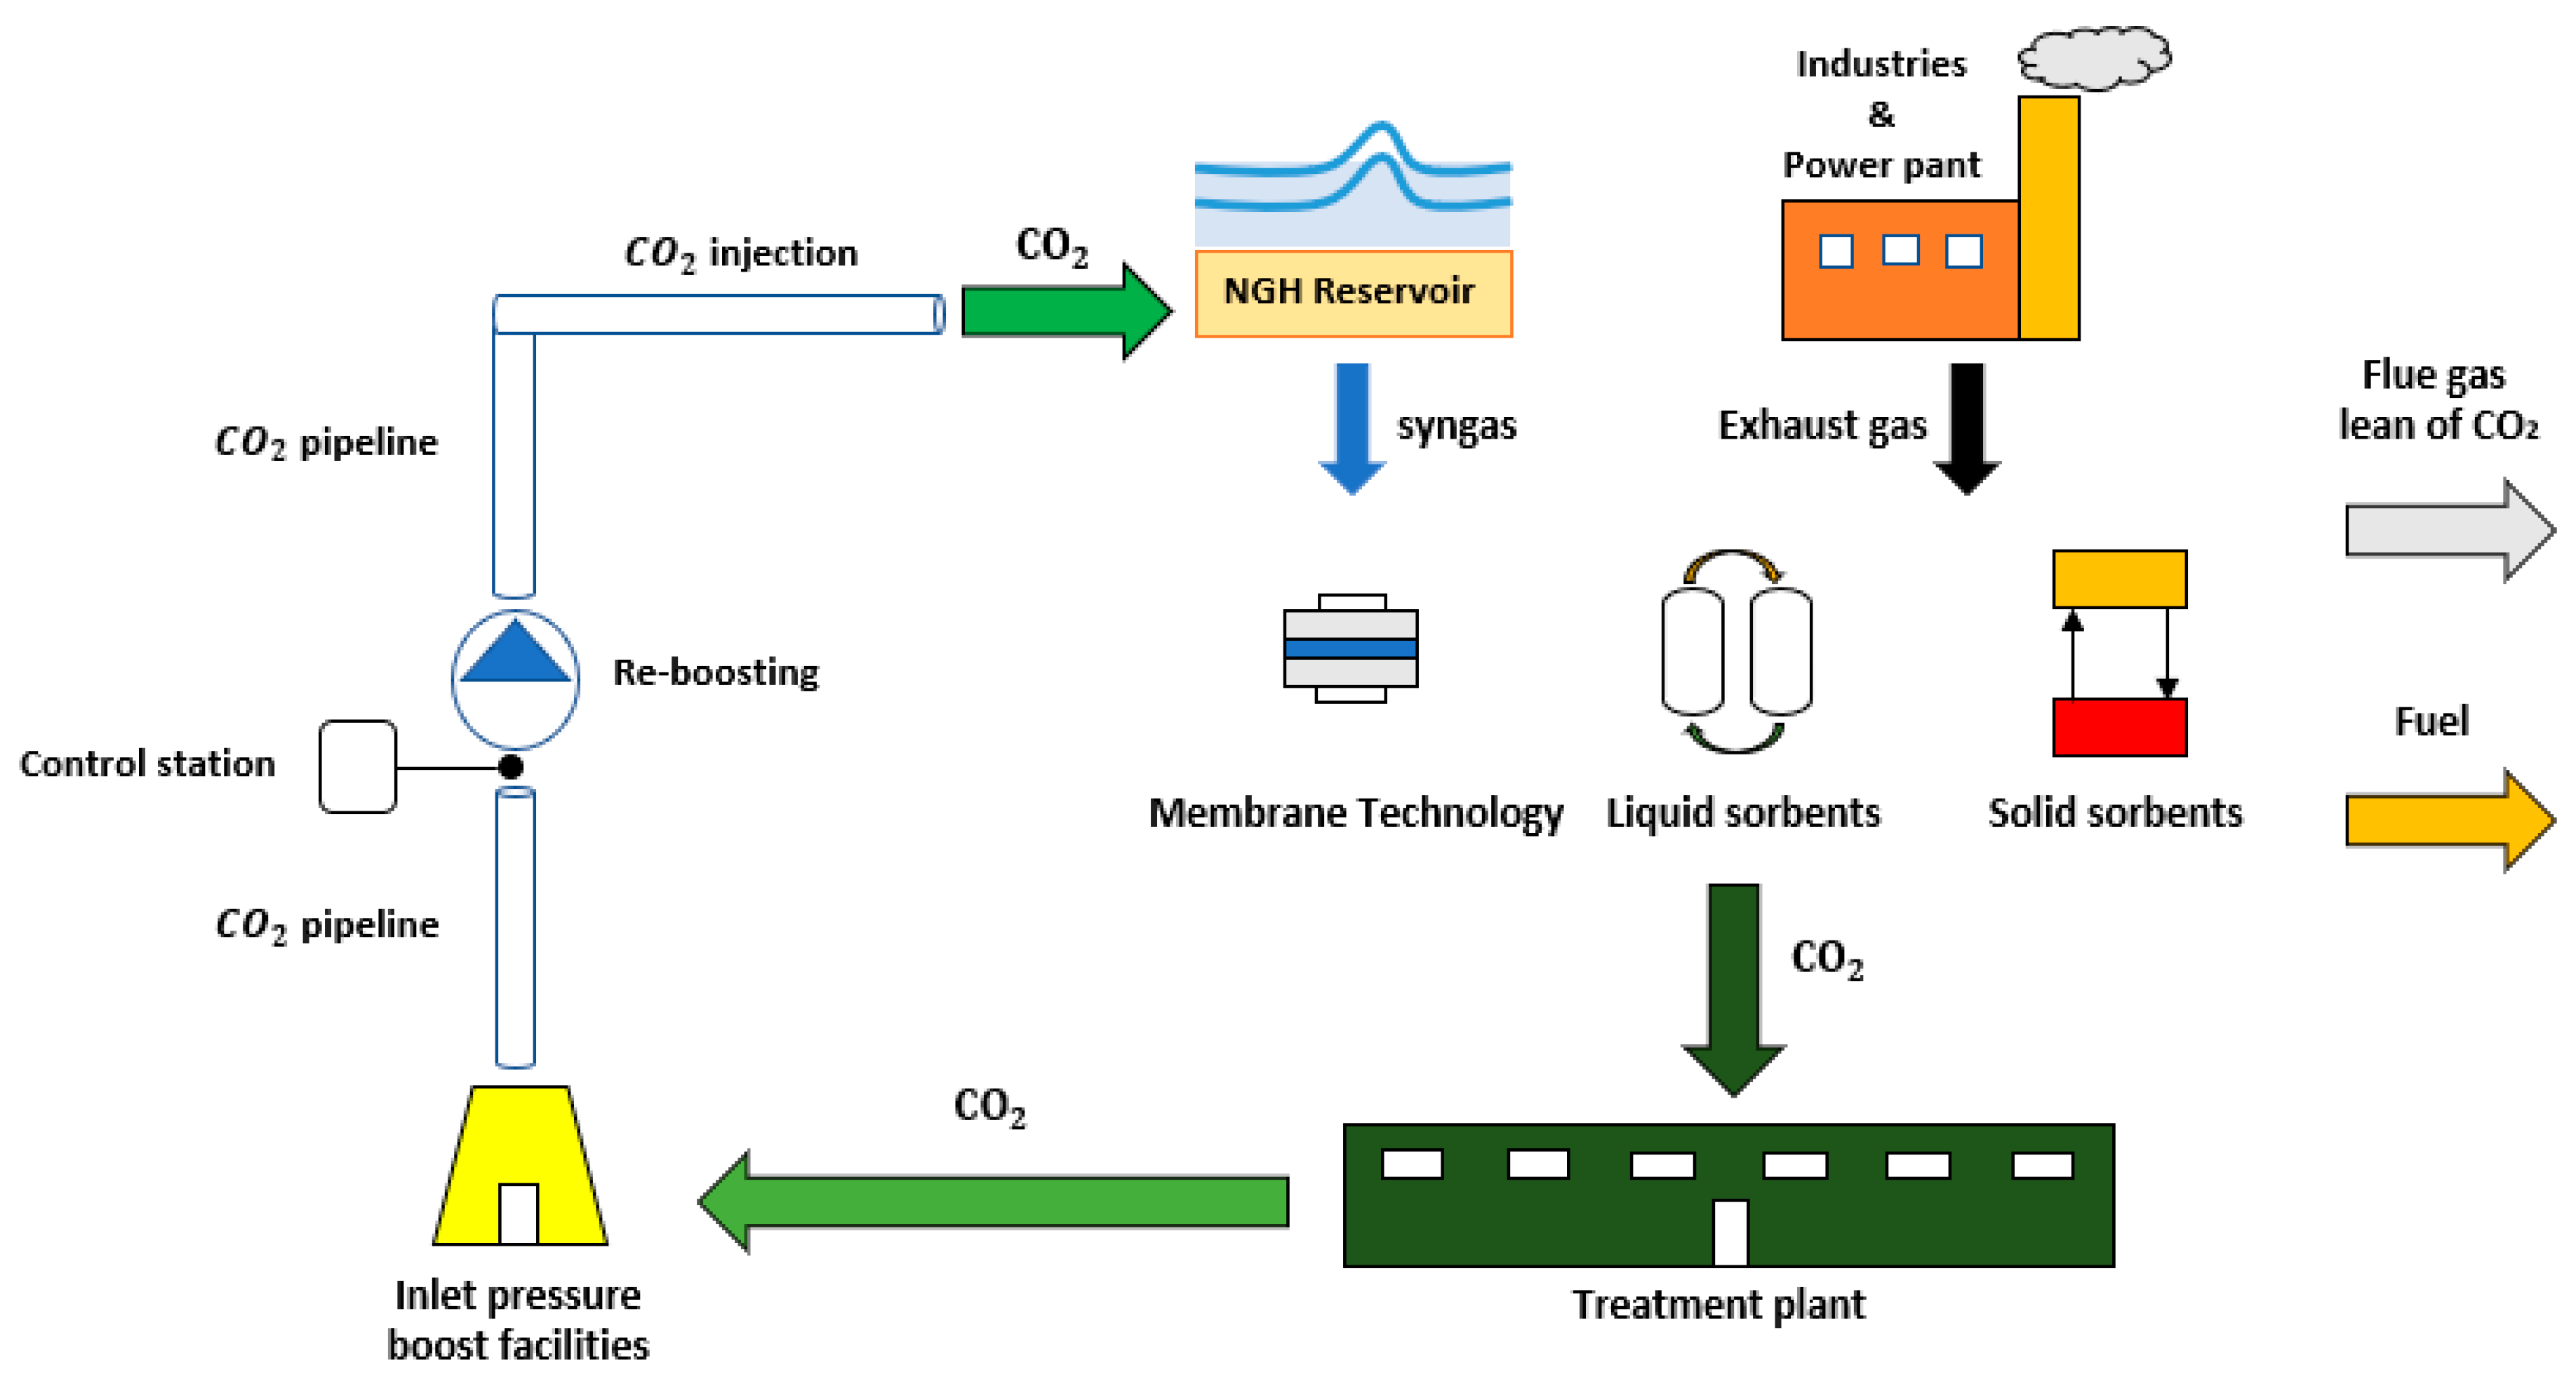
Table 1.
Current performance and cost estimates for oxyfuel combustion capture at new (SCPC/USC) plants (values in 2013 US$) [21]. Definition: Higher Heating Value (HHV).
Table 1.
Current performance and cost estimates for oxyfuel combustion capture at new (SCPC/USC) plants (values in 2013 US$) [21]. Definition: Higher Heating Value (HHV).
| Performance and Cost Measurement for New Oxy-Combustion Plants with Subbituminous or Bituminous Coal | |||
|---|---|---|---|
| Range | |||
| Plant Performance Measurement | Low | High | Representative Value |
| SCPC/USC reference plant net power output [MW] | 550 | 1030 | 684 |
| Emission rate w/o capture [t CO2/MWh] | 0.75 | 0.861 | 0.83 |
| Emission rate with capture [t CO2/MWh] | 0.017 | 0.11 | 0.08 |
| Percentage of CO2 reduction per MWh [%] | 90 | 98 | 92 |
| Total CO2 captured or stored [Mt/y] | 3.1 | 5.5 | 3.9 |
| Plant efficiency w/o capture, HHV basis [%] | 38.7 | 42 | 39 |
| Plant efficiency w/capture, HHV basis [%] | 30.1 | 34.1 | 32 |
| Efficiency penalty [%] | 8.1 | 7.9 | 8 |
| Capture energy requirement [%more input/MWh] | 24 | 29 | 25 |
| LCOE w/o capture [$/MWh] | 56 | 68 | 64 |
| LCOE w/capture [$/MWh] | 91 | 121 | 110 |
| Increase in LCOE capture only [$/MWh] | 35 | 53 | 46 |
| Cost of CO2 captured [$/t CO2] | 36 | 67 | 52 |
| Cost of CO2 avoided [$/t CO2] | 45 | 73 | 62 |
Table 2.
Summary of the results of new IGCC power plants with and without a pre-combustion capture system [21].
Table 2.
Summary of the results of new IGCC power plants with and without a pre-combustion capture system [21].
| Performance and Cost Measurement for New IGCC Plant with Bituminous or Sub-Bituminous Coal (SCPC) | |||
|---|---|---|---|
| Range | |||
| Plant Performance Measurement | Low | High | Representative Value |
| SCPC/USC reference plant net power output [MW] | 550 | 1030 | 753 |
| Emission rate w/o capture [t CO2/MWh] | 0.75 | 0.84 | 0.786 |
| Emission rate with capture [t CO2/MWh] | 0.093 | 0.15 | 0.104 |
| Percentage of CO2 reduction per MWh [%] | 82 | 88 | 87 |
| Total CO2 captured or stored [Mt/y] | 3 | 6 | 4 |
| Plant efficiency w/o capture, HHV basis [%] | 39 | 44.2 | 42 |
| Plant efficiency w/capture, HHV basis [%] | 29.9 | 36.5 | 33 |
| Efficiency penalty [%] | 9.1 | 7.7 | 9 |
| Capture energy requirement [%more input/MWh] | 21 | 30 | 25 |
| LCOE w/o capture [$/MWh] | 64 | 79 | 69 |
| LCOE w/capture [$/MWh] | 100 | 141 | 124 |
| Increase in LCOE capture only [$/MWh] | 36 | 62 | 55 |
| Cost of CO2 captured [$/t CO2] | 42 | 87 | 63 |
| Cost of CO2 avoided [$/t CO2] | 52 | 112 | 81 |
Table 3.
Current performance and cost estimates for post-combustion capture at SCPC power plant (values in 2013$) [21].
Table 3.
Current performance and cost estimates for post-combustion capture at SCPC power plant (values in 2013$) [21].
| Performance and Cost Measurement for New SCPC with Bituminous Coal | |||
|---|---|---|---|
| Range | |||
| Plant Performance Measurement | Low | High | Representative Value |
| SCPC/USC reference plant net power output [MW] | 550 | 1030 | 742 |
| Emission rate w/o capture [t CO2/MWh] | 0.746 | 0.84 | 0.788 |
| Emission rate with capture [t CO2/MWh] | 0.092 | 0.12 | 0.104 |
| Percentage of CO2 reduction per MWh [%] | 86 | 88 | 87 |
| Total CO2 captured or stored [Mt/y] | 3.8 | 5.6 | 4.6 |
| Plant efficiency w/o capture, HHV basis [%] | 39 | 44.4 | 41.4 |
| Plant efficiency w/capture, HHV basis [%] | 27.2 | 36.5 | 31.6 |
| Efficiency penalty [%] | 11.8 | 7.9 | 9.8 |
| Capture energy requirement [%more input/MWh] | 21 | 44 | 32 |
| LCOE w/o capture [$/MWh] | 61 | 79 | 70 |
| LCOE w/capture [$/MWh] | 91 | 130 | 113 |
| Increase in LCOE capture only [$/MWh] | 30 | 51 | 43 |
| Cost of CO2 captured [$/t CO2] | 36 | 53 | 46 |
| Cost of CO2 avoided [$/t CO2] | 45 | 70 | 63 |
Table 4.
Techno-economic analysis for CO2 separation with membrane technology performed by MTR for post-combustion capture in SCPC coal-fired power plant [22].
Table 4.
Techno-economic analysis for CO2 separation with membrane technology performed by MTR for post-combustion capture in SCPC coal-fired power plant [22].
| Performance and Cost Measurement for New SCPC with Bituminous Coal Integrated with the Membrane Capture System | |
|---|---|
| Plant Performance Measurement | Representative Value |
| SCPC/USC reference plant net power output [MW] | 550 |
| Emission rate w/o capture [t CO2/MWh] | 0.788 |
| Emission rate with capture [t CO2/MWh] | 0.111 |
| Percentage of CO2 reduction per MWh [%] | 89.9 |
| Total CO2 captured or stored [Mt/y] | 4.8 |
| Plant efficiency w/o capture, HHV basis [%] | 39.3 |
| Plant efficiency w/capture, HHV basis [%] | 28.6 |
| Efficiency penalty [%] | 10.7 |
| LCOE w/o capture [$/MWh] | 76.9 |
| LCOE w/capture [$/MWh] | 120.4 |
| Increase in LCOE capture only [$/MWh] | 43.5 |
| Cost of CO2 captured [$/t CO2] | 44 |
| Cost of CO2 avoided [$/t CO2] | 64 |
Table 5.
Financial parameters and technical parameters used to perform an economic analysis of CO2 transportation.
Table 5.
Financial parameters and technical parameters used to perform an economic analysis of CO2 transportation.
| Financial Parameters | |
| Capitalization | 50% |
| Cost of Equity | 12% |
| Cost of Debt | 4.5% |
| Tax Rate | 24% |
| Escalation Rate | 3% |
| Project Contingency Factor | 15% |
| Depreciation method-recovery period for depreciation | DB150—15 years |
| Duration of Construction in years | 3 |
| Duration of Operation in years | 30 |
| Technical Parameters | |
| Annual tonnes of CO2 Transported (on average) [Mt/y] | 5 |
| Capacity Factor | 80% |
| Inlet Pressure [MPa] | 15.3 |
| Outlet Pressure [MPa] | 8.4 |
| Change in elevation [m] | 0 |
| Temperature of the environment [°C] | 12 |
| Pump efficiency | 75% |
Table 6.
Cost data used to compute the simultaneous CO2 storage and methane production.
| Cost Element | Unit | Number of Wells | |||
|---|---|---|---|---|---|
| CAPEX | 1 | 2 | 5 | 10 | |
| Mob & Demob | [$ · 106] | 1.5 | 1.5 | 2 | 2 |
| Top Side System | [$ · 106] | 250 | 250 | 350 | 350 |
| Subsea system | [$ · 106] | 5 | 10 | 25 | 50 |
| Drilling & Completion | [$ · 106] | 1.5 | 3 | 7.5 | 15 |
| OPEX | [$ · 106/year] | 2 | 4 | 10 | 20 |
Table 7.
The financial and technical parameter to evaluate the CO2 storage cost.
| Financial Parameters | |
| Capitalization | 50% |
| Cost of Equity | 12% |
| Cost of Debt | 4.5% |
| Tax Rate | 24% |
| Escalation Rate | 3% |
| Project Contingency Factor | 15% |
| Depreciation method-recovery period for depreciation | DB150—15 years |
| Duration of Construction in years | 3 |
| Duration of Operation in years | 15 |
| Technical Parameters | |
| Annual methane production [Mm3/y/well] | 3 |
| Capacity Factor | 80% |
| Price of methane in japan (2019) [$/m3] [60] | 0.335 |
| [56] | 36% |
| Annual CO2 stored [Mm3/y/well] | 3 |
Table 8.
Range of storage cost for several reservoir types, either onshore or offshore. All prices are reported in US dollars in 2013.
Table 8.
Range of storage cost for several reservoir types, either onshore or offshore. All prices are reported in US dollars in 2013.
| Reference | Reservoir Type | On/Off-Shore | Low | High | Unit |
|---|---|---|---|---|---|
| [67] | Depleted O&G field—reusing wells | onshore | 1.5 | 10.7 | [$/t CO2] |
| Depleted O&G field—no reusing wells | onshore | 1.5 | 15.3 | [$/t CO2] | |
| Saline formation | onshore | 3.1 | 18.4 | [$/t CO2] | |
| Depleted O&G field—reusing wells | offshore | 3.1 | 13.8 | [$/t CO2] | |
| Depleted O&G field—no reusing wells | offshore | 4.6 | 21.4 | [$/t CO2] | |
| Saline formation | offshore | 9.2 | 30.6 | [$/t CO2] | |
| [68] | Saline formation | Onshore | 6.8 | 12.6 | [$/t CO2] |
| [69] | Poor and good reservoir properties | Onshore | 6.2 | 13.4 | [$/t CO2] |
| CO2 storage in NGH reservoir | Offshore | 1.5 | 11.6 | [$/t CO2] |
Publisher’s Note: MDPI stays neutral with regard to jurisdictional claims in published maps and institutional affiliations. |
© 2021 by the authors. Licensee MDPI, Basel, Switzerland. This article is an open access article distributed under the terms and conditions of the Creative Commons Attribution (CC BY) license (http://creativecommons.org/licenses/by/4.0/).
Share and Cite
MDPI and ACS Style
Cannone, S.F.; Lanzini, A.; Santarelli, M. A Review on CO2 Capture Technologies with Focus on CO2-Enhanced Methane Recovery from Hydrates. Energies 2021, 14, 387. https://doi.org/10.3390/en14020387
AMA Style
Cannone SF, Lanzini A, Santarelli M. A Review on CO2 Capture Technologies with Focus on CO2-Enhanced Methane Recovery from Hydrates. Energies. 2021; 14(2):387. https://doi.org/10.3390/en14020387
Chicago/Turabian StyleCannone, Salvatore F., Andrea Lanzini, and Massimo Santarelli. 2021. "A Review on CO2 Capture Technologies with Focus on CO2-Enhanced Methane Recovery from Hydrates" Energies 14, no. 2: 387. https://doi.org/10.3390/en14020387
Note that from the first issue of 2016, this journal uses article numbers instead of page numbers. See further details here.