Article

To What Extent Is Manure Produced, Distributed, and Potentially Available for Bioenergy? A Step toward Stimulating Circular Bio-Economy in Poland

Department of Bioeconomy and Systems Analysis, Institute of Soil Science and Plant Cultivation-State Research Institute (IUNG-PIB), 24-100 Puławy, Poland
*
Author to whom correspondence should be addressed.
Energies 2020, 13(23), 6266; https://doi.org/10.3390/en13236266
Submission received: 23 September 2020 / Revised: 23 November 2020 / Accepted: 25 November 2020 / Published: 27 November 2020
(This article belongs to the Special Issue Bioeconomy for Resilient Post-COVID Economies)

Abstract

:
Bioenergy production from animal waste can be a key driver to achieving bio-economy goals. Developing a bio-economy sector could help to create opportunities for a circular system where not only people and the planet will be benefited, but it will also provide economic profitability to farmers, especially in the post-Covid period. To this end, manure production, its nutrient content, and bioenergy potential were estimated, along with their spatial distribution in the Lubelskie province, Poland. Farm-level data were processed and aggregated at the municipality level. Material balance equations were used to calculate the theoretical potential of livestock manure and bioenergy for different use scenarios: (1) Baseline (BC): direct manure application to land, which was compared against (2) Anaerobic Digestion (AD): anaerobic digestion to biogas with digestate returned to the fields (3) AD + Separation (AD + Sep): mechanical separation followed by anaerobic digestion, and (4) Surplus + AD: surplus manure (after application to the fields) is sent to anaerobic digestion. Manure, biogas, electricity, and thermal energy production of the AD scenario were estimated to be 7.5 Mt y−1, 378 Mm3 y−1, 907 GWe y−1, and 997.8 GWth y−1, respectively. The scenario, including mechanical separation followed by anaerobic digestion (AD + Sep), contributed to avoiding emissions to the largest extent (1 Mt CO2 eq), whereas AD outperformed the others in avoiding costs of fertilization. According to the estimated potential and the environmental cost-effectiveness of AD, new plants can be established that will recycle manure through bioenergy production, and, subsequently, the digestate can be applied as organic fertilizer, closing the nutrients cycle.

1. Introduction

1.1. Manure Treatment for Sustainable Agriculture and Livestock Sectors

The agriculture and livestock sectors may contribute to realizing the transition from a fossil-based to a renewable, bio-based economy. Bioenergy is renewable energy generated from biomass resources, such as animal manure, in the form of electricity, gas, fuel, etc. [1]. A bioenergy carrier that currently gains much attention is biogas.
The current Covid-19 pandemic in 2020 has already driven most countries to shut down their economy, which may impact the global food system in various ways, among them management and treatment of waste from livestock farms. A direct impact of this situation is that a large part of the world’s countries can be recognized in the enhancement of domestic products, which will necessitate the circular agriculture to be adapted to the current situation of farming activities. Therefore, bio-economy may enhance the resilience of livestock farming in the post-Covid 19 era through on-farm cycling of nutrients and soil improvement by enriching soil organic matter and minimizing environmental pollution [2]. Hence, it is time to rethink and restructure the strategies for more local solutions combined with a broader and longer-term perspective [3].
In addition, efficient measures to limit unfavorable environmental impacts, such as greenhouse gases (GHG) emissions and ammonia emission from manure, are needed; however, only part of the generated manure can be treated as a source of bioenergy. The added value from the use of manure can be created in different ways in the forward chain, e.g., bioenergy production, such as anaerobic digestion (AD) for biogas production [1]. Estimation of bioenergy potential is the starting point for identifying the added value [4,5]. Besides the electricity and heat energy, an important contributor to the added value of AD is the digestate by-product, which has an impact on the viability of AD projects [6].

1.2. Bioeconomy Potential in Poland

In Poland, there is no strategic document dedicated to bioeconomy [7]. Thus, following up the Polish bioeconomy development is difficult. Poland has already taken big steps towards this new concept of economy; however, bioeconomy indicators are still in their infancy. In this respect, Polish inventions are very rarely converted into commercial products [7].
Recent initiatives, such as The Central-Eastern European Initiative for Knowledge-based Agriculture, Aquaculture and Forestry in the Bioeconomy—BIOEAST, argue that an east-west divide exists in the EU, resulting in slower development of bioeconomy in eastern EU countries. This is due to the fact that these countries serve mainly as raw material providers for big companies in the west and have limited access to research. Developing bioeconomy strategies for these countries can contribute to overcome existing or perceived geographical imbalances and better exploit the untapped potential [8].
In a recent study, Polish bioeconomy sectors were analyzed, and fully bio-based sectors, such as the agriculture and food sectors, were identified for their higher potentials to induce knock-on effects in the economy [9].
In Poland, a high potential of biogas production was identified by Igliński et al. [10], Igliński et al. [11], and Muradin and Foltynowicz [12]. Due to the decision of the Council of Ministers adopted on 13 July 2010 [13], Poland established a target of 125 GWh of electricity and 200 GWh of thermal energy from agricultural AD plants by 2020. Despite the optimism triggered by the Renewable Energy Sources Act (2015) [14] for the biogas industry take-off, Poland is still far from the aforementioned targets, mainly due to insufficient government funding and support.
However, the rescue plan for existing installations, as well as planned investments, is to combine the use of manure and low cost industrial substrates with high biogas yields [15]. The national energy and climate plan for the years 2021–2030 [16] indicates renewable energy development directions in Poland, considering the possibility of producing annually 7.8 billion m3 of biogas from agricultural sources. The role of biogas is emphasized not only for energy generation but also for solving problems of waste and energy storage [17].
Grain production in Poland has followed a rising trend, amounting to 31 megaton (Mt) by 2016. This trend, as well as the lower price, the simplicity of application and fast acting characteristics of chemical fertilizers, have resulted in the higher use of synthetic rather than organic fertilizers; hence, the demand for livestock manure has reduced [18]. In view of a sustainable circular bioeconomy, one of the main uses of livestock manure is as a fertilizer. Manure can be processed in anaerobic digestion plants, and the produced digestate can be treated and considered as a source of organic fertilizer [19]. In order to avoid N-immobilization in the soil, a pre-treatment method prior to land application of manure is required. Solid-liquid separation of the effluent and composting of the solid part is widely applied around the world [20].

1.3. Estimation of Manure Production and Potential

Since the basic feedstock fed into agricultural biogas plants is manure (60% to 100% of feedstock mass) [21], an accurate estimation of the livestock manure and its distribution is of paramount importance for the future planning and optimization of bioenergy production [5]. In this respect, Piwowar et al. [21] estimated an increase in production of agricultural biogas in 2011–2014 by 137.29 million m3 (equal to 274.58 GWh). It was reported that Lubelskie province, with 11.71 MW, is among the regions with relatively high capacity for biogas production after Pomorskie (21.41 MW), Warmińsko-Mazurskie (15.62 MW), Wielkopolskie (15.31 MW), Dolnośląskie (14.4 MW), and Kujawsko-Pomorskie (14.02 MW). Igliński et al. [11] estimated the technical potential of biogas from different biomass sources in Poland. According to their study, contribution of animal droppings including cattle slurry, pig slurry, and poultry manure (25.19 PJ) is much higher than of other biomass sources (14.25 PJ). The central provinces showed the greatest potential due to larger livestock farms. According to the estimation by Igliński et al. [11], the theoretical annual biogas potential in Poland for cattle slurry was 3646 million m3, for pig slurry was 2581 million m3, and for poultry manure was 717 million m3, while, for municipal solid waste and maize, this potential was reported to be 100 and 1044 million m3, respectively.
The works carried out under the BioBoost project (7FP) have shown that in the case of Poland, as well as in many other European countries, the entire theoretical potential of manure can be used in agriculture [22], i.e., there is a possibility of its use as a fertilizer, whereas, at the regional level, the dose of 170 kg N ha−1 would not be exceeded (in accordance with the restriction indicated in the EU Nitrates Directive) [23]. In connection with the above, the question that is important for bioeconomy is whether the more sustainable form of manure management is its direct ploughing in the field, or the production of biogas and secondary management of digestate as a soil amendment. It must be noted that the calculated values within this study depend on coefficients and unpredictable fluctuating variables set out as constant to enable the assessment, which may make the analysis prone to uncertainties. In order to tackle the uncertainty, one solution is to conduct the analysis at a finer level, i.e., the farm level. A thorough search of the relevant literature yielded no study on the production of livestock manure using farm-level data. To fill this gap, we opted for a bottom-up approach to estimate the bioenergy potential and fertilizing value; meanwhile, analyzing the environmental and economic added value in Lubelskie.
On this basis, the objective of this study was to estimate manure production (from dairy cattle and pig population), its nitrogen and phosphorus content, as well as other characteristics of manure, along with its corresponding biogas potential (electricity and heat generated from manure), using farm-level data. This study also provides an assessment of spatial distribution of livestock manure. Thus, the policy making process at regional level will be supported by more detailed and up-to-date estimates than previous studies available for the Lubelskie province (i.e., Reference [4]).
Another important aspect of this work is drawing attention to the currently emerging possibilities of analyzing and modeling real data describing current food production, its dynamics, and associated waste generated over time. This work also fills the gap in publishing the results of spatial analyses based on “raw” public data collected in order to provide direct support to food producers. The presented approach to data processing shows the possibility of generating scenarios that can be directly used to support decisions aimed at development of renewable energy sources.

2. Material and Methods

2.1. Data Collection and Description of the Case Study

Data were obtained from the database of the Agency for Restructuring and Modernization of Agriculture (ARMA). The Agency was established in 1994 with the aim to support agriculture and rural development in Poland. Following Poland’s decision to join the European Union, ARMA has been designated by the Government to perform the role of an accredited paying agency. Therefore, it continuously obtains data from farmers regarding agricultural production. This information was initially developed and pre-processed for the needs of the Ministry of Agriculture and Rural Development, as part of the long-term programme implemented at the Institute of Soil Science and Plant Cultivation—State Research Institute (IUNG-PIB).
The Lubelskie province (voivodeship), located in the eastern part of Poland, is one of the nomenclature of territorial units for statistics (NUTS)-2 administrative units of Poland (overall, there are 16 provinces in Poland). It is the third largest province by area (2.5 million ha), divided into 20 districts (poviats) and 211 NUTS-5 units. The main economic activity of the region is crop and livestock farming, thanks to the good soil and climate conditions, as well as well-developed food production infrastructure. The agricultural area of the province constitutes 66% of the total area, out of which 75% is dominated by arable land. Although the province represents a proper natural arena for the development of biogas plants, the small sized and highly fragmented farms over the region withstand the development of decentralized (on-farm) biogas plants. In the last decade, large scale biogas plants were established in the Lubelskie province. It has been reported that 7 biogas plants are operating in this province, with total capacity of 9859 kWel in 2019 (average of 1408 kWel), based on registration of agricultural biogas producers [24].
Data included farm-level livestock population (average values of four quarters of a year) and the utilized agricultural area in Lubelskie province in 2016. In this study, data associated to dairy and pig populations were derived and then aggregated to the level of gmina (municipality), a basic unit of administrative division in Poland; according to Eurostat, administrative units’ classification equal to NUTS-5 (ex local administrative units (LAU)-2). The recorded number of livestock farms in Lubelskie in 2016 was 75,600, while the number of farms having either cattle or pig or both cattle and pig was 74,232.

2.2. Manure Potential and Quality

Accurate estimation of the quantity and nutrients in excrements is essential for the efficient design of manure processing and treatment, as well as quality of the final product as a green-fertilizer substitute for chemical fertilizers. In addition, manure management alternatives, such as anaerobic digestion, are influenced by manure characteristics, the quantity of manure production and its distribution at the regional scale. This section describes the method for estimating characteristics of manure in Lubelskie.
As-excreted manure can be estimated on two bases: (I) dietary feed, nutrient intakes and animal characteristics; and (II) manure per animal coefficients derived from the literature and standards. The latter is critical due to the potential changes in animal performance related to the genetics, availability of feeding stuffs, and quality of feed. However, the former is more appropriate when farm-specific data for herd management and feeding ration are available. Nevertheless, since the farm-level data of dietary and animal characteristics were not available for the Lubelskie province, the second option was applied, and the relevant coefficients were derived from literature.

2.2.1. Cattle Manure Supply

Table 1 presents the profile of cattle farms in Lubelskie. The data included the number of livestock units (LSU). Manure potential and nutrients content were calculated based on the population of animals in heads. By definition, LSU [25] is a unit equivalent of one adult dairy cow producing an annual amount of 3000 kg of milk. Thus, for dairy cow, the conversion rate is 1; for dry cow, it is 1; for heifer, it is 0.8; and, for pig, it is 0.4 (an average of 0.8 for breeding sows and 0.3 for other pigs). The collectable share of animal excrements was not found in literature for Poland; however, there are studies which indicate 75% for cattle manure and 90% for pig manure [26]. In this study, it was assumed that all manure can be collected. The detailed calculation methodology and equations used are presented in Table 2 and Table 3.
For estimating dairy manure quantity and characteristics, equations based on animal characteristics and milk quality were used [30,31] (Equations (1)–(5)). Estimating the nutritional quality of excreted manure is essential both for the accurate design of a biogas plant and the quality assessment of the anaerobic digestion by-products. Based on Nennich et al. [32], it is recommended to estimate manure and nutrient excretion values associated with the relationship between feed intake, milk production (nutrient use), and nutrient excretion. Nitrogen (N) and phosphorus (P) are present in manure as various inorganic and organic compounds and they play a key role in soil amendment. Surpluses of N and deficiencies of P in Poland render N and P balances an essential part of the decision support systems in agriculture and as a fundamental agri-environmental indicator (AEIs) [30]. In Lubelskie, the average surpluses of N and P balances were about 38.7 kg N ha−1 and 2.4 kg P ha−1 [31,33].
The N and P content of manure were estimated according to Equations (6)–(11) (Table 3).

2.2.2. Pig Manure Supply

As mentioned above, farm-level data including farm size categories in terms of the number of livestock units per farm were available for the Lubelskie province. The data for pig were not differentiated into pig groups. No common free-range housing system is assumed for pigs; therefore, all manure was assumed to be collected for bioenergy production. Table 4 presents the key characteristics which were used in the analysis.

2.3. Bioenergy Potential of Manure

Volatile solids (VS) (solids minus ashes) of manure are the organic material in livestock manure that primarily determine the biogas yield and consist of both biodegradable and non-degradable fractions [38]. As stated previously, biogas is derived from manure via anaerobic digestion; subsequently, it generates electricity and heat through coupling methane at a combined heat and power (CHP) unit.
The technical potential of manure was estimated by Equations (12)–(16) (Table 5). VS in manure are decomposed by microorganisms in a warm anaerobic environment. The rate of VS flow was determined from the manure total solid (TS) fed into the digester and the VS content of that dry matter (TS) (Equation (12)). Conversion coefficients were utilized on the basis of the animal category and per kg of total solids (TS) [39] (Table S1).
The amount of methane produced is a function of methane productivity (Equation (8)). Methane productivity from VS is not expected to vary substantially; however, it is dependent on manure characteristics (Table S2). Biogas generally contains almost 65% methane and 35% carbon dioxide on a volumetric basis. Therefore, the biogas production rate was estimated by Equation (14). The biogas leakage was assigned 1% and is further explained in Section 2.5.
A mesophilic fermentation process is most often observed in the study region [10]. Moreover, electricity and heat were estimated by assuming that methane fuels a combined heat and power (CHP) unit. On this basis, a basic parameter for estimating the electricity and heat potential is the energy conversion efficiency dependent on the scale of production. An average size CHP with electrical power of maximum 1 MW, electricity and heat conversion efficiency of 40% and 44%, respectively, and 8760 full load hours represents the typical biogas plant in the region [40]. This study assumes the digestate yield of the AD is 93% of the feedstock mass.
Electricity and heat production rate are functions of the calorific value of biogas and efficiency of electricity/heat generation (Equations (15) and (16)).

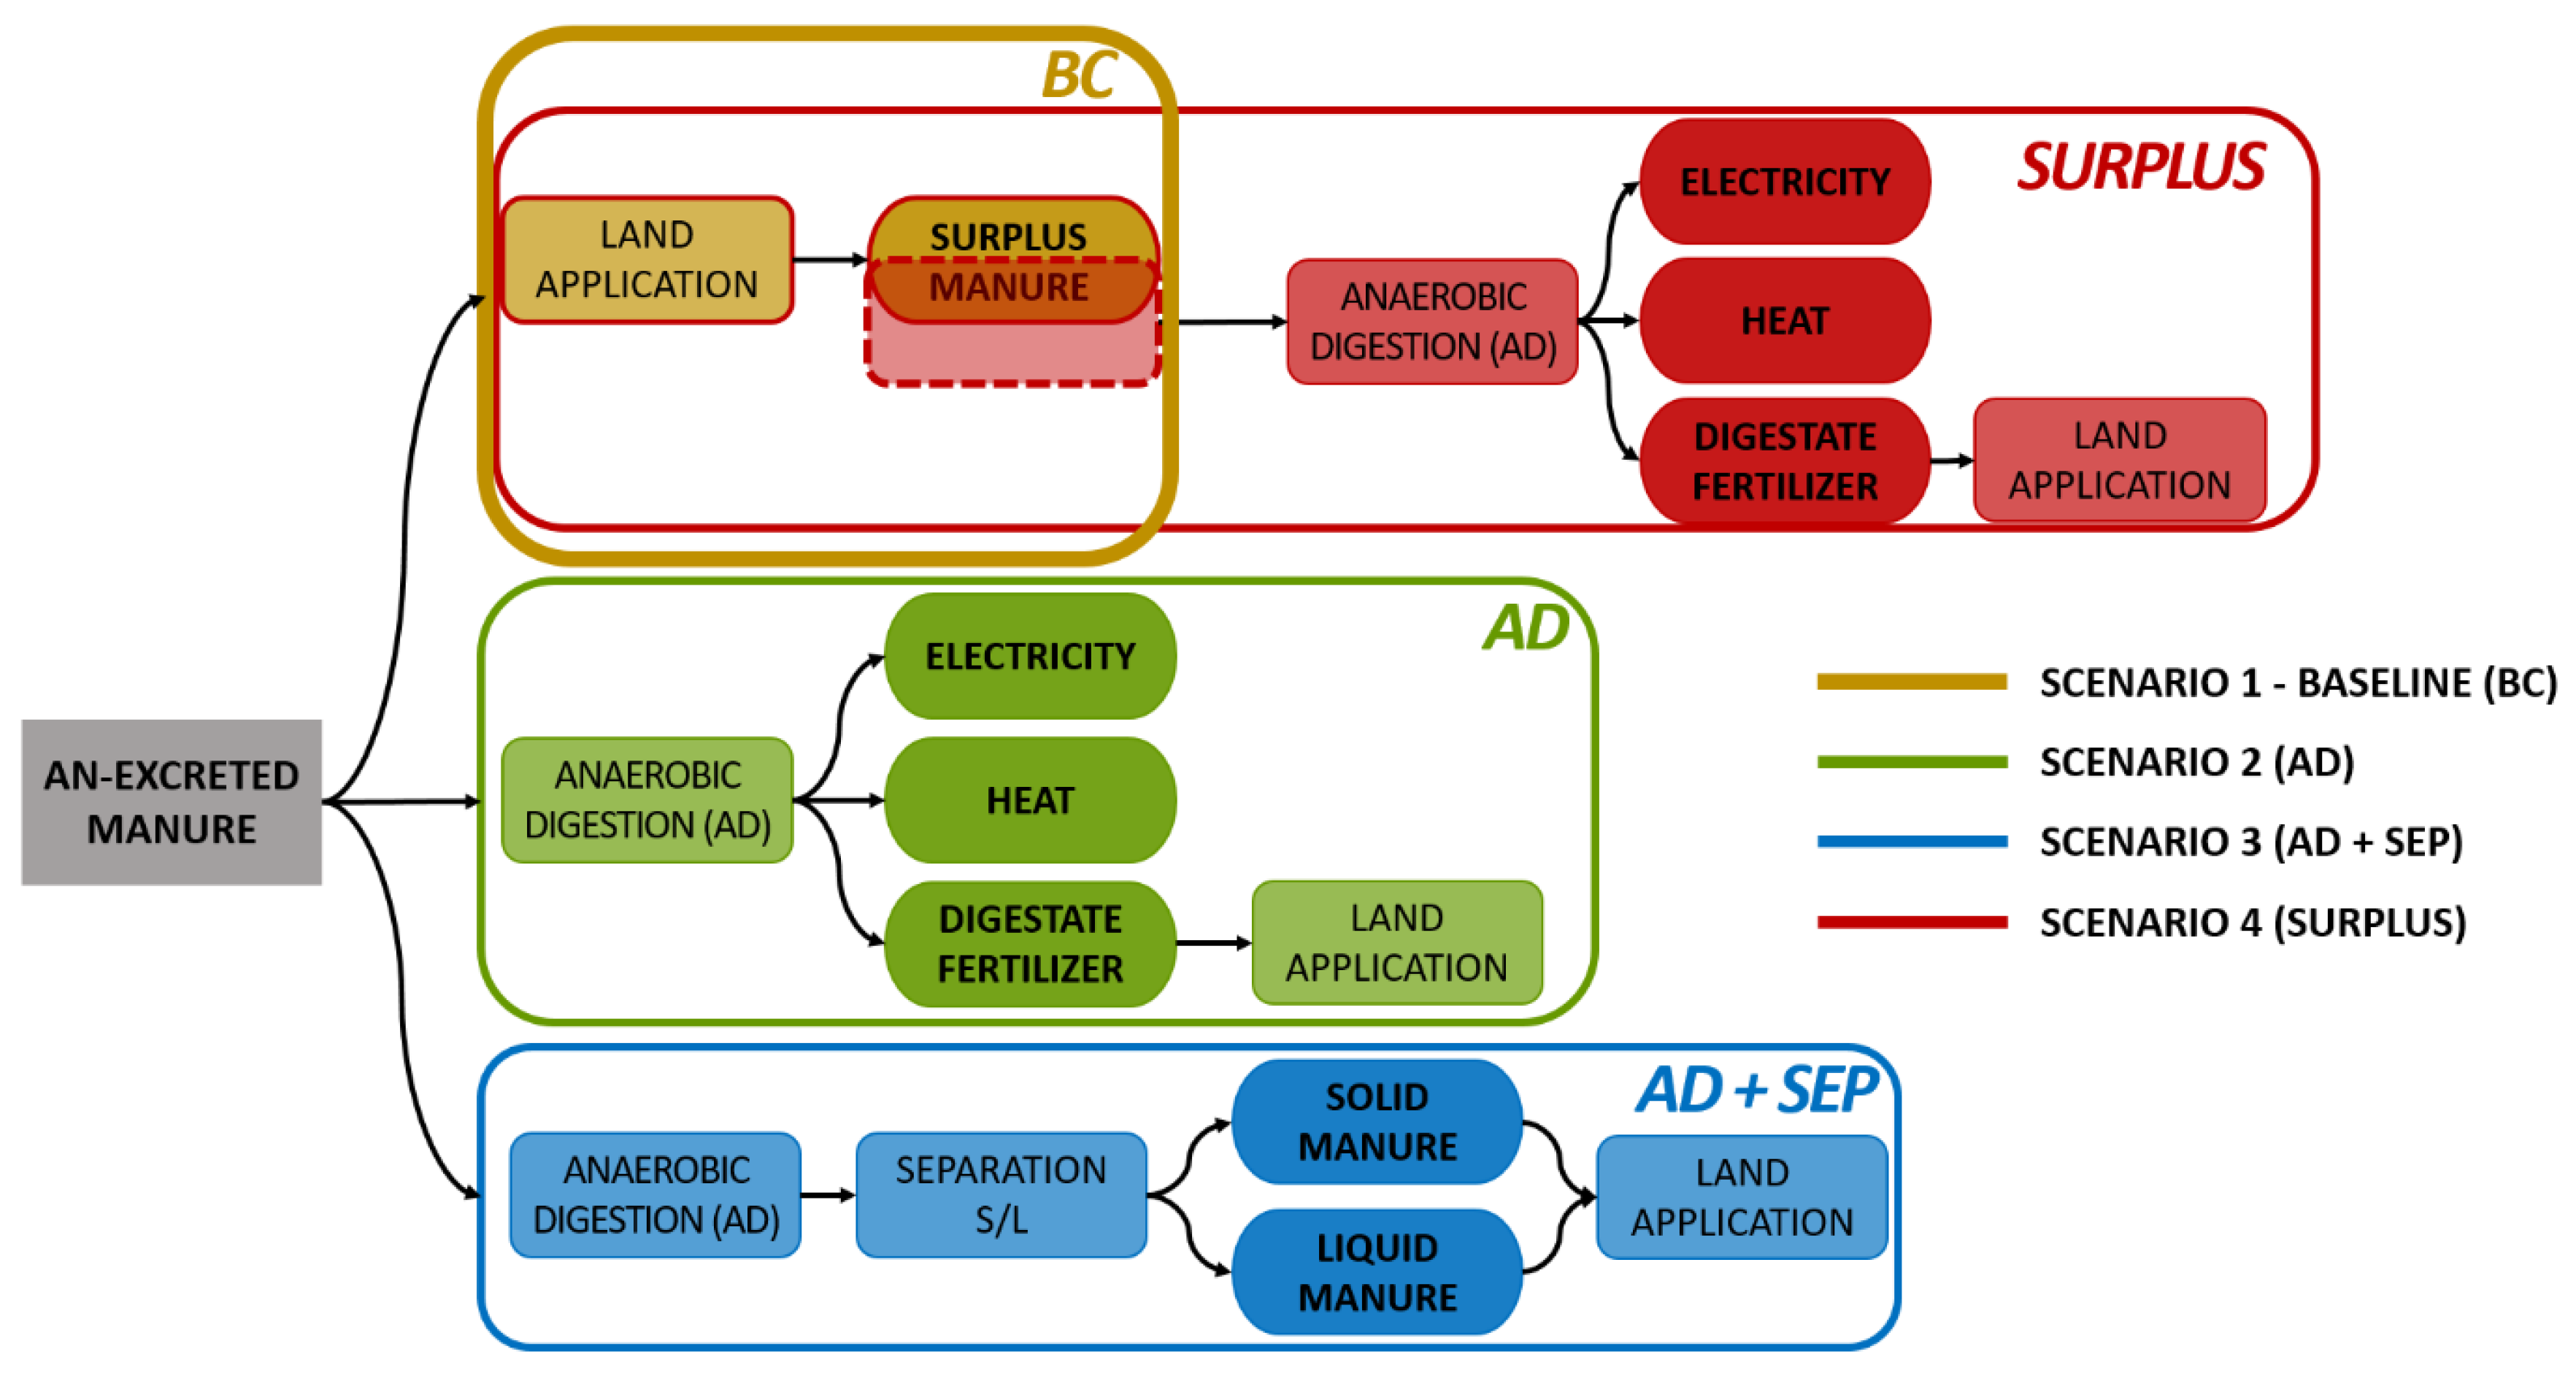
2.4. Scenarios for Bioenergy Production from Manure

To calculate the manure surplus, an annual limit of 35 t manure per ha (assuming the N content of 5 kg N t−1 and the maximum dose limit of 170 kg N ha−1 according to the Nitrates Directive [23]) must be applied. For each farm in the Lubelskie province, the surplus in manure production was calculated according to Equation (17).
S u r p l u s   =   ( N     M E )     ( U A A   35 ) ,
where N is the total number of livestock (LSU), ME is the average manure excretion (t LSU−1 y−1), UAA is the utilized agricultural area (rural land declared by the farmers as area for agricultural activity) (ha), and 35 is the assumed manure limit (t ha−1). From an agricultural point of view, it is advisable that the entire stock of residues from livestock production is used as natural fertilizer. These residues are beneficial both for the supply of yield-generating elements (N, P), as well as organic matter improving the physical and chemical properties of the soil, which makes it more fertile and more resistant to weather conditions (e.g., droughts, torrential rains). However, too much manure application may result in increased GHG emissions, which is why the limit set in the Nitrates Directive has been adopted in agricultural practice. Farms with manure surplus are obliged to sell it. In practice, manure is most often bartered for straw. In both cases, they are mass goods, so it should be assumed that they are transported in the immediate vicinity with the use of farm equipment (tractors, trailers). For this reason, it was assumed that this distance should be no more than 10 km. Another method to “get rid” of surplus manure is to use it for the production of biogas. Due to the fact that the digestate obtained in a biogas plant (as a by-product) is also a valuable fertilizer, it can also be assumed that all available manure resources will be used for biogas production.
All the above assumptions were taken into account in the four scenarios analyzed in this paper, which were considered to explore the benefits of biogas production in the Lubelskie province as depicted in Figure 1. The first scenario is the Base case scenario (BC), where direct application of manure on land is assumed. In scenario 2 (AD), biogas production was assumed as a manure treatment method, while the fermented digestate was transported to farms (within a distance of 10 km). Scenario 3 (AD + Separation (Sep)) involves solid-liquid separation of the AD digestate, transport of the solid manure to land application (within a distance of 10 km) and use of the liquid fraction as a supplement to irrigation water. It should be noted that no economic value was assumed for the liquid fraction as effluent of mechanical separation. In scenario 4, a reverse condition of previous scenarios was assumed, i.e., only the surplus manure from land application can be transported to produce bioenergy. For this scenario, only holdings (cattle or pig farms or both cattle and pig farms) having more than 2.5 LSU per year, that is about 37% of all livestock producers in the Lubelskie region, were taken into account. The remaining 63% are mainly family farms which apply manure on their own farms and are not willing to transport it to biogas plants.
Spatial analyses were carried out in the geographic information system (GIS) environment with the use of open license software. Geoprocessing of data was performed in the QGIS (version 3.10) software. PostgreSQL (version 10.12) was used to aggregate the data into databases. The results of the assumed scenarios were calculated using SQL query procedures. Generalized results for NUTS-5 were visualized in QGIS 3.10 Desktop. The analyses were carried out in the GIS laboratory of the Department of Bioeconomy and System Analysis, which was developed thanks to the project “New Strategies on Bio-Economy in Poland” at http://bioecon.iung.pulawy.pl/en/. Spatial analyses, from the farm scale to the NUTS-2 scale, are presented in diagram S1 (Supplementary Material).

2.5. Ecological Added Value

Ecological analysis was performed in order to determine the added value of bioenergy production. Some of the most important environmental implications of agricultural biogas production and utilization in the target region were quantified. More specifically:
  • avoided carbon dioxide (CO2) emissions from replacing fossil fuel sources, e.g., to produce electricity;
  • methane (CH4) leakage from AD installations; and
  • nitrous oxide (N2O) emissions from land application of manure.
Emissions were converted to the 100-year time horizon global warming potential (GWP) using the appropriate coefficients (265 and 34 kg CO2eq for N2O and CH4) [41,42].
Avoided CO2 emissions were estimated by the coefficient outlined as −0.9 kg CO2eq kWh−1 of the electricity generated [43]. Avoided emissions from digested (treated) manure were categorized as the emissions associated to the land application of untreated manure and storage of manure during winter (1 December to 28 February).
To estimate the total avoided emission of biogas production, it is necessary to take into account the fact that biogas production causes emissions due to methane leakage from the digester and CHP (1% and 1.5%, respectively) [44,45].
Following manure recycling method in any system of manure management, nearly all the manure will be applied to land [46]. N2O is produced in soils through the nitrification and denitrification processes. Nitrification is the aerobic microbial oxidation of ammonium to nitrate, and denitrification is the anaerobic microbial reduction of nitrate to nitrogen gas (N2). N2O emissions are normally measured in two forms: direct and indirect from land application of manure [47]. In this study, both forms of N2O emissions were estimated using the methods derived from De Klein et al. [48], Tier 2 (Equations (18) and (19) in Table 6).

2.6. Economic Added Value

The economic benefits from bioenergy production were calculated for the potential co-benefits of recycling manure to biogas compared to the BC scenario. These benefits were categorized into three groups: (1) benefits for farmers, which include the avoided costs of purchasing chemical fertilizers and electricity from regular grid; (2) benefits for biogas plants, which are caused by selling the generated electricity and by-products of biogas production process to the agricultural farms; and (3) total benefits from the activities. For this purpose, the benefits of scenarios were calculated independently of the size and location of AD plants. For AD plants, it was assumed that each NUTS-5 will provide the manure required for appropriate AD plants, provide its electricity and fertilizer needs, and sell the surpluses. The own electricity consumption of CHP was assumed to be 6% of the generated electricity [49]. Economic analysis was performed using Equations (20)–(23) provided in Table 7 and the price parameters listed in Table S3 of the Supplementary Material.

3. Results

3.1. Manure Production and Characteristics

Based on the data of cattle and pig farms, it was estimated that, on average, there have been 1375.3 LSU of cattle and 422.5 LSU of pigs per NUTS-5 in this province. The leading poviat with highest livestock population was Łukowski (LLU) with 47,247.6 LSU of cattle, followed by Bialski (LBI) with 35,463.5 LSU and Radzyński (LRA) with 20,439.6 LSU. The estimated population of cattle and pig, stocking rates, manure production rate, and its characteristics are shown in Table 8.
The total amount of manure produced was estimated to be about 7.56 Mt of ME throughout the year, with the contribution being 81% from cattle and 19% from pigs (see Table 8). The N and P content of cattle manure was accounted for 4.56 g N kg−1 ME and 1.6 g P kg−1 ME, and, for pig, for 3.5 g N kg−1 ME and 0.7 g P kg−1 ME. Given that the estimated P demand was 14.4 kg P ha−1 in the Lubelskie province [33], the results of the present study indicated that P contained in manure (19.87 kg ha−1) could satisfy, to some extent, the need of agricultural sector in case that manure is recycled.

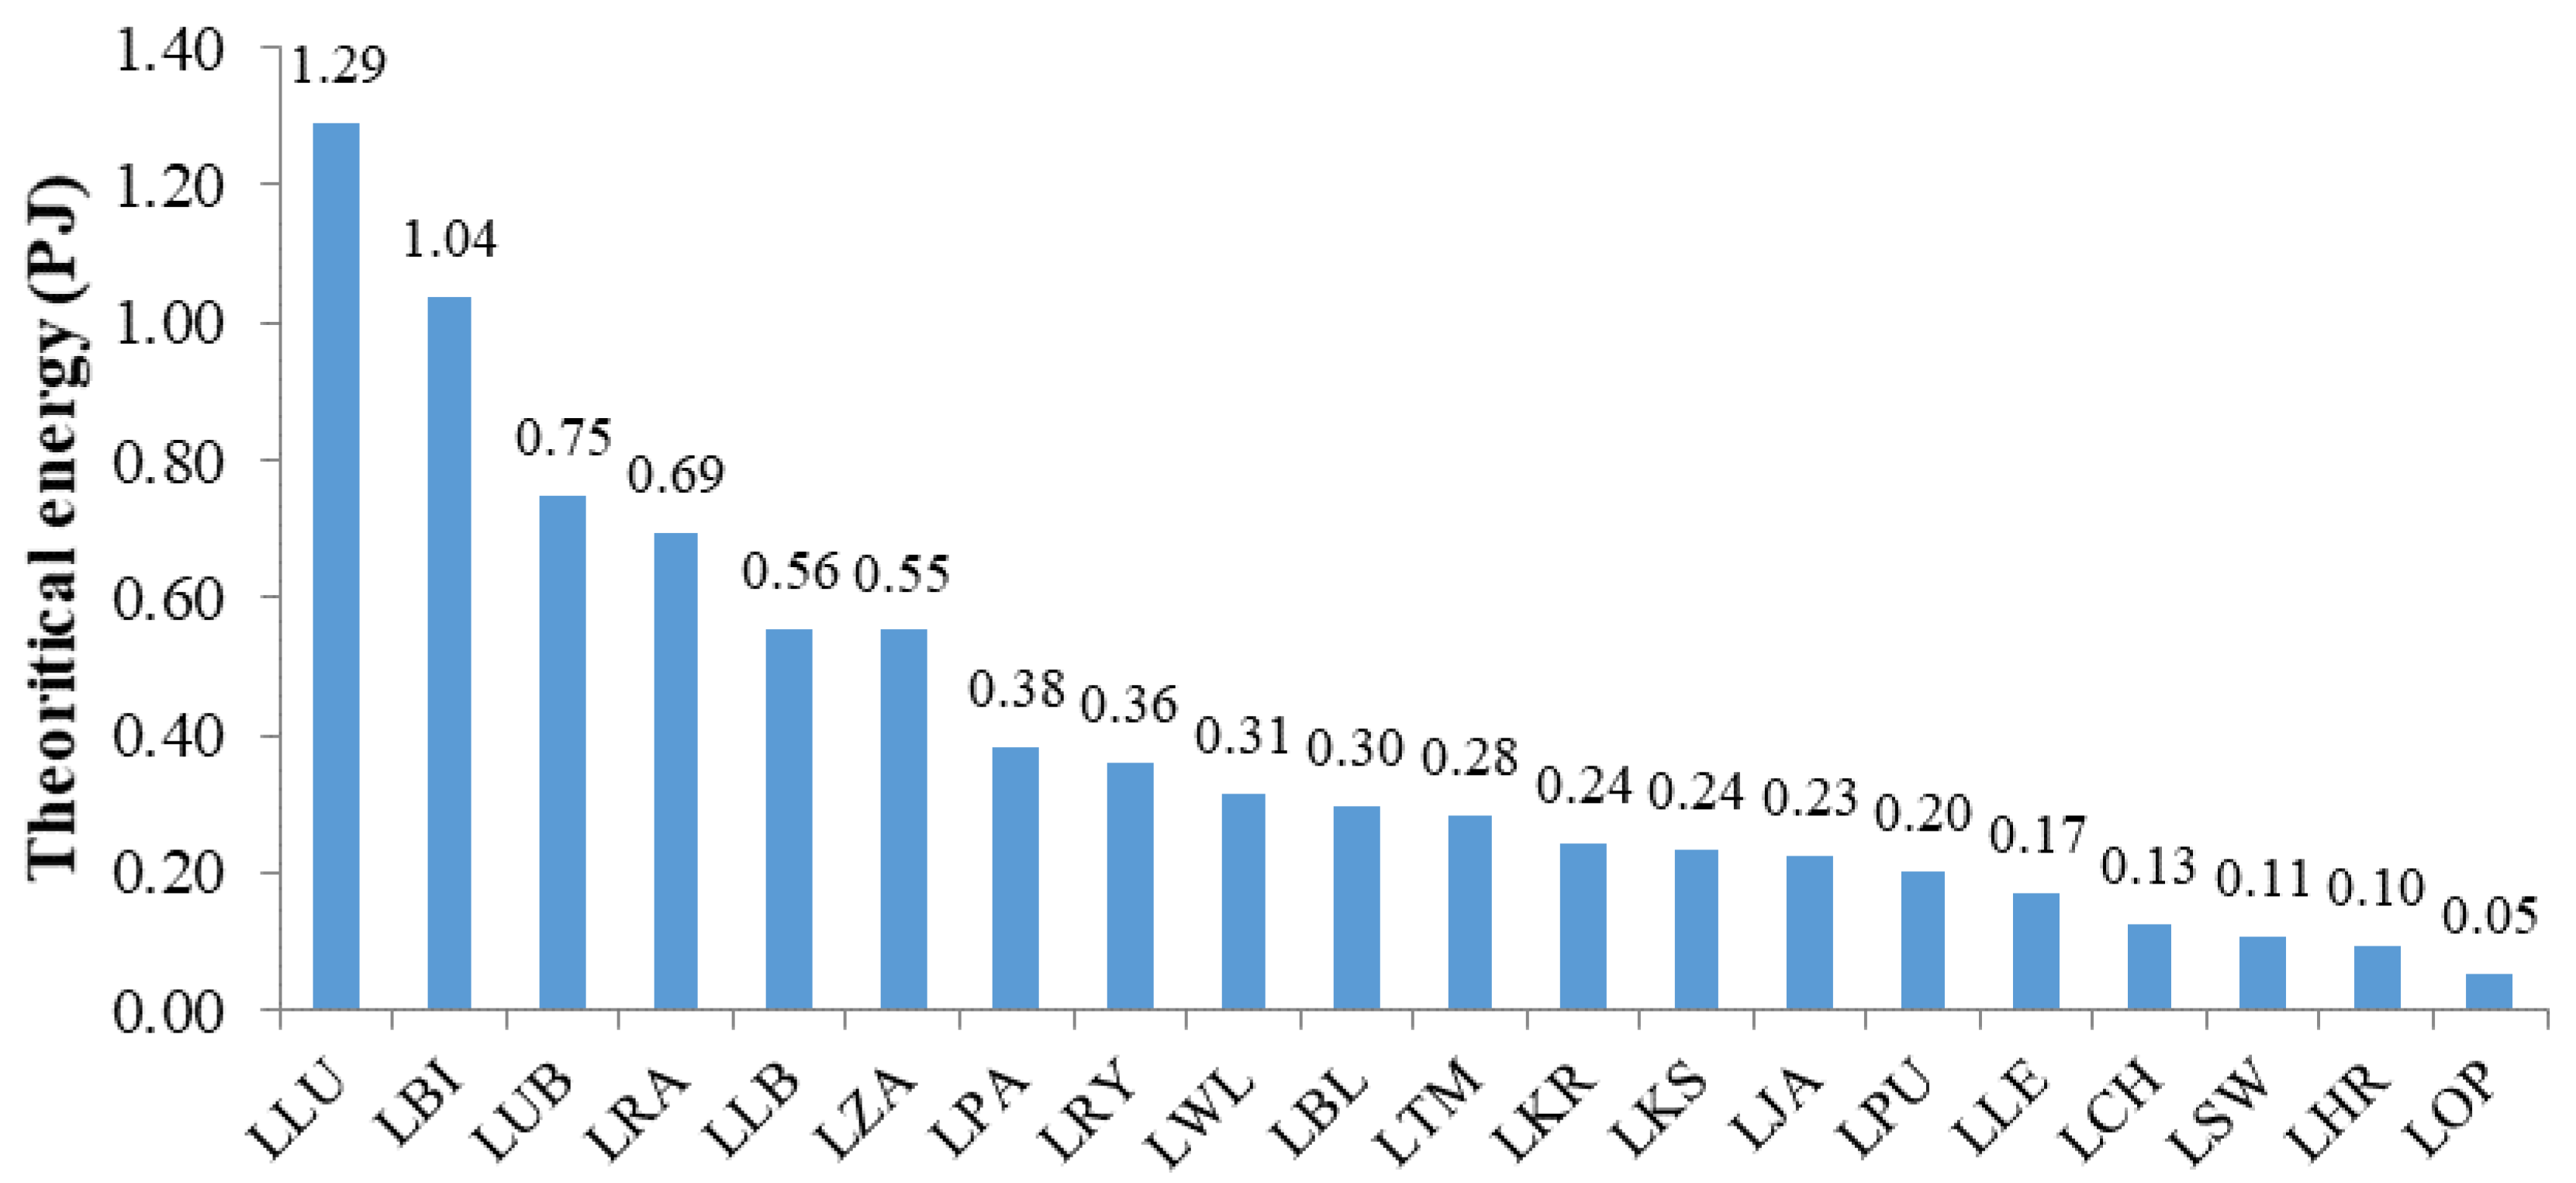
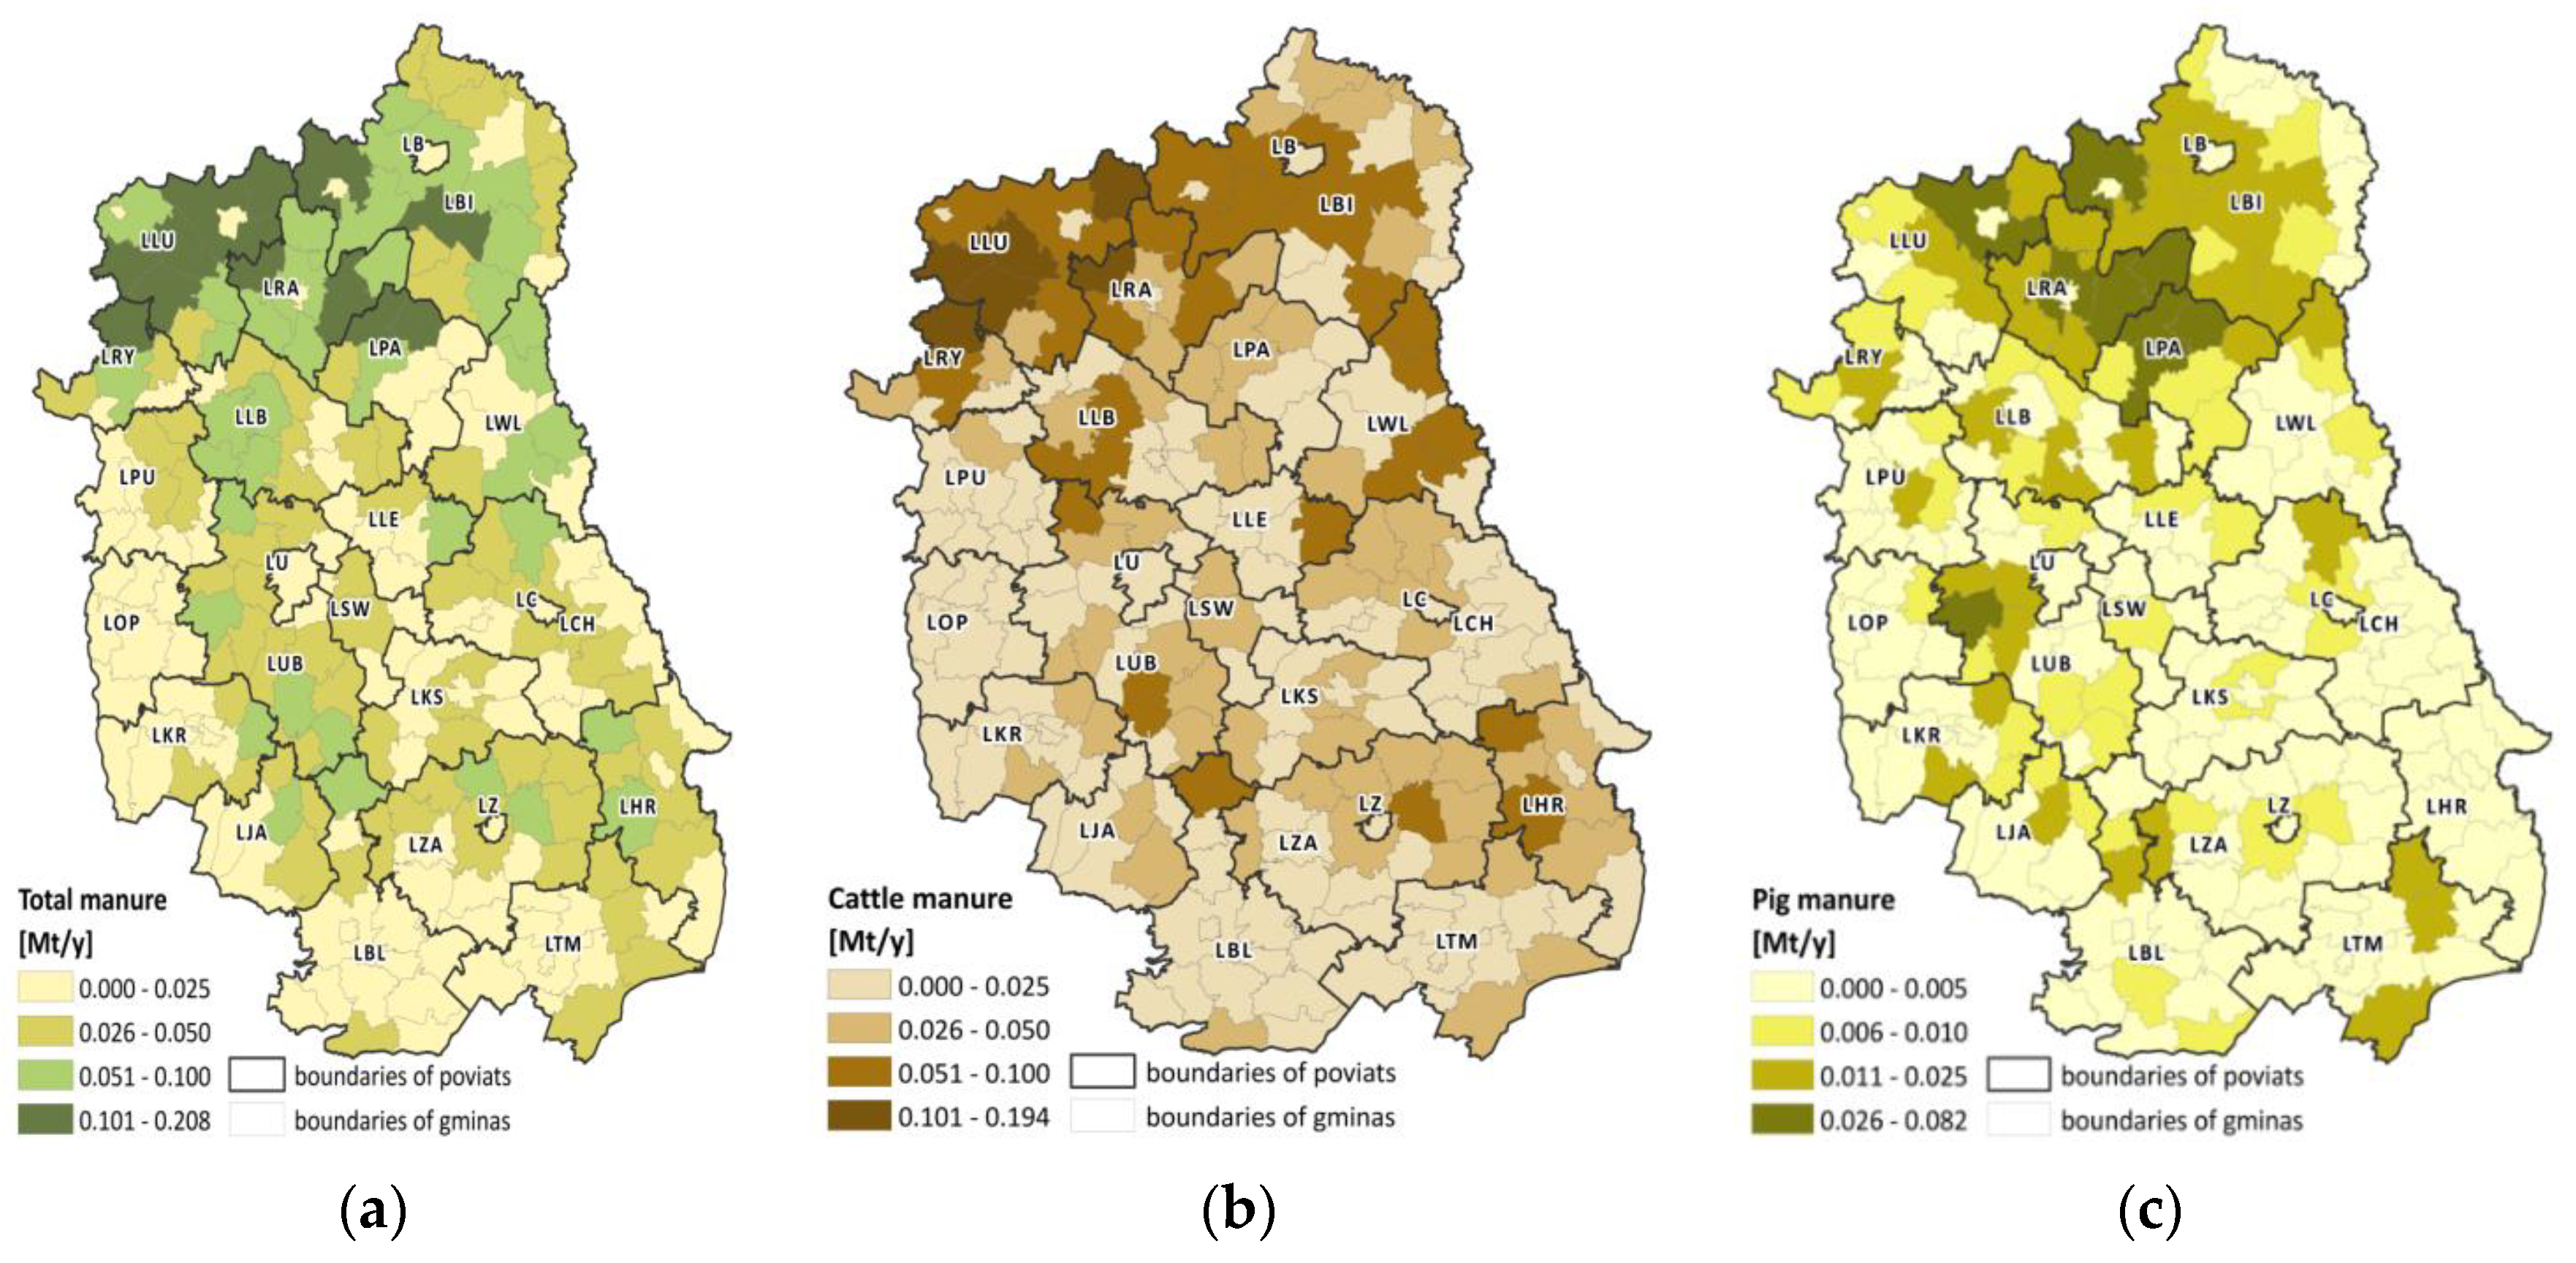
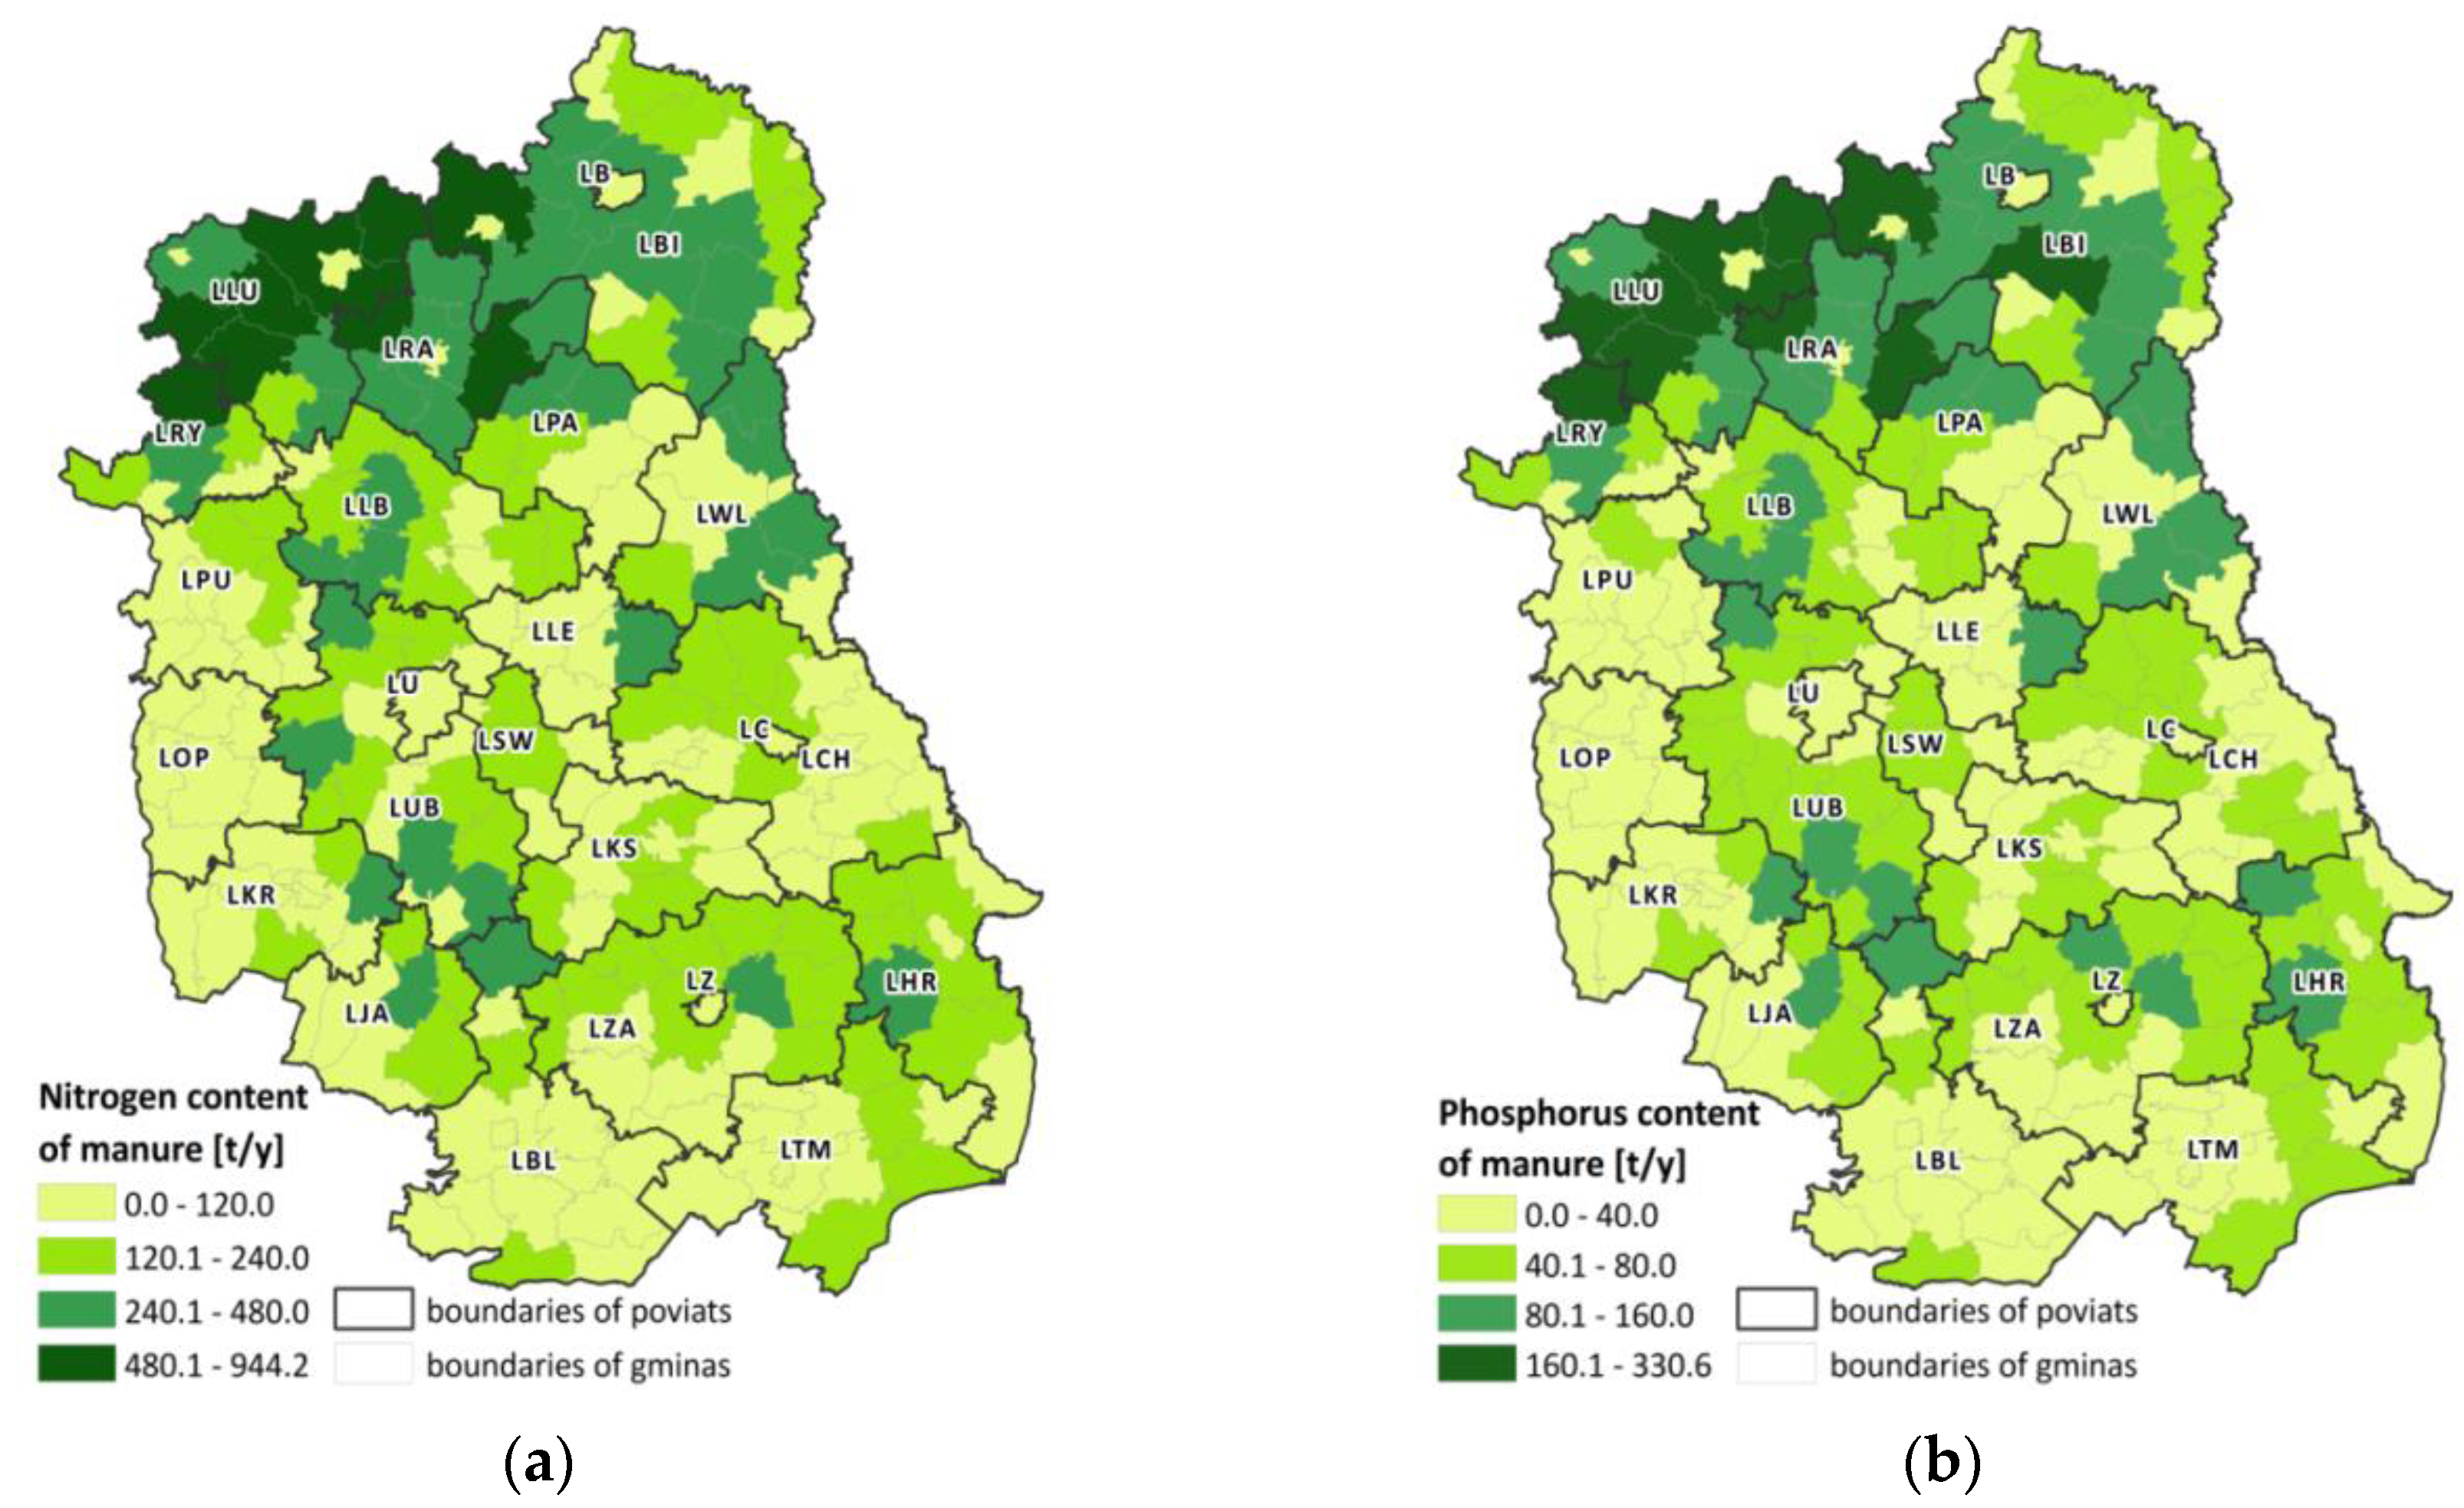
3.2. Spatial Distribution of Manure, Nutrients and Bioenergy Potential

The calculated amount of manure production, if collected entirely from the livestock husbandry units, has a bioenergy potential of about 378 million m3, which contains 346 million m3 of CH4. This theoretic potential could generate 907 GWhe of electricity and 998 GWth of heat energy. In addition, 7.03 Mt of AD digestate may be further applied to arable land as organic fertilizer. Figure 2 shows the results for theoretic bioenergy potential at the poviat level. It should be noted that the amount of bioenergy production is strongly dependent on the energy conversion technology, i.e., the conversion efficiency of CHP. In Table 9, the results related to bioenergy potential of manure are presented.
The total amount of manure by animal type throughout Lubelskie province has been graphically illustrated in Figure 3a–c. Trzebieszów NUTS-5, with the highest manure production, is located in Łukowski (LLU) poviat, which accounted for about 3% of the manure potential of the province (Figure 3a). As bioenergy potential is perfectly correlated to the manure quantity, an identical map to Figure 3a is assumed. Cattle manure was mainly produced in the northern and north-western areas (Figure 3b). The main regions of pig manure production were found to be located in the northern part of Lubelskie (Figure 3c). The top four poviats, namely Łukowski (LLU), Bialski (LBI), Lubelski (LUB), and Radzyński (LRA), accounted for 44.4% of the total cattle and pig manure production. Currently, biogas is mostly produced in the north-east and south-east of the Lubelskie province. Considering that transporting manure over long distances may be uneconomic; therefore, new biogas plants should be located in the best possible place with easy access to raw material. Maps can be helpful in determining these locations.
The total values of manure N and P load in 2016 are illustrated in Figure 4. The average values of N and P load per unit of UAA are 63 kg ha−1 and 21 kg ha−1. As observed in the maps (Figure 3 and Figure 4), the predominant regions for bioenergy production are the ones with higher manure nutrients load, which indicates the necessity of manure (or digestate) transport to the areas with nutrients deficit. Thus, suitable areas for establishing bioenergy production plants are the areas with high concentration of feedstock and optimal transport distance and logistic network.

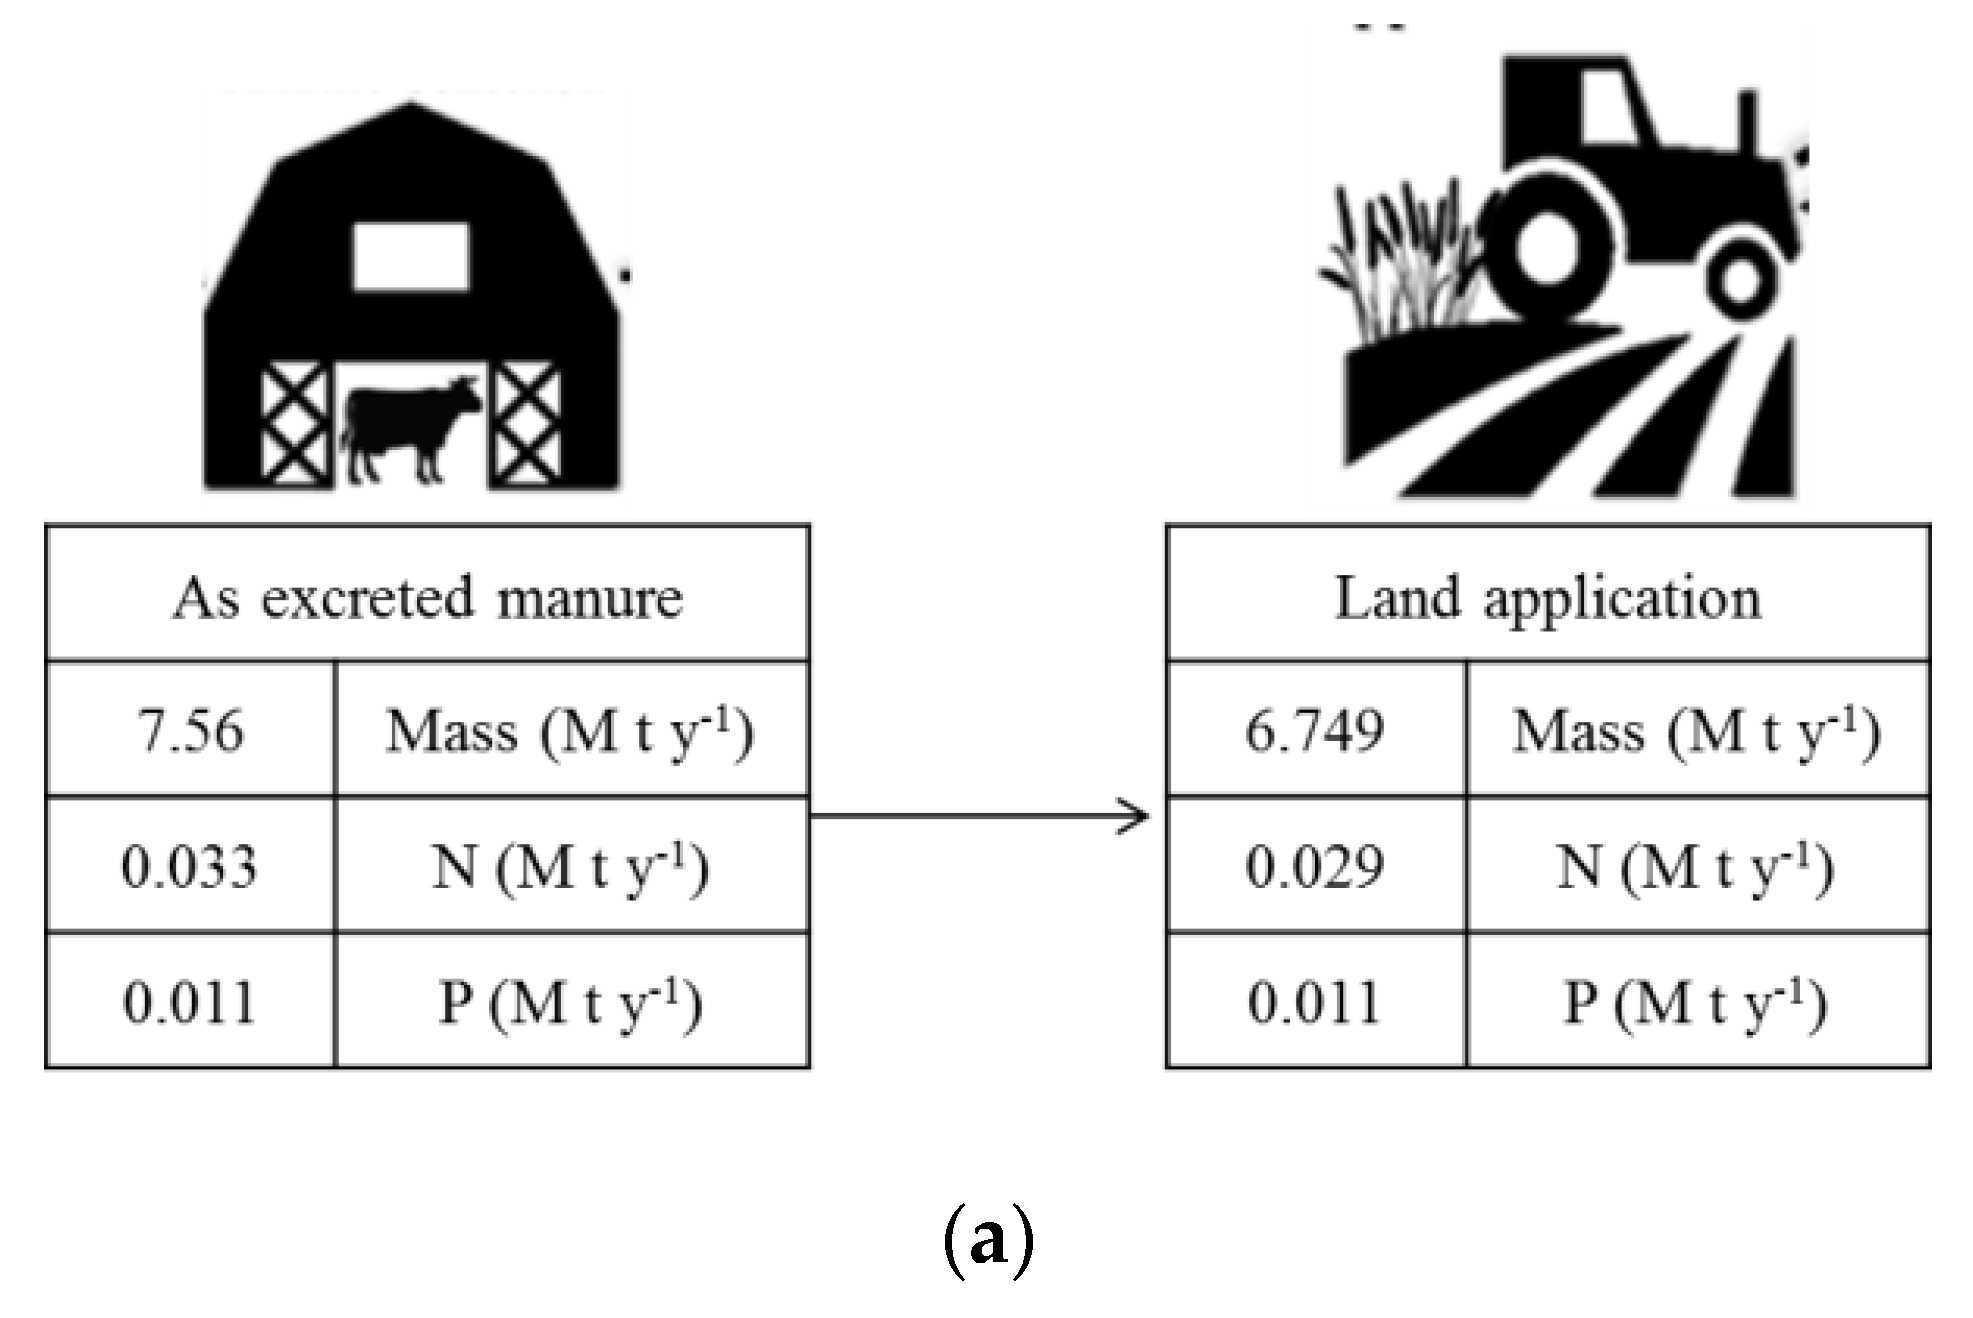
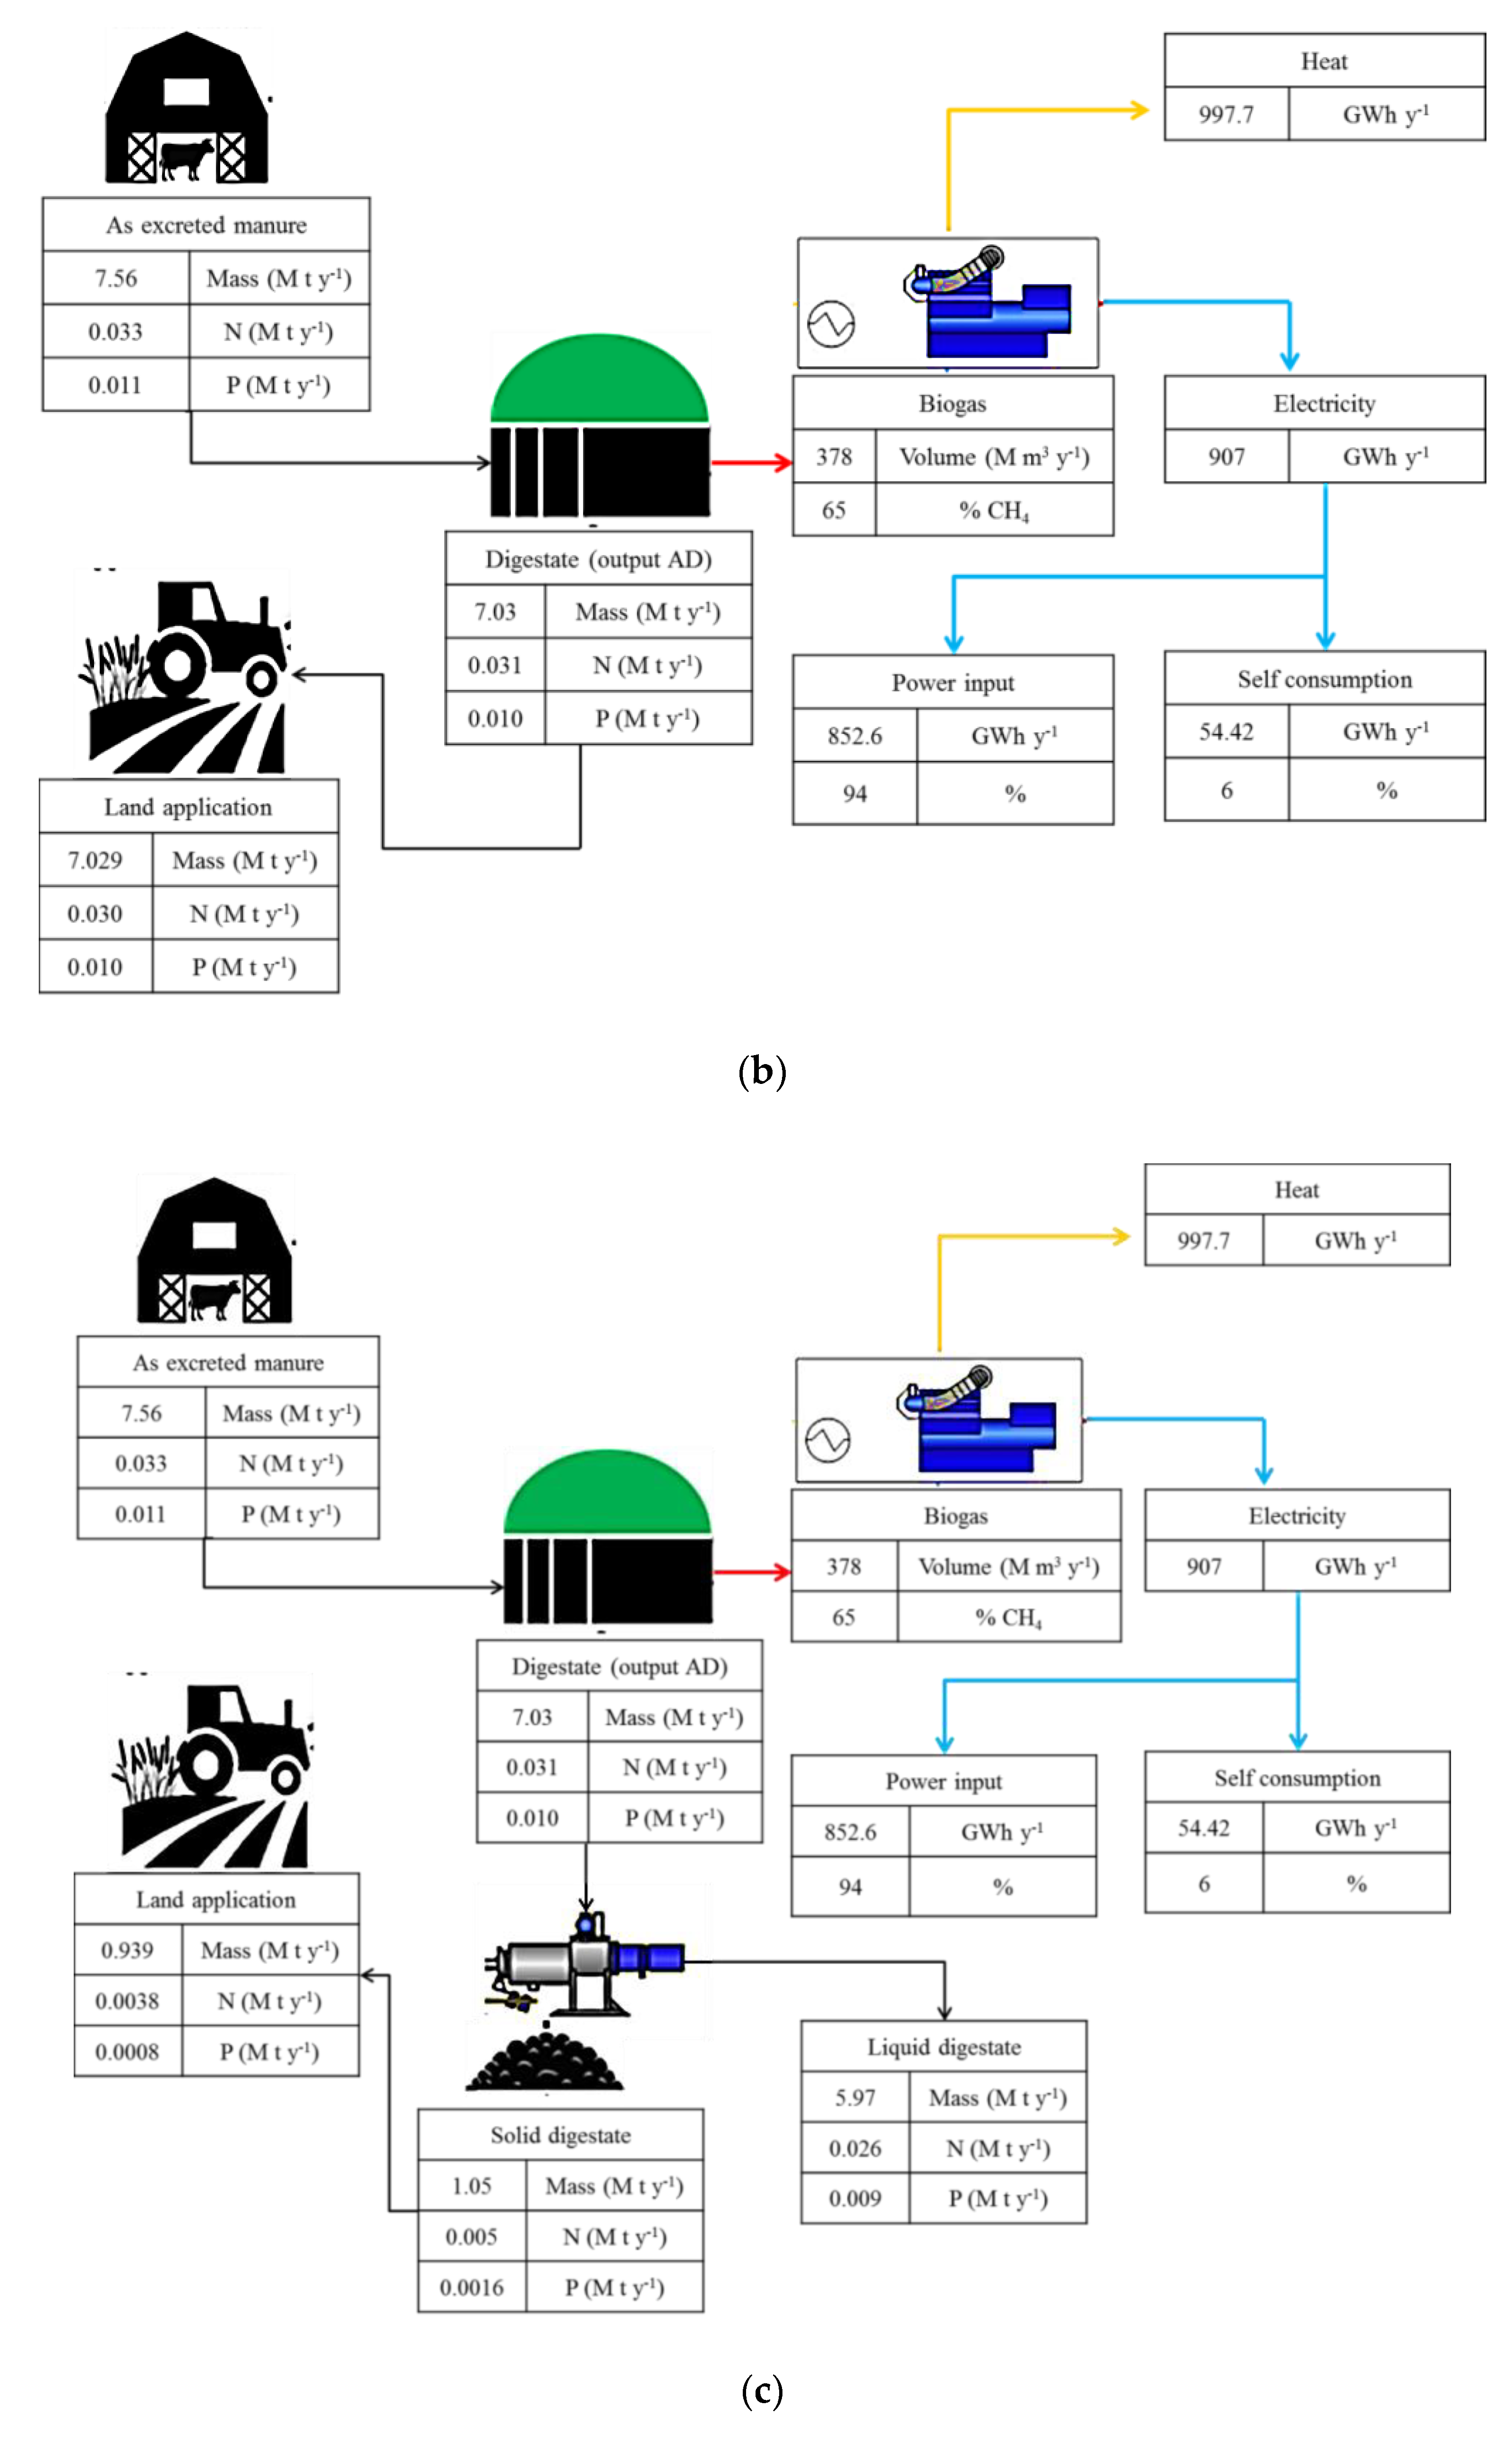
3.3. Mass Balance of Manure, N and P and the Energy Products of AD Process

To better illustrate the outcomes of each scenario, a mass balance of manure and flow of N and P was presented. The flow of outputs, i.e., energy and fertilizer, for each scenario, were presented to close the bioenergy production cycle. The emission of N2O and CH4 leakage was deducted from effluents of each step to represent the net available amounts. The results are depicted through flowcharts in Figure 5a–c.

3.3.1. Ecological Added-Value of Bioenergy

A comparison was carried out to show the changes of emissions released in scenarios with AD compared to the BC scenario where manure is only applied to land (Table 10). Avoided emissions were calculated by comparing the differences from the BC scenario. The total avoided GHG emissions accounted by adding CO2 emissions avoided by renewable electricity production, CH4 leakage from AD installations, and N2O released from soil related to application of manure were −0.78, −0.91, and −0.32 Mt CO2 eq. The BC scenario assumes that no treatment other than storage of manure for a specific time was performed on the excreted manure, whereas, in the AD scenario, the excreted manure was first digested, then electricity and heat were produced and the digestate was transported to be applied on land. As a result, ranking of scenarios indicated that scenario AD + Sep had higher avoided emissions when compared to the BC scenario. This result is highly influenced by the solid manure applied to land (there is less N distributed in the solid fraction of manure after S/L separation; therefore, N2O emissions are mitigated [50]). In contradiction to the above, scenario Surplus + AD contributed the least to avoiding emissions and obtained the third rank after the two other scenarios. Application of fresh manure (0.11 Mt CO2 eq) made the greatest contribution to the total avoided GHG emissions.

3.3.2. Economic Added-Value of Bioenergy

The financial benefits of bioenergy production compared to the BC scenario were computed and are presented in Table 11. The avoided costs from the AD scenario were approximately 36 M EUR (considering that the exchange rate of Polish Zloty to Euro was 0.23 on 10 May 2019), including the avoided cost of electricity provided from the generated bio-electricity (in the context of self-consumption), the cost of chemical fertilizer and transport of lower volume of manure instead of fresh manure. The benefit from selling the renewable electricity was 35.47 M EUR for AD and AD + Sep scenarios separately, which is much higher than in scenario 4. The positive values of fertilization costs are due to the fact that, for each scenario other than the BC, digestate/manure volume decreased on grounds of degradation during AD and/or prior to application of manure before treatment as in the last scenario. Therefore, differences with the BC scenario will result in the purchase of fertilizer to the extent of the decreased volume and might not contribute to avoiding costs. Based on these results, the scenario including AD (scenario 2) contributed the most to the added value of bioenergy chain of this study.

4. Discussion

4.1. Manure as a Biomass for Bio-Economy

Over time, livestock sector and, in particular, manure management strategies have become highly globalized or regionalized, with manure often produced in one country or region, and transported to another for land application. Little thought is given to implications of this paradigm in times of crisis, such as the current Covid-19 pandemic [3,51]. In such conditions, bio-economy could enhance the resilience of this sector to the potential threats. One solution is to respond to this crisis with policies that support circular economy through developing local bioenergy production.
To improve the accuracy of estimating manure production, in this study, detailed data were utilized in addition to the methodology based on the characteristics of animal manure production. For cattle manure, separate classifications of cattle are needed for lactating, dry, and replacement heifers. Most coefficients for manure and nutrients excretion found in literature are based on the body weight [28]. Recent findings have shown that a better predictor is the one reflecting the feed intake (excretion = intake − retention). Therefore, in this study, for lactating cattle that have the highest contribution to manure production, milk yield factor was used. Next to that, for pig manure, due to the dependency of equations available in literature on feed intake and pig groups, the most relevant coefficients were derived from the literature and the results were compared with standard values provided by the American Society of Agricultural and Biological Engineers (ASABE) [29]. The excreted manure and the nutrient content estimated for cattle differ more than the ones from literature, while, for pigs, a similar result with that of ASABE was obtained.
Besides the efforts put into this study, it is speculated that the manure production may be overestimated due to disregarding the non-collectable manure. On the other hand, nutrient content of manure may be underestimated because of the feed ratios more concentrated in N and P used especially at intensive livestock farming systems [52].
This study also focused on N and P loading rates in regions with higher bioenergy potential, which emphasizes the need for management strategies that best direct manure surpluses to the areas with deficiency. The substitution of organic fertilizer with inorganic one resulted in mitigation of GHG emissions and in economic benefits. Creation of local added values from bioenergy production may be a substantial reason to increase attention of regional policy makers.
The total amount of manure produced in the four major agricultural regions, namely Łukowski (LLU), Bialski (LBI), Lubelski (LUB), and Radzyński (LRA), accounted for about 3 Mt, which suggests a possibility of developing future large-scale biogas plants in these areas. These results are in agreement with those obtained by Oniszk-Popławska et al. [4].
Manure potential and the corresponding biogas yield were estimated using a spatial analysis method [53]. In Europe, France and Germany stand at the highest rank (with estimated manure potential as 214.3 and 175.7 Mt) with the highest theoretic biogas potential (3952 and 2907 Mm3 CH4). In the same study, the biogas potential in Poland has the sixth rank (1698 Mm3 CH4).
The total installed capacities have been estimated and shown to be significant in several EU countries, including France, Germany, UK, Spain, Italy, Poland, and Netherlands, while, in other countries, this contribution is much more reduced [53].
Biogas production and energy potential were estimated using a similar GIS-based approach for Greece at around 209 Mm3 and 4.5 PJ. The estimated biogas potential was an attempt to develop strategies for the commercial development of livestock manure as waste biomass feedstock in 2005 [54]. In Germany, the biogas production potential of manure was estimated to be significant, with 90 PJ yr−1. The largest share of this potential is from cattle droppings, with around 60%, followed by pigs accounting for around 30 PJ yr−1 [1]. In this study, the estimated biogas potential is in a good agreement with other studies in Poland and abroad. Igliński et al. [10] represented that the contribution of animal droppings in bioenergy potential including cattle slurry, pig slurry and poultry manure (25.19 PJ) is much higher than of other biomass sources (14.25 PJ). The central provinces showed the greatest potential due to larger livestock farms. Piwowar et al. [21] estimated that Lubelskie province with 11.71 MW is among the regions with relatively high capacity for biogas production after Pomorskie (21.41 MW), Warmińsko-Mazurskie (15.62 MW), Wielkopolskie (15.31 MW), Dolnośląskie (14.40 MW), and Kujawsko-Pomorskie (14.02 MW). A conclusion of these comparisons implied the high potential of Poland and the studied province to enhance the installed capacities of biogas production.
The results of this study in terms of the added value can be used as a drive for investors and policy makers to increase their support towards bioenergy investments. As it is suggested by other researchers around the world, incorporating negative effects, such as emissions from biogas plants, is crucial [55,56]. The avoided emissions from utilization of AD by-products (organic fertilizer), such as CH4 and N2O emissions reduction from replacement of organic fertilizers, showed the superiority of scenario AD over scenario BC. Anaerobic digestion (AD) has also been identified as an obvious bioeconomy pathway in regions where livestock manure management is an issue, besides being amongst the most efficient means of mitigation strategies [57,58]. The results of scenario analysis may give a better view to policymakers in the form of a decision-making toolkit that allows for comparative assessments. However, revealing trade-offs between alternatives, as well as other important indicators, such as the social and economic impact of the additional employment, may lead to better decisions.
Another influential factor for the viability of AD scenario will be the post-digestion process of digestate to separate it into solid and liquid fractions, whereby the transport of solid manure to farther fields and use of liquid fraction locally would be rational. Separation treatment has led to cutting transport costs of manure containing liquid up to 18%; however, less benefit was ultimately derived due to the reduced volume of manure diluted with liquid, which brings on increased logistics costs. Mechanical separation is most recommended when manure should be exported to the fields at relatively long distances [59]. As it was shown, the AD + Sep scenario is also an emission-reducing alternative. The same potential was reported by Pardo et al. [44] when manure is treated in one stage mesophilic AD. However, Sefeedpari et al. [50] showed higher outcomes of post-digestion practices, such as solid-liquid separation and composting, in terms of economic and environmental aspects.
The surplus manure remaining after land application to be sold for bioenergy production was found mostly in the northern regions of the province. In this area, more biogas plants or future centralized anaerobic digesters can be established. The potential use of the excess manure in biogas production was evaluated by Yazan et al. [60] in the Netherlands. It was concluded that manure can be better exploited if the supply surplus problem results in double dividend as economic benefits are possible by minimizing environmental impacts. In the Netherlands, the manure discharge cost affects the economic performance of farmers. This could be considered in policymaking for manure management in Poland, as well. In addition, the environmental regulations for surplus manure discharge could likely affect the farmers’ revenues. It is also crucial to note that farmers make their own independent decisions individually. However, they may also alter their farming practices, especially when given appropriate recommendations.
While improving and developing bioenergy policies, it is important to address the circular bioeconomy policies. In this respect, a key message of this study is that in case of using manure as a residue of agricultural sector, it is important to consider the use/need of such biomass for soil management (i.e., fertility and protection) and/or animal feed. This has been reflected in the scenarios of this study where land application of manure is highlighted either before or after biogas production. Energy is needed at all stages of bioenergy production; however, given the objective to reduce the use of fossil fuels, this means that renewable energy (including bioenergy) should be preferentially used to produce bio-based products. In this study, the self-consumption of biogas plant was taken into account in our calculations.

4.2. Farm Scale Modeling vs. Statistical Data (Validation and Statistical Assessment Issues)

Agricultural biomass is the largest resource available to the bioeconomy [19,22]. This regularity applies to most of the European countries. However, when analyzing the available resources, we see large differences in their estimation. Most of the research is based mainly on statistical data collected for large administrative units (NUTS-1, NUTS-2). In the case of analyzing manure availability (as biomass) for biogas production, the basic problem is the need to assume that manure will primarily be used as a natural fertilizer. If the modeling is based on statistical data (livestock units per ha of arable land), then, most often, the result of calculation shows total use of manure for soil conservation (e.g., results obtained in the BioBoost project [19,22]). Only farm scale data allow for real calculations of which manure resource can be used for biogas production. This approach allows modeling of various manure logistics scenarios, taking into account short supply and delivery chains “ate-to-gate” by the farmer. The current common agricultural policy of the EU forces all countries to keep detailed records of the allocation of aid funds for agriculture (direct and targeted subsidies) and thus to record the declared production. The opportunity to use farm scale data from the national database (ARMA) was used in this study. The obtained results showed the possibility of detailed analysis and modeling of agricultural production and waste potential for the real situation. Such models do not require validation because the input data is not a sample but the whole population. The pilot project presented in this paper will set directions for future development of this subject by the team of authors.

5. Conclusions

In Poland, the production of bioenergy is appreciated as a manure management method to provide environmental and economic benefits for agricultural-rural structures to effectively manage animal manure by producing electricity, heat, and organic fertilizer. Moreover, realizing the distribution of manure over a region may support regional policy makers in the investigation and planning of renewable energy options. In the time of the Covid-19 crisis, it is critical to take actions that provide strong and resilient food sectors, among which livestock sector plays an important role.
Manure from cattle and pig is intensively produced in the northern sub-regions. Regions with high N loading rate may pose environmental problems if abatement solutions are not pursued. Future recycling of manure through bioenergy production should be strengthened in the regions with high manure production, together with separation of digestate into solid and liquid fractions whereupon no nutrient is lost via leaching or gaseous emissions. The scenario analysis showed huge potential for environmental and economic added value of bioenergy production by means of captured emissions and avoided costs. At the same time, the effect of separation of digestate into solid and liquid fractions addressed a potential opportunity to cut transport costs of AD digestate to farms with manure deficiency. Future potential regions for biogas plants establishment were identified in the northern areas of the region with higher amounts of additional manure left after its land application as organic fertilizer.
This research was a particular study for the Lubelskie province in Poland, but the methodology can be used for other provinces and countries. The results of this study show that a model for optimization of manure logistics in biogas production and transport of the fermented digestate could be under focus in future works.
The presented analyses, already at this stage, concern a representative region in a EU country, but, considering the current development of IT technology and the data resources collected within the common agricultural policy (CAP), there are no barriers to apply this type of approach nationally or even throughout the EU. In this sense, this work shows new research directions but also the possibilities of creating decision support systems for institutions responsible for creating CAP and implementing or supervising the assumptions of this policy.
Recently, the Ministry of Agriculture and Rural Development ordered an expert opinion, the aim of which is to develop a uniform methodology for estimating all available and rational biomass resources from agriculture and to build tools based on spatial information systems for modeling these results. It was assumed that the input database would be based on the declarations of farmers applying for aid under the CAP (i.e., updated data with the same degree of detail as used in this case study). This approach will allow in the near future to develop a national system for monitoring biomass resources, which will take into account the current economic situation, the dynamics of agricultural production and the occurrence of unfavorable weather phenomena affecting crop production (e.g., droughts, spring frosts).

Supplementary Materials

The following are available online at https://www.mdpi.com/1996-1073/13/23/6266/s1, Figure S1: Diagram of Spatial analysis from farm scale to NUTS-2, Table S1: Parameters and coefficients for biogas potential, Table S2: Emission, volatilisation and leaching factors for soil N2O emissions, Table S3: Price parameters.

Author Contributions

Conceptualization, P.S.; Formal analysis, P.S. and M.K.; Methodology, P.S.; Resources, R.P. and A.J.; Visualization, P.S. and A.J.; Writing—original draft, P.S. and R.P.; Writing—review & editing, P.S. and M.B. All authors have read and agreed to the published version of the manuscript.

Funding

This work has been supported by “New Strategies on Bio-Economy in Poland—BioEcon” project, an H2020-EU project under the call: H2020 WIDESPREAD-2014-2, topic: ERA Chairs, grant agreement No 669062, at the Department of Bioeconomy and Systems Analysis, Institute of Soil Science and Plant Cultivation-State Research Institute (IUNG-PIB). Part of the work was done as part of the project: “New renewable energy technologies for sustainable development of rural areas and low-carbon agriculture TechRol”–contract number: BIOSTRATEG3/344128/12/NCBR/2017, financed by the National Centre for Research and Development (NCBR).

Acknowledgments

We would like to thank Małgorzata Wydra and Katerina Troullaki for her help with editing the English manuscript of this paper.

Conflicts of Interest

The authors declare no conflict of interest.

Abbreviations

ADAnaerobic digestion
ARMAAgency for restructuring and modernization of agriculture
ASABEAmerican Society of Agricultural and Biological Engineers
BCBase case
CAPCommon agricultural policy
CH4Methane
CHPCombined heat and power
CO2Carbon dioxide
GHGGreenhouse gas
GISGeographic information system
GWhGigawatt-hour
GWPGlobal warming potential
ITInformation technology
LAULocal administrative units
LSULivestock unit
MaxMaximum
MEManure excretion
ME.PManure excretion of pig
M EURMillion Euro
MinMinimum
MWMegawatt
NNitrogen
N2Nitrogen gas
N2ONitrous oxide
NE.PTotal nitrogen excretion of pig
NUTSNomenclature of territorial units for statistics
PPhosphorus
PE.PTotal phosphorus excretion of pig
SDStandard deviation
SQLStructured Query Language
TSTotal solids
UAAUtilized agricultural area
VSVolatile solids

References

  1. Scheftelowitz, M.; Thrän, D. Unlocking the Energy Potential of Manure—An Assessment of the Biogas Production Potential at the Farm Level in Germany. Agriculture 2016, 6, 20. [Google Scholar] [CrossRef] [Green Version]
  2. Lal, R.; Brevik, E.C.; Dawson, L.; Field, D.J.; Glaser, B.; Hartemink, A.E.; Hatano, R.; Lascelles, B.; Monger, H.C.; Scholten, T.; et al. Managing Soils for Recovering from the COVID-19 Pandemic. Soil Syst. 2020, 4, 46. [Google Scholar] [CrossRef]
  3. Gemmill-Herren, B. Closing the circle: An agroecological response to covid-19. Agric. Hum. Values 2020, 37, 613–614. [Google Scholar] [CrossRef] [PubMed]
  4. Oniszk-Popławska, A.; Matyka, M.; Ryńska, E. Evaluation of a long-term potential for the development of agricultural biogas plants: A case study for the Lubelskie Province, Poland. Renew. Sustain. Energy Rev. 2014, 36, 329–349. [Google Scholar] [CrossRef]
  5. Vlyssides, A.; Mai, S.; Barampouti, E.M. Energy Generation Potential in Greece From Agricultural Residues and Livestock Manure by Anaerobic Digestion Technology. Waste Biomass Valorization 2015, 6, 747–757. [Google Scholar] [CrossRef]
  6. Atelge, M.R.; Krisa, D.; Kumar, G.; Eskicioglu, C.; Nguyen, D.D.; Chang, S.; Atabani, A.E.; Al-Muhtaseb, A.H.; Unalan, S. Biogas Production from Organic Waste: Recent Progress and Perspectives. Waste Biomass Valorization 2018, 11, 1019–1040. [Google Scholar] [CrossRef]
  7. Woźniak, E.; Twardowski, T. The current state of bioeconomy in Poland. Acta Biochim. Pol. 2017, 63, 731–735. [Google Scholar] [CrossRef]
  8. Ronzon, T.; M’Barek, R. Socioeconomic Indicators to Monitor the EU’s Bioeconomy in Transition. Sustainability 2018, 10, 1745. [Google Scholar] [CrossRef] [Green Version]
  9. Loizou, E.; Jurga, P.; Rozakis, S.; Faber, A. Assessing the Potentials of Bioeconomy Sectors in Poland Employing Input-Output Modeling. Sustainability 2019, 11, 594. [Google Scholar] [CrossRef] [Green Version]
  10. Igliński, B.; Buczkowski, R.; Cichosz, M. Biogas production in Poland—Current state, potential and perspectives. Renew. Sustain. Energy Rev. 2015, 50, 686–695. [Google Scholar] [CrossRef]
  11. Igliński, B.; Buczkowski, R.; Iglińska, A.; Cichosz, M.; Piechota, G.; Kujawski, W. Agricultural biogas plants in Poland: Investment process, economical and environmental aspects, biogas potential. Renew. Sustain. Energy Rev. 2012, 16, 4890–4900. [Google Scholar] [CrossRef]
  12. Muradin, M.; Foltynowicz, Z. Potential for Producing Biogas from Agricultural Waste in Rural Plants in Poland. Sustainability 2014, 6, 5065–5074. [Google Scholar] [CrossRef] [Green Version]
  13. Ministry of Economy. Directions of Development for Agricultural Biogas Plant in Poland in 2010–2020. 2010. Available online: https://www.pigeor.pl/media/js/kcfinder/upload/files/Kierunki-Rozwoju-Biogazowni-Rolniczych-w-Polsce-na-lata-2010-2020.pdf (accessed on 3 September 2019).
  14. Act on Renewable Sources of Energy (“RES Act”), Act of 20 February 2015, Journal of Laws 2015 Item 478 as Amended. Available online: http://isap.sejm.gov.pl/isap.nsf/DocDetails.xsp?id=wdu20150000478 (accessed on 14 June 2019).
  15. Marks, S.; Dach, J.; Fernandez-Morales, F.J.; Mazurkiewicz, J.; Pochwatka, P.; Gierz, Ł. New Trends in Substrates and Biogas Systems in Poland. J. Ecol. Eng. 2020, 21, 19–25. [Google Scholar] [CrossRef]
  16. Ministry of State Assets. National Energy and Climate Plan for the Years 2021–2030. 2019. Available online: https://www.gov.pl/attachment/df8c4c37-808c-44ff-9278-676fb94add88 (accessed on 5 May 2020).
  17. Ministry of Energy. Energy Policy of Poland until 2040. 2019; p. 84. Available online: https://www.gov.pl/web/aktywa-panstwowe/zaktualizowany-projekt-polityki-energetycznej-polski-do-2040-r (accessed on 5 May 2020).
  18. Sun, B.; Zhou, B.; Bóna, A.; Pevzner, R.L. Feasibility analysis of drill bit tracking using seismic while drilling technique. ASEG Ext. Abstr. 2012, 2012, 1–4. [Google Scholar] [CrossRef] [Green Version]
  19. Hamelin, L.; Borzęcka, M.; Kozak, M.; Pudełko, R. A spatial approach to bioeconomy: Quantifying the residual biomass potential in the EU-27. Renew. Sustain. Energy Rev. 2019, 100, 127–142. [Google Scholar] [CrossRef]
  20. FNR. Guide to Biogas, from Production to Use; Fachagentur Nachwachsende Rohstoffe e.V.: Gülzow, Germany, 2012; p. 232. Available online: https://mediathek.fnr.de/media/downloadable/files/samples/g/u/guide_biogas_engl_2012.pdf (accessed on 3 September 2019).
  21. Piwowar, A.; Dzikuć, M.; Adamczyk, J. Agricultural biogas plants in Poland-selected technological, market and environmental aspects. Renew. Sustain. Energy Rev. 2016, 58, 69–74. [Google Scholar] [CrossRef]
  22. Pudełko, R.; Borzecka-Walker, M.; Faber, A. The Feedstock Potential Assessment for EU-27 + Switzerland in NUTS-3. Deliverable 1.2, Biomass Based Energy Intermediates Boosting Biofuel Production (FP7 Project). Available online: http://bioboost.eu/uploads/files/bioboost_d1.2_iung_feedstock_potential_vers1_0-final.pdf; 2013 (accessed on 3 September 2019).
  23. European Commission (EC). The EU Nitrates Directive (No. KH-30-09-235-EN-D). European Union 2010. Volume KH-30-09-235-EN-D. Available online: http://ec.europa.eu/environment/pubs/pdf/factsheets/nitrates.pdf (accessed on 3 September 2019).
  24. KOWR. Register of Agricultural Biogas Producers; KOWR: Warsaw, Poland, 2019; p. 7. Available online: http://www.kowr.gov.pl/uploads/pliki/oze/biogaz/Rejestr_wytw%C3%B3rc%C3%B3w_biogazu_rolniczego_z_dnia_19.02.2019_r.pdf (accessed on 3 September 2019).
  25. Eurostat, E.C. Glossary: Livestock Unit (LSU). Available online: https://ec.europa.eu/eurostat/statistics-explained/index.php/Glossary:Livestock_unit (accessed on 14 June 2018).
  26. Sorda, G.; Sunak, Y.; Madlener, R. An agent-based spatial simulation to evaluate the promotion of electricity from agricultural biogas plants in Germany. Ecol. Econ. 2013, 89, 43–60. [Google Scholar] [CrossRef]
  27. ARMA. Database for the Agency for Restructuring and Modernisation of Agriculture (ARMA); Institute of Soil Science and Plant Cultivation—State Research Institute (IUNG-PIB): Puławy, Poland, 2016. [Google Scholar]
  28. Polish Federation of Cattle Breeders and Dairy Farmers (PFCBDF). Assessment and Breeding of Dairy Cattle; PFCBDF: Warsaw, Poland, 2016. (In Polish) [Google Scholar]
  29. Borkowska, D.; Januś, E.; Polski, R. Reduction in body condition of cows after calving and their lactation yield. Acta Sci. Pol. Zootech. 2016, 15, 43–52. [Google Scholar] [CrossRef]
  30. Velthof, G.L.; Selenius, J. Agri-Environmental Indicators: Recommendations for Priority Data Collection and Data Combination; Publications Office of the European Union: Luxembourg, 2011. [Google Scholar]
  31. Tujaka, A.; Terelak, H. The balance of phosphorus in the agriculture of Poland. Pol. J. Agron. 2012, 9, 29–33. [Google Scholar]
  32. Nennich, T.; Harrison, J.H.; Meyer, D.; Weiss, W.P.; Heinrichs, A.J.; Kincaid, R.L.; Powers, W.J.; Koelsch, R.K.; Wright, A.P.E. Development of standard methods to estimate manure production and nutrient characteristics from dairy cattle. Anim. Agric. Food Process. Wastes IX 2013, 1. [Google Scholar] [CrossRef]
  33. Kopiński, J.; Tujaka, A.; Igras, J. Nitrogen and phosphorus budgets in Poland as a tool for sustainable nutrients management. Acta Agric. Slov. 2006, 87, 173–181. [Google Scholar]
  34. ASABE. Manure Production and Characteristics; American Society of Agricultural and Biological Engineers: St. Joseph, MI, USA, 2014; Volume D384.2 MAR2005 (R2014). [Google Scholar]
  35. Jørgensen, P.J. Biogas-Green Energy: Process, Design, Energy Supply, Environment. 8799224321; Researcher for a Day 2009. Available online: https://www.lemvigbiogas.com/BiogasPJJuk.pdf (accessed on 3 September 2019).
  36. Al Seadi, T.; Rutz, D.; Prassl, H.; Köttner, M.; Finsterwalder, T.; Volk, S.; Janssen, R. Biogas Handbook; Al Seadi, T., Ed.; University of Southern Denmark: Esbjerg, Denmark, 2008. [Google Scholar]
  37. Sánchez, M.; González, J. The fertilizer value of pig slurry. I. Values depending on the type of operation. Bioresour. Technol. 2005, 96, 1117–1123. [Google Scholar] [CrossRef] [PubMed]
  38. Sommer, S.G.; Petersen, S.; Møller, H. Algorithms for calculating methane and nitrous oxide emissions from manure management. Nutr. Cycl. Agroecosyst. 2004, 69, 143–154. [Google Scholar] [CrossRef]
  39. Rotz, C.A.; Corson, M.S.; Chianese, D.S.; Montes, F.; Hafner, S.D.; Bonifacio, H.F.; Coiner, C.U. Integrated Farm System Model, Reference Manual; USDA-Agricultural Research Service: Beltsville, MD, USA, 2016; Version 4.3. [Google Scholar]
  40. Lansche, J.; Muller, J.D. Life cycle assessment of energy generation of biogas fed combined heat and power plants: Environmental impact of different agricultural substrates. Eng. Life Sci. 2012, 12, 313–320. [Google Scholar] [CrossRef]
  41. Pishgar-Komleh, S.H.; Akram, A.; Keyhani, A.; Van Zelm, R. Life cycle energy use, costs, and greenhouse gas emission of broiler farms in different production systems in Iran—a case study of Alborz province. Environ. Sci. Pollut. Res. 2017, 24, 16041–16049. [Google Scholar] [CrossRef] [PubMed]
  42. IPCC. Climate Change 2013: The Physical Science Basis. Contribution of Working Group I to the Fifth Assessment Report of the Intergovernmental Panel on Climate Change; Cambridge University Press: Cambridge, UK; New York, NY, USA, 2013. [Google Scholar]
  43. Ecoinvent3.3. Ecoinvent®Swiss Center for Life Cycle Inventories. Available online: http://www.ecoinvent.org/database/ecoinvent-33/ecoinvent-33.html (accessed on 6 June 2018).
  44. Pardo, G.; Moral, R.; Del Prado, A. SIMSWASTE-AD—A modelling framework for the environmental assessment of agricultural waste management strategies: Anaerobic digestion. Sci. Total Environ. 2017, 574, 806–817. [Google Scholar] [CrossRef]
  45. Hou, Y. Towards Improving the Manure Management Chain. Ph.D. Thesis, Wageningen University, Wageningen, The Netherlands, 2016. [Google Scholar]
  46. Dong, H.; Mangino, J.; McAllister, T.; Hatfield, J.; Johnson, D.; Lassey, K.; de Lima, M.; Romanovskaya, A. Chapter 10: Emissions from livestock and manure management. In IPCC Guidelines for National Greenhouse Gas Inventories, Volume 4; Technical Report 4-88788-032-4; Intergovernmental Panel on Climate Change: Geneva, Switzerland, 2006. [Google Scholar]
  47. Pishgar-Komleh, S.; Akram, A.; Keyhani, A.; Raei, M.; Elshout, P.; Huijbregts, M.; Van Zelm, R. Variability in the carbon footprint of open-field tomato production in Iran—A case study of Alborz and East-Azerbaijan provinces. J. Clean. Prod. 2017, 142, 1510–1517. [Google Scholar] [CrossRef]
  48. De Klein, C.; Novoa, R.; Ogle, S.; Smith, K.; Rochette, P.; Wirth, T.; McConkey, B.; Mosier, A.; Rypdal, K. Chapter 11: N2O emissions from managed soils, and CO2 emissions from lime and urea application. In IPCC Guidelines for National Greenhouse Gas Inventories, Volume 4; Technical Report 4-88788-032-4; Intergovernmental Panel on Climate Change: Geneva, Switzerland, 2006. [Google Scholar]
  49. Frey, J.; Grüssing, F.; Nägele, H.-J.; Oechsner, H. Cutting the electric power consumption of biogas plants: The impact of new technologies. Landtechnik 2013, 68, 58–63. [Google Scholar]
  50. Sefeedpari, P.; Vellinga, T.; Rafiee, S.; Sharifi, M.; Shine, P.; Pishgar-Komleh, S.H. Technical, environmental and cost-benefit assessment of manure management chain: A case study of large scale dairy farming. J. Clean. Prod. 2019, 233, 857–868. [Google Scholar] [CrossRef]
  51. FAO. Guidelines to Mitigate the Impact of the COVID-19 Pandemic on Livestock Production and Animal Health. 2020. Available online: http://www.fao.org/3/ca9177en/CA9177EN.pdf (accessed on 6 September 2020).
  52. Chadwick, D.R.; Wei, J.; Yan’An, T.; Guanghui, Y.; Qirong, S.; Qing, C. Improving manure nutrient management towards sustainable agricultural intensification in China. Agric. Ecosyst. Environ. 2015, 209, 34–46. [Google Scholar] [CrossRef]
  53. Scarlat, N.; Fahl, F.; Dallemand, J.-F.; Monforti, F.; Motola, V. A spatial analysis of biogas potential from manure in Europe. Renew. Sustain. Energy Rev. 2018, 94, 915–930. [Google Scholar] [CrossRef]
  54. Batzias, F.; Sidiras, D.; Spyrou, E. Evaluating livestock manures for biogas production: A GIS based method. Renew. Energy 2005, 30, 1161–1176. [Google Scholar] [CrossRef]
  55. Tauro, R.; García, C.A.; Skutsch, M.; Masera, O.R. The potential for sustainable biomass pellets in Mexico: An analysis of energy potential, logistic costs and market demand. Renew. Sustain. Energy Rev. 2018, 82, 380–389. [Google Scholar] [CrossRef]
  56. O’Keeffe, S.; Wochele-Marx, S.; Thrän, D. RELCA: A REgional Life Cycle inventory for Assessing bioenergy systems within a region. Energy Sustain. Soc. 2016, 6, 265. [Google Scholar] [CrossRef] [Green Version]
  57. Hamelin, L.; Wesnæs, M.; Wenzel, H.; Petersen, B.M. Environmental Consequences of Future Biogas Technologies Based on Separated Slurry. Environ. Sci. Technol. 2011, 45, 5869–5877. [Google Scholar] [CrossRef]
  58. Pellerin, S.; Bamière, L.; Angers, D.; Béline, F.; Benoit, M.; Butault, J.-P.; Chenu, C.; Colnenne-David, C.; De Cara, S.; Delame, N.; et al. Identifying cost-competitive greenhouse gas mitigation potential of French agriculture. Environ. Sci. Policy 2017, 77, 130–139. [Google Scholar] [CrossRef] [Green Version]
  59. Pellervo, K.; Lehtonen, H.; Rintamäki, H.; Oostra, H. Economics of Manure Logistics, Separation and Land Application; Knowledge Report; Baltic Forum for Innovative Technologies for Sustainable Manure Management; 2013; p. 33. Available online: https://core.ac.uk/download/pdf/52249098.pdf (accessed on 14 June 2018).
  60. Yazan, D.M.; Fraccascia, L.; Mes, M.; Zijm, H. Cooperation in manure-based biogas production networks: An agent-based modeling approach. Appl. Energy 2018, 212, 820–833. [Google Scholar] [CrossRef]
Figure 1. Scenarios description and system boundary.
Energies 13 06266 g001
Figure 2. Bioenergy potential of poviats (PJ) in 2016. LBI: Bialski; LBL: Biłgorajski; LCH: Chełmski; LHR: Hrubieszowski; LJA: Janowski; LKS: Krasnostawski; LKR: Kraśnicki; LLB: Lubartowski; LUB: Lubelski; LLE: Łęczyński; LLU: Łukowski; LOP: Opolski; LPA: Parczewski; LPU: Puławski; LRA: Radzyński; LRY: Rycki; LSW: Świdnicki; LTM: Tomaszowski; LWL: Włodawski; LZA: Zamojski.
Energies 13 06266 g002
Figure 3. Spatial distribution of (a) livestock manure, (b) cattle manure, and (c) pig manure in the Lubelskie province.
Energies 13 06266 g003
Figure 4. Spatial distribution of (a) N content and (b) P content of manure in the Lubelskie province.
Energies 13 06266 g004
Figure 5. Mass-energy balance flow analysis of (a) Base case (BC), (b) Anaerobic Digestion (AD), (c) AD + Separation (Sep), and (d) Surplus scenarios.
Energies 13 06266 g005aEnergies 13 06266 g005bEnergies 13 06266 g005c
Table 1. Structure of cattle farms in Lubelskie province in 2016.
ItemUnitValueReference
Total No. of farms 1(-)57,761[27]
Total No. of cattleLSU290,195.7[27]
Average number of cattleLSU (NUTS5)−1 (LSU farm−1)1375.3 (3.9)[27]
Stocking rateLSU ha−10.53[27]
Herd structure (lactating, dry, and heifer)% of heads40, 10, 50Assumption
Milk yieldkg d−126[28]
Milk fat (MF)g (g milk)−1 0.04[28,29]
Milk protein (MP)g (g milk)−1 0.03[28,29]
Body weight (BW)kg680; 650; 408[28]
Days in milking (DIM)d300[28]
Dry period (DP)d65[28]
Dry matter intake (lactating, dry and heifer) (DMI)kg d−118.5; 13.13; 7.1[28]
1 > 0 LSU.
Table 2. Equations used for calculating manure production [32,34].
EquationsNo.
M E . L = ( M i l k   ×   0.647 ) + 43.212 (1)
M E . D = ( B W   ×   0.022 ) + 21.844 (2)
M E . H = ( B W   ×   0.018 ) + 17.817 (3)
D M E . L = ( M i l k   ×   0.135 ) + ( B W   ×   0.004 ) + ( D I M   ×   0.004 ) + ( M T P   ×   118.370 )     2.456 (4)
D M E . D   &   H = ( B W   ×   0.004 ) + 1.863 (5)
ME.L = Total manure, lactating cow (kg animal−1 d−1); Milk = Milk production (kg of milk animal−1 d−1); ME.D = Total manure, dry cow (kg animal−1 d−1); BW = Average live body weight (kg); ME.H = Total manure, heifer (kg animal−1 d−1); DME.L = Total solids-lactating cow (kg animal−1 d−1); DME.D&H = Total solids-dry cow and heifer (kg animal−1 d−1); DIM = Days in milk (d); MTP = Milk true protein (g milk−1 d−1) (0.940*MP).
Table 3. Equations for calculating nitrogen and phosphorus content of cattle manure [32,34].
EquationsNo.
N E .   L = ( M i l k   ×   0.4202 ) + 283.3 (6)
N E . D = ( D M I   ×   12.747 ) + ( C C P   ×   1606.290 )     117.500 (7)
N E . H = ( D M I   ×   C C P   ×   78.390 )   +   51.350 (8)
P E . L = [ ( D M I   ×   1000 )   ×   C P ]     ( M i l k   ×   0.9 ) (9)
P E . D = { [ ( D M I   ×   1000 )   ×   C P   ×   D P ]     264.386 } / D P (10)
P E . H = D M I   ×   1000   ×   C P (11)
NE.L = total nitrogen-lactating cow (g animal−1 d−1); NE.D = total nitrogen-dry cow (g animal−1 d−1); DMI = dry matter intake (kg dry feed animal−1 d−1); CCP = concentration of crude protein (g crude protein g dry feed−1); NE.H = total nitrogen-heifer (g animal−1 d−1); CP = concentration of phosphorus (g phosphorus g dry feed−1); DP = dry period length (d); PE.L = total phosphorous for lactating cow (g animal−1 d−1); PE.D = total phosphorous for dry cow (g animal−1 d−1); PE.H = total phosphorous for heifer (g animal−1 d−1).
Table 4. Structure of pig farms in Lubelskie province.
ItemUnitValuesReference
Total No. of farms 1(-)33,188[27]
Total No. of pigsLSU89,144[27]
Average number of pigLSU (NUTS5)−1 (LSU farm−1) 422.5 (1.2)[27]
Stocking rateLSU ha−10.18[27]
Manure excretion (ME.P)kg head−1 d−143.5[34,35,36]
Total solids (TS)% ME.P6.0[34,35,36]
Volatile solid (VS)% TS0.8[35,36]
Total nitrogen (NE.P)g (LSU)1 d−13.7[34,37]
Total phosphorus (PE.P)g (LSU)−1 d−10.8[34,37]
1 > 0 LSU.
Table 5. Equations for calculating bioenergy potential.
EquationsNo.
V S =   T S × M v s (12)
C H 4 = ( V S × P C H 4 ) / ρ C H 4   (13)
B i o g a s = C H 4 /   C C H 4 (14)
E l e c t r i c i t y = C V   ×   η e l   ×   B i o g a s (15)
H e a t = C V   ×   η t h   ×   B i o g a s (16)
TS = total solids into the digester (kg); Mvs = volatile solids content of cattle and pig manure (Table S1); CH4 = methane potential (m3); VS = volatile solids of manure (kg); PCH4 = methane productivity of manure (kg CH4 kg VS−1) (Table S1); ρCH4 = density of methane (kg m−3) (Table S1); CCH4 = methane content in biogas (%); Electricity = electricity potential (kWh); CV = calorific value of biogas (kWh m−3); ηel = electricity conversion efficiency (%), Heat = heat potential (kWh); ηth = heat conversion efficiency (%).
Table 6. Equations for calculating N2O emissions from N inputs applied to soil [48].
EquationsNo.
N 2 O D i r e c t   = i ( F S N + F O N ) i × E F 1 × 44 / 28 (18)
N 2 O I n d i r e c t   = i [ ( F S N × F r a c G A S F i × E F 4 ) + ( F S N + F O N ) × F r a c l e a c h × E F 5 ] × 44 / 28 (19)
N2ODirect = annual direct N2O–N emissions produced from managed soils (kg N2O–N y−1); FSN = annual amount of synthetic fertilizer N (kg N y−1); FON = annual amount of manure, compost and other organic N additions (kg N y−1); EF1 = emission factor for N2O emissions, kg N2O–N (kg N input)−1 (Table S2); N2OIndirect = annual indirect N2O–N emissions (kg N2O–N y−1); FracGASF = fraction of synthetic fertilizer N that volatilizes as NH3 and NOx, kg N volatilized (kg of N applied)−1 (Table S2); EF4 = emission factor for N2O emissions from atmospheric deposition of N on soils and water surfaces, [kg N–N2O (kg NH3–N + NOx–N volatilized)−1] (Table S2); FracLEACH = fraction of all N added to/mineralized, kg N (kg of N additions)−1 (Table S2); EF5 = emission factor for N2O emissions from N leaching and runoff, kg N2O–N (kg N leached and runoff)−1 (Table S2); 44/28 = conversion factor from N2O-N to N2O.
Table 7. Equations for calculating avoided costs.
EquationsNo.
C a v .   f e r t . = P o d i g e s t a t e × P r f e r t . (20)
C a v .   t r a n . = ( P o d i g e s t a t e P o m a n u r e ) × P r t r a n / ρ f e r t (21)
C a v .   e l e c . = P o e l e c t r i c i t y × P r r e .   e l e c .   (22)
C t o t a l = C a v .   f e r t . + C a v .   t r a n . + C a v .   e l e c .   (23)
Cav. fert. = avoided cost of fertilizer (EUR); Podigestate = digestate potential (Mt y−1); Prfert. = fertilizer price (EUR kg−1); Cav. tran. = avoided cost of transport (EUR); Prtran. = transport cost (EUR m−3); ρfert = fertilizer density (800 kg m−3); Cav. elec. = avoided cost of electricity (EUR); Poelec = electricity potential (MWh y−1); Prre. elec. = electricity price (EUR kWh−1); Ctotal = total avoided cost (EUR).
Table 8. Estimated manure potential and characteristics in 2016.
UnitCattlePigTotal
Animal populationLSU290,195.6989,144.02379,339.71
Utilized agricultural areaha534,241.65
Stocking rateLSU ha−10.540.170.71
Manure potentialMt6.141.417.56
NitrogenMt0.0280.0050.034
Phosphorus Mt0.010.0010.011
Total solidsMt0.610.080.69
Volatile solidsMt0.520.070.59
Table 9. Bioenergy potential from livestock manure in 2016.
OutputsUnitScenario with AD
Theoretical energyPJ6.86
BiogasMm3377.9
CH4Mm3245.7
ElectricityGWh907.0
HeatGWh997.8
Organic fertilizerMt7.03
NitrogenMt0.03
PhosphorusMt0.01
Table 10. Avoided GHG emissions of AD scenarios compared to BC scenario.
Emission SourceUnitEmissionsAvoided Emissions
BCADAD + SepSurplus + ADADAD + SepSurplus + AD
Methane leakageMt CO2 eq00.050.050.010.050.050.01
Manure applicationMt CO2 eq0.200.190.060.31−0.01 *−0.140.11
Avoided electricityMt CO2 eq0−0.82−0.82−0.16−0.82−0.82−0.16
TotalMt CO2 eq −0.78−0.91−0.04
Ranking 213
* Negative values show the avoided emissions.
Table 11. Avoided costs of AD scenarios compared to the BC scenario.
Sources of CostUnitQuantity FlowsAvoided Costs (M EUR)
BCADAD + SepSurplus + ADADAD + SepSurplus + AD
fromtofromtofromtofrom
FertilizationMt7.56-7.03-1.056.071.380.617.485.39
Electricity GWh0-907.1-907.1-178.3−35.47 **−35.47−6.97
Transport *Mt7.567.567.037.561.057.561.49−0.01−0.15−0.11
TotalM EUR −34.87−28.14−1.69
Ranking 123
* Transport manure to plant (or digestate to land) ** Negative values show avoided costs.
Publisher’s Note: MDPI stays neutral with regard to jurisdictional claims in published maps and institutional affiliations.

