Estimation of Battery Separator Area, Cell Thickness and Diffusion Coefficient Based on Non-Ideal Liquid-Phase Diffusion Modeling


1
Research and Development Center of Technical Sciences, University of Pannonia, 8200 Veszprém, Hungary
2
Institute of Automation, Óbuda University, 1034 Budapest, Hungary
*
Author to whom correspondence should be addressed.
Energies 2020, 13(23), 6238; https://doi.org/10.3390/en13236238
Submission received: 21 September 2020
/
Revised: 19 November 2020
/
Accepted: 23 November 2020
/
Published: 26 November 2020
(This article belongs to the Section D1: Advanced Energy Materials)
Abstract
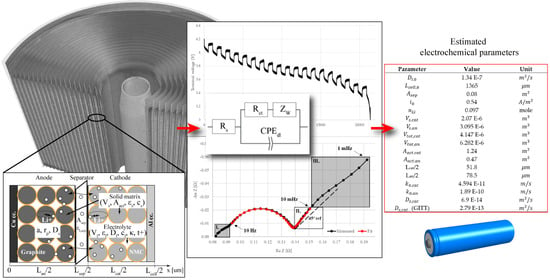
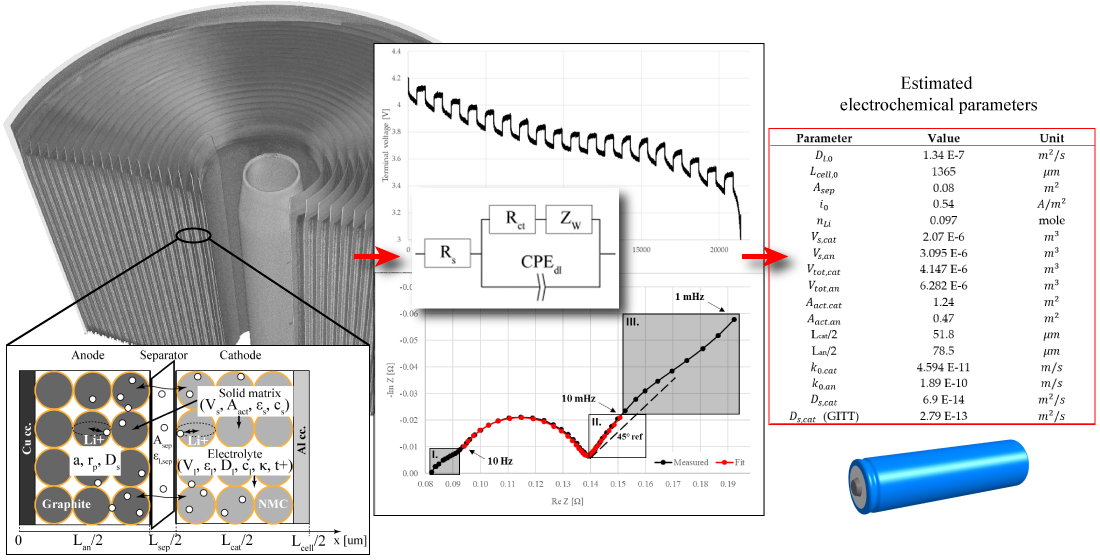
:The aim of this work is to present a fast and in situ diffusion modeling technique to extract essential electrochemical parameters from liquid-phase diffusion which can be used to implement a realistic battery in a pseudo-2D finite element modeling environment. A generalized Warburg element was used within an extended Randles equivalent circuit to obtain an appropriate fit on non-ideal diffusion impedance. Based on the calculation method presented in this paper, the values of diffusion-related parameters such as the cross-sectional area of the separator Asep, cell thickness Lcell as well as liquid-phase and solid-phase diffusion coefficients Dl and Ds were derived, successfully. A characteristic cell which allowed the exchange current density i0 and reaction rate constant k0 to be calculated was also established. The experimental data was measured by electrochemical impedance spectroscopy (EIS), resistivity measurement and the galvanostatic intermittent titration technique (GITT). The results show that our hypothesis to extract essential electrochemical parameters from the tail part of diffusion impedance is correct. The applicability of our concept is confirmed by the prosperous validation results produced by computed tomography (CT) and battery dynamics simulation in finite-element environment. Due to the inherent limitations of the pseudo-2D Doyle-Fuller-Newman (DFN) model, our technique is accordingly valid within the current range of 0–1 C.
1. Introduction
Li-ion batteries are usually the primary source of energy storage in, for example, transportation and commercially available portable applications. The fuel gauge of a battery is the state of charge (SoC), which shows the utilizable amount of charge. During battery usage, the available capacity and power decrease as the battery ages [1] which is hallmarked by the battery’s state of health (SoH). It is recommended that both of these parameters be monitored for reliability and safety issues, especially in vehicular applications [2]. SoC and SoH are both hypothetical lumped indicators of battery states, which rely on a couple of battery-specific material parameters. These material properties not only change over time and from one mode of operation to another but also with the specifics of manufacturing processes. Since battery technology is an increasingly developing sector, battery chemistries and structures vary significantly. In addition, Li-ion cell manufacturing is a very complex process that inadvertently introduces a strong degree of variation in the chemical composition of cells [3]. Consequently, there is a lack of matching material data for a specific cell, therefore, it is recommended to obtain relevant and reliable information about the composition of a battery before modeling it.
For the sake of clarity, two types of possible battery models are distinguished. One battery model is used for parameter estimation and the other takes into consideration these estimated values and forms a suitable model to implement battery dynamics to a feasible degree of detail. In the present paper, a former model is established and material parameters derived as inputs for numerical simulations of batteries.
Regarding the numerical simulations, finite element analysis (FEA) can offer a reasonable alternative for, for example, the analysis of the effects of aging [4,5,6,7,8,9] and according to Warner et al. [10], supports the testing of driving scenarios on new and aged batteries, analysis of mechanical forces placed on cells and packs, as well as the study of thermal and electromagnetic problems. Kaltenegger showed that FEA is also applicable for 3D battery analysis [11]. Even though the battery model could be more exact by considering heterogeneous electrodes composed of polycrystalline materials of primary and secondary particles in 3D, this approach would lead to an excessively detailed model and computational issues with regard to the suggested numerical applications. Hence, a simplified battery model called the Doyle-Fuller-Newman (DFN) electrochemical model in the pseudo-2D domain is mostly preferred in FEA, which is valid for cell currents of up to 1C [12]. Since a pseudo-2D DFN model is a simplified approach, a simplified battery model for parameter estimation should also be used in order to avoid unnecessary measurements and computational efforts. In pseudo-2D DFN models, the electrodes are modelled by homogeneous multiphase systems according to the porous electrode theory, and the dynamic behavior of the battery is implemented by concentrations and potentials [13]. The mathematical apparatus of the electrochemical model is based on the governing partial differential equations (PDEs), which are established by applying the laws concerning the conservation of charge and mass both in the electrolyte and electrodes as well as the Butler-Volmer equation at the electrode-electrolyte interface. These relationships are summarized in detail by Trembacki et al. [14].
1.1. Experimental Investigations
The determination of electrochemical parameters used in the electrochemical battery model is challenging due to difficulties in terms of measurability and numerous unknown parameters. Krewer et al. [13] and Li et al. [15] summarized several techniques that have been developed to gather valid electrochemical parameters. These measurements can be grouped into two types according to their micro- or macroscopic relevance:
- direct measurements that basically require the cell to be dismantled and special cell preparations include scanning electron microscopy (SEM), X-ray diffraction (XRD), transmission electron microscopy (TEM), X-ray photoelectron spectroscopy (XPS), nuclear magnetic resonance spectroscopy (NMR) [16], etc.
- indirect measurements sometimes addressed as dynamic methods include electrochemical impedance spectroscopy (EIS), the potentiostatic intermittent titration technique (PITT), the galvanostatic intermittent titration technique (GITT), galvanometry, potentiometry, chronoamperometry, etc.
Here, it should be emphasized that the measurements classified above complement each other. The indirect measurements are based on more accurate and a priori direct information according to which the inspected cell could be further specified in situ. In fact, indirect measurements come forward if only voltages, currents and temperatures of the cell can be measured.
One of the major advantages of direct measurements is that they offer the granular inspection of materials at the molecular level, therefore, it is useful for studying, for example, porosity, material composition and the effect of aging [17,18,19,20]. Even though direct measurements are the most precise, they are still costly and require the sample to be specially prepared. On the other hand, in the case of indirect measurements, the encapsulated electrochemical parameters of the cell should be extracted from macroscopic dynamics data such as voltage and current by using a proper mathematical or data-driven model and a model-related fit function.
1.2. Modeling and Parameter Identification
The acquired dynamic data is subjected to post-processing where fitted parameters are determined and transformed into electrochemical quantities. In the time domain, this is usually achieved by fitting on the terminal voltage curves which are the voltage responses of the charging or discharging currents [12,21,22,23,24]. In the frequency domain, impedance regression is favorable [25,26]. The impedance response of the porous electrode model was established by Meyers et al. [27]. The regression algorithms can vary significantly, but the genetic algorithm (GA), Kalman filter and non-linear least squares by applying different solvers such as Levenberg-Marquardt, Newton-Raphson, quasi-Newton and Gauss methods are frequently used [28]. In numerous sources, the calculation of either Randles circuit parameters such as the charge transfer resistance Rct, double-layer capacitance Cdl, series resistance Rs, Warburg coefficient σ and diffusion time-constants [29,30,31] or electrochemical parameters, for example, the diffusion coefficient Ds of Li-ions in the solid phase, diffusion coefficient Dl of Li-ions in the electrolyte, Li concentration in the electrode cs, , , reaction rates k0 and transference number t+ have been reported [32,33,34,35,36,37]. The relationship between the geometrical structures and electrochemical parameters of the cell such as solid-phase diffusion coefficients were investigated by Cooper et al. [38], Sapoval et al. [39] and Zou et al. [40] in different fractal-like pore shapes. They pointed out that the pore’s shape affects the EIS impedance spectra. However, conventional DFN models rely on simple spherical particles, therefore, special shapes of pores and particles are not considered in these models. In addition, Song et al. [41] showed that the particle geometries and pore shapes have a negligible effect on the EIS impedance characteristics in the high-frequency region of diffusion impedance. Levi et al. [42] evaluated and compared several promising equivalent circuit models that are suitable to fit EIS impedance spectra especially in the low-frequency region where diffusion dominates. Their comprehensive comparison draws attention to deviations in EIS spectra due to the effects of different particle sizes, ionic and electrical conductivities, solid-phase diffusion coefficients and electrode thicknesses. The effect of these inhomogeneities is investigated by Bisquert et al. using a constant phase element-based diffusion modeling technique. Baker et al. [43] studied solid-phase diffusion in multiphase electrode materials and showed a strong non-linear dependency between the solid-phase diffusion coefficient and SoC during phase transitions. Guo et al. [44] published a very promising method to estimate the solid-phase diffusion coefficient based on the AC excitation signal and showed the dependency of the solid-phase diffusion coefficient on the application of different electrochemical parameters. Cabanero et al. [45] estimated the solid-phase diffusion coefficients for several commercial Li-ion batteries using the galvanostatic intermittent titration technique (GITT). Dong et al. [46] presented a method for estimating parameters in which they used the constant phase element (CPE) to model both diffusion and the double-layer effect. They proposed different configurations of equivalent circuits which are suitable to retrieve values of resistive, capacitive, inductive and distributed elements based on EIS impedance measurements. The useful application of CPE for diffusion modeling was also reported by Huang et al. [47], Guha et al. [48] and Zhuang et al. [49]. Scipioni et al. [50] used a general transmission line model to estimate equivalent circuit parameters where several RC branches were implemented instead of using a single CPE for diffusion modeling. Electrochemical parameters of batteries can be estimated by fitting a physicochemical model on dynamic discharge curves according to Park et al. [51].
In these scientific reports, the estimated electrochemical parameters are related to different types and configurations of cells, moreover, there is a lack of a complete list of material data needed by the DFN model in FEA. Furthermore, no significant techniques have been reported concerning how the cross-sectional area of an unwrapped electrode plate Acell and the thickness of the modelled cell “sandwich” (unity cell thickness) Lcell can be obtained by indirect measurements to scale the DFN model to the real size of the cell.
In order to overcome this problem, a technique to derive the missing geometrical data from diffusion impedance has been established. The classical estimation techniques—as referenced in the previous paragraph—retrieve diffusion-related parameters from solid-phase diffusion impedance through the Warburg element and CPE. However, data acquisition and parameter fitting in the corresponding low-frequency range where solid-phase diffusion occurs are very time-consuming and challenging. Moreover, solid-phase diffusion is obviously related to the diffusion of particles inside the electrode matrix so does not carry useful information for researchers about macroscale dimensions such as cross-sectional areas and electrode thicknesses of the cell. Consequently, our focus was on data extraction from the early “high” frequency region—also known as the tail part—of diffusion impedance which was addressed with regard to the region of liquid-phase diffusion by Huang [47].
Our main hypothesis is that at these “high” frequencies, there is enough time for ion transport in the electrolyte to develop within the whole cross-sectional area of the cell but an insufficient amount of time for the majority of ions to intercalate into the electrode matrix. In other words, the frequency-dependent diffusion length for the given active particle i is short within this frequency region, therefore, the effect of solid-phase diffusion can be considered negligible in this case.
Under these circumstances, the diffusion-related parameters of ions in the electrolyte do characterize the macroscale structure of the cell and can be used to determine the battery-specific macroscale electrochemical parameters.
In order to prove this hypothesis, first EIS measurements were run to acquire impedance data from the cell. Subsequently, the impedance characteristics were fitted by applying the Randles equivalent circuit model with an extension of a generalized Warburg element which was intended to model the appearing non-ideal—so called non-Fickian—liquid-phase diffusion in the tail region. An additional advantage of extracting data from the tail is faster acquisition as well as a simpler and more robust impedance fit than on the whole diffusion impedance spectrum. Based on the results of fitting, the core parameters such as , , and Ds and a matching electrochemical parameter vector of an 18,650 Li-ion cell were determined. Time-domain dynamical measurements were also run to assess the internal resistance of the battery from the time domain. Both EIS and resistance measurements in the time domain were performed in order to reduce measurement errors. The core liquid-phase diffusion-related electrochemical parameters are shown in Table 1:
The calculated geometrical parameters were verified by computed tomography (CT). The validity of the estimated electrochemical parameters was evaluated by the simulation framework of a DFN finite-element battery model comparing simulated and measured terminal voltages.
2. Materials and Methods
This work examines a commercially available ICR18650-26F 2600 mAh cylindrical cell (Samsung, Seoul, Korea). The cell chemistry is considered to be lithium-nickel-manganese-cobalt-oxide (NMC) at the cathode and graphite at the anode according to the manufacturer’s datasheet and based on previous work using this type of cell [52]. Although the cell consists of double-sided electrodes, the calculation was performed on an elemental cell for the sake of simplicity, since it refers to the smallest but still operating composition of the cell which is wrapped around and forms the jelly roll. The elemental cell consists of two double-sided electrodes, two current collectors and two separators.
EIS measurements were performed by a SI1287 electrochemical interface (Solartron, Leicester, UK) and a SI 1255 HF frequency response analyzer (Schlumberger, Leicester, UK) at frequencies between 1 mHz–100 kHz at 10 mV amplitude of AC voltage. The impedance was recorded by ZPlot® software at 10 points per decade and the data points as well as the impedance fit were evaluated by ZView®. The aim of the EIS measurements was to evaluate the effect of diffusion in the electrolyte. The parameters extracted from EIS only represent the fully charged state of the cell, however, these values may vary as a function of concentrations, potentials and temperatures during operation, which is not investigated in this paper.
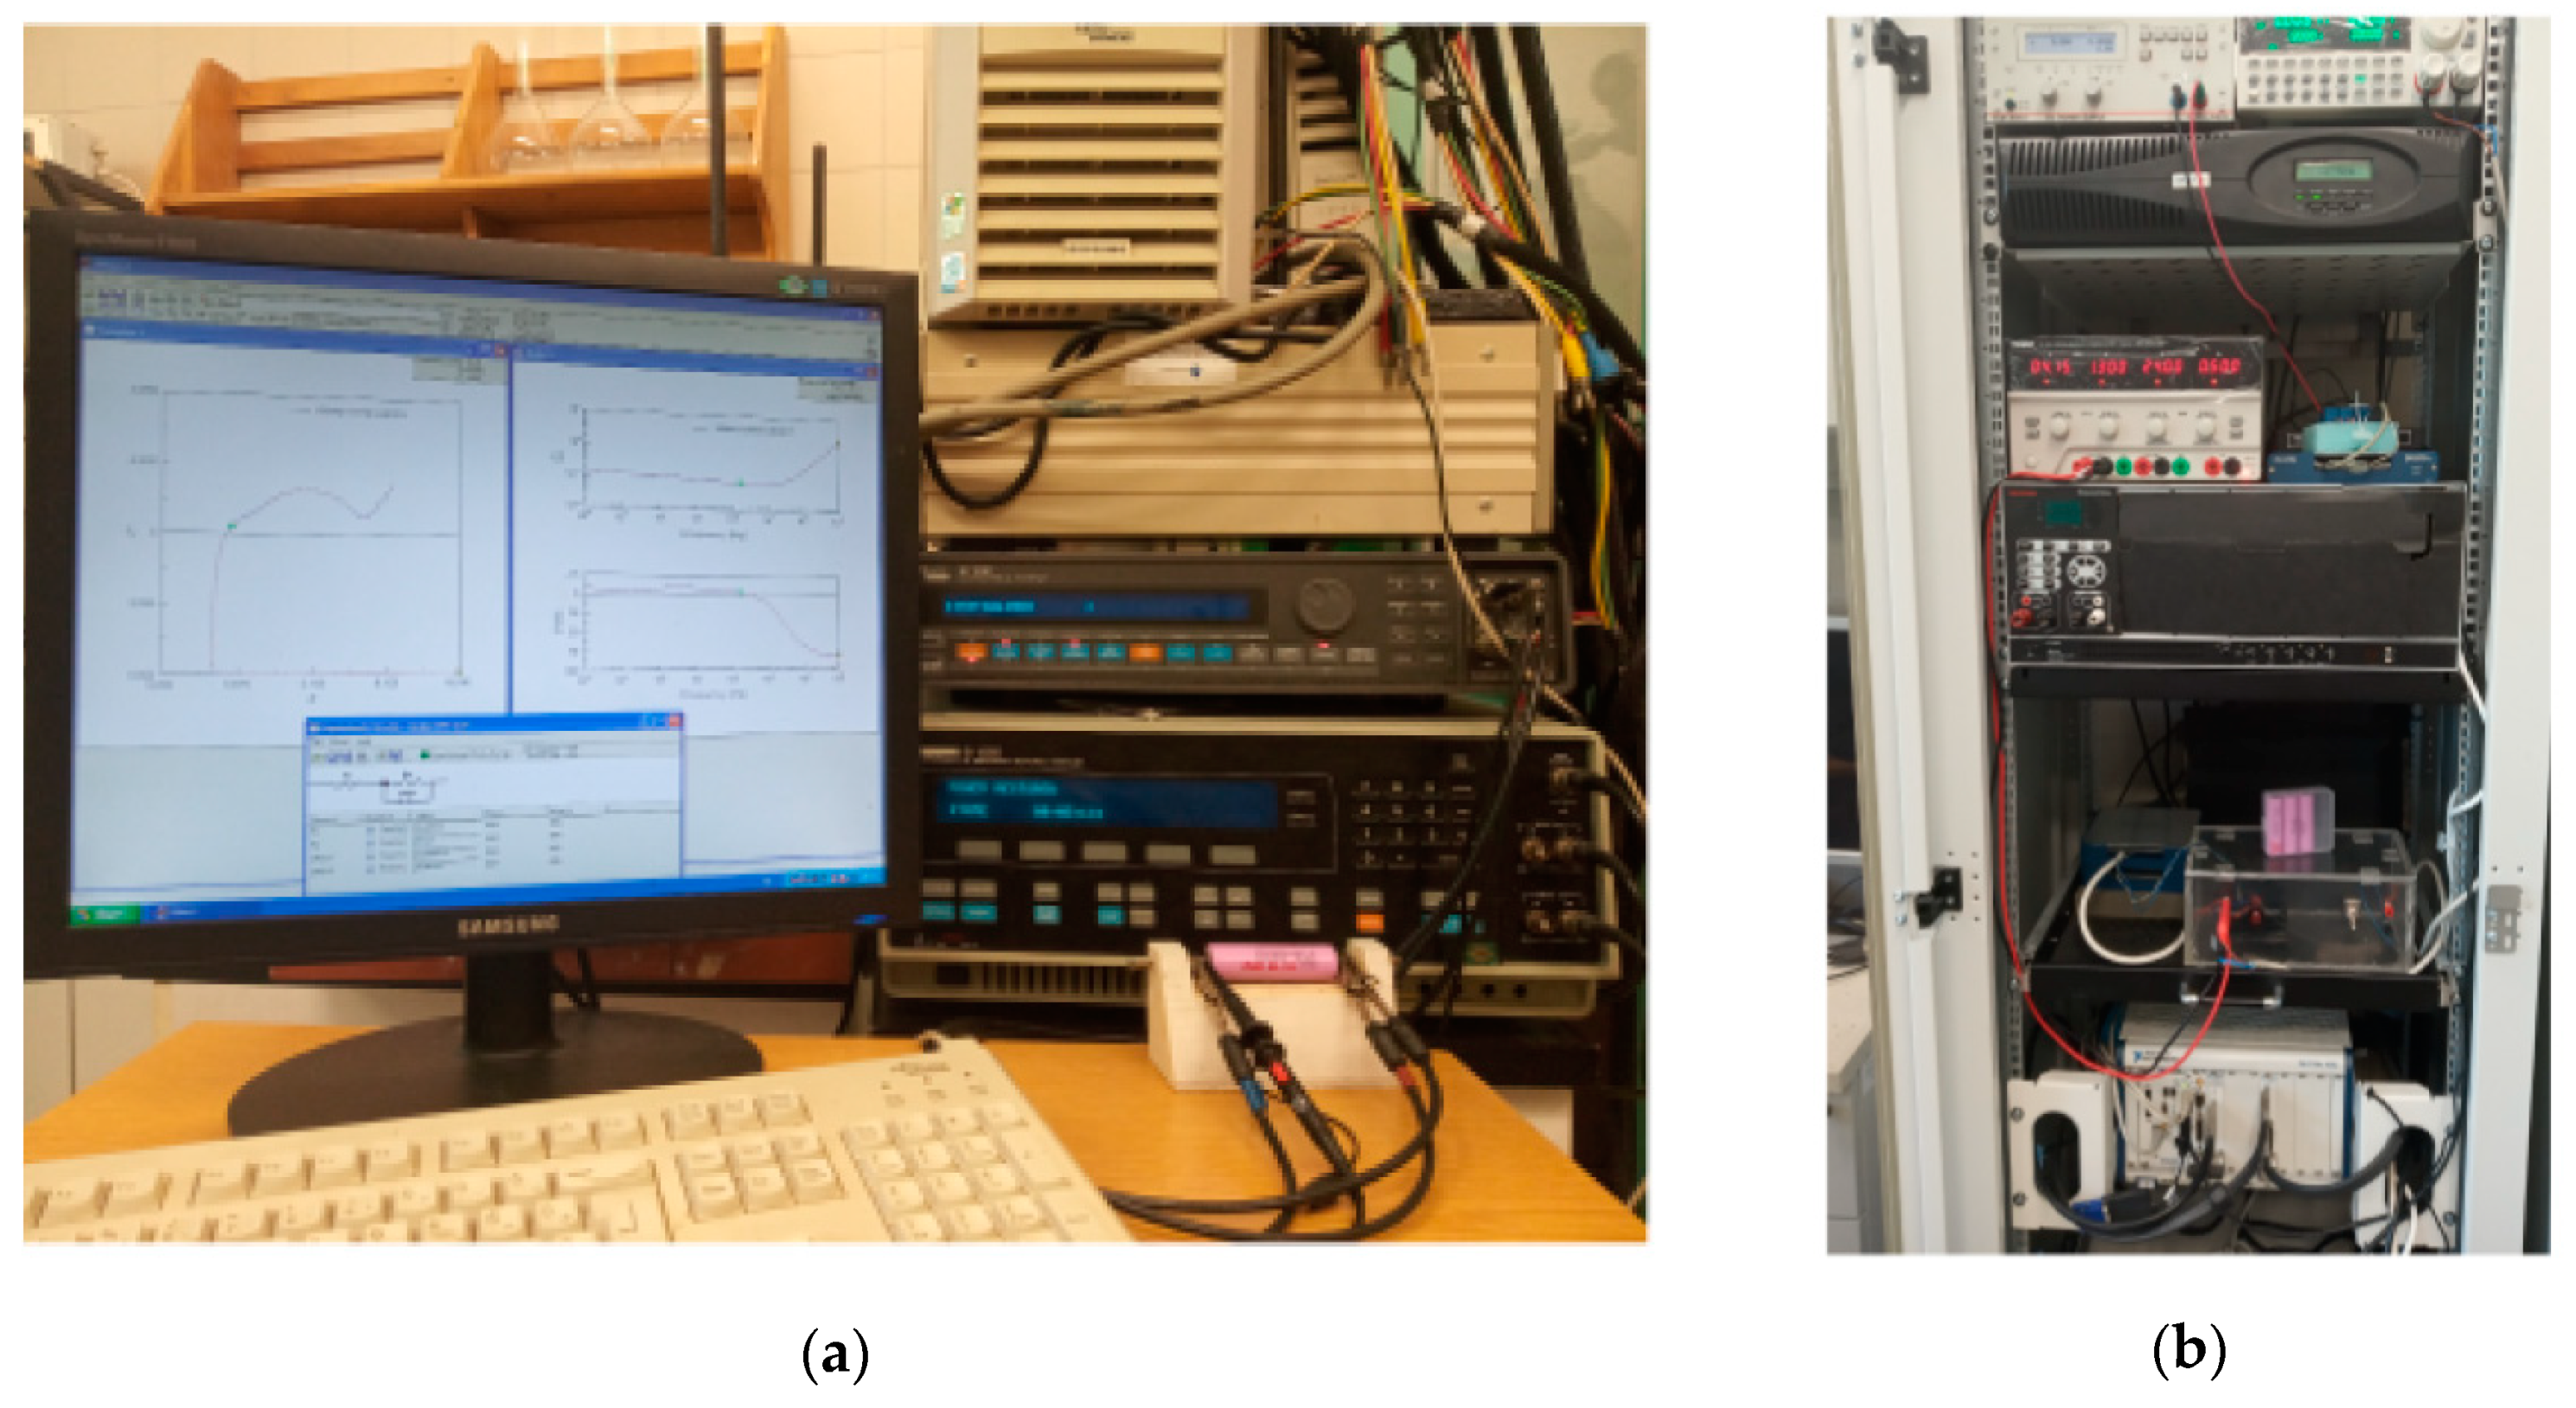
The cell was fully charged by a commercial CC-CV Li-ion battery charger with a C/10 charge rate at room temperature. After a 12 h-long period of relaxation, the cell was also subjected to a short impulse current test to determine the instantaneous resistances of the cell at different load currents at room temperature. The load current was applied by a 72-13200 programmable DC load (TENMA, Leeds, UK) in constant current (CC) mode and the voltage as well as current were recorded by a PXI embedded controller (National Instruments, Debrecen, Hungary). Additionally, based on this platform, GITT was performed to measure the diffusion coefficient of the solid electrode. The discharge current was 0.3 C and the interruption time interval has been set to 550 s with 1 s sampling time. The measurements were run at 295 K ambient temperature. The experimental setups can be seen in Figure 1.
The cell was held in a simple insulator box during the analysis to suppress deviation in the ambient temperature during the inspection period. The dependency of the parameters on temperature was neglected during the measurements. The calculated geometrical parameters were verified by an XT H 225 ST instrument (Nikon, Tokyo, Japan). Moreover, all the parameters fitted in a DFN model were tested by a simulated dynamic discharge. The simulation platform was run on an Intel Core i7-8700 @ 3.2 GHz CPU equipped with 16 GB DDR4 RAM.
3. Methodology
Manufacturing differences introduce variations in the structures and chemical compositions of cells. Moreover, its exact composition is a manufacturer’s secret and the set of material properties of a cell are usually inaccessible for a particular case. Consequently, little detailed preliminary information about the electrode geometries, porosities, particle sizes, composition of the electrolyte and all associated parameters such as specific surface areas, active electrode surface, electrode and cell thicknesses, ionic conductivity, diffusion coefficients was available. As was mentioned earlier, the complexity of the multi-particle battery model will be beyond the expected target of application due to the numerous unknowns and unreasonably profound resolution. Instead, an attempt was made to apply a simplified model for parameter identification that should offer a reasonable compromise between resolution and computability. Therefore, a simple characteristic cell was established by adopting some of the necessary electrochemical parameters from the following literature that could not be indirectly measured.
3.1. Characteristic Cell Model
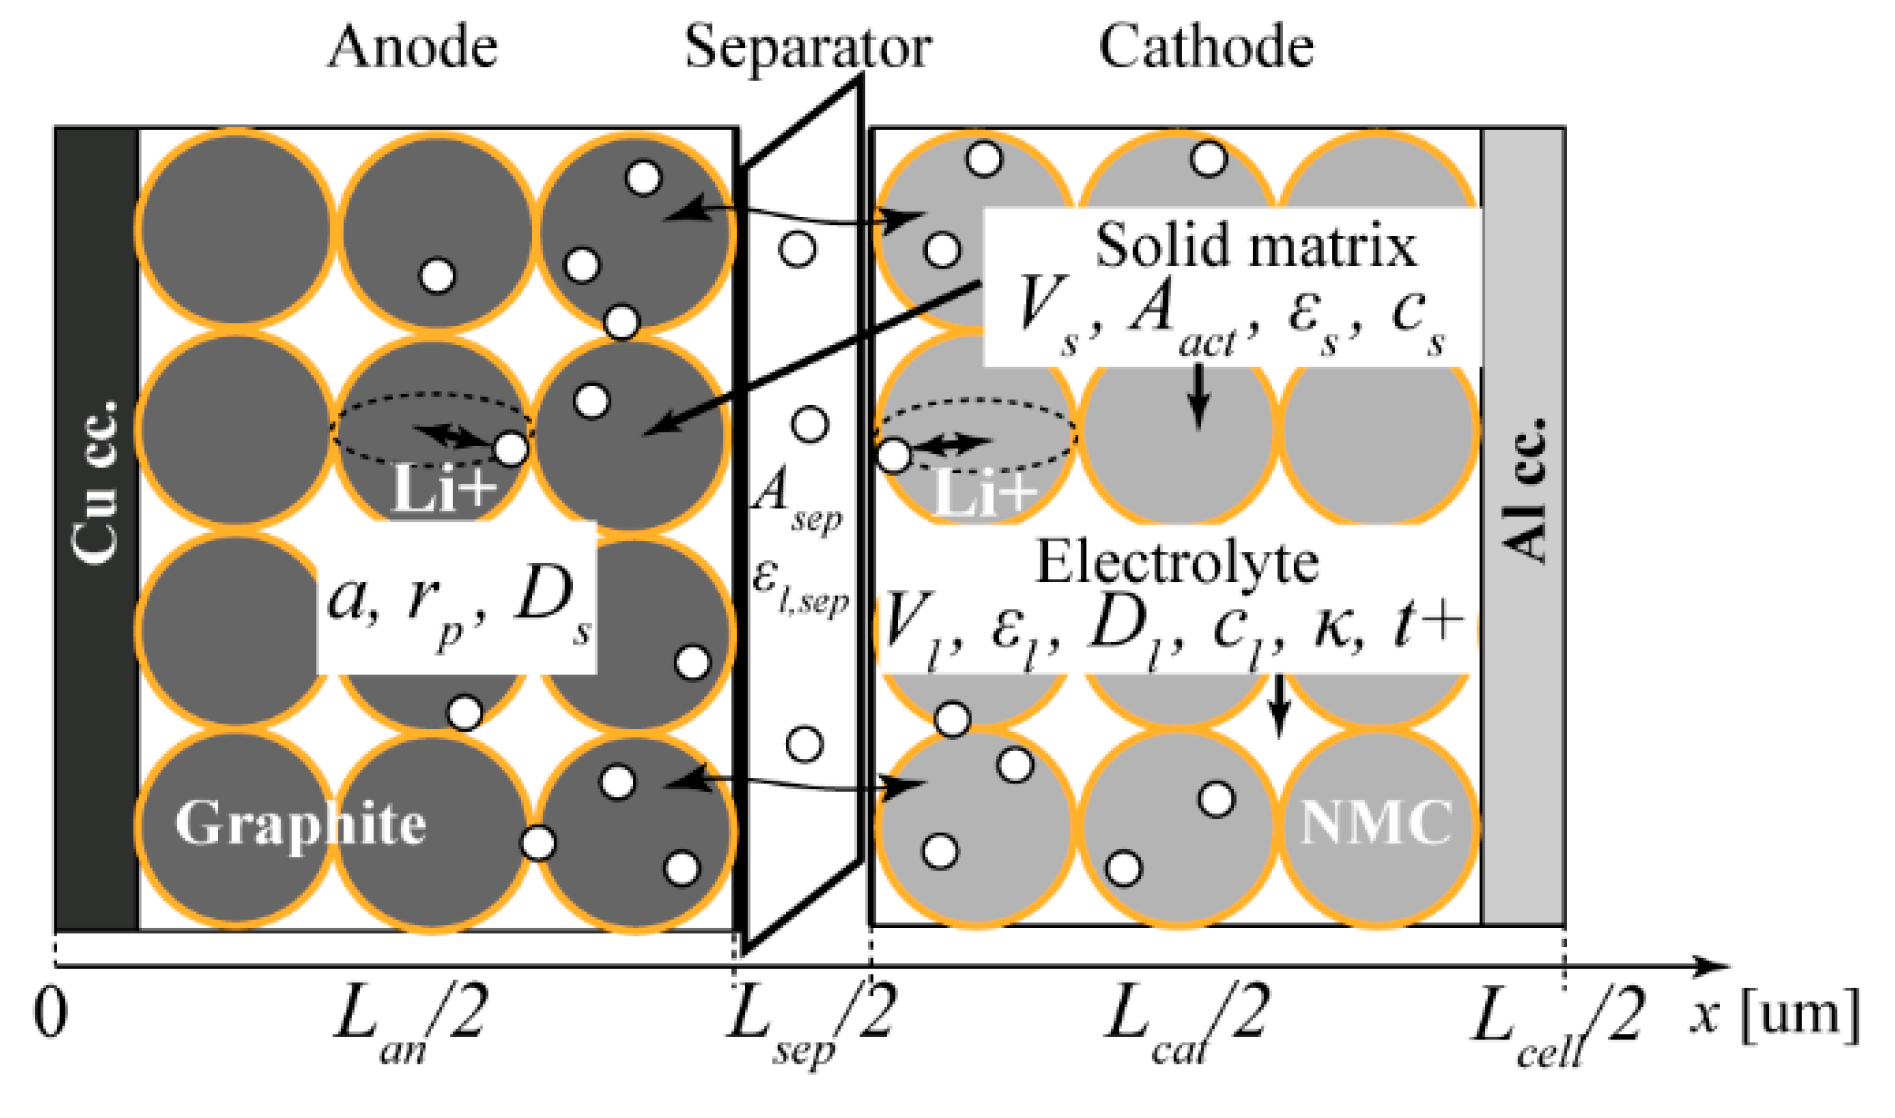
The cell consists of a porous double-sided NMC cathode and a double-sided graphite anode. Most of the material parameters were taken from Carelli et al.’s work [53] since they investigated the same type of NMC and carbon-based cell as us. According to this study, the radii of the cathode and anode particles were 5 and 10 , respectively. These values are also in agreement with the manufacturer’s datasheet of NMC111 [54]. The initial volume fraction of the solid particles in the cathode is 0.5224, while its void (electrolyte) fraction is 0.2976. The gas phase is neglected in this case. The volume fraction of solid particles in the anode is 0.5073 and its void fraction is 0.4526. The recommended values for the porosity of the separator (in the liquid phase) are within the range of 0.4–0.6 and for the thickness of the separator are between 20–25 [55]. According to Newman’s work [56], the porosity of the separator was set at 0.4. was arbitrarily chosen to be 22.5 as an average value within the recommended range. The Bruggeman coefficient was chosen to be 1.5 for both of the electrodes based on a specific study on Bruggeman coefficients in NMC electrodes [35]. The initial Li concentration in the LiN0.3M0.3C0.3O2 cathode was 49.000 mole/m3, while the initial Li concentration in the MCMB graphite anode was 31.507 mole/m3. These are material constraints and depend on the compositions of the electrodes. A commonly used electrolyte is LiPF6 in an organic solvent. Even though some of the properties of the electrolyte (e.g., ionic conductivity, temperature range) depend on the mixture and volume ratios of alkyl carbonate solvents such as ethylene carbonate (EC), dimethyl carbonate (DMC), diethyl carbonate (DEC) and ethyl methyl carbonate (EMC) [57], the initial salt concentration of 1 mole/dm3 and transference number of 0.363 are similar in these electrolytes according to Valoen et al. [58]. Most of the electrolytes in recent cells are based on the salt LiPF6 in some of these alkyl carbonate mixtures with a salt concentration of 1 mole/dm3. However, the exact chemical formulation of the electrolyte is unknown. In Serena et al.’s work [53], it is shown that Nyman et al., Zhang et al. and Ecker et al. gathered values of the ionic conductivity of different electrolyte mixtures. Based on their studies, was assumed to have an average value of 0.87 S/m. A schematic diagram of the cell structure can be seen in Figure 2.
3.2. Extended Randles Equivalent Circuit Model
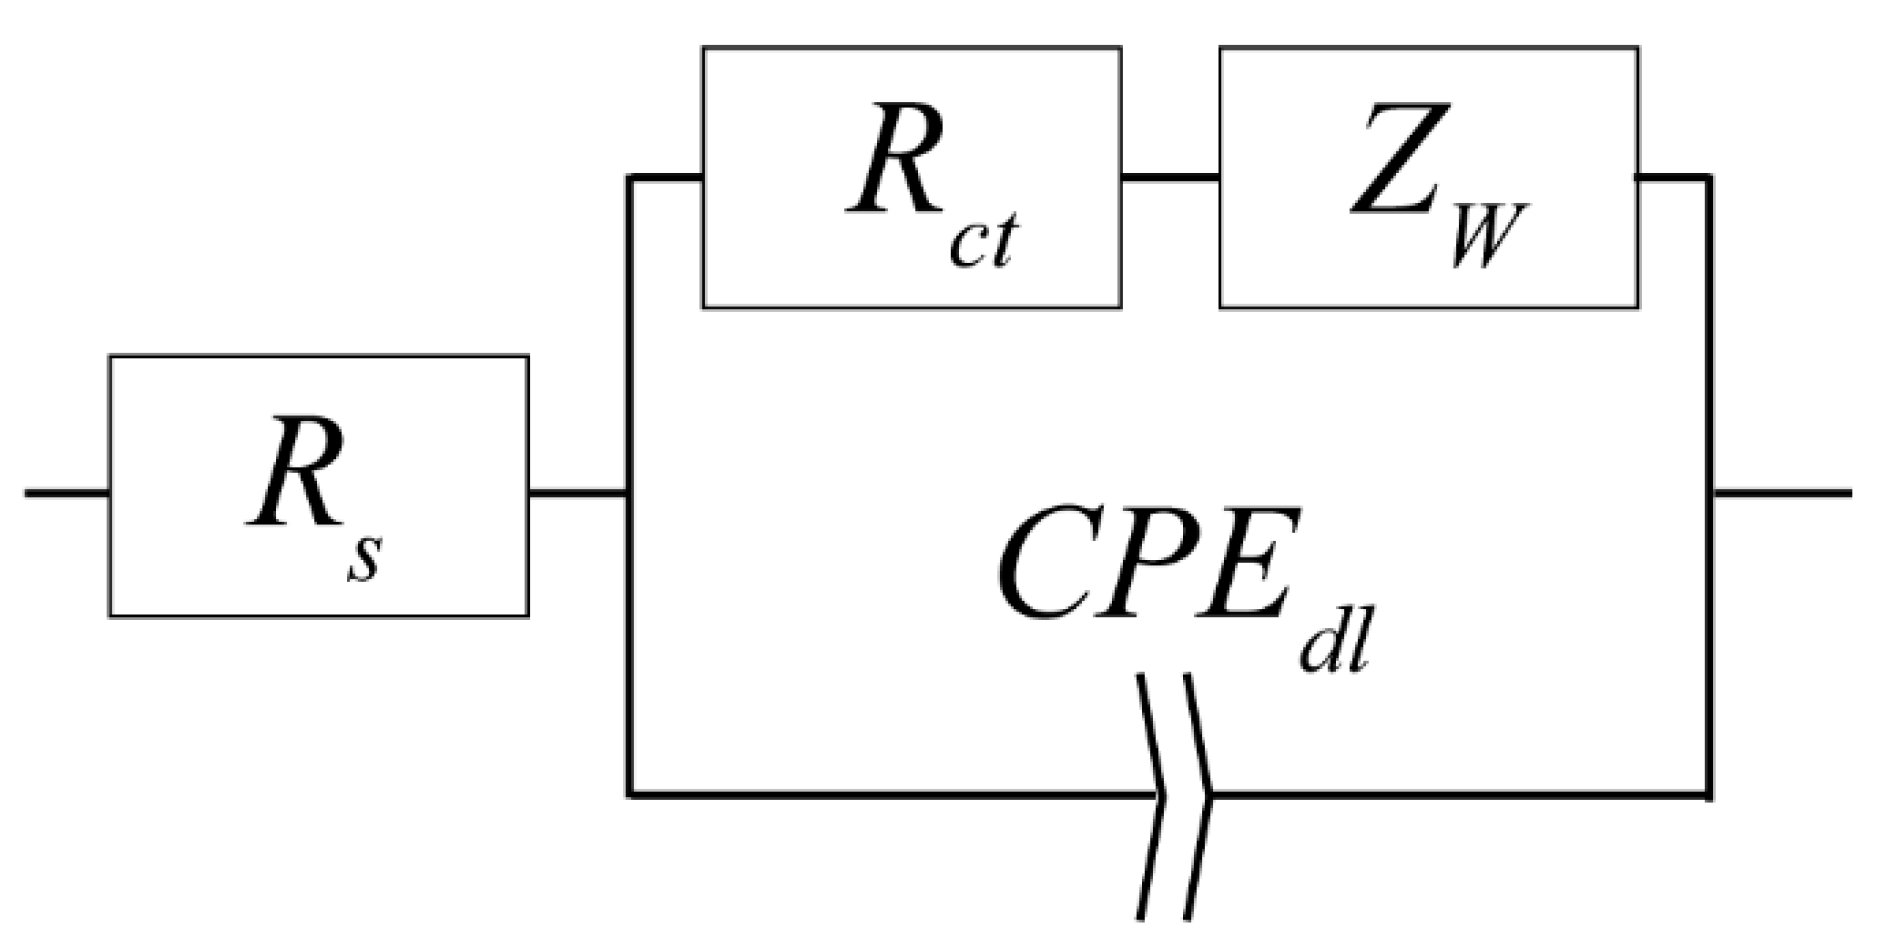
As was mentioned at the end of the Introduction, it is our aim to determine the core electrochemical parameters concerning liquid-phase diffusion impedance. These parameters were determined by fitting an extended Randles equivalent circuit on EIS data where the non-idealities of diffusion and migration were implemented by distributed elements. The extended Randles circuit can be seen in Figure 3.
Rs and Rct stand for the serial and charge-transfer resistances of the cell, respectively. The classically used double-layer capacitor in Randles circuits was now replaced by a CPE to implement a more realistic, “leaky” capacitor. On the other hand, the standard Warburg element used for ideal diffusion modeling in the Randles circuits was substituted by its generalized alternative to handle non-idealities. Batteries with porous electrodes such as ours are expected to exhibit non-Fickian behavior which can be observed in their phase angles other than 45°. Several authors have extensively investigated the source of these non-idealities and have pointed to multi-phase and multi-scale diffusion phenomena in porous electrodes [59,60], to diffusion coupled with migration [61,62], and/or to diffusion in non-conventional space [39,63,64] as root causes of the non-Fickian behavior.
It is also important to note that there are finite- and infinite-length Warburg elements and CPEs in the tool set which at first sight seem to also be useful alternatives to non-ideal diffusion modeling. However, finite-length Warburg elements are dedicated to model transmissive or reflective diffusion behavior at the very low frequencies through their hyperbolic functions. Since measuring impedance at very low frequencies is unaffordable, there is usually insufficient data from that region which makes the fitting of finite-length Warburg elements unreasonable. Although a standard infinite-length Warburg element does not suffer from this problem, it is inaccurate for non-ideal diffusion modeling.
Wang [65] and Franceschetti together with MacDonald [61] have laid down the fundamentals of the theory and mathematical background concerning generalized Warburg impedance. According to these papers, the generalized form of the Warburg element can be written in the following form:
where 0 < n < 1, A denotes a Warburg constant and . Wang notes in his paper [65] that a circuit element with an impedance described by (1) is sometimes referred to as a CPE. In terms of a core parameter estimation process, liquid-phase diffusion modeling is of most interest. Therefore, only the relationships used for liquid-phase diffusion modeling were focused on in the following.
First, Equation (1) was modified by applying the Euler’s formula and our nomenclature in order to make the mathematical deductions easier to follow. By implementing some simple mathematical operations, Equation (1) can be rewritten in the form of . By applying Euler’s formula, the following equation can be derived, which is in accordance with the form presented by the authors on page 12 [66]:
where denotes the Warburg coefficient and is a so-called dispersion parameter. Following the analogy of classical Warburg relationships, which is detailed for example on page 380 of A. Bard et al.’s book [67], is the fraction of the Warburg resistance and as follows:
where denotes the limiting diffusion resistance as a function of mobility [32]. stands for the fraction of the effective characteristic length and the related effective diffusion coefficient :
where is the characteristic length and is the related effective diffusion coefficient.
Expressing the generalized Warburg impedance in an electrochemical form is useful to determine the material parameters. Based on the electrochemical form of semi-infinite planar diffusion impedance (Equation (88) of [47]) when “inter-electrode distance is much larger than the characteristic diffusion length” and a supporting electrolyte may have been used, (2) can be rewritten in the following form:
where R denotes the universal gas constant, T stands for the absolute temperature, z represents the amount of charge involved in the reaction, F refers to Faraday‘s constant, is the Li-ion concentration in the diffusion material, denotes the intrin9sic Li-ion diffusion coefficient, and stands for the cross-sectional area of the cell perpendicular to the direction of ion transport. In this case, is equal to the cross-sectional area of the separator. 0 written in subscript denotes its intrinsic property instead of effective value. Before moving forward, it should be clarified that our technique seems to have a supporting electrolyte as most of the state-of-the-art Li-ion batteries do in order to minimalize their ionic resistances and improve the chemical stability of their electrolytes. Therefore, the diffusion of PF6 in the electrolyte is neglected. This concept has been confirmed by researchers who pointed out that the diffusion of Li+ controls the rate of ion transport within the range of salt concentrations of 0–2.5 M [68].
It is also important to note that (5) implies that the following criteria should be kept: excitation is quasi-equilibrium, that is, as well as and either the oxidant or reductant is not in the solution. By taking the real part of the Warburg impedance from Equation (5), the following equation can be derived:
where denotes the real part of the Warburg coefficient. Equation (6) serves as a basis for estimating electrochemical parameters in the following. There are four unknown core variables, namely , , and , and four independent equations are required to find the solution. Wang et al. [34] presented an approach to determine by fitting the real part of the impedance data against but is only valid for Fickian diffusion. Nevertheless, this method has been extended to the generalized case that can be mathematically expressed as:
where R’ denotes an offset and represents the gradient of the trend. Since macroscale electrochemical parameters are sought, the characteristic diffusion length expressed by Equation (4) was scaled to the inter-electrode level to obtain:
where denotes the intrinsic thickness of the unity cell, represents the Bruggeman coefficient and stands for the liquid fraction in the separator. In Equation (8), can be experimentally derived from the instantaneous resistance of the cell. The instantaneous resistance of the cell refers to shown in Figure 3 which can be quantified either from EIS or simple time-domain measurements. Measuring from EIS is trivial. In the case of time-domain measurements, J. Lindberg et al. [69] derived a mathematical formula to calculate according to:
where denotes the drop in the terminal voltage caused by steady-state concentration gradients for a given cell thickness and stands for the effective ionic conductivity. The first term on the right-hand side of Equation (9) is while the second term is the diffusion resistance. Since obtained from the instantaneous voltage drop is of interest, the second term was neglected. By integrating the first term in Equation (9) into the overall cell thickness, the following form was derived:
The coefficient of the term on the left-hand side can be expressed by the cell resistance which results in a simplified voltage form:
where denotes the initial terminal voltage of the cell. By measuring the terminal voltages of the cell against different load currents, can be determined by the gradient of the trend. By rearranging (10) in the form :
In (12), , , and can be deduced from the characteristic cell, while the values of , , and can be measured. Consequently, if Equations (8) and (12) are combined and inserted into (6), can be expressed as:
Once has been determined, and can also be estimated by Equations (12) and (8), respectively.
Up to this point, all the relationships which allow diffusion-related core parameters to be obtained have been presented. In the following, how our technique is able to determine the exchange current density and reaction rate constant by calculating characteristic geometrical parameters is shown. The word “characteristic” is used to indicate that the values are taken from the dataset of the characteristic cell so were not measured in this work. Here, it is highlighted that the parameters being estimated in the following might be different for the anode and cathode, moreover, their individual values could be measured by three-electrode measurements with Li metal as a reference. Although this method offers a solution for the lumped-parameter problem, three-electrode measurements still introduce issues concerning the placement of a reference electrode. Furthermore, our technique targets realistic in situ measurements of commercial instead of special experimental batteries where individual characteristics are inaccessible without cell abuse. This led us to consider as a lumped parameter which represents an average rate of both electrodes simultaneously. can be calculated by the simplified Butler-Volmer equation presented on page 99 in the book by Bard and Faulkner [67] that is valid for low overpotentials:
where Rct denotes the charge transfer resistance that can be experimentally determined by fitting on EIS data within the mid-frequency range.
In order to obtain , first some characteristic geometrical parameters must be calculated. The following calculations are based on our assumption that the total utilizable amount of charge the electrodes can accumulate is equal to the total number of Li ions in the cell which is given by the manufacturer. Therefore, it is necessary to calculate the utilizable amount of Li first by rearranging Faraday’s equation in the form of according to:
where Q denotes the nominal capacity of the cell. After that, the volume of the solid was calculated in the given electrode by the ratio of the utilizable amount of active particles per volume to the available number of active particles. Mathematically, this is:
where denotes the concentration of Li ions in the given electrode and the utilizable amount of Li ions in the solid phases reflects the material constraints the electrodes naturally have. According to the definition of porosity, it is possible to estimate the total volume of the given electrode based on the solid and liquid fractions:
Another important geometrical parameter is the active surface area which yields the area of the solid electrode particles surrounded by the electrolyte. It is the product of the specific particle surface and the total volume of the given electrode and can be expressed by:
The specific surface area of the particles of the electrode is . The thickness of the given electrode can be derived by dividing Equation (17) by Equation (18):
, , and can be calculated for both electrodes to roughly approximate their internal geometrical dimensions. Obviously, the estimated values of parameters expressed in (16)–(19) can moderately deviate from real data since they are based on both the assumptions of the characteristic cell and nominal values from manufacturer datasheets. Nevertheless, knowing these internal parameters—even with a moderate degree of uncertainty—is beneficial with regard to geometrical scaling of cells. It should be highlighted here that the most accurate geometrical data is accessible by using any of the direct measurement techniques mentioned in the Introduction. However, those procedures are unavailable for in situ measurements without having to dismantle the cell. can be calculated for both of the electrodes in a quasi-equilibrium state when the overpotential is small (<15 mV) by the fraction of for the given electrode and the concentration of Li ions at the electrode surface . Mathematically, this can be derived from the Butler-Volmer equation for a limiting case when the overpotential is very small. The formula from page 210 of Newman’s book [70] was adopted, that is:
where the units are , , and . is assumed to be equal to the solid concentration of the electrode . Since was measured as an average value of exchange current rates of the electrodes, also becomes a lumped parameter. Considering the parameters detailed so far, the reaction rate and implement the main terminal voltage characteristics during long-term battery usage in the finite element model. Even though these parameters usually change with the solid- and liquid-phase concentrations, the initial values of these parameters play an important role in modeling true battery dynamics.
An attempt was also made to estimate the order of magnitude of Ds without any additional measurements by assuming that the calculation of can be treated by considering the particle radius rp as a characteristic diffusion length. In other words, this idea implies an average approximation of the entire diffusion impedance curve by the tail part. In this sense, Ds was approximated by the formula taken from Krewer et al.’s paper [13] which gives the relationship between the diffusion time-constant, particle size and solid-phase diffusion coefficient according to:
where denotes an average particle radius of the given electrode.
In order to obtain a more reliable value of , GITT measurements were taken. The main procedure is detailed in the Materials and Methods section. was determined by the following relationship adapted from the literature [71]:
where denotes the duration of a current pulse, represents the number of moles of Li ions, stands for the molar volume of the cathode, refers to the change in voltage during the relaxation phase and is the change in voltage during the discharge period. Choi et al. [72] pointed out that calculation of by GITT is only possible for single-phase reaction which cathode shows.
4. Results
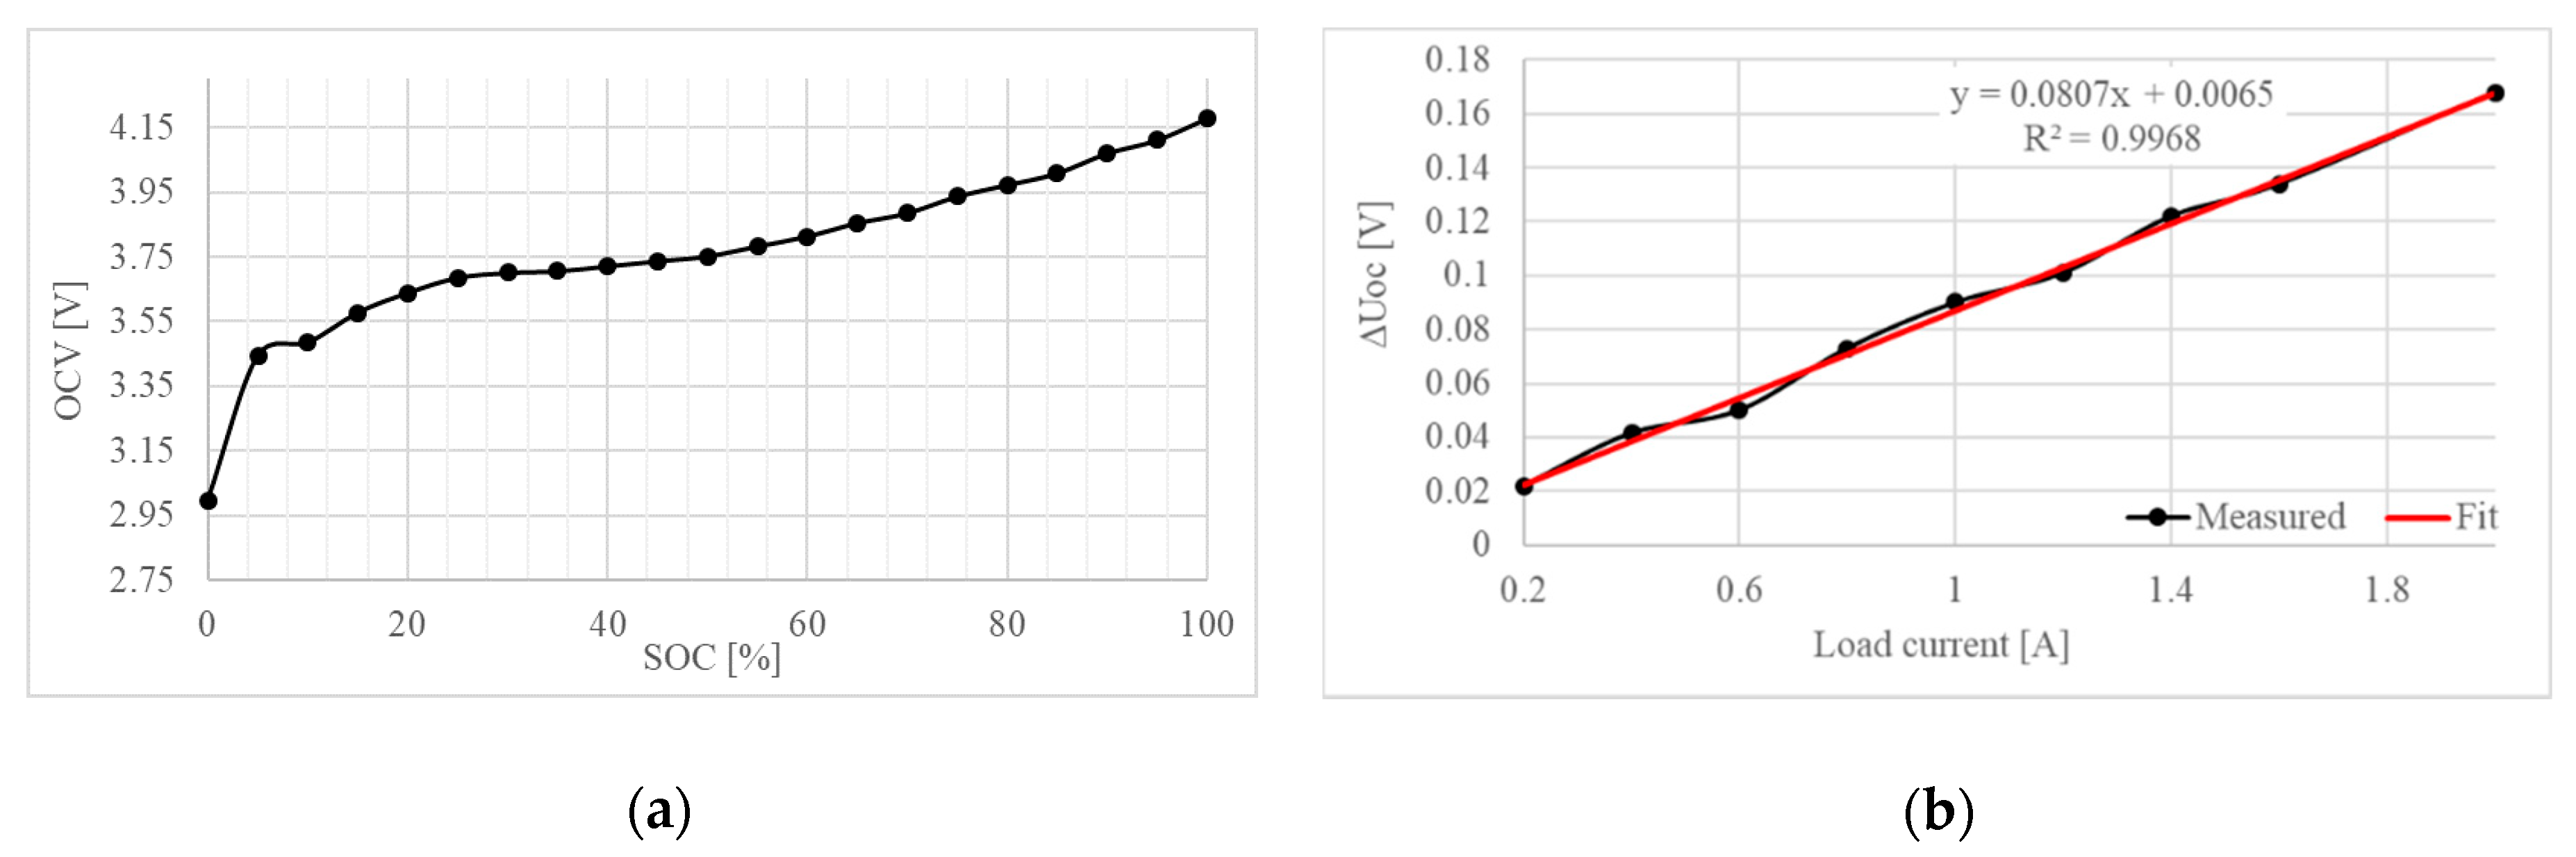
In order to detect the main cell dynamics in the time domain, first a quasi-equilibrium discharge was performed and the OCV-SoC discharge characteristic of the cell under a 0.1 C load current measured. Then, was determined from the gradient of a linear trend characterizing the instantaneous voltage drop upon the applied 0.2—2.0 A load currents. These results are presented in Figure 4.
The OCV-SoC curve exhibits a typical NMC discharge characteristic with a small plateau around 30% SoC and a rapid breakdown below 10% SoC. The results in Figure 4b show a linear characteristic within the applied current range. The linear fit has a gradient of 0.0807 with a small 0.0065 V bias. The fitness of 0.9968 seems to be adequate for the current purpose.
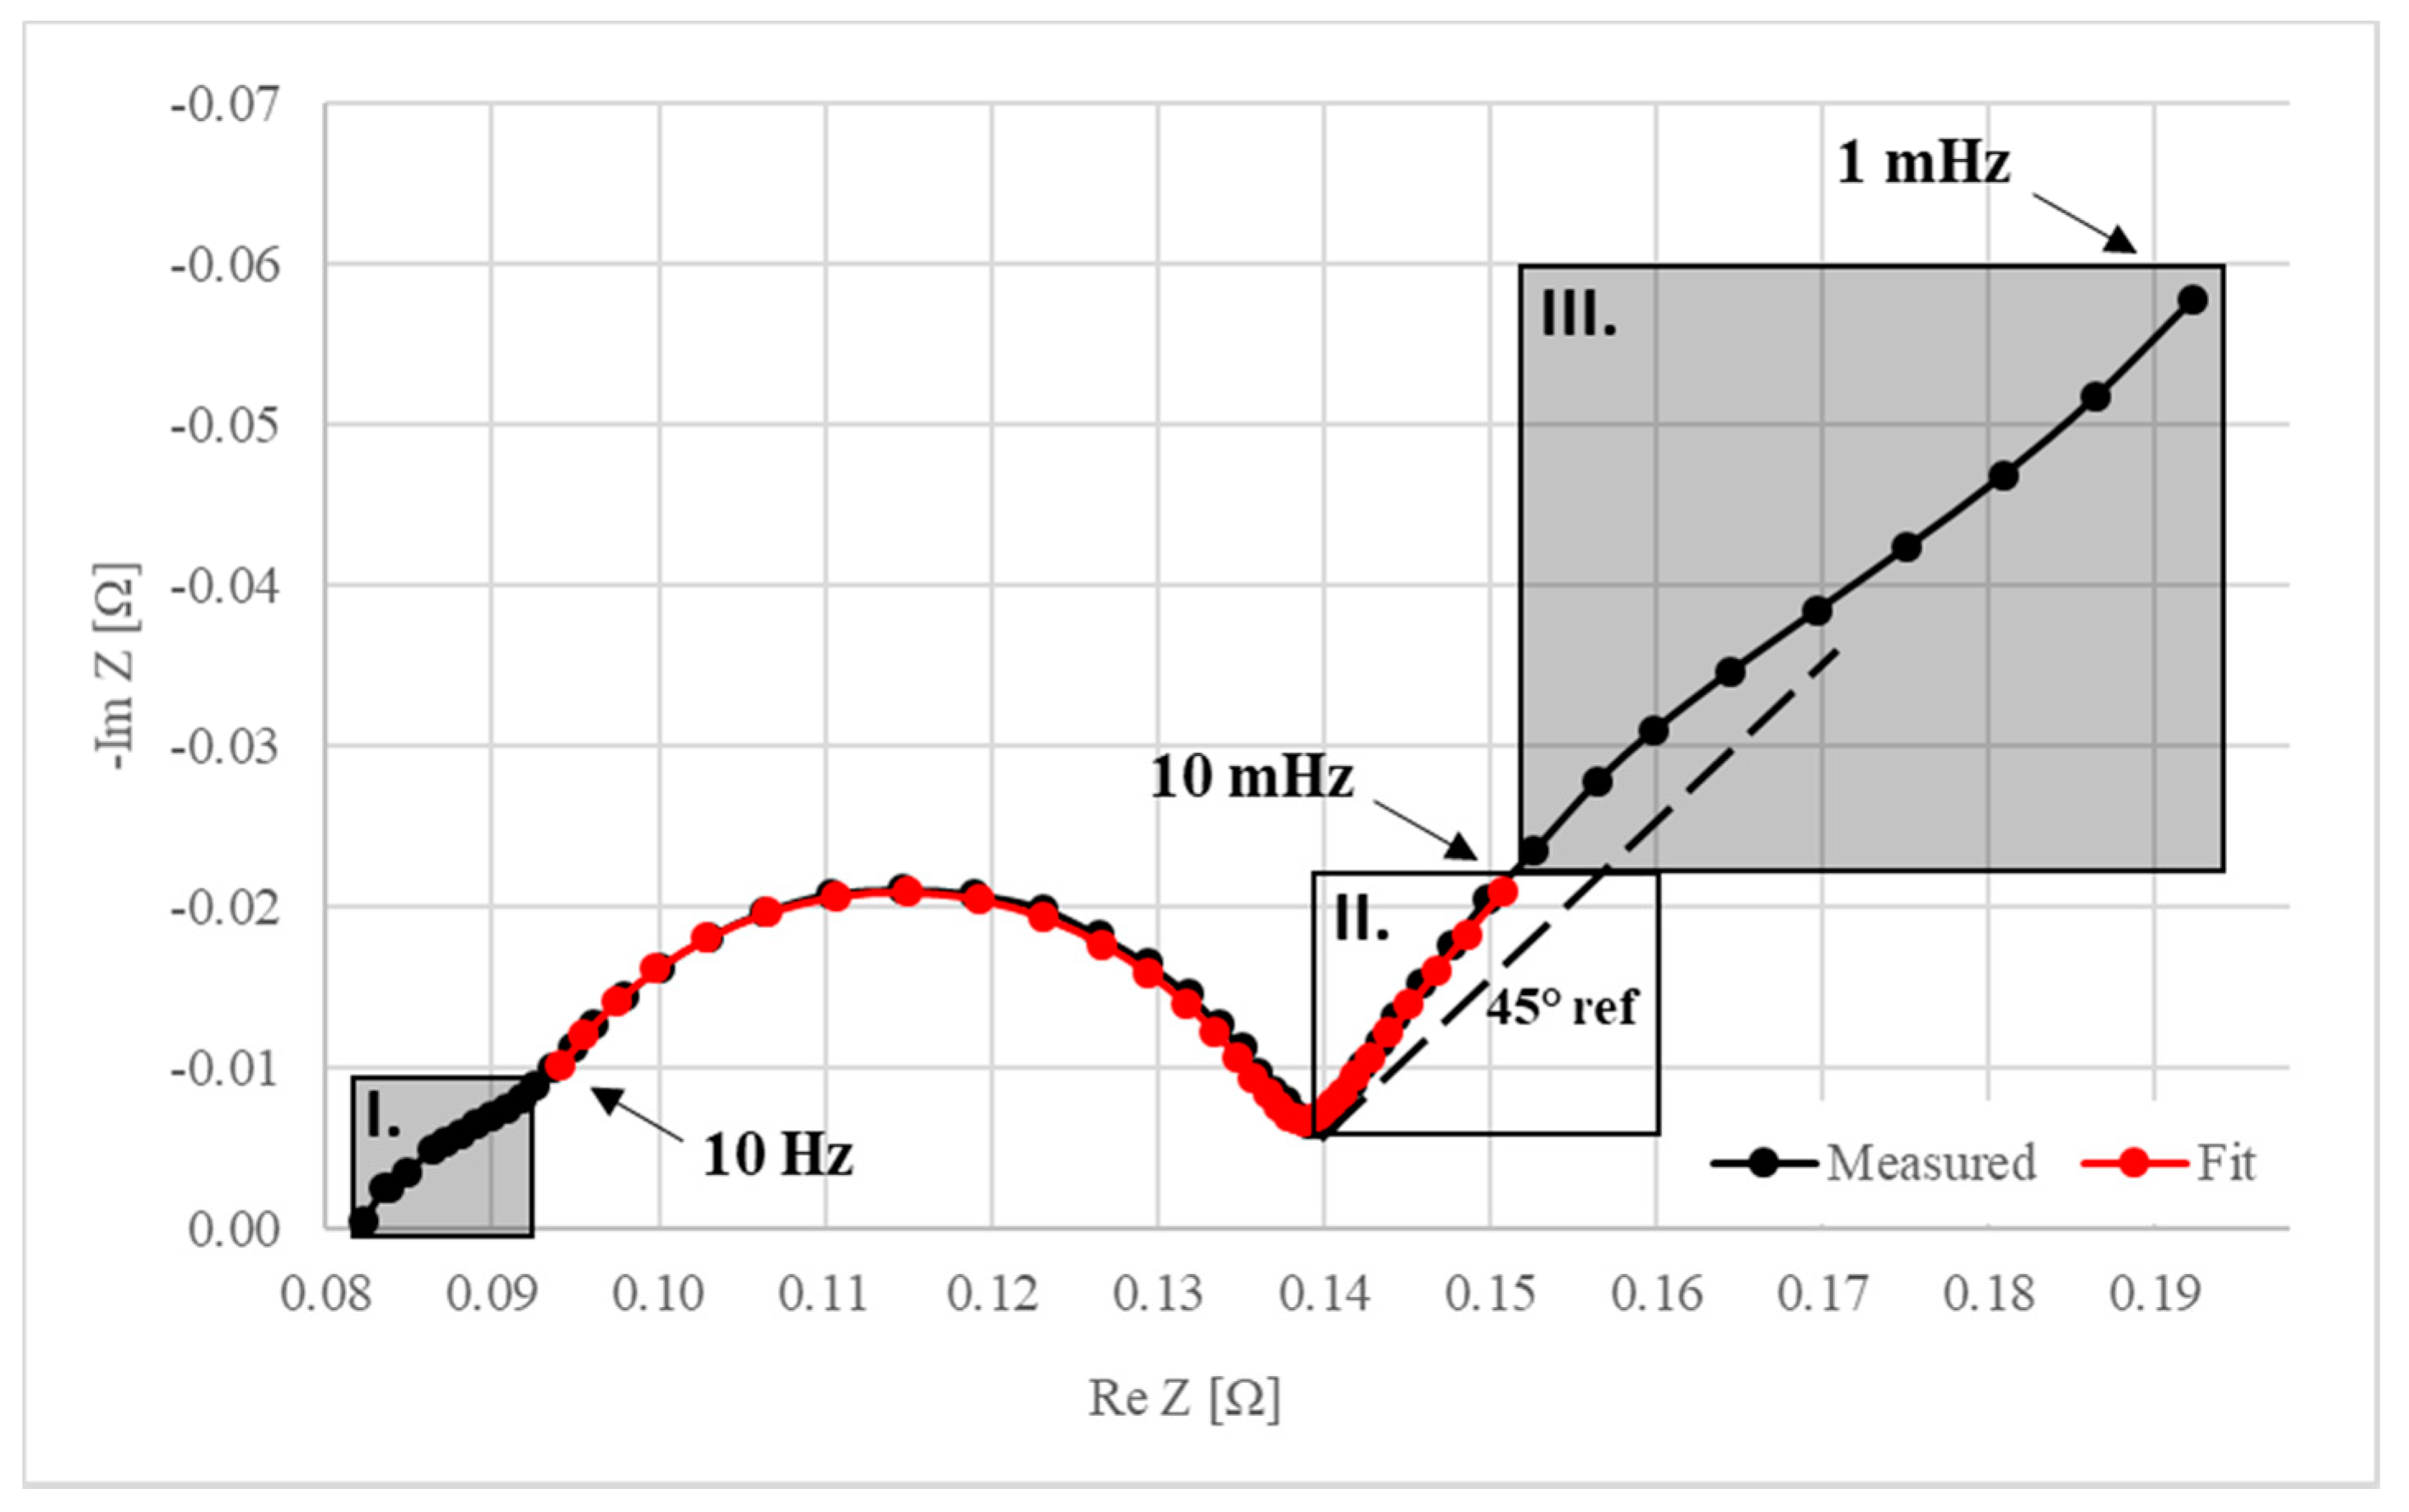
In order to obtain Randles circuit parameters and electrochemical parameters, EIS measurements were taken. The frequencies of EIS measurements swept from 100 kHz–1 mHz. The Nyquist plot of the inspected cell in its fully charged state at room temperature can be seen in Figure 5.
In Figure 5, the high-frequency part of the impedance spectrum above 251 Hz where the cell exhibits inductive behavior is irrelevant for the calculation of parameters so was neglected. The impedance response of the cell incorporates the characteristics of both electrodes so the individual characteristics of each electrode cannot be retrieved. Due to reasons mentioned in the Methodology section, the use of three-electrode measurements was avoided, therefore, limited information about the identical characteristics of the electrodes had to be relied on. Some research conducted in a scientific paper [60] states that the characteristics of the cathode dominate in a fully charged state. Therefore, EIS impedance characteristics shown in Figure 5. are more related to cathode processes. In Figure 5, the impedance curve crosses the real axis at 251 Hz where the real part of the impedance Rs is 0.0785 Ω which is really close to 0.0807 Ω that was measured by the instantaneous resistance method mentioned previously. In region I., an underlying first-order subsystem can be observed that results in a short, small bend on the impedance curve caused by the Solid Electrolyte Interface (SEI) film formed on the anode particles. Between regions I. and II., the relaxation effect of the electrode-electrolyte interface can be detected. In regions II. and III., the diffusion impedance was observed. As was referenced to in the Introduction, the tail that appears around 0.1 Hz is a result of liquid-phase diffusion. The tail is then followed by a transition zone to region III. where diffusion in the solid-phase dominates.
Relaxation in region I. typically occurs where the effect of the existing SEI film developed on the anode. However, as this appears at much higher frequencies than those of diffusion, the characteristics of liquid-phase diffusion are unaltered. From the viewpoint of parameter estimation, the most important region is region II.
The parameters of the Randles model were fitted and estimated by ZView software based on the EIS impedance data presented in Figure 5. The fitting algorithm was a non-linear least-squares method, further details of which are beyond the scope of the current paper.
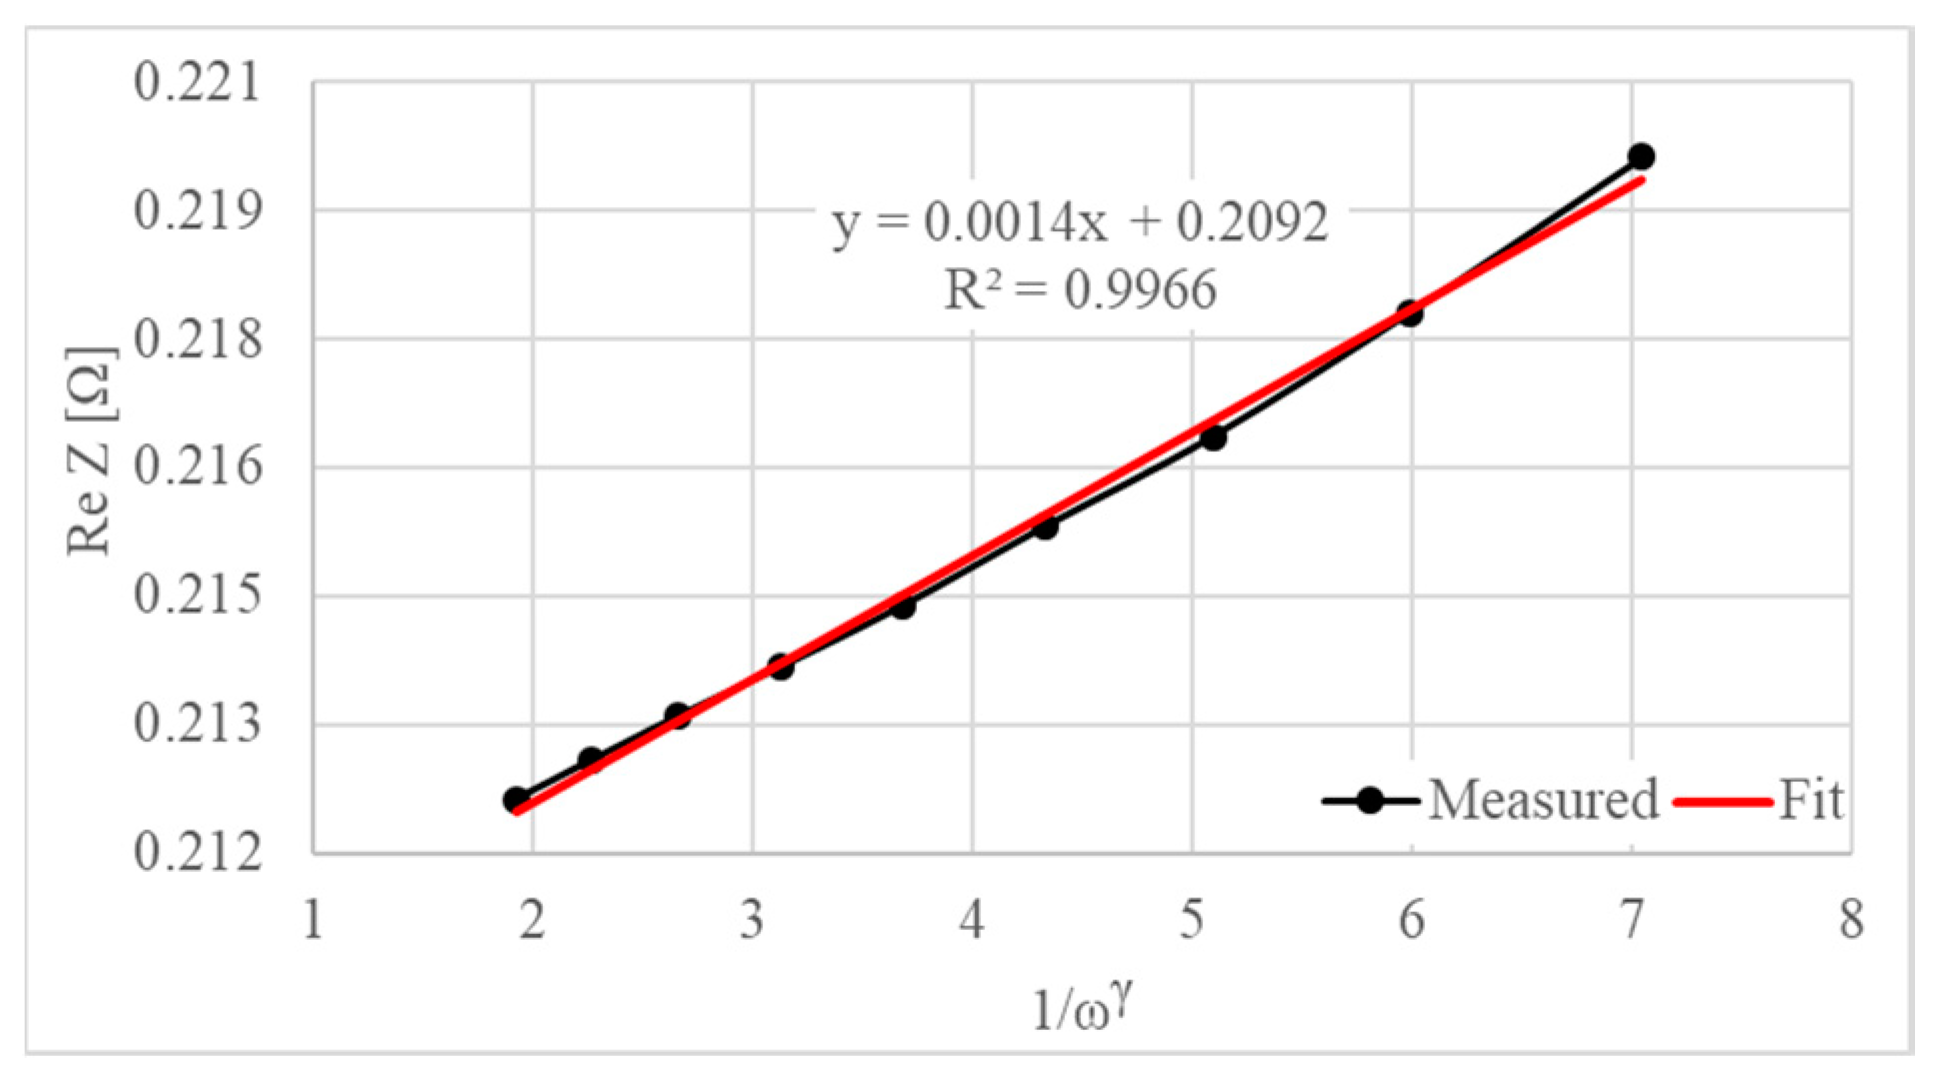
can be obtained if Re Z is plotted against . The measurements and fit can be seen in Figure 6.
The gradient of the linear trend is equal to which is 0.0014. , , , , and are Randles circuit parameters and their values were estimated by an EIS impedance fit. was determined by both instantaneous resistance and EIS measurements. was calculated by Equation (7). The estimated Randles circuit parameters are summarized in Table 2:
In order to gather solid-phase diffusion data, GITT measurements were run. GITT is based on a transient discharge where the load current is interrupted at given intervals where the cell starts to relax. The time interval should be equal for the load and relaxation phases, moreover, it should be set as wide as the diffusion processes become clearly observable and separable from the double layer effect. The applied load current should be sufficiently small to maintain the cell around a quasi-equilibrium state during the discharge process. The discharge-relaxation cycles are usually repeated until the cell reaches the lower voltage threshold. Then, can be calculated by (22) for every cycle which results in a function of over SoC.
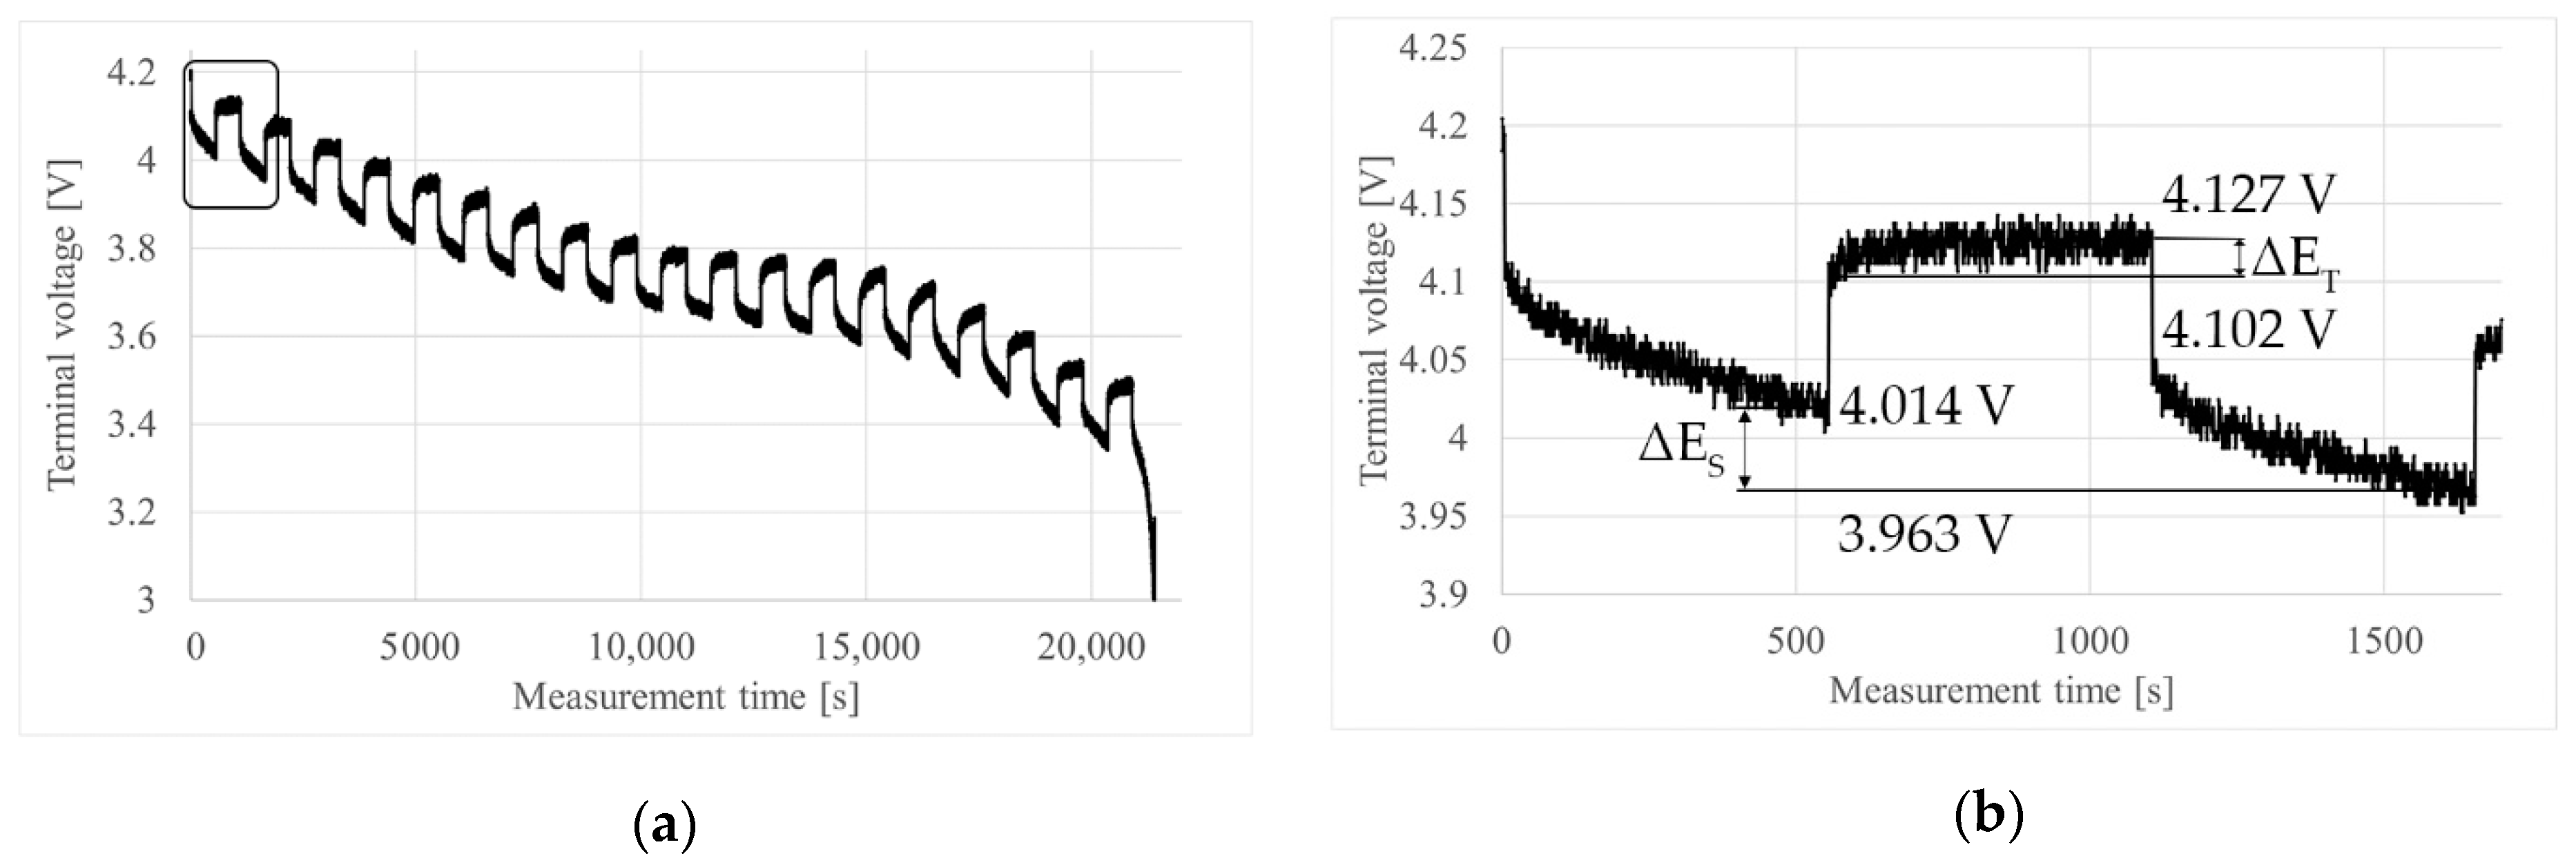
In our case, only one value of was sought, thus only one GITT cycle was carried out. The terminal voltage of the cell was 4.2 V at the beginning of the discharge. The time interval was set at 550 s, the results of which can be seen in Figure 7. The pulse-width was set at 550 s with an applied load current of 0.3 C. The pulse-width of 550 s has been chosen on the basis of EIS result presented in Figure 5. Solid-phase diffusion control starts to build up and dominate if there is enough time for transition to the solid phase and transport of Li-ion inside the solid matrix. According to [47], solid-phase diffusion phenomenon can be identified by a double-bended curve appearing in the Nyquist diagram of diffusion impedance at very low frequencies. In the particular case, it can be observed in region III. of Figure 5, that is in the frequency range of 1 to 10 mHz—corresponding to a periodic time of 1000 s to 100 s. It infers that if current is allowed to continuously flow in the same direction for more than 50 s (half-period of 100 s), diffusion profile can build up in the solid matrix and tends to control the overall reaction as the periodic time increases. Based on this consideration, the pulse-width of 550 s (periodic time of 1100 s, corresponding to a frequency less than 1 mHz) seemed to be an adequate time window for GITT to certainly detect solid-phase diffusion. Although the value could be further increased, we did not want to significantly exceed the measurement range where EIS has been applied. In addition, the pulse-width of 550 s is in a good agreement with the range published in [73]. and were measured as −0.0253 and 0.051, respectively. The lumped value of was calculated by (22) as 2.320 × 10⁻¹³ m2/s.
5. Discussion
In the previous section, the Randles circuit parameters and were estimated. Based on the Randles circuit parameters, it is possible to calculate , , and using Equation (8) and Equations (11)–(13), respectively. Equations (15)–(19) are devoted to calculating the characteristic parameters for the specific electrodes. The complete list of estimated parameters is summarized in Table 3:
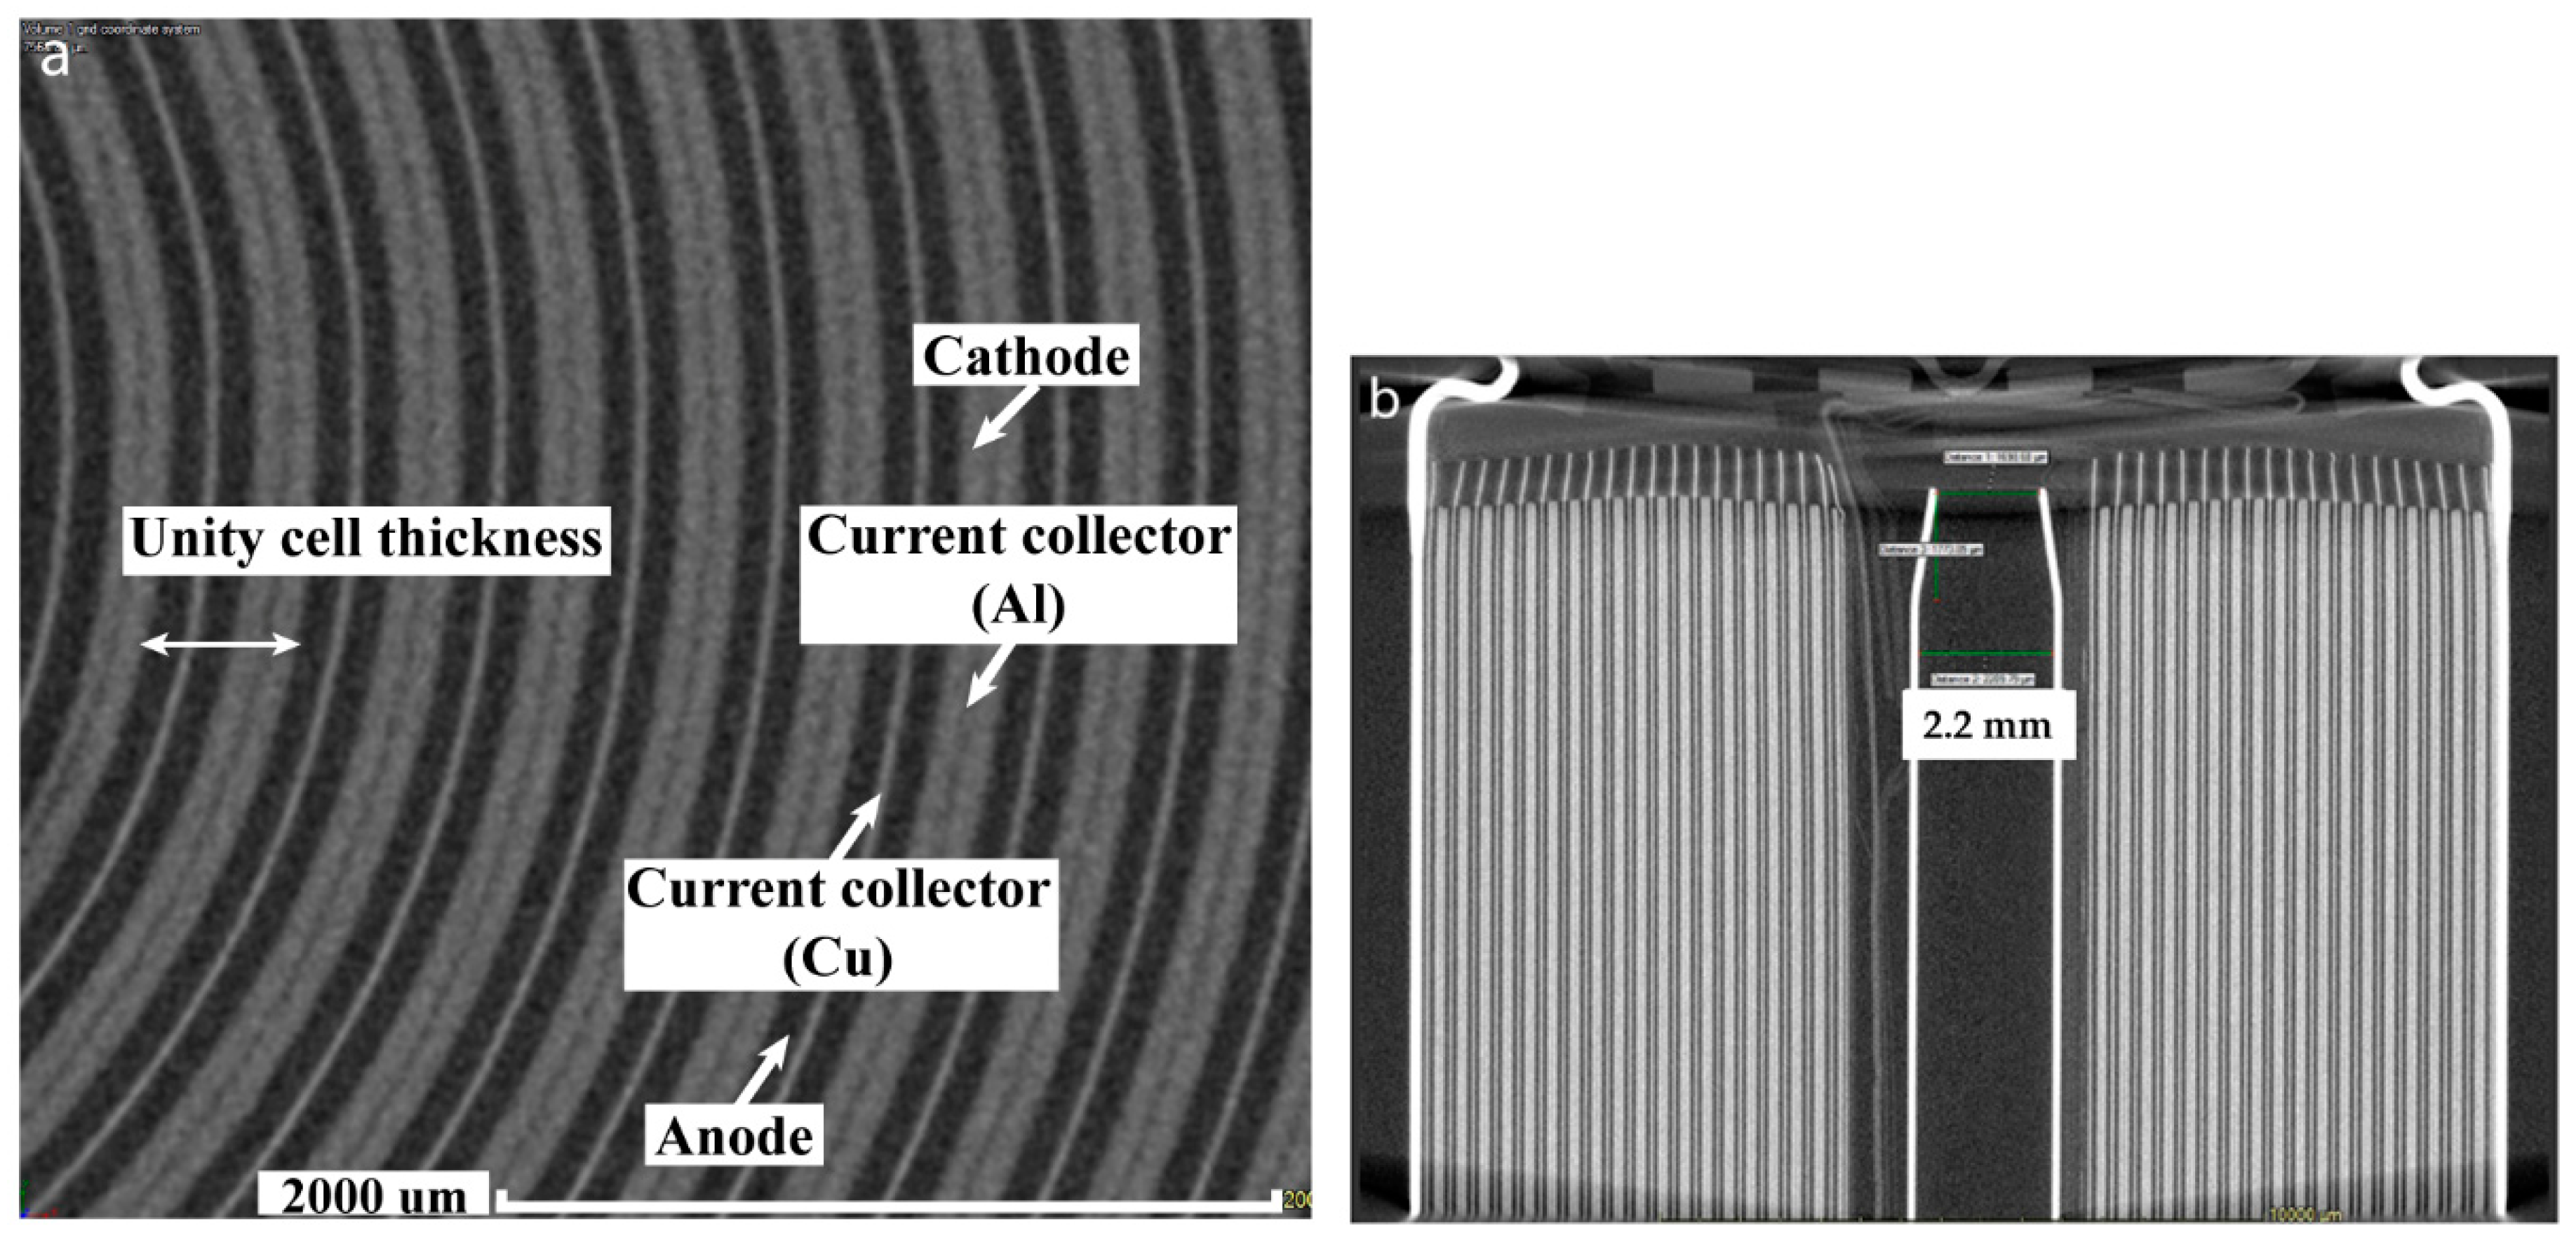
A comparison of the calculated electrochemical and geometrical values with those from the literature and CT data was made to prove their applicability in FEA. The comparison of the calculated values shown in Table 3. with data from the literature is not straightforward due to the lack of references for 18,650 NMC111-graphite-type cells. However, Valoen et al. [58] and Lee et al. [77] summarized a general range of liquid-phase diffusion between 1.4 × 10⁻⁹ and 6.0 × 10⁻¹⁰ m2/s. Tsai et al. [78] showed that usually falls within the range of 0.1–1.0 . It was assumed that this is due to the higher conductivity and mobility of the electrolyte than in general. In order to verify the calculated geometrical values, a CT analysis was performed on the cell since CT is able to provide high-resolution images from the geometrical dimensions and configurations of the electrodes, separators and current collectors. The main geometrical structure of the cell and the configuration of its layers can be seen in Figure 8.
In Figure 8, the type of each layer can be identified by their color and position. The brighter the color the higher the molar weight of the given material. On the other hand, anode which has a copper as high-density current collector (brighter color) is always attached next to the battery can thus, it serves as a good reference in component identification.
According to Equation (8), the cell consists of a spirally wrapped jelly roll. Thus, the unwrapped, total length of the electrode was calculated by:
where the corresponding values were determined by visual observations. The number of turns N was 18, inner diameter of the cell d was 4 mm and thickness of the layer l was 420 mm. The calculated area of the separator was:
where the height of the electrode sandwiches h was 58 mm. was measured to be 1496 µm resulting from an average thickness of 7 distinct intervals. The thickness of one electrode was measured to be approximately 80 µm. The separator area was calculated to be 0.068 m2 based on (24). The results of the calculated and measured geometrical values are compared in Table 4:
As can be seen, there is a moderate error between the calculated and measured data. On the one hand, it is important to note that some constructional imperfections and asymmetries can be detected in Figure 8 due to crumpled wrapping especially next to the mandrel that may introduce some errors into the calculations. On the other hand, and are sensitive parameters and strongly depend on the exact values of , , and which were now only assumed through the characteristic cell. Considering these uncertainties and the inaccuracy of in situ measurements, the presented technique reached its performance limit. The results can be further improved by averaging multiple measurements on the same type of cell and/or measuring multiple cells of the same type and taking the average of their values.
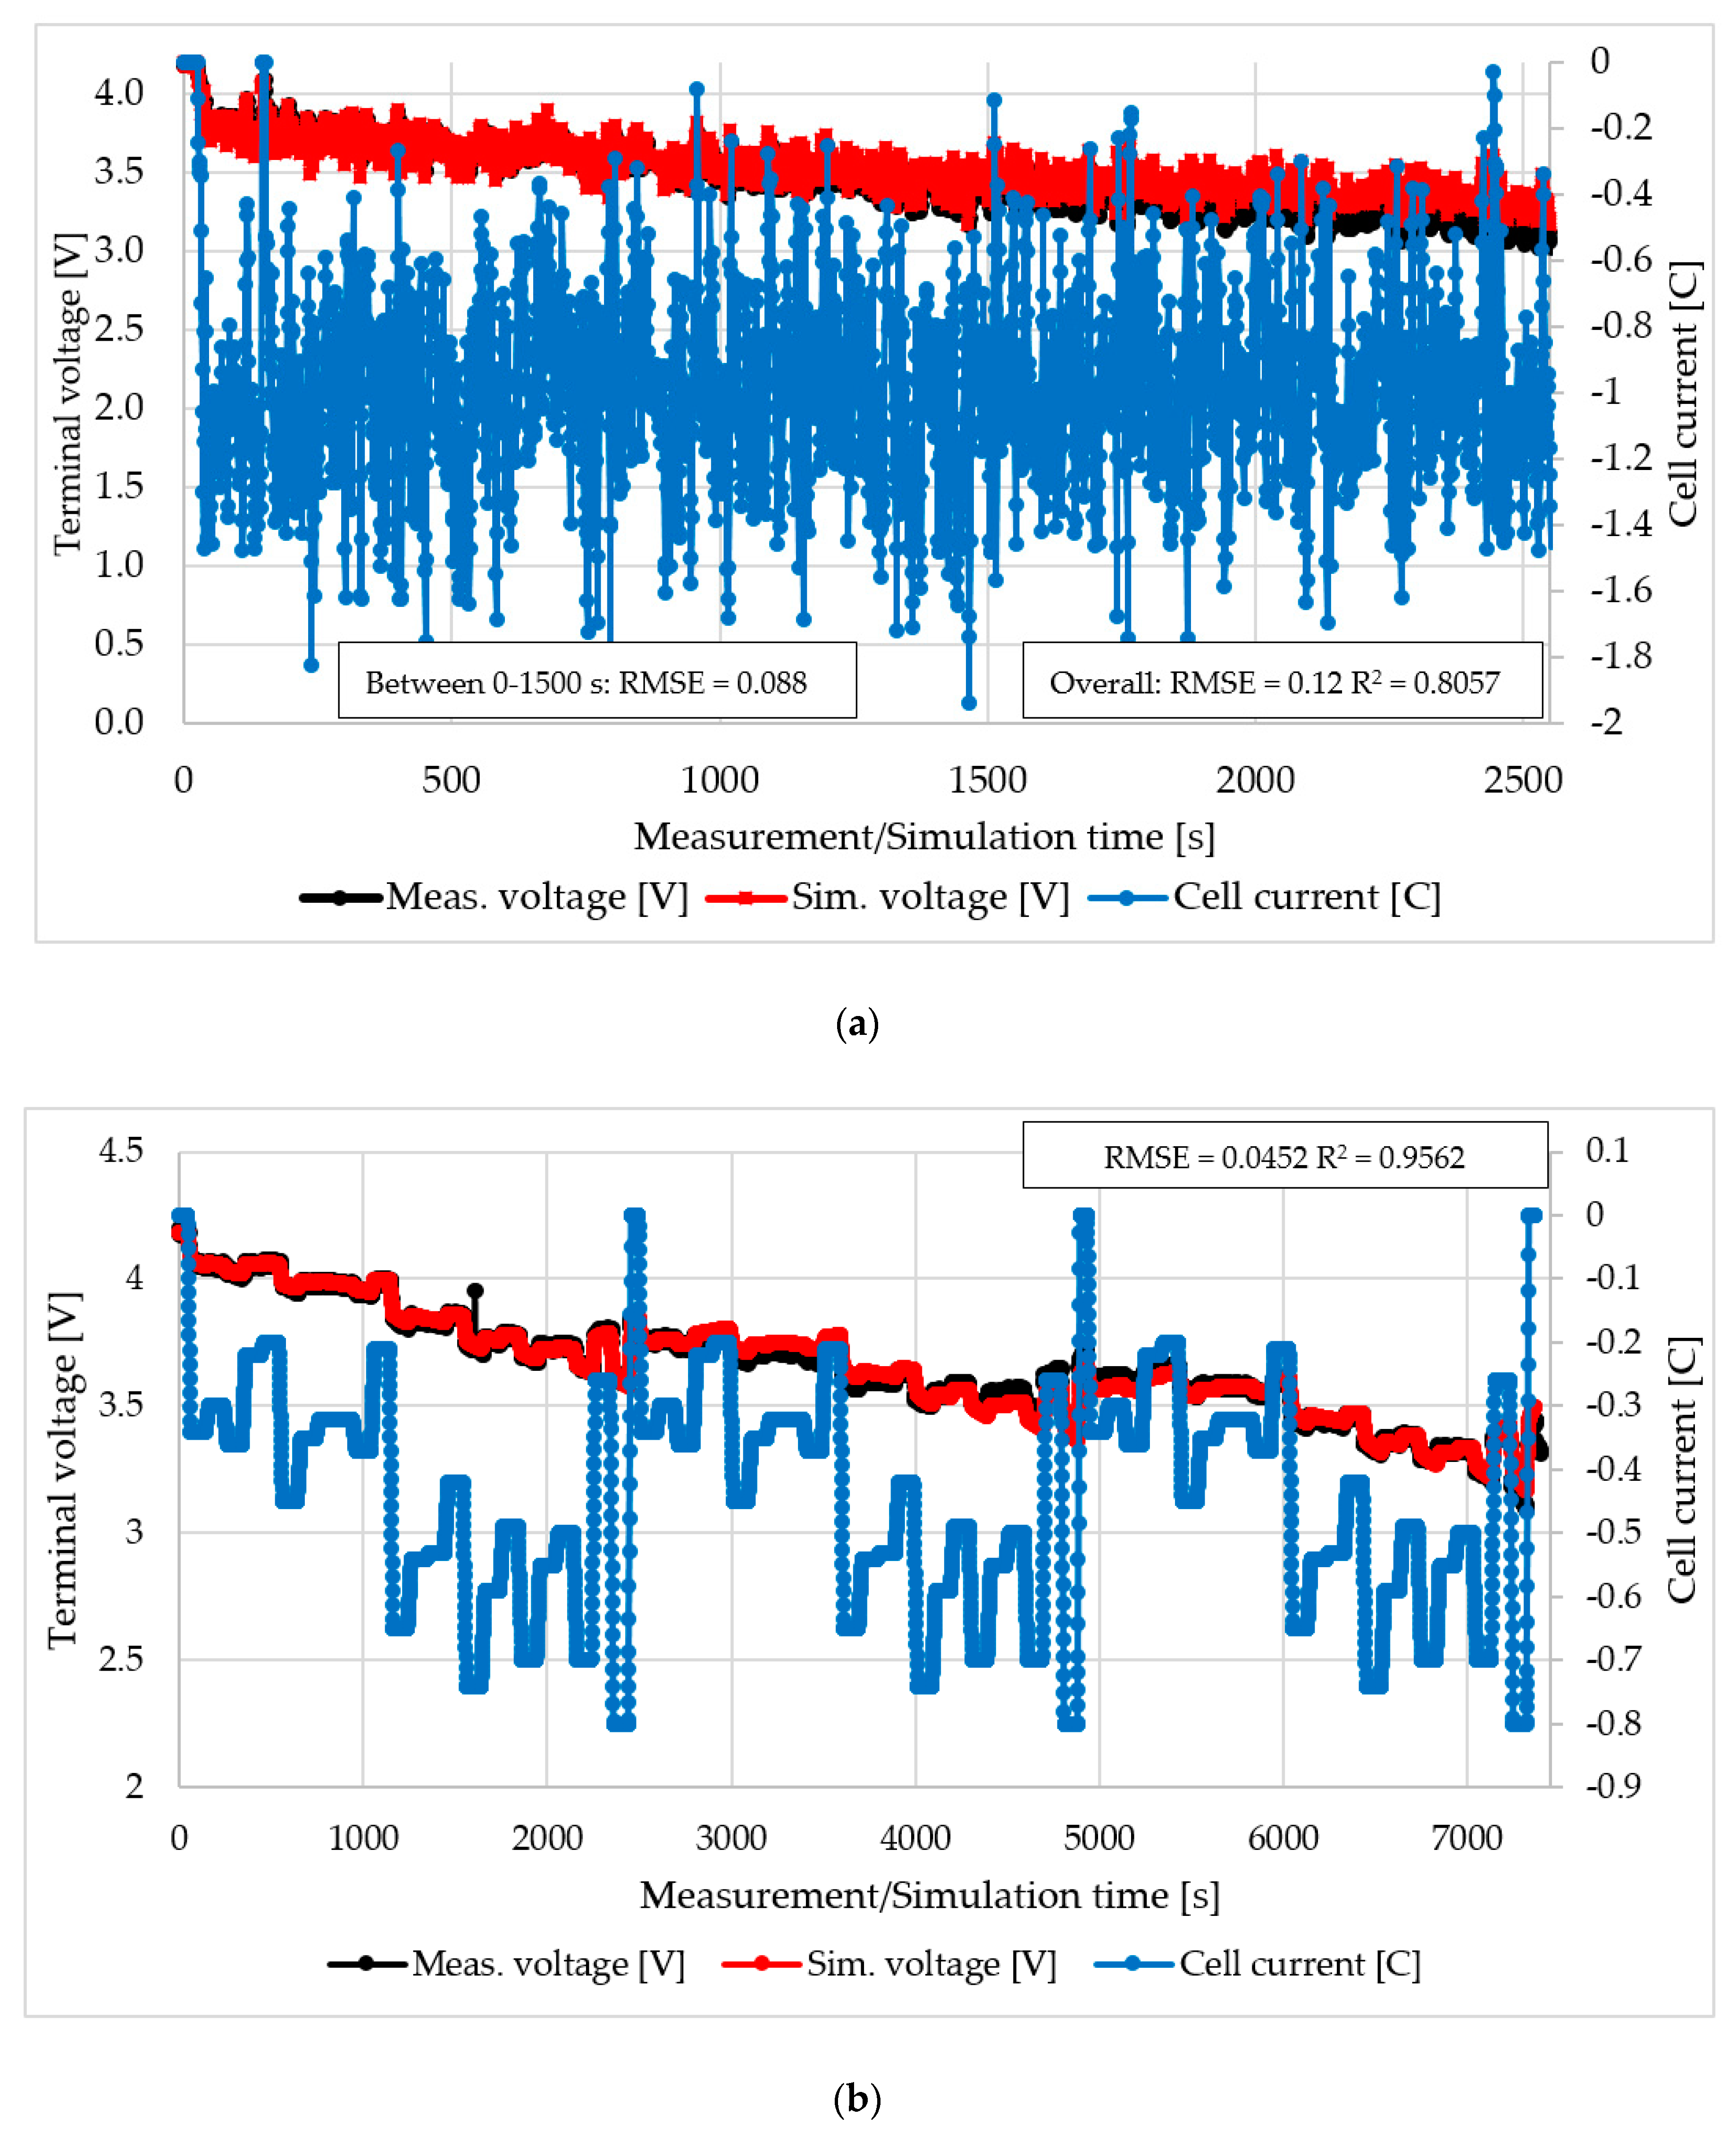
Not only did the geometrical parameters need to be validated but the applicability and accuracy of the whole parameter set in the DFN battery model had to be tested. The terminal voltage of the battery is a typical indicator of the battery dynamics, therefore, the DFN simulation outcome was used for this purpose by its comparison with measurements. The DFN based battery dynamics has been evaluated by running two types of test cases. One was dedicated for 1 C transient discharge with short current impulses while the other was used to obtain long-term voltage response by an average of applied 0.3 C load current. The results have been plotted in Figure 9.
The simulation results reveal that the simulated terminal voltage curve accurately fits the measurements and reflects the cell dynamics well. The regression in Figure 9a has an overall root-mean-square error (RMSE) of 0.12 and a R-squared of 0.8057 while in Figure 9b, these values are 0.0452 and 0.9562, respectively. In Figure 9b, the error reaches its maximum value at approximately 4700 s. In Figure 9a,b, the error between the measurement and simulation data has been mainly addressed to the changes of electrochemical parameters such as and in a function of and temperature during discharge. This effect can be tracked by an increased value of the RMSE after 1500 s in Figure 9a. The implementation of and functions is beyond the scope of the current work.
6. Conclusions
In this paper, a strategy for how to estimate a set of electrochemical parameters of a battery for a finite-element battery model was outlined. The estimated parameters are summarized in Table 5.
The parameters shown in Table 5 are vital to construct a valid DFN battery model in, for example, finite-element battery simulations. Although plenty of studies have focused on the composition of batteries and possible ways of parameter extraction, these works usually concerned different cells and resulted in scattered data between different battery types. On the other hand, the calculation of geometrical properties of a cell is necessary to obtain a valid cell model. However, there is a lack of scientific papers which show how to measure geometrical parameters in situ when the cell cannot be dismantled. We considered this problem as a bottleneck of finite-element modeling.
Our aim was to develop a strategy for how decisive battery-related data from indirect in situ measurements could be obtained which provide the missing parameters for DFN models. Our hypothesis was that it is possible to retrieve main geometrical and electrochemical parameters from liquid-phase diffusion impedance which represent a realistic cell with a sufficient accuracy. We have decomposed our procedure into two main phases. First, the core diffusion-related parameters were estimated, then geometrical and electrochemical parameters determined by using our characteristic cell model. The experimental data was measured by EIS, an instantaneous resistance measurement and we used CT and GITT for parameter validation. Even though a moderate error has been resulted in between the measured and estimated cathode thicknesses, its estimated value is still useful as an initial guess in simulations. The rest of the calculated parameter values are in a good accordance with the literature and measured data. Furthermore, based on the negligible error between the simulated and measured battery dynamics, it was stated that the tail part of the diffusion impedance is suitable for diffusion-related parameter extraction. Considering the inherent parameter uncertainties, the validity limit of the DFN model and the unavoidable measurement noise, our technique is recommended to use for simulations up to 1 C cell currents.
Author Contributions
Conceptualization, B.C.; Data curation, B.C.; Formal analysis, B.C.; Funding acquisition, I.V.; Investigation, B.C.; Methodology, B.C.; Project administration, I.V.; Resources, D.F.; Software, B.C.; Supervision, D.F.; Visualization, B.C.; Writing—original draft, B.C.; Writing—review and editing, D.F. and I.V. All authors have read and agreed to the published version of the manuscript.
Funding
This work was supported by the TKP2020-IKA-07 project financed under the 2020-4.1.1-TKP2020 Thematic Excellence Programme by the National Research, Development and Innovation Fund of Hungary.
Acknowledgments
This work was supported by the TKP2020-IKA-07 project financed under the 2020-4.1.1-TKP2020 Thematic Excellence Programme by the National Research, Development and Innovation Fund of Hungary. The authors thanks for the support of “National Laboratories 2020 Program—Autonomous Systems Subprogram—Establishment of the National Laboratory of Autonomous Systems at Széchenyi István University (NKFIH-869-9/2020)” project. The authors are also grateful to Zoltán Lukács and Tamás Kristóf for the support in electrochemical impedance spectroscopy (EIS) and their professional help in the revision of the theoretical background presented in this paper. B.Cs. would like to thank Szabolcs Kocsis-Szürke and András Kovács for their support in making battery measurements and computed tomography, respectively.
Conflicts of Interest
The authors declare no conflict of interest.
Abbreviations
| Parameter Name | Symbol | Unit |
| Nominal capacity | Q | As |
| Molar mass of Li-ion | MLi | g/mole |
| Utilizable amount of Li-ion in the given electrode | - | |
| Cell load current | A | |
| Maximum Li concentration in cathode | ccat,max | mole/m3 |
| Maximum Li concentration in anode | can,max | mole/m3 |
| Li concentration at the electrode surface | csurf | mole/m3 |
| Initial salt concentration in the solution | mole/m3 | |
| Amount of electrons participating | z | - |
| Volume fraction of liquid phase in the separator | - | |
| Volume fraction of liquid phase in the cathode | - | |
| Volume fraction of liquid phase in the anode | - | |
| Volume fraction of active material in the cathode | - | |
| Volume fraction of active material in the anode | - | |
| Particle radius in the cathode | ||
| Particle radius in the anode | ||
| Bruggeman-coefficient | - | |
| Electrolyte conductivity | S/m | |
| Effective electrolyte conductivity | S/m | |
| Transference number | - | |
| Absolute temperature | T | K |
| Universal gas constant | R | |
| Faraday-constant | F | |
| Electromotive force | ||
| Electric potential | ||
| Initial electric potential | ||
| Li diffusion coefficient in the electrolyte | ||
| Unity cell thickness | ||
| Solid-phase diffusion coefficient of Li | ||
| Solid phase concentration | ||
| Effective diffusion coefficient | ||
| Effective thickness | ||
| Separator area | ||
| Exchange current density | ||
| Amount of Li | mole | |
| Cathodic reaction rate constant | ||
| Anodic reaction rate constant | ||
| Cathode active surface area | ||
| Anode active surface area | ||
| Cathode thickness | Lcat | |
| Anode thickness | Lan | |
| Separator thickness | Lsep | |
| Diffusion coefficient inside the electrode | ||
| Volume of the solid matrix in the given electrode | ||
| Volume of liquid in the given electrode | ||
| Total volume of the given electrode | ||
| Specific surface area of the given electrode | a | 1/m |
| Unwrapped length of the electrodes | ||
| Number of turns of jelly-roll | N | - |
| Inner diameter of the battery can | d | mm |
| Height of the electrodes | h | |
| Layer thickness of a unity cell sandwich | l | |
| Cell serial resistance | ||
| Charge transfer resistance | ||
| CPE to model double-layer effect | F | |
| Excitation angular frequency | ||
| Dispersion parameter | - | |
| Diffusion time constant of Warburg element | s | |
| Warburg diffusion impedance | ||
| Warburg-coefficient | Ωm2/s0.6868 | |
| Real part of Warburg-coefficient | Ωm2/s0.6868 | |
| Interruption time interval | s | |
| Relaxation voltage difference (in GITT) | ||
| Discharge voltage difference (in GITT) |
References
- Redondo-Iglesias, E.; Venet, P.; Pelissier, S. Efficiency Degradation Model of Lithium-Ion Batteries for Electric Vehicles. IEEE Trans. Ind. Appl. 2019, 55, 1932–1940. [Google Scholar] [CrossRef] [Green Version]
- Klass, V. Battery Health Estimation in Electric Vehicles; KTH Royal Institute of Technology: Stockholm, Sweden, 2015. [Google Scholar]
- Hoffmann, L.; Grathwol, J.K.; Haselrieder, W.; Leithoff, R.; Jansen, T.; Dilger, K.; Dröder, K.; Kwade, A.; Kurrat, M. Capacity Distribution of Large Lithium-Ion Battery Pouch Cells in Context with Pilot Production Processes. Energy Technol. 2020, 8, 8. [Google Scholar] [CrossRef]
- Doyle, M.; Newman, J.; Gozdz, A.S.; Schmutz, C.N.; Tarascon, J.M. Comparison of modeling predictions with experimental data from plastic lithium ion cells. J. Electrochem. Soc. 1996, 143, 1890–1903. [Google Scholar] [CrossRef]
- Ekström, H.; Lindbergh, G. A model for predicting capacity fade due to SEI formation in a commercial graphite/LiFePO4 cell. J. Electrochem. Soc. 2015, 162, A1003–A1007. [Google Scholar] [CrossRef]
- Ramadass, P.; Haran, B.; White, R.; Popov, B.N. Mathematical modeling of the capacity fade of Li-ion cells. J. Power Sources 2003, 123, 230–240. [Google Scholar] [CrossRef]
- Ramadass, P.; Haran, B.; Gomadam, P.M.; White, R.; Popov, B.N. Development of First Principles Capacity Fade Model for Li-Ion Cells. J. Electrochem. Soc. 2004, 151, 196–203. [Google Scholar] [CrossRef]
- Safari, M.; Morcrette, M.; Teyssot, A.; Delacourt, C. Multimodal physics-based aging model for life prediction of Li-Ion batteries. J. Electrochem. Soc. 2009, 156. [Google Scholar] [CrossRef]
- Ning, G.; White, R.E.; Popov, B.N. A generalized cycle life model of rechargeable Li-ion batteries. Electrochim. Acta 2006, 51, 2012–2022. [Google Scholar] [CrossRef]
- Warner, J. The Handbook of Li-ion Battery Pack Design (Chemistry, Components, Types, Terminology); Elsevier: Amsterdam, The Netherlands, 2015; ISBN 9780128014561. [Google Scholar]
- Fink, C.; Kaltenegger, B. Electrothermal and Electrochemical Modeling of Lithium-ion Batteries: 3D Simulation with Experimental Validation. ECS Trans. 2014, 61, 105–124. [Google Scholar] [CrossRef]
- Jin, N.; Danilov, D.L.; Van den Hof, P.M.J.; Donkers, M.C.F. Parameter estimation of an electrochemistry-based lithium-ion battery model using a two-step procedure and a parameter sensitivity analysis. Int. J. Energy Res. 2018, 42, 2417–2430. [Google Scholar] [CrossRef]
- Krewer, U.; Röder, F.; Harinath, E.; Braatz, R.D.; Bedürftig, B.; Findeisen, R. Review—Dynamic models of Li-Ion batteries for diagnosis and operation: A review and perspective. J. Electrochem. Soc. 2018, 165, A3656–A3673. [Google Scholar] [CrossRef]
- Trembacki, B.L.; Vadakkepatt, A.; Roberts, S.A.; Murthy, J.Y. Volume-averaged electrochemical performance modeling of 3D interpenetrating battery electrode architectures. J. Electrochem. Soc. 2020, 167. [Google Scholar] [CrossRef]
- Lin, C.; Tang, A.; Wang, W. A Review of SOH Estimation Methods in Lithium-ion Batteries for Electric Vehicle Applications. Energy Procedia 2015, 75, 1920–1925. [Google Scholar] [CrossRef] [Green Version]
- Wu, J.; Fenech, M.; Webster, R.I.; Tilley, R.; Sharma, N. Electron microscopy and its role in advanced lithium-ion battery research. Sustain. Energy Fuels 2019, 3, 1623–1646. [Google Scholar] [CrossRef]
- Pietsch, P.; Wood, V. X-Ray Tomography for Lithium Ion Battery Research: A Practical Guide. Annu. Rev. Mater. Res. 2017, 47, 451–479. [Google Scholar] [CrossRef]
- Matadi, B.P.; Geniès, S.; Delaille, A.; Chabrol, C.; De Vito, E.; Bardet, M.; Martin, J.F.; Daniel, L.; Bultel, Y. Irreversible capacity loss of Li-ion batteries cycled at low temperature due to an untypical layer hindering Li diffusion into graphite electrode. J. Electrochem. Soc. 2017, 164, A2374–A2389. [Google Scholar] [CrossRef]
- Simari, C.; Lufrano, E.; Coppola, L.; Nicotera, I. Composite gel polymer electrolytes based on organo-modified nanoclays: Investigation on lithium-ion transport and mechanical properties. Membranes 2018, 8, 69. [Google Scholar] [CrossRef] [Green Version]
- Pecher, O.; Carretero-Gonzalez, J.; Griffith, K.J.; Grey, C.P. Materials’ methods: NMR in battery research. Chem. Mater. 2017, 29, 213–242. [Google Scholar] [CrossRef] [Green Version]
- Ramadesigan, V.; Chen, K.; Burns, N.A.; Boovaragavan, V.; Braatz, R.D.; Subramanian, V.R. Parameter estimation and capacity fade analysis of lithium-ion batteries using reformulated models. J. Electrochem. Soc. 2011, 158, 1048–1054. [Google Scholar] [CrossRef]
- Chen, L.; Xu, R.; Rao, W.; Li, H.; Wang, Y.P.; Yang, T.; Jiang, H. Bin Electrochemical model parameter identification of lithium-ion battery with temperature and current dependence. Int. J. Electrochem. Sci. 2019, 14, 4124–4143. [Google Scholar] [CrossRef]
- Muenzel, V.; Hollenkamp, A.F.; Bhatt, A.I.; De Hoog, J.; Brazil, M.; Thomas, D.A.; Mareels, I. A comparative testing study of commercial 18650-format lithium-ion battery cells. J. Electrochem. Soc. 2015, 162, A1592–A1600. [Google Scholar] [CrossRef] [Green Version]
- Zhang, L.; Wang, L.; Lyu, C.; Li, J.; Zheng, J. Non-destructive analysis of degradation mechanisms in cycle-aged graphite/LiCoO2 batteries. Energies 2014, 7, 6282–6305. [Google Scholar] [CrossRef] [Green Version]
- Murbach, M.D.; Schwartz, D.T. Analysis of li-ion battery electrochemical impedance spectroscopy data: An easy-to-implement approach for physics-based parameter estimation using an open-source tool. J. Electrochem. Soc. 2018, 165, A297–A304. [Google Scholar] [CrossRef]
- Pizarro-Carmona, V.; Cortés-Carmona, M.; Palma-Behnke, R.; Calderón-Muñoz, W.; Orchard, M.E.; Estévez, P.A. An optimized impedance model for the estimation of the state-of-charge of a Li-ion cell: The case of a LiFePO 4 (ANR26650). Energies 2019, 12, 681. [Google Scholar] [CrossRef] [Green Version]
- Meyers, J.P.; Doyle, M.; Darling, R.M.; Newman, J. Impedance response of a porous electrode composed of intercalation particles. J. Electrochem. Soc. 2000, 147, 2930–2940. [Google Scholar] [CrossRef]
- Santhanagopalan, S.; Guo, Q.; White, R.E. Parameter estimation and model discrimination for a lithium-ion cell. J. Electrochem. Soc. 2007, 154, 198–206. [Google Scholar] [CrossRef] [Green Version]
- Li, S.E.; Wang, B.; Peng, H.; Hu, X. An electrochemistry-based impedance model for lithium-ion batteries. J. Power Sources 2014, 258, 9–18. [Google Scholar] [CrossRef]
- Qu, D. The study of the proton diffusion process in the porous MnO2 electrode. Electrochim. Acta 2004, 49, 657–665. [Google Scholar] [CrossRef]
- Birkl, C.R.; Howey, D.A. Model identification and parameter estimation for LiFePO4 batteries. IET Conf. Publ. 2013, 2013, 1–6. [Google Scholar]
- Nguyen, T.Q.; Breitkopf, C. Determination of diffusion coefficients using impedance spectroscopy data. J. Electrochem. Soc. 2018, 165, E826–E831. [Google Scholar] [CrossRef]
- Jokar, A.; Rajabloo, B.; Désilets, M.; Lacroix, M. An inverse method for estimating the electrochemical parameters of lithium-ion batteries I. Methodology. J. Electrochem. Soc. 2016, 163, A2876–A2886. [Google Scholar] [CrossRef]
- Wang, L.; Zhao, J.; He, X.; Gao, J.; Li, J.; Wan, C.; Jiang, C. Electrochemical Impedance Spectroscopy (EIS) study of LiNi 1/3Co 1/3Mn 1/3O 2 for Li-ion batteries. Int. J. Electrochem. Sci. 2012, 7, 345–353. [Google Scholar]
- Ebner, M.; Wood, V. Tool for tortuosity estimation in lithium ion battery porous electrodes. J. Electrochem. Soc. 2015, 162, A3064–A3070. [Google Scholar] [CrossRef] [Green Version]
- Mastali, M.; Farkhondeh, M.; Farhad, S.; Fraser, R.A.; Fowler, M. Electrochemical modeling of commercial LiFePO4 and graphite electrodes: Kinetic and transport properties and their temperature dependence. J. Electrochem. Soc. 2016, 163, A2803–A2816. [Google Scholar] [CrossRef]
- Safari, M.; Delacourt, C. Modeling of a Commercial Graphite/LiFePO4 Cell. J. Electrochem. Soc. 2011, 158, A562–A571. [Google Scholar] [CrossRef]
- Cooper, S.J.; Bertei, A.; Finegan, D.P.; Brandon, N.P. Simulated impedance of diffusion in porous media. Electrochim. Acta 2017, 251, 681–689. [Google Scholar] [CrossRef]
- Sapoval, B.; Chazalviel, J.-N.; Peyrière, J. Electrical response of fractal and porous interfaces. Phys. Rev. A 1988, 38, 5867–5887. [Google Scholar] [CrossRef]
- Zou, C.; Zhang, L.; Hu, X.; Wang, Z.; Wik, T.; Pecht, M. A review of fractional-order techniques applied to lithium-ion batteries, lead-acid batteries, and supercapacitors. J. Power Sources 2018, 390, 286–296. [Google Scholar] [CrossRef] [Green Version]
- Song, J.; Bazant, M.Z. Effects of Nanoparticle Geometry and Size Distribution on Diffusion Impedance of Battery Electrodes. J. Electrochem. Soc. 2013, 160, A15–A24. [Google Scholar] [CrossRef]
- Levi, M.D.; Aurbach, D. Impedance of a single intercalation particle and of non-homogeneous, multilayered porous composite electrodes for Li-ion batteries. J. Phys. Chem. B 2004, 108, 11693–11703. [Google Scholar] [CrossRef]
- Baker, D.R.; Verbrugge, M.W. Intercalate Diffusion in Multiphase Electrode Materials and Application to Lithiated Graphite. J. Electrochem. Soc. 2012, 159, A1341–A1350. [Google Scholar] [CrossRef]
- Guo, Q.; Subramanian, V.R.; Weidner, J.W.; White, R.E. Estimation of Diffusion Coefficient of Lithium in Carbon Using AC Impedance Technique. J. Electrochem. Soc. 2002, 149, A307–A318. [Google Scholar] [CrossRef] [Green Version]
- Cabañero, M.A.; Boaretto, N.; Röder, M.; Müller, J.; Kallo, J.; Latz, A. Direct Determination of Diffusion Coefficients in Commercial Li-Ion Batteries. J. Electrochem. Soc. 2018, 165, A847–A855. [Google Scholar] [CrossRef]
- Dong, T.K.; Kirchev, A.; Mattera, F.; Kowal, J.; Bultel, Y. Dynamic Modeling of Li-Ion Batteries Using an Equivalent Electrical Circuit. J. Electrochem. Soc. 2011, 158, A326. [Google Scholar] [CrossRef]
- Huang, J. Diffusion impedance of electroactive materials, electrolytic solutions and porous electrodes: Warburg impedance and beyond. Electrochim. Acta 2018, 281, 170–188. [Google Scholar] [CrossRef]
- Guha, A.; Patra, A. Online Estimation of the Electrochemical Impedance Spectrum and Remaining Useful Life of Lithium-Ion Batteries. IEEE Trans. Instrum. Meas. 2018, 67, 1836–1849. [Google Scholar] [CrossRef]
- Quanchao, Z.; Shoudong, X.; Xiangyun, Q.; Yongli, C.; Liang, F.; Shigang, S. Diagnosis of electrochemical impedance spectroscopy in lithium ion batteries. In Lithium Ion Batteries—New Developments; Belharouak, D.I., Ed.; InTech: London, UK, 2012; pp. 190–226. ISBN 978-953-51-0077-5. [Google Scholar]
- Scipioni, R.; Jørgensen, P.S.; Graves, C.; Hjelm, J.; Jensen, S.H. A Physically-Based Equivalent Circuit Model for the Impedance of a LiFePO 4 /Graphite 26650 Cylindrical Cell. J. Electrochem. Soc. 2017, 164, A2017–A2030. [Google Scholar] [CrossRef] [Green Version]
- Park, S.; Kato, D.; Gima, Z.; Klein, R.; Moura, S. Optimal Experimental Design for Parameterization of an Electrochemical Lithium-Ion Battery Model. J. Electrochem. Soc. 2018, 165, A1309–A1323. [Google Scholar] [CrossRef]
- Somerville, L.; Ferrari, S.; Lain, M.J.; McGordon, A.; Jennings, P.; Bhagat, R. An in-situ reference electrode insertion method for commercial 18650-type cells. Batteries 2018, 4, 18. [Google Scholar] [CrossRef] [Green Version]
- Carelli, S.; Quarti, M.; Yagci, M.C.; Bessler, W.G. Modeling and experimental validation of a high-power lithium-ion pouch cell with LCO/NCA blend cathode. J. Electrochem. Soc. 2019, 166, A2990–A3003. [Google Scholar] [CrossRef]
- Msesupplies NMC111 Datasheet. Available online: https://www.msesupplies.com/products/lithium-nickel-manganese-cobalt-oxide-linimncoo2-powder-ni-co-mn-1-1-1-500g-bag-lnmco-111-500?variant=7141062212 (accessed on 16 May 2020).
- Deimede, V.; Elmasides, C. Separators for Lithium-Ion Batteries: A Review on the Production Processes and Recent Developments. Energy Technol. 2015, 3, 453–468. [Google Scholar] [CrossRef]
- Tiedemann, W.; Newman, J. Maximum Effective Capacity in an Ohmically Limited Porous Electrode. J. Electrochem. Soc. 1975, 122, 1482–1485. [Google Scholar] [CrossRef]
- Aurbach, D.; Talyosef, Y.; Markovsky, B.; Markevich, E.; Zinigrad, E.; Asraf, L.; Gnanaraj, J.S.; Kim, H.J. Design of electrolyte solutions for Li and Li-ion batteries: A review. Electrochim. Acta 2004, 50, 247–254. [Google Scholar] [CrossRef]
- Valøen, L.O.; Reimers, J.N. Transport Properties of LiPF6-Based Li-Ion Battery Electrolytes. J. Electrochem. Soc. 2005, 152, A882. [Google Scholar] [CrossRef]
- Huang, J.; Ge, H.; Li, Z.; Zhang, J. An Agglomerate Model for the Impedance of Secondary Particle in Lithium-Ion Battery Electrode. J. Electrochem. Soc. 2014, 161, E3202–E3215. [Google Scholar] [CrossRef]
- Huang, J.; Li, Z.; Zhang, J.; Song, S.; Lou, Z.; Wu, N. An Analytical Three-Scale Impedance Model for Porous Electrode with Agglomerates in Lithium-Ion Batteries. J. Electrochem. Soc. 2015, 162, A585–A595. [Google Scholar] [CrossRef] [Green Version]
- Franceschetti, D.R.; Macdonald, J.R. Diffusion of neutral and charged species under small-signal a.c. conditions. J. Electroanal. Chem. 1979, 101, 307–316. [Google Scholar] [CrossRef]
- Lelidis, I.; Ross Macdonald, J.; Barbero, G. Poisson-Nernst-Planck model with Chang-Jaffe, diffusion, and ohmic boundary conditions. J. Phys. D Appl. Phys. 2016, 49, 25503. [Google Scholar] [CrossRef]
- Jacobsen, T.; West, K. Diffusion impedance in planar, cylindrical and spherical symmetry. Electrochim. Acta 1995, 40, 255–262. [Google Scholar] [CrossRef]
- Bisquert, J.; Garcia-Belmonte, G.; Bueno, P.; Longo, E.; Bulhões, L.O.S. Impedance of constant phase element (CPE)-blocked diffusion in film electrodes. J. Electroanal. Chem. 1998, 452, 229–234. [Google Scholar] [CrossRef]
- Wang, J.C. Realizations of Generalized Warburg Impedance with RC Ladder Networks and Transmission Lines. J. Electrochem. Soc. 1987, 134, 1915–1920. [Google Scholar] [CrossRef]
- Mark, E.; Orazem, B.T. Electrochemical Impedance Spectroscopy; John Wiley Sons Inc.: Hoboken, NJ, USA, 2008. [Google Scholar]
- Bard, A.J.; Faulkner, L.R. Electrochemical Methods—Fundamentals and Applications, 2nd ed.; John Wiley & Sons: Hoboken, NJ, USA, 2001; ISBN 0-471-04372-9. [Google Scholar]
- Ravikumar, B.; Mynam, M.; Rai, B. Effect of Salt Concentration on Properties of Lithium Ion Battery Electrolytes: A Molecular Dynamics Study. J. Phys. Chem. C 2018, 122, 8173–8181. [Google Scholar] [CrossRef]
- Lindberg, J.; Lundgren, H.; Behm, M.; Lindbergh, G. Benchmarking of electrolyte mass transport in next generation lithium batteries. J. Electrochem. Sci. Eng. 2017, 7, 213–221. [Google Scholar] [CrossRef] [Green Version]
- Newman, J.; Alyea, K.E.T. Electrochemical Systems, 3th ed.; John Wiley & Sons: Hoboken, NJ, USA, 2004; ISBN 0-471-47756-7. [Google Scholar]
- Weppner, W. Determination of the Kinetic Parameters of Mixed-Conducting Electrodes and Application to the System Li3Sb. J. Electrochem. Soc. 1977, 124, 1569. [Google Scholar] [CrossRef]
- Choi, W.; Shin, H.-C.; Kim, J.M.; Choi, J.-Y.; Yoon, W.-S. Modeling and Applications of Electrochemical Impedance Spectroscopy (EIS) for Lithium-ion Batteries. J. Electrochem. Sci. Technol. 2020, 11, 1–13. [Google Scholar] [CrossRef] [Green Version]
- Verma, A.; Smith, K.; Santhanagopalan, S.; Abraham, D.; Yao, K.P.; Mukherjee, P.P. Galvanostatic Intermittent Titration and Performance Based Analysis of LiNi 0.5 Co 0.2 Mn 0.3 O 2 Cathode. J. Electrochem. Soc. 2017, 164, A3380–A3392. [Google Scholar] [CrossRef]
- Fu, R.; Zhou, X.; Fan, H.; Blaisdell, D.; Jagadale, A.; Zhang, X.; Xiong, R. Comparison of lithium-ion anode materials using an experimentally verified physics-based electrochemical model. Energies 2017, 10, 2174. [Google Scholar] [CrossRef] [Green Version]
- Xu, M.; Wang, X. Electrode thickness correlated parameters estimation for a Li-ion NMC battery electrochemical model. ECS Trans. 2017, 77, 491–507. [Google Scholar] [CrossRef]
- Taslimi Taleghani, S.; Marcos, B.; Lantagne, G. Modeling and simulation of a commercial graphite–LiFePO4 cell in a full range of C-rates. J. Appl. Electrochem. 2018, 48, 1389–1400. [Google Scholar] [CrossRef]
- Lee, S.I.; Jung, U.H.; Kim, Y.S.; Kim, M.H.; Ahn, D.J.; Chun, H.S. A study of electrochemical kinetics of lithium ion in organic electrolytes. Korean J. Chem. Eng. 2002, 19, 638–644. [Google Scholar] [CrossRef]
- Tsai, P.C.; Wen, B.; Wolfman, M.; Choe, M.J.; Pan, M.S.; Su, L.; Thornton, K.; Cabana, J.; Chiang, Y.M. Single-particle measurements of electrochemical kinetics in NMC and NCA cathodes for Li-ion batteries. Energy Environ. Sci. 2018, 11, 860–871. [Google Scholar] [CrossRef] [Green Version]
Figure 1.
Experimental setups for (a) EIS (frequency-domain) and (b) instantaneous resistance (time-domain) measurements. The measured cell was removed from the insulator box for the duration of the photoshoot for the purpose of better visual representation.
Figure 1.
Experimental setups for (a) EIS (frequency-domain) and (b) instantaneous resistance (time-domain) measurements. The measured cell was removed from the insulator box for the duration of the photoshoot for the purpose of better visual representation.

Figure 2.
The characteristic NMC graphite electrode-based Li-ion cell. The specific electrochemical parameters used in the estimation have been outlined. Li transport due to migration and diffusion only occurs along the x-axis. The cross-sectional area Asep is perpendicular to the x-axis. The electrodes and separator have double-sided coatings.

Figure 3.
Applied Randles circuit to model electrolyte resistance , charge-transfer resistance , the double layer effect and diffusion impedance in the electrolyte. The model incorporates the characteristics of both electrodes.
Figure 3.
Applied Randles circuit to model electrolyte resistance , charge-transfer resistance , the double layer effect and diffusion impedance in the electrolyte. The model incorporates the characteristics of both electrodes.

Figure 4.
(a) The Open-Circuit Voltage (OCV)—State of Charge (SoC) characteristic of the cell, (b) Linear trend of the measured and fitted instantaneous resistances of the cell.
Figure 4.
(a) The Open-Circuit Voltage (OCV)—State of Charge (SoC) characteristic of the cell, (b) Linear trend of the measured and fitted instantaneous resistances of the cell.

Figure 5.
Nyquist plot of a Samsung ICR18650-26F 2600mAh cell at 100% SoC and room temperature. Parameter estimation is based on the frequency range of 10 mHz to 10 Hz. Part I.—SEI can be observed here, however, it has a negligible effect on liquid-phase diffusion in part II. (neglected zone); Part II.—diffusion dominates in the electrolyte; Part III.—diffusion dominates in the solid electrodes (neglected zone). The generalized Warburg element shows a better fit on non-ideal diffusion than the standard Warburg element, which is only suitable for a phase angle of 45°.

Figure 6.
Fitting of the real part of the impedance data against within the 0.1 Hz–10 mHz frequency region to calculate the Warburg coefficient .
Figure 6.
Fitting of the real part of the impedance data against within the 0.1 Hz–10 mHz frequency region to calculate the Warburg coefficient .

Figure 7.
GITT measurements on the inspected cell applying a load current of 0.3 C at room temperature. (a) GITT cycles until a complete discharge (b) Detailed evaluation of GITT for the first cycle highlighted by the rechtange in (a).
Figure 7.
GITT measurements on the inspected cell applying a load current of 0.3 C at room temperature. (a) GITT cycles until a complete discharge (b) Detailed evaluation of GITT for the first cycle highlighted by the rechtange in (a).

Figure 8.
CT images of the modelled Samsung ICR18650-26F 2.6Ah cell for validation purposes. denotes the unity cell thickness: (a) Main cell components, (b) structure of the electrode, separator and current collector layers as well as the inner diameter of the mandrel for better visual scaling.
Figure 8.
CT images of the modelled Samsung ICR18650-26F 2.6Ah cell for validation purposes. denotes the unity cell thickness: (a) Main cell components, (b) structure of the electrode, separator and current collector layers as well as the inner diameter of the mandrel for better visual scaling.

Figure 9.
Comparison of the measured and simulated terminal voltage when estimated electrochemical values were applied in the DFN model. (a) An average of 1 C transient discharge; the diffusion coefficient changes in the function of Li-ion concentrations in the solid and the electrolyte which effect can be observed between 1500 s–2600 s. (b) An average of 0.3 C discharge with repetition of discharge profiles.


Table 1.
List of core electrochemical parameters to be estimated.
| Parameter | Sign |
|---|---|
| Li diffusion coefficient in the electrolyte | |
| Unity cell thickness | |
| Cross-sectional area of the separator | |
| Exchange current density | |
| Reaction rate constant | |
| Diffusion coefficient of the solid electrode |
Table 2.
Estimated Randles circuit parameters as shown in Figure 3.
Table 2.
Estimated Randles circuit parameters as shown in Figure 3.
| Parameter | Value | Unit |
|---|---|---|
| Rs | 0.0764 | Ω |
| Rct | 0.0470 | Ω |
| 2.07 | F | |
| 0.8870 | − | |
| 0.6868 | − | |
| 359 | s | |
| 0.0014 | Ωm2/s0.6868 |
Table 3.
Complete list of estimated electrochemical parameters for modeling a Samsung ICR18650-26F 2.6Ah cell. Values below the dotted black line were calculated in the present paper.
Table 3.
Complete list of estimated electrochemical parameters for modeling a Samsung ICR18650-26F 2.6Ah cell. Values below the dotted black line were calculated in the present paper.
| Parameter | Value | Unit | Source |
|---|---|---|---|
| Q | 9360 | As | [54] |
| MLi | 6.941 | g/mole | [54] |
| 0.95 | − | [74] | |
| 0.99 | − | [74] | |
| ccat,max | 49,000 | mole/m3 | [75] |
| can,max | 31,507 | mole/m3 | [76] |
| 1000 | mole/m3 | [58] | |
| z | 1 | − | |
| 22.5 | [55] | ||
| 0.40 | − | [56] | |
| 0.35 | − | [53] | |
| 0.45 | − | ||
| 0.15 | − | ||
| 0.04 | − | ||
| 0.50 | − | ||
| 0.51 | − | ||
| 5 | |||
| 10 | |||
| 1.5 | − | ||
| 0.87 | S/m | ||
| 0.363 | − | [58] | |
| T | 295 | K | measured |
| 1.34 × 10⁻⁷ | Equation (8) | ||
| 1365 | Equation (12) | ||
| 0.08 | Equation (13) | ||
| 0.54 | Equation (14) | ||
| 0.097 | mole | Equation (15) | |
| 2.070 × 10⁻⁶ | Equation (16) | ||
| 3.095 × 10⁻⁶ | Equation (16) | ||
| 4.147 × 10⁻⁶ | Equation (17) | ||
| 6.282 × 10⁻⁶ | Equation (17) | ||
| 1.24 | Equation (18) | ||
| 0.47 | Equation (18) | ||
| Lcat/2 | 51.8 | Equation (19) | |
| Lan/2 | 78.5 | Equation (19) | |
| 4.594 × 10⁻¹¹ | Equation (20) | ||
| 1.890 × 10⁻¹⁰ | Equation (20) | ||
| 6.90 × 10⁻¹⁴ | Equation (21) | ||
| (by GITT) | 2.790 × 10⁻¹³ | Equation (21) |
Table 4.
Validation results based on CT and GITT. The parameter uncertainty of the thicknesses of the electrodes due to read error was on average 11%, while it was 25% for the thickness of the separator.
Table 4.
Validation results based on CT and GITT. The parameter uncertainty of the thicknesses of the electrodes due to read error was on average 11%, while it was 25% for the thickness of the separator.
| Parameter | Calculated | Measured by CT | Relative Error |
|---|---|---|---|
| (m2) | 0.08 | 0.068 | 18% |
| (µm) | 1365 | 1496 | 9% |
| (µm) | 51.8 | 80 | 35% |
| (µm) | 78.5 | 80 | 2% |
| (µm) | 22.5 (assumed) | 28 | 20% |
| (µm) | − | 40 | − |
| (µm) | − | 40 | − |
Table 5.
Summary of battery parameters estimated in this work.
| Parameter | Value | Unit |
|---|---|---|
| 1.34 × 10⁻⁷ | ||
| 1365 | ||
| 0.08 | ||
| 0.54 | ||
| 0.097 | mole | |
| 2.07 × 10⁻⁶ | ||
| 3.095 × 10⁻⁶ | ||
| 4.147 × 10⁻⁶ | ||
| 6.282 × 10⁻⁶ | ||
| 1.24 | ||
| 0.47 | ||
| Lcat/2 | 51.8 | |
| Lan/2 | 78.5 | |
| 4.594 × 10⁻¹¹ | ||
| 1.89 × 10⁻¹⁰ | ||
| 6.9 × 10⁻¹⁴ | ||
| (GITT) | 2.79 × 10⁻¹³ |
Publisher’s Note: MDPI stays neutral with regard to jurisdictional claims in published maps and institutional affiliations. |
© 2020 by the authors. Licensee MDPI, Basel, Switzerland. This article is an open access article distributed under the terms and conditions of the Creative Commons Attribution (CC BY) license (http://creativecommons.org/licenses/by/4.0/).
Share and Cite
MDPI and ACS Style
Csomós, B.; Fodor, D.; Vajda, I. Estimation of Battery Separator Area, Cell Thickness and Diffusion Coefficient Based on Non-Ideal Liquid-Phase Diffusion Modeling. Energies 2020, 13, 6238. https://doi.org/10.3390/en13236238
AMA Style
Csomós B, Fodor D, Vajda I. Estimation of Battery Separator Area, Cell Thickness and Diffusion Coefficient Based on Non-Ideal Liquid-Phase Diffusion Modeling. Energies. 2020; 13(23):6238. https://doi.org/10.3390/en13236238
Chicago/Turabian StyleCsomós, Bence, Dénes Fodor, and István Vajda. 2020. "Estimation of Battery Separator Area, Cell Thickness and Diffusion Coefficient Based on Non-Ideal Liquid-Phase Diffusion Modeling" Energies 13, no. 23: 6238. https://doi.org/10.3390/en13236238
Note that from the first issue of 2016, this journal uses article numbers instead of page numbers. See further details here.