The Effect of CO2 Concentration on Children’s Well-Being during the Process of Learning


1
Daugavpils Secondary School Nr 9, LV-5401 Daugavpils, Latvia
2
Heat, Gas and Water Technology Institute, Riga Technical University, LV-1048 Riga, Latvia
*
Author to whom correspondence should be addressed.
Energies 2020, 13(22), 6099; https://doi.org/10.3390/en13226099
Submission received: 31 October 2020
/
Revised: 17 November 2020
/
Accepted: 18 November 2020
/
Published: 21 November 2020
(This article belongs to the Special Issue Energy Performance and Indoor Climate in Buildings)
Abstract
:There are more than 200 thousand pupils in Latvia. Most of them are still learning in non-renovated classrooms without proper mechanical ventilation. The classrooms are often ventilated only during the breaks by opening windows. This can lead to increased CO2 levels and reduced mental performance. To test how CO2 concentration in classrooms influences student attention level and their ability to perform mental tasks, the students had to complete a short test at the start and the end of the class. At the same time CO2 concentration, temperature and relative humidity were logged. In addition, an anonymous survey on how the pupils felt regarding the overall indoor environmental quality (IEQ) in the classroom, their thermal sensation, are they fatigued, any difficulty concentrating and if they have headaches during the lesson performed. The measurements were performed in a Secondary School in Daugavpils, Latvia. The analysis of results shows that existing 10 min breaks are not enough to fully ventilate the classroom, and they must be increased to at least 15 min. At the same time, 30 min breaks can be reduced to 20 min. The correlation between CO2 concentration and test results of pupils’ performance test results is noticeable but not definitive. It indicates that at increased CO2 levels the performance lowers—when the concentration of CO2 corresponds only to the Category 3 norm, the lowest results are achieved while the best results are when the CO2 concentration level corresponds to Category 1. To improve the study, observations of CO2 concentrations must be extended throughout the school year, as well as measurements in other classrooms in the school should be made.
1. Introduction
At the start of the year 2019, there were 707 educational institutions and 214,002 pupils in Latvia, according to information from the Ministry of Education and Science. Only some of the schools have undergone renovation and implementation of central ventilation systems, although existing studies [1,2] show the importance and improvements of renovation works. This means that most of the students are still having classes in buildings without proper ventilation and with low indoor air quality (IAQ). According to the study [3], the main causes of indoor air pollution are insufficient and inadequate ventilation rates, emissions from cleaning products and the chemicals emitted by building materials or furnishings.
IAQ can be characterized by various metrics, such as level of pollutants, humidity, temperature and so on. Indoor carbon dioxide concentration is one of the most important indices of IAQ because of its ability to affect the human body. Concentrations of carbon dioxide in the air at 1000 ppm and can cause poisoning and have been shown to affect the human thinking process. At the same time, no indicator clearly distinguishes the threshold between quality air and low-quality air, as individual people may feel comfortable in different conditions of fresh air volume and composition depending on their physiology, emotional state, clothing, activity, the temperature of environment, etc. Therefore, the air quality can be conditionally determined by the number of theoretically dissatisfied people. The higher the level of poor air quality, the higher the number of dissatisfied people. For example, with a fresh air supply of 10 L/s per person, theoretically, 15% of the inhabitants could be dissatisfied (Category 1), at 7 L/s per person, already 20% might be dissatisfied (Category 2), at 4 L/s per person, 30% would be dissatisfied (Category 3), according to LVS EN 15251: 2007 [4,5]. The concentration limits for CO2 can be described according to European Standard EN 16798-1: 2019 [6], corresponding to three indoor air quality categories (Table 1).
According to the ScienceDirect data, several hundred studies recently have reported problems with indoor air quality and thermal comfort in schools through different climatic zone [7,8,9]. Measurements in Latvian education institutions [10,11] have shown that the indoor environment is critical in many classrooms that are not equipped with mechanical ventilation units. A similar situation is all around the world and in many cases, the reported CO2 levels exceed even 2500 ppm [12]. In an existing study [13], the results on CO2 concentrations in classrooms in different countries (France, Portugal, Germany, Scotland and 10 other countries) were compiled and analyzed. It demonstrates that CO2 levels in classrooms are affected by ventilation types. A distinction is made between natural, mechanical and hybrid ventilation and it was concluded that ventilation efficiency can be assessed by measuring the level of CO2 in the room. Several schools participated in the research, ranging from 6 (Germany) to 389 (Denmark). The minimum indoor CO2 concentration was 351 ppm (Portugal) while the maximum was 6000 ppm (UK). Most schools were found to have natural ventilation that could not provide enough fresh air during the day, but some schools with mechanical ventilation also found excess CO2 levels, and one of the causes was incorrect regulation of ventilation systems in classrooms. The ventilation system, in particular a correct use of variable air volume (VAV) valves, can significantly affect the IAQ and thermal comfort [14].
In 2015, the World Health Organization produced a document entitled “School environment: policies and current status” to draw the attention of school administration to indoor air quality [15]. The World Health Organization (WHO) researched high-income countries, including Latvia. However, due to the lack of information on indoor air quality in middle- and low-income countries, further research is necessary worldwide. The World Health Organization, during the school years of 2011–2013, performed carbon dioxide concentration measurements in schools. Measurements were made within five days without repetition. According to the results, the highest concentrations of carbon dioxide were observed in schools with insufficient air exchange during the winter. In the year 2015/2016, the WHO study “Indoor Air Quality in Schools” was conducted in Latvian schools. Fourteen schools participated in the study. A total of 42 classes were measured. Based on the results, 28 classes (67%) were found to violate the limit for carbon dioxide concentration. A total of 26 of all 42 classes had natural ventilation. The WHO study found that the amount of fresh air supplied over a given period depends on the volume of the room, the number of people and the nature of the work to be done [15,16].
The study [17] mentions a recommendation for schools with natural ventilation to install a CO2 concentration sensor in their classrooms to inform the teacher about the violation of the CO2 concentration and the need to ventilate the room. The CO2 sensor is also useful in mechanical ventilation schools to adapt the ventilation system to the learning process and classroom usage schedule. In Italy [18], schools were tested to see the effects of the ventilation system on CO2 concentration, air pollution and energy consumption in schools. The study investigated study rooms with both natural and mechanical ventilation. It was concluded that mechanical ventilation is the best way to reduce air pollution and is cost-effective in terms of energy savings, as well as properly regulated mechanical ventilation is capable of ensuring that CO2 concentrations do not exceed 1000 ppm in classrooms, therefore, meeting the air quality standards. In Sweden [5], indoor air quality in newly built energy-efficient schools with mechanical ventilation were studied. In 60 rooms out of 61 (4 schools), the CO2 concentration was found to correspond to air quality Categories 1 or 2. The study [19] shows that ventilation with a heat recovery efficiency of at least 80% should be installed for schools in a cold climate. The payback period of such an investment can be calculated according to methods provided in the studies [20,21].
It is proven that IAQ has a direct effect on the working capacity of students and thus impacts academic performance [22,23]. Some studies [24] show that ill-advised energy conservation measures can reduce children’s performance of schoolwork by as much as 30%. This is a significant problem since students due to their age can be more susceptible to long-term health damage caused by poor IAQ in school buildings. Experiments were carried out at the Lawrence Berkeley National Laboratory to find out how the concentration of carbon dioxide affects a person’s ability to solve tasks and his cognitive state. During the experiment, 22 participants stayed in three rooms with different levels of CO2 concentration (600, 1000 and 2500 ppm) for 2.5 h. They then performed a series of tasks on a computer, with the aim to find out the breadth of thinking of the participants, strategic and intuitive thinking, the ability to perceive information. The tasks of the participants in the rooms with CO2 concentrations of 1000 and 2500 ppm showed difficulties in the results. As a result, a relationship between CO2 levels in the air and human thinking ability was demonstrated [25]. Measurements of CO2 concentrations in several schools were performed in 2018 in Australia. The study [26] shows how the CO2 concentration changes dynamically during the lesson and that the CO2 concentration in the classroom can increase from 400 to 2800 ppm in one and a half hours, which can be detrimental to the health of students. In addition, some studies [27] indicate that the increase in CO2 concentration can lead to lower attendance levels. The cause is not directly related to the CO2 concentration, but it can serve as an indicator of bad IAQ which can cause more illnesses between the pupils [28,29].
2. Materials and Methods
The study was conducted in 2019 at a Secondary School in Daugavpils, Latvia. The school was built in the 1950s but renovated in 2010. It is built from bricks and now with external insulation. The ventilation is only natural through openable windows and with a local exhaust in bathrooms. The school is located in the center of the city, near the highway and railroad.
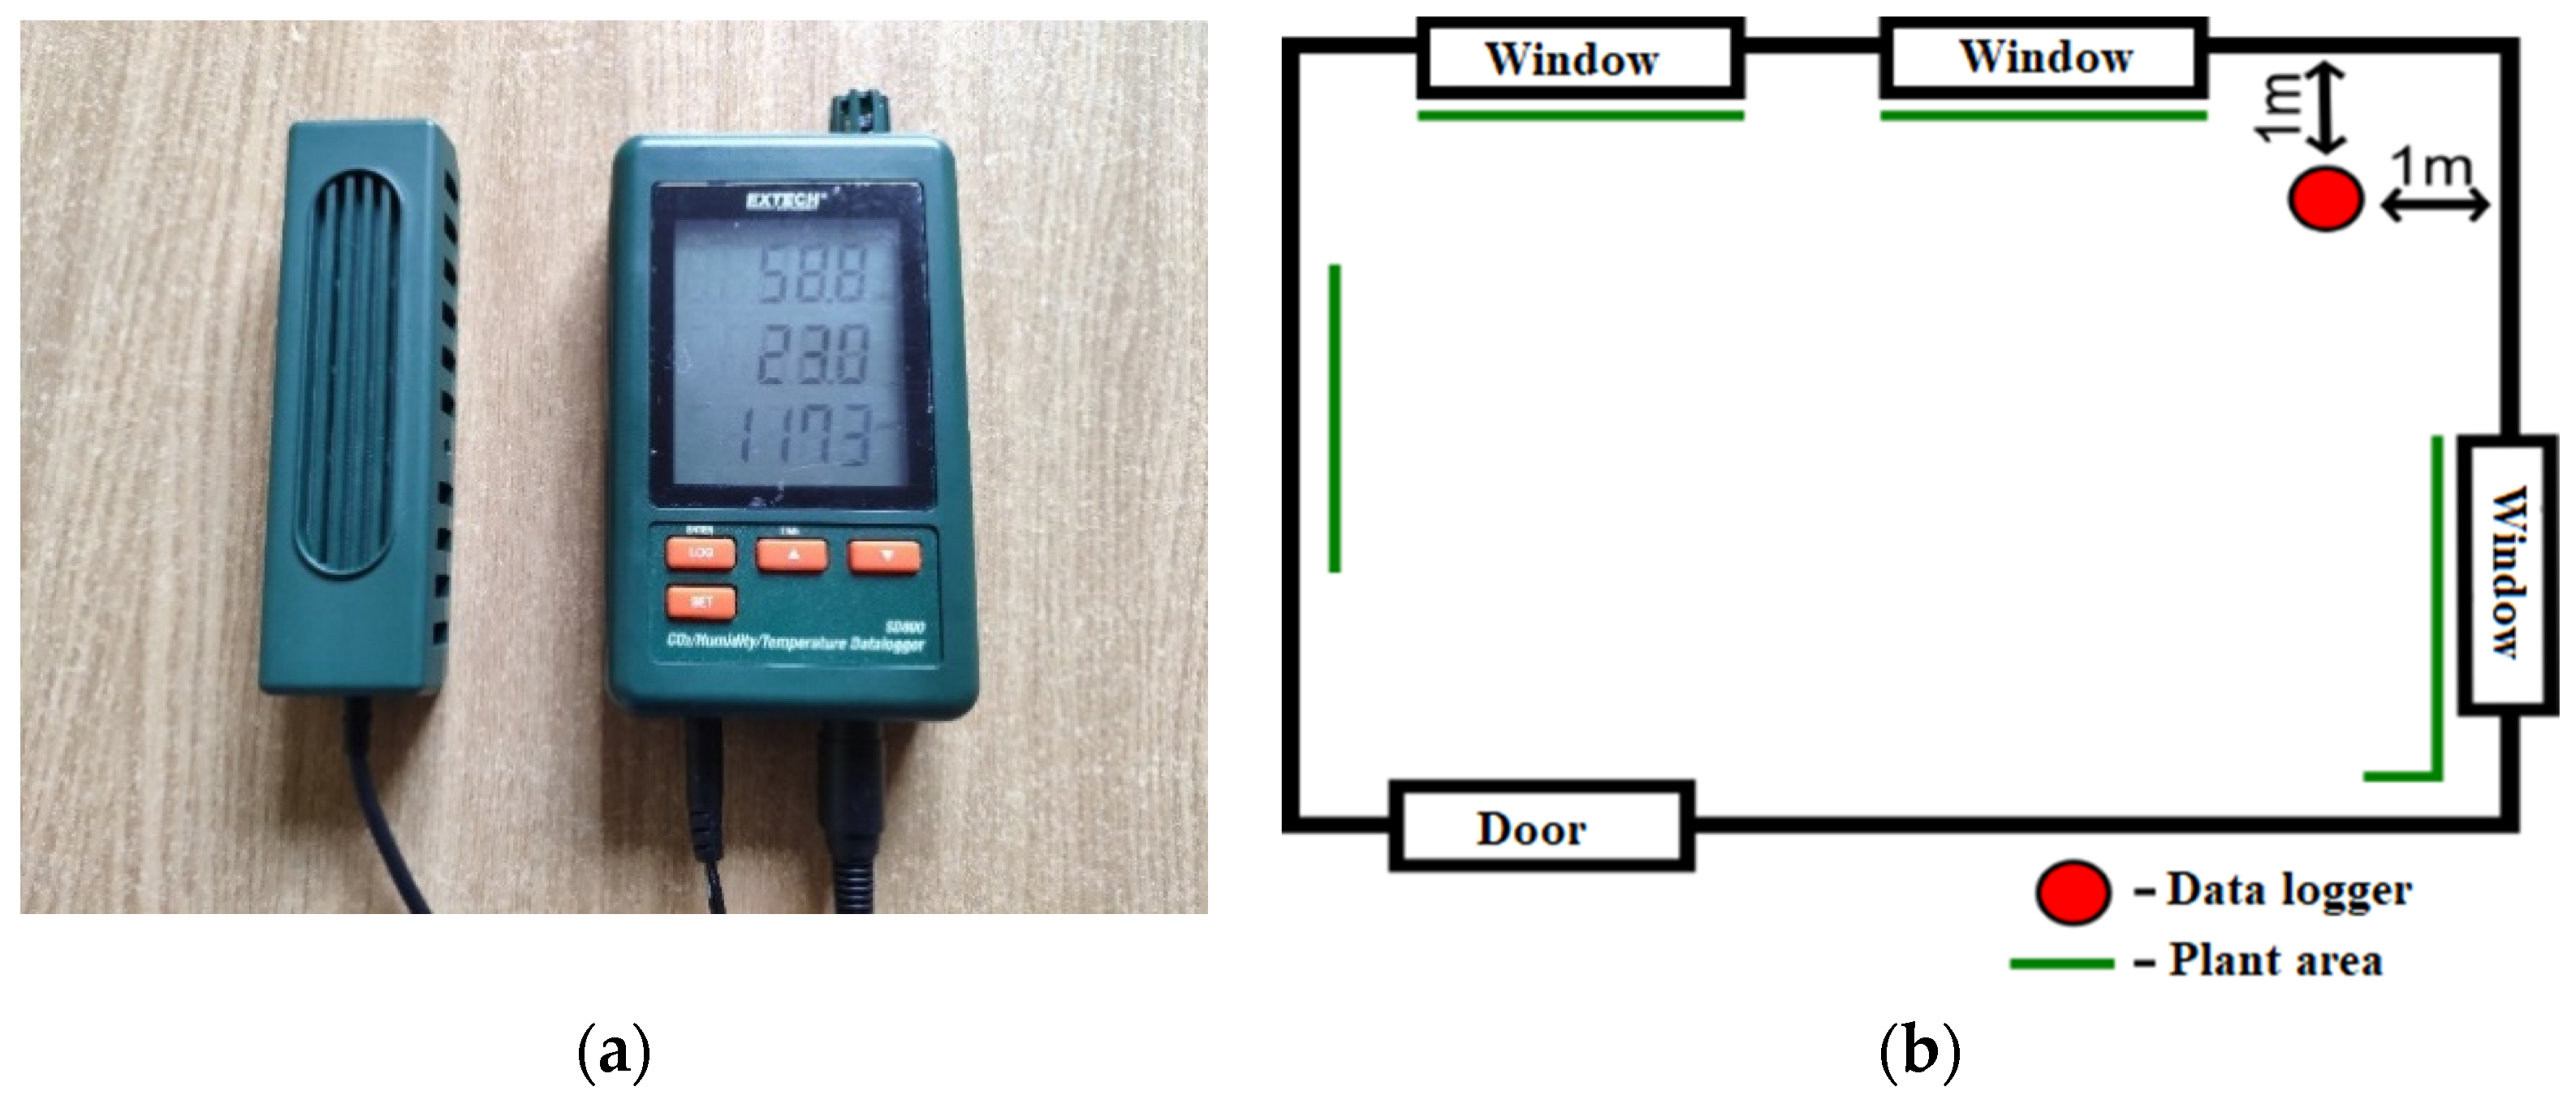
The area of the study room is 48.6 m2, height is 3.05 m. The study room has 3 windows and 1 door. The room has 30 student seats and a teacher workstation. The set-up of the measurements can be seen in Figure 1. The classroom has 17 plants—Begonia tiger (n = 2), Begonia cleopatra (n = 2), Ficus benjamina, Crassula ovata, Spathiphullum, Zygocactus truncatus, Kalanchoe blossfeldiana, Nephrolepis exaltata Bostoniensis, Sansevieria trifasciata (n = 2), Epipremnum aureum, Tradescantia fluminensis, Saintpaulia “Diana Blue” (n = 3).
Based on the recommendations of the World Health Organization in 2015, a carbon dioxide concentration device was placed in the training room. According to ISO 16000-1, the recorder was located 1 m from the wall and 1–1.5 m from the floor. No direct sunlight was allowed on the data recorder and it was placed away from the windows.
Measurements were performed over one week from 14 to 18 October in the year 2019. Measurements were made during 6 teaching hours, including breaks, from 8:00 to 14:00. During the measurement period, the outside air temperatures were approximately 8–10 °C at 8:00 (school starting time) and 16–20 °C at 14:00 (finishing time). The heating system was operational but on low heating power.
Data on CO2, relative humidity and room temperature were obtained with the EXTECH SD800. The data were logged with 30-s increments. Measurements were made to find out the dynamics of CO2 concentration and its effect on the mental and physical performance of pupils. The outdoor CO2 concentration measured during the study was 480 ppm. The ventilation schedule of the classroom was noted and is as shown in Table 2.
The room was ventilated following the Cabinet of Ministers Regulation No. 610, 2002. At the beginning of the training day, the study room was ventilated by opening wide two windows and the door. At each break, the room was ventilated for the maximum possible duration. For the 10 min long breaks, the actual ventilation time was close to 8 min as 2 min are required for students to arrange their belongings and exit after the class and the next ones to arrive and arrange for the lesson. During the break, the students were not in the classroom as ventilation with windows that are wide open when students are in the room is not permitted due to the possible harmful effect on health.
During the observations, an anonymous survey for pupils from 6th to 12th grade was performed. Students completed the survey at the beginning and end of the lesson to see how the response change. In total, 13 tests were performed with a total number of respondents—248. The survey consists of four questions and includes questions regarding how they felt in regard to the overall indoor environmental quality (IEQ) in the classroom, their thermal sensation, are they fatigued or having difficulty concentrating and if they have headaches during the lesson (Figure 2). The microclimate of the classroom (air temperature, humidity, the freshness of the air, smell, etc.) was judged by the pupils according to their feelings, based on how comfortable they were in the room.
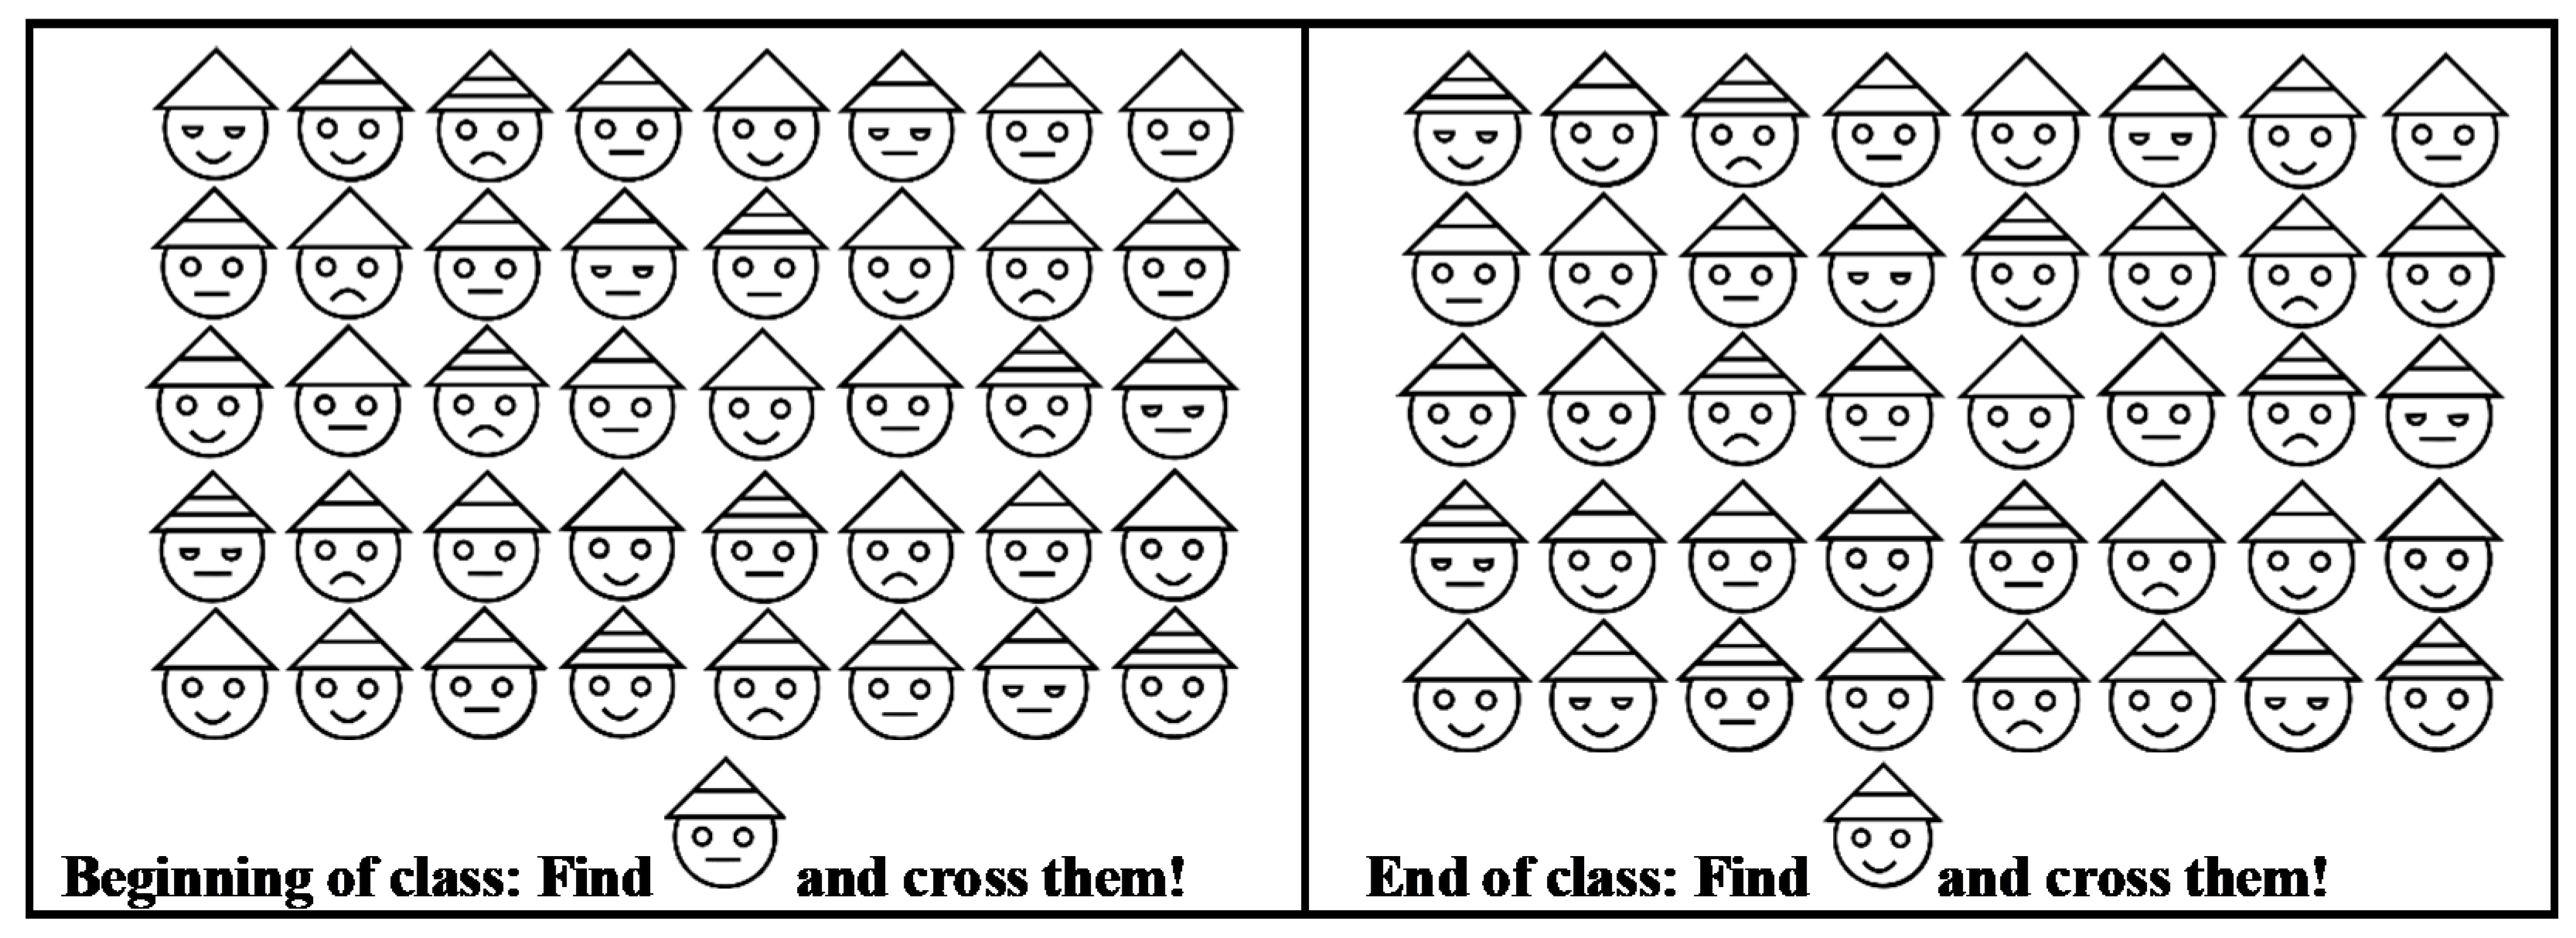
To determine the relationship between student attention level and their ability to perform mental tasks and CO2 concentration, the students had to complete a test at the start and the end of the class. Test tasks were created in Inkscape software specifically for this experiment (Figure 3).
The test tasks are the same in terms of difficulty. The time for completing the test was 30 s. Due to time constraints in the learning process, it was not possible to complete more tasks. Each correctly tagged image was awarded one point. If there was a mistake, the assignment was canceled because the student either did not understand the test conditions or was not careful in the process of completing the test assignments.
Statistical analysis was used to analyze the results of the study. In particular, the correlation method was used which allows the interrelation between two data sets to be evaluated. During the study, this method was used to determine the relationship between the survey results—microclimate, thermal comfort, tiredness and concentration level, as well as reported headaches and measured CO2 concentration.
The correlation coefficient r was obtained with the help of the MS Excel function “CORREL”. The correlation coefficient represents the closeness of the relation, which is expressed by the coefficient r within the range [−1, 1]. If the factor approaches 1, then it indicates that if one parameter increases then the other also increases, but if the value approaches −1, one increases while the other decreases. If r = 0 or close to it, then there is no correlation. It can be concluded that, depending on the absolute value of the correlation coefficient, the correlation can be estimated as either close (if r ≥ 0.7), moderate (0.3 < r < 0.7) or poor (if r ≤ 0.3).
3. Results and Discussion
The average CO2 concentration and the average student survey results over 5 days were calculated to see the weekly average results (Table 3 and Table 4). Average values help to more objectively assess the effect of intermittent and room ventilation on CO2 concentrations at the beginning and end of the hour.
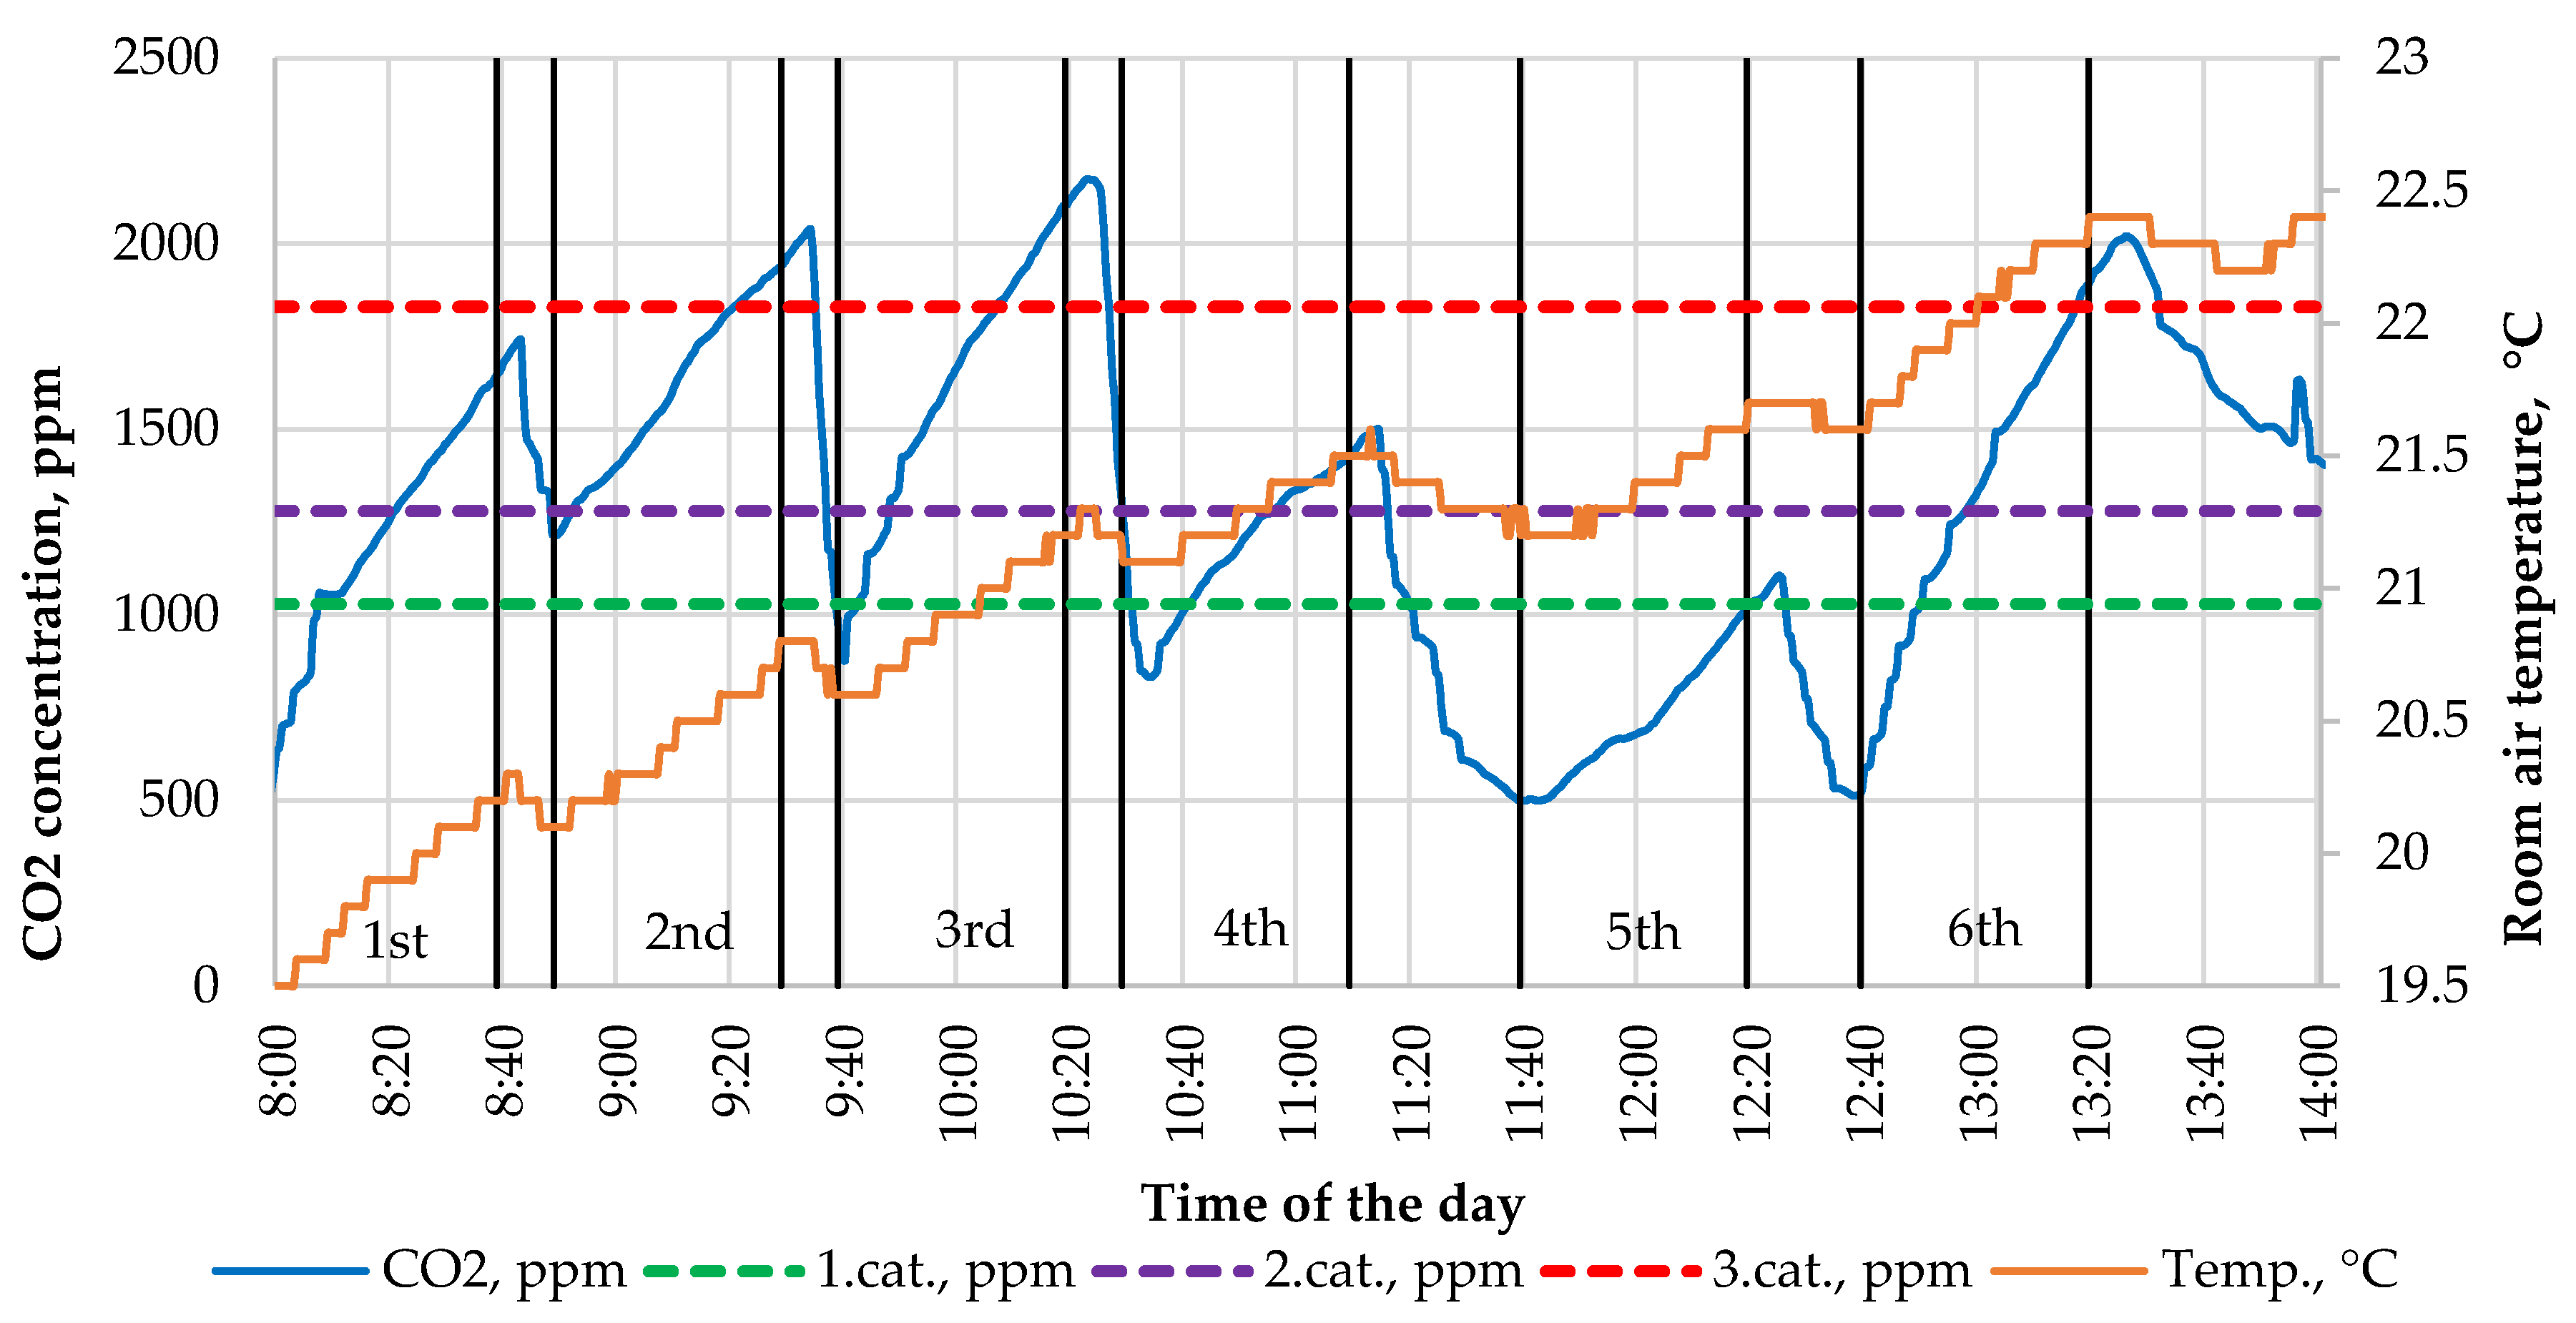
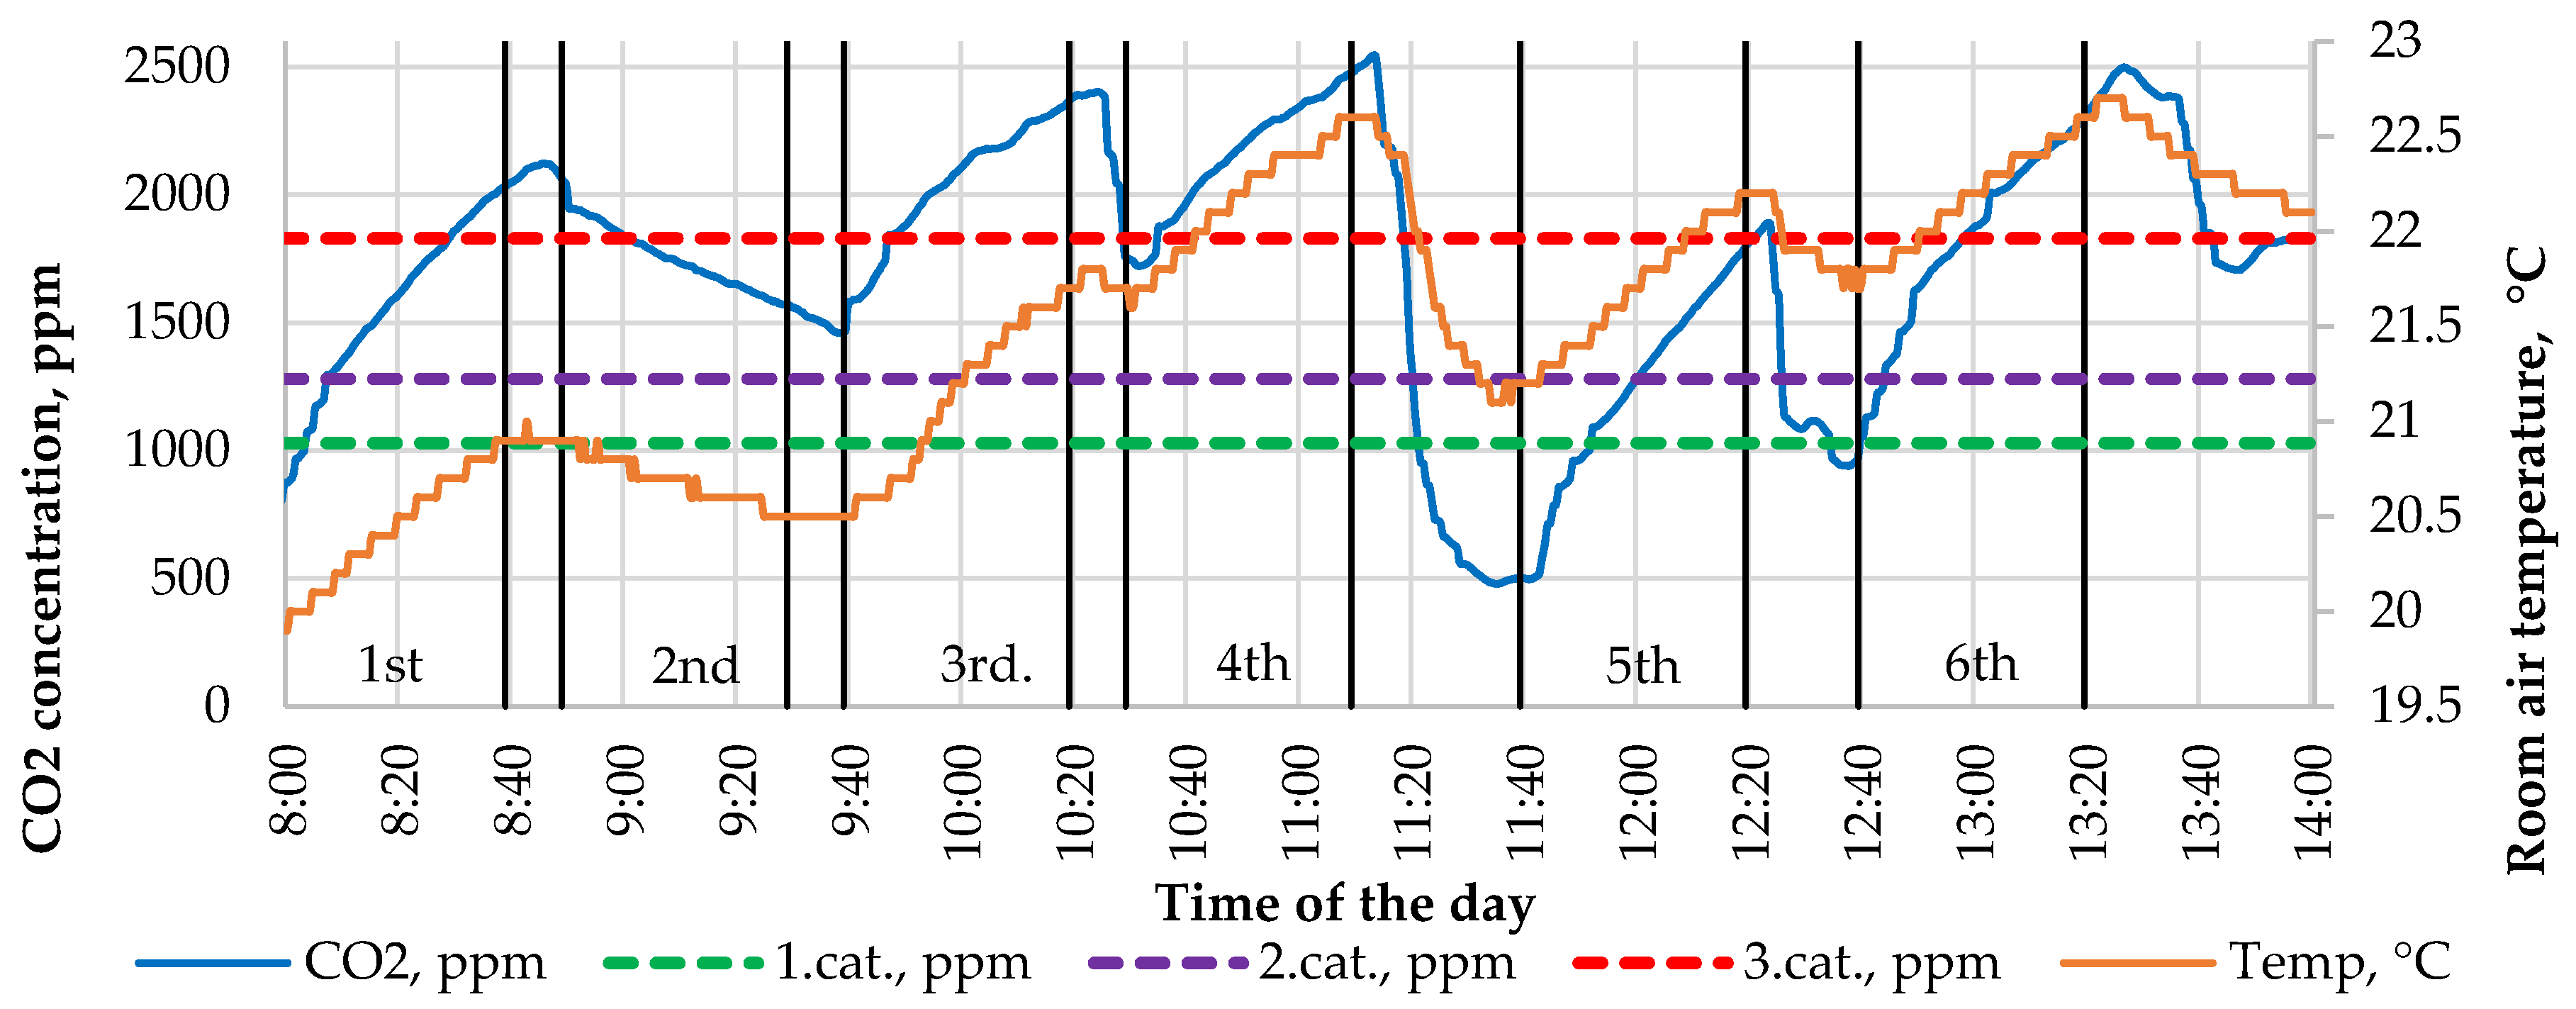
The data of CO2 concentration fluctuations over one week as well as the increase in concentration above the relevant air quality categories were noted. The example of results for Monday and Tuesday are shown in Figure 4 and Figure 5.
The data analysis showed that the classroom was used for a total of 28 h during the week and 28% of the time the CO2 concentration was above limits of Category 3, 70% over Category 2 and 81% over Category 1. The most rapid increase in CO2 concentration occurs when the level of CO2 concentration is lowest at the beginning of the hour (hours 1, 5 and 6). Before the first lesson, the room has been well ventilated during the night-time, but before the 5th and 6th, there were long breaks (30 and 20 min). The results show that the duration of these breaks is sufficient to reduce the CO2 concentration to the level that corresponds to the 1st category of IAQ at the beginning of the class.
Graphs show that during the long break when the classroom is being ventilated, the classroom temperature may drop by 1.4 °C (Tuesday). During the winter, the temperature drop may be even greater, thus reducing the ventilation time. During short breaks, the temperature drop was in the range of 0.2–0.6 °C.
Based on the CO2 concentration standards in schools according to EN 16798-1: 2019 (Table 1), it was determined that the CO2 concentration at the beginning corresponds to the norms. If the concentration exceeds the allowable limit, the percentage by which the measured value is above normal is calculated. The results are summarized in Table 5 and Table 6.
The study found that at the beginning of the class, the CO2 concentration in all hours corresponds to Category 3, but at the beginning of the 2nd, 3rd and 4th class the concentration does not fall into Categories 1 and 2 because there are only 10 min before the class. At the end of the class, the results show that only at the end of hours 5 and 6 do the CO2 concentration falls into Category 3. The biggest concentration of CO2 is observed at the end of class nr. 3 when the normative value of Category 1 is exceeded by 2 times.
During the study, 549 questionnaires were collected and processed. The average results of the student survey are summarized in Table 3 and Table 4. The results were afterward processed, and the hourly average survey results are shown in Table 7 and Table 8.
The results show that the average microclimate rating at the end of the hour is always lower than the beginning of the hour by 7–11%. The feeling of overly high air temperature increases by 4–77%. Feelings of fatigue increase by 21–45% at the end of the class and an additional 4–10% of pupils experience headaches at the end of the day.
During the study, to assess whether there was a correlation between the indoor CO2 concentration and the results of the student survey, the average values of the surveys at the beginning and end of each class were compared with the CO2 concentration at that time. Results are plotted and analyzed using the correlation method (p < 0.05), see Figure 6.
During the study, a negative correlation was found between the CO2 concentration and the IEQ assessment, which means that as the CO2 concentration increases, the indoor IEQ assessment decreases. Since r = −0.49, it can be concluded that there is an average correlation (0.3 < r < 0.7) in this graph. However, the graph B in Figure 6 shows that there is a positive correlation between CO2 concentration and the feeling of overheating by the pupils. As the concentration of CO2 in the room increases, the feeling of overly high room temperature by the pupil increases. The correlation coefficient r = 0.41, which corresponds to the level of average correlation (0.3 < r < 0.7).
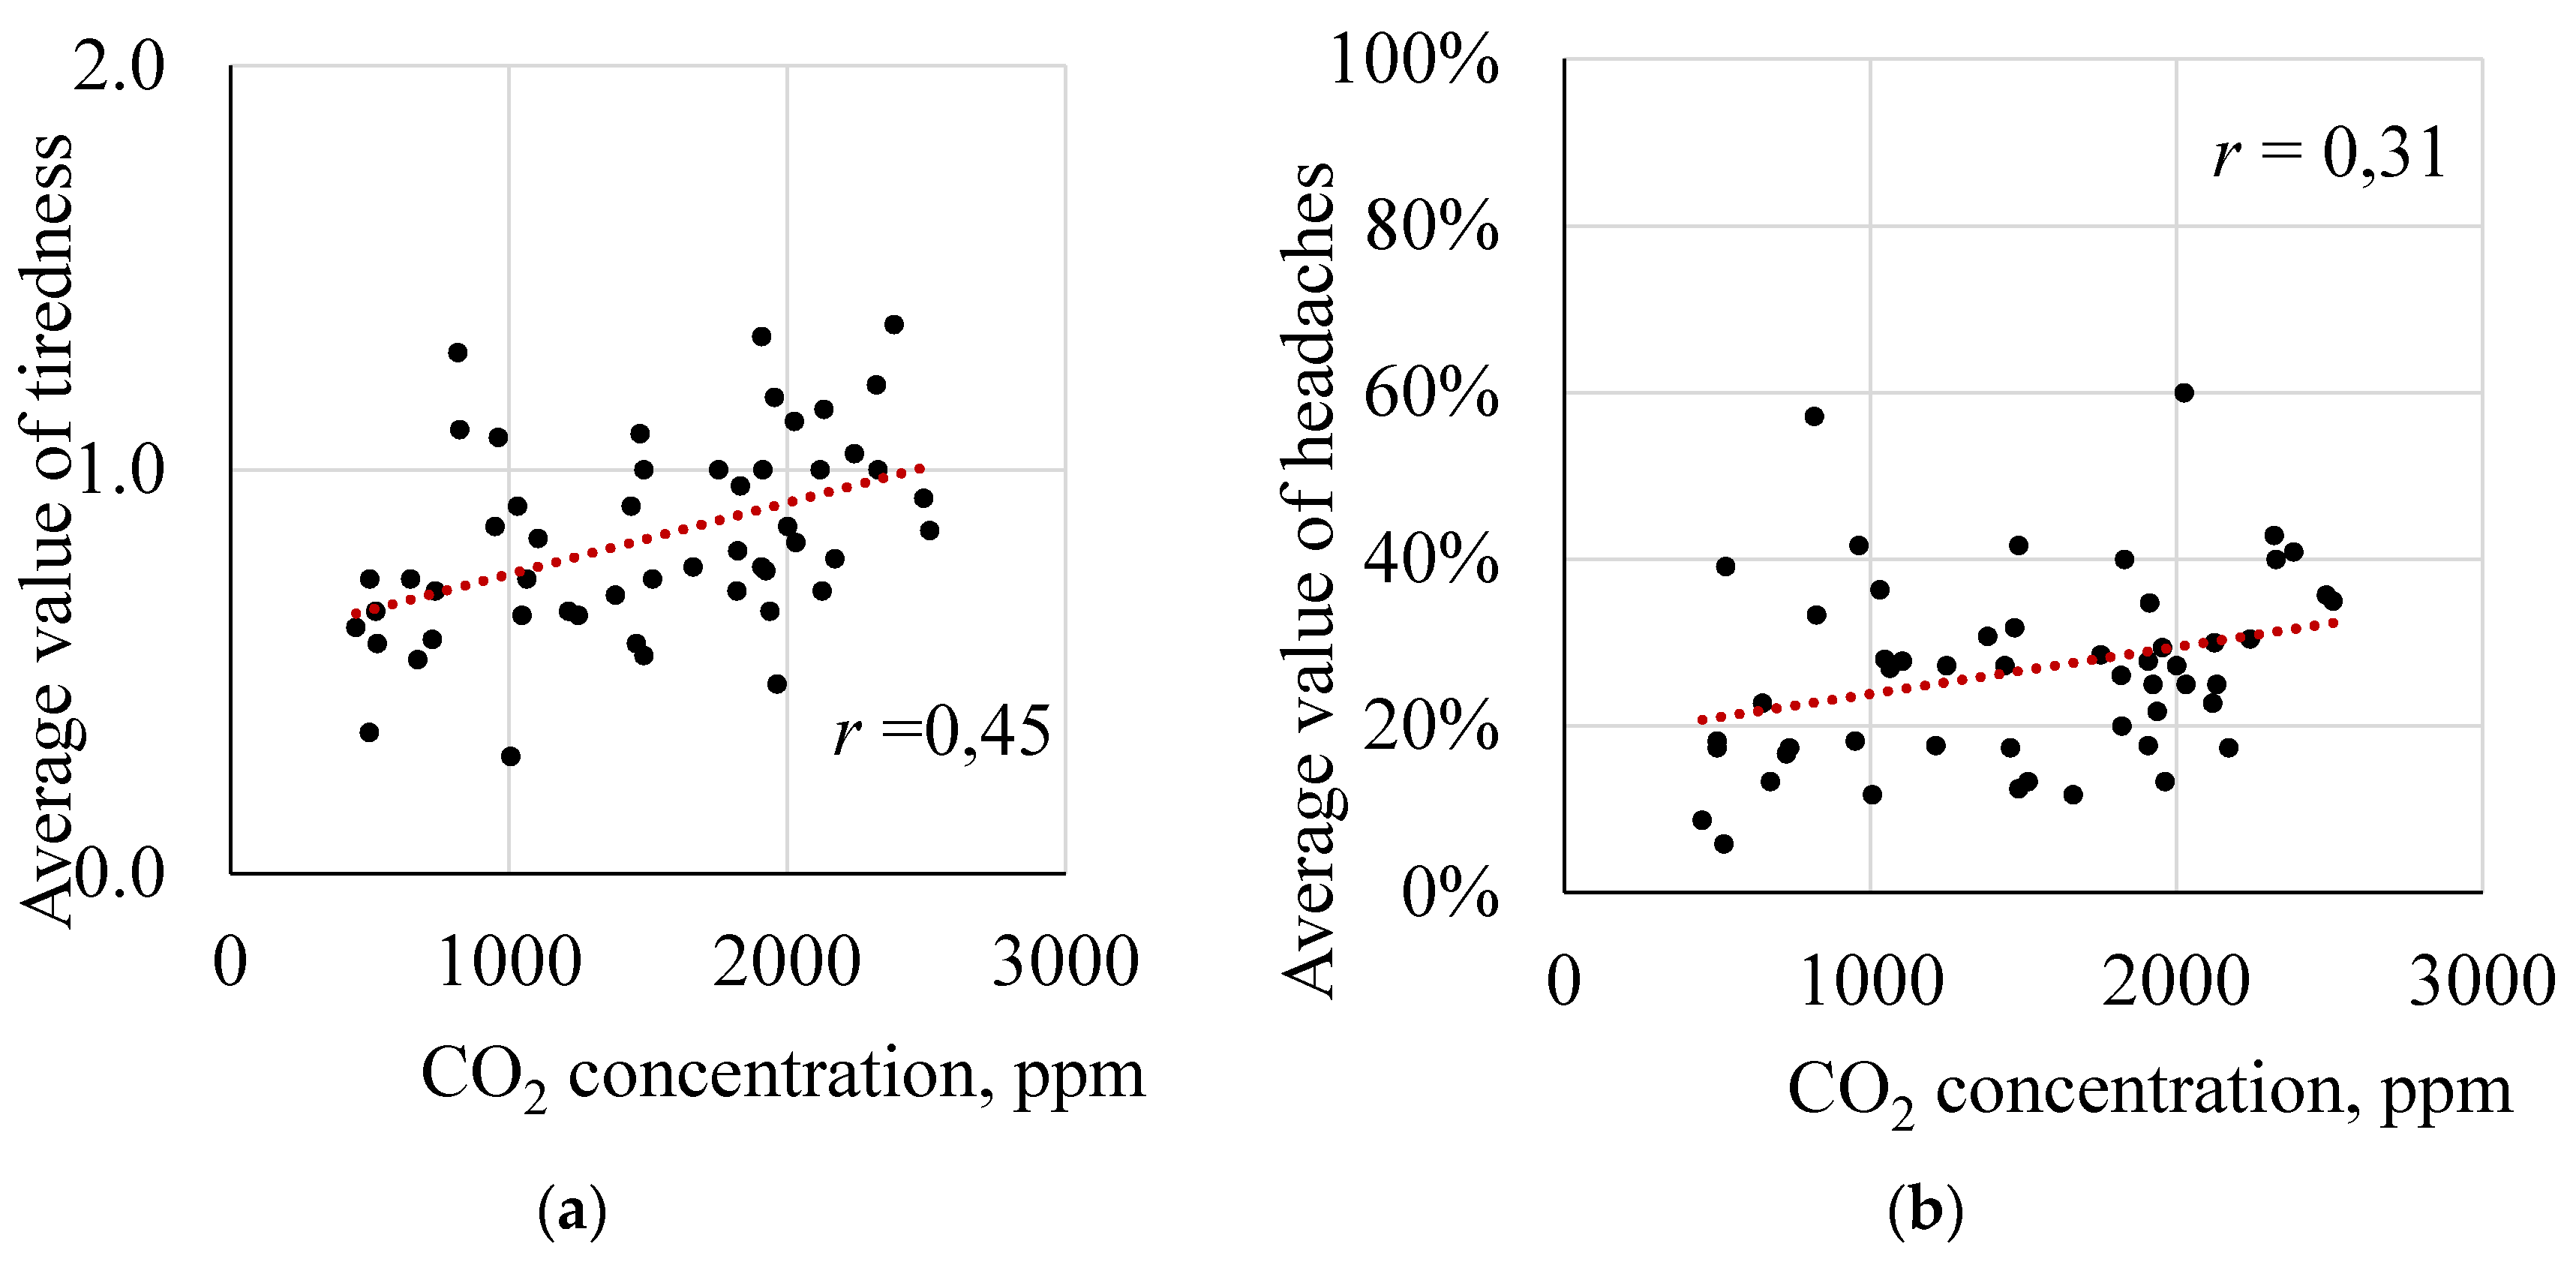
The data from Figure 7 shows that there is a positive correlation between the CO2 concentration and the mean fatigue of pupils. The correlation coefficient was r = 0.45, which corresponds to average correlation strength (0.3 < r < 0.7). In addition, a positive correlation between CO2 concentration and the percentage of pupils with headache are shown. The correlation coefficient is r = 0.31, which corresponds to the average correlation (0.3 < r < 0.7), but the correlation is weaker compared to the other combinations.
The results of the survey show that indoor IEQ, overheating and fatigue ratings, as well as headaches per hour, have a moderate correlation with CO2 concentration in the classroom, so CO2 concentration may have the potential to influence student well-being at school, but the correlation is not strong because well-being is affected by many other factors. The occurrence of headaches in the learning process is not direct evidence of their correlation with the increase in CO2 concentration in the room, as the period of non-compliance with the CO2 concentration standard may be too small for pupils to suffer from headaches. Headaches can also be caused by other factors, such as sickness or sleep deprivation in students, and difficulties in understanding the class subject.
During the experiment, along with the pupil survey and the measurements of the CO2 concentration, a pupil attention test was conducted. The average values of the obtained data are shown in Table 9.
The data show that the maximum test score averages at both the beginning and end of the classes are at the latest class nr. 6, but the minimum values are at classes nr.3 and nr.4 as well as at the end of class nr.1. At the end of the lesson, the average test results are always better than at the beginning of the lesson. This could be explained as students focus on learning procedure during the class by participating in the lesson process and completing assignments based on the lesson theme, therefore are getting in the mindset of learning, and increasing their focus. In addition, when completing the task at the end of the class they are already familiar with the test procedure and know the method of execution, which helps them to write it faster and more accurately.
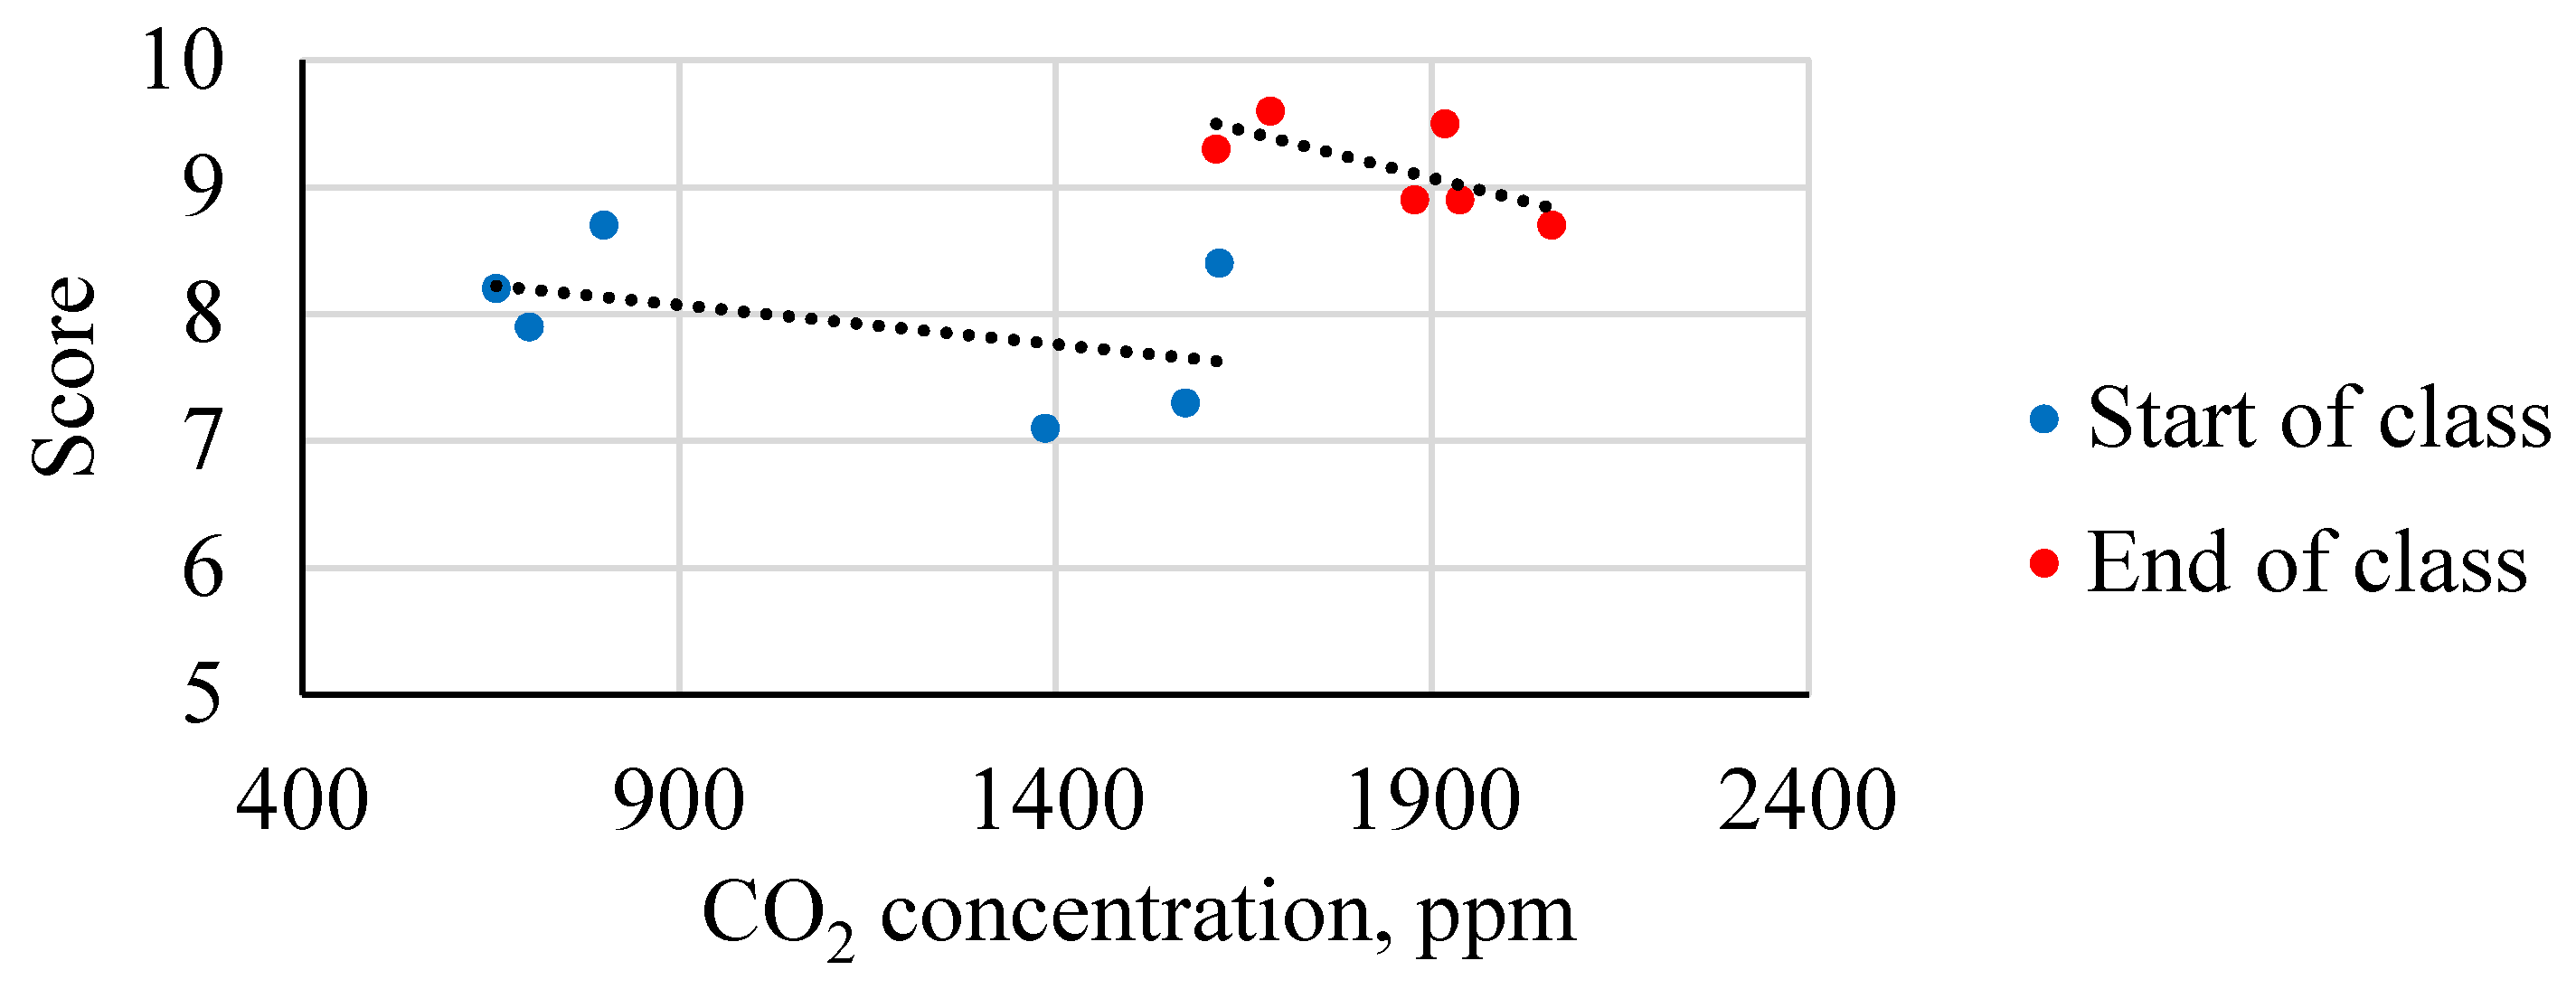
There is a small but noticeable correlation between the test results and the CO2 concentration measurements. It can be seen (Figure 8 and Table 9) that at the beginning of classes nr. 3 and nr. 4, with elevated concentrations of CO2, which corresponds only to the Category 3 norm, the lowest results are achieved. The best results are achieved at the beginning of class nr. 6 when the CO2 concentration level corresponds to Category 1. From the results obtained by the test performed at the end of the classes, it can be concluded that a similar correlation can be seen between the data. The lowest results are at the end of classes nr. 1, 3 and 4 when the CO2 concentration is the highest and does not correspond to any norm category. The best result, on the other hand, was observed in the learning process when the CO2 concentration was at least in Category 3. This proves that as the CO2 concentration in the classroom increases, the test performance decreases.
4. Conclusions
The measurements of CO2 concentration coupled with surveys of pupils and tests to estimate their concentration levels were performed. The highest levels of CO2 concentration were observed during the third and fourth hours of study, but up to the fifth and sixth hours, the concentration of CO2 remained within the normal range.
A correlation between breaks and changes in CO2 concentration in the learning process was observed. In addition, there is a moderate correlation between the results of the survey and the CO2 concentration, so the concentration of CO2 may have the potential to influence the well-being of the pupil at school, but the correlation is not strong and decisive as many other factors influence well-being.
The results show that at the beginning of the lesson, the students performed worse than at the end of the lesson because the students’ cognitive thinking at the end of the lesson is more active. As well as the second time students complete the test, they already knew the conditions and the fastest way to complete the test. A series of exercises are needed to more accurately determine the relationship between the increase in CO2 concentration and the decline in student attention. It has been found that as the CO2 concentration in the classroom increases, the test performance decreases.
Based on the obtained results, it can be concluded that the period of elevated CO2 concentration, or the time when the CO2 concentration is higher than all 3 permissible air quality norms in the premises of the Secondary School from 1st to 6th lesson is quite long. Consequently, recommendations should be made to keep carbon dioxide levels within the normative levels and to ensure that pupils have a healthy stay in the classroom. To avoid exceeding the recommended CO2 concentration levels mechanical ventilation in the classroom should be installed. If this is not possible then each pupil should be provided with approximately 2 m2, so a classroom of 48.6 m2 may take place in classrooms with less than 23 pupils and a teacher.
During the breaks, the concentration of CO2 should be reduced to 500 to 600 ppm. This way the CO2 concentration during the classes would not exceed the limit values of Category 3. To achieve this, 10 min breaks are not enough, and they must be increased to at least 15 min the long 30 min breaks can be reduced to 20 min, as this time is sufficient to ventilate the room, and long periods of ventilation can rapidly reduce the temperature of the room during the winter period.
To improve the study, observations of CO2 concentrations must be extended throughout the school year, as well as measurements in other classrooms in the school should be made. Further development of the study can be performed by measuring CO2 concentration in other schools with different ventilation types.
Author Contributions
Measurements and data analysis were performed by S.B.; supervision and writing by J.Z.; review and editing by R.B. All authors have read and agreed to the published version of the manuscript.
Funding
This work has been supported by the European Regional Development Fund within the Activity 1.1.1.2 “Post-doctoral Research Aid” of the Specific Aid Objective 1.1.1 “To increase the research and innovative capacity of scientific institutions of Latvia and the ability to attract external financing, investing in human resources and infrastructure” of the Operational Programme “Growth and Employment” (No. 1.1.1.2/VIAA/1/16/033).
Conflicts of Interest
The authors declare no conflict of interest.
References
- Pikutis, R.; Šeduikytė, L. Estimation of the Effectiveness of Renovation Work in Lithuanian Schools. J. Civ. Eng. Manag. 2006, 12, 163–168. [Google Scholar] [CrossRef]
- Seduikyte, L.; Paukstys, V.; Sadauskiene, J.; Dauksys, M.; Pupeikis, D.; Ivanauskas, E. Evaluation of energy performance and environmental conditions in Lithuanian schools. In Proceedings of the 12th International Multidisciplinary Scientific GeoConference and EXPO—Modern Management of Mine Producing, Geology and Environmental Protection, SGEM 2012, Albena, Bulgaria, 17–23 June 2012. [Google Scholar]
- Jovanović, M.; Vučićević, B.; Turanjanin, V.; Živković, M.; Spasojević, V. Investigation of indoor and outdoor air quality of the classrooms at a school in Serbia. Energy 2014, 77, 42–48. [Google Scholar] [CrossRef]
- EN 15251 Criteria for the Indoor Environment Including Thermal, Indoor Air Quality, Light and Noise; CEN: Brussels, Belgium, 2019.
- Simanic, B.; Nordquist, B.; Bagge, H.; Johansson, D. Indoor air temperatures, CO2 concentrations and ventilation rates: Long-term measurements in newly built low-energy schools in Sweden. J. Build. Eng. 2019, 25, 100827. [Google Scholar] [CrossRef]
- EN 16798-1:2015 Indoor Environmental Input Parameters for Design and Assessment of Energy Performance of Buildings Addressing Indoor Air Quality, Thermal Environment. Lighting and Acoustics; CEN: Brussels, Belgium, 2015.
- Almeida, R.M.; De Freitas, V.P. Indoor environmental quality of classrooms in Southern European climate. Energy Build. 2014, 81, 127–140. [Google Scholar] [CrossRef]
- Salthammer, T.; Uhde, E.; Schripp, T.; Schieweck, A.; Morawska, L.; Mazaheri, M.; Clifford, S.; He, C.; Buonanno, G.; Querol, X.; et al. Children’s well-being at schools: Impact of climatic conditions and air pollution. Environ. Int. 2016, 94, 196–210. [Google Scholar] [CrossRef] [PubMed] [Green Version]
- Jurelionis, A.; Seduikyte, L. Indoor environmental conditions in Lithuanian schools. In Proceedings of the 7th International Conference on Environmental Engineering, ICEE 2008—Conference Proceedings, Vilnius, Lithuania, 22–23 May 2008; pp. 833–839. [Google Scholar]
- Borodinecs, A.; Budjko, Z. Indoor air quality in nursery schools in Latvia. In Proceedings of the 9th International Conference and Exhibition—Healthy Buildings 2009, HB 2009, Syracuse, NY, USA, 13–17 September 2009. [Google Scholar]
- Stankevica, G.; Lesinskis, A. Indoor Air Quality and Thermal Comfort Evaluation in Latvian Daycare Centers with Carbon Dioxide, Temperature and Humidity as Indicators. J. Civ. Eng. Arch. 2012, 6. [Google Scholar] [CrossRef] [Green Version]
- Hou, Y.; Liu, J.; Li, J. Investigation of Indoor Air Quality in Primary School Classrooms. Procedia Eng. 2015, 121, 830–837. [Google Scholar] [CrossRef] [Green Version]
- Fisk, W.J. The ventilation problem in schools: Literature review. Indoor Air 2017, 27, 1039–1051. [Google Scholar] [CrossRef] [Green Version]
- Prozuments, A.; Borodinecs, A. The optimal operating range of VAV supply units. In Proceedings of the 10th International Conference on Healthy Buildings 2012, Brisbane, Australia, 8–12 July 2012; Volume 2. [Google Scholar]
- School Environment: Policies and Current Status; WHO Regional Office for Europe: Copenhagen, Denmark, 2015.
- The Results of Health Inspection’s Research “Indoor Air Quality at Schools” at Latvian Schools during the 2015./2016. Studying Years. Available online: http://www.vi.gov.lv/lv/vides-veseliba/gaiss/iekstelpu-gaiss/pvo-petijums (accessed on 20 November 2020).
- Schibuola, L.; Scarpa, M.; Tambani, C. Natural Ventilation Level Assessment in a School Building by CO2 Concentration Measures. Energy Procedia 2016, 101, 257–264. [Google Scholar] [CrossRef]
- Stabile, L.; Buonanno, G.; Frattolillo, A.; Dell’Isola, M. The effect of the ventilation retrofit in a school on CO2, airborne particles, and energy consumptions. Build. Environ. 2019, 156, 1–11. [Google Scholar] [CrossRef]
- Teplova, Z.; Solovyeva, K.; Nemova, D.; Trubina, D.; Petrosova, D. Thermo technical calculation of enclosure structure of comprehensive school. Constr. Unique Build. Struct. 2014, 4, 96–108. [Google Scholar]
- Gorshkov, A.; Vatin, N.; Rymkevich, P.P.; Kydrevich, O.O. Payback period of investments in energy saving. Mag. Civ. Eng. 2018, 78, 65–75. [Google Scholar] [CrossRef]
- Vatin, N.; Gorshkov, A.S.; Nemova, D.; Tarasova, D. Energy Efficiency of Facades at Major Repairs of Buildings. Appl. Mech. Mater. 2014, 991–996. [Google Scholar] [CrossRef]
- Stabile, L.; Dell’Isola, M.; Russi, A.; Massimo, A.; Buonanno, G. The effect of natural ventilation strategy on indoor air quality in schools. Sci. Total. Environ. 2017, 595, 894–902. [Google Scholar] [CrossRef] [PubMed]
- Mendell, M.J.; Heath, G.A. Do indoor pollutants and thermal conditions in schools influence student performance? A critical review of the literature. Indoor Air 2005, 15, 27–52. [Google Scholar] [CrossRef] [PubMed]
- Wargocki, P.; Wyon, D.P. Providing better thermal and air quality conditions in school classrooms would be cost-effective. Build. Environ. 2013, 59, 581–589. [Google Scholar] [CrossRef]
- Satish, U.; Mendell, M.J.; Shekhar, K.; Hotchi, T.; Sullivan, D.; Streufert, S.; Fisk, W.J. Is CO2an Indoor Pollutant? Direct Effects of Low-to-Moderate CO2Concentrations on Human Decision-Making Performance. Environ. Health Perspect. 2012, 120, 1671–1677. [Google Scholar] [CrossRef] [Green Version]
- Luther, M.B.; Horan, P.; Tokede, O. Investigating CO2concentration and occupancy in school classrooms at different stages in their life cycle. Arch. Sci. Rev. 2017, 61, 83–95. [Google Scholar] [CrossRef]
- Shendell, D.G.; Prill, R.; Fisk, W.J.; Apte, M.G.; Blake, D.; Faulkner, D. Associations between classroom CO2 concentrations and student attendance in Washington and Idaho. Indoor Air 2004, 14, 333–341. [Google Scholar] [CrossRef]
- Turunen, M.; Toyinbo, O.; Putus, T.; Nevalainen, A.; Shaughnessy, R.; Haverinen-Shaughnessy, U. Indoor environmental quality in school buildings, and the health and wellbeing of students. Int. J. Hyg. Environ. Health 2014, 217, 733–739. [Google Scholar] [CrossRef]
- Annesi-Maesano, I.; Baiz, N.; Banerjee, S.; Rudnai, P.; Rive, S.; on behalf of the SINPHONIE Group. Indoor Air Quality and Sources in Schools and Related Health Effects. J. Toxicol. Environ. Health Part B 2013, 16, 491–550. [Google Scholar] [CrossRef] [PubMed]
Figure 1.
(a) Picture of ongoing measurements; (b) schematic layout of the measurement setup in the classroom.
Figure 1.
(a) Picture of ongoing measurements; (b) schematic layout of the measurement setup in the classroom.

Figure 2.
Example of the performed survey.

Figure 3.
Example of the performance test.

Figure 4.
The changes in CO2 concentration and temperature in the classroom on Monday divided by the class nr.
Figure 4.
The changes in CO2 concentration and temperature in the classroom on Monday divided by the class nr.

Figure 5.
The changes in CO2 concentration and temperature in the classroom on Tuesday divided by the class nr.
Figure 5.
The changes in CO2 concentration and temperature in the classroom on Tuesday divided by the class nr.

Figure 6.
(a) Evaluation of indoor environmental quality (IEQ) as a function of CO2 concentration; (b) relationship of pupils’ heat sensation to CO2 concentration.
Figure 6.
(a) Evaluation of indoor environmental quality (IEQ) as a function of CO2 concentration; (b) relationship of pupils’ heat sensation to CO2 concentration.

Figure 7.
(a) Relationship of pupil fatigue to CO2 concentration; (b) relationship of the percentage of pupils with a headache to CO2 concentration.
Figure 7.
(a) Relationship of pupil fatigue to CO2 concentration; (b) relationship of the percentage of pupils with a headache to CO2 concentration.

Figure 8.
The correlation between the average CO2 concentration and score of the test at the start and end of the class.
Figure 8.
The correlation between the average CO2 concentration and score of the test at the start and end of the class.


Table 1.
CO2 concentration and temperature in schools according to EN 16798-1: 2019.
| 1st Category | 2nd Category | 3rd Category | ||
|---|---|---|---|---|
| CO2 concentration (above outdoor concentration) | 550 | 800 | 1350 | ppm |
| CO2 concentration (absolute values; outdoor CO2 concentration 480 ppm) | 1030 | 1280 | 1830 | ppm |
| Temperature | 21–23 | 20–24 | 19–25 | °C |
Table 2.
Daily ventilation process schedule.
| Time of the Day | Class Activity | Duration | Type of Ventilation |
|---|---|---|---|
| 7:40–7:59 | Break | 19 min | 2 windows open from above |
| 8:00–8:40 | Class nr. 1 | 40 min | 1 window open from above |
| 8:41–8:49 | Break | 8 min | 2 windows wide open and door opened |
| 8:50–9:30 | Class nr. 2 | 40 min | 1 window open from above |
| 9:31–9:39 | Break | 8 min | 2 windows wide open and door opened |
| 9:40–10:20 | Class nr. 3 | 40 min | 1 window open from above |
| 10:21–10:29 | Break | 8 min | 2 windows wide open and door opened |
| 10:30–11:10 | Class nr. 4 | 40 min | 1 window open from above |
| 11:11–11:39 | Break | 28 min | 2 windows wide open and door opened |
| 11:40–12:20 | Class nr. 5 | 40 min | 1 window open from above |
| 12:21–12:39 | Break | 18 min | 2 windows wide open and door opened |
| 12:40–13:20 | Class nr. 6 | 40 min | 1 window open from above |
| 13:21–14:00 | Break | 39 min | 2 windows open from above |
Table 3.
Average results of the survey at the beginning of the classes.
| Nr. of Pupilss | IEQ | Do You Feel too Hot | Do You Feel Tired | Headaches | CO2 | Temp. | ||||||||||
|---|---|---|---|---|---|---|---|---|---|---|---|---|---|---|---|---|
| 1 | 2 | 3 | 4 | 5 | No (0) | A Little (1) | Yes (2) | No (0) | A Little (1) | Yes (2) | No | Yes | ppm | °C | ||
| 1st | 19.8 | 0.0 | 1.0 | 5.0 | 10.3 | 3.5 | 12.5 | 6.0 | 1.3 | 9.8 | 8.5 | 1.5 | 17.3 | 2.5 | 657 | 20.0 |
| 2nd | 20.0 | 0.3 | 0.8 | 5.3 | 11.8 | 2.0 | 12.0 | 7.3 | 0.8 | 8.8 | 8.8 | 2.5 | 15.3 | 4.8 | 1617 | 21.2 |
| 3rd | 20.8 | 0.2 | 0.6 | 6.0 | 10.2 | 3.8 | 14.0 | 5.4 | 1.4 | 7.0 | 9.0 | 4.8 | 15.2 | 5.6 | 1572 | 21.5 |
| 4th | 21.6 | 0.0 | 1.0 | 6.8 | 11.0 | 2.8 | 14.6 | 5.6 | 1.4 | 7.8 | 10.8 | 3.0 | 16.0 | 5.6 | 1386 | 21.9 |
| 5th | 18.2 | 0.2 | 0.4 | 3.6 | 10.4 | 3.6 | 13.0 | 4.6 | 0.6 | 9.0 | 7.8 | 1.4 | 14.8 | 3.4 | 701 | 21.9 |
| 6th | 23.0 | 0.3 | 1.3 | 7.7 | 11.7 | 2.0 | 9.3 | 11.0 | 2.7 | 9.0 | 10.7 | 3.3 | 15.3 | 7.7 | 800 | 22.1 |
Table 4.
Average results of the survey at the end of the classes
| Nr. of Pupils | IEQ | Do You Feel too Hot | Do You Feel Tired | Headaches | CO2 | Temp. | ||||||||||
|---|---|---|---|---|---|---|---|---|---|---|---|---|---|---|---|---|
| 1 | 2 | 3 | 4 | 5 | No (0) | A Little (1) | Yes (2) | No (0) | A Little (1) | Yes (2) | No | Yes | ppm | °C | ||
| 1st | 19.8 | 0.5 | 1.3 | 7.0 | 9.5 | 1.5 | 10.0 | 6.8 | 3.0 | 7.8 | 9.0 | 3.0 | 15.8 | 4.0 | 1877 | 21.3 |
| 2nd | 20.0 | 0.8 | 2.5 | 7.8 | 7.8 | 1.3 | 10.3 | 7.3 | 2.5 | 6.3 | 8.3 | 5.5 | 13.5 | 6.5 | 1917 | 22.0 |
| 3rd | 20.8 | 0.8 | 2.0 | 7.8 | 7.8 | 2.4 | 9.0 | 9.2 | 2.6 | 4.6 | 9.2 | 7.0 | 13.2 | 7.6 | 2059 | 22.1 |
| 4th | 21.6 | 0.6 | 1.6 | 7.2 | 10.4 | 1.6 | 9.8 | 8.8 | 3.0 | 6.8 | 9.4 | 5.4 | 15.0 | 6.6 | 1937 | 22.5 |
| 5th | 18.2 | 0.2 | 0.8 | 7.8 | 7.8 | 1.4 | 10.0 | 6.6 | 1.6 | 6.4 | 8.6 | 3.2 | 14.0 | 4.2 | 1613 | 22.6 |
| 6th | 23.0 | 0.7 | 3.7 | 9.0 | 6.7 | 3.0 | 9.3 | 10.3 | 3.3 | 5.7 | 9.7 | 7.7 | 13.0 | 10.0 | 1685 | 22.8 |
Table 5.
The percentage of CO2 concentration above the respective indoor air quality (IAQ) category level at the beginning of class.
Table 5.
The percentage of CO2 concentration above the respective indoor air quality (IAQ) category level at the beginning of class.
| Class nr. | CO2 Concentration | Maximal | ||
| 1st Category | 2nd Category | 3rd Category |  | |
| 1st | In norm | In norm | In norm | |
| 2nd | 56.9% | 26.3% | In norm | |
| 3rd | 52.6% | 22.8% | In norm | |
| 4th | 34.5% | 8.3% | In norm | |
| 5th | In norm | In norm | In norm | |
| 6th | In norm | In norm | In norm | Minimal |
Table 6.
The percentage of CO2 concentration above the respective IAQ category level at the beginning of class.
Table 6.
The percentage of CO2 concentration above the respective IAQ category level at the beginning of class.
| Class nr. | CO2 Concentration | Maximal | ||
| 1st Category | 2nd Category | 3rd Category |  | |
| 1st | 82.2% | 46.6% | 2.6% | |
| 2nd | 86.1% | 49.7% | 4.7% | |
| 3rd | 99.9% | 60.9% | 12.5% | |
| 4th | 88.1% | 51.3% | 5.8% | |
| 5th | 56.6% | 26.0% | In norm | |
| 6th | 63.6% | 31.6% | In norm | Minimal |
Table 7.
Average survey results at the beginning of class.
| Class nr. | IEQ (±SD) | Thermal Comfort (±SD) | Tiredness (±SD) | Headaches |
|---|---|---|---|---|
| 1 to 5 | 0 to 2 | 0 to 2 | % of Pupils | |
| 1st | 3.82 ± 0.78 | 0.43 ± 0.61 | 0.58 ± 0.63 | 13% |
| 2nd | 3.73 ± 0.75 | 0.44 ± 0.57 | 0.69 ± 0.86 | 24% |
| 3rd | 3.81 ± 0.95 | 0.39 ± 0.68 | 0.89 ± 0.77 | 27% |
| 4th | 3.72 ± 0.80 | 0.39 ± 0.67 | 0.78 ± 0.70 | 26% |
| 5th | 3.92 ± 0.75 | 0.32 ± 0.55 | 0.58 ± 0.63 | 19% |
| 6th | 3.59 ± 0.79 | 0.71 ± 0.67 | 0.75 ± 0.69 | 33% |
Table 8.
Average survey results at the end of class.
| Class nr. | IEQ (±SD) | Thermal Comfort (±SD) | Tiredness (±SD) | Headaches |
|---|---|---|---|---|
| 1 to 5 | 0 to 2 | 0 to 2 | % of Pupils | |
| 1st | 3.52 ± 0.83 | 0.65 ± 0.73 | 0.76 ± 0.70 | 20% |
| 2nd | 3.31 ± 0.91 | 0.61 ± 0.70 | 0.96 ± 0.77 | 33% |
| 3rd | 3.43 ± 0.95 | 0.69 ± 0.68 | 1.12 ± 0.75 | 37% |
| 4th | 3.47 ± 0.85 | 0.69 ± 0.71 | 0.94 ± 0.75 | 31% |
| 5th | 3.48 ± 0.75 | 0.54 ± 0.66 | 0.82 ± 0.71 | 23% |
| 6th | 3.33 ± 1.00 | 0.74 ± 0.70 | 1.09 ± 0.78 | 43% |
Table 9.
Average test results of mental performance by the pupils at the start and at the end of class.
Table 9.
Average test results of mental performance by the pupils at the start and at the end of class.
| Class nr. | Start of Class | End of Class | ||
|---|---|---|---|---|
| Points (±SD) | CO2 Concentration, ppm | Points (±SD) | CO2 Concentration, ppm | |
| 1st | 8.2 ± 0.4 | 657 | 8.9 ± 0.6 | 1877 |
| 2nd | 8.4 ± 1.5 | 1617 | 9.5 ± 0.3 | 1917 |
| 3rd | 7.3 ± 1.5 | 1572 | 8.7 ± 1.2 | 2059 |
| 4th | 7.1 ± 1.3 | 1386 | 8.9 ± 0.9 | 1937 |
| 5th | 7.9 ± 1.5 | 701 | 9.3 ± 0.3 | 1613 |
| 6th | 8.7 ± 0.4 | 800 | 9.6 ± 0.1 | 1685 |
Publisher’s Note: MDPI stays neutral with regard to jurisdictional claims in published maps and institutional affiliations. |
© 2020 by the authors. Licensee MDPI, Basel, Switzerland. This article is an open access article distributed under the terms and conditions of the Creative Commons Attribution (CC BY) license (http://creativecommons.org/licenses/by/4.0/).
Share and Cite
MDPI and ACS Style
Bogdanovica, S.; Zemitis, J.; Bogdanovics, R. The Effect of CO2 Concentration on Children’s Well-Being during the Process of Learning. Energies 2020, 13, 6099. https://doi.org/10.3390/en13226099
AMA Style
Bogdanovica S, Zemitis J, Bogdanovics R. The Effect of CO2 Concentration on Children’s Well-Being during the Process of Learning. Energies. 2020; 13(22):6099. https://doi.org/10.3390/en13226099
Chicago/Turabian StyleBogdanovica, Snezana, Jurgis Zemitis, and Raimonds Bogdanovics. 2020. "The Effect of CO2 Concentration on Children’s Well-Being during the Process of Learning" Energies 13, no. 22: 6099. https://doi.org/10.3390/en13226099
Note that from the first issue of 2016, this journal uses article numbers instead of page numbers. See further details here.