Numerical Simulation and Experimental Validation of an Oil Free Scroll Compressor


Department of Chemical, Materials and Production Engineering, University of Naples Federico II, 80125 Naples, Italy
*
Author to whom correspondence should be addressed.
Energies 2020, 13(22), 5863; https://doi.org/10.3390/en13225863
Submission received: 15 October 2020
/
Revised: 4 November 2020
/
Accepted: 6 November 2020
/
Published: 10 November 2020
(This article belongs to the Special Issue Open Data and Models for Energy and Environment)
Abstract
:This paper presents a virtual model of a scroll compressor developed on the one-dimensional analysis software Simcenter Amesim®. The model is semi-empirical: it needs some physical details of the modelled machine (e.g., the cubic capacity), but, on the other hand, it does not require the geometrical features of the spirals, so it needs experimental data to calibrate it. The model also requires rotational speed and the outlet temperature as boundary conditions. The model predicts the power consumption and the mass flow rate and considers leakages and mechanical losses. After the model presentation, this paper describes the test bench and the obtained data used to calibrate and validate the model. At last, the calibration process is described, and the results are discussed. The calculated values fit the experimental data also in extrapolation, despite the model is simple and performs calculations within 7 s. Due to these characteristics, the model is suitable for being used in a larger model as a sub-component.
1. Introduction
Scroll compressors are widely used in applications where noise pollution and low vibrations are relevant factors, such as domestic refrigeration and domestic climatic control. Due to its unique properties, these machines are given much attention by scientific and industrial researchers. Some works, especially the oldest ones [1,2], are mainly focused on the theoretical functioning of those machines, even though the final aim has always been the improvement of the scroll efficiency. The scroll compressors efficiency-enhancing is pursued using different approaches, such as researching on the design of rotor profiles to reduce volumetric losses [3,4] or investigating the cooling effects on the compression work [5,6].
The latest most attractive research branches on scroll machines concern studies on the machine behaviour into thermodynamics cycles [7], works on the performance of injecting water (or vapour) compressors [8,9] and studies on the scroll expanders [10].
Many works on scroll compressors or expanders use a mathematical model that is generally virtualised with a low-level programming language. Among them, some use a geometrical approach [11,12,13,14,15] while others use semi-empirical methods [16,17,18]. Some details of one work for each group are briefly illustrated below. Blunier et al. [14] presented a model written in very-high-speed-integrated-circuits hardware description language (VHDL) code including the scroll’s geometrical features in it; the model does not need any calibration. Winandy et al. [18] used the Engineering Equation Solver (EES) software to virtualise the model equations. The model needs seven parameters to be obtained through a calibration process on mass flow rate, power output and outlet temperature. The required data points are obtained by themselves through several experimental runs.
The use of commercial 0-1D fluid-dynamic code was not frequent for machines models, while they are often used to simulate a whole thermodynamic cycle [18,19,20]. Ziliani et al. [19] used the commercial software Amesim® ( Siemens PLM Software, Plano, TX, USA)to model an entire Organic Rankine Cycle (ORC) plant where it is supposed to be used a screw or a scroll expander. The machines’ behaviour was deduced by a Computational Fluid Dynamics (CFD) simulation (for the scroll compressor) and a geometry-based simulation (for the screw compressor). Bracco et al. [20] used a similar approach for their ORC plant simulation: their machine model needs four parameters, that are based on a combination of some manufacturer information, experimental data and a self-made scroll simulation tool.
However, Bell et al. [21] recently (2020) developed an open-source platform (named PDSim) specific for modelling positive-displacement compressors. Tanveer et al. [22] compared different software on a reciprocating compressor finding that the PDSim suit has good potential. On the other hand, Rak et al. [23] relied on a CFD analysis to model in detail a cooled scroll compressor, thus considering heat transfer issues.
The main purpose of this work was the development of a fluid-dynamic model of a scroll compressor and its experimental validation. The model does not consider the internal geometry of the scroll, nor its kinematic behaviour. The model aim is to perform calculations in a few seconds so that it can be used as a sub-component of a whole plant model. In this paper, an oil-less commercial scroll compressor is modelled by a zero-dimensional semi-empirical model developed using the commercial software Simcenter Amesim® (version 19.2). The compressor is viewed as a pneumatic system made up by a series of peculiar reciprocating compressors with driven valves. Leakages and a keyed fan power consumption are considered. The experimental activities are performed on a commercial oil-less scroll compressor, at four rotational speed levels and six pressure levels.
2. The Scroll Compressor
The same timing scheme characterises all rotary machines. The rotors uncover ports and intercept cells carved in the stator, carrying the working fluid from the inlet side to the outlet. As the cells have a decreasing volume, a design pressure ratio βi is generated by the internal volume reduction (for roots compressors βi = 1). The compression ratio β, required by the application, may overlap or not with the compression ratio βi, that the machine can produce due to volume change of cells. Usually, regarding the scroll compressors, there is a moving spiral and a fixed spiral. The moving spiral describes an orbit around the base circle centre of the fixed. The spirals are thick circle involutes, and, in most cases, they are equals. Many authors described the scroll geometry and kinematic characteristics in details (e.g., Chen et al. [13]). The proposed model is not based on the geometry of the spirals, so this work will not examine these issues.
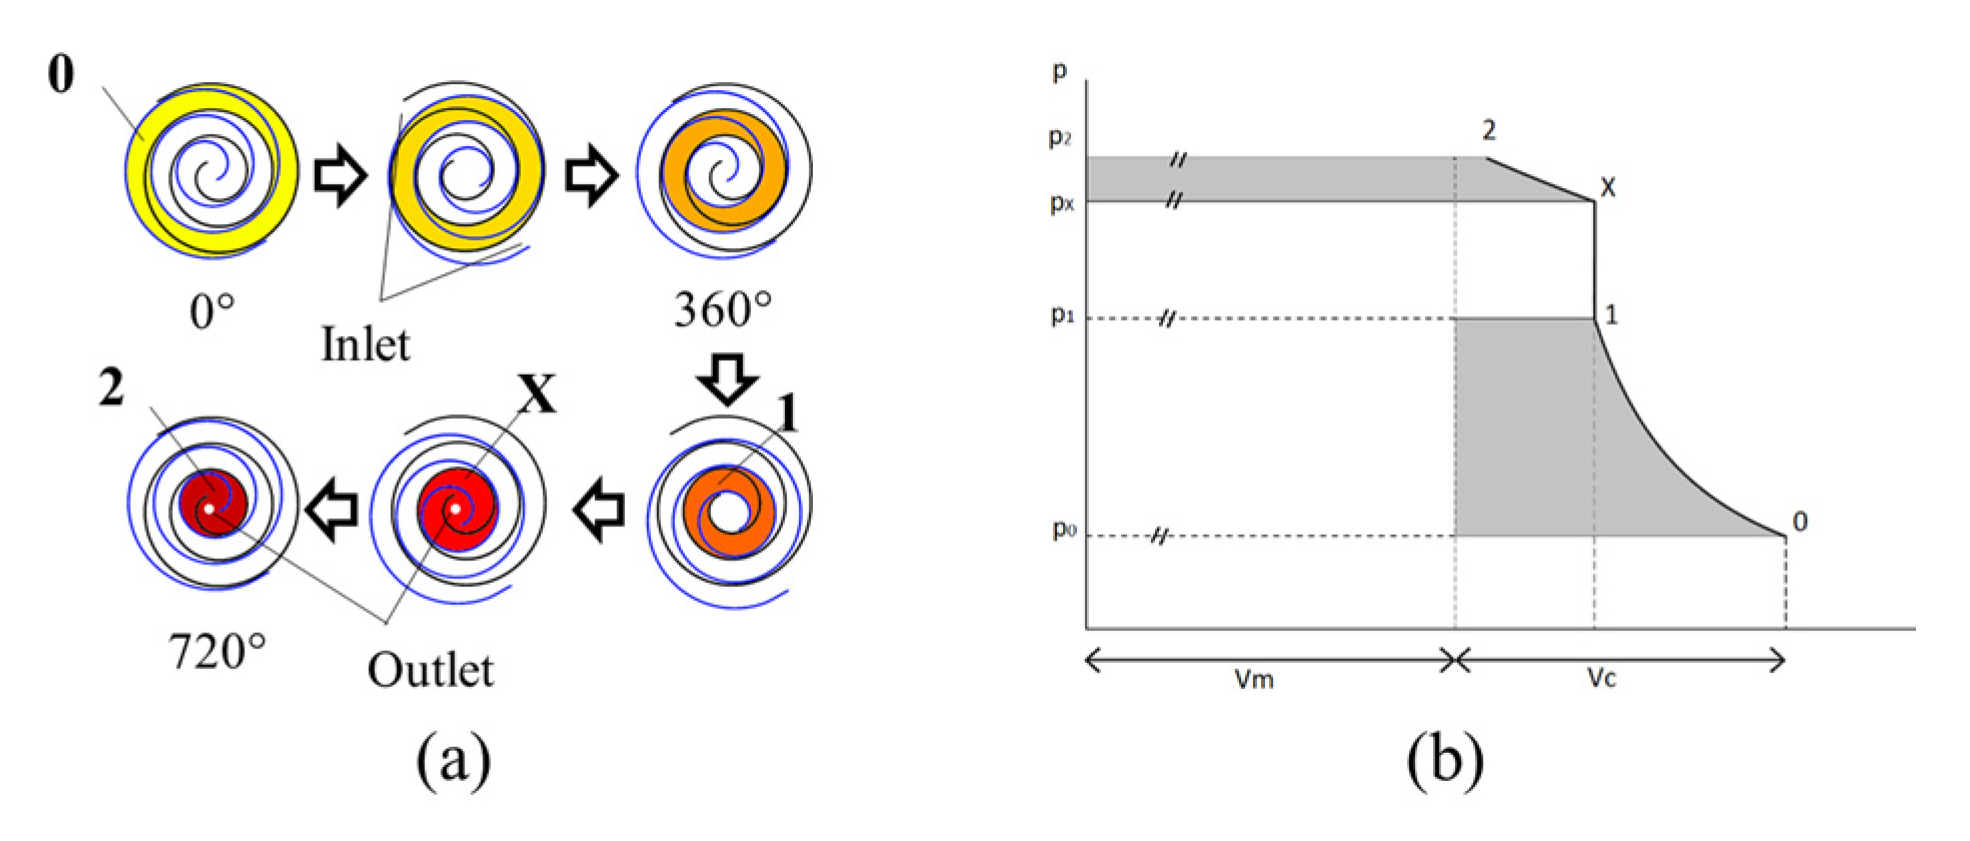
Figure 1a shows a scroll compressor working scheme, while Figure 1b shows a rotary volumetric compressor’s ideal cycle diagram. Referring to Figure 1, these machines make a first internal compression (from state 0 to state 1) through volume reduction. Then, at the opening of the last internal contacts of the machine, two volumes are put into communication: the last cell filled with gas in state 1 (p1, T1) and the discharge volume filled with gas in state 2 (p2, T2). Therefore, an instantaneous mixing phase (at constant volume) starts: the state of the whole gas becomes an intermediate state (px, Tx). In the next step of the machine rotors, while the volume of the last cell decreases, state 2 in the volume Vm is restored.
An authors’ previous work [24] theoretically analysed the machine β ≥ βi field. It illustrated an alternative representation of a generic ideal rotary compressor’s working scheme (see Figure 1). The theoretical analysis confirmed that the two theoretical models are equivalent. It was demonstrated that the proposed representation leads to a simpler but rigorous equation to calculate the ideal specific work consumption (see Equation (1)).
In this work, Equation (1) is used to give a theoretical validation to the proposed model, before implementing real losses and calibrating it on experimental data.
where k is the isentropic index, R is the gas constant (for air), T0 is the inlet temperature, TX is the temperature in the state X, mc is the mass elaborated per cycle, mm is the mass in the discharge volume. The other abbreviations are collected in Equation (2).
3. Numerical Model
The numerical model is developed on Simcenter Amesim® software.
Referring to Figure 2, two pairs (A, B) of variable volumetric chambers are used to simulate the scroll compressor. The volumetric variation does not follow the actual scroll chambers variation. The model uses a simple sinusoidal function of the shaft rotation. The compression process is modelled through the subsequent steps: the suction phase of chambers A1 and B1 stands for the scroll suction. They are in phase opposition so that the system has the suction phase 360° long and the sum of their cubic capacity is the scroll capacity. Three controlled valves for each pair of chambers are used to simulate the openings of the scroll contacts. These valves are opened every 180°. Focus on one pair of chambers (e.g., chambers A1 and A2). The first valve stands for the contacts that enclose half scroll suction chamber when it reaches its maximum capacity; the second valve separates the first chamber from the second and it stands for the contacts that separate the scroll suction chambers from the other scroll chambers. Then, the third valve stands for the contacts that separate the scroll compression chamber from the discharge chamber. Chambers A2 and B2 are smaller than the others and they are in phase opposition respective to chamber A1 and B1. When the second valve opens, the compression phase begins due to the total volumetric decreasing achieved after the second valve opening.
An ideal electric engine imposes a constant speed to the whole model. In this work, electric losses are neglected, because the experimental work input is measured downstream of the electric motor.
After the compression phase, the third valve opens and the second close. The discharge phase and the suction phase start respectively in chambers 2 and 1. The other pair of chambers (e.g., B1 and B2) are just the same, but they are in opposition of phase. Therefore, there is an entire suction and discharge that lasts 2π radians long in a revolution. An ideal infinite volume simulates the compressor discharge tank.
In this model, the heat losses are neglected, so the chambers are adiabatic. Therefore, the outlet temperature, as well as the inlet temperature, are set based on the experimental data. According to Yu Chen et al. [13] work there are two types of leakages: the flank leakages and the radial leakages. The flank leakages are simulated by an imperfect closing of the valves (the valves V1, V2, V3 that simulate the internal contacts). Therefore, when they should be closed, they are slightly opened. The radial leakages are simulated by internal by-pass (R). The mass flow rate through the valves is calculated via Equation (3) [25].
where A is the actual orifice area, Cq is Perry’s coefficient from his correlation [26], Cm is the flow coefficient as also described by Szente et al. [25], Pup and Tup are the upstream pressure and temperature.
The mechanical losses (ML) are modelled as a fixed frictional loss (one constant to be estimated). The keyed fan (KF) is simulated by a torque load function of the square of the rotational speed, so there are three parameters (A, B, C) to be estimated (see also Equation (4)).
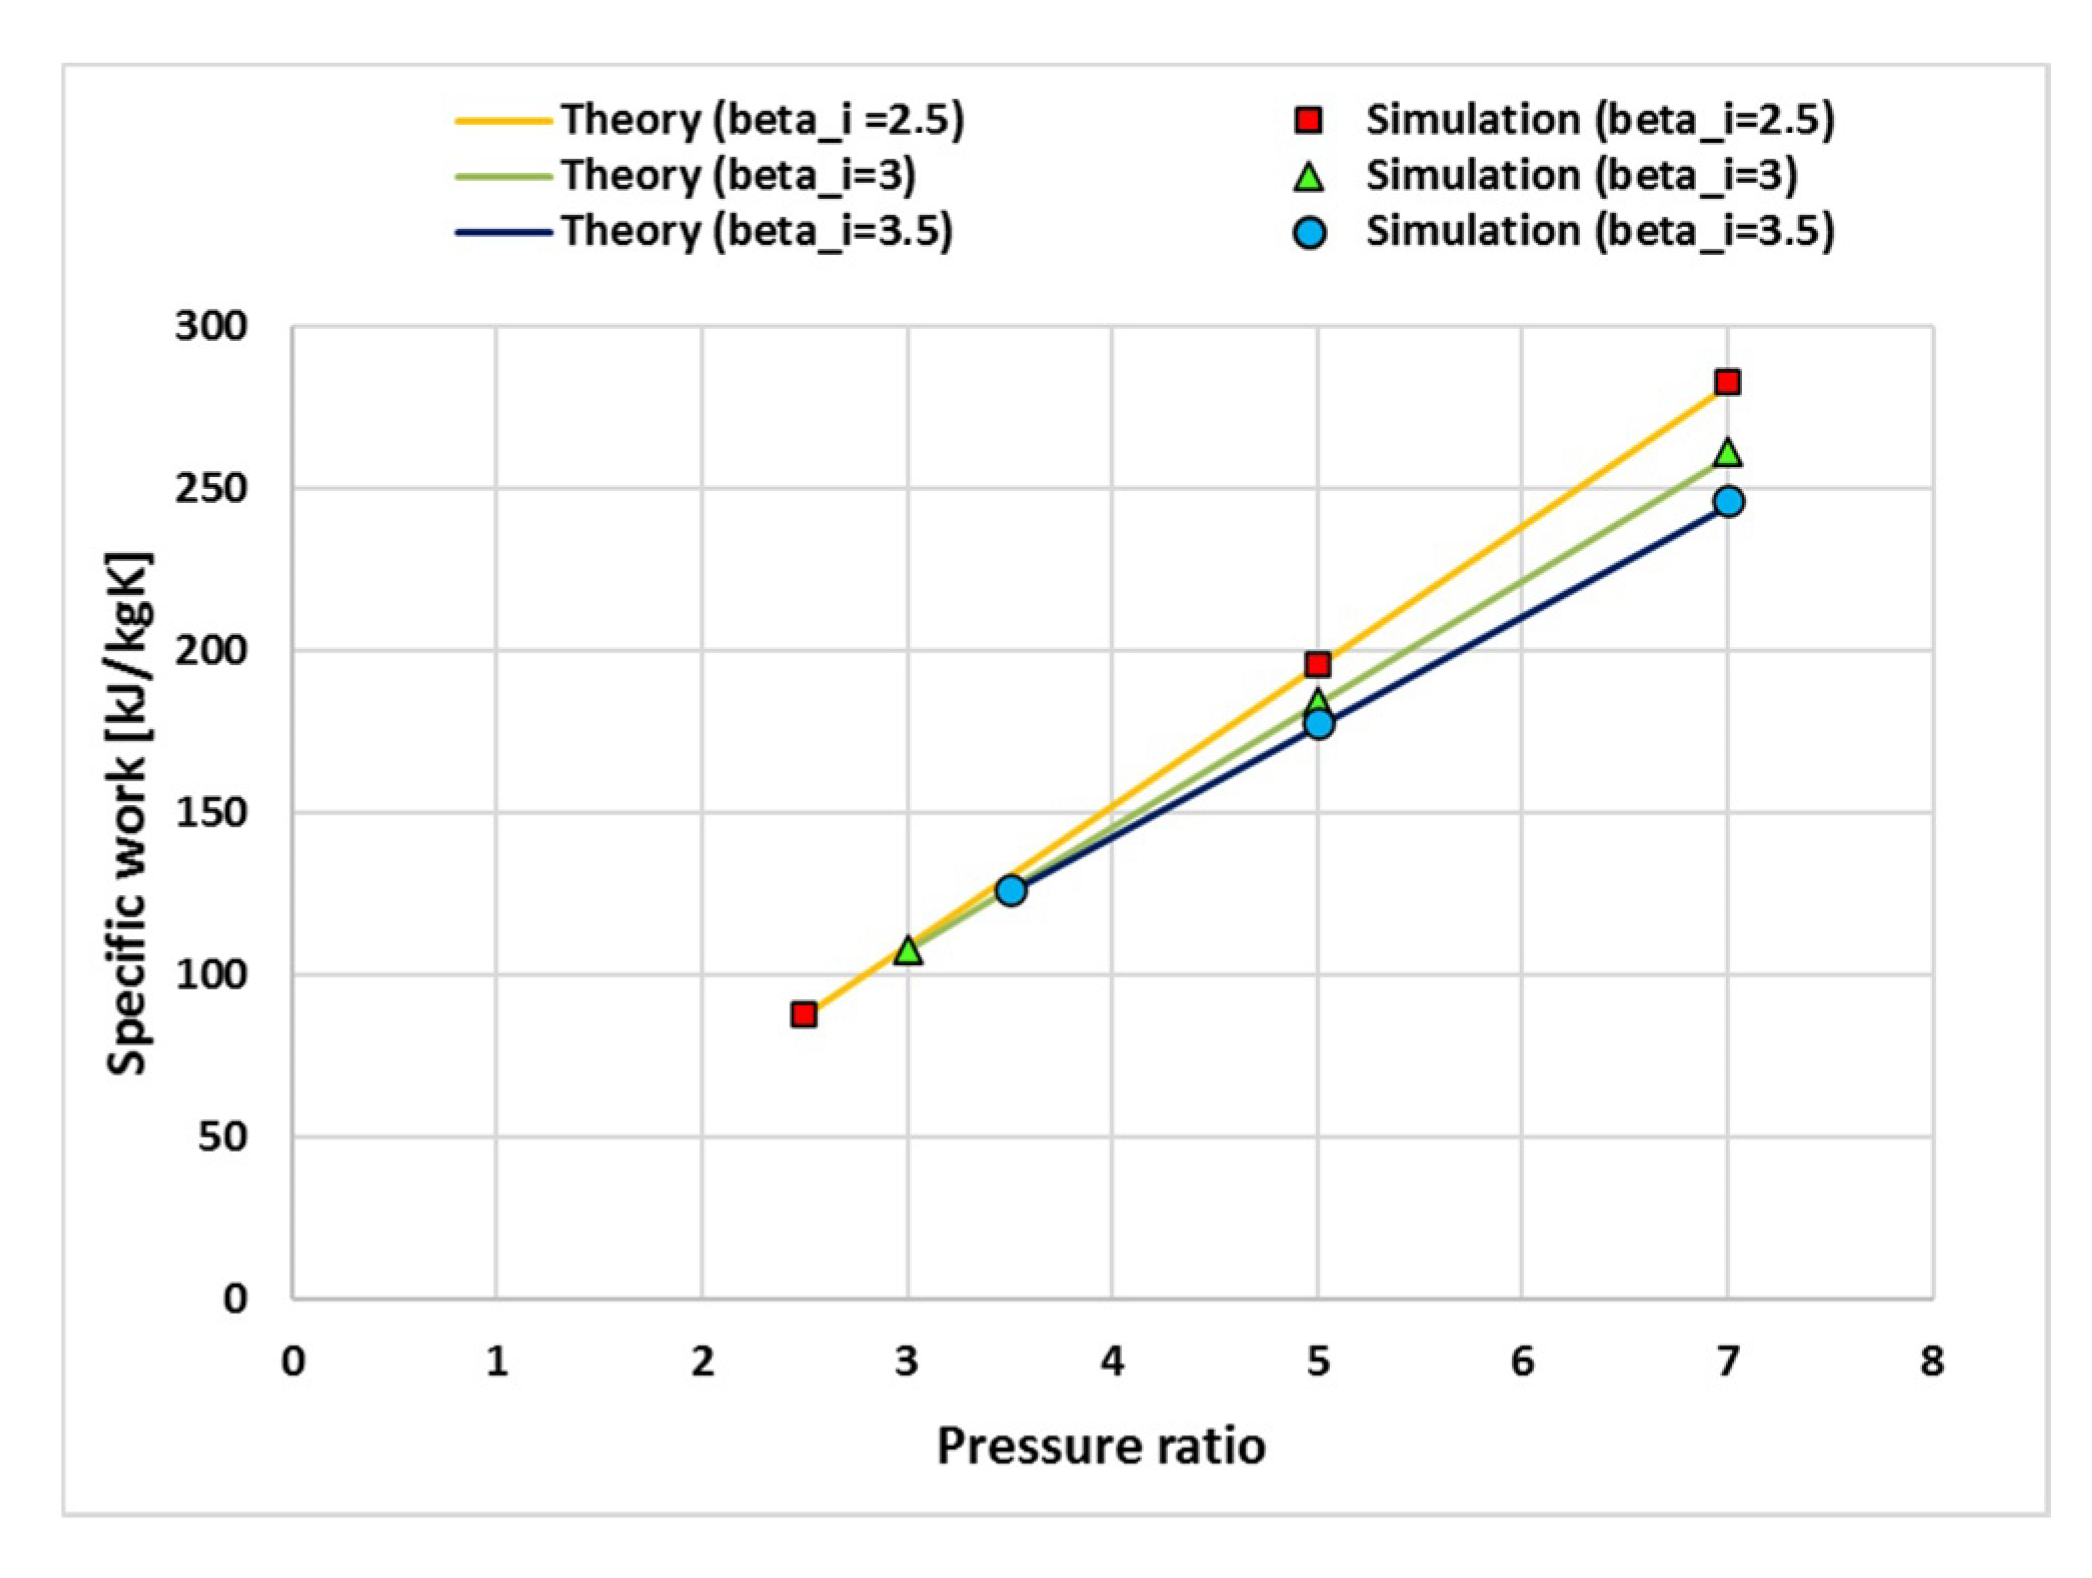
At first, the model is tested on an ideal case, suppressing the elements KF, ML and R. The model results are compared with the theoretical results of Equation (1), at different internal and total pressure ratios. Figure 3 shows that there are no significant deviations between the scroll ideal performances and the simplified numerical model. The maximum deviation obtained is always under 0.8% of the theoretical values (the model calculation is always greater than the theoretical value). These differences are caused by some small pressure losses still present in the model, and, secondary, by the model outlet tank, that the code treats as an infinite volume (the theoretical calculation is under the assumption of an outlet tank of 105 times the scroll cubic capacity). Overall, the proposed model is congruent with the theory, so, enabling KF, ML and R, it should be able to simulate real scrolls. The values of these elements’ parameters are estimated through a calibration process based on experimental data.
4. Results
4.1. Experimental Activities
4.1.1. Experimental Setup
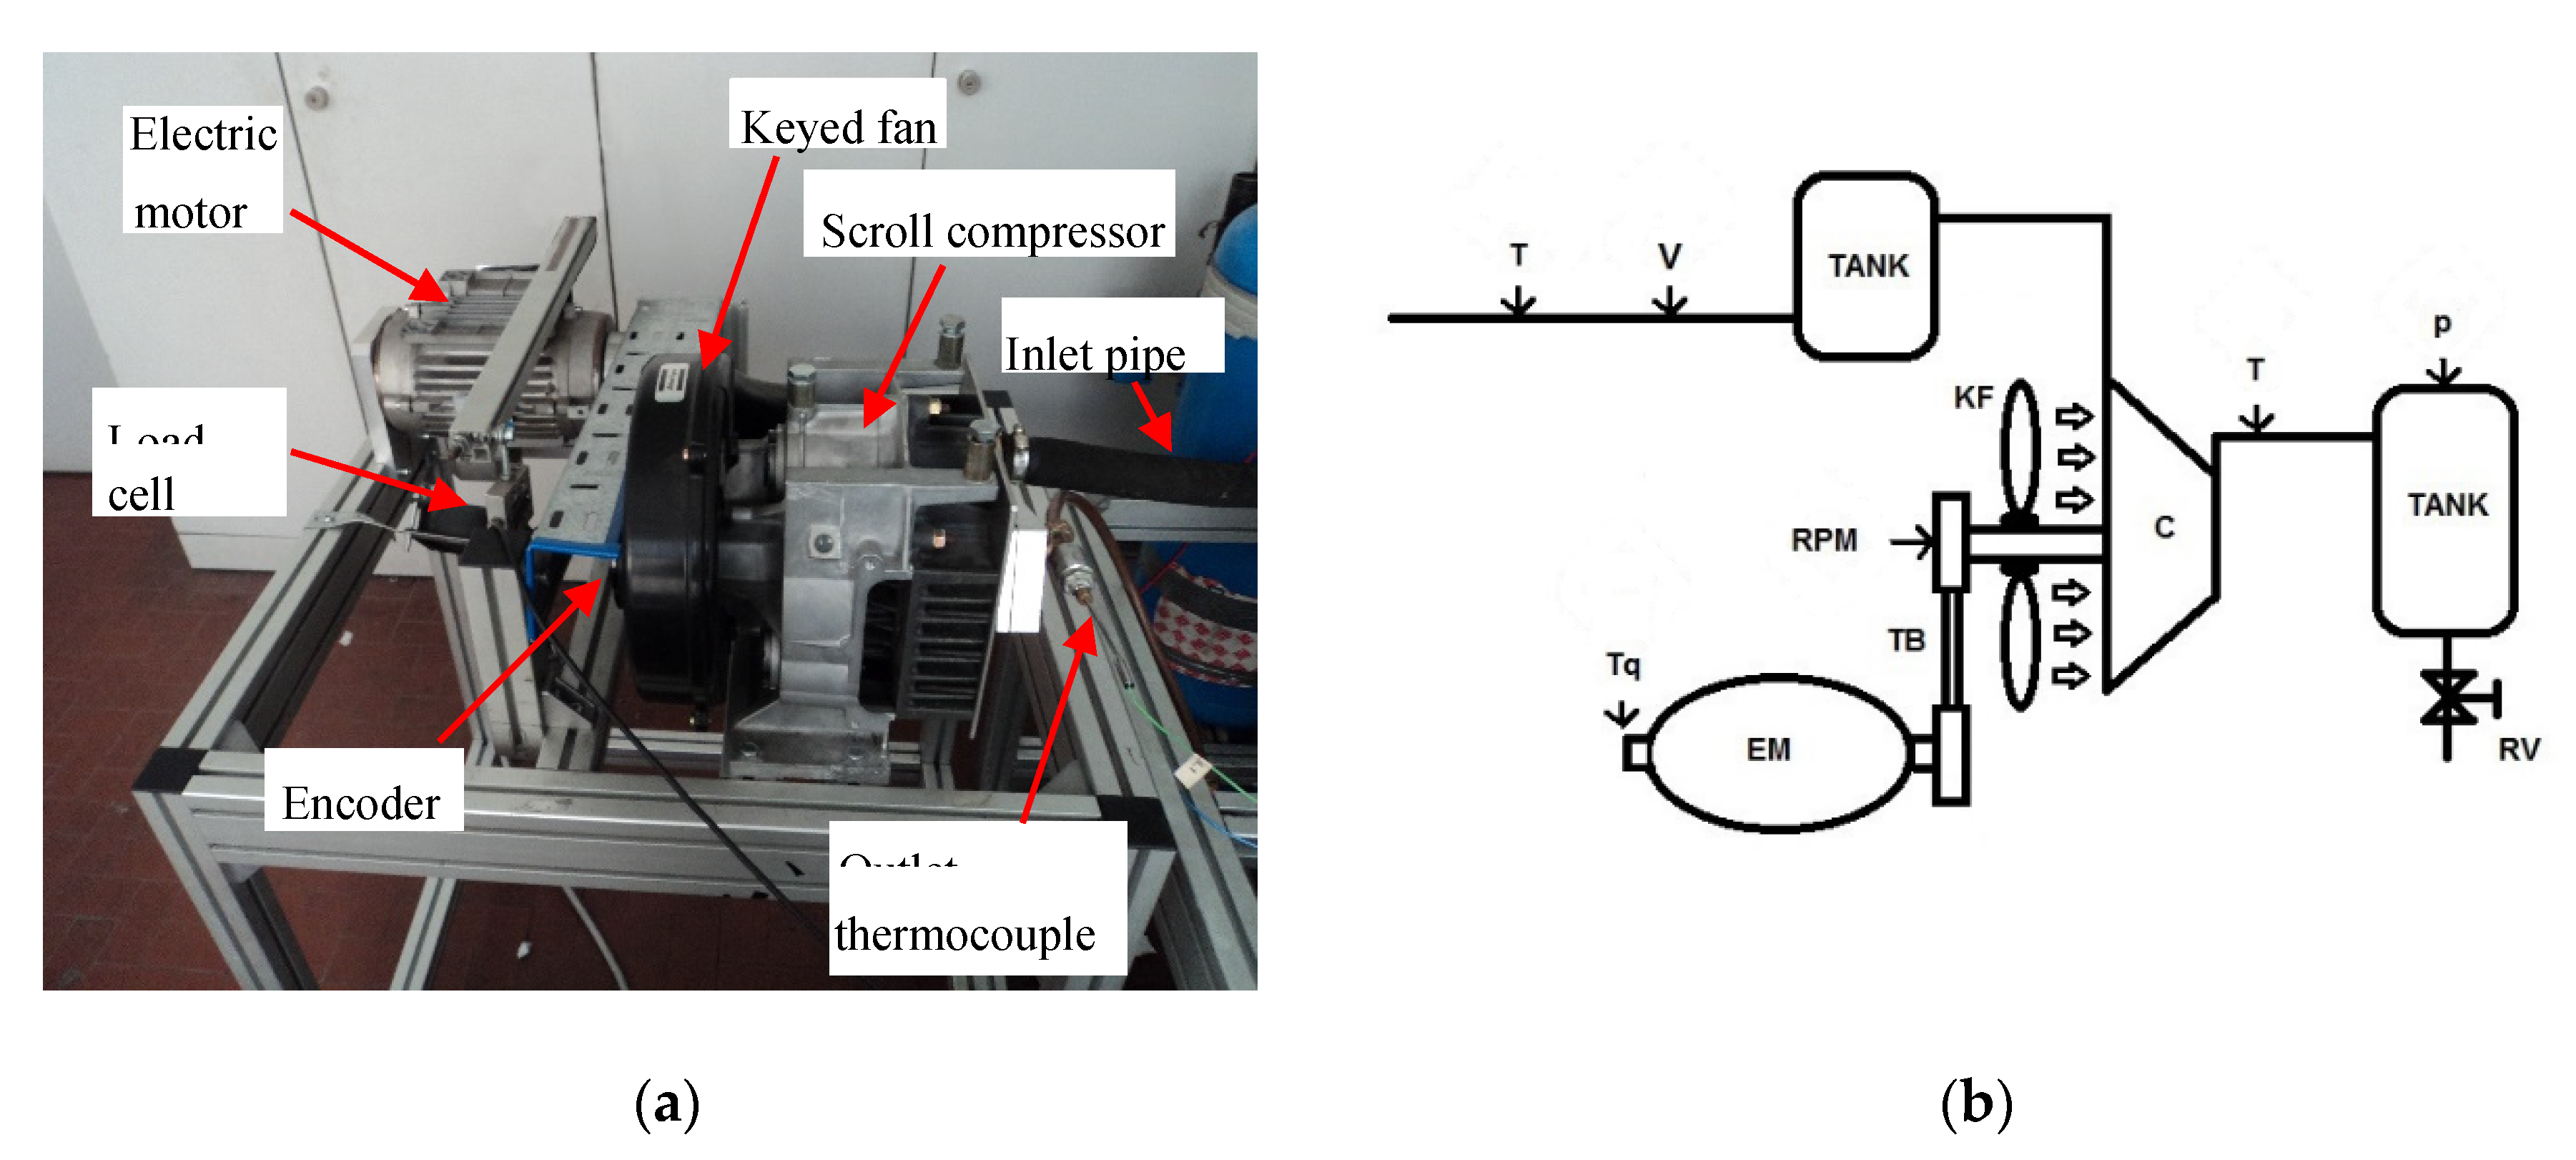
Figure 4a shows the experimental test bench used, Figure 4b illustrates its scheme and Table 1 collects the details on its main components. The machine tested is a 2.1 kW oil-free scroll compressor (C) taken from the ATLAS COPCO SF2 clean air generator (ATLAS COPCO, Nacka, Sweden). The required power is given by a three-phase oscillating-casing electrical asynchronous motor (EM). The motor is connected to an inverter that controls the motor speed modifying the current frequency. A load cell measures the required torque (Tq): the motor oscillating-casing is constrained by the load cell through an arm of a known length, so the product of the sensed force and the arm length is equal to the torque given by motor. A trapezoidal belt connects the compressor to the motor with a unitary transmission ratio (TB). The encoder (RPM) is integral with the compressor axis, measuring the compressor speed. The compressor original cooling fan is a centrifugal fan (KF), and it is keyed on the scroll axis. A turbine flow meter (V) measures the air volumetric flow rate at the suction of the compressor. Two K-type thermocouples (T) (mounted through a T-joint) measure the temperatures, both at the inlet and outlet pipe of the machine. The outlet thermocouple is mounted at 15 cm from the outlet port, due to the compressor built-in external fins. A piezo-resistive sensor (p) is linked to the calm reservoir (TANK) at the outlet to measure the required average pressure imposed on the compressor. The circuit ends with a regulator valve (RV) to control the outlet pressure. The data are digitalized by data acquisition system made up by a NI-DAQ USB 6259 (National Instrument, Austin, TX, USA) and a NI-FieldPoint cFP 1808 coupled with a cFP-TC-120 module that provides built-in cold joint correction for the thermocouples. All data are processed by a self-made software realized in LabVIEW ™ (version 15.5, National Instrument, Austin, TX, USA) code.
4.1.2. Experimental Plan
The test campaign considered in this work consists of four runs, each performed at total pressure ratios (β) from 2 to 7 and then from 7 to 2. Each run is performed at a different constant speed: 1000, 1500, 2000 and 2500 RPM. Once the compressor speed is set, the pressure in the outlet tank is controlled through the regulation valve. Starting from the lowest pressure ratio, when the desired value is reached, the acquisition system waits until the outlet temperature is stationary and then saves the data. Then, the regulation valve is tightened to achieve the next desired pressure ratio. The process is repeated until the pressure ratio reaches 7, and the system saves the data. Then, compressor state is modified reaching a pressure ratio of 7.5 (approaching the limits of the test bench). After 5 min, the process is repeated from pressure ratio 7 to 2. Despite the different thermal dynamics between the rising and the falling part of the run, the next paragraphs show that the measured data are close to each other.
4.1.3. Experimental Results
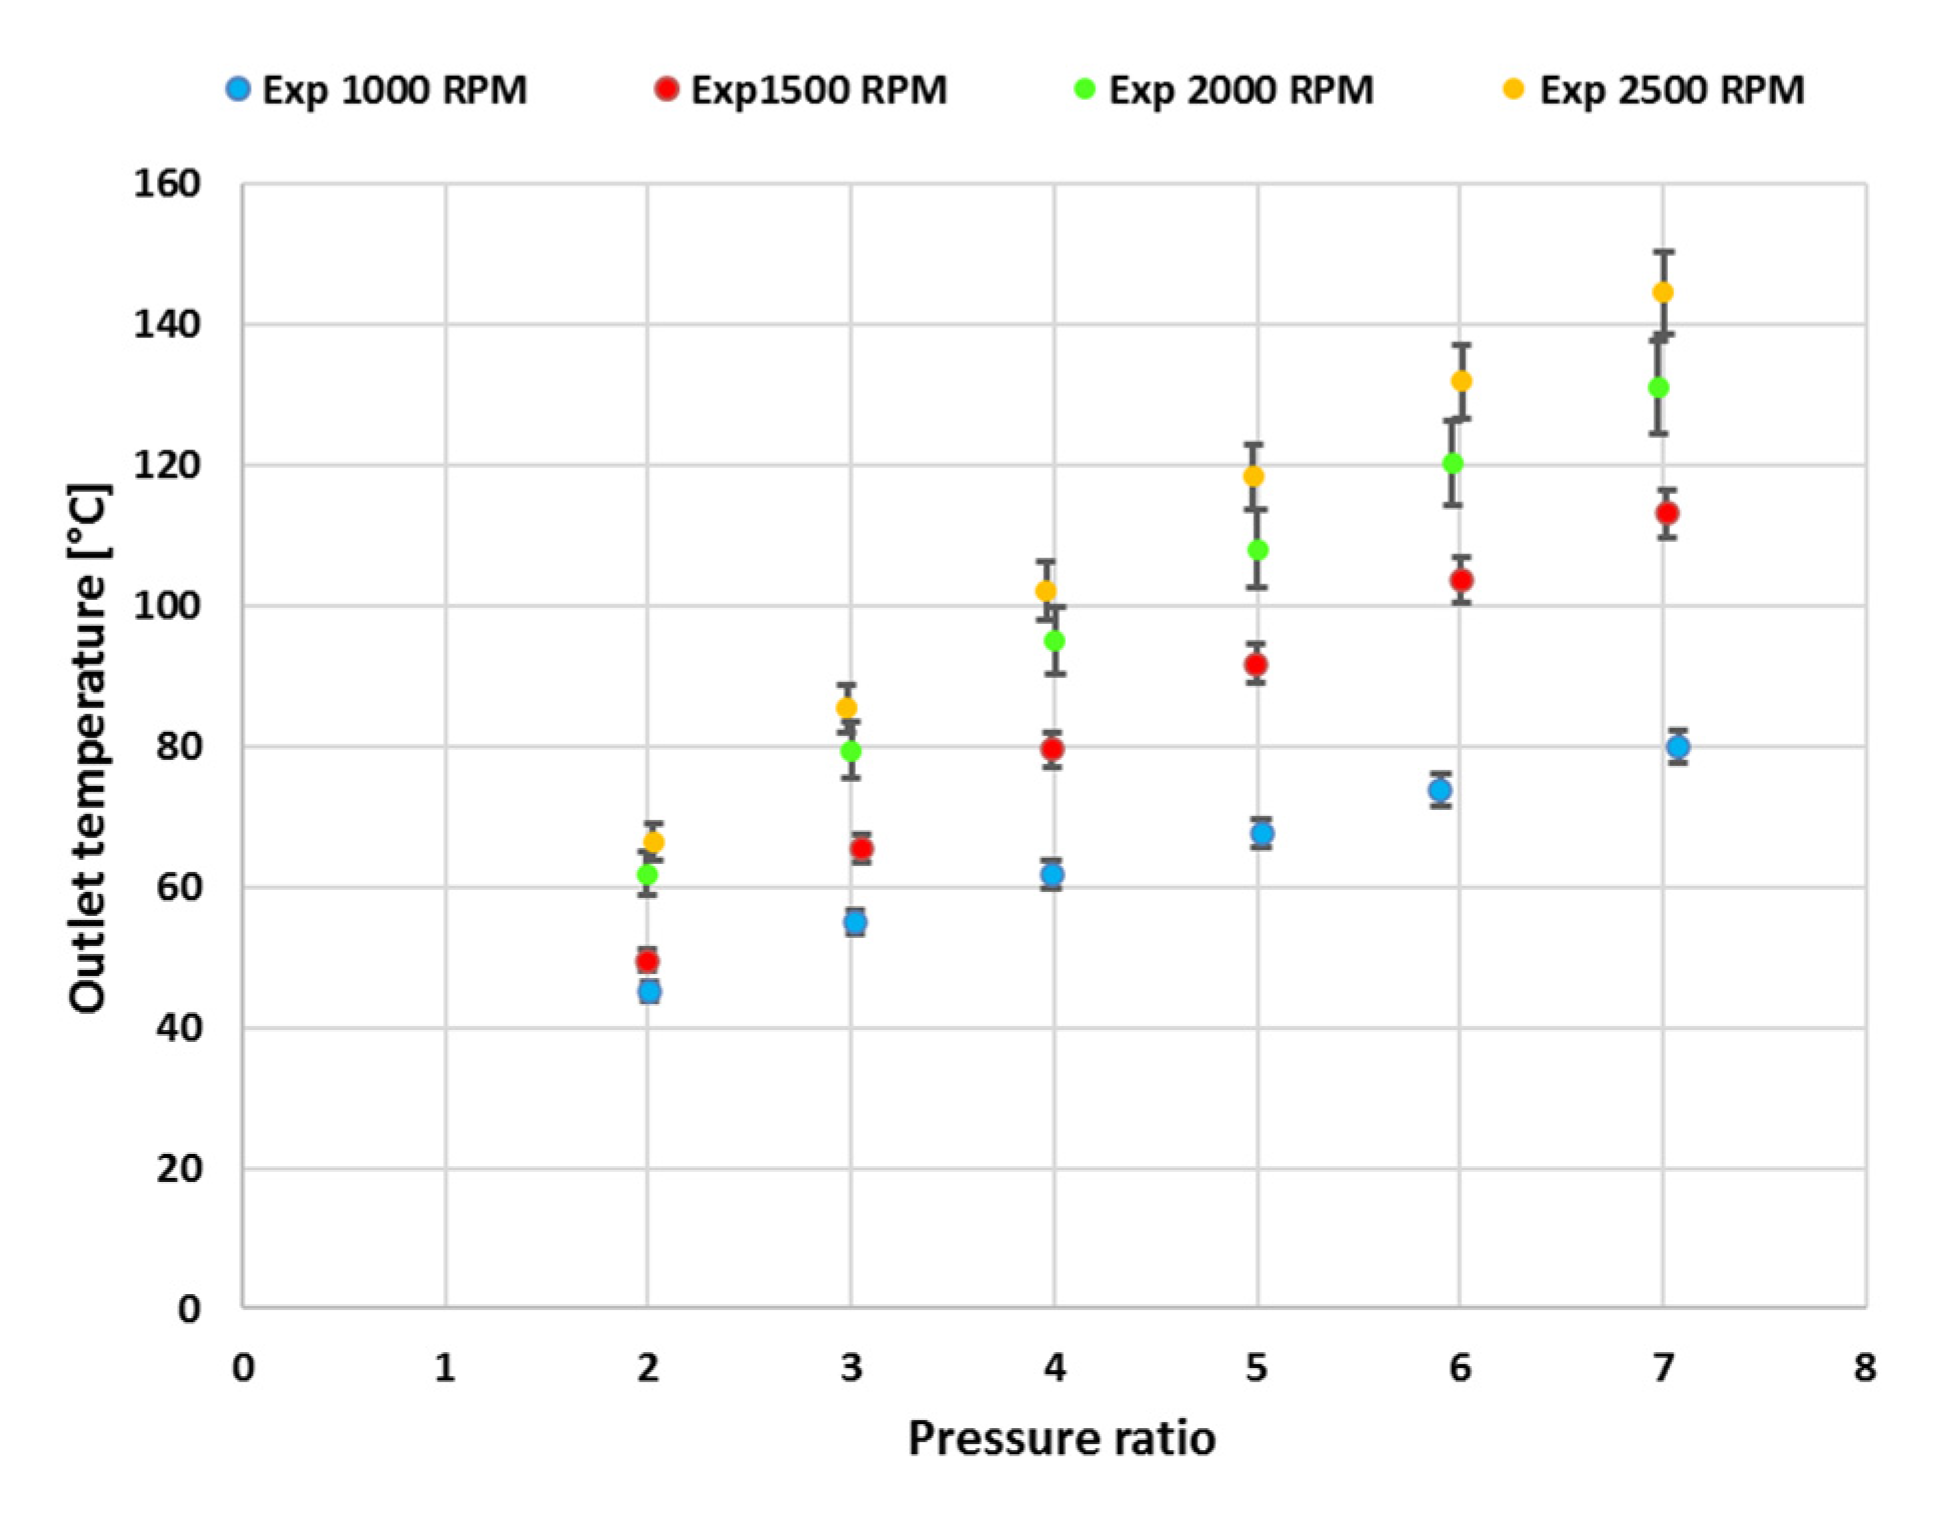
Figure 5 presents the working fluid (air) temperature versus the total pressure ratio and for various rotational speed. The experimental reproducibility is average: the higher error is below 5%. It is shown that the temperature is an increasing function of both compression ratio and rotational speed. The temperature is still increasing due to both the rising of the compressed mass flow rate and the rise of frictional losses, despite a higher rotational speed causes a higher cooling flow rate (generated by the keyed fan).
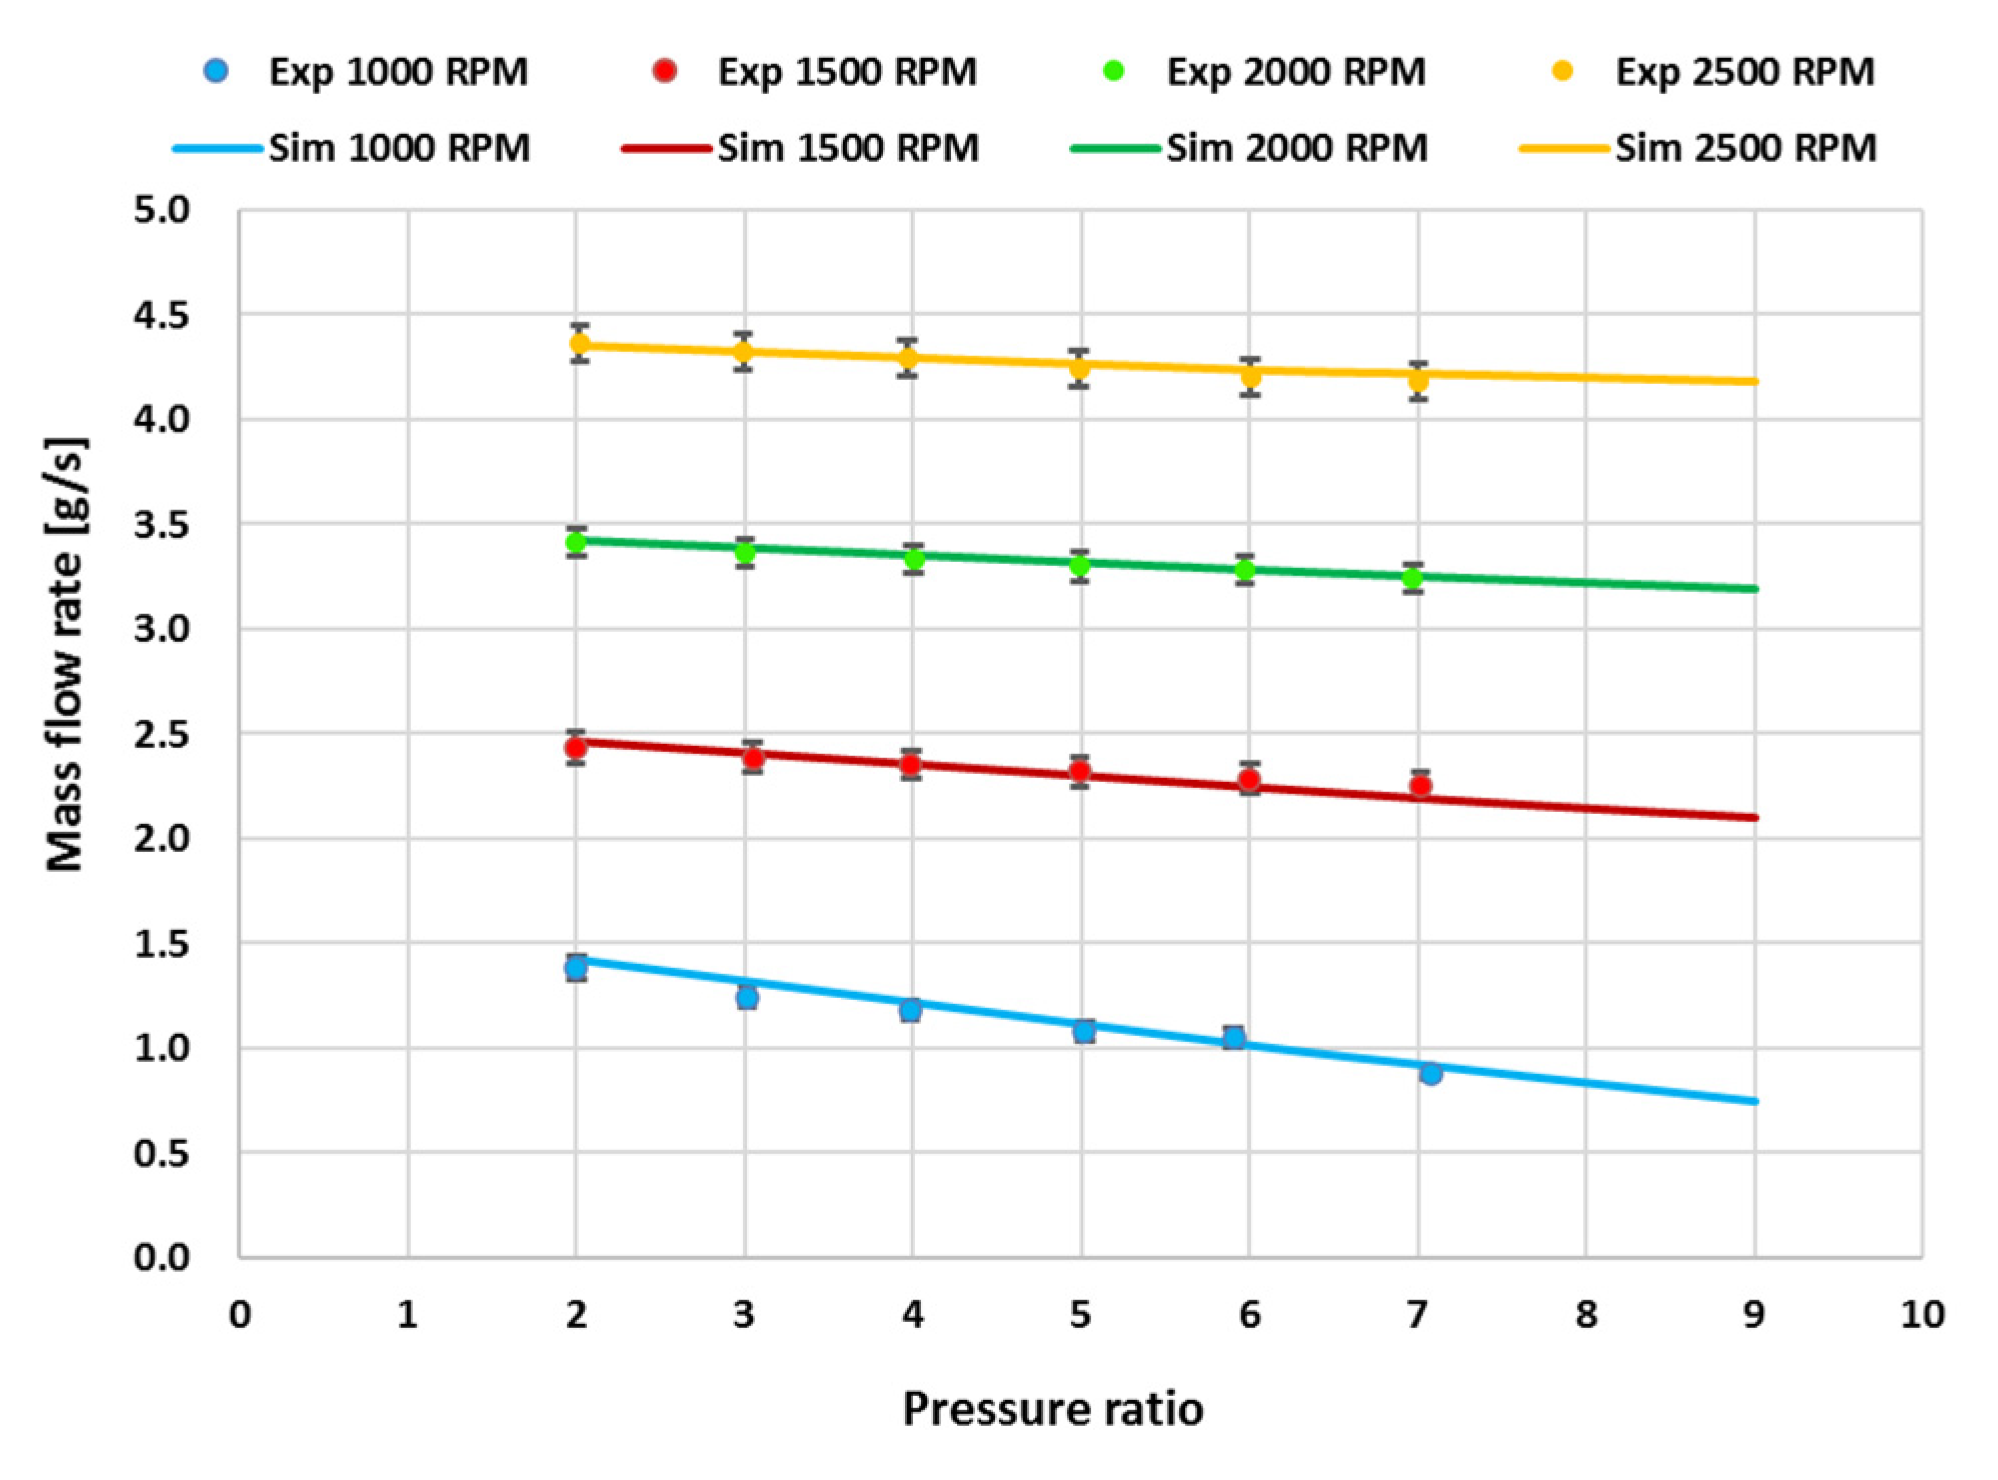
The mass flow rate and power consumption experimental data are shown together with the simulated data (the model results will be discussed in the next paragraphs): Figure 6 shows the compressor mass flow rate and Figure 7 shows the power consumption with the fan. According to Figure 6, the higher the pressure in the delivery tank, the lower the mass flow rate. This effect is heavier for low rotation speed. This tendency is caused by both the temperature effect (the whole machine temperature is higher at higher compression ratios) and the leakages (a higher-pressure gradient across the gaps leads to more air leaked). The experimental reproducibility is good: the higher error is below 3%, and the absolute errors are under 0.1 g/s.
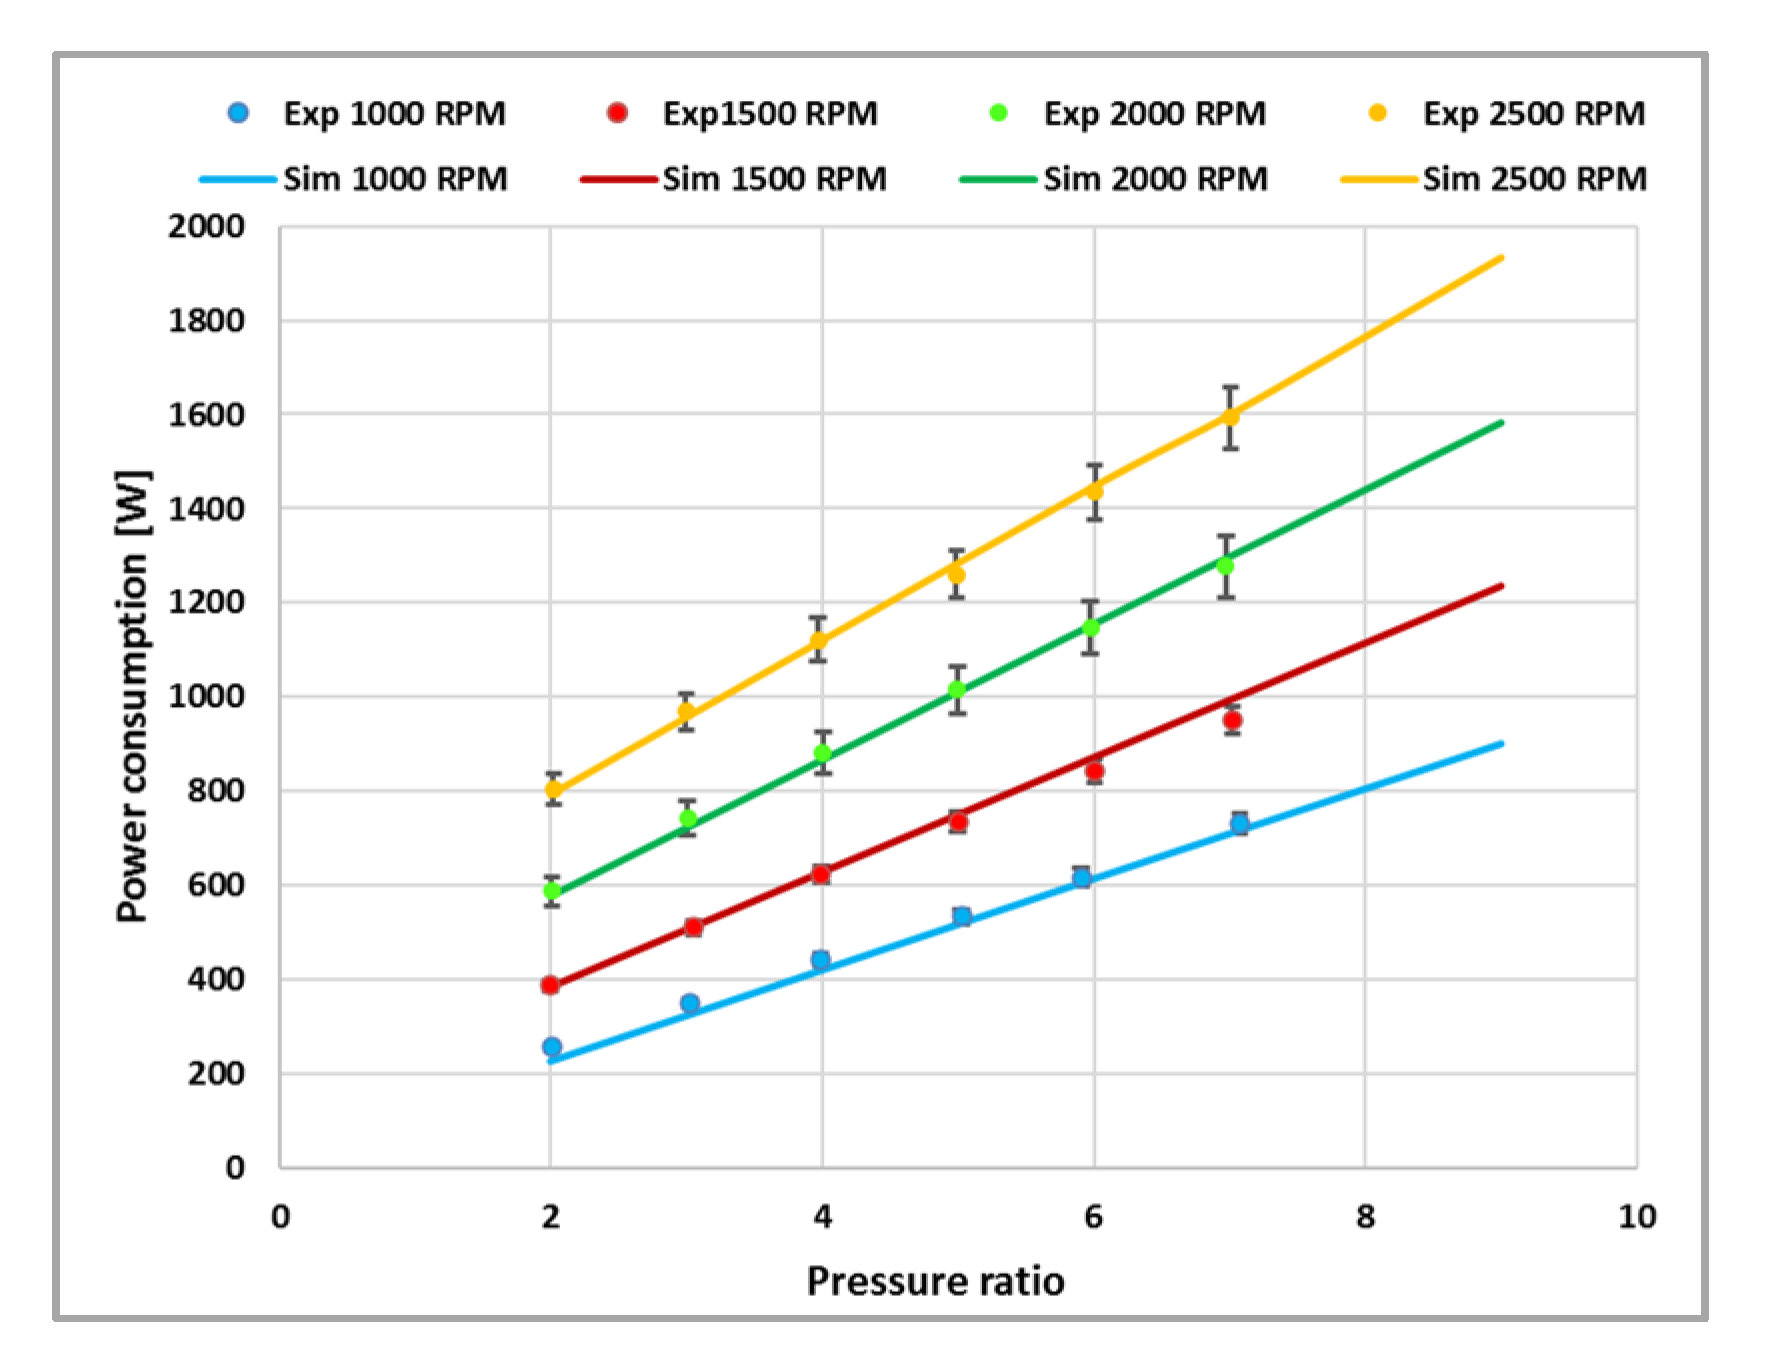
Figure 7 shows the power consumption data of compressor for all experimental tests, calculated via Equation (5), where are the measured torque and the measured rotational speed. The experimental reproducibility is average: the higher error is below 5%
Both the power and the temperature are increasing functions of both compression ratio and rotational speed.
4.2. Model Results
4.2.1. Model Calibration and Validation: Leakages
In the model, the adiabatic process simplified hypothesis is done, supposing that the fan cooling affects only the final stage of the compression process (i.e., the curve X-2 shown in Figure 1). The first step of the calibration process is to determine the leakages. In the model (see Figure 3), the flank gaps are modelled as an imperfect closing of the internal contacts (the valves V1–V3) while the radial leakages are modelled as a by-pass. The model requires the orifice area for each of them. These areas are not the physical areas of the scroll gaps, but their model representation. It is possible to determine them using the experimental data on the mass flow rate. It can be postulated that both the centrifugal force and the increasing temperature would reduce the internal clearances. Therefore, the influence of the rotor speed over the leakages must be considered.
The calibration is performed using experimental data at β = 2 and β = 6 at 1000, 2000 and 2500 RPM. All the other experimental points are used to validate the model. In particular, the β = 7 points are used to verify the model consistency outside the calibration data field, while the 1500 RPM experimental points are used to evaluate the model consistency in simulating the scroll running at another rotational speed. The calibration points temperatures are set based on the experimental data. In other cases, the temperatures are based on a linear regression of the values measured at β = 2 and β = 6. As for the 1500 RPM temperatures, they are based on a linear regression of the values determined at 1000, 2000 and 2500 RPM. Similarly, the orifice areas are estimated anew for each rotor speed. For the validation at 1500 RPM, the orifice areas are calculated based on a linear regression of the values determined at 1000, 2000 and 2500 RPM. Figure 6 shows the model compliance with the real scroll in terms of mass flow rate after the calibration process (coloured dots for the experimental data and coloured lines the calculated one).
4.2.2. Model Calibration and Validation: Mechanical Losses
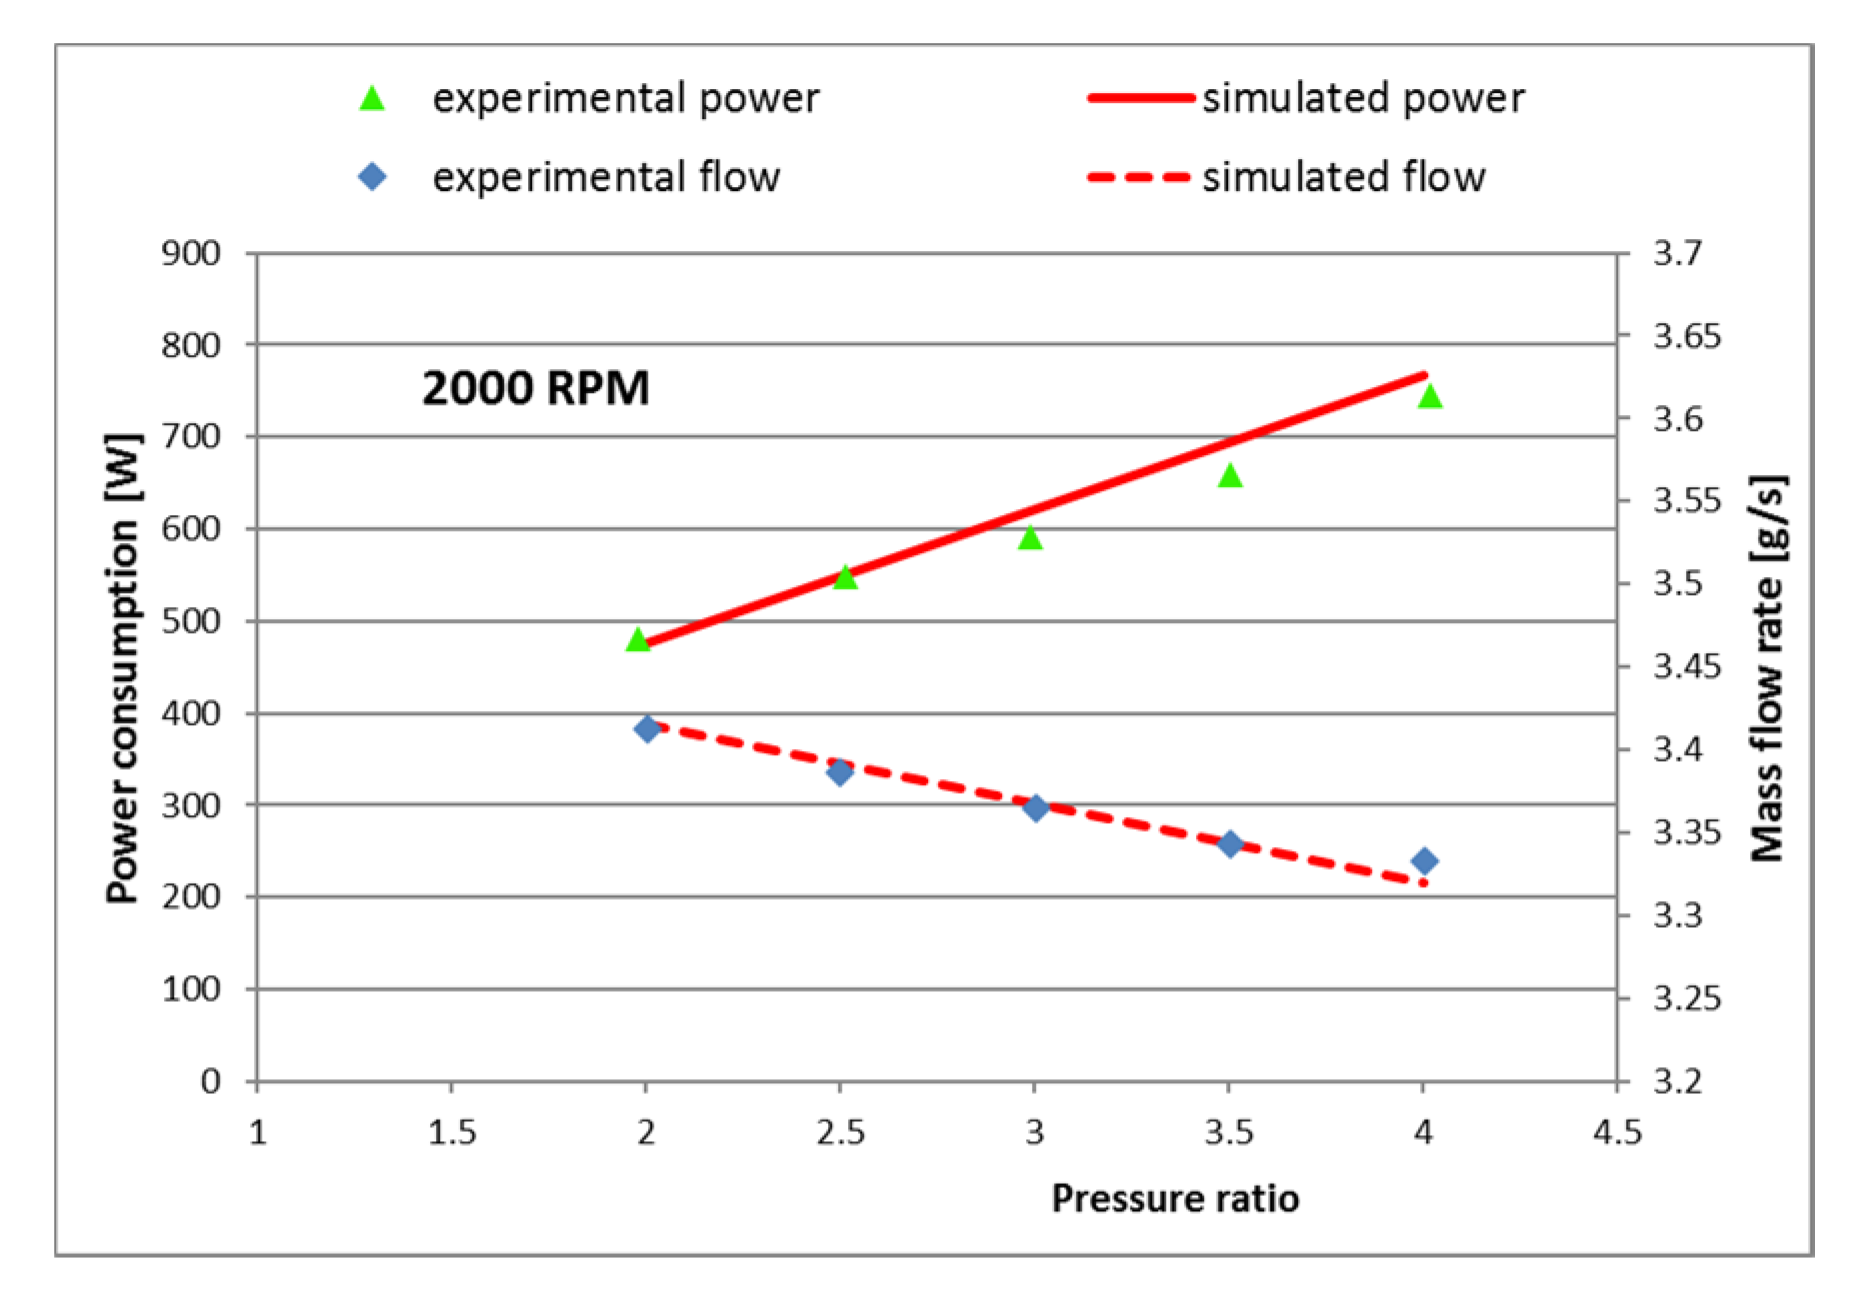
A new set of experimental runs were performed to calculate the mechanical losses (modelled by the ML block). This experimental set-up is characterised by the absence of the keyed fan. In this way, we get the difference between the experimental power consumption and the simulated one (once the KF block is suppressed, see Equation (6)).
The machine temperatures were higher than the previous case, so the higher pressure ratio tested is 4. As the thermal conditions were altered, the spirals thermal deformation is different; therefore, a new leakages calibration was needed. Figure 8 shows the accordance between the model and the new experimental set (the one without the fan) after the new calibration. It is possible to determine the value of the ML torque confronting the power consumption experimental data with the model output. The torque can be assumed as a constant independent by the rotational speed as the mechanical losses are just simple friction losses (there are no other auxiliaries nor inertial forces).
4.2.3. Model Calibration and Validation: Keyed Fan
The speed effect on the torque losses (ML) was neglected, so the mechanical loss is set to constant. As previously said, the keyed fan (KF) power consumption is modelled by a torque load function of the square of the rotational speed, so there are three parameters (A–C) to be estimated (see also Equation (2)). Once these parameters are determined, they are set as constant, independent from both the speed and the pressure ratio. As previously, the data at β = 2 and β = 6 at 1000, 2000 and 2500 RPM are used to calibrate, the others are used to validate. Figure 7 shows the comparison between the experimental power consumption (coloured dots) and the calculated one (coloured lines), after the calibration process. The figure shows the power consumption as a function of the pressure ratio and the rotational speed. In addition, the 1500 RPM and all β = 7 experimental data are well predicted by the model. The model complies with experimental data, but some deviations remain. These deviations are higher for lower rotational speed (that are further from the real compressor nominal speed and further from adiabatic behaviour).
5. Conclusions
In the first part of the paper, the key features of a scroll compressor are presented. Then a numerical model developed in Simcenter Amesim® is presented: the model includes leakages and mechanical losses. Despite that the integrated keyed cooling fan power consumption is considered, its cooling effect is neglected, and the compressor is considered adiabatic. To partially overcome this limitation, the outlet temperature is set as a boundary condition using experimentally derived values. The model was preliminary tested on ideal cases (no losses or leakages). Then, the experimental activity is presented: a series of experimental runs were performed on a commercial scroll compressor. Four levels of rotational speed (1000, 1500, 2000, 2500 RPM) and six levels of the pressure ratio (2–7) were considered. The experimental data are reproducible as the errors are under 5%. Finally, the model is calibrated on the experimental data. Six points are used to calibrate the model (at β = 2 and β = 6 at 1000, 2000 and 2500 RPM), while the other 26 are used to validate. After the proper calibration of the leakages, mechanical losses and fan power consumption, the model can follow the scroll’s real behaviour.
The model does not consider the actual scroll geometry and kinematic. This feature could be both an advantage or a limitation: it is a limitation because it is not possible to calculate any inner quantity nor instantaneous quantities (e.g., instantaneous torque); it is an advantage when the geometrical features are unknown. Moreover, the calculations last less than seven seconds. Overall, the model is not suitable as a machine design aid, but, on the other hand, it can be used as a component for a whole plant simulation.
Author Contributions
The conceptualization, methodology and experimental design have been developed by M.C.; the data acquisition, software model development and model calibration have been performed by B.G. All authors have read and agreed to the published version of the manuscript.
Funding
This research received no external funding.
Acknowledgments
The authors would like to thank Salvatore De Cristofaro for his technical assistance in laboratory activities.
Conflicts of Interest
The authors declare no conflict of interest.
Abbreviations
| cp | Isobaric specific heat capacity [kJ/kgK] |
| cv | Isochoric specific heat capacity [kJ/kgK] |
| H | Enthalpy [kJ] |
| h | Specific enthalpy [kJ/kg] |
| k | Isentropic index |
| M | Torque [Nm] |
| mc | Inlet air mass [kg] |
| mm | Mass inside discharge volume [kg] |
| p | Pressure [Pa] |
| R | Gas constant [kJ/kgK] |
| T | Temperature [K] |
| V | Volume [m3] |
| v | Specific volume [m3/kg] |
| Vc | Inlet volume [cm3] |
| Vc’ | Last closed cell volume [cm3] |
| Vm | Discharge volume [cm3] |
| W | Work [kJ] |
| w | Specific work [kJ/kg] |
| 0 | Inlet state point |
| 1 | End of internal compression state point |
| X | End of isochoric compression state point |
| 2 | End of global compression state point |
| β | Total compression ratio p2/p0 |
| βi | Internal compression ratio p1/p0 |
| βX2 | p2/pX |
| ρi | Internal volumetric compression ratio |
| ω | Rotational speed [rad/s] |
References
- Stone, C. The efficiency of Roots compressors and compressors with fixed internal compression. Proc. Instit. Mech. Eng. Part A Power Proc. Eng. 1988, 202, 199–205. [Google Scholar] [CrossRef]
- Yanagisawa, T.; Cheng, M.D.; Fukuta, M.; Shimizu, T. Optimum operating pressure ratio for scroll compressors. In Proceedings of the International Compressor Engineering Conference, Purdue, IN, USA, 17–20 July 1990. [Google Scholar]
- Ishii, N.; Sakai, M.; Sano, K.; Yamamoto, S.; Otokura, T. A fundamental optimum design for high mechanical and volumetric efficiency of compact scroll compressors. In Proceedings of the International Compressor Engineering Conference, Purdue, IN, USA, 23–26 July 1996; p. 1176. [Google Scholar]
- Lee, Y.R.; Wu, W.F. On the profile design of a scroll compressor. Int. J. Refrig. 1995, 18, 308–317. [Google Scholar] [CrossRef]
- Xudong, W.; Yunho, H.; Reinhard, R. Investigation of potential benefits of compressor cooling. Appl. Therm. Eng. 2008, 28, 1791–1797. [Google Scholar]
- Shuaihui, S.; YuanYang, Z.; Pengcheng, S. Simulation research on scroll refrigeration compressor with external cooling. Int. J. Refrig. 2010, 33, 897–906. [Google Scholar]
- Yang, S.C.; Hung, T.C.; Feng, Y.Q.; Wu, C.J.; Wong, K.W.; Huang, K.C. Experimental investigation on a 3 kW organic Rankine cycle for low-grade waste heat under different operation parameters. Appl. Therm. Eng. 2017, 113, 756–764. [Google Scholar] [CrossRef]
- Mendoza, L.C.; Sylvain, L.; Jürg, S. Testing and modelling of a novel oil-free co-rotating scroll machine with water injection. Appl. Energy 2017, 185, 201–213. [Google Scholar] [CrossRef]
- Tello-Oquendo, F.M.; Navarro-Peris, E.; Gonzálvez-Maciá, J. New characterization methodology for vapor-injection scroll compressors. Int. J. Refrig. 2017, 74, 526–537. [Google Scholar] [CrossRef] [Green Version]
- Zhang, X.; Xu, Y.; Xu, J.; Sheng, Y.; Zuo, Z.; Liu, J.; Chen, H.; Wang, Y.; Huang, Y. Study on the performance and optimization of a scroll expander driven by compressed air. Appl. Energy 2017, 186, 347–358. [Google Scholar] [CrossRef]
- Cho, I.; Yong, S.; Bin, K.; Yongchan, K. Optimization of injection holes in symmetric and asymmetric scroll compressors with vapor injection. Int. J. Refrig. 2012, 35.4, 850–860. [Google Scholar] [CrossRef]
- Lemort, V.; Sylvain, Q.; Jean, L. Numerical simulation of a scroll expander for use in a Rankine Cycle. In Proceedings of the International Compressor Engineering Conference, Purdue, IN, USA, 14–17 July 2008. [Google Scholar]
- Chen, Y.; Halm, N.P.; Groll, E.A.; Braun, J.E. Mathematical modeling of scroll compressors—Part I: Compression process modelling. Int. J. Refrig. 2002, 25, 731–750. [Google Scholar] [CrossRef]
- Blunier, B.; Cirrincione, G.; Herve, Y.; Miraoui, A. A new analytical and dynamical model of a scroll compressor with experimental validation. Int. J. Refrig. 2009, 32, 874–891. [Google Scholar] [CrossRef]
- Sung, J.P.; Joon, H.B.; Eui, G.J. Transient thermodynamic modeling of a scroll compressor using R22 refrigerant. Energies 2020, 13, 3911. [Google Scholar] [CrossRef]
- Winandy, E.L.; Lebrun, J. Scroll compressors using gas and liquid injection: Experimental analysis and modelling. Int. J. Refrig. 2002, 25, 1143–1156. [Google Scholar] [CrossRef]
- Dardenne, L.; Fraccari, E.; Maggioni, A.; Molinaroli, L.; Proserpio, L.; Winandy, E. Semi-empirical modelling of a variable speed scroll compressor with vapour injection. Int. J. Refrig. 2015, 54, 76–87. [Google Scholar] [CrossRef]
- Winandy, E.; Saavedra, C.; Lebrun, J. Experimental analysis and simplified modelling of a hermetic scroll refrigeration compressor. Appl. Therm. Eng. 2002, 22, 107–120. [Google Scholar] [CrossRef]
- Ziviani, D.; Suman, A.; Lecompte, S.; De Paepe, M.; van de Broek, M.; Spina, P.R.; Pinelli, M.; Venturini, M.; Beyene, A. Comparison of a single-screw and a scroll expander under part-load conditions for low-grade heat recovery ORC systems. Energy Proc. 2014, 61, 117–120. [Google Scholar] [CrossRef] [Green Version]
- Bracco, R.; Clemente, S.; Micheli, D.; Reini, M. Experimental tests and modelization of a domestic-scale ORC (Organic Rankine Cycle). Energy 2013, 58, 107–116. [Google Scholar] [CrossRef]
- Bell, I.H.; Ziviani, D.; Lemort, V.; Bradshaw, C.R.; Mathison, M.; Horton, W.T.; Braun, J.E.; Groll, E.A. PDSim: A general quasi-steady modeling approach for positive displacement compressors and expanders. Int. J. Refrig. 2020, 110, 310–322. [Google Scholar] [CrossRef]
- Tanveer, M.M.; Bradshaw, C.R. Quantitative and qualitative evaluation of various positive-displacement compressor modeling platforms. Int. J. Refrig. 2020, 119, 48–63. [Google Scholar] [CrossRef]
- Rak, J.; Pietrowicz, S. Internal flow field and heat transfer investigation inside the working chamber of a scroll compressor. Energy 2020, 202, 117700. [Google Scholar] [CrossRef]
- Abagnale, C.; Cardone, M.; Gargiulo, B.; Marialto, R. Ideal specific work of rotary compressors: A new approach. Energy Procedia 2016, 101, 710–717. [Google Scholar] [CrossRef]
- Szente, V.; Vad, J. A semi-empirical model for characterisation of flow coefficient for pneumatic solenoid valves. Period. Polytech. Mech. Eng. 2003, 47, 131–142. [Google Scholar]
- Perry, J.A. Critical flow through sharp-edged orifices. Trans. ASME 1949, 71. [Google Scholar]
Figure 1.
(a) Scroll functioning scheme; (b) rotary compressors’ diagram.

Figure 2.
Model code in Amesim environment.

Figure 3.
Comparison between theory and the proposed model.

Figure 4.
(a) Test bench; (b) test bench scheme.

Figure 5.
Experimental data: outlet temperature.

Figure 6.
Model validation: mass flow rate.

Figure 7.
Complete model validation: power consumption.

Figure 8.
Comparison of mass flow rates and power consumption between the model and the real compressor without the keyed fan.
Figure 8.
Comparison of mass flow rates and power consumption between the model and the real compressor without the keyed fan.


Table 1.
Test bench elements.
| Symbol | Element | Details | Accuracy |
|---|---|---|---|
| EM | Electric engine | ||
| C | Compressor | 2.1 kW scroll compressor | |
| TB | Transmission belt | Trapezoidal transmission belt. Transmission ratio = 1:1 | |
| p | Pressure sensor | Piezo-resistive sensor | ±4% |
| Tq | Torque sensor | Strain-gauge force sensor applied to the electric engine’s known length arm | ±0.011 Nm |
| RPM | Encoder | 500 pulse per round | |
| RV | Regulation valve | ||
| T | Temperature sensor | K-type thermocouple | ±1.5 K |
| V | Volumetric flow rate sensor | Turbine flow meter | ±3% |
| KF | Keyed fan | Centrifugal cooling fan | |
| TANK | Dumping tank |
Publisher’s Note: MDPI stays neutral with regard to jurisdictional claims in published maps and institutional affiliations. |
© 2020 by the authors. Licensee MDPI, Basel, Switzerland. This article is an open access article distributed under the terms and conditions of the Creative Commons Attribution (CC BY) license (http://creativecommons.org/licenses/by/4.0/).
Share and Cite
MDPI and ACS Style
Cardone, M.; Gargiulo, B. Numerical Simulation and Experimental Validation of an Oil Free Scroll Compressor. Energies 2020, 13, 5863. https://doi.org/10.3390/en13225863
AMA Style
Cardone M, Gargiulo B. Numerical Simulation and Experimental Validation of an Oil Free Scroll Compressor. Energies. 2020; 13(22):5863. https://doi.org/10.3390/en13225863
Chicago/Turabian StyleCardone, Massimo, and Bonaventura Gargiulo. 2020. "Numerical Simulation and Experimental Validation of an Oil Free Scroll Compressor" Energies 13, no. 22: 5863. https://doi.org/10.3390/en13225863
Note that from the first issue of 2016, this journal uses article numbers instead of page numbers. See further details here.