1. Introduction
This paper provides a detailed study of the fire suppression mechanisms and suppressants that are suitable for liquid pool fires. The aim of this paper is to present the fundamentals of fire suppressants used in the case of fire. There are a number of agents that have been used for fire suppression such as aqueous film forming foams (AFFF) and water mist suppression. Efficient suppressing agents and techniques in practical life are still questionable. In the past, a number of causalities took place, which not only took the life of innocents but also caused a tremendous amount of loss.
In recent years, there have been a rapid development in the production of agents and implementation of techniques to prevent fire hazards [
1]. There have been many advancements in avoiding dangerous accidents leading to such developments, hoping that there will be small casualties in the future. The present work aims to design such a model for the prediction of the elements mentioned above and to present a detailed knowledge of how to accomplish these tasks by the use of computational power. The nature of the fire may differ from one another, but all of them follow the same path, i.e., growth, steady state, and decay. In this study, the only difference is that the decay phase has to be forcefully started by means of suppression, while other fires, which do not involve suppression, may decay due to incomplete combustion or unavailability of fuel or oxygen.
Fire safety researchers have been interested in a number of techniques, which involve the use of numerical methods and experimental studies on different scales. G. Daviller et al. [
2] demonstrated a new sensor and approach to effectively produce the desired local mesh refinement to match the target losses, which are measured experimentally. Utyuzhnikov et al. [
3] numerically simulated the combustion of fuel droplet vapor releases in the atmosphere and there are a number of studies that have been performed, especially on the use of LES methodology [
4,
5,
6]. Jenft et al. [
7] experimented with a pool fire using water mist in comparison to a nozzle spray and droplet per second. Zhu et al. [
8] performed an experimental and numerical study on the attenuation of thermal radiation from pool fires by water mist. Jaiho lee [
9] conducted a numerical investigation on the quick fire suppression by the use of a water mist nozzle in a fire compartment. Hamins et al. [
10] experimented on the material handling of a rack-storage goods fire by water suppression for the adjustment of the computation fluid dynamics (CFD) fire model. Kim et al. [
11] experimented on the application of the water mist behavior during a fire in an enclosure. Ferng et al. [
12] conducted a numerical investigation of the fire suppression mechanisms of various droplet sizes for the water mist through the FDS code. Beji et al. [
13] presented a detailed sensitivity analysis on the volume flux probability density function to represent water spray patterns with computational fluid dynamics (CFD).
Ren et al. [
14] validated the rack-storage fire growth and suppression by use of the fire FOAM, they also included the two fire experiments and two fire suppression configurations with different rack-storage arrays. Naito et al. [
15] studied the droplet effect on the fire suppression of a diffusion flame stabilized in the forward stagnation region, the distribution of the water droplet size was measured by a phase doppler particle analyzer (PDPA), which was found to be nearly normal, with the number of mean diameter ranging typically from 15 to 25 µm and the Sauter mean diameter from 25 to 30 µm. Grant et al. [
16] established the state-of-the-art use of water sprays for the suppression and extinguishment of typical compartment fires. Chow et al. [
17] studied the utilization
n of the field modelling technique by its interaction between the fire induced convective air flow and water spray sprinkler. James et al. [
18] measured the suppression effects of a canonical experimental configuration with a buoyant, turbulent methane fueled diffusion flame to a co-flowing oxidizer laden with a fine water mist (Sauter mean diameter of 6.6 µm). Zhou et al. [
19] studied the collaboration between the water spray and the fire plume.
To provide appropriate data for the establishment and evaluation of LES fire safety models, such as the fire FOAM, a series of small-scale experiments were conducted to investigate the interaction of hot air plumes and water sprays by means of combined gas-liquid speed and droplet size measurements. Brian et al. [
20] developed a small-scale test apparatus to measure the foam loss mechanisms (i.e., solution evaporated and drained), as well as the time to fuel ignition.
Several earlier researches on pool fire radiation have extracted curve fits of experimental data to produce two- and three-dimensional average spatial distributions of temperature, soot, and species [
21,
22,
23,
24]. However, this concept has a lot of meaning in many ways, which can vary according to the application. Some of the pool fires may differ from others according to the physical and chemical behaviour of the fuel and its products towards surroundings.
In late 2019, one of the research works was based on the utilization of CO
2 liquid with water as an additive. Dong et al. [
25] studied the gasoline fire extinguishing by water mist with multicomponent additives driven by CO
2. In this study, both of the suppressing agents were in a liquid form. The fire extinguishing time was measured to evaluate the extinguishing efficiency of different additives.
To the best of our knowledge, previous work focused on the experiment and numerical simulation of fire suppression by water mist or the additives that are in liquid form, but the numerical simulation by other suppressing agents were not considered [
26]. Most of the research work was mainly focused only on the experimental work of fire suppression by liquid, gas, or bubble based as AFFF solutions. All of these suppressing agents have their unique kind of suppressing mechanism. Therefore, in this research work, we focused on the comparison of numerical simulation of a large-scale n-heptane radiative fire suppression by water (also known as droplets) and its mixture with carbon dioxide. This work is intended to explore the possibilities of utilizing different suppressing agents along with water not only by means of their initial chemical formation [
25], but also by physical effects.
3. Results and Discussion
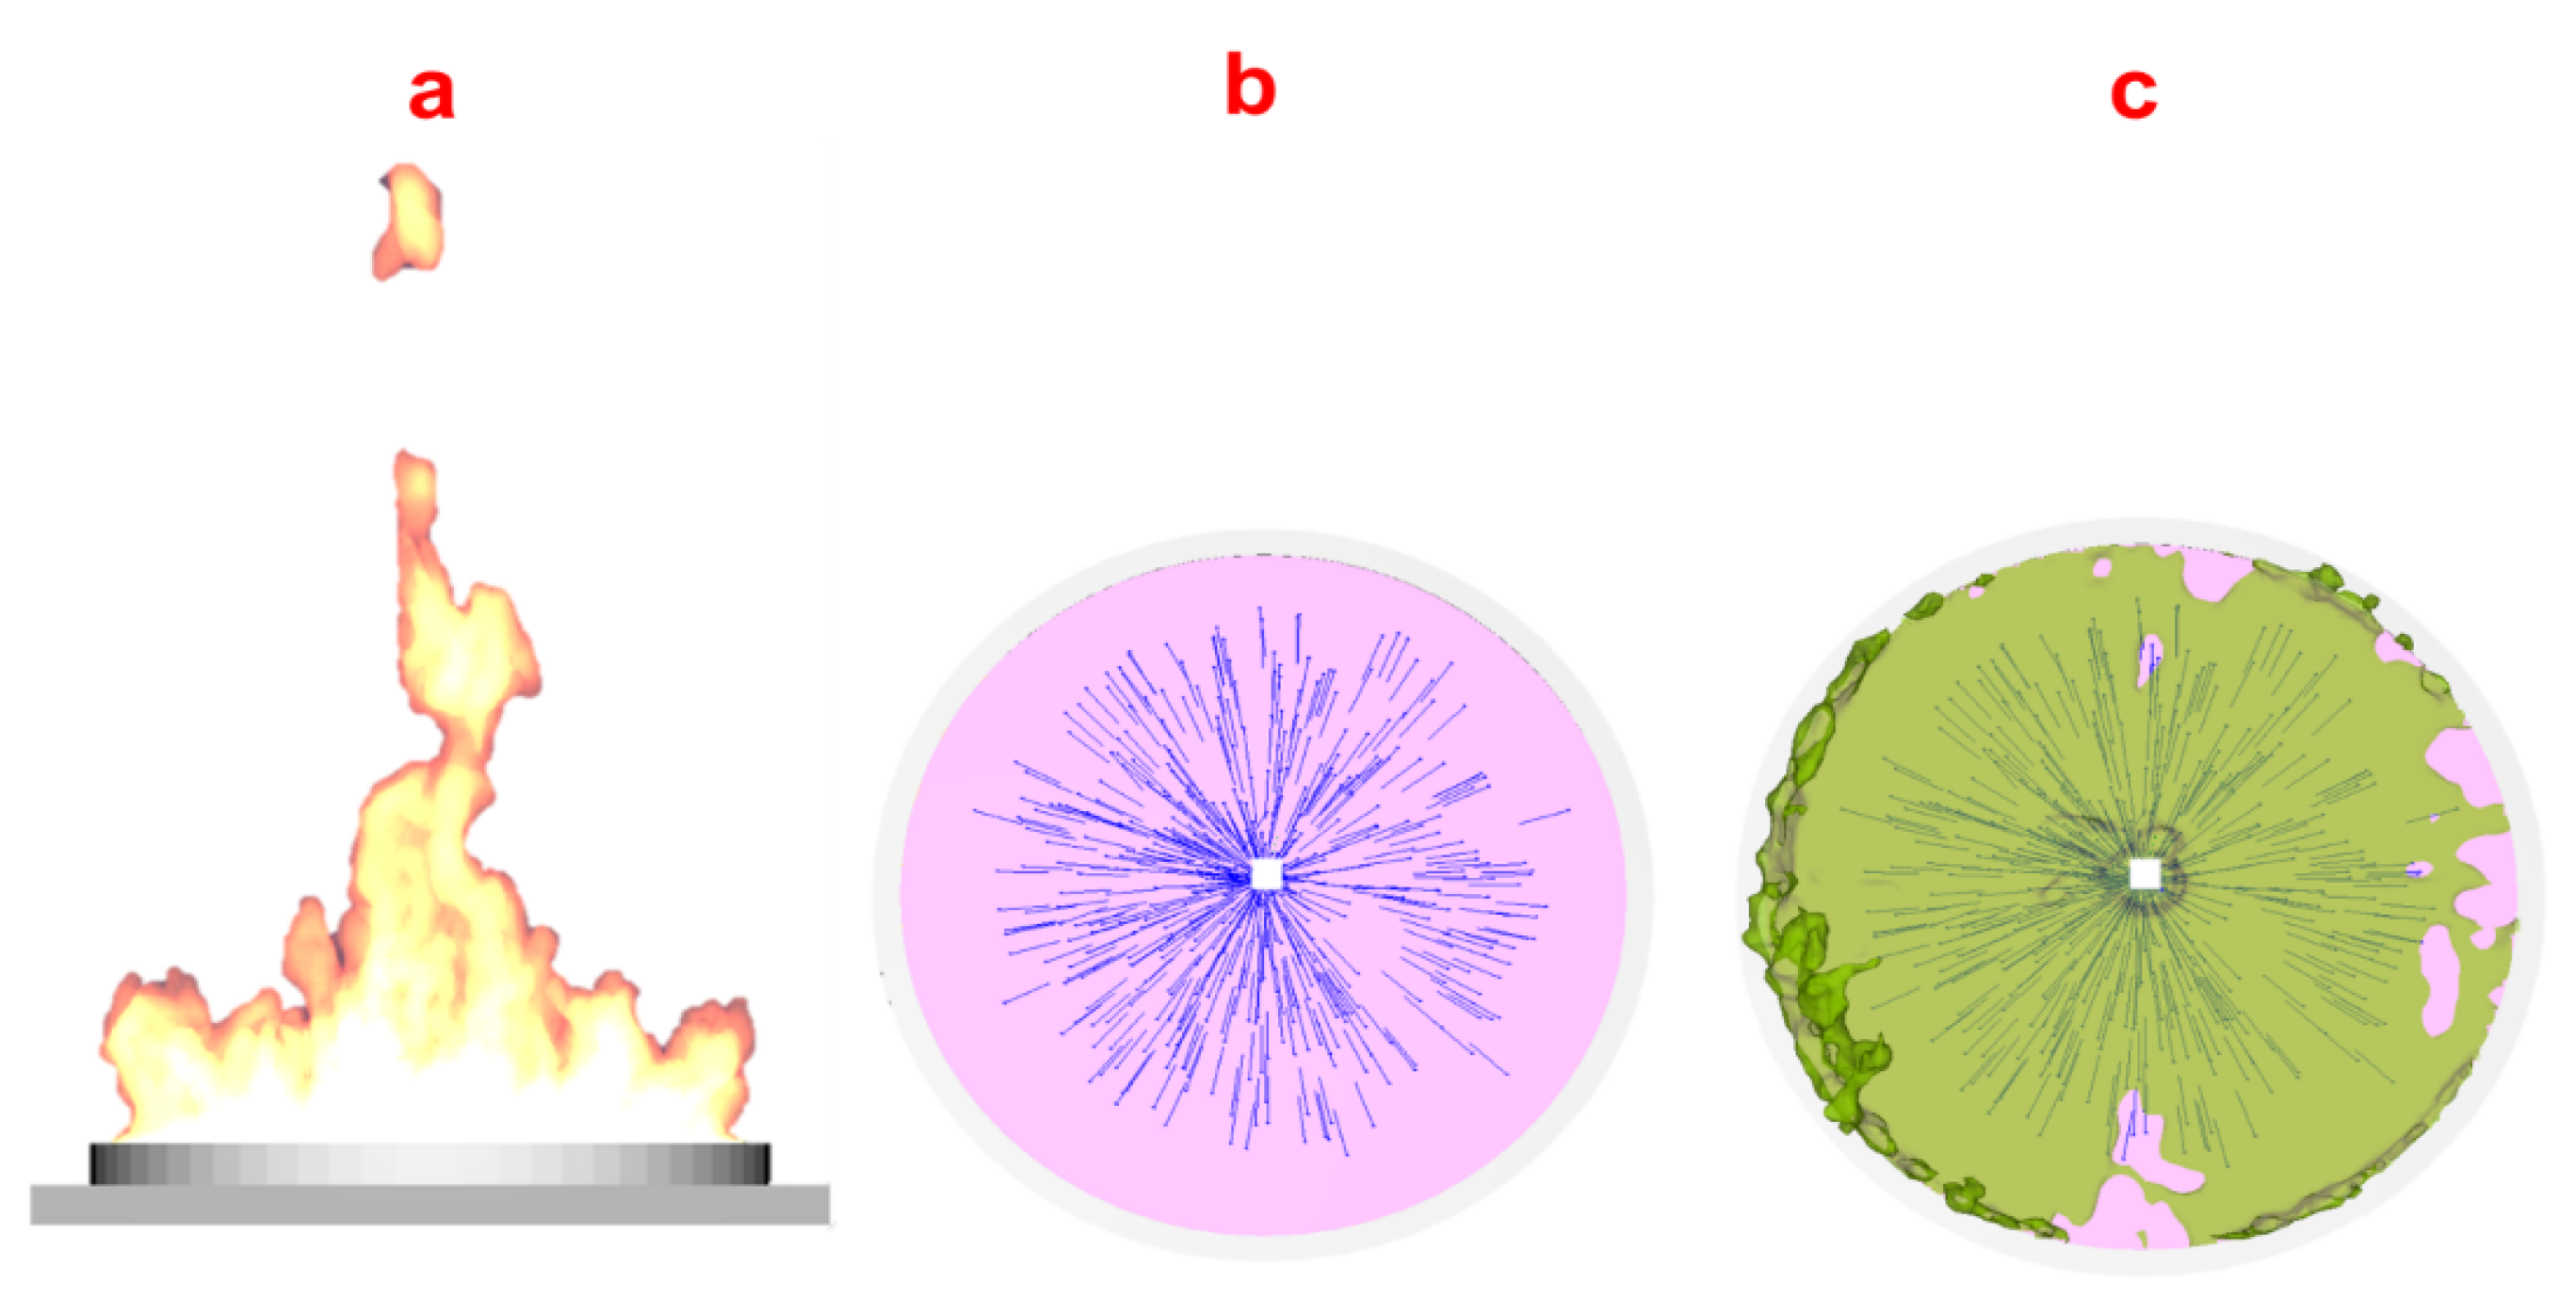
Figure 2 shows (a) the n-heptane pool fire burner geometry and the flow mechanism of suppressing agents (b,c) over the fuel surface, which were obtained from the results of the smoke view. The process of simulation starts with the grid sensitivity analysis. This analysis is used for the dimensions of domain, the bodies present inside it, and the size of each cell in x, y, and z axis. Physical quantities related to the heat transfer were also obtained from the results of the simulations and smoke view.
3.1. Mesh Sensitivity Analysis
For the three-dimensional grid, these parameters are based on the approximation which involves evenly spacing. As discussed above in the introduction, in some special cases where the geometries are of a complex nature, the multiple passing interface (MPI) can also be used for the parallel processing of multiple meshes. In these interfaces, the center of each grid cell is assigned scalar quantities such as the velocity components at the appropriate cell faces and the vorticity components at the edges of the cells. This is what is commonly referred to as a staggered grid [
12,
13].
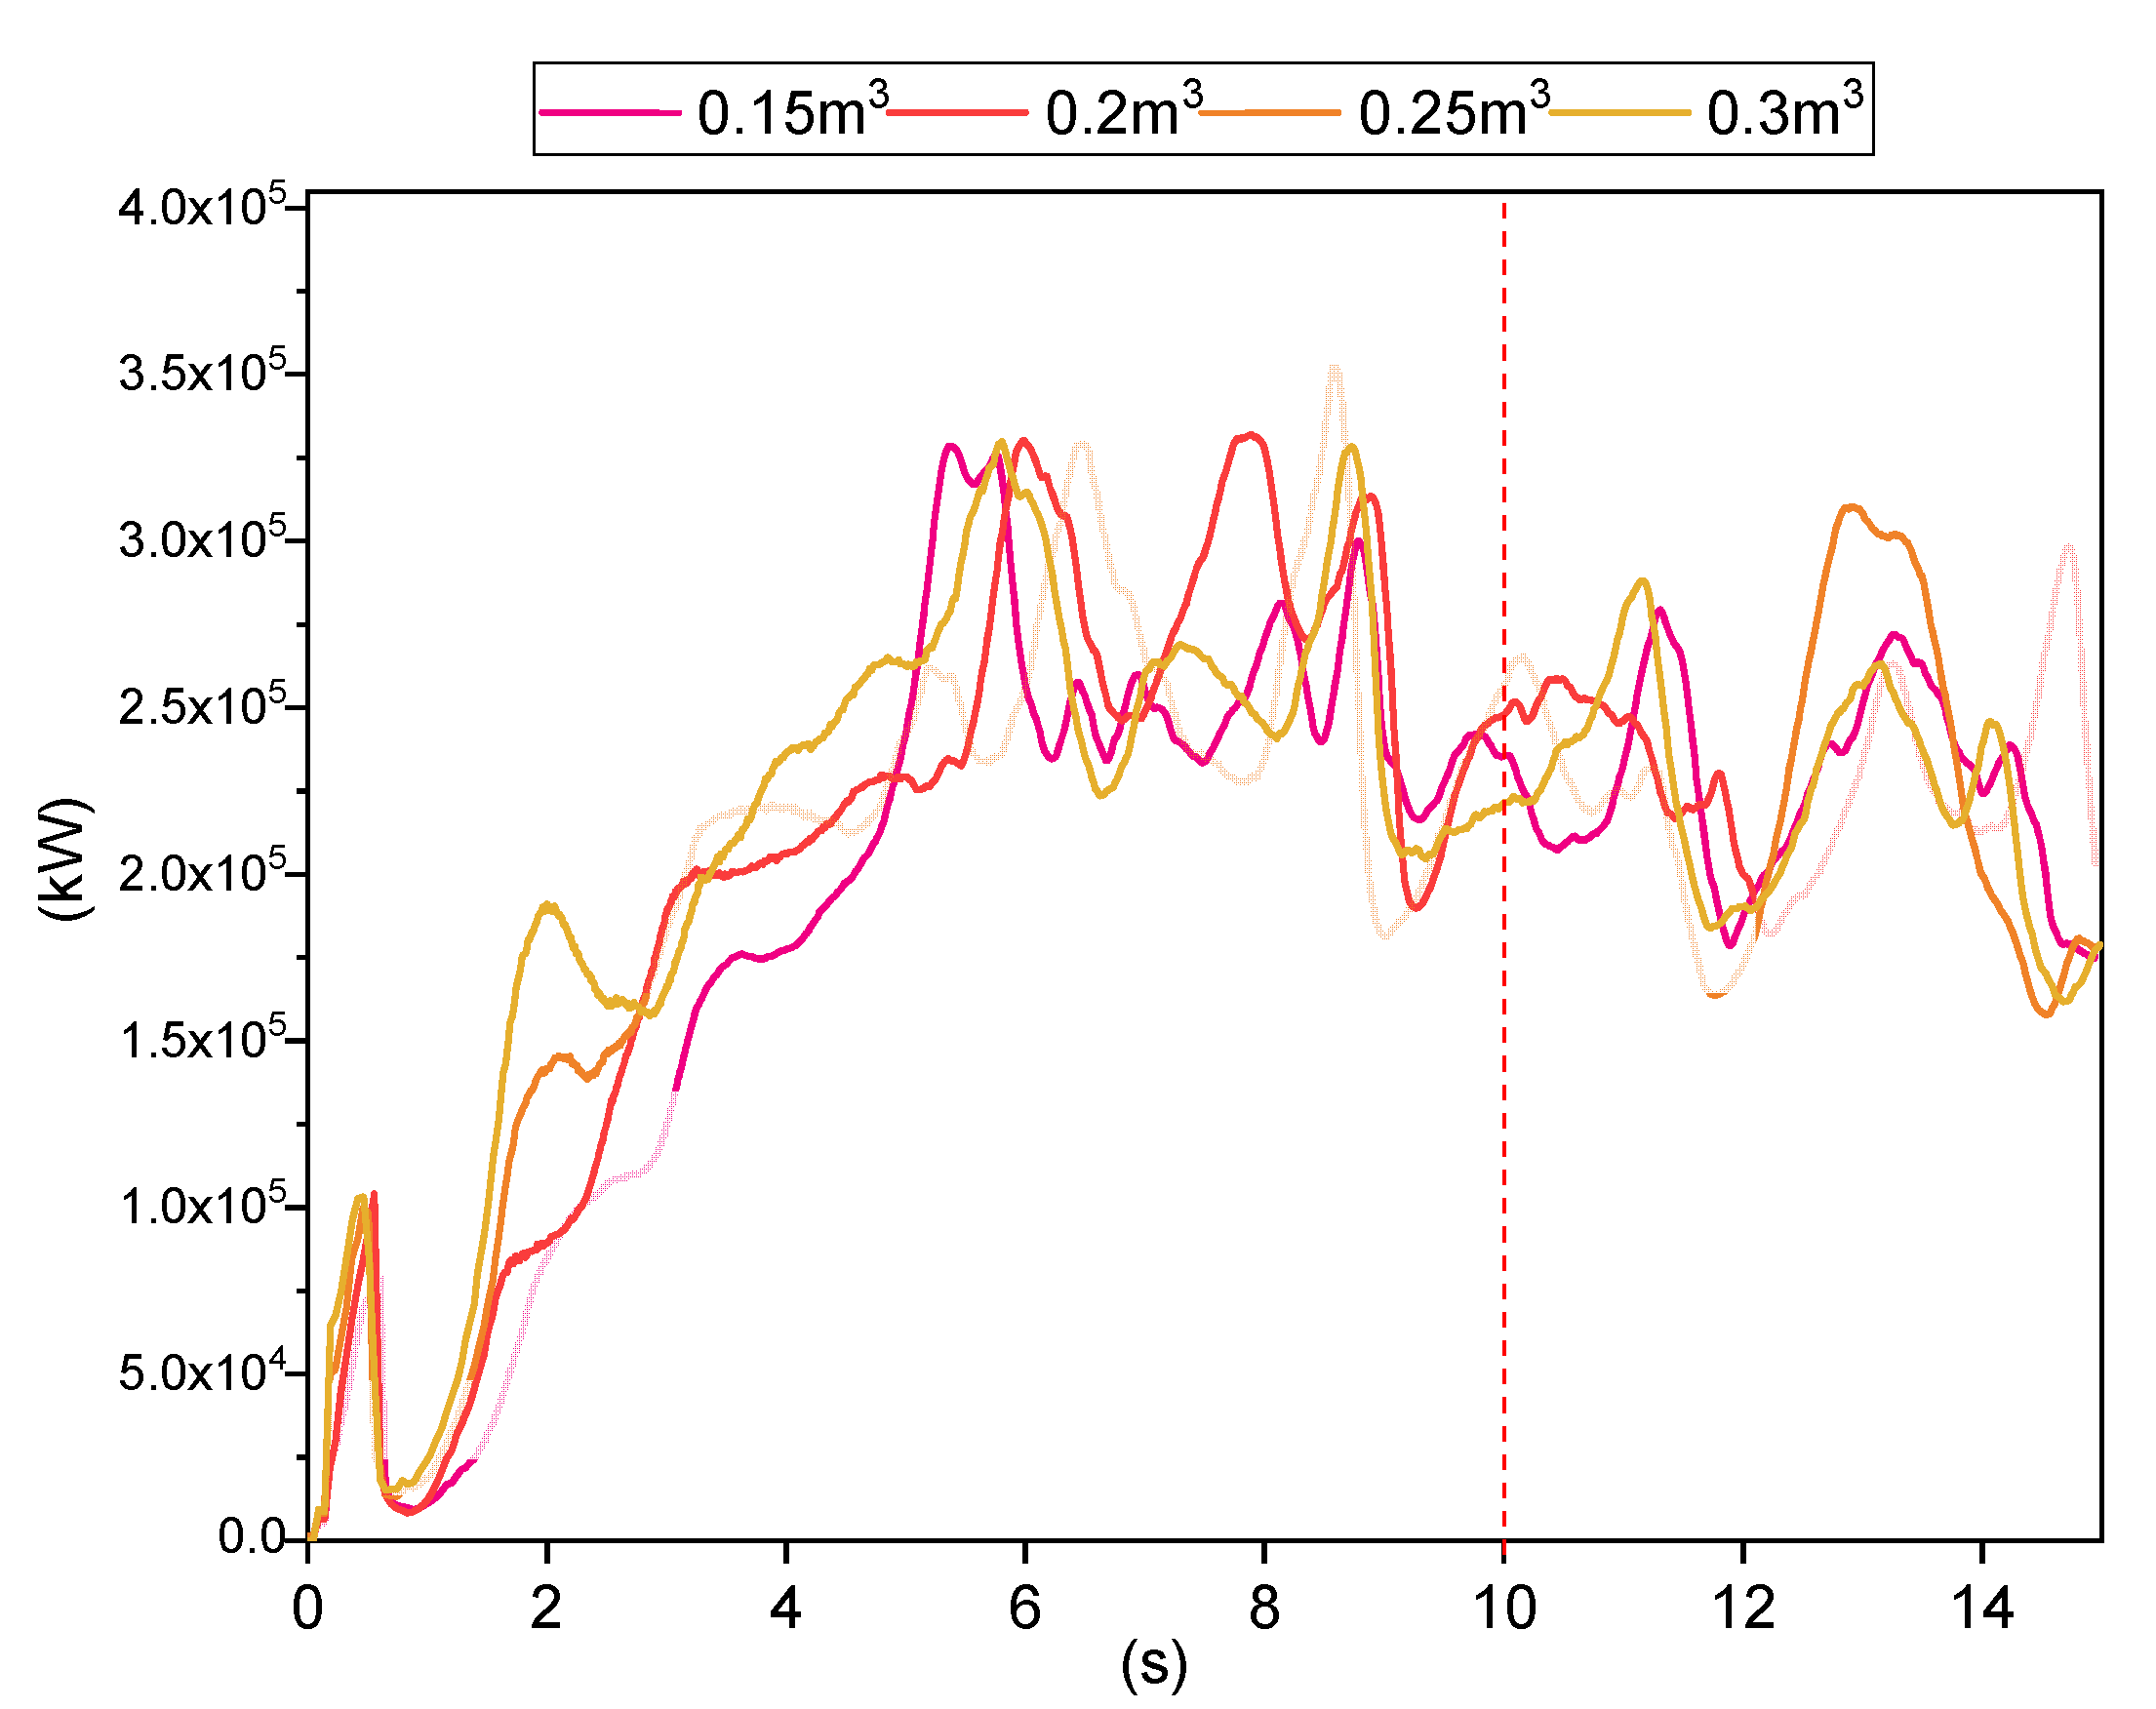
The grid sensitivity is performed by changing the cell size. It is quite common during the initial stage of the simulations; the cell size is coarse and then decreases gradually, which is also recommended by the FDS community. The cell size should be decreased until there is no major change in the physical values, such as temperature, heat release rate, and radiation. This is the reason why in this mesh sensitivity analysis, the cell size at the initial stage was 0.5 m
3 and later on it was decreased with a difference of 0.05 m
3. It was found that from the cell size of 0.3 m
3, there was a minute difference in the physical values, as shown in
Figure 3.
The mesh sensitivity based on the cell size can also be decreased depending on the user or at a point where the results are non-variable. However, this process of decreasing the cell size into an overly sensitive setting could also lead to the high computational time. Not only this, but it could result in a number of non-uniform outputs. During this process, the start time of the nozzle was set to 10 s, which is illustrated with the red dotted line shown in
Figure 3.
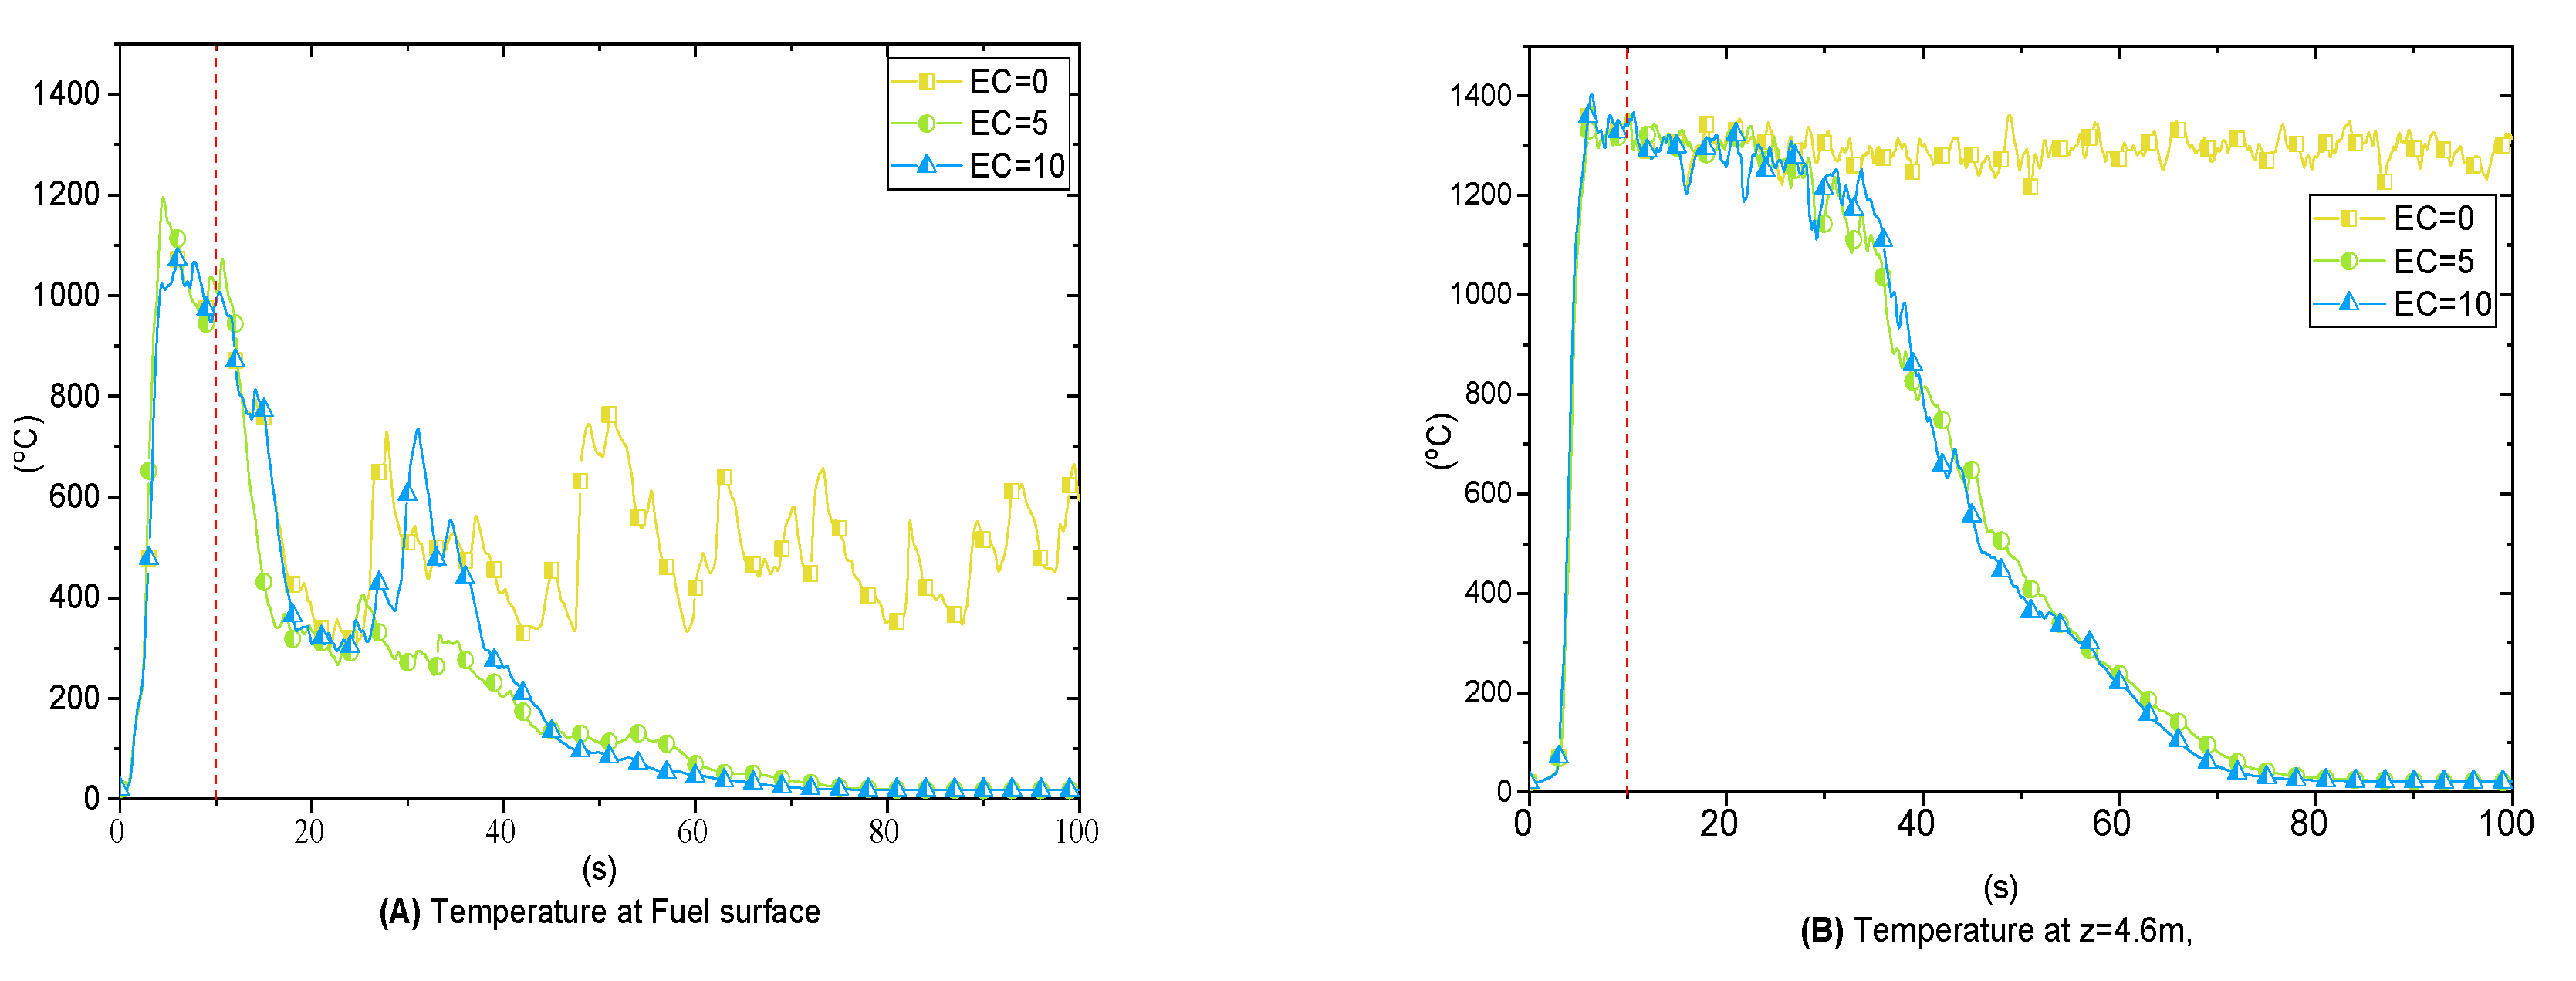
3.2. Flame Extinction
The flame extinction during the fire suppression by water droplets can also be varied with another important parameter, which is the extinction coefficient. The coefficient was first implemented by Yu et al., which was further modified by Hammins and McGrattan for its application in FDS. For the purpose of its application, this parameter is also used for contrasting the experimental time with the simulations. In our study, we only focused on some of the initial values from 0 to 10 for the purpose of obtaining the difference of its use inside the system. To simplify this process, extinction 1 was utilized as this mode contains user and time friendly applications for the optimization.
Figure 4 shows the comparison of three different extinguishing coefficients.
During this process, the initial step of the simulation such as the cell size, was kept to 0.2 m
3 and the DPS was set to 1 × 10
3. As seen in
Figure 5, when the extinction coefficient was kept at zero, there was an absence of the flame extinction after the water mist was inserted over the fuel surface. The variation occurs only due to the oxygen depletion over the fuel surface and the evaporation of the droplets. However, the water mist is not able to suppress the fire, which can be seen by keeping the value >1. In this process, the assumption was taken for this specific quantity, as this is compared with the experiments most of the time, to obtain its real value.
3.3. Fire Suppression by Water
In the experiments, the water mist is actuated at 10 s after the fire ignition. The droplets, discharged from the nozzle, will suppress the fire by direct cooling, evaporation cooling, or displacement of O
2 [
11]. In this section, we only focus on the suppression of fire by micro droplets of water. Water mist is injected via the nozzle at the top of the liquid level at a height of z = 2 m. The fuel used in the experiment was n-heptane. In the experiments, the point where the n-heptane reaches a complete combustion is precisely after 10 s [
27]. However, in FDS, we could set the HRRPUA directly to a certain value so that it could reach its complete combustion merely in seconds. The flow of the water mist/droplets over the fuel surface is further elaborated in
Figure 5, obtained from the results of the simulations. Such results are supportive for understanding the physics of any kind of numerical experiment. It also enables us to compare it with realistic experimental results as it is totally based on proper mathematical input and output.
During the fire suppression, one must think that the water mist may or may not be able to suppress the fire or the fire is suffocated due to the less amount of oxygen present inside the domain. This is the reason why the top and sides of the pool were kept open, to have a sufficient amount of oxygen. The open surfaces continuously provided oxygen and prevented the increase of the pressure inside the domain, resulting in numerical instability.
There are a number of sprinklers being used around the world with the variation in the mean volumetric diameter. Current simulations presume that the discharged droplets have a constant size. The droplet per second parameter is also used for a better visualization of the results and to obtain the difference between the droplet size and spread. This parameter categorizes how many drops in micro sizes are flowing from the nozzle, in some cases it provides a vital difference, while in other cases it has a negligible difference. It should also be noted that increasing the DPS could also lead to a higher computational time [
8]. Research findings of Beji et al. [
13] show that the input parameter of variable DPS can possibly cause the numerical error to be as high as 35%. Consequently, by avoiding further errors during these times, the DPS of the simulations were kept constant, but we also calculated the difference between the DPS ranging from 1 × 10
2 to 1 × 10
4.
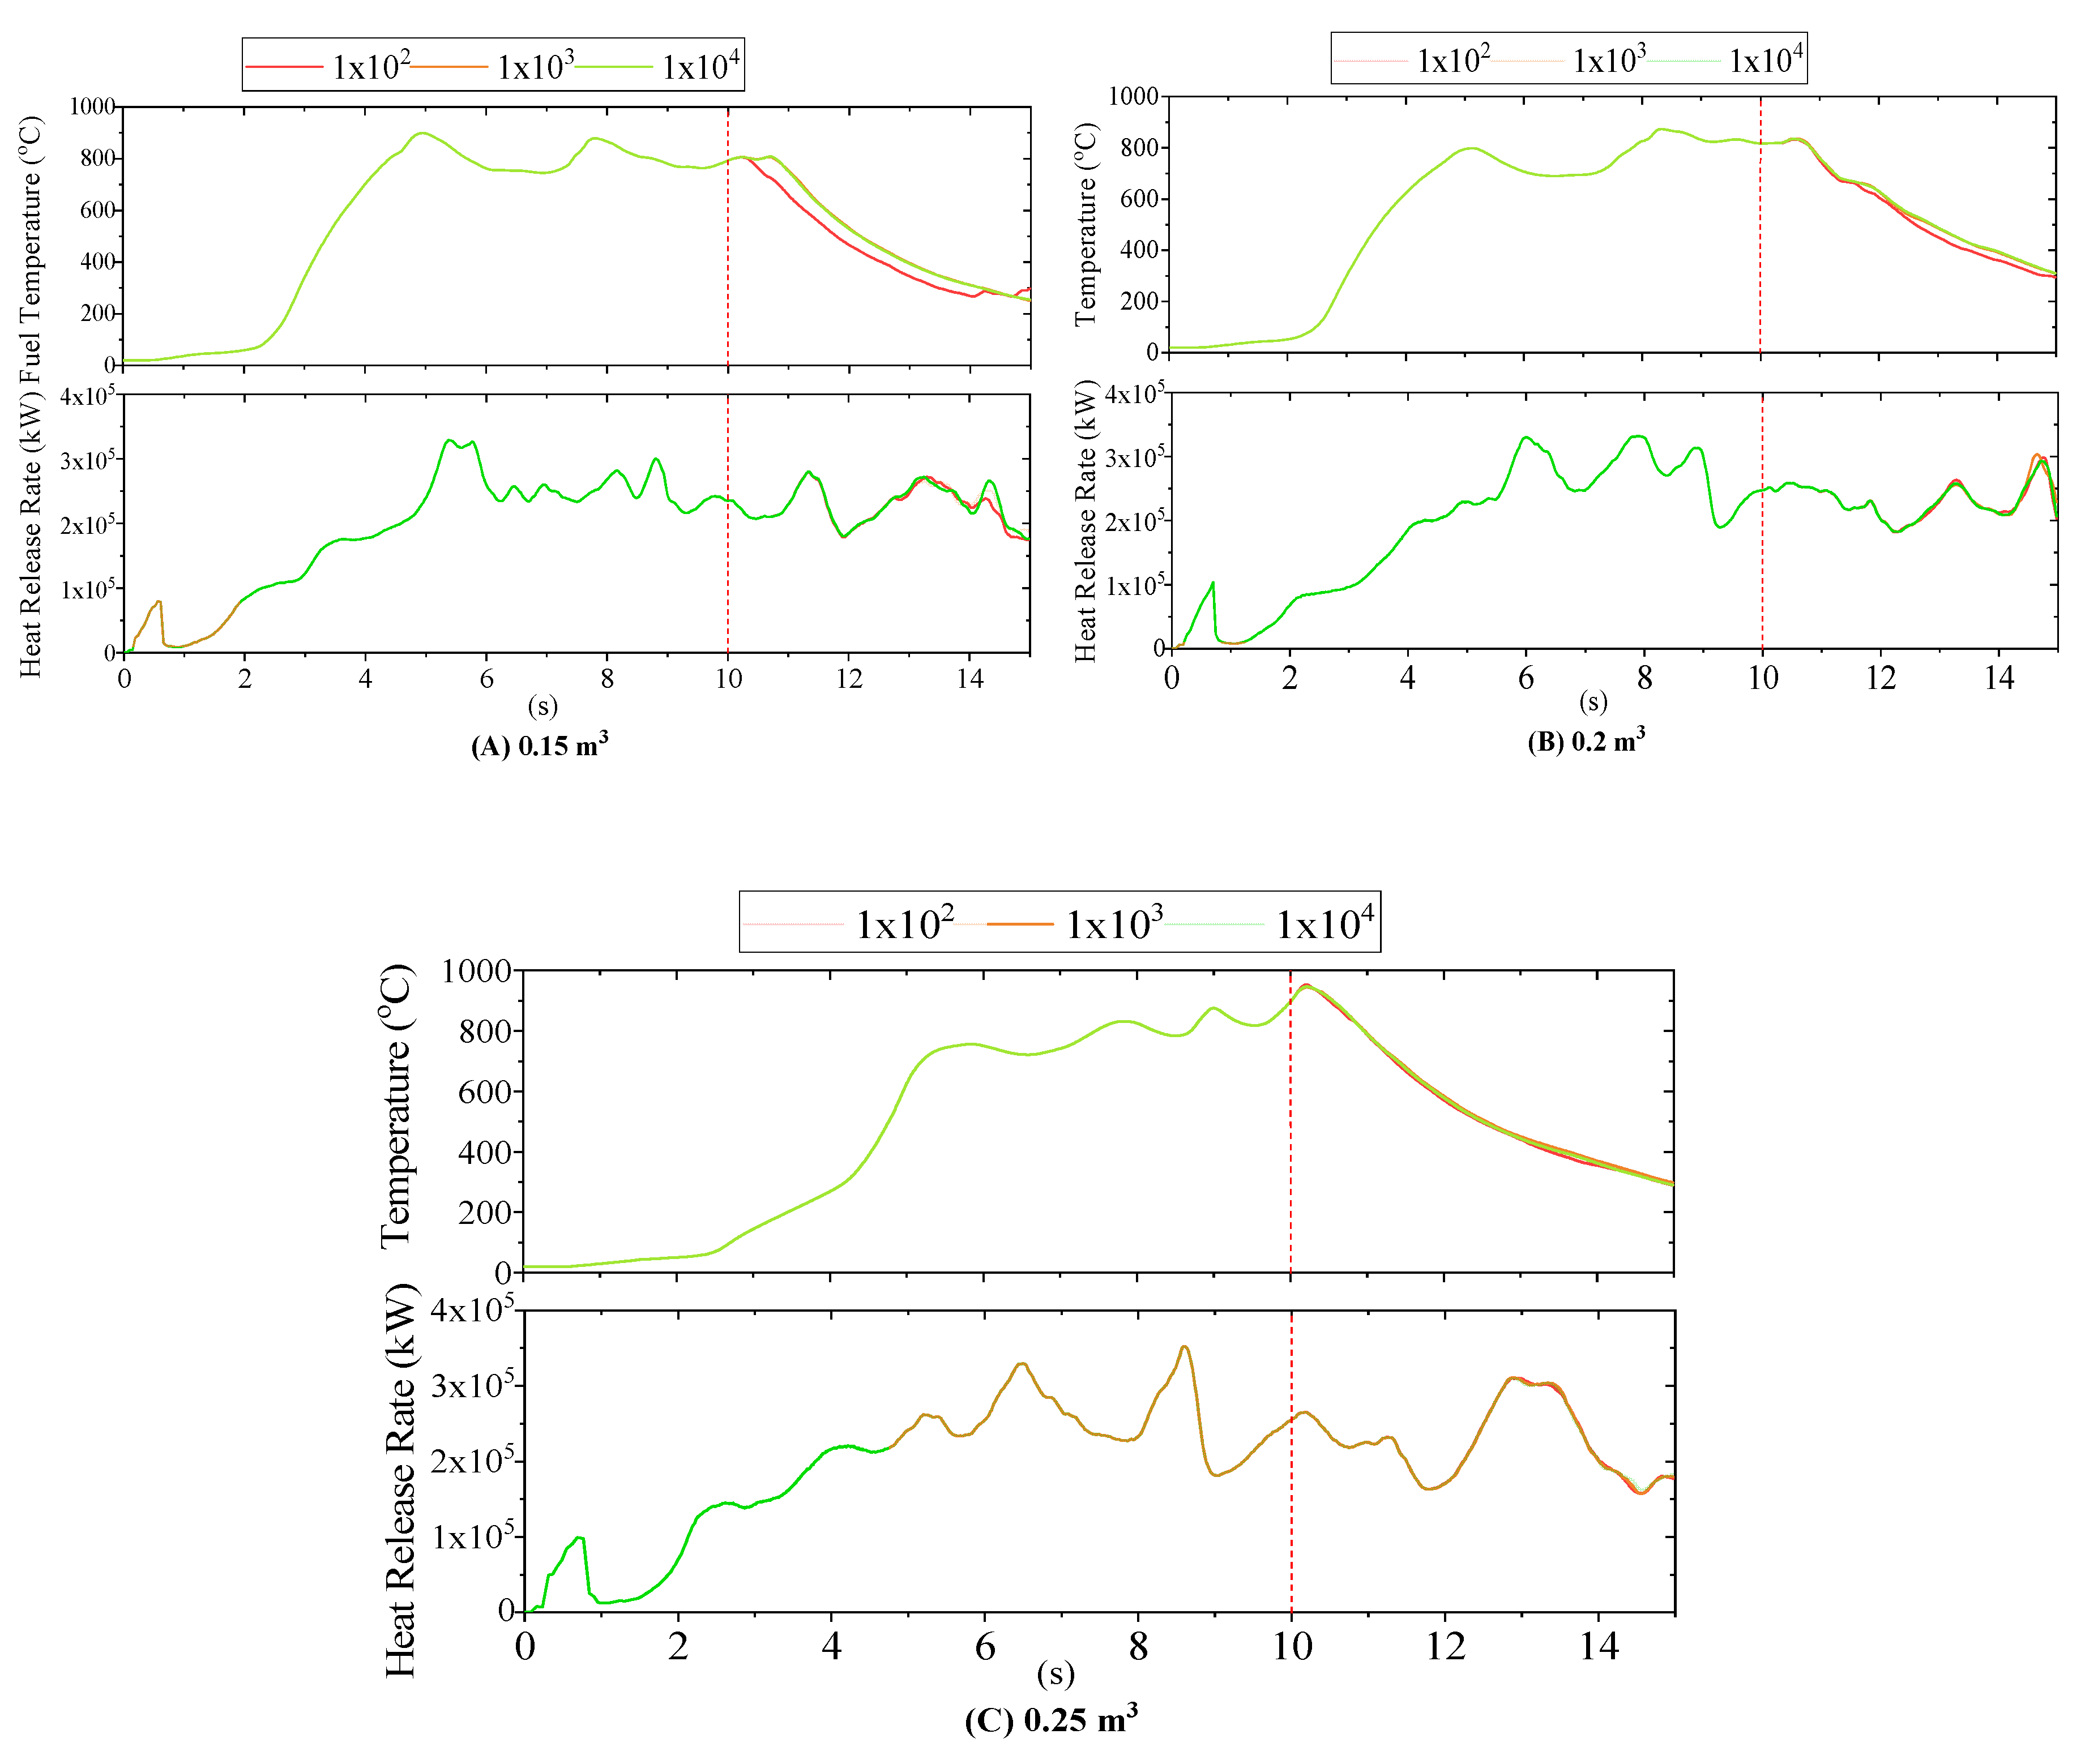
Figure 6 shows the difference in the temperature and heat release rate with the effect of changing DPS.
After determining the grid size for reasonable results, the mesh was also checked for the variation in the output of temperature over the fuel surface and the rate of heat release from the pool fire. During these processes, there were no alterations in the output of the results before the fire suppression. The main difference occurs only after the fire suppression starts, which is the start time of the water mist’s insertion. The droplets per seconds were categorized into three significant values, 1 × 10², 1 × 10³, and 1 × 10⁴. After changing the input during these three simulation processes, it was found that the first setting of DPS varied during all of the three cell sizes, which rarely affected the physical values with the increment in the number of droplets. Therefore, after finding these results, the second setting was utilized for most of the simulations for the main comparisons, as it was time efficient and rarely affects the output quantities.
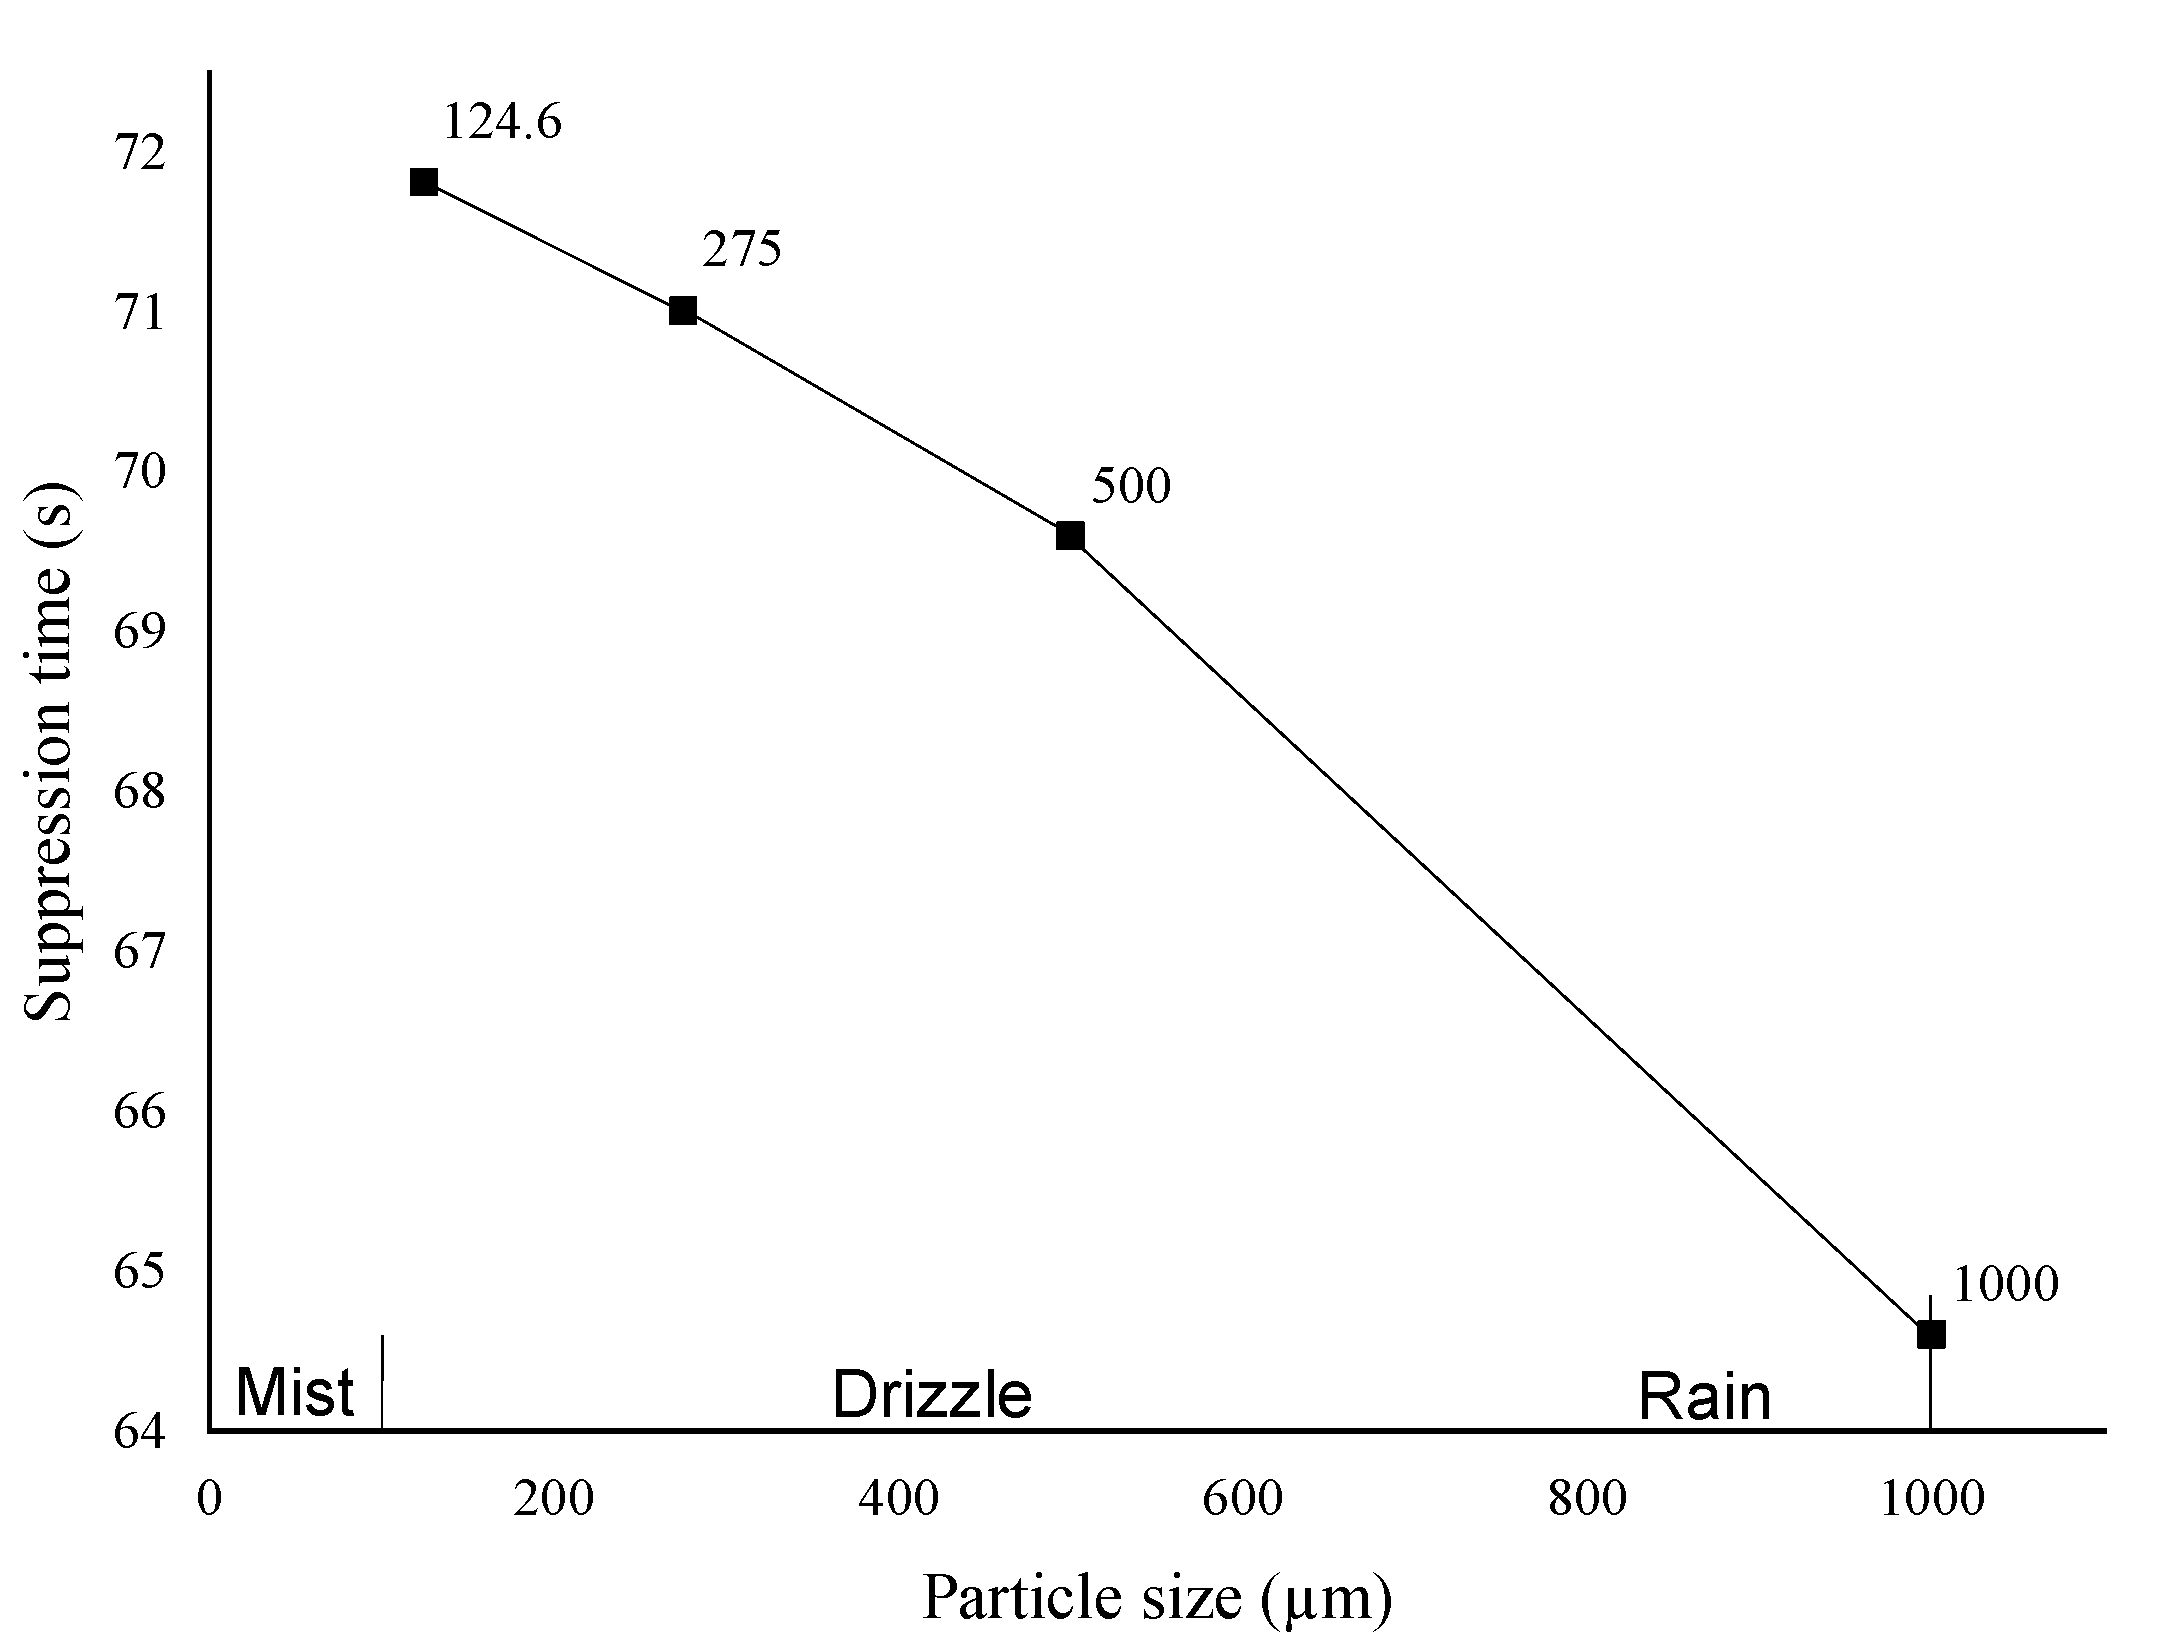
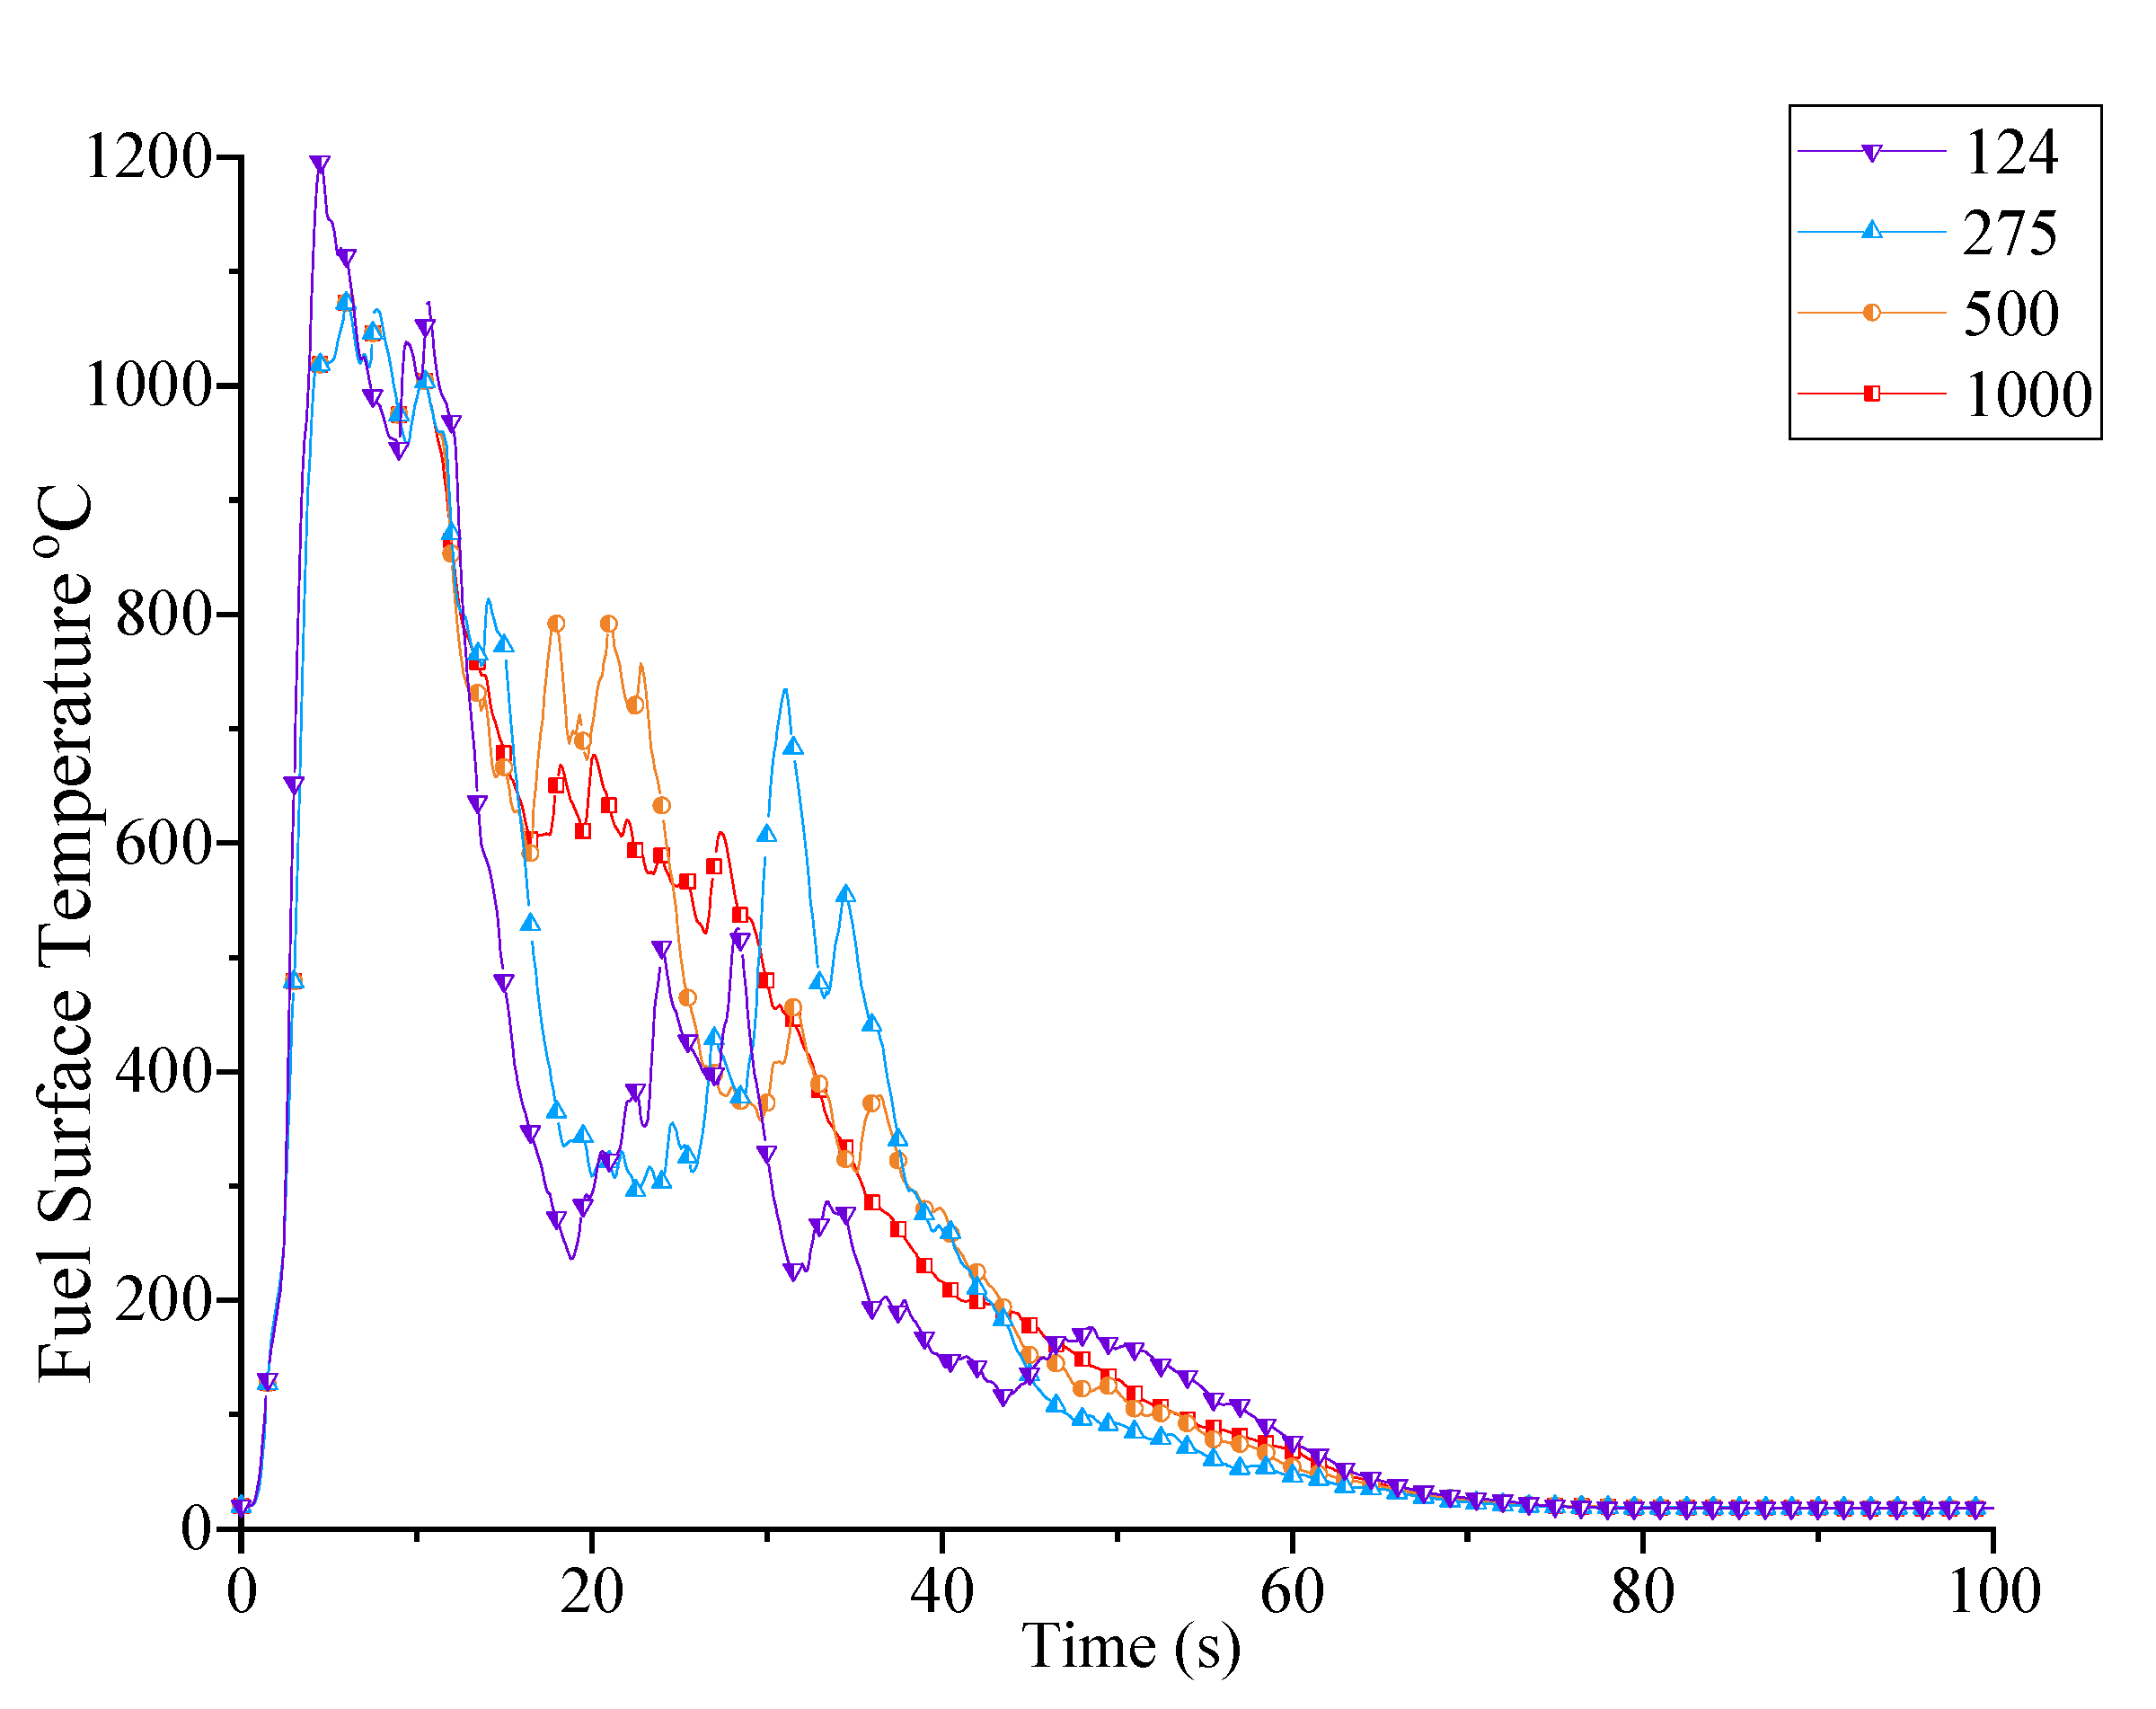
During the simulation of water mist suppression, the liquid droplets were injected through a nozzle spray model having the initial temperature along with the other parameters enlisted in
Table 1. Additionally, the water mist distribution was further categorized with a fine (mist) to average (droplet range preferred for fire-fighting) based on the categorization by Grant et al. [
16], as shown in
Figure 7. After comparing the droplet diameter ranging from 124.6, 275, 500, and 1000 µm, it was found that the larger the droplet, the quicker the fire suppression.
Fire suppression with different droplet sizes plays a significant role in the suppression process. Jai [
9] found out that the droplet size of 124.6 µm was the compatible size on a small scale. Moreover, larger droplets in diameter can sustain a high temperature as compared to smaller ones. This is the reason that larger droplets suppressed the fire efficiently.
It should be noted that these co-relations might be mutually related to each other. These results are just for this case of simulations, however, results may vary for different cases of fire suppression. Changing of a single parameter within the input parameters, model size, or nozzle height may cause a huge difference in results.
Figure 8 shows the analysis for the efficient droplet size for the water mist suppression.
Larger droplet sizes play a vital role in fire suppression [
32]. Smaller droplets highly decreased the temperature at the beginning, then later on increased the temperature. This proves that smaller droplets easily evaporated, while on the other hand, larger droplets sustained the high temperature zone and continuously decreased the temperature of the fuel surface temperature. During this experiment, we found that droplets having a diameter of 1000 µm uniformly decreased the fuel temperature.
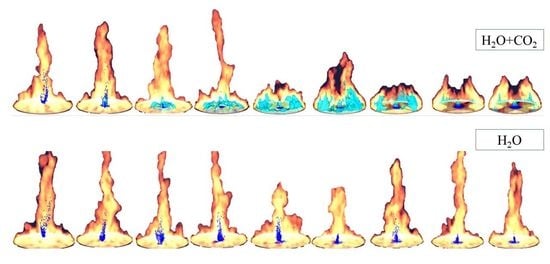
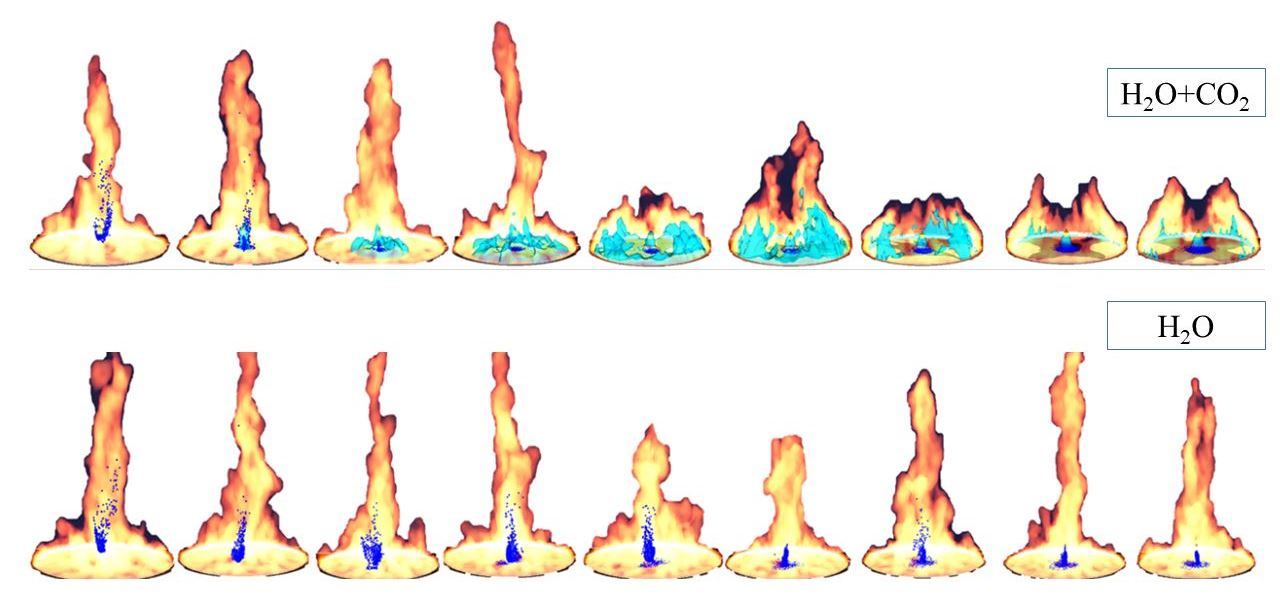
3.4. Fire Suppression by Mixture
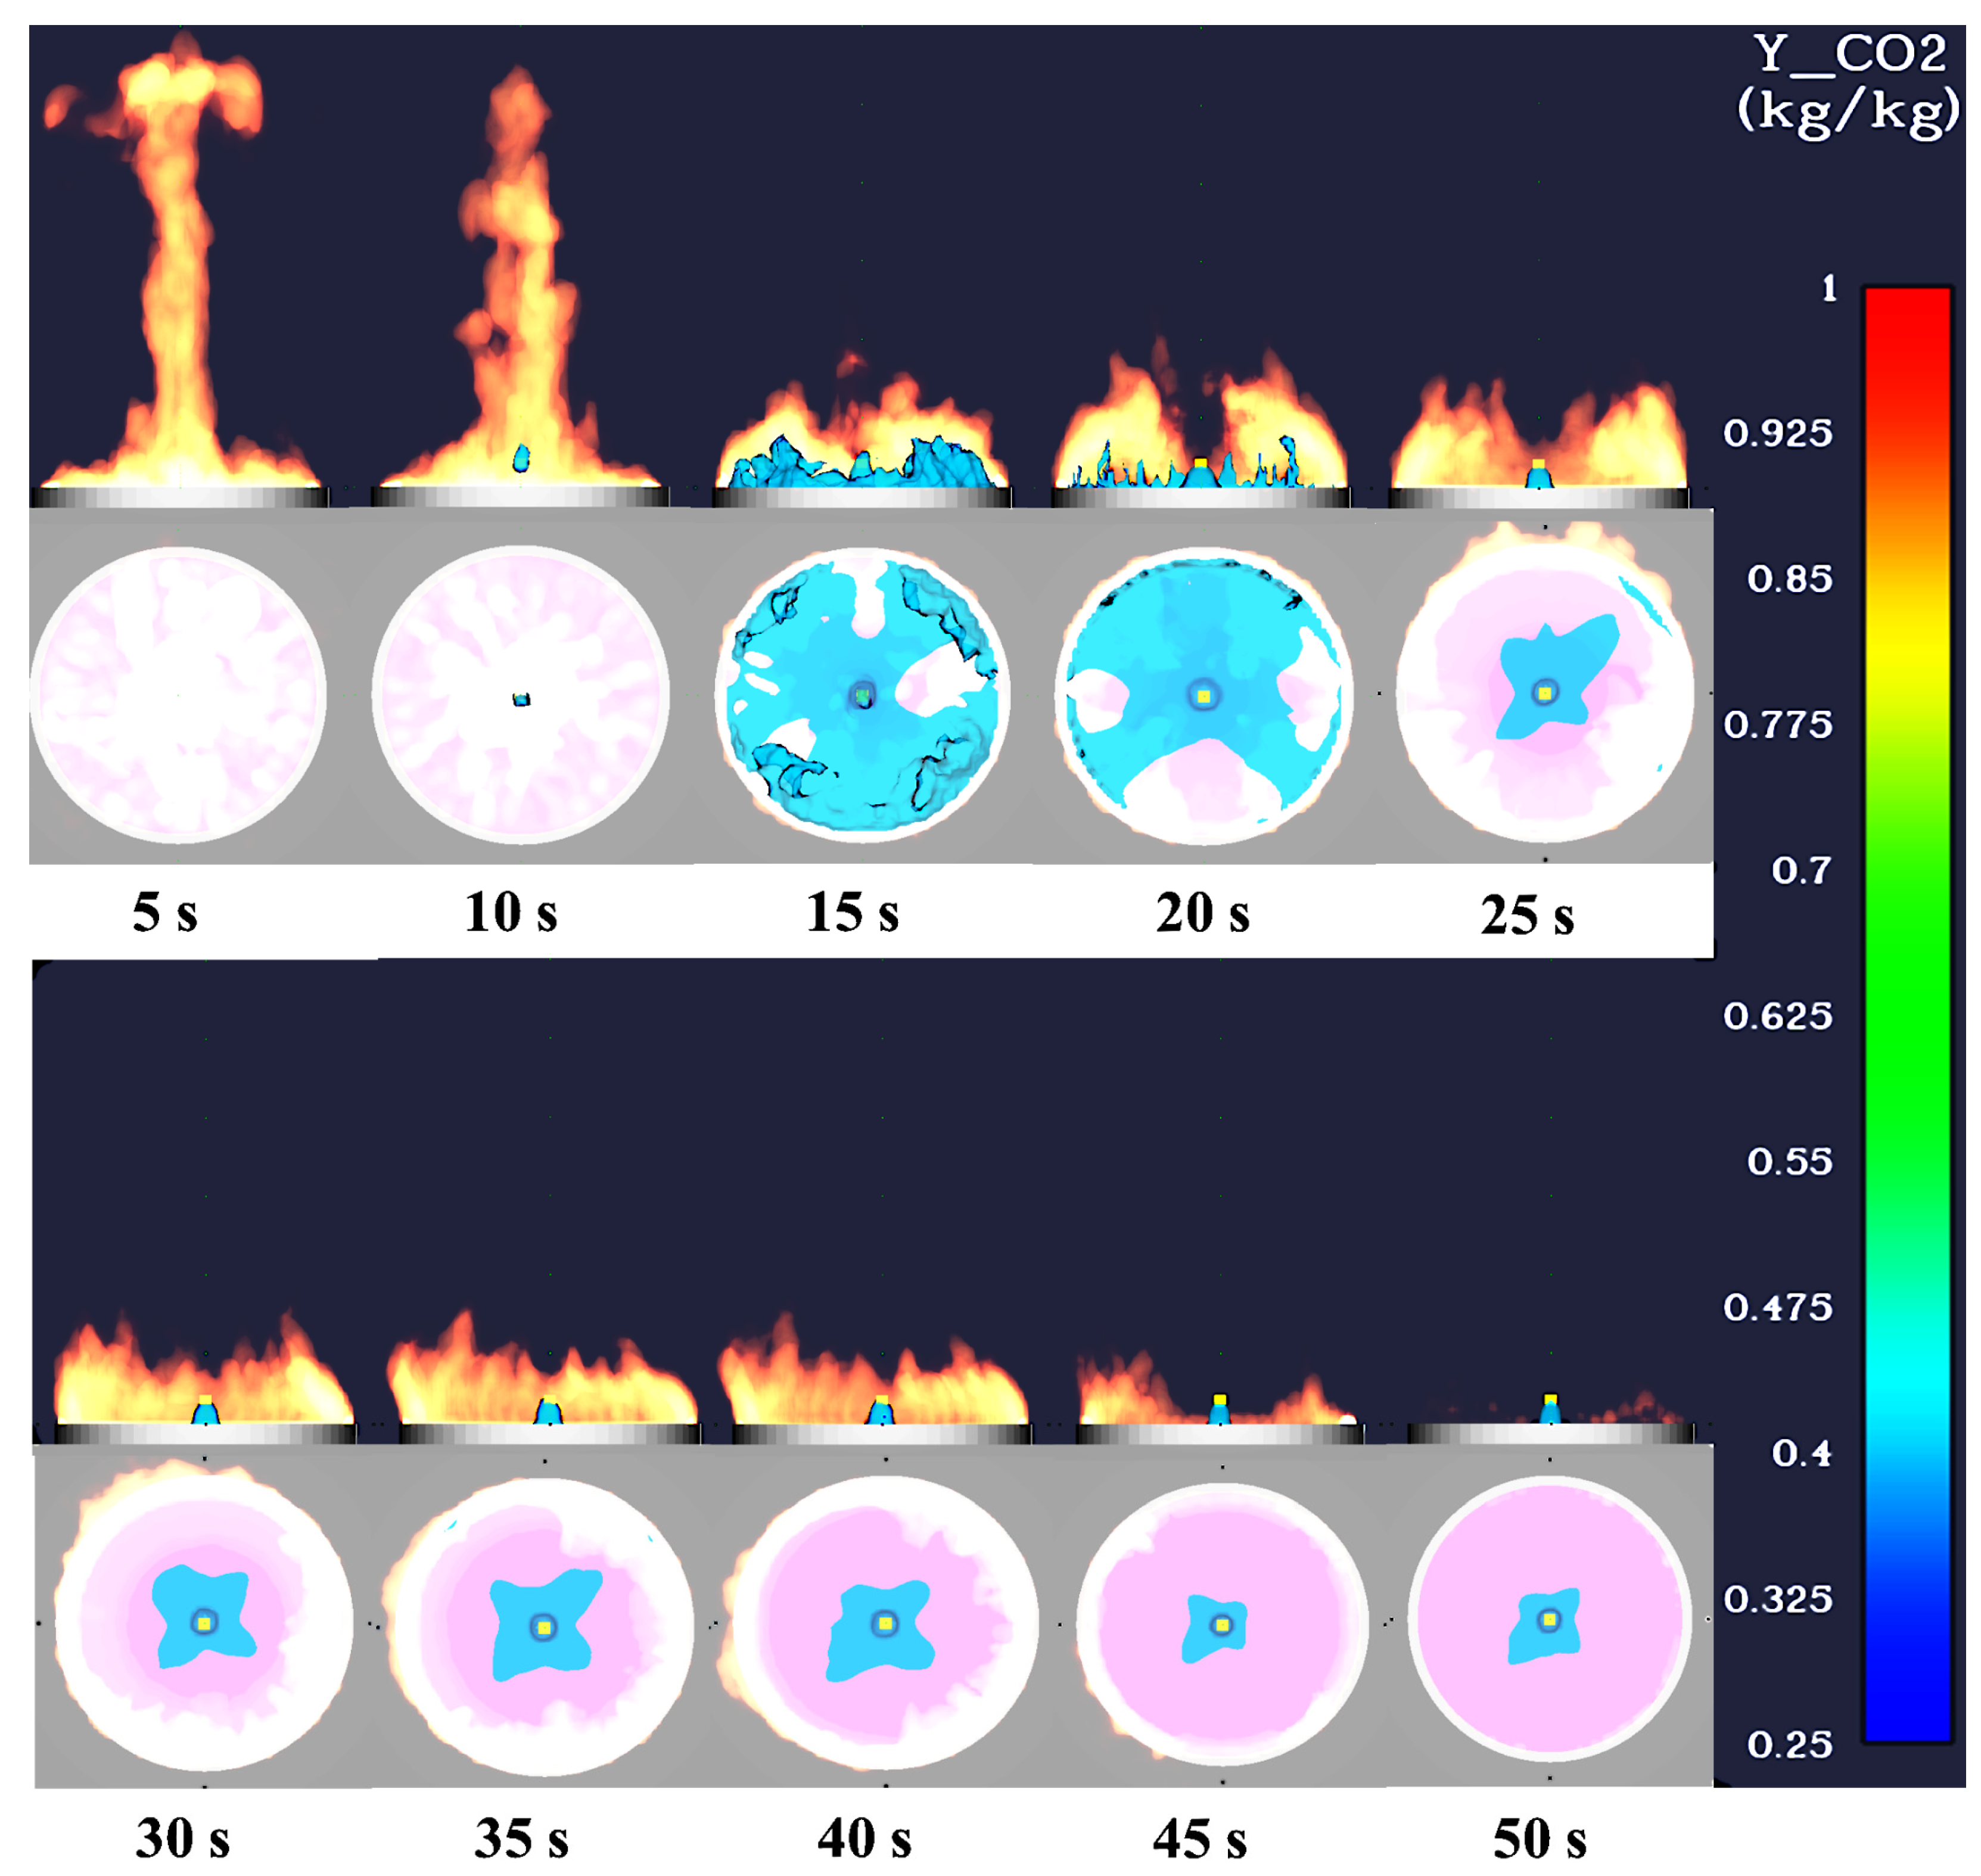
The fire suppression by mixture was achieved through water and CO
2 simultaneously, the detailed input parameters are enlisted in
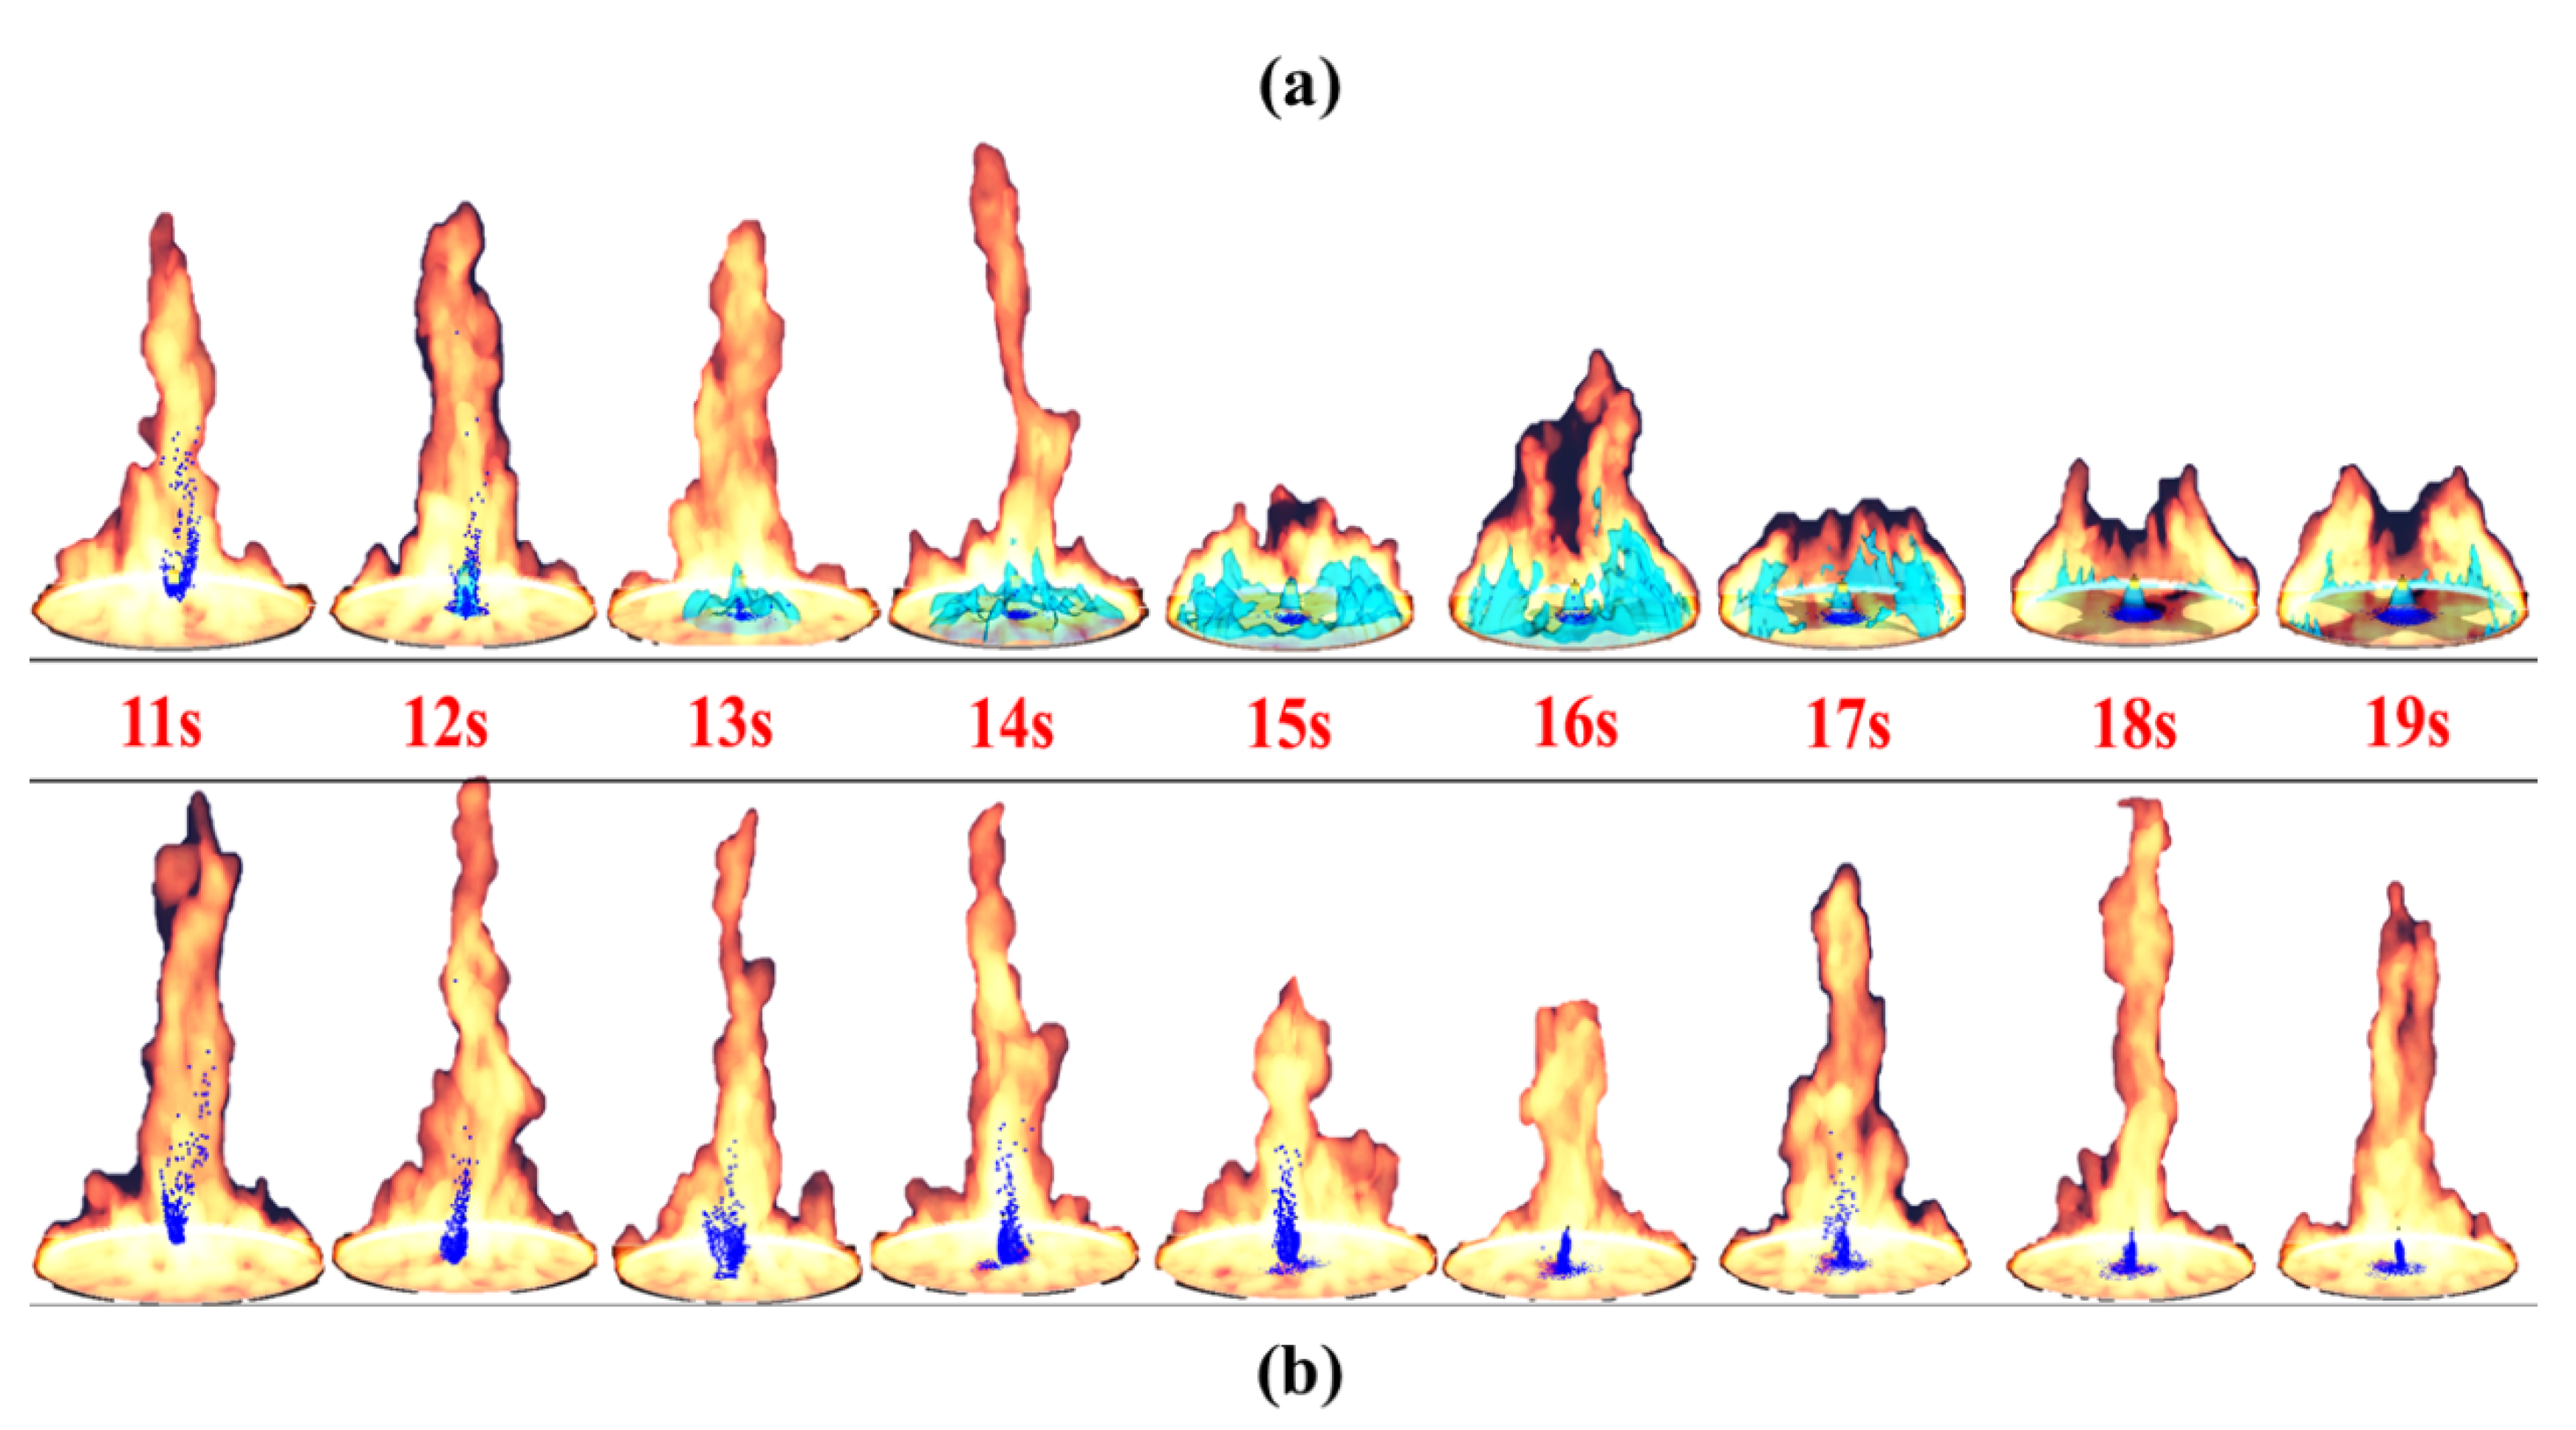
Table 1. The flow mechanism of every 5-s interval after the suppression is further shown in
Figure 9. These results are obtained by putting the iso-surface with the mass fraction (kg/kg). The gas particles are quite lighter than the liquid or solid particles, in which the fire starts to push the particles upwards. This push of fire starts to disperse the CO
2 into the atmosphere by breaking the chemical composition into the air. Once the CO
2 mixture was supplied, all the gas went through the flame and entered the fire of the n-heptane tank. It was observed that the flame gradually descended to the center of the periphery, after the gas (CO
2) and the liquid particles (water) reached the flame, and then the flame was suppressed. Visually, it can be verified that the time needed for fire suppression, by the combination of CO
2 and water mist, was shorter when both of these suppressing agents were used. Based on the test results over the range of different mass flow rates, we found that the fire suppression would be faster if the mass flow rate was higher.
The above mentioned flaming extinction phenomenon, which is a gradual disappearance from the center to the sides, is considered to be the extension of the low temperature region around the dissociated carbon dioxide in the base of the flame and the lack of oxygen supply.
4. Comparative Analysis of Fire Suppressants
In gaseous form, carbon dioxide was injected into the chamber and the water mist was injected in liquid form at room temperature. The analysis was conducted before and after suppression, based on the heat release rate of pool fire to better understand the interaction of the water droplet (mist) injection and mixture (CO2 and water mist) during the process. CO2 reduces the height of the flame by inerting and absorbing heat, while the droplets flow through this inert region and cool down the fuel surface temperature to prevent evaporation. The difference is, during the water suppression alone, it goes under the phase change process due to the initial evaporation for a longer period of time, while during the mixture, carbon dioxide saves the water from initial evaporation. As discussed in the previous sections, the objective is not only to check the ability to simulate the temperature or comparison of different parameters, but to also use such kind of numerical techniques to obtain the magnitude of the parameters related to energy exchanges. Certain techniques could be beneficial to understand the nature of incidents, and could also save time and effort to perform a number of experiments. These simulations were then analysed on a radiative heat flux, thermal variation, and production of by-products. The comparison is mainly classified into three main categories such as the effect on heat release rate, radiative heat flux, and temperature of pool fire, as explained in the following sections.
4.1. Effect of Suppressants on Thermal Energy Rate
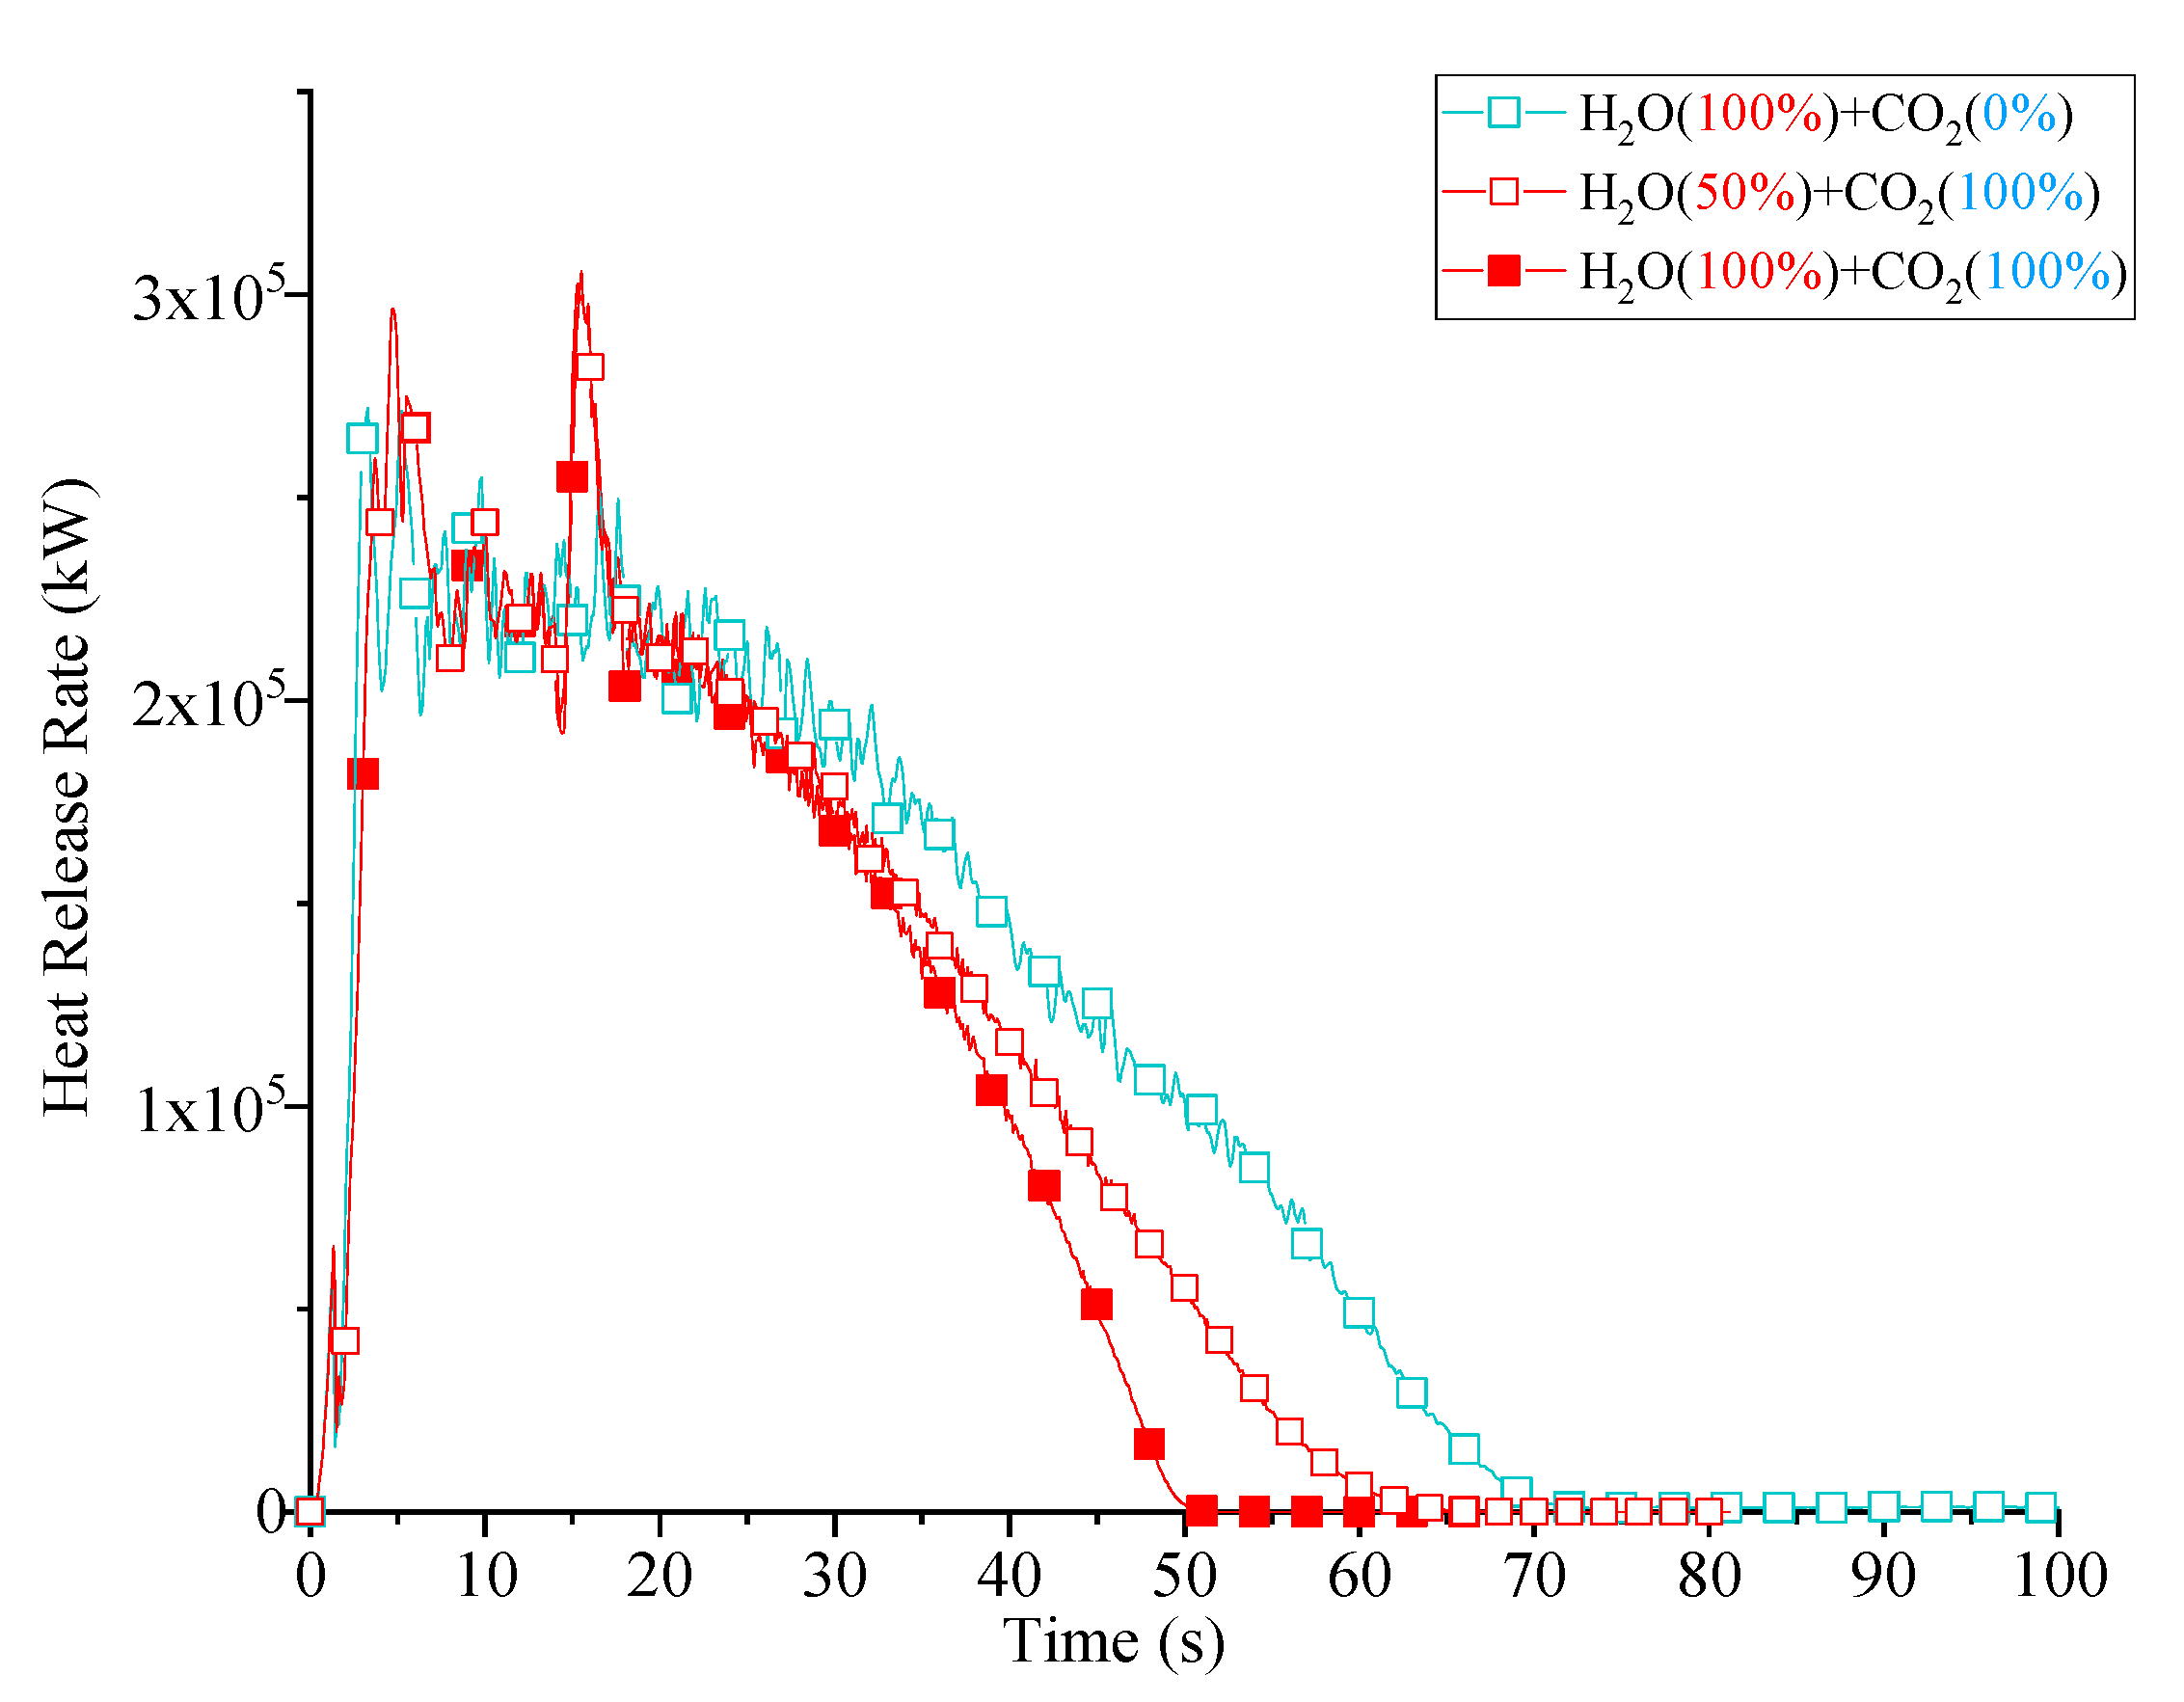
Regarding the particular contributions of the different effects [
7] of hot gas temperature and the increase of heat release rate with the change of time rate, it has been found that when the suppressing agents start to flow via the input source, there is a difference in the heat release rate of the pool fire. The red lines show the use of CO
2 with water droplets simultaneously, while the blue line shows the fire suppression only by water. As presented in
Figure 10, the fire suppression was highly efficient when both suppressing agents were used at 100%, a bit quicker with the use of 50% of water droplets, and a very late fire suppression with only the use of water droplets.
All these results are obtained by simulating these cases with various concentrations of suppressing agents separately. The physical quantities obtained after the suppression of two different suppressing agents vary in the difference in magnitude with almost the same start but different culminations. However, with the mixture, the heat transfer decreases very quickly as compared to the use of water alone. This is only possible if the suppressing agents covering the entire fuel surface area burn rapidly and decrease the chain reaction, which is found in the case of gaseous suppressing agents.
4.2. Effect on Radiative Heat Flux (RHF)
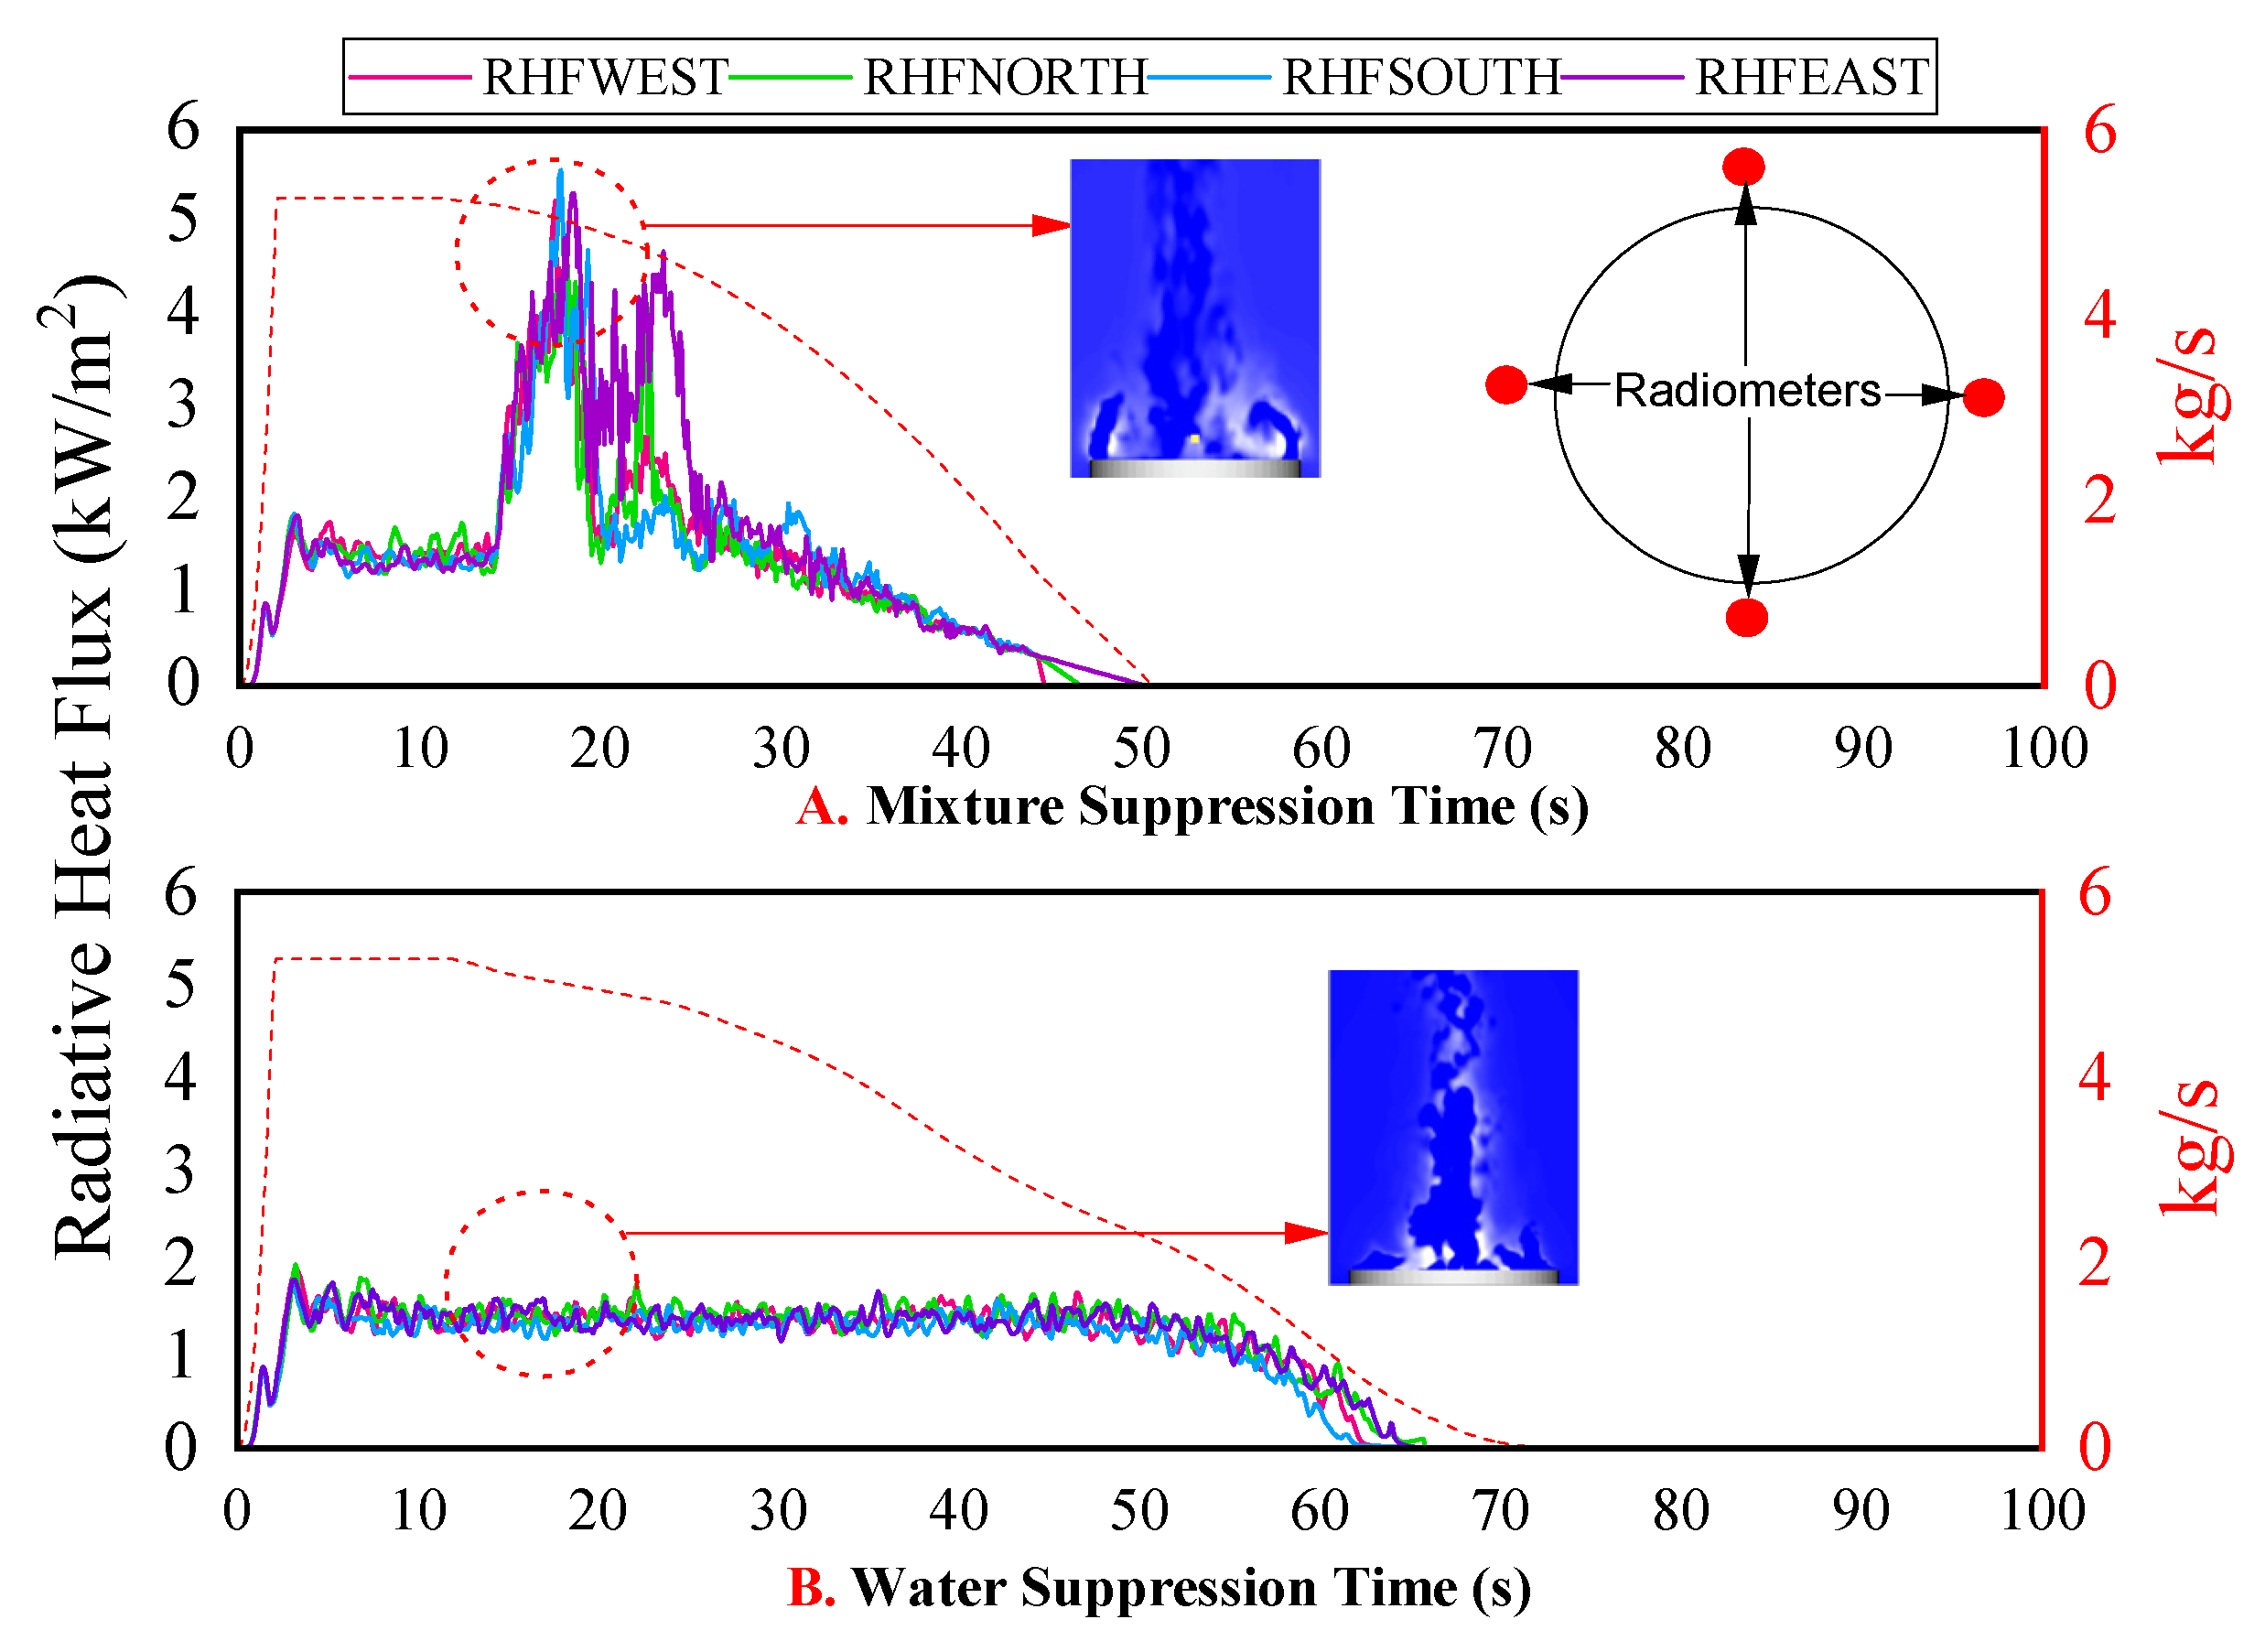
To understand the heat transfer by fire behavior, the radiative heat flux was obtained by four radiometers placed at every 1 m horizontal distance in all four directions from the centre towards the side of the pool fire. After the suppression by mixture, the change in the radiation and mass loss rate occurs. In
Figure 11, colored lines show the difference in radiation, which is obtained by traditional radiative heat sensors, the red dotted line shows the mass loss rate of the fire, and the two embossed pictures on
Figure 11A,B show the radiation obtained by 2D scalar plans during the initial stages of fire suppression. During the fire suppression by mixture, the RHF increases for a short amount of time, which is due to the carbon dioxide being the gas that covers the whole area of the pool abruptly, also shown in
Figure 9, in a short amount of time from the upward direction, removing the hot gases and oxygen residing over the fuel surface and its vicinity towards the sides of the pool. This flow of suppressant later tends to move the hot gases towards the sides, which is where the radiometers were placed with a 1 m horizontal distance from the pool sides.
In the case of water suppression, the fire is suppressed with less radiation towards the sides of the pool but with a longer duration of time, as shown in
Figure 11A. During the suppression by mixture, the radiation increases for a short amount of time and drops off the overall radiation including the top and side of the pool, which is rarely affected during the water mist suppression, as shown at the end of
Figure 11B. As the water mist being liquid evaporates at first and at a later stage stays over the fuel surface, the difference between this behavior is caused only due to the multi-fluid mechanics over the fire, due to which the mass loss rate during the mixture was highly decreased as compared to the water only.
4.3. Effect on Overall Temperature
The behavioral changes of various quantities related to heat transfer occurred after the suppression, but due to the insertion of these two suppressing agents, there is also a vital thermal difference below the nozzle. During both of the suppression processes, the atmosphere inside is scorching. There are two methods to obtain the thermal difference between these two methods. The first method is one of the advanced methods to practically visualize the difference of temperatures. This method involves the placement of 2D planar surfaces over the pool fire to observe the temperature of hot gases at each and every position with respect to height, as shown in
Figure 12. To obtain the temperature, the one planar surface was placed at the centre of the pool fire.
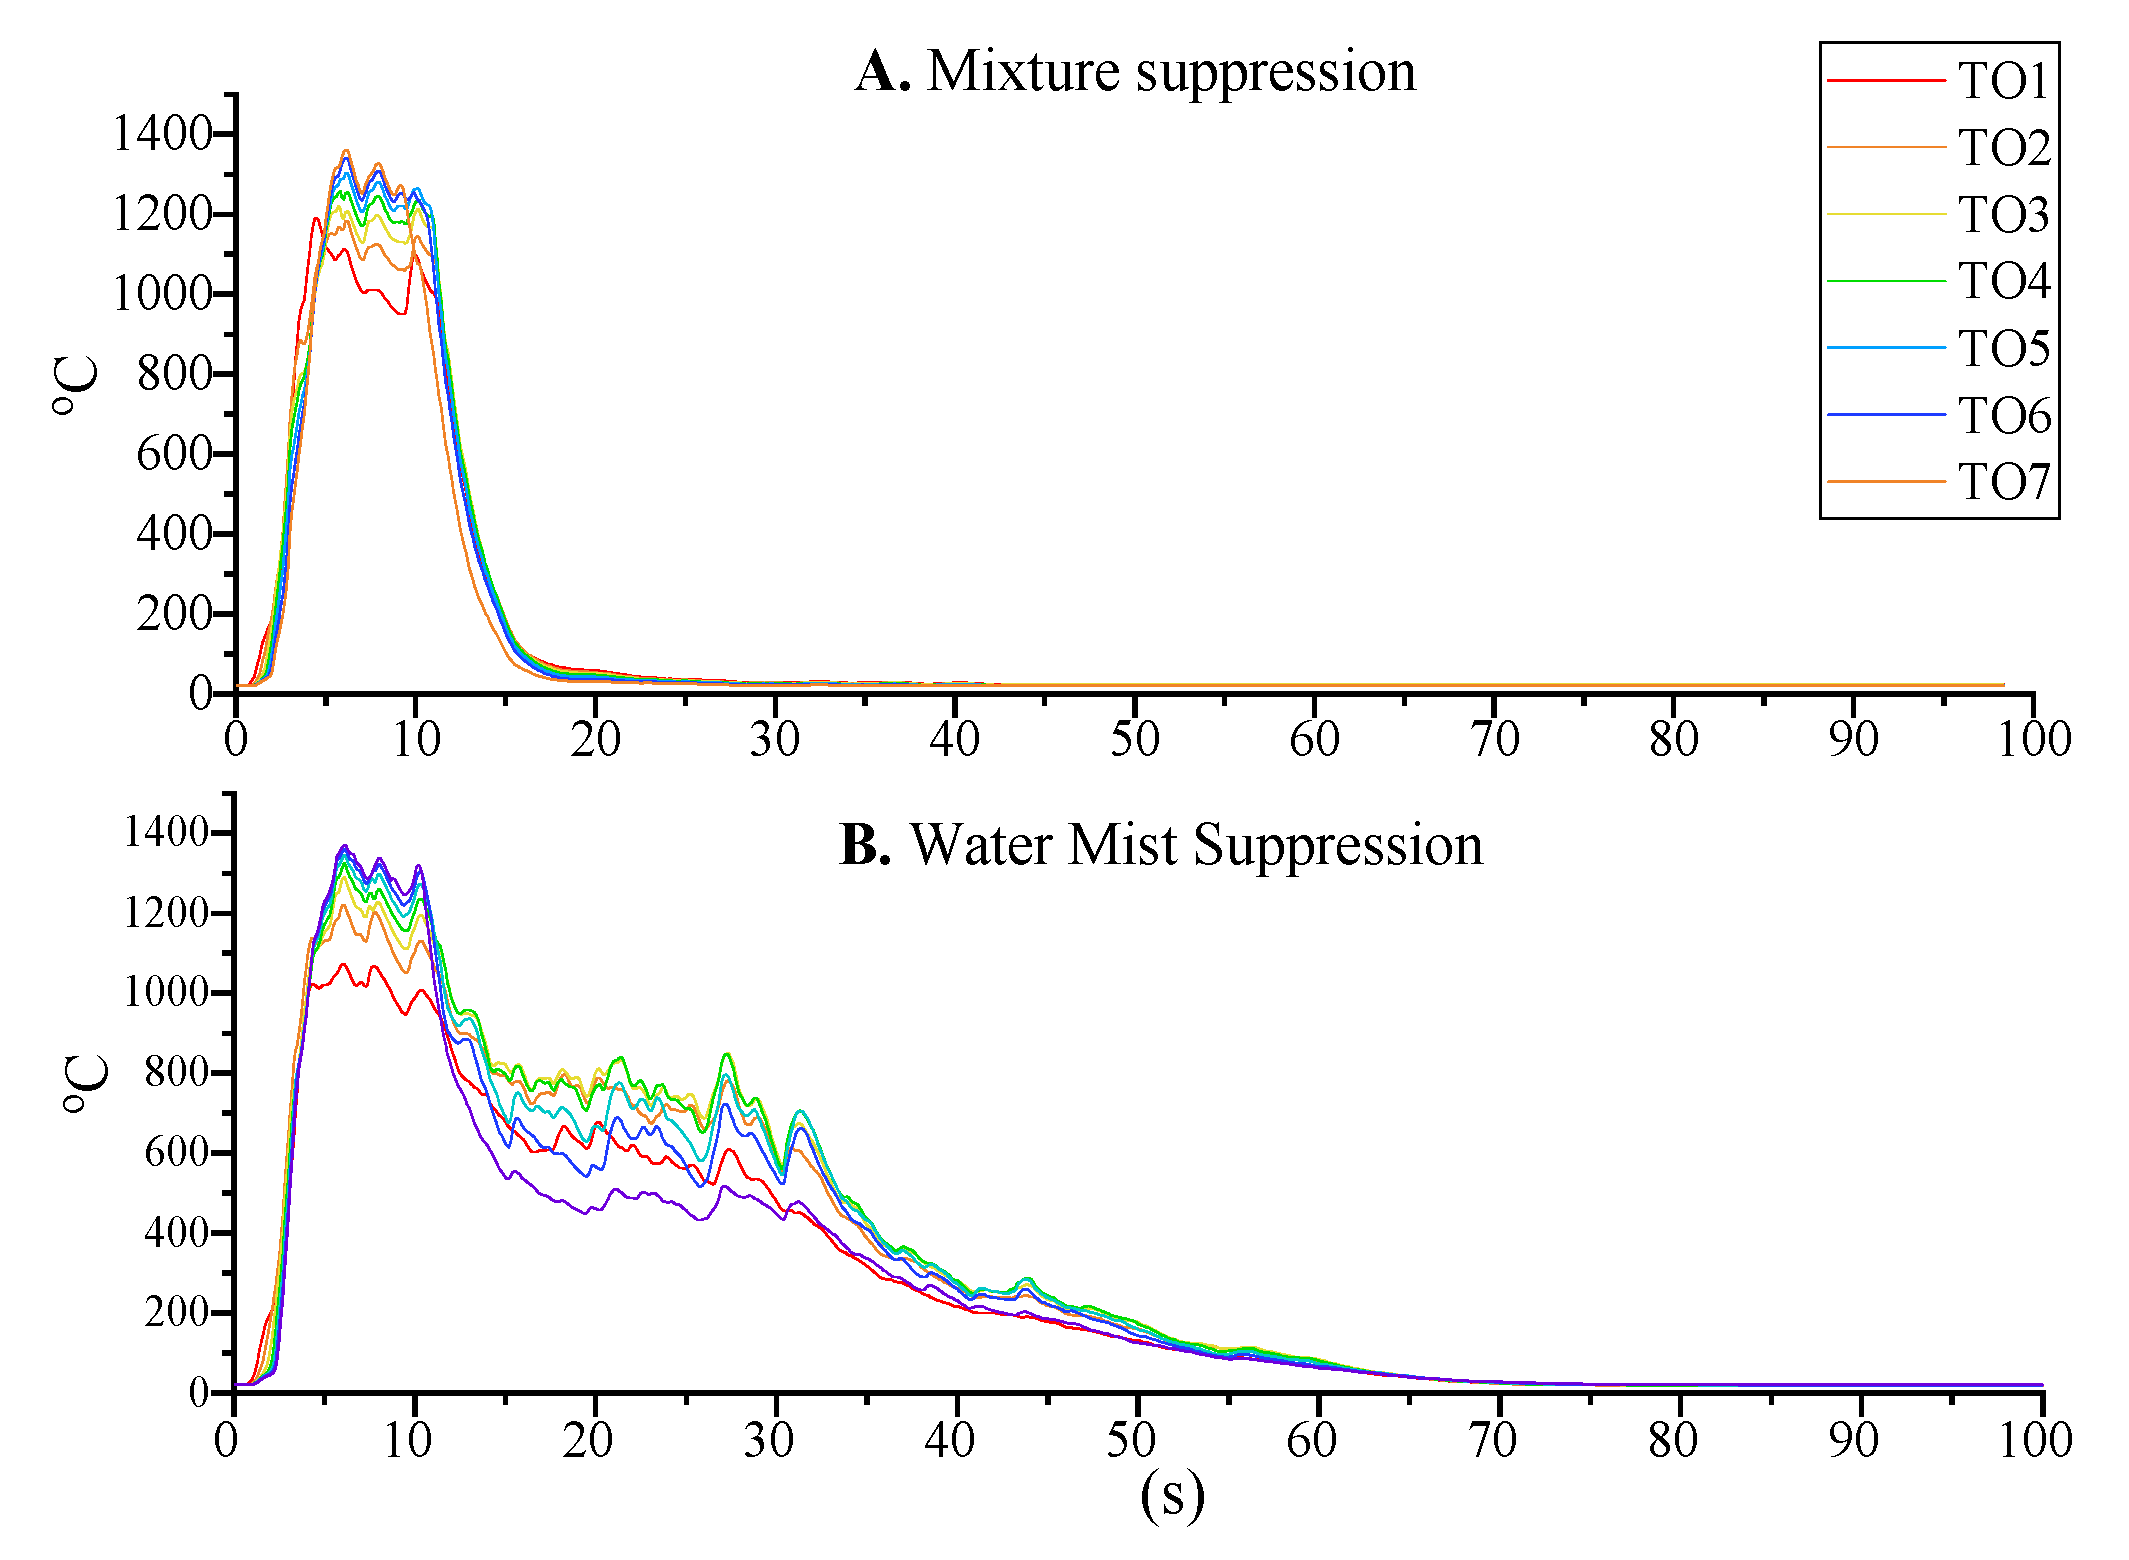
The second method is more of a traditional one, which is the most preferred during experimental procedurals. This method involves the use of traditional K-type thermocouples with a bead diameter of 1 mm. To obtain the temperature variations over the fuel surface, seven thermocouples were placed at the centre of the pool fire with variable height (z), as shown in
Figure 12a. The main difference obtained was after the suppression. The first thermocouple (TO1) was placed over the liquid surface and the remaining thermocouples were placed on every 15 cm vertical distance. After the suppression started, the temperature falls abruptly, which is due to the fact that during the suppression by mixture, the CO
2 is cooling down the gas phase over the fuel and water droplets are cooling the fuel surface.
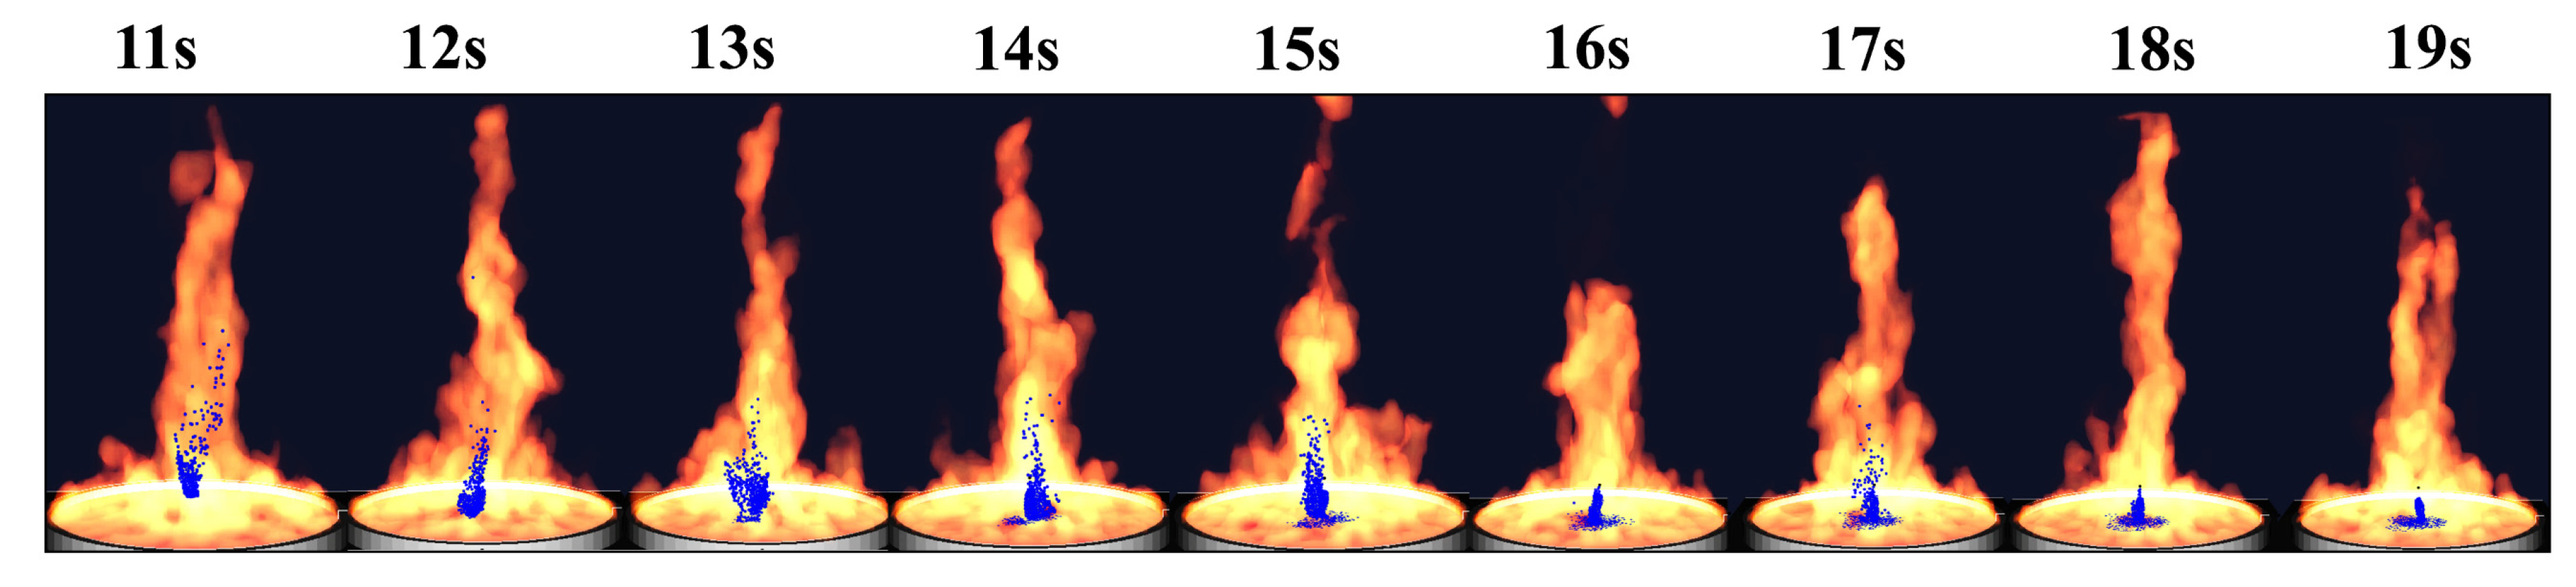
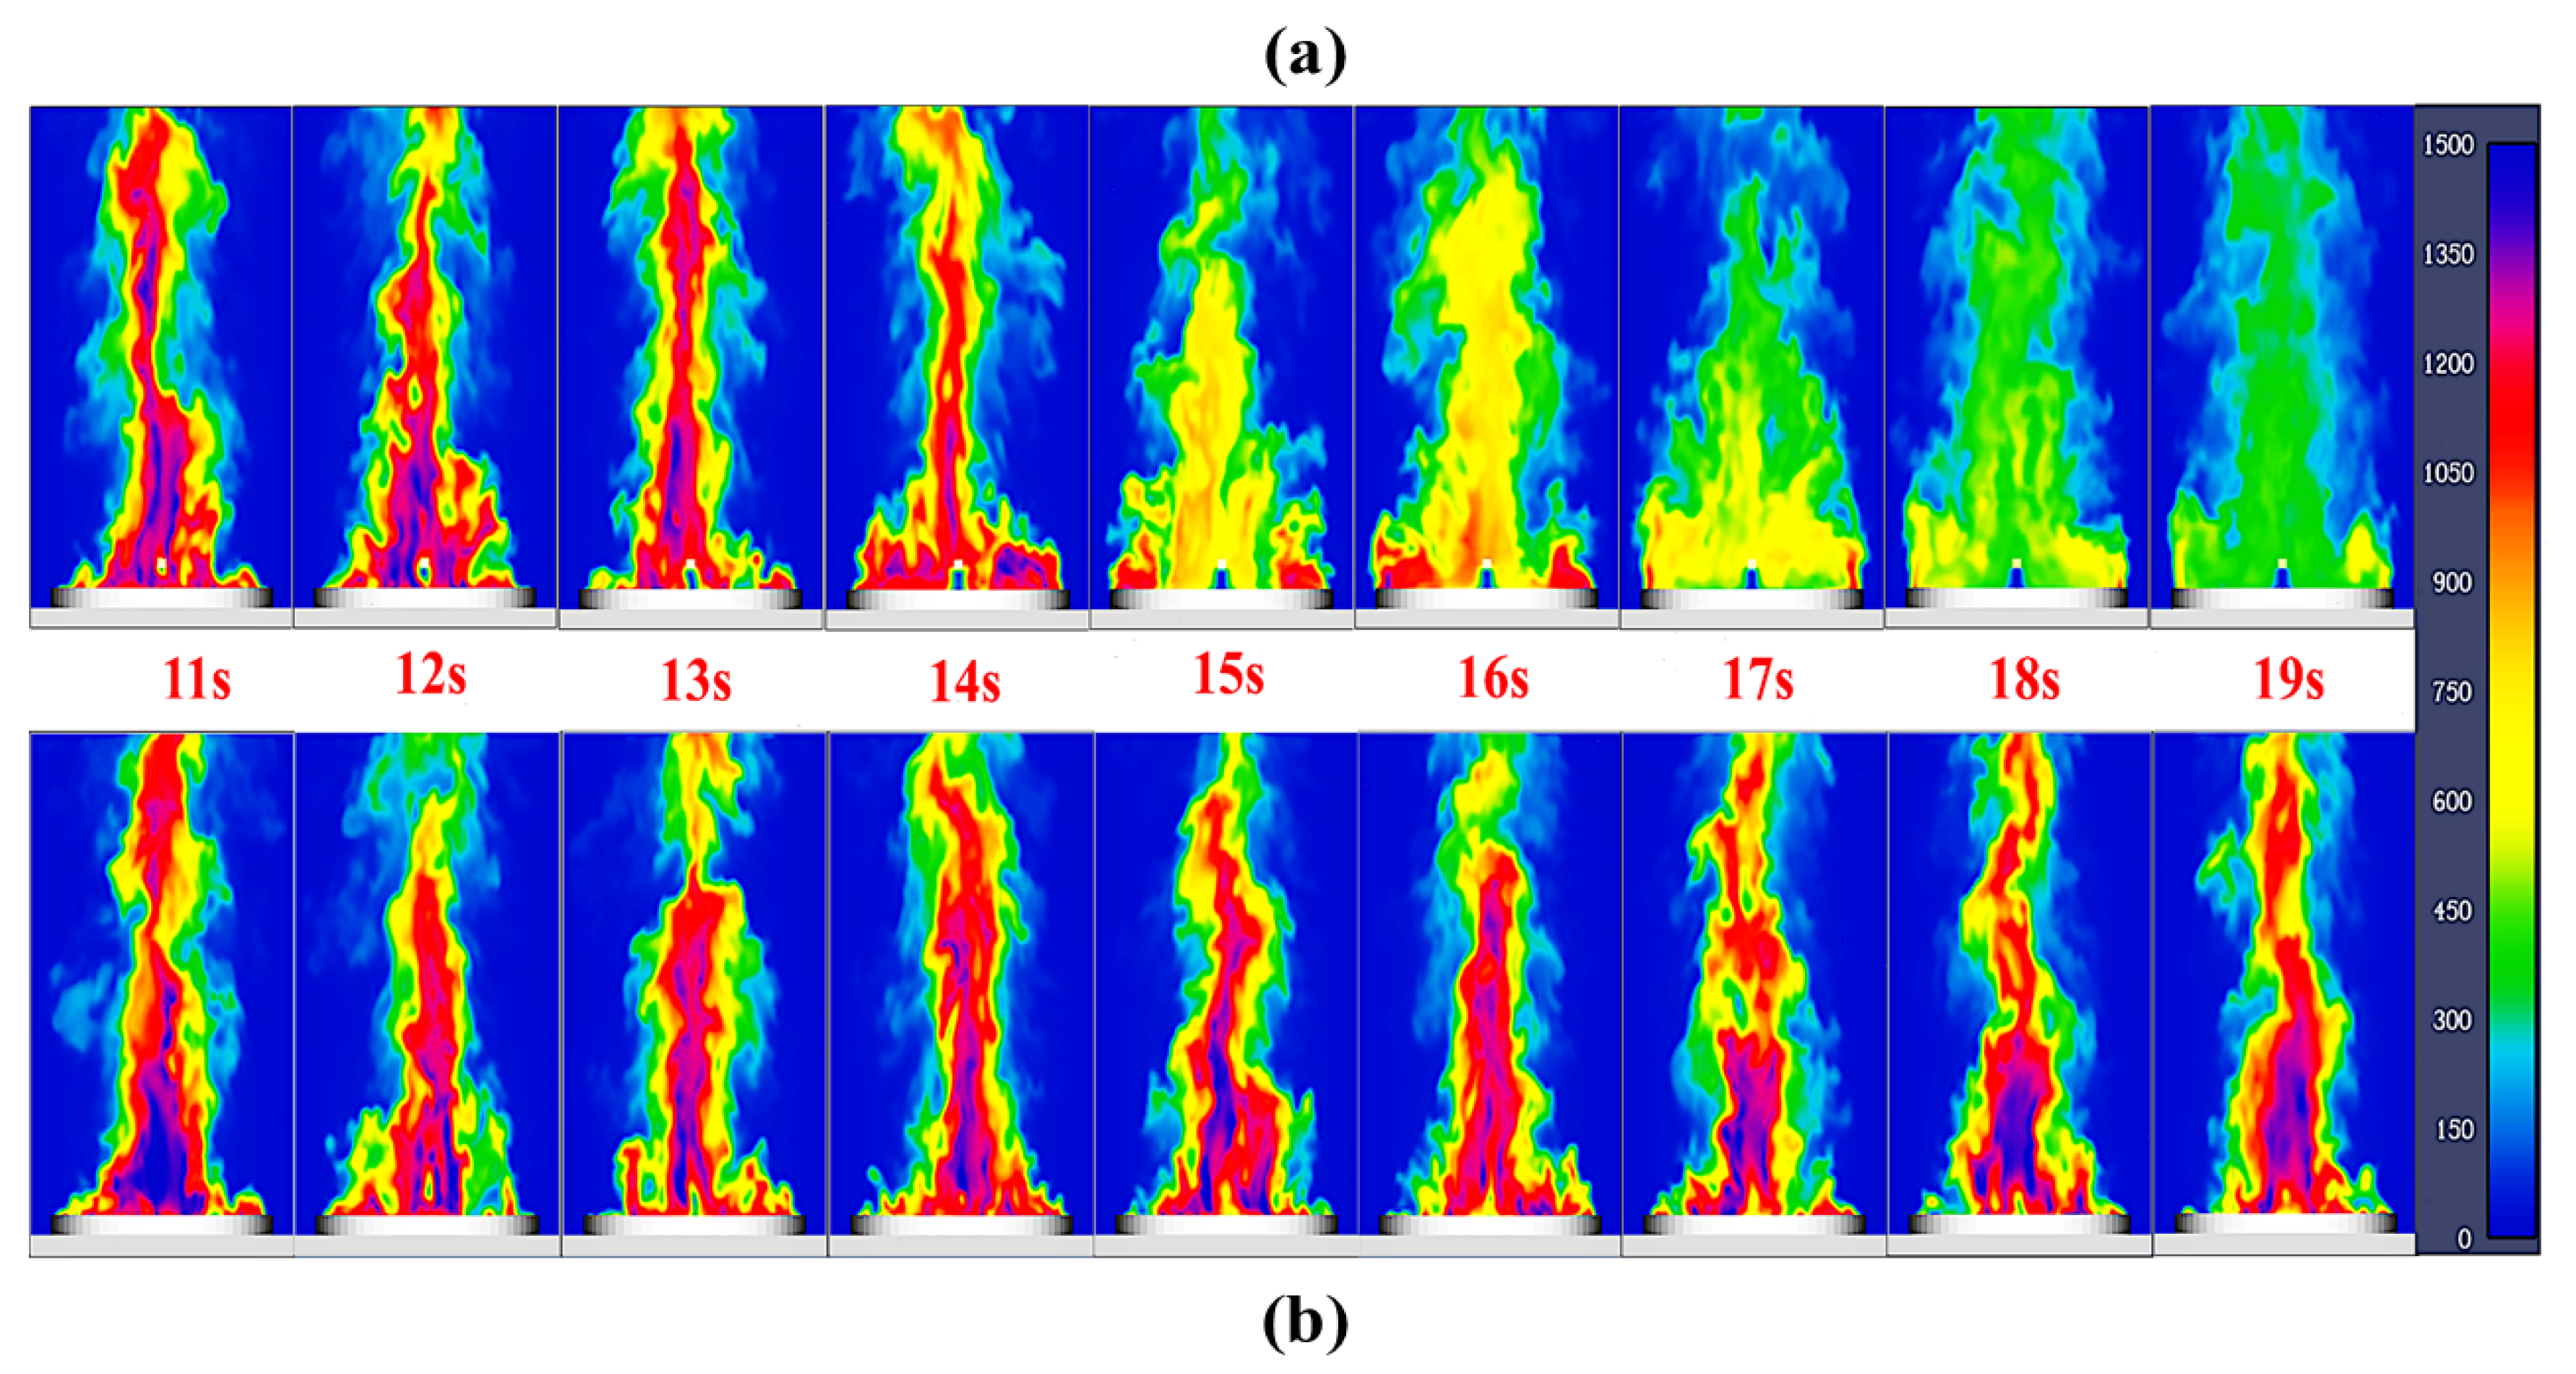
On the other hand, the suppression by water mist (
Figure 13B) is not efficient as compared to the suppression by mixture, which is due to the fact that during the water mist suppression, most of the water droplets are being evaporated into the atmosphere or lifted up due to the buoyancy force created by the fire from 11 to 15 s, as shown in
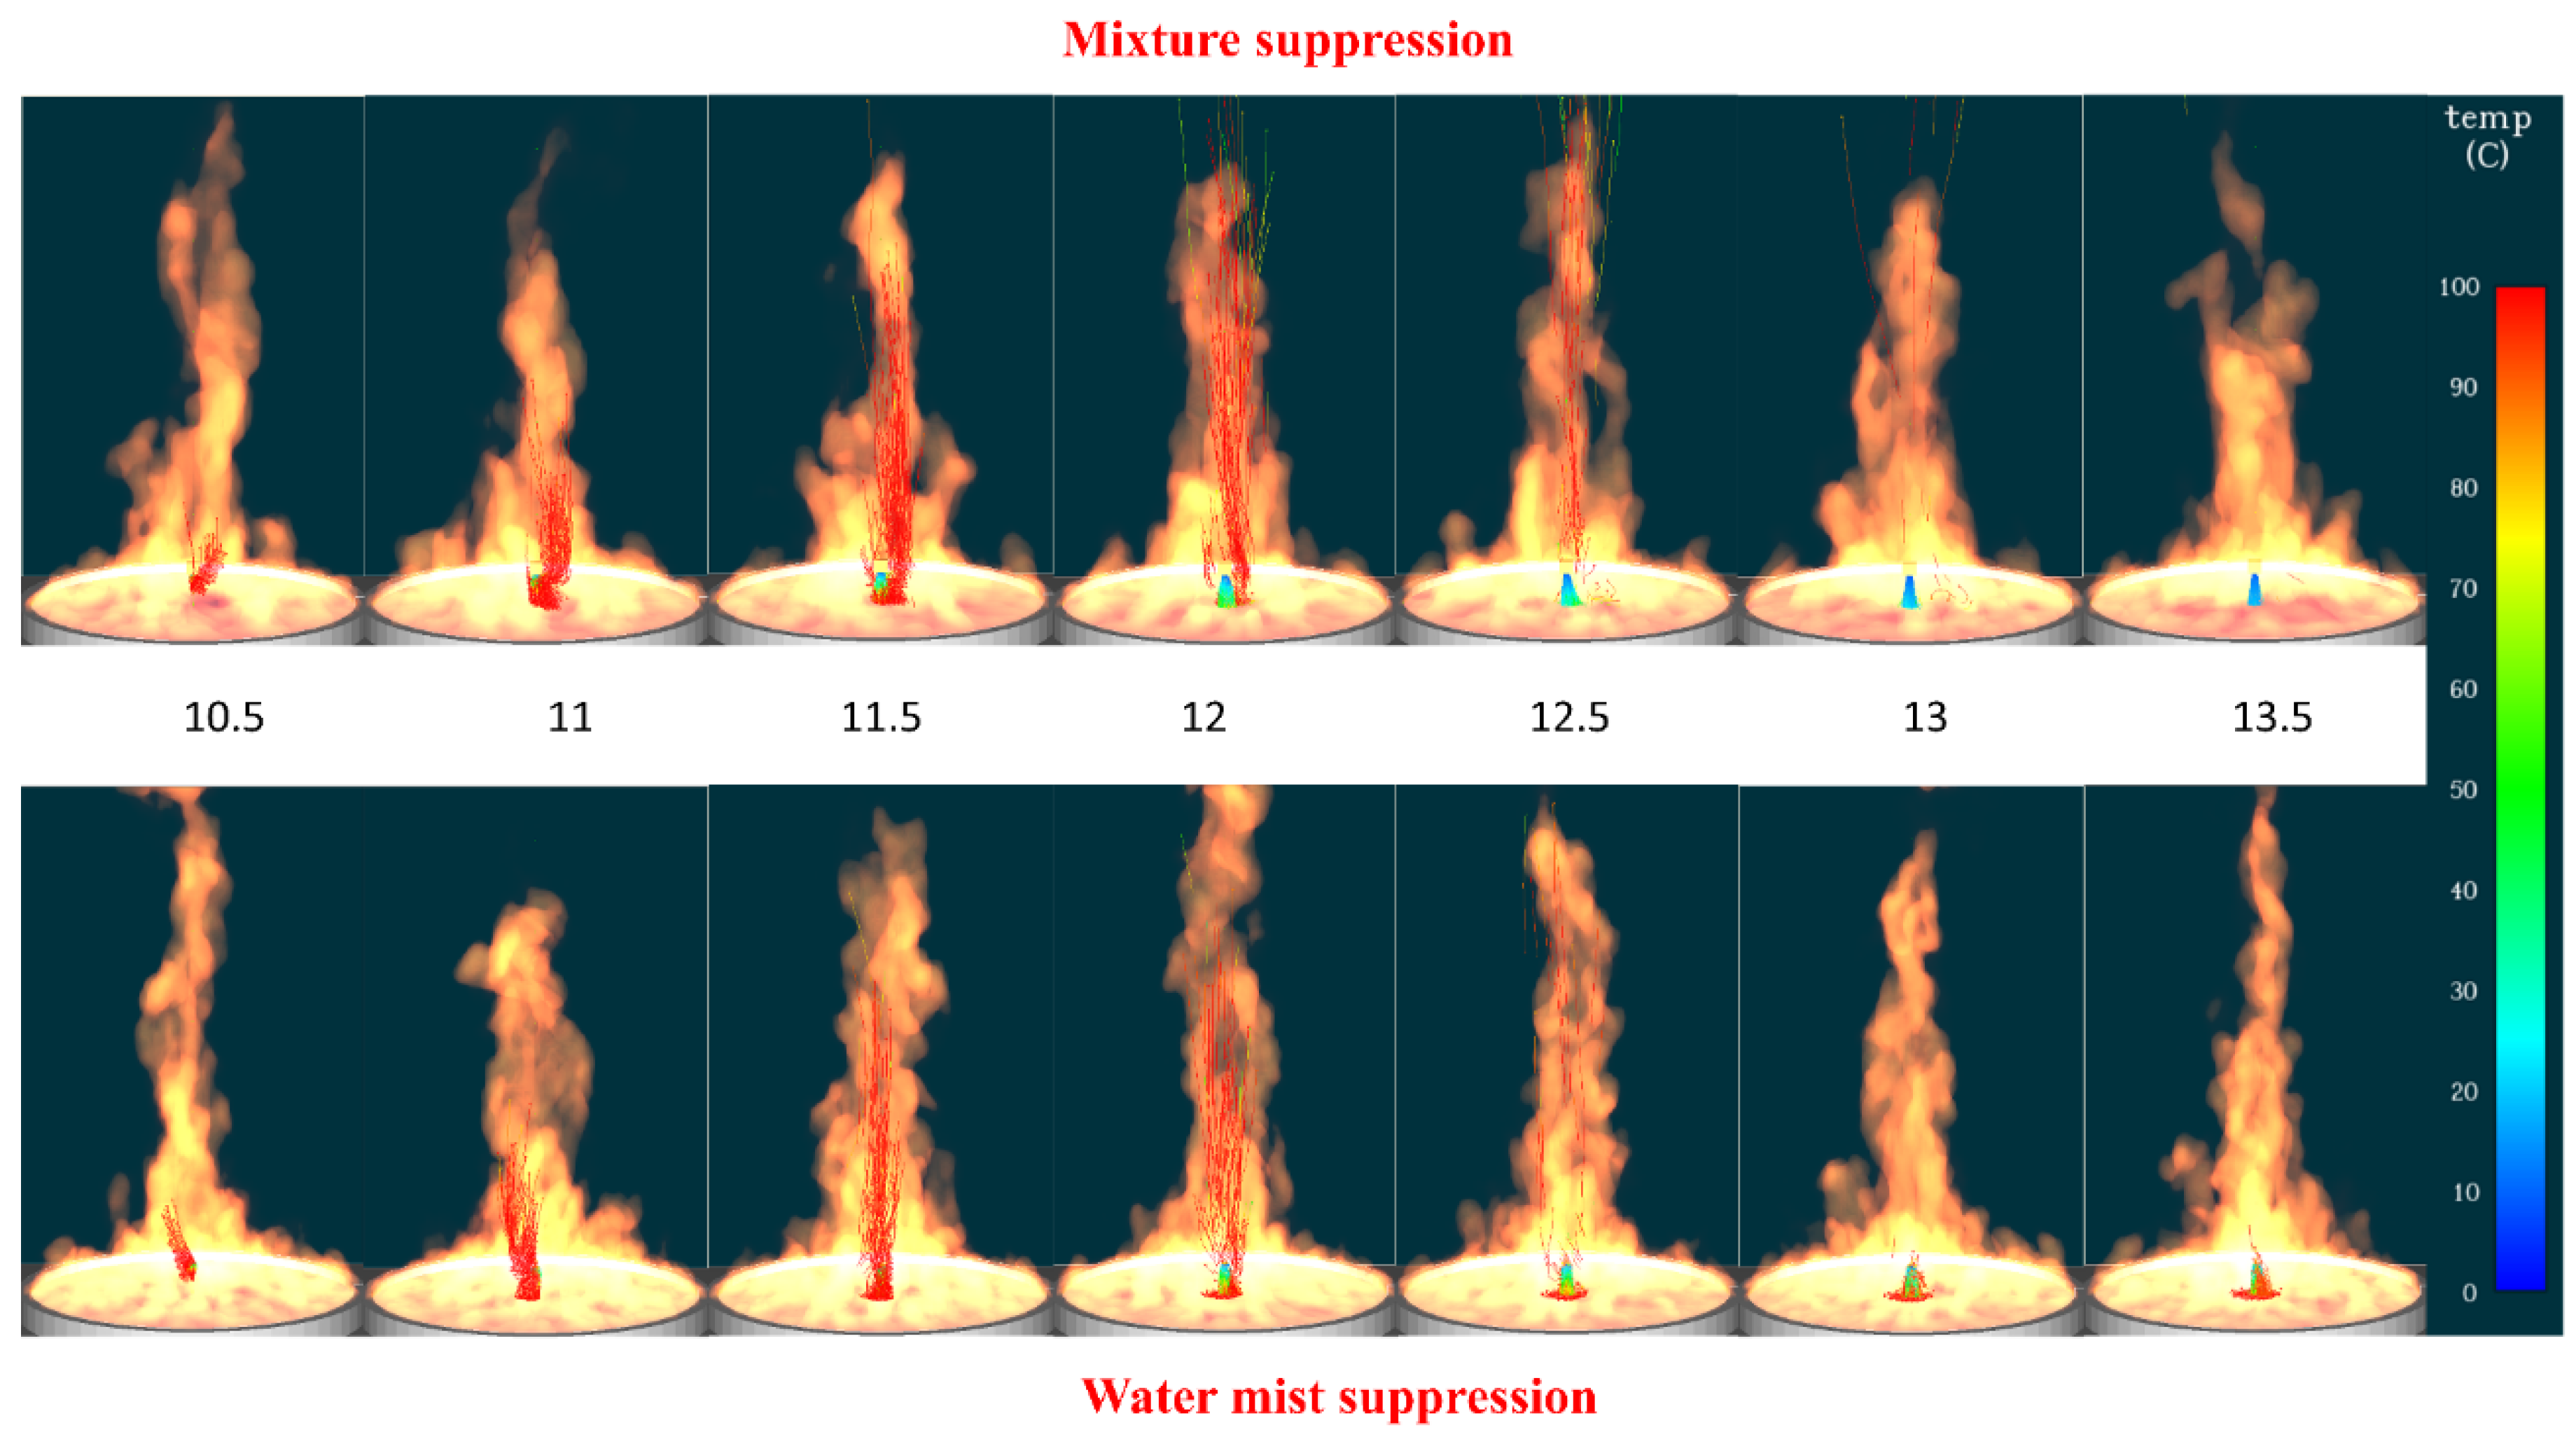
Figure 14. After a period of time, they start to cool down the fuel surface by evaporation cooling and temperature reduction. This phase change process of water results in a longer duration of time for complete suppression.
Figure 14 shows the movement of droplets due to the buoyancy force created by the fire. In this figure, the background, tank, and floor structure were cropped out of each picture and only the fire and fire suppressants were left to clearly observe the difference between them. The synergistic effect of mixture helps decrease the evaporation and movement of droplets in an upward direction (
Figure 14a). However, during the water, it is evaporated and thrown in an upward direction due to the buoyancy of the fire, then later suppresses the fire, as shown in
Figure 14b.
The implication of this finding is that the composition of the interaction was altered not only by the momentum but also by the influence of evaporation due to hot air on the droplets of water. During both of the suppression processes, the suppressing agents were set to be supplied continuously until the end of this process to illustrate that the pool fire was quenched and unable to release hot gases above the nozzle. Similar to radiation, the temperature around the vacant space over the nozzle behaves in the same way, which is in agreement with the ending of temperature after the suppression.
Figure 15 further shows the temperature variation above the nozzle during these two processes.
As we can see in
Figure 15A, during the fire suppression by mixture the temperature above the pool decreases drastically, which is due to the colder gas species of the suppressing agents after striking the fuel surface flow upwards due to the buoyant force created by the fire. In the case of water suppression, as shown in
Figure 15B, the water droplets after discharge start to evaporate at first, which provides the oxygen after evaporation and further increases the temperature.
Finally, in contrast to the mixture, the degradation phase of the fire was only longer during the fire control by water. The key distinction found between them, as discussed above, is the initial evaporation of water particles, which is the reason why the temperature falls continuously during the mixture suppression. The main advantage of using simulation tools is that in FDS we can trace the movement and temperature of particles along with the vanishing of those high temperature particles, which have been evaporated due to high temperature flames.
Figure 16 shows the droplet evaporation during both suppressing agents.
The high temperature droplets are shown in red and low temperature droplets in blue. The maximum temperature sustained by the water particles is also shown on the left of
Figure 16. As we can see in
Figure 16, the particles often evaporate and achieve high temperatures during the mixture suppression, but over a limited amount of time relative to water, which continuously evaporates and supplies the fire with abundant oxygen.
In the end, a numerical analysis was conducted for both fire suppressing techniques, which led to different outcomes. One is CO2, which has a really positive feedback over suppressing and removal of hot gases, temperatures, radiations, and surroundings. The limitations of this model are the fact that this modeling and simulation is validated on the basis of flame extinction parameters and mesh sensitivity analysis. Due to unavailability of the literature on this research area, as this is one of the first and unique studies on utilizing a hybrid suppression system, this model is only limited to the simulation. However, in the future, this work will be extended to a comparison with the experimental results.

 ,
, 


