Article

Calculations of Electrodynamic Forces in Three-Phase Asymmetric Busbar System with the Use of FEM

by
Michał Szulborski
1,*,
Sebastian Łapczyński
1,
Łukasz Kolimas
1,
Łukasz Kozarek
2 and
Desire Dauphin Rasolomampionona
1
1
Institute of Electrical Power Engineering, Warsaw University of Technology, 00-662 Warsaw, Poland
2
ILF Consulting Engineers Polska Sp. z o.o., 02-823 Warsaw, Poland
*
Author to whom correspondence should be addressed.
Energies 2020, 13(20), 5477; https://doi.org/10.3390/en13205477
Submission received: 23 September 2020 / Revised: 11 October 2020 / Accepted: 14 October 2020 / Published: 20 October 2020
(This article belongs to the Section A1: Smart Grids and Microgrids)

Abstract

:
Proper busbar selection based on analytical calculations is of great importance in terms of power grid functioning and its safe usage. Experimental tests concerning busbars are very expensive and difficult to be executed. Therefore, the great advantage for setting the valid parameters for busbar systems components are analytical calculations supported by FEM (finite element method) modelling and analysis. Determining electrodynamic forces in busbar systems tends to be crucial with regard to subsidiary, dependent parameters. In this paper analytical calculations of asymmetric three-phase busbar system were carried out. Key parameters, like maximal electrodynamic forces value, mechanical strength value, busbar natural frequency, etc., were calculated. Calculations were conducted with an ANSYS model of a parallel asymmetric busbar system, which confirmed the obtained results. Moreover, showing that a model based on finite elements tends to be very helpful in the selection of unusually-shaped busbars in various electrotechnical applications, like switchgear.

1. Introduction

The development of realistic design procedures involving busbar systems, responding to the mechanical loads associated with fault current impact, was a recurrent problem throughout the history of the power industry. A large number of studies have been done in order to assess how the busbars will withstand a stress corresponding to the instantaneous peak force due to short circuit currents. The approach adopted by NEMA (National Electrical Manufacturers Association) neglects the dynamic aspects of the problem and assumed that the stresses acting on busbars are directly proportional to the prevailing forces according to the Standards for Power Switching Equipment (SG6). Classical methods involving calculations of electrodynamic interactions in current circuits were created with intent to manually calculate those values with help of auxiliary graphical methods [1]. These methods are mainly used in the case of one-dimensional, straight-line busbars. Furthermore they are very effective in accordance to busbar testing. The accuracy of these methods is particularly high for current circuits feeding high voltage devices, due to the transverse dimensions being significantly smaller than the distance between the wires.
During calculations, individual configurations of busbars can be distinguished:
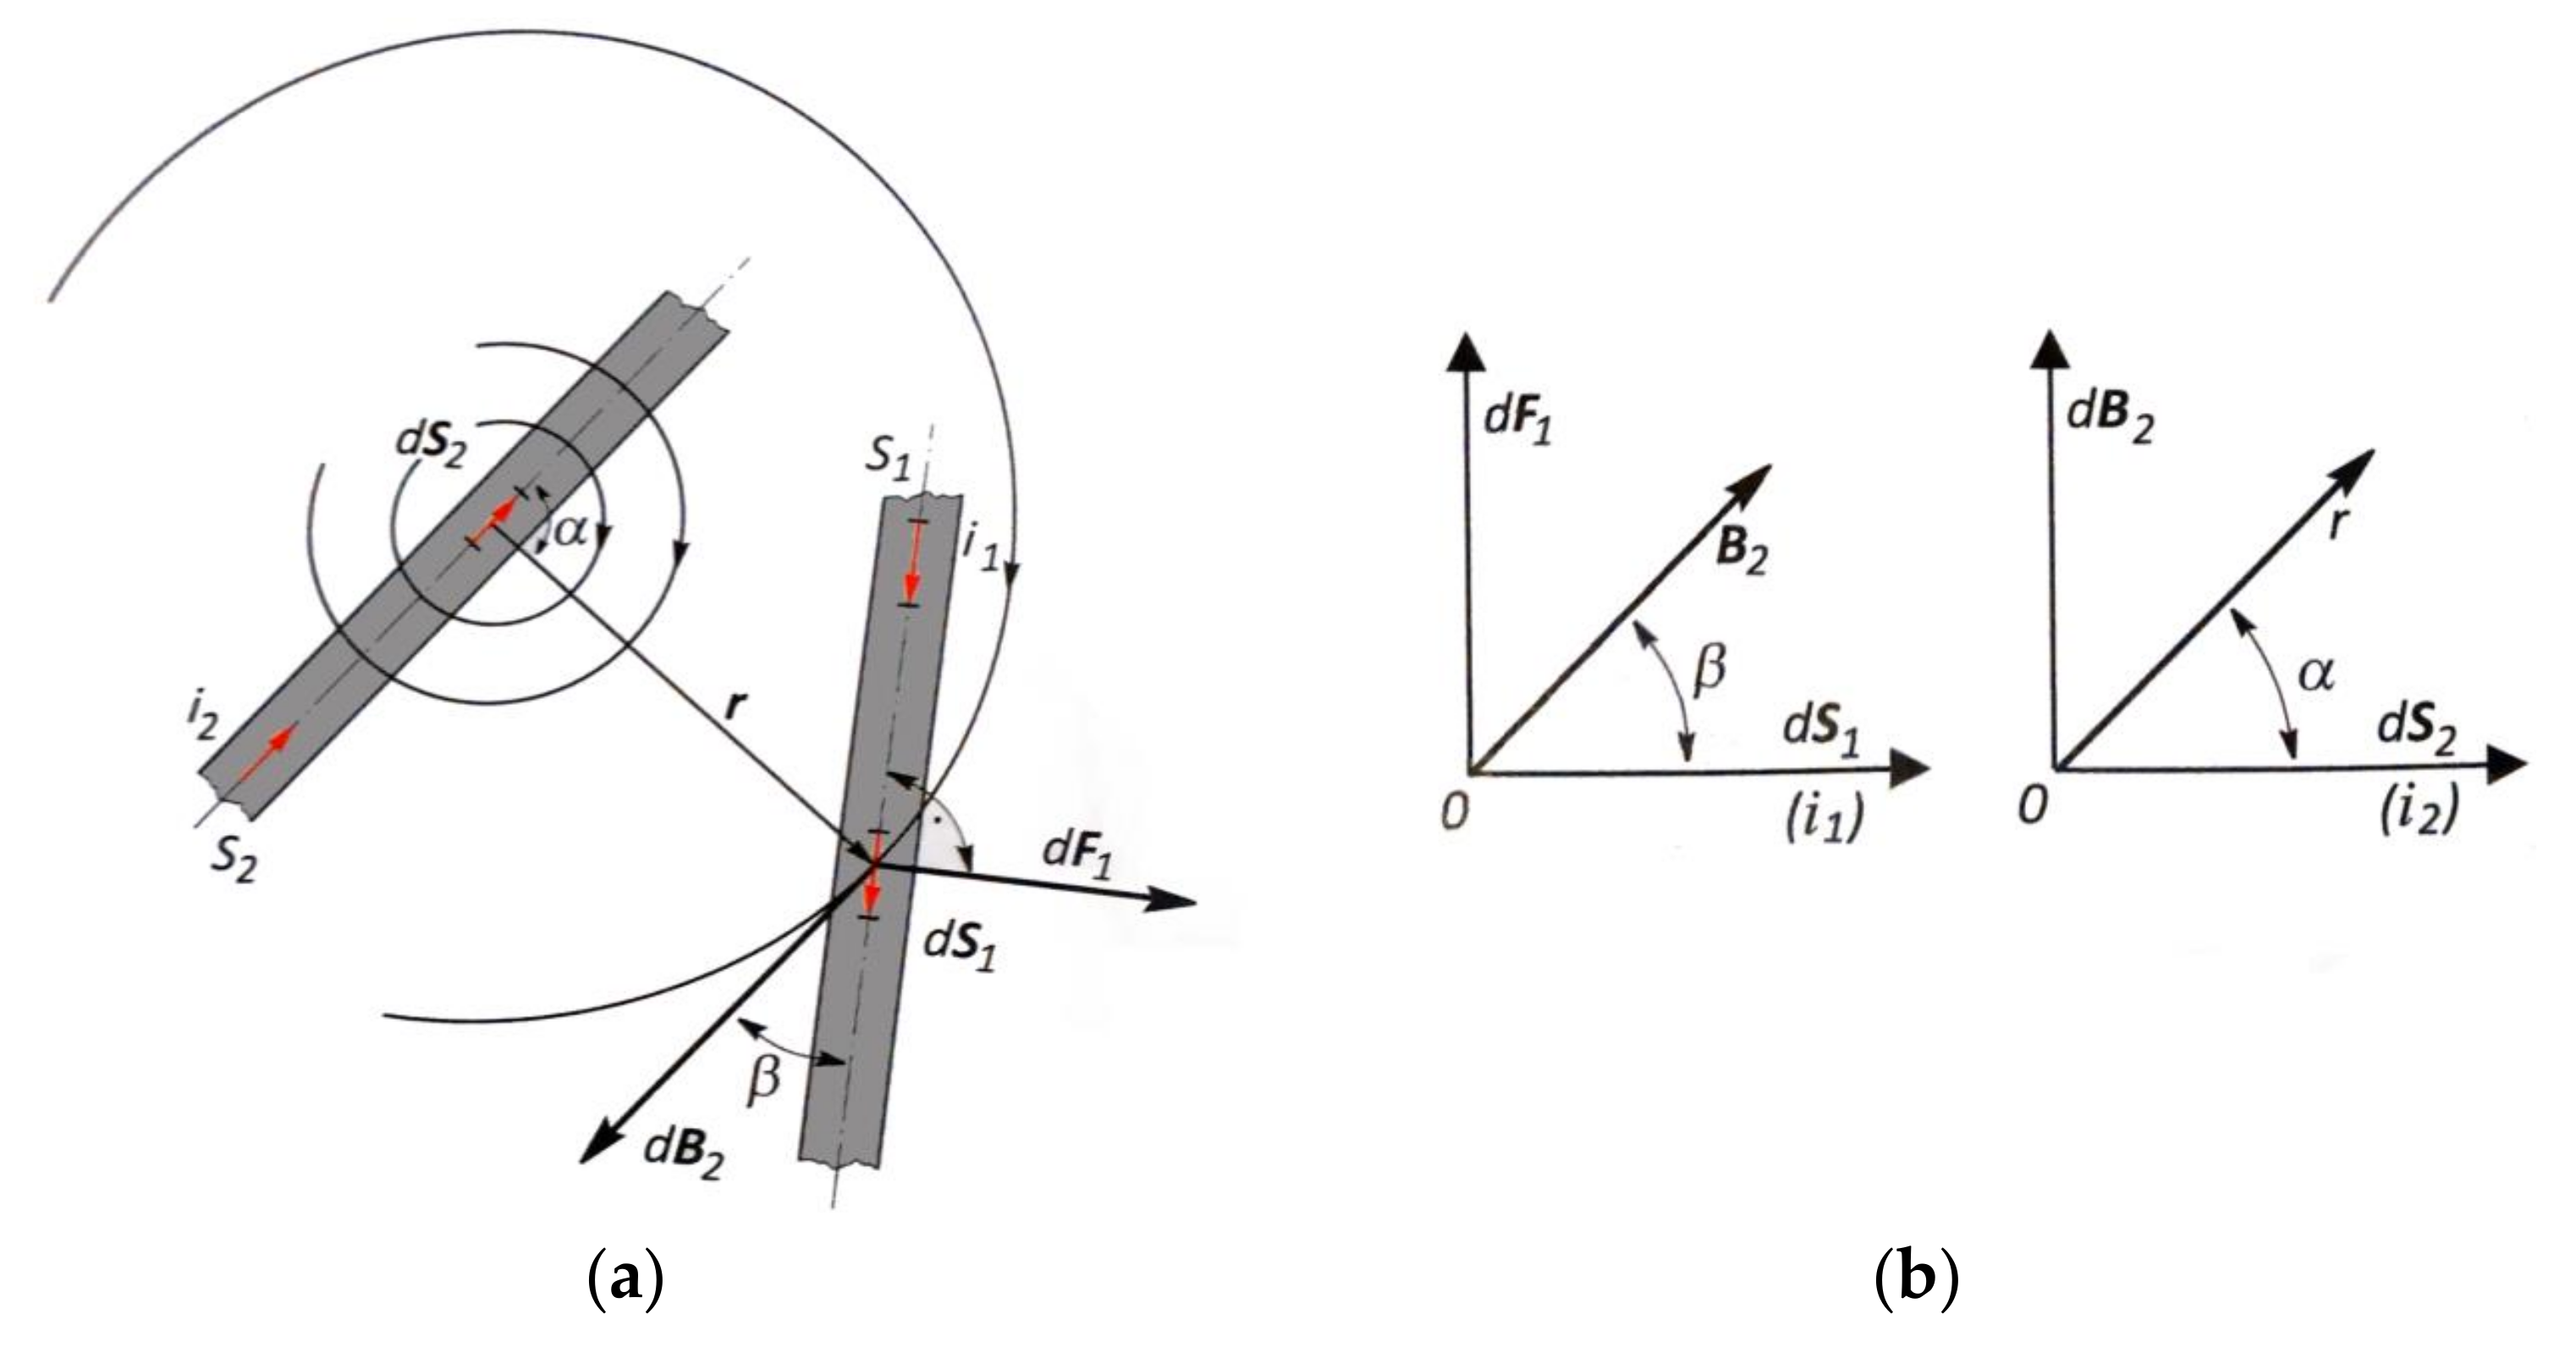
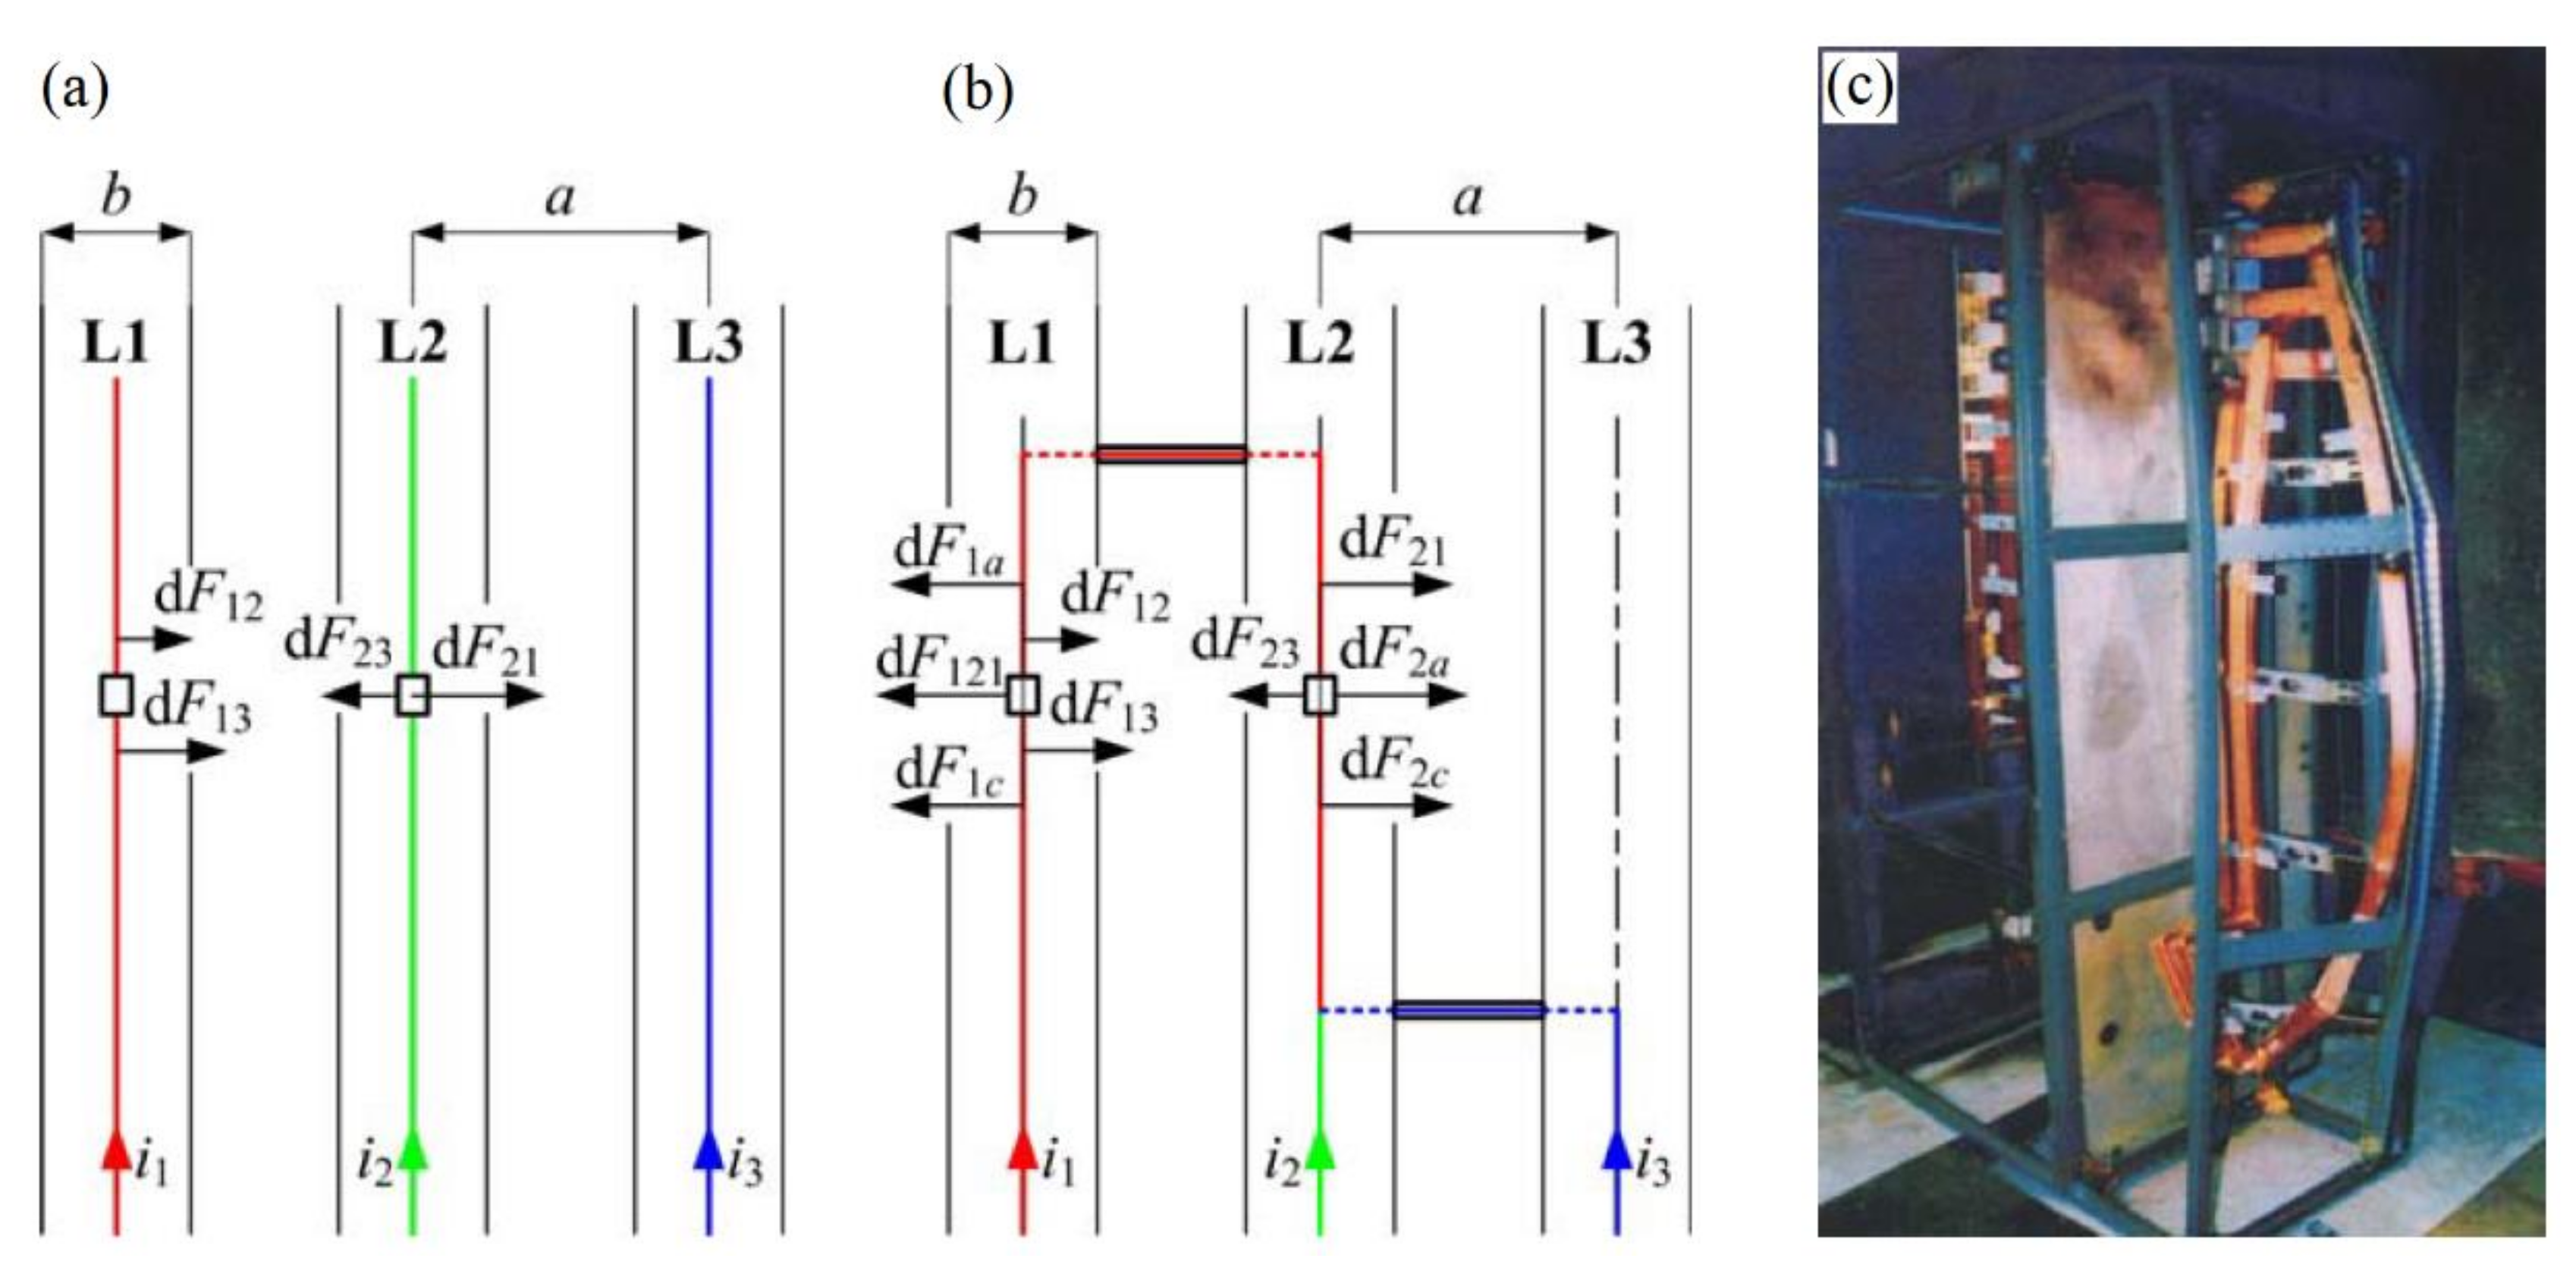
  • Layout of flat parallel busbars;
  • Layout of flat perpendicular busbars;
  • Layout of spatial perpendicular busbars.
The use of power distribution busbars in low voltage power system switchgears is highly advantageous. It is an exact way to conduct energy distribution with a problem-free possibility of its expansion in the case of adding additional apparatuses in place of reserves intended for additional devices. On the other hand, the installation of the main busbar at the rear of the switchgear allows for optimal heat dissipation resulting from the heating of the loaded busbars, as well as withstanding the greatest stresses in the event of a short circuit. To guide the busbars inside the switchgear, special insulators are used which are screwed to the supporting brackets of structures intended for this type of solution. In most cases, the rails are attached horizontally. Vertical busbar systems occurs when the rated current is below 4000 A and there are no movable and withdrawable elements. The distances between insulators are determined based on the requirements of the standards and short circuit currents that may occur in the switchgear. Busbars in switchboards with higher currents are a better choice than cables. This is due to the fact that the rails dissipate heat better and can conduct higher values of the load current. An important advantage is also the certainty of screw connections between the rails, as opposed to terminals crimped on the wires. Under the influence of electrodynamic forces, the conductor may break out of the cable terminal and touch other conductive parts, leading to a short circuit. The most commonly used busbar thicknesses for energy distribution in switchboards are 5 and 10 mm, while the widths are 20–100 mm. Most often, those are made of pure copper, which is reducing the skin effect and allows the conduction of higher currents by about 20%.
Unfortunately, analytical formulas used in classical methods can be very complex even in the case of investigating simple busbar layouts. A particular computational problem is the mathematical complexity of integrals. In order to make correct calculations, modern computer software and numerical methods (described below) are recommended. For example, the ANSYS environment is based on the finite element model (FEM) method [2]. FEM is characterized by a variational formulation, a discretization strategy, one or more solution algorithms and post-processing procedures. FEM is used, e.g., to calculate the electrodynamic force and its effect on the EIPB (enclosed isolated phase busbar) [3].
The second group of solutions used for calculations are called peripheral methods. These methods allow determining the electrodynamic interactions with regard to cross-section and current variability in both parallel and perpendicular layout of current circuits [4]. This method relies on replacing one busbar of heterogeneous current density by a series of separate smaller current circuits of constant current density [5]. The application of the Biot–Savart law gives the possibility of determining the magnetic induction at any point of space caused by the flow of current through the element of the conductor [6]. Furthermore, calculations of the magnetic induction value allow determining the electrodynamic forces acting in the conductor system [7], which is shown in Figure 1 below.
The magnetic induction in the system shown in Figure 1 can be determined using the formula:
d B 2 = μ i 2 4 π r 2 d s 2 r
where i2 is the current flowing through the current circuit; d s 2 is a vector, the length of which corresponds to the length of the conductor element, with the direction of the conductor and the return consistent with the direction of the flowing current; r is the distance of the conductor element from the magnetic field point; r is a vector which origin is the source of the magnetic field and the end is the chosen point in space.
The third group of solutions are numerical methods, such as FEM, finite difference method, finite volume method, boundary element method, etc. In a simplified manner, these methods rely on the division of the contemplated continuous area into a finite number of subareas and searching for an outcome in those sectors [8]. The solution is obtained by interpolating the derived results in any point of space [9]. The main difference between these methods is the way of searching for a solution by analysis and definition of boundary conditions. FEM is an approximate method for solving partial differential equations. In FEM, the studied area is divided into many subareas. Finite elements with a simple shape are derived, for example for a two-dimensional space—a triangular or quadrangular element. This procedure allows calculating the values in a section of a given system/model. The functions sought are being solutions of partial differential equations [10]. Those functions are approximated locally in each finite element using special continuous test functions determined uniquely by their values at certain points called nodes (nodes lie inside or on the element’s edge). An important coefficient for overall electrodynamic forces calculations (also natural frequency) is the Dwight factor [11]. The Dwight factor is used in case of parallel busbar arrangement with rectangular cross-section [12].
This work is consisted of analytical model (derived by classic calculations of electrodynamic forces) and numerical model (made using FEM) were compared in order to determine the best solutions for designing three-phase busbar system considering electrodynamic forces impact on the tested layout.
This manuscript includes the brief summary of work done by other scientist that was essential for concluded research in Section 2. The properties of busbar systems are mentioned in Section 3. Analytical calculations were procured for the chosen busbar layout and are presented in Section 4. Those calculations were confronted with the main part of the manuscript—the FEM simulations of an asymmetric three phase busbar system, which are presented in Section 5. The last section concludes the work gathering all of the knowledge coming from this research.

2. State of Art

Due to the increasing threats posed to human health, life and devices like switchgears, short circuit currents have been investigated with an emphasis on electrodynamic forces.
How important it is to build simulation models of busbars and distribution bars can be proved, inter alia, in publications [13]. Based on the thermal results, the authors calculate the dynamic stability of the EIPB (enclosed isolated phase busbar) to analyze the electrodynamic force under short circuit conditions [14]. A 2-D model was used for this purpose. In our discussion, a 3-D model is presented taking into account all electromechanical hazards (stresses of supporting insulators, natural frequency of the system and electrodynamic forces) [15]. Many scientists have studied the thermal stability of EIPB under short circuit current conditions [16]. Various scientists propose a method of calculating the busbar conductor temperature using the heat network analysis [17]. Analyses of the contact resistance of the busbar parts and calculations concerning the temperature rise generated by the resistance could be witnessed [18]. Other authors used experimental methods to check the reliability of busbar contacts and predicted the contact state on the basis of theoretical models [19,20]. Therefore, considering the effects of electrodynamic forces, temperature rise, and other factors, such as mechanical strength and the effect of a short circuit conditions on the busbar is analyzed [21,22,23].
However, most of these methods are based on the very small size of the rails which are no longer than 5 m, the test object is small and has a simple structure. In this work, the validation of the analytical model using the 3-D model of busbars with contacts and load bars is presented. Due to the complex structure of the power system network, actual EIPBs are often large with complex structures and it is difficult to directly calculate the dynamic stability. The finally presented FEM model is applicable to insulated rails in various environments. On this basis, the design and implementation of low-voltage switchgear was successfully carried out. The presented results enable a correct selection of the rails not only from the point of view of the current carrying capacity, but also considering the electrodynamic capacity. A solution enabling the validation of analytical calculations, the implementation of different, often complicated current circuits in relation to the calculations of simple rectangular or circular current circuits were presented. The model enables the determination of values for scientific and engineering calculations. It has been shown that the selection of power supply and receiving current circuits can be performed not only from the current load side. Not only was the skin effect taken into account, but also the current displacement and the natural frequency of the system.
In low voltage switchgears, small insulation gaps between the busbars of individual phases are sufficient, and the level of short circuit currents is similar to that in high voltage switchgears. The problem of electrodynamic stresses on rails is therefore more pronounced in the former, although the mitigating circumstance is the smaller distances between the rail fixing points. The rules for dimensioning rigid rails with regard to electrodynamic loads in short circuits are specified in the standard (IEC 865-1 Short circuit currents—Calculation of effects). The calculations are quite complex and based on such simplifications that their practical usefulness is too low. When developing the concept of a new series of switchgears, these calculations form the basis for initial design solutions, which are then verified in the short circuit laboratory. The author’s team works on a daily basis in the short circuit laboratory of the Warsaw University of Technology, Institute of Electrical Power Engineering, and conduct work in the field of design and testing of switchgear devices. Multicore cables and other insulated conductors, suitably selected for their thermal short circuit capability, generally also withstand the electrodynamic forces associated with the flow of short circuit current. Due to the small thickness of the insulation, and therefore smaller distances between the axles of the conductors, the electrodynamic forces in cables and other low-voltage cables—with the same value of short circuit current—are greater than in high-voltage cables. Validation may be needed in the case of extremely high short circuit currents (over 60 kA) that are switched off in a short time (less than 20 ms), but without any limiting effect, i.e., with passing the expected value of the surge short circuit current [24]. Electrodynamic exposures must also be taken into account when choosing the construction principle and assembly technique of the heads and cable joints.
In the absence of a simulation model, a number of laborious and time-consuming works related to the determination of the maximum withstand forces are performed. This applies to both the current circuits and the insulators (Figure 2).
It is worth noting that with such an approach, additional tests are carried out by designing current circuits and switchgear devices. The analytical model is the correct application of the dependencies from the electromagnetic fields supported by the dependencies from the IEC 60609 standard for short circuit currents. The novelty of the procured work is presented in the following:
  • Global approach to the model of electrodynamic forces in switchgears (model not only is presenting parallel current circuits, but a real system of rails with contacts);
  • Consideration of an unfavorable case (the currents contains asymmetries), analytically countable only with a high approximation (not meeting the design requirements for such currents in practice). Therefore the numerical model is a novelty that is able to omit tedious calculations with better results;
  • Reference to the design of switchgears from the angle of calculating electrodynamic forces, not only the current carrying capacity of the busbars, which is very rare.
  • Limitation of oversizing (in the case of the cross-section of the current circuits) and frequent underestimating in calculations (in the case of supporting insulations), or vice versa, in the case of low-, medium-, and high-voltage secondary circuits of the switchgear.

3. Properties of Busbar Systems

3.1. Mechanical Vibrations in Busbar Systems

Busbars exposed to electrodynamic forces are also exposed to mechanical vibrations also occurring during this phenomenon. The amplitude of these vibrations depends on many factors, which include, among others: the way the busbars are placed, the type of material they are made of and the number of insulation supports installed. The worst case that could happen is when the natural frequency of the busbars coincides with the frequency of changes in forces affecting their system. For this reason, the natural frequency of the busbar should be offset from the frequency of mechanical excitations resulting from electrodynamic forces. The most dangerous case may occur during the appearance of resonance characterized by the system’s own vibrations equal to [26]:
fo = 2 · f
where fo is the system natural vibration; f is the frequency of current change; 2f is the frequency of changes in periodic (non-disappearing) components.
In order to determine the permissible natural frequency of the busbar system the following dependency (3) shall be used. Furthermore it is obligatory to choose a frequency value that is outside the following interval:
fo = (1.7 − 2.4) · f
The properly determined busbar natural frequency should be outside the specified incorrect ranges. In case the calculated frequency does not correspond to the above assumptions, the system parameters should be adjusted in such a way as to detune the natural frequency of the tested rail from the resonance frequency. Table 1 presents the relevant formulas for determining the correct operating frequency for busbars firmly fixed at both ends. After substituting parameters related to the cross-section of the busbar, the natural frequency of the current circuit is obtained. Different calculations are made for multi-frequency systems where the mounting of rails and brackets is flexible.
It is possible to determine the natural frequencies of a given rail by taking into account the coefficients responsible for the particularities concerning the shape of the current circuits analyzed. In this case the following formula is used [27]:
f o = f oo · c 1 · c 2 · c 3
where foo is a natural frequency of a simplified system; c 1 is a coefficient that allows to take into account the influence of spacers used to connect individual rails in a multi-strip system; c 2 ,   c 3 is a factor that allows stiffness, weight, and cable routing to be taken into account.

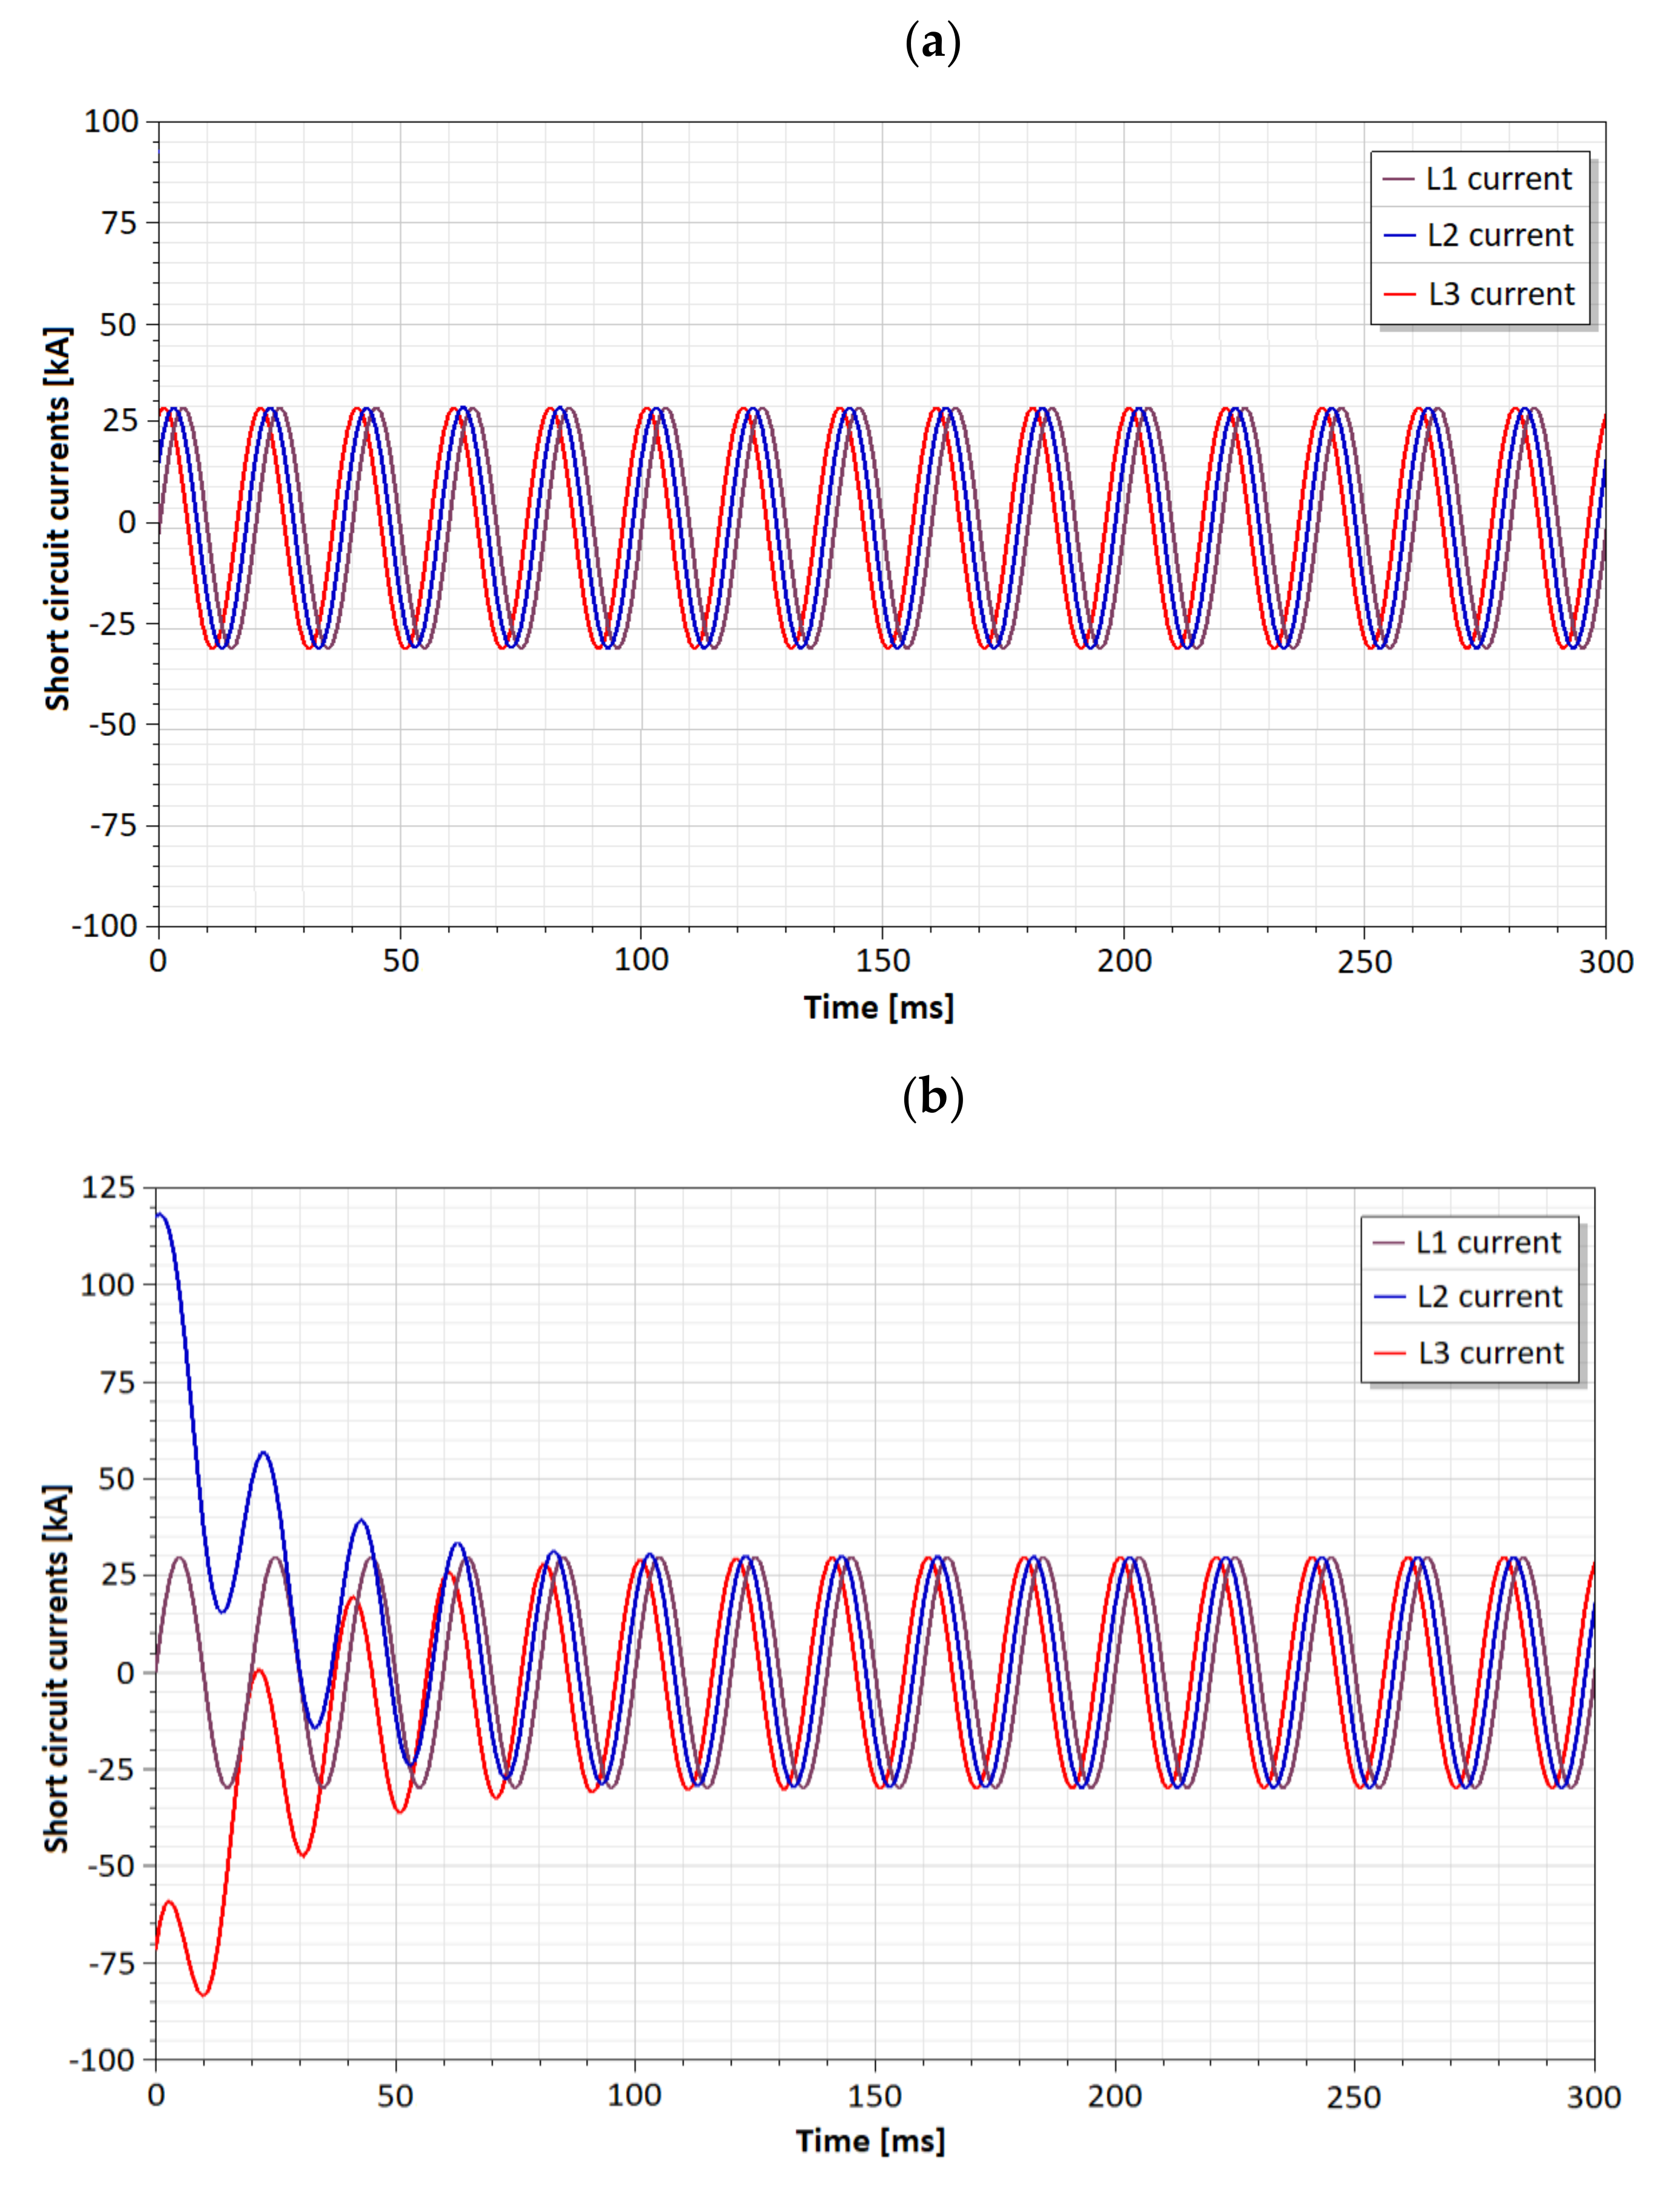
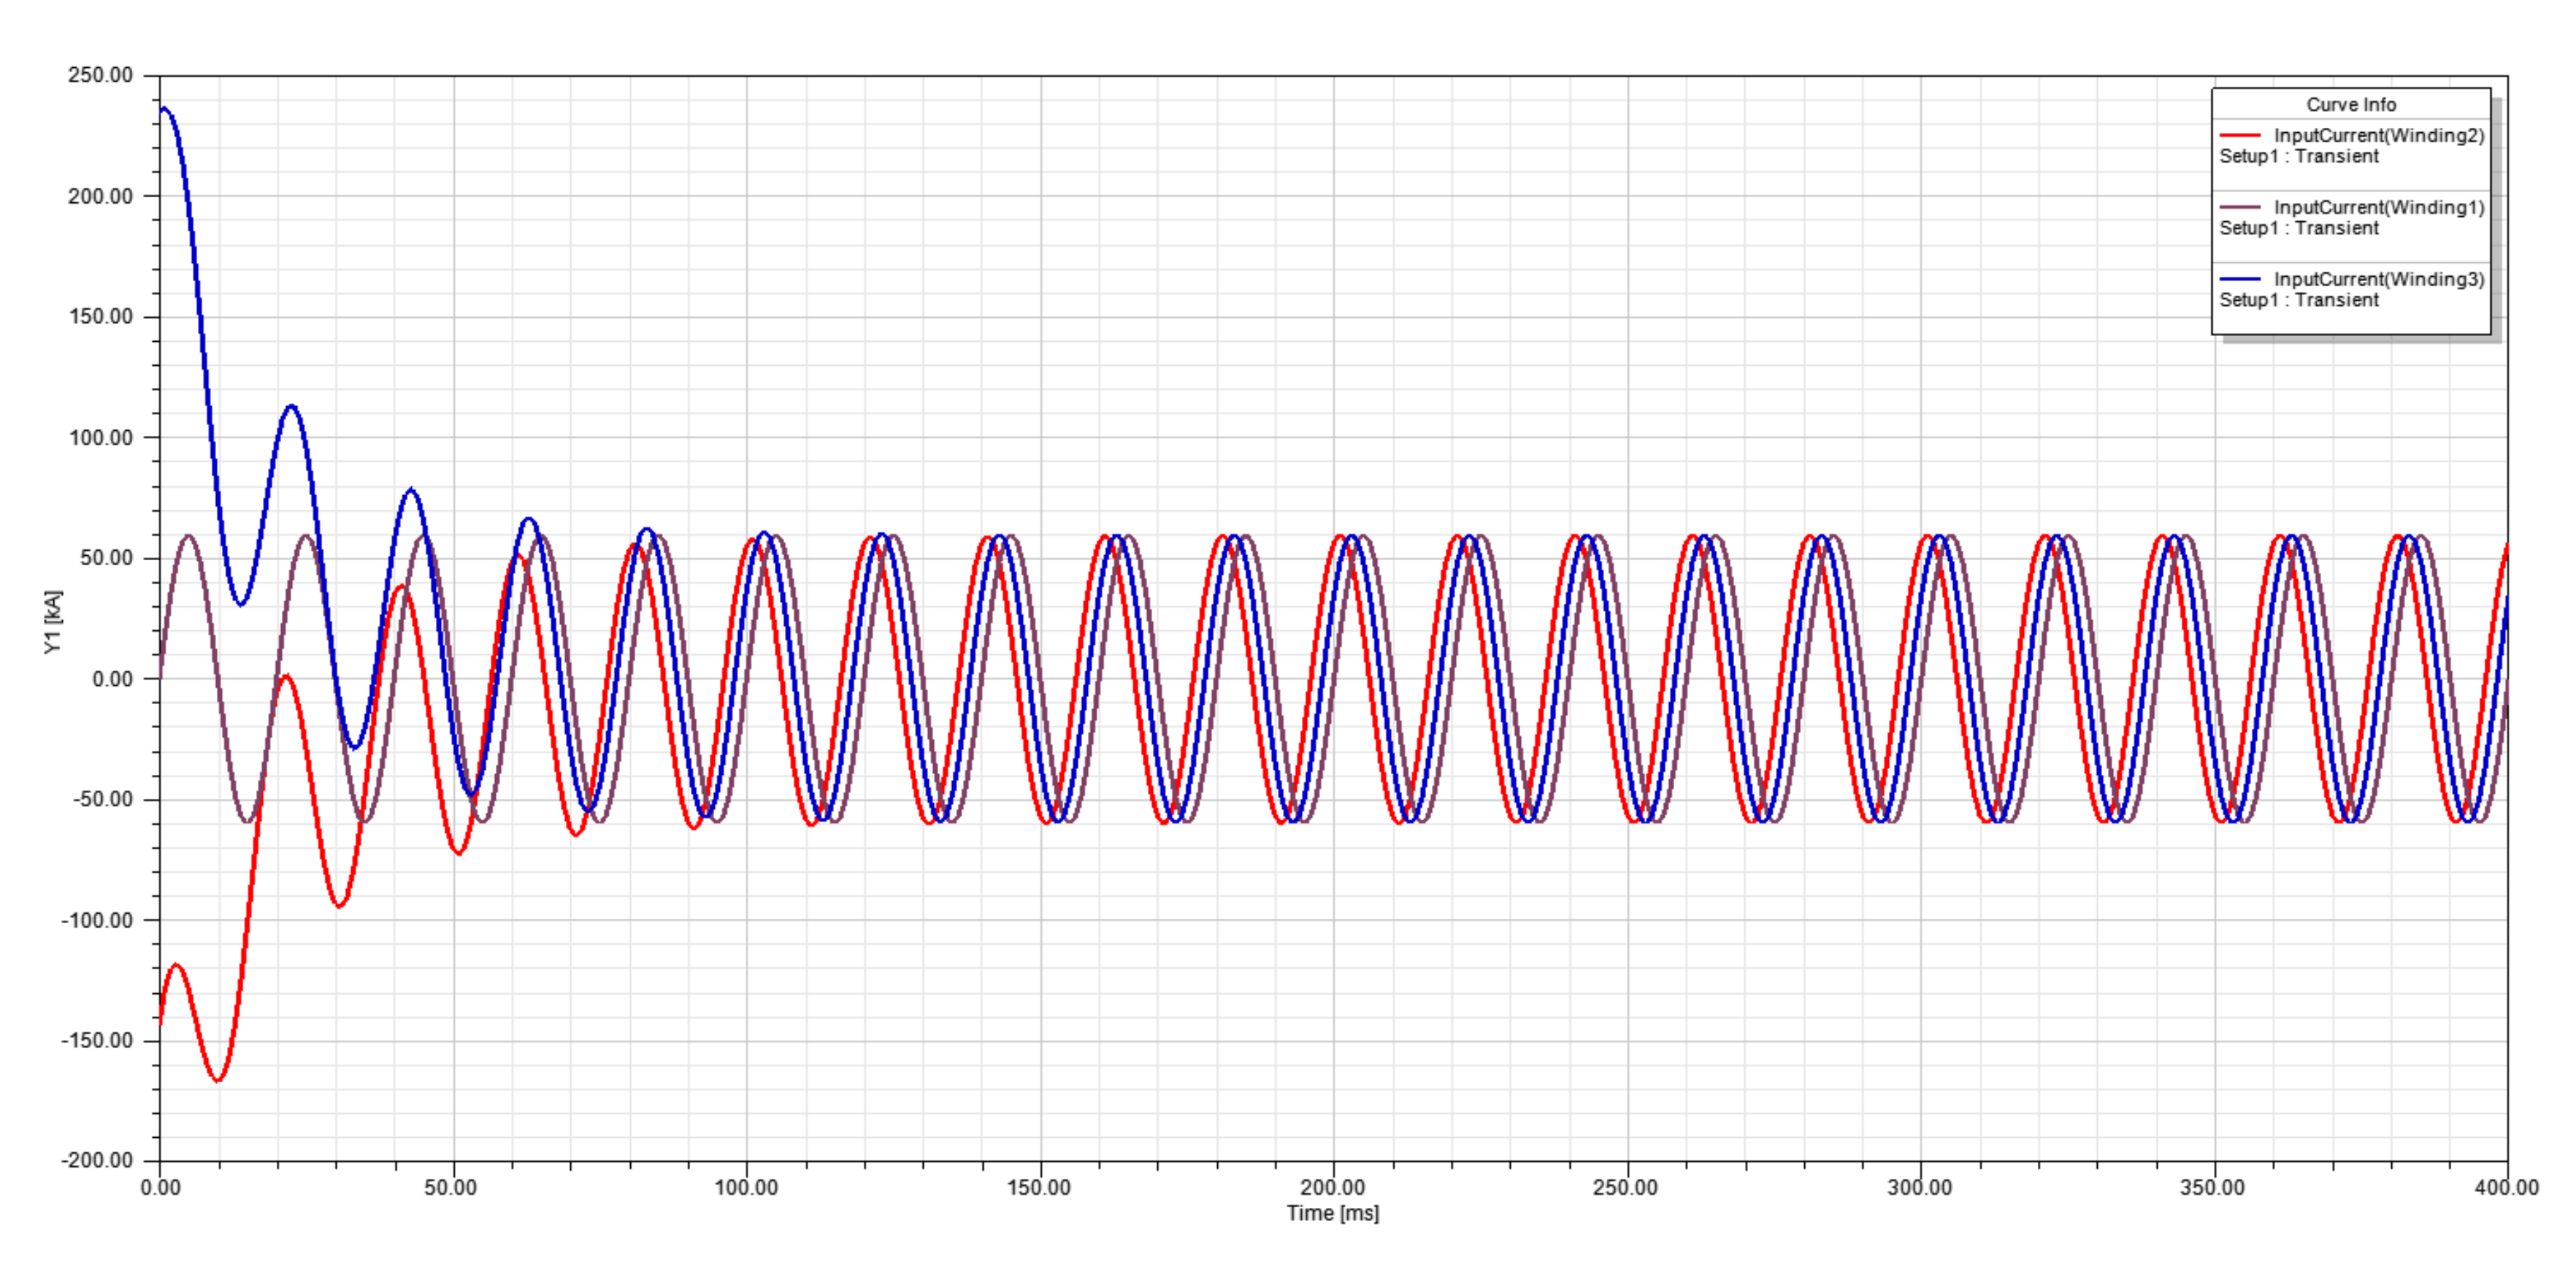
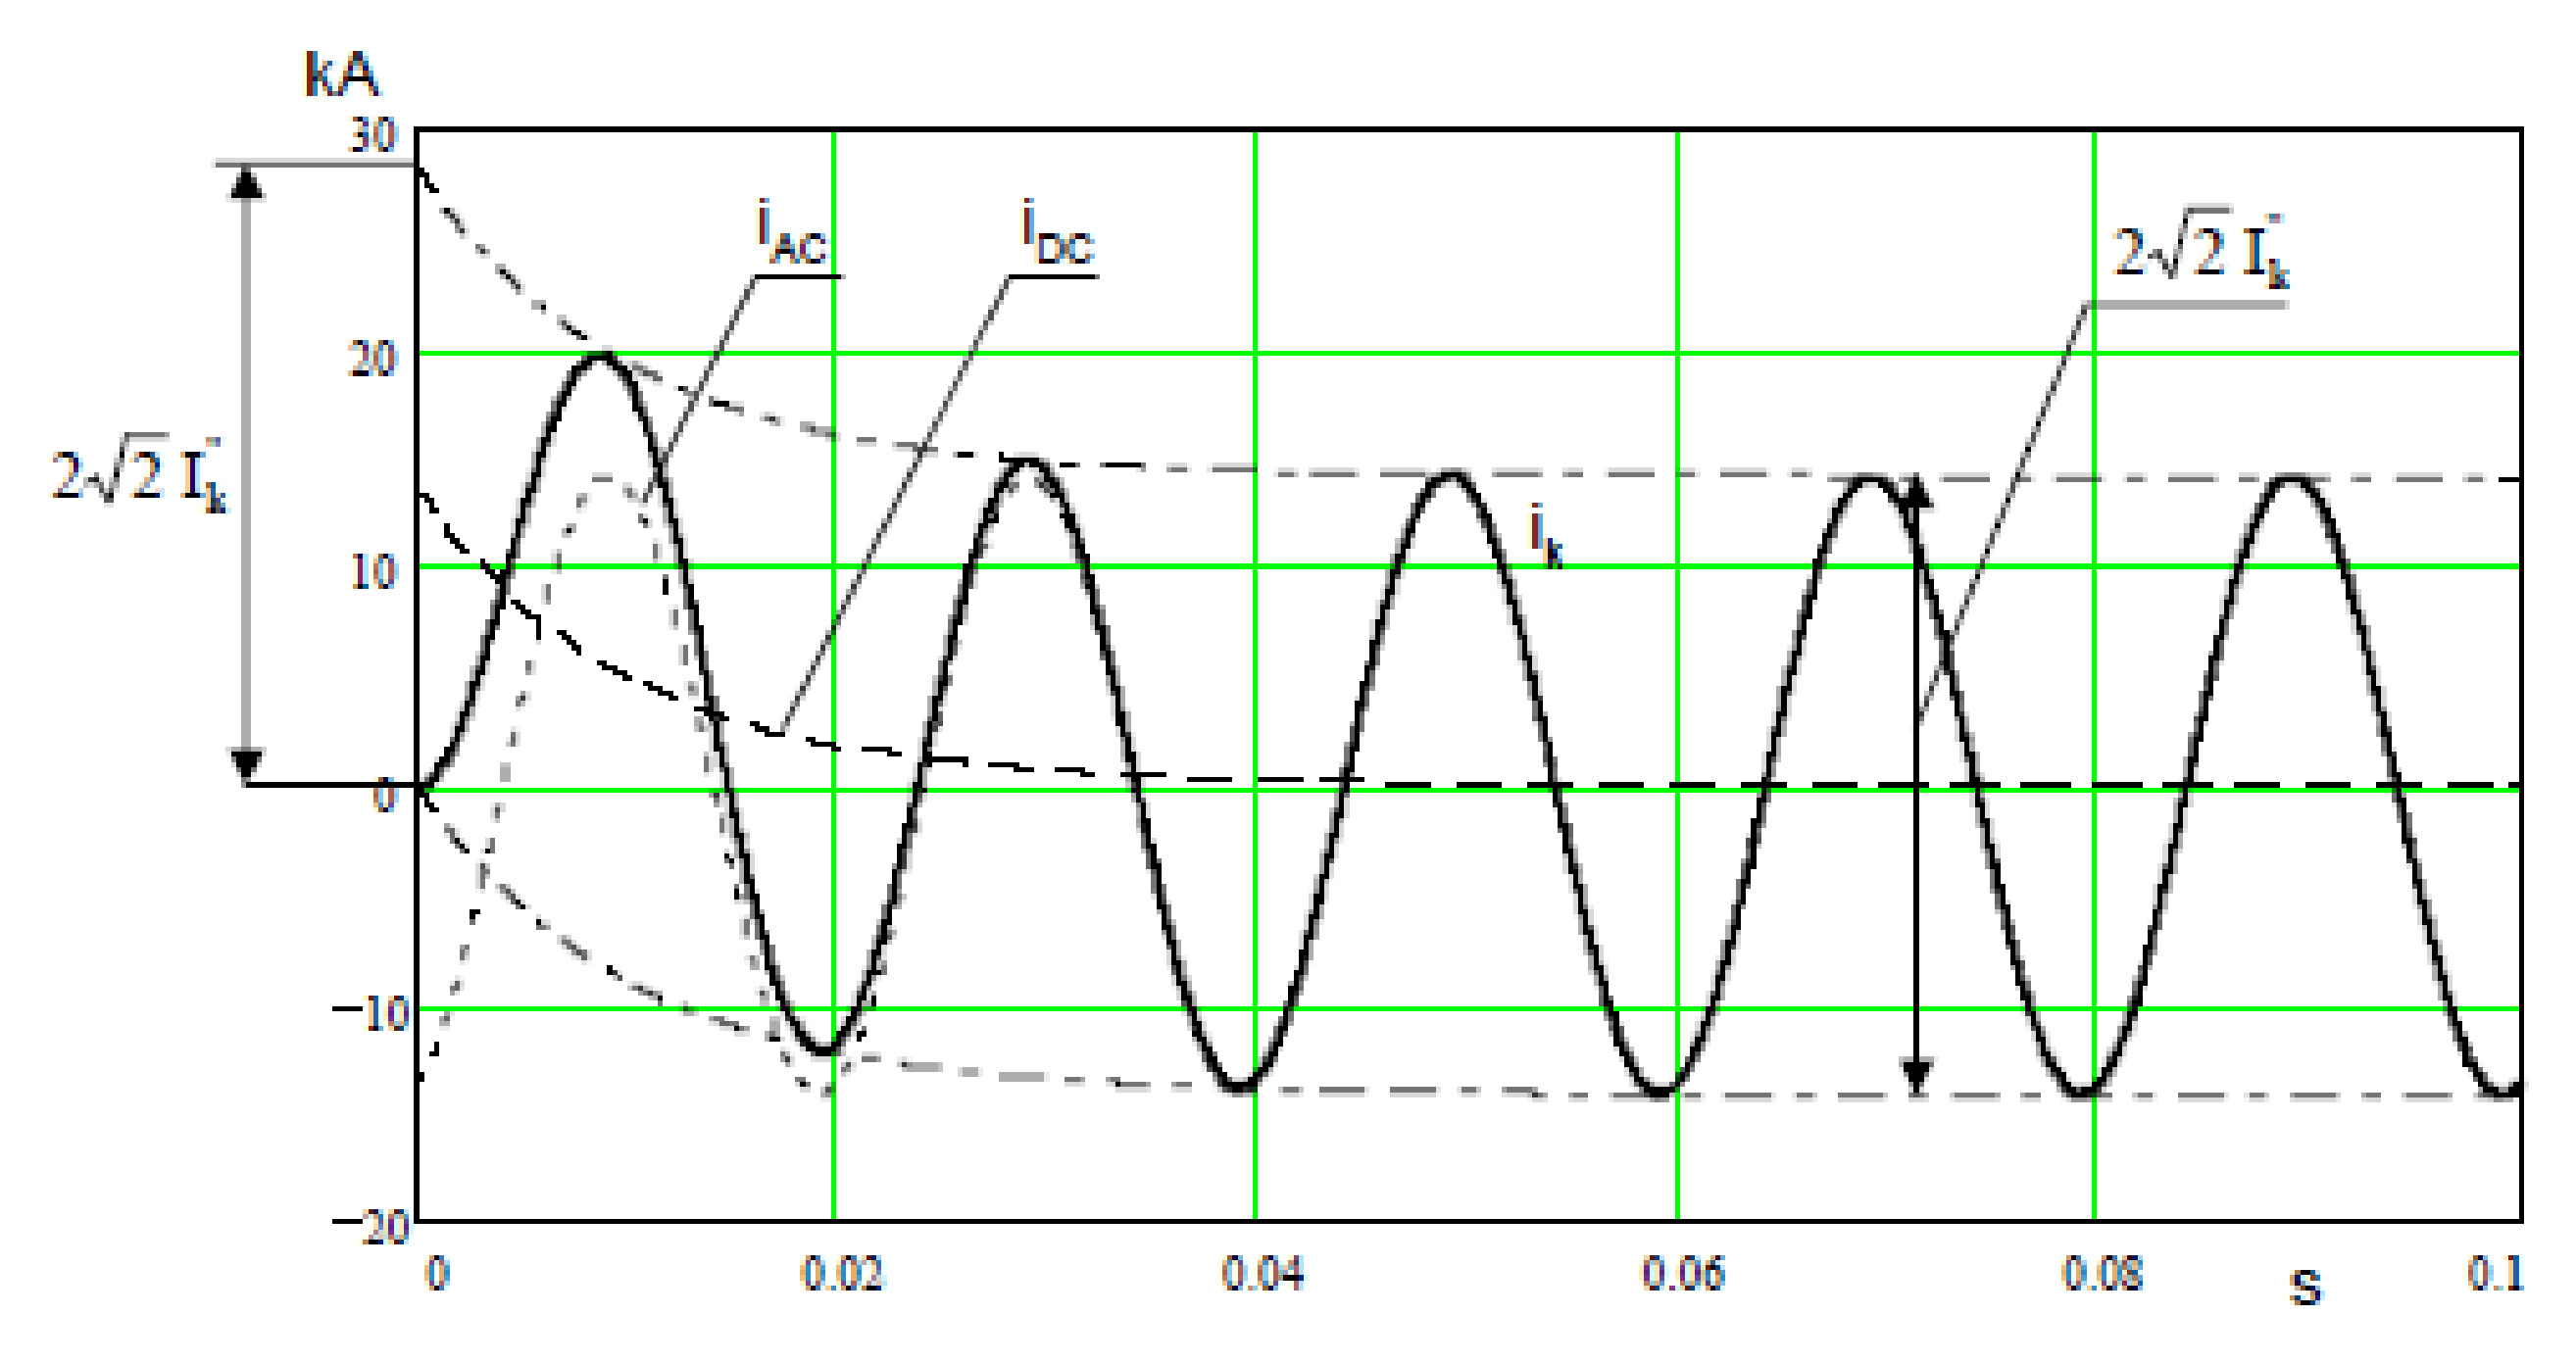
3.2. Short Circuit Currents

While studying electrodynamic forces, the possibility of short circuit occurrence must be considered. An accidental connection between individual phase conductors or between a phase conductor and earth is called an electrical short circuit. A short circuit may occur directly through an electric arc or through a component with low resistance. This phenomenon is generally harmful and/or undesirable. There are several types of short circuits, including symmetrical (for example three-phase or three-phase with earth) and asymmetrical (single-phase, two-phase, and two-phase with earth) short circuits. We can also classify certain short circuits according to their frequency of occurrence in given power systems. However, when calculating the electrodynamic forces, regardless of the frequency of occurrence, we must take as the basic scenario the short circuit, which has the most harmful effect on the system. The occurrence of a short circuit is usually associated with a current that is much higher than the current under normal operating conditions. The increasing value of electric current contributes to the heating of the devices and to the increase of interactions derived from electrodynamic forces. Therefore, it is necessary to use devices with increased protection values against short circuits, resistant to the risks of mechanical damage in the event of a much higher current flow than in normal periods.
The course of the short circuit current is variable both during the direct current flow and in the case of AC circuits, so it is particularly important to take into account the impact of changes in the value of short circuit currents in the transient state during calculations. The short circuit current contains two very distinct components: a periodic component iok and a non-periodic component nos. The RMS value of the periodic component is constant throughout the duration of the short circuit, assuming that the RMS value of the electromotive force of the circuit and the value of the short circuit impedance do not change significantly. The non-periodic component, on the other hand, has a certain initial value that disappears exponentially with the circuit time constant of T = L/R. Figure 3 is an example of a short circuit current waveform showing the shape of the characteristic, taking into account the periodic and non-periodic components (assuming constant amplitude of the periodic component).

3.3. Short Circuit Current Calculations

In order to determine the circuit parameters that allow safe operating conditions to be maintained during a short circuit, calculations of electrodynamic forces should be made assuming the most unfavorable short circuit scenario associated with the currents with the highest possible intensity. In general, such conditions occur during a symmetrical three-phase short circuit and in this case the basic diagrams are shown in Figure 2. The initial symmetrical short circuit current I k that represents rms value of the AC symmetrical component of a prospective short circuit current can be calculated from the formula [27]:
I k = c · U n 3 · Z k + Z
where U n is rated voltage; c is voltage factor that represents ratio between the equivalent voltage source and the nominal system voltage U n divided by 3 ; Z k is an abbreviated expression for the positive-sequence short circuit impedance for the calculation of three-phase short circuit while Z = 0.
Based on the determined value, the so-called initial current can be calculated. Maximum initial symmetrical short circuit depends strictly on highest voltage for equipment (line to line RMS value) and can be describes as [27]:
U m = c m a x · U n
where c m a x is a voltage factor that represents maximum short circuit current for a three-phase short circuit.
Assuming the value c m a x   = 1.1, the value of the initial symmetrical short circuit current can be expressed as [27]:
I k = 1.1 · U n 3 · Z 1
Due to the occurrence of a non-periodic component, the peak short circuit current can reach much higher values than the peak value of the periodic component. In the event that the short circuit occurs when voltage passes through zero (for phase angle voltage equal to 0), the peak value of the short circuit current reaches the highest possible value and is called the surge current. The surge current is the maximum achievable short circuit current used in electrodynamic calculations. The spoken value can be determined from the following formula, taking into account the calculated initial short circuit current value [27]:
i p = κ · 2 · I k
where i p is maximum possible instantaneous value of the prospective short circuit current; κ is a surge factor for the R/X ratio obtained from Figure 3 or calculated by the following expression [27]:
κ = 1.02 + 0.98 · e 3 · R / X
The use of the surge factor κ in the formula makes it possible to include in the calculations the attenuation of the non-periodic short circuit current component over time until the appearance of the overvoltage current. The value of this coefficient can be selected on the basis of the following characteristics shown in Figure 4 below.

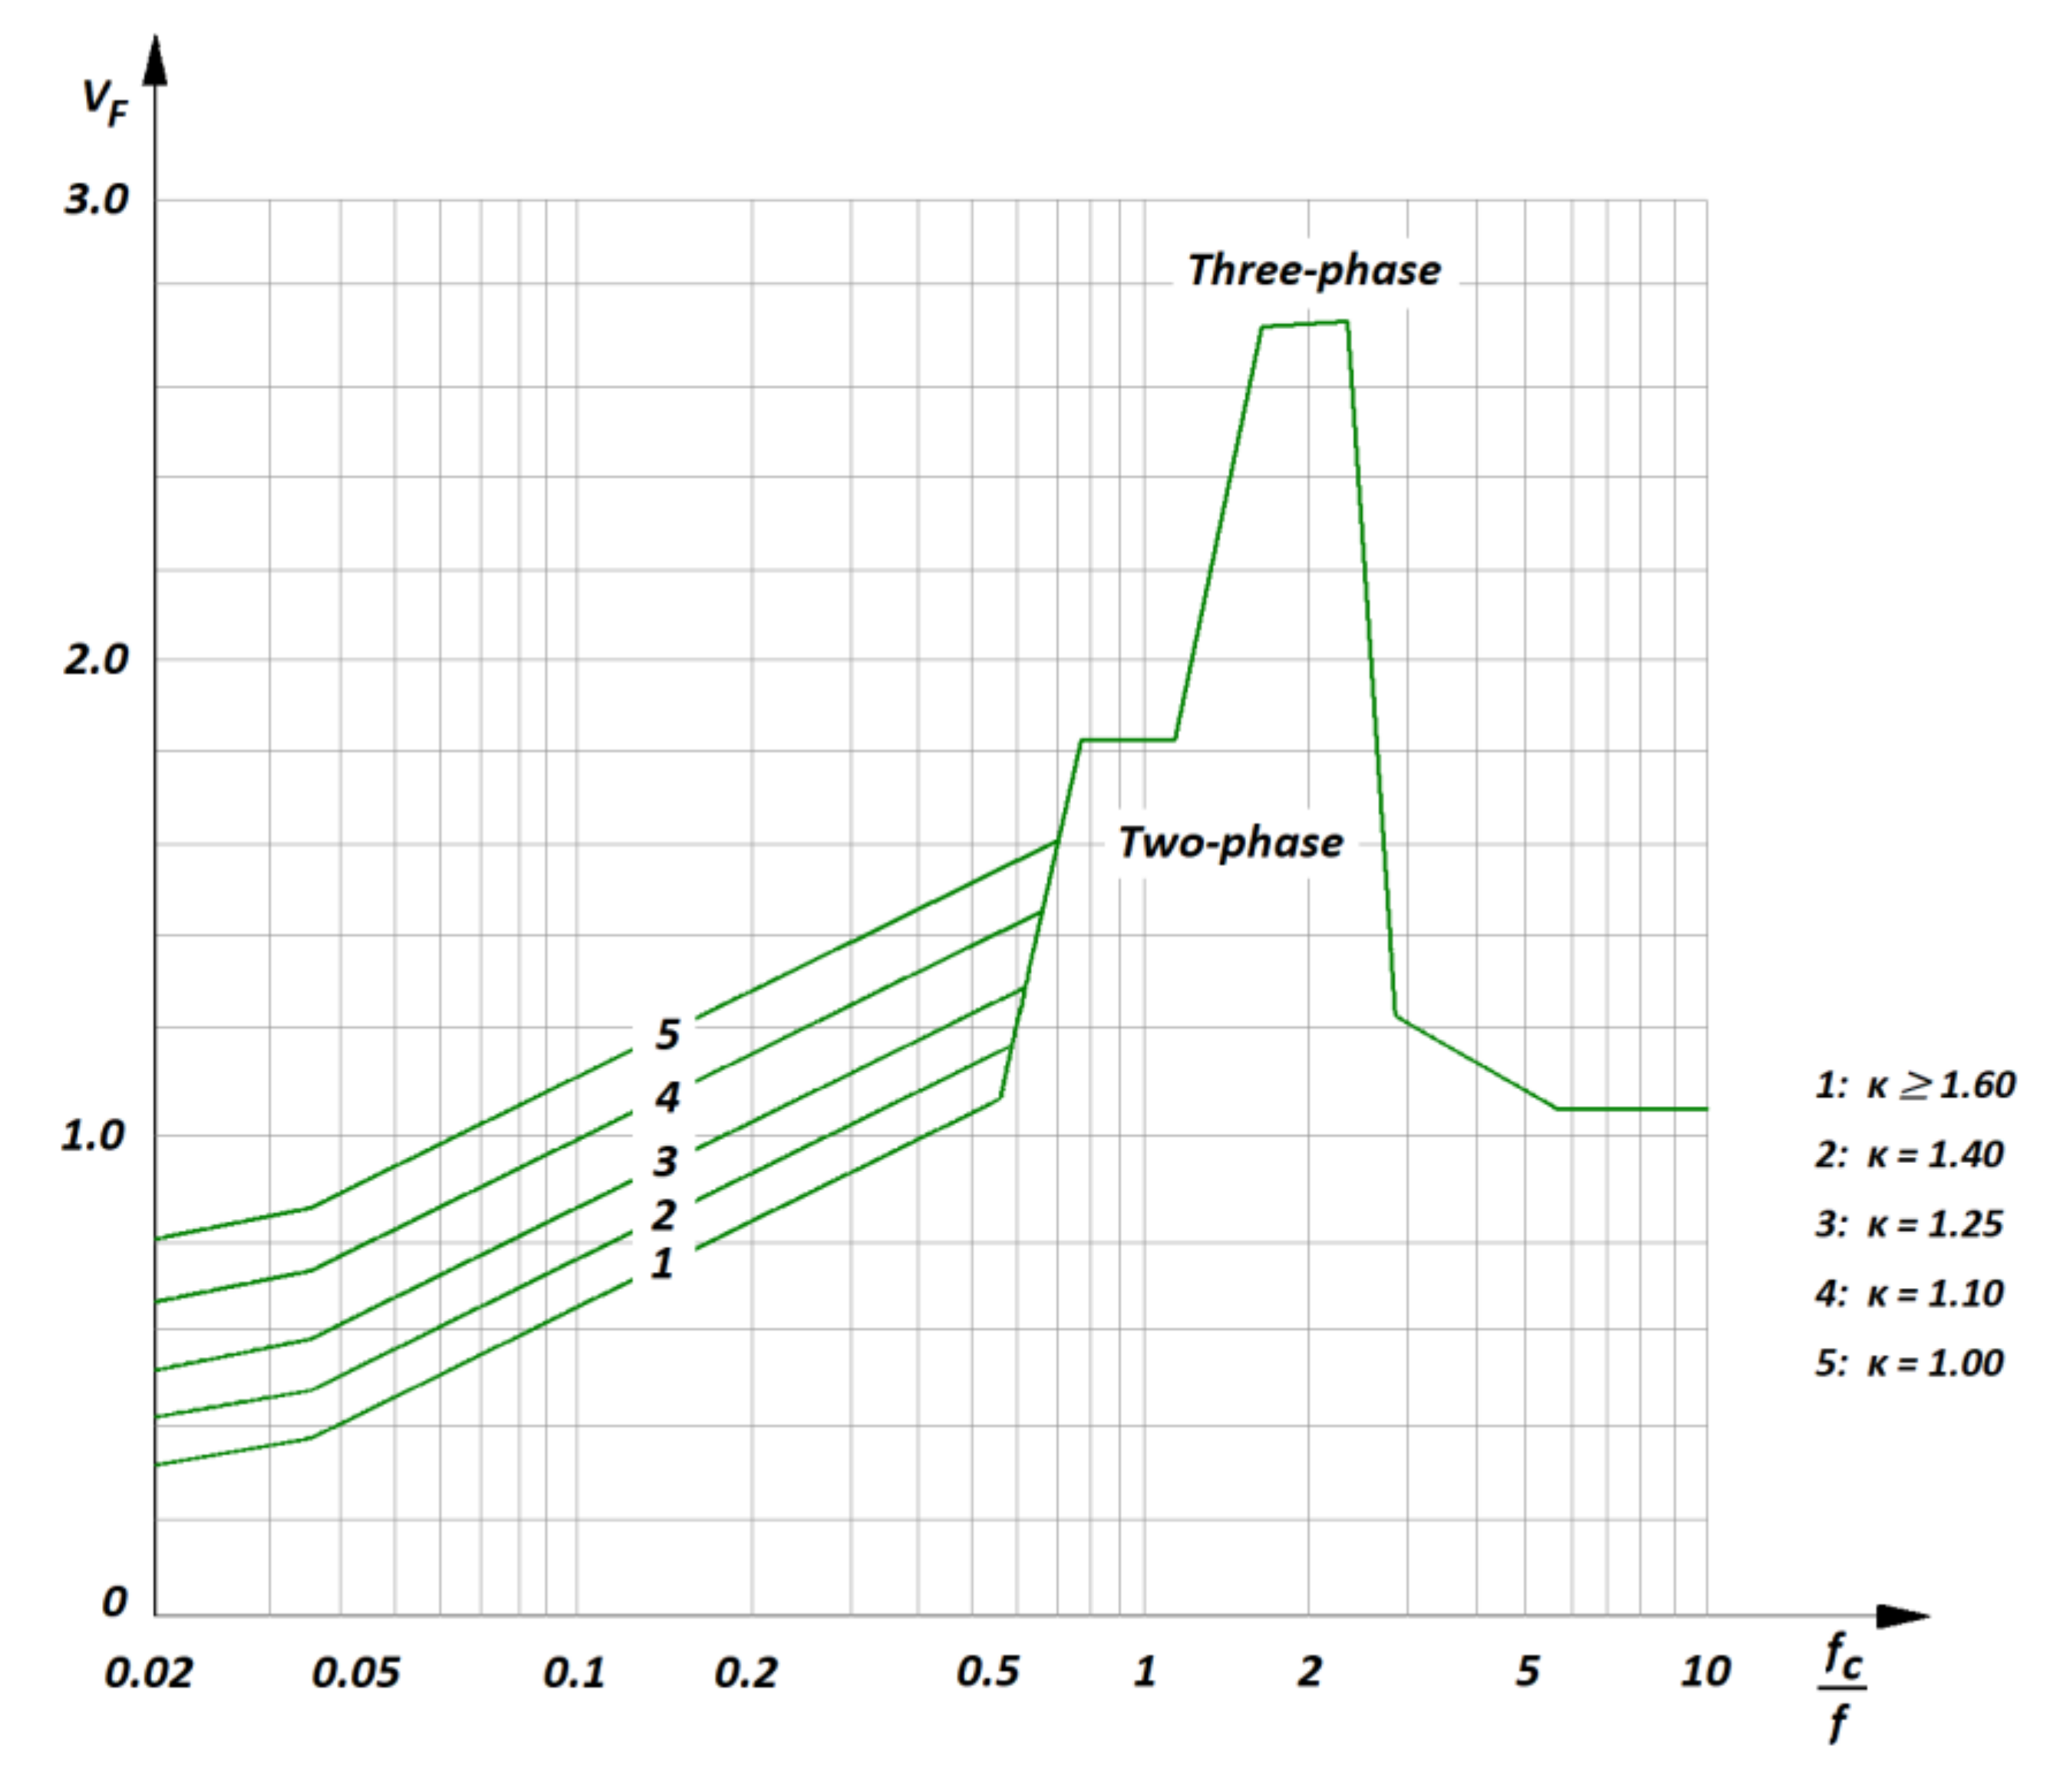
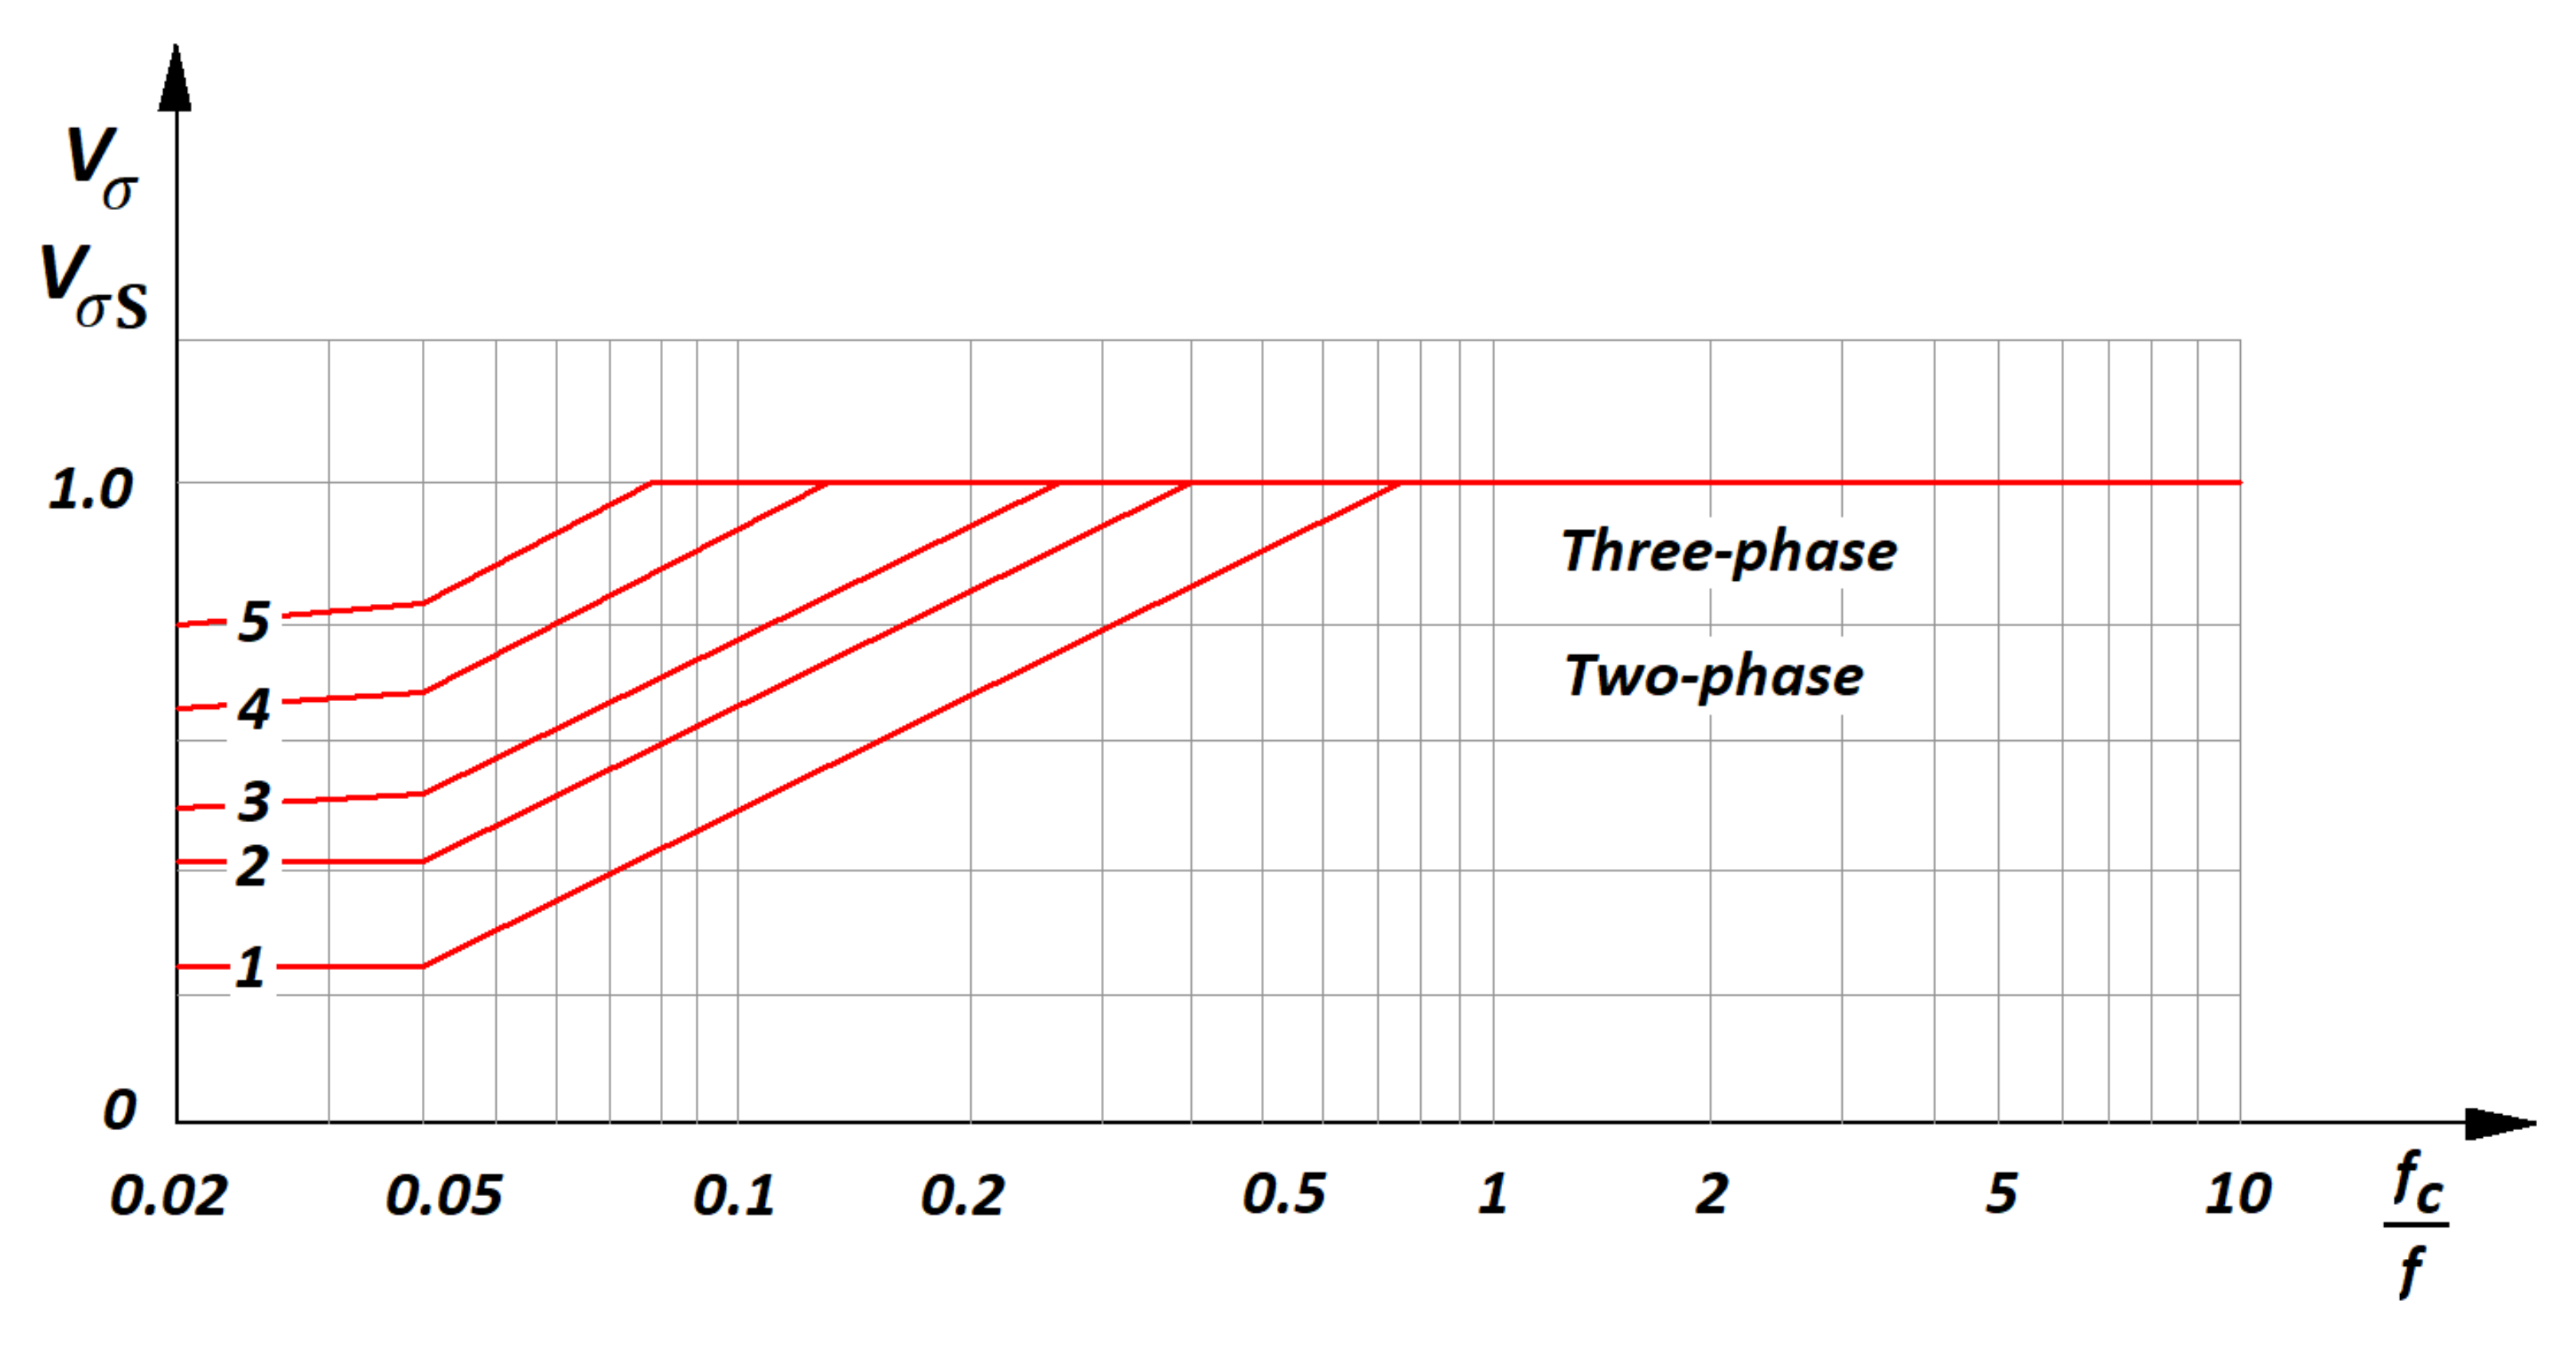
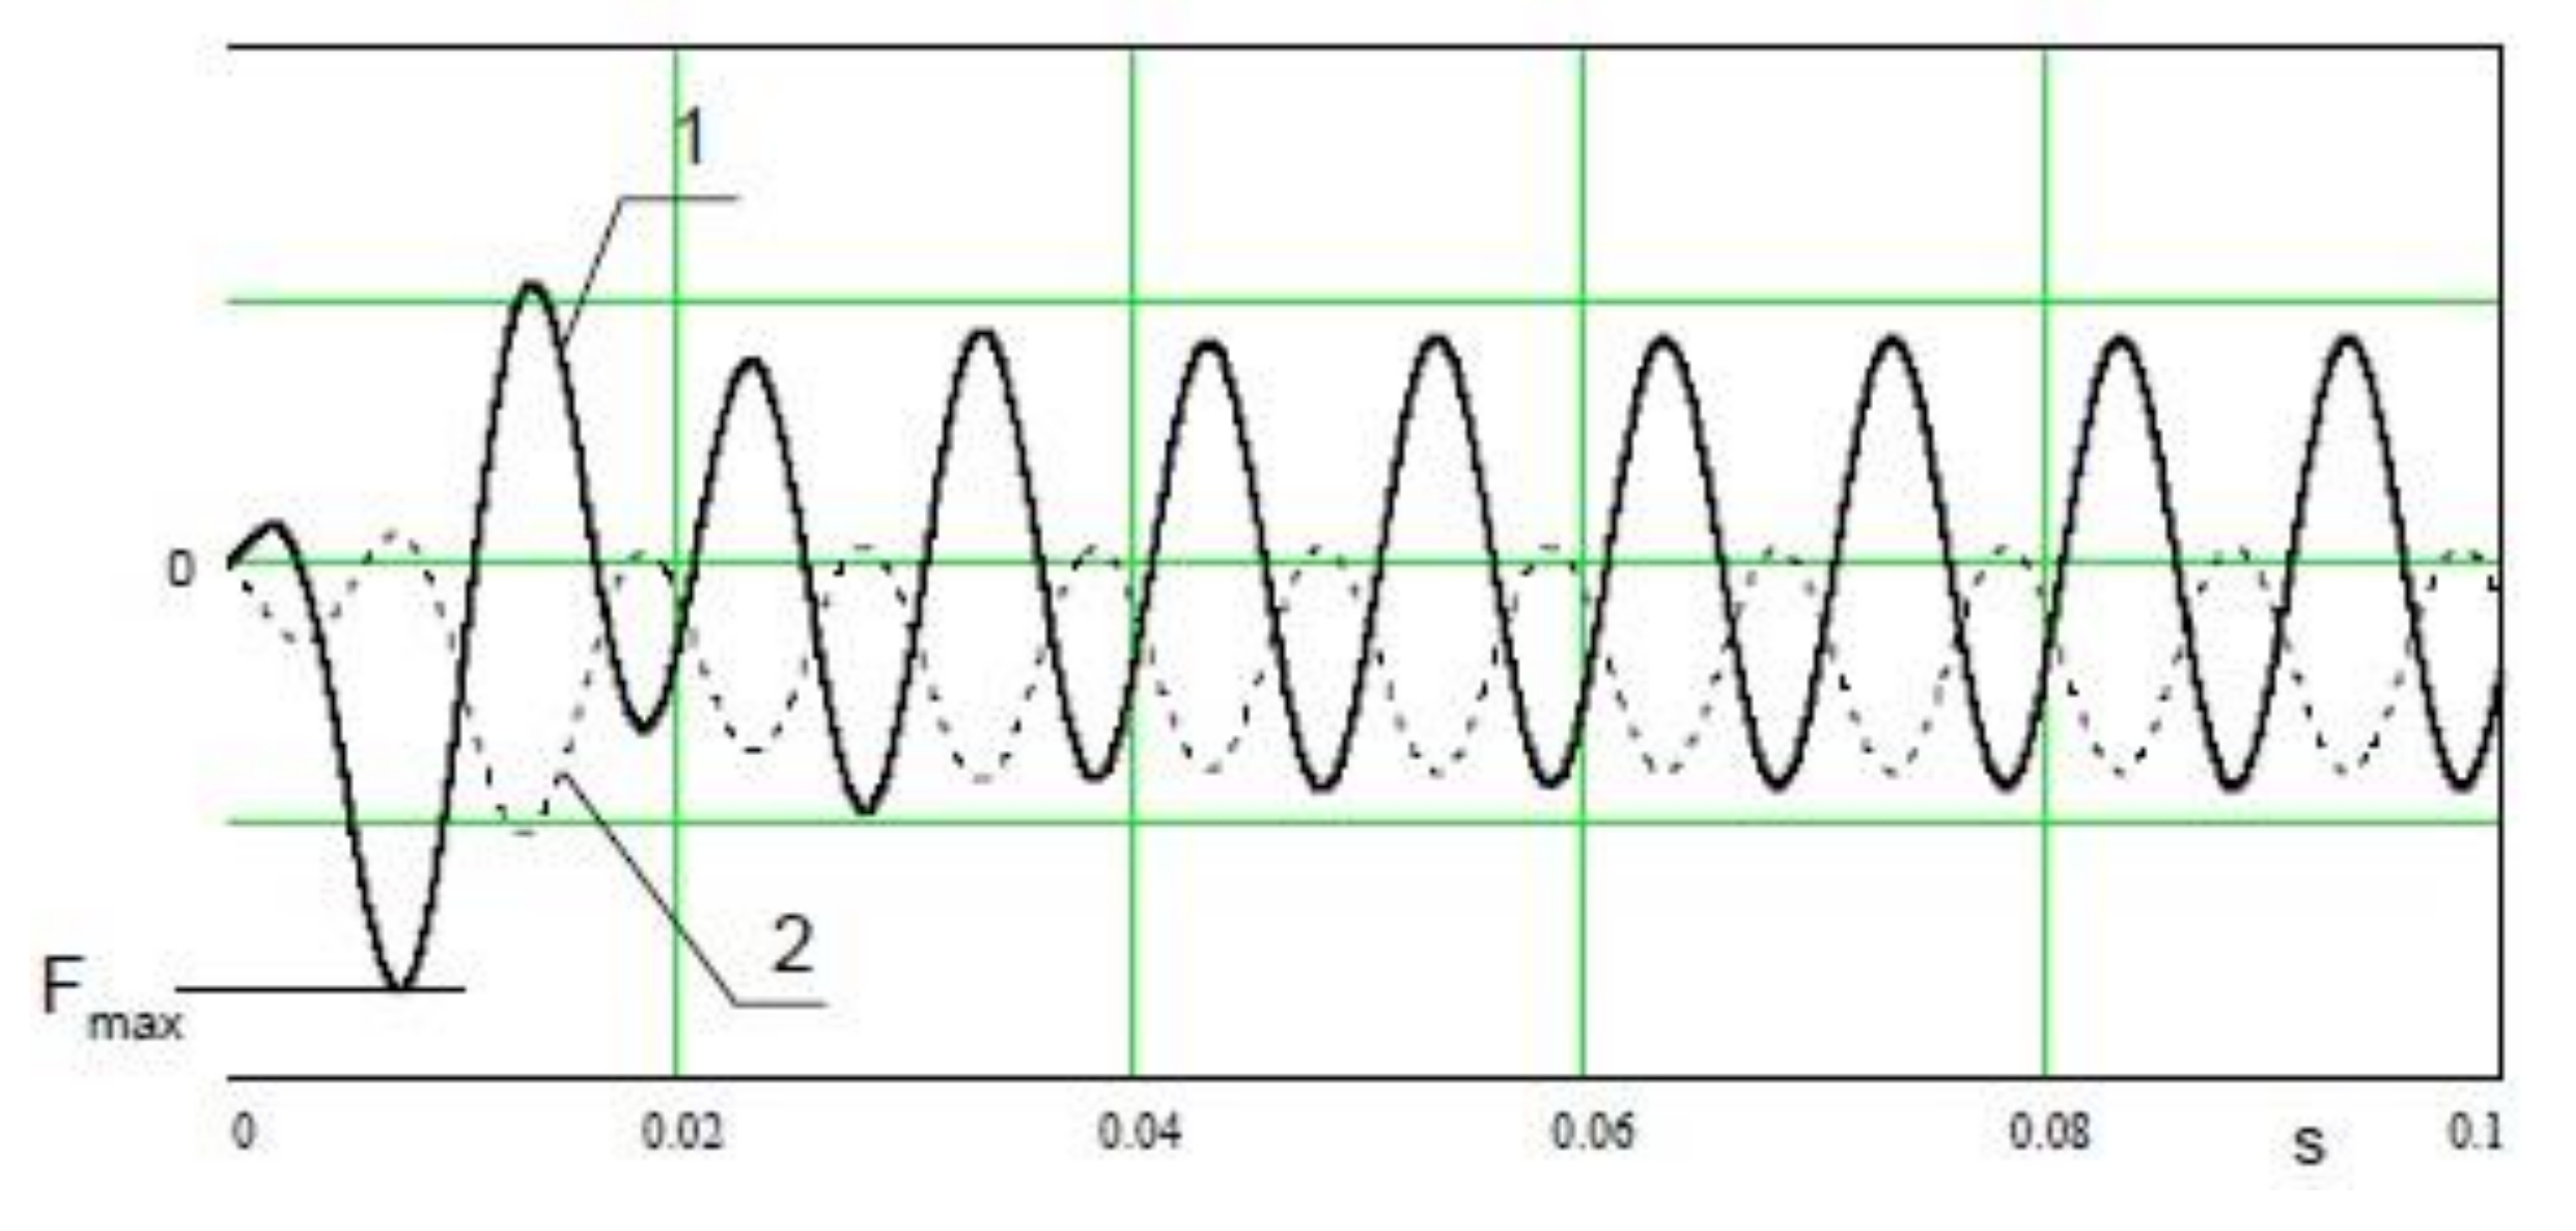
3.4. Impact of Short Circuit Current Variability on Electrodynamic Force Values

The analysis concerning the operation of electrodynamic forces in the current circuits of electrical apparatuses is usually carried out taking into account the flow of short circuit currents through the busbars. The force values are then the largest. Short circuit currents are characterized by variability as a function of time, so it is important to check how the change in the value of these currents affects the time courses of electrodynamic forces. Among the forces acting on a given system, individual components can be distinguished:
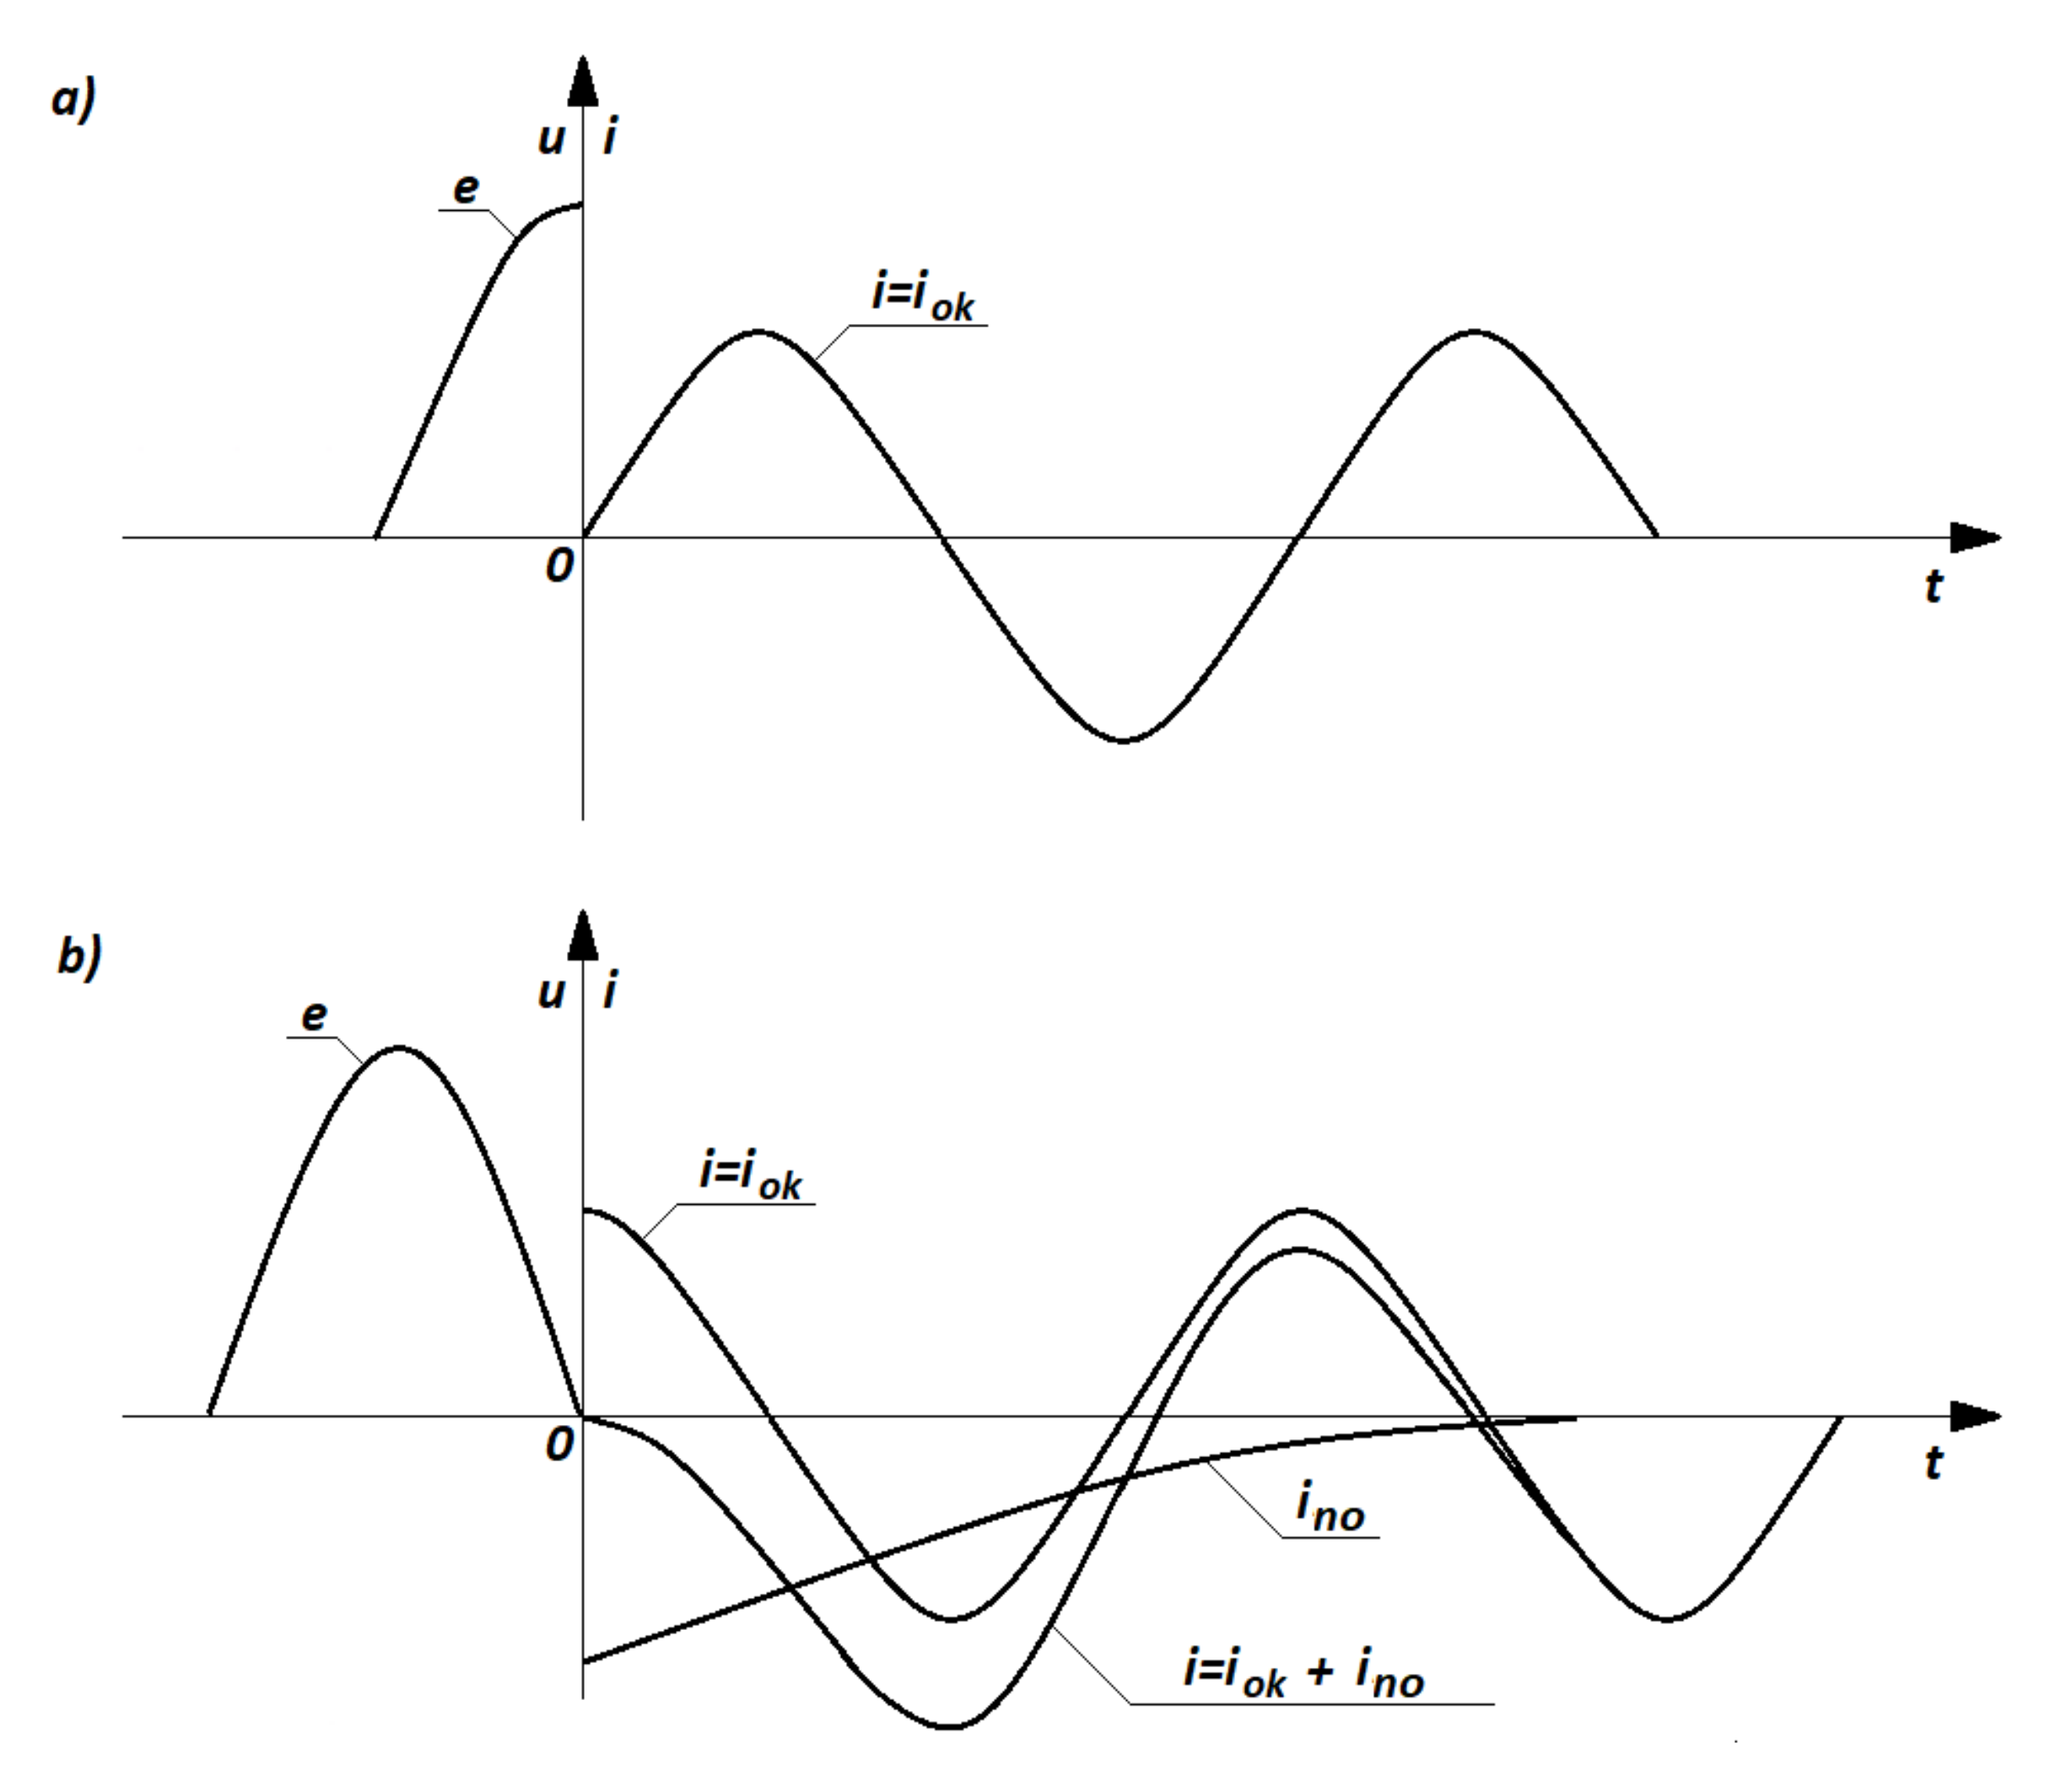
  • Periodic, disappearing and non-disappearing;
  • Periodic decay of a frequency equal to the frequency of the voltage source; and
  • Periodic non-disappearing frequencies with twice the frequency of the voltage source.
For single-phase and two-phase short circuits, variation curves of electrodynamic forces are related with the value of the squares of currents: symmetrical or asymmetrical (Figure 5). In the case of symmetrical current, the following equation applies:
F t = μ 4 · π · k F · I m 2 2 μ 4 · π · k F · I m 2 2 · cos 2 ω t
However, for an asymmetrical short circuit current:
F 1 = μ 4 · π · k F · I m 2 · sin ω t + 2 3 · π sin ω t + 1 2 sin ω t 2 3 · π
where α is the current phase at the moment of short circuit α = ψϕ; ψ is the voltage phase at the moment of short circuit.
When determining the electrodynamic interactions at the level of three-phase faults, two cases can be distinguished, taking into account or not the non-periodic components. If the influence of non-periodic components is not taken into consideration and also assuming that the individual phase currents are out of phase by 120 g, the short circuit currents can be described by the following formulas [27]:
c i A = I m · sin ( ω t + 2 3 · π )
i B = I m · sin   ω t
i C = I m · sin ( ω t 2 3 · π )
In order to correctly determine the value of the mutual interaction of electrodynamic forces, it is necessary to find their largest values, which in this case will take place when the multiplication of the two currents will produce a maximum value. Therefore, in a flat single three-pole system, where the external current circuits are arranged symmetrically with respect to the middle busbar, the electrodynamic forces acting on individual conductors can be described by the following equations [27]:
F A = μ 4 π k F i A ( i B + i c 2 )
F B = μ 4 π k F i B i A + i C
F C = μ 4 π k F i C ( i A 2 i B )
After having made a substitution of the above formulas, we obtain an equation which makes it possible to determine the value of the electrodynamic forces acting on the external current circuits through which the current iA flows:
F 1 = μ 4 π k F I m 2 sin ( ω t + 2 3 π ) sin ω t + 1 2 sin ( ω t 2 3 π )
In order to obtain the maximum value of the above-mentioned force it is necessary to determine the extrema of the function f (wt):
f ω t = sin ( ω t + 2 3 π ) sin ω t + 1 2 sin ( ω t 2 3 π )
After having made the appropriate substitution the following equations are obtained:
F 1 m a x = μ 4 · π · k F · I m 2 · 0.808
F 1 m i n = μ 4 · π · k F · I m 2 · 0.058
The maximum values of electrodynamic forces for the external current circuit through which the current i c flows are exactly the same as for the conductive busbar i a and could be determined from the following formulas:
F 3 m a x = F 1 m a x = μ 4 · π · k F · I m 2 · 0.808
F 3 m i n = F 1 m i n = μ 4 · π · k F · I m 2 · 0.058
The value of electrodynamic forces acting on the center busbar of the system is slightly different. After substituting the current formulas, the following equation is obtained:
F 2 = μ 4 π k F I m 2 sin ω t sin ( ω t + 2 3 π ) + sin ( ω t 2 3 π )
After determining the maximum values, the above-mentioned formula can be described as:
F 2 m a x = μ 4 π k F I m 2 0.866
The force of the same value acts in the opposite direction (towards the C phase rail). Based on the analysis of the above relationships determined for each busbar of the three-wire system it can be stated that the largest load of electrodynamic forces concerns the phase B busbar (middle rail). In this case, it is worth considering changing the parameters of the outer rails and adjusting their mechanical strength to a slightly lower load. However, calculations of mechanical strength are often made assuming loads that act on the middle current circuit. Therefore, the busbars with identical parameters are used. This is due to the small difference between the electrodynamic forces of the outer and middle tracks, which are just over 7%. Similarly, calculations are made when the occurrence of non-periodic short circuit currents is taken into account. Then slightly higher values of electrodynamic forces will be obtained, however, the relationships between individual phase conductors remain unchanged (the middle current path will be most loaded).

4. Analytical Calculations for Three-Phase Busbar SYSTEM

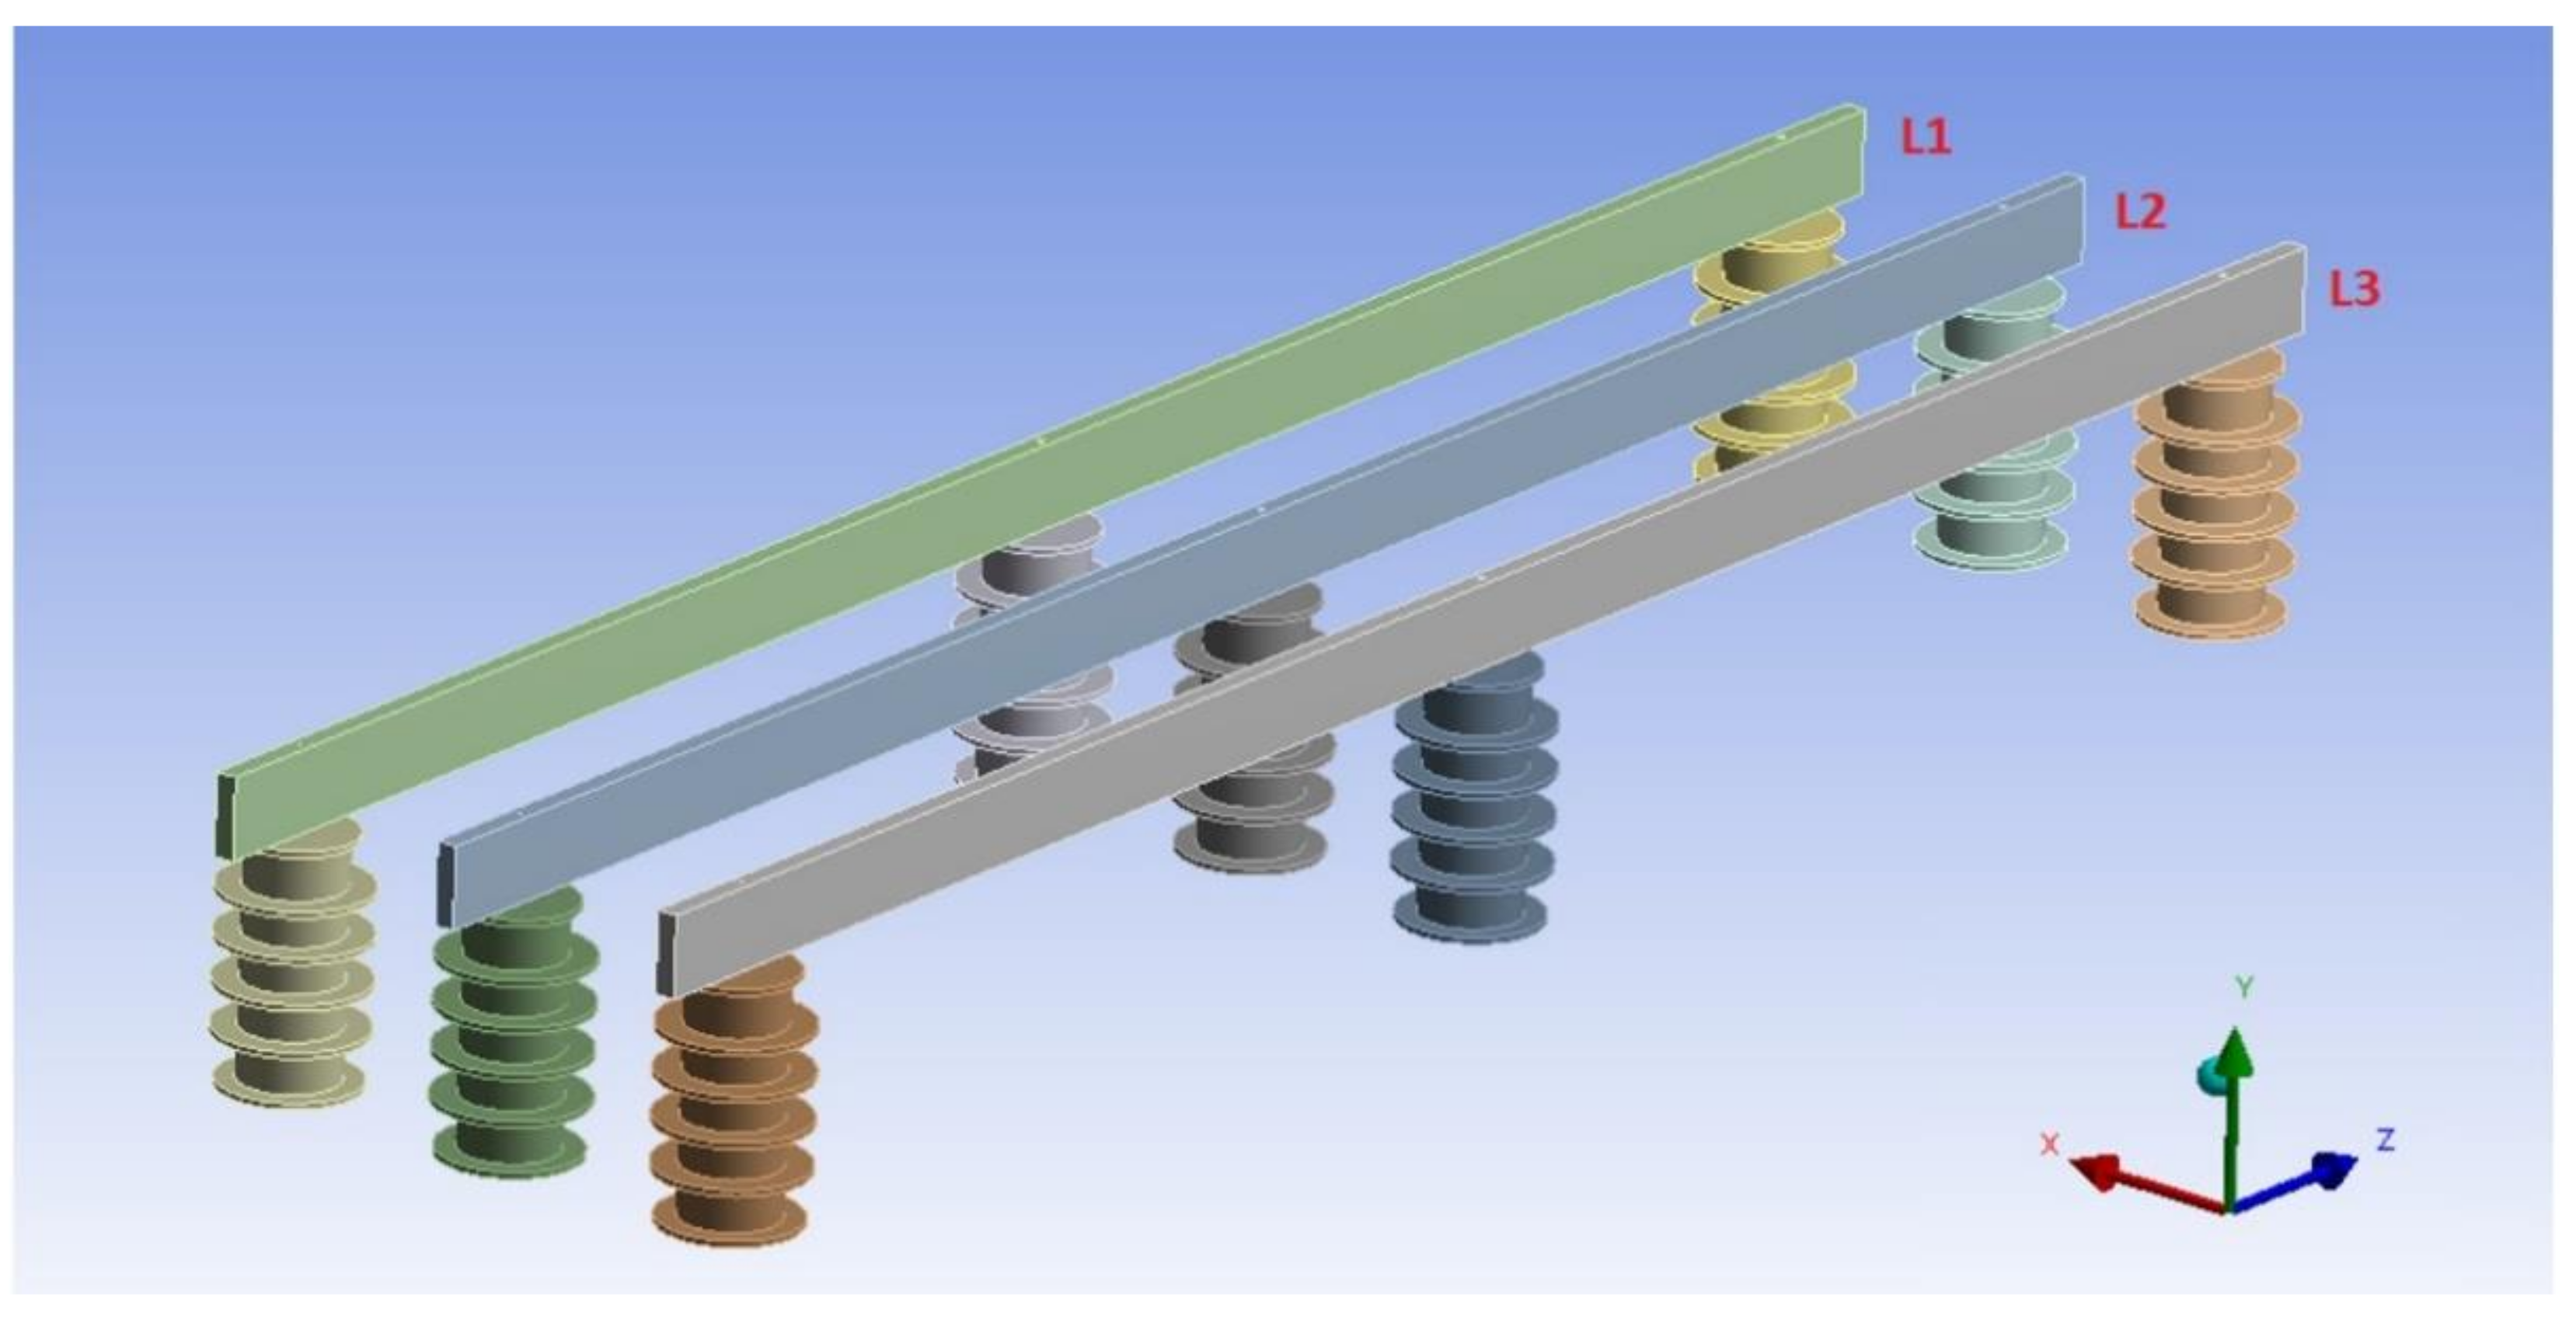
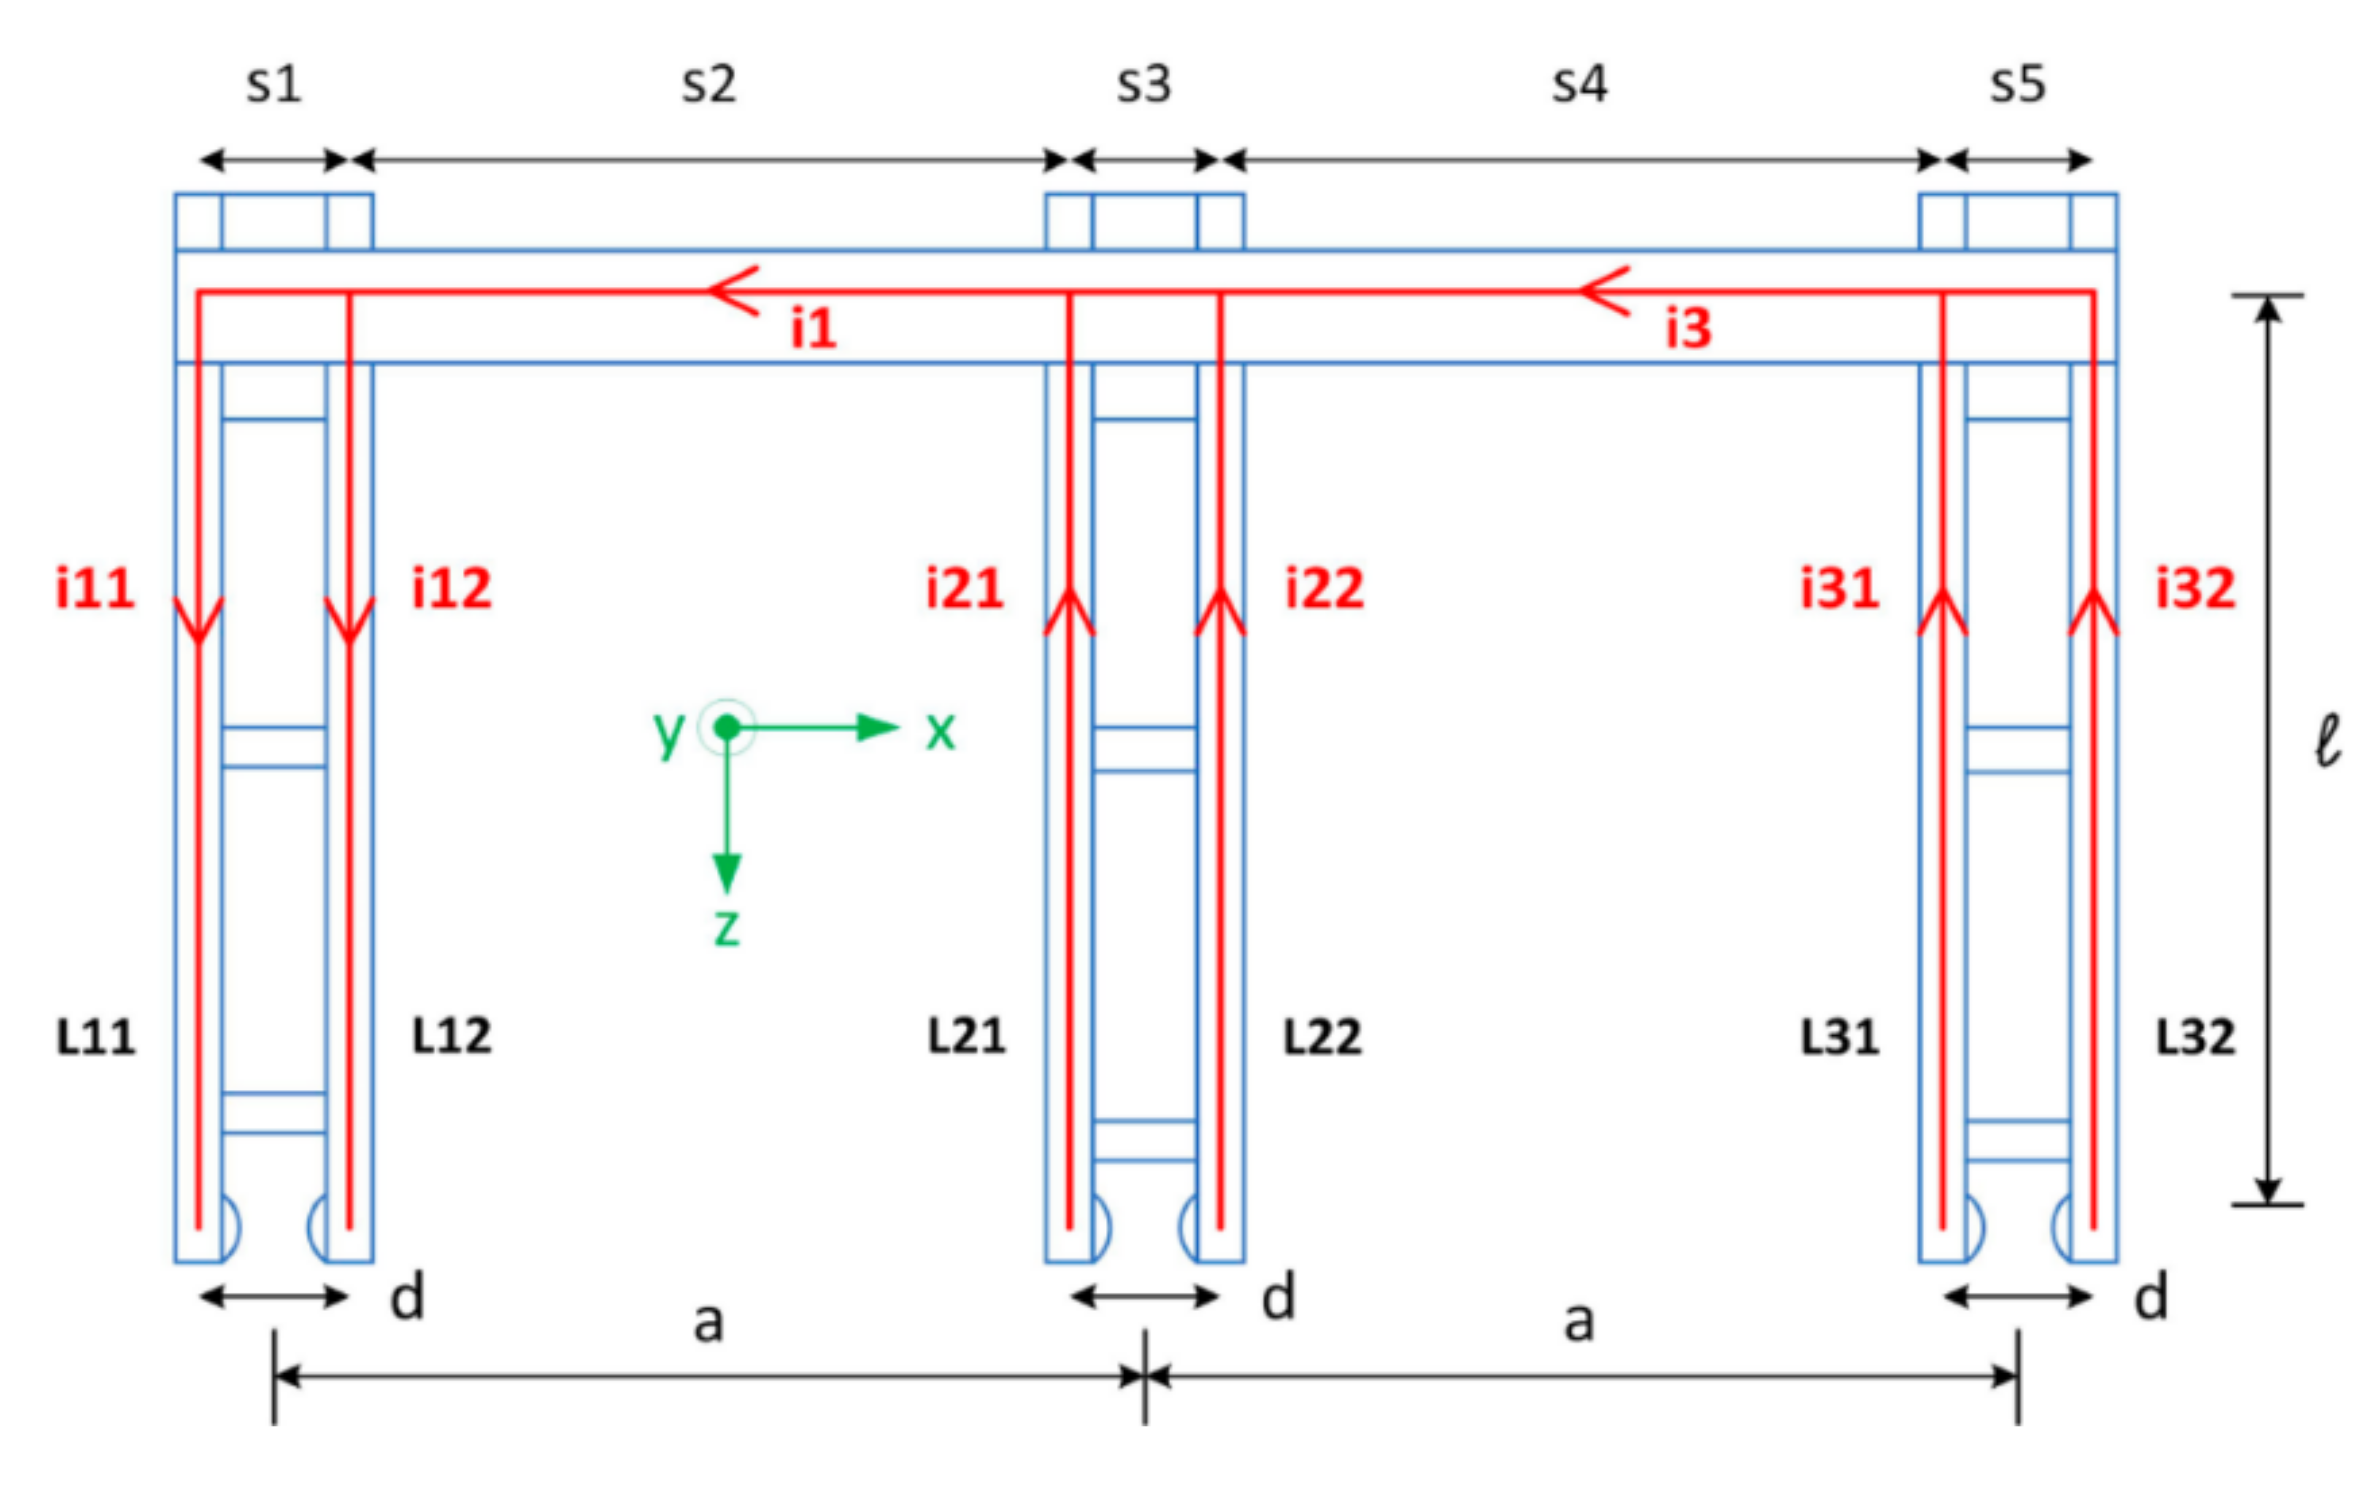
4.1. Calculations of A Single-Wire Three Phase Busbar System—Parameters of the Tested System

This subsection will present examples of calculations allowing determining: the maximum value of the electrodynamic force, the value of arising mechanical stress, the breaking force of the supporting insulators and the system’s natural frequency.
The busbar arrangement under test is a three-phase, one-wire system, in which the external current circuits are symmetrical with respect to the middle path. The system is composed of rectangular copper bus bars. All the busbars have been stacked. It is also assumed that the electric currents in each phase have the same direction and equal values. The calculations presented in this subsection have been carried out on the basis of the theoretical information previously discussed and allow the determination of the individual parameters associated with the occurrence of electrodynamic forces, the proper adjustment of which allows maintaining safe and stable operation of the entire system. The calculations concerning the maximum value of the electrodynamic force were carried out taking into account the mathematical relations mentioned above, according to which the central current path of the system is the most loaded. In order to determine the parameters enabling safe operation of devices, tests should be carried out under the most unfavorable operating conditions of the system, which, in this case, means calculations under short circuit conditions (three-phase short circuit).
The tested busbar system is characterized by the following parameters:
  • iuIII = 60 kA—surge current value at three phase short circuit;
  • S: b = 10 × h—current busbar cross section (rectangular cross section);
  • l = 50 cm—distance between support insulators of a given phase;
  • d = 12 cm—distance between the centers of the wires;
  • material used: copper; and
  • σdop = 1400 daN/cm2—allowable material stress.
The arrangement of busbars, their support insulators and their dimensions are shown in Figure 6.

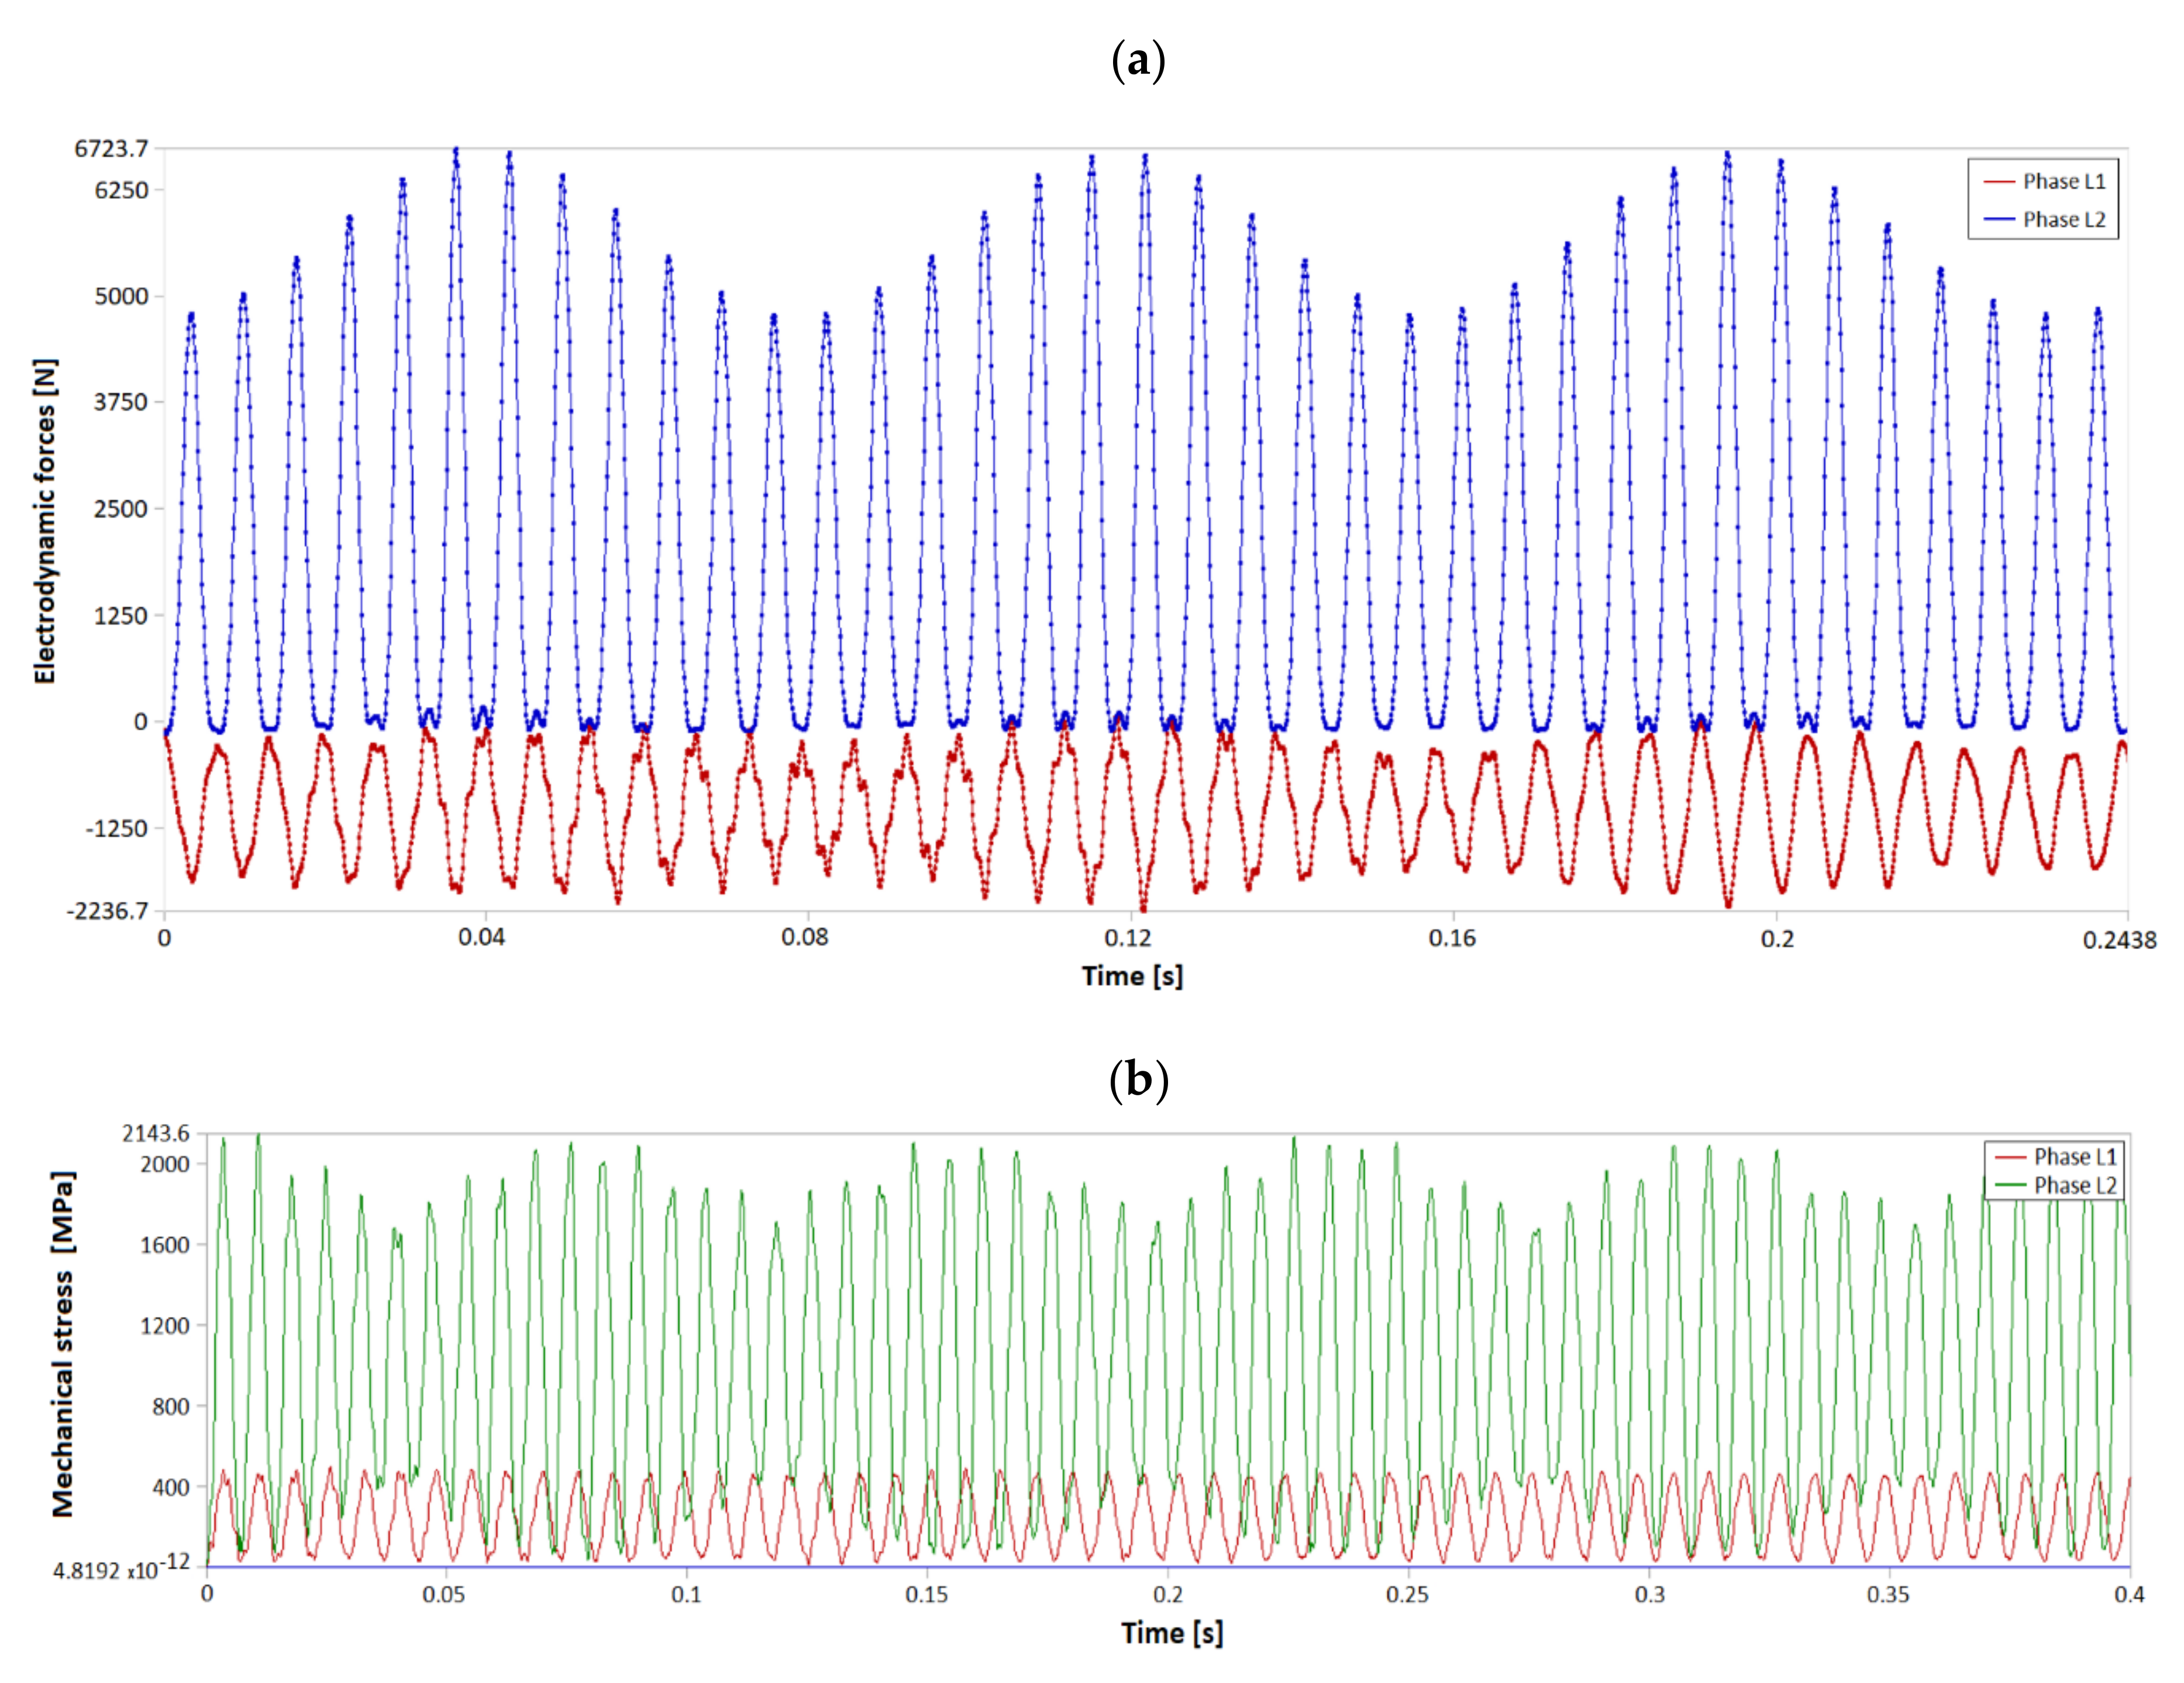
4.2. Determination of the Maximum Electrodynamic Force Value

Taking into account the relationships previously determined concerning the impact of the variability of the short circuit current on the values of the electrodynamic forces, it can be assumed that the most important forces act on the average current circuit. Correct calculations of the values concerning electrodynamic forces acting under three-phase short circuit conditions can be obtained using the following formula:
F 2 max = μ 4 π k F k D 3 2 i u I I I 2
where kF is the shape factor of the current circuit system; kD is the Dwight coefficient based on the characteristics from (iuIII)—surge current at three-phase short circuit.
Based on the available circuit parameters, the kF factor value can be determined using the following formula:
k F = 2 · l d = 2 · 50 d 12 = 8.34
where l is the distance between the axles of individual phase conductors; d is the distance between the axles of individual phase conductors.
The Dwight coefficient value (kD) can be derived from the charts [27]:
d b h + b = 12 cm 1 cm 4 cm + 1 cm = 2.2 > 2
b h = 1 5 = 0.2
The Dwight coefficient value is equal: kD = 1. After substitution to Equation (26), the values of the surge current and the values of the determined coefficients make it possible to obtain the maximum electrodynamic force acting on the middle current circuit and it is equal to:
F 2 m a x = 4 · π · 10 7 4 · π H m · 8.34 · 3 2 · 36 · 10 8 · A 2 = 2600.16   N = 260.016   daN

4.3. Calculations of Natural Frequency for the Tested System

Due to the occurrence of interactions of electrodynamic forces in the examined system, mechanical vibrations also appear in the described system. In order to determine the natural frequency of the tested busbar layout, it is mandatory to use the equations described in Table 1.
n = 3.67 · b l 2 · 10 5
After substituting the appropriate values, the following value is obtained:
n = 3.67 · 1 50 2 · 10 5 = 146.8   Hz
To avoid resonance phenomena, the natural frequency of the busbars—f must be outside the range (1.7–2.4). For an operating frequency of f = 50 Hz, the following equation can be used:
n = 146.8   Hz > 2.4 f = 120   Hz
The natural frequency of the system determined previously meets the condition expressed above. Based on the above-mentioned formulas regarding the determination of the natural vibrations of the busbars, it can be stated that the factor that can be adjusted to avoid the occurrence of the resonance phenomenon is the distance ‘l’ at which the phase insulators are placed.

4.4. Selection of Support Insulators

Based on the above calculations, it can be concluded that each support insulator of the tested busbar system is subject to a static force equal to R = F2max = 260.016 daN. In order to correctly select support insulators with an appropriate breaking force capacity, the force applied in the axis of the busbar R should be reduced to the force applied at the height of the upper edge of the insulator fitting R’. To this end, the response factor vF should be determined according to the characteristics presented in Figure 7.
R = ϑ F · R = 1.2 · 260.016   daN = 312.019   daN
For some selected support insulators, it is mandatory to respect the safe operating conditions, formulated by the following inequality:
R < F N z R < F N z
It is therefore necessary to select support insulators with a rated breaking strength capacity expressed as follows − F N z > 312.019   daN   .

4.5. Mechanical Strength

The busbars operating in the system under test have a certain, characteristic resistance to mechanical stress for a particular type of material. Table 2 shows the maximum stress data for different types of copper and aluminum busbars in accordance with the guidelines contained in the PN-72/E-05025 standard.
In order to check whether the effect of electrodynamic forces will not be associated with excessive mechanical stress of the conductors, it is necessary to check whether the bending stress values described by the following equations do not exceed the allowable stress values specified in the standards:
σ g = v σ k σ M g W σ d o p
where σg is the bending stress value acting on the cable; vσ is the dynamic bending stress factor; kσ is a factor related to the increase in material strength at loads equal to kσ = 0.5 for cables with a rectangular cross-section; Mg is the bending moment; W is the bending strength of the rail cross-section; σdop is the allowable value of mechanical stress for a given material.
In order to check the strength of the busbars, it is necessary to know the maximum bending moment of the rail, which can be determined from the following relationships for articulated rail fastening:
M g = 1 8 F max l
However, in the case of rigid mounting of busbars:
M g = 1 12 F max l
In the tested system it was assumed that the busbars are rigidly fastened at both ends:
M g = 1 12 · 260.015   daN · 50   cm = 1083.39   daN · cm
To determine the dynamic coefficient of bending stress ns, it is necessary to know the ratio of the natural frequency of the conductor to the frequency of the flowing current n/f.
n f = 146.8 50 = 2.936
Based on the above calculations, vσ = 1 was selected from the chart below in Figure 8.
The bending strength index of a rectangular section can be calculated as based on the relationships given in Table 3.
In the tested system it was assumed that there is one conductor per phase and that all busbars are set to edge. Thus, it can be written that:
W = h b 2 6 = 1 cm 16 cm 2 6 = 2.67   cm 3
After substituting the determined parameters for Equation (32), the value of mechanical stress acting on the tested system is obtained:
σ g = 0.5 1083.396   daN / cm 2.67   cm 3 = 202.883   daN / cm 2 σ d o p = 1400   daN / cm 2

4.6. Summary of Analytical Calculations

The interactions arising from electrodynamic forces is related to the electric current flowing through the busbars in the magnetic field. These interactions can occur not only between current circuits but also near the ferromagnetic masses (for example between the concerned circuit and the ferromagnetic material). Among the methods for determining the electrodynamic forces acting on a given system, classical methods are used, one can enumerate, among others, the methods used in the case of one-dimensional busbars as well as the methods allowing to take into account the section of busbars and the variability of the electrodynamic forces passing through them in the calculations.
Basic equations were used for this purpose, the sources of electrodynamic forces and the means to select the appropriate system parameters allowing safe operation of the devices under conditions compatible with the assumptions presented above are considered. The most unfavorable operating conditions possible have always been assumed during the tests of correct operation of a given system. As in the same way as for the cases enumerated before, in the case of electrodynamic forces acting on busbars, such conditions will occur during the flow of short circuit currents. When designing current circuits that are to operate correctly even during high short circuit current flow, individual parameters should be taken into account:
  • Determination of the maximum value of electrodynamic force.
The value of the calculated electrodynamic force is used to determine the remaining parameters that affect the proper operation of the entire system. The determination of the maximum possible value of the electrodynamic force makes it possible to select the parameters of the system so that its operational safety is maintained under all conditions, including the most unfavorable conditions.
2.
Determination of the natural system frequency.
The magnitude of mechanical vibrations resulting from electrodynamic forces is affected, among other things, by factors such as how the busbars are arranged, the type of material used in their construction, as well as the number of supporting insulators and the distance at which they are attached. In the case where the frequency of the vibrations caused by the force is equal to the frequency of the natural vibrations of the system, an unwanted resonance phenomenon may appear.
3.
Determination of mechanical stress.
Under the influence of electrodynamic forces, the current circuits are subjected to mechanical stresses, the maximum size of which is determined for each material.
4.
Selection of the material used to construct busbars.
The exact choice of the right material has a very large impact on the proper operation of the entire system due to a number of parameters related to thermal load and mechanical strength. However, for electrodynamic forces, the most important factor is the value of allowable stress σdop. According to the data presented in Table 1, the allowable stress is σdop = 1400 daN/cm2 for copper and σdop = 700 daN/cm2 for aluminum. In the case where the stresses resulting from electrodynamic forces exceed the permissible value for a given material, a mechanical deformation of the busbars may occur.
5.
Selection of support insulators of appropriate strength.
Support insulators are often made of stiff, brittle materials, which means those are not very not very flexible or malleable. If the bracket is overloaded, it may break. Under the influence of electrodynamic forces, conductors in which current flows in the same direction attract each other, on the contrary, if currents flow in opposite directions, conductors repel each other. In particular cases during a short circuit electrodynamic forces reach such high values that their impact on a given electrical system can even lead to mechanical damage and deformation of the busbars. The dependencies (Equations (20), (22), and (25)) show that during electrodynamic forces presence, the average current circuit is subjected to the greatest stress. This is due to the fact that in a system in which the busbars are arranged symmetrically with respect to the middle current circuit, the interaction of the external busbars is slightly smaller due to the greater distance. In practice, however, identical parameters are often used for the center busbar and external rails. Sample calculations allowed determining how individual parameters of the busbar system affect the value of arising electrodynamic forces and how their proper adjustment affects the safety of current circuits.
Based on the formulas and dependencies presented, it can be stated that the maximum value of electrodynamic forces depends on:
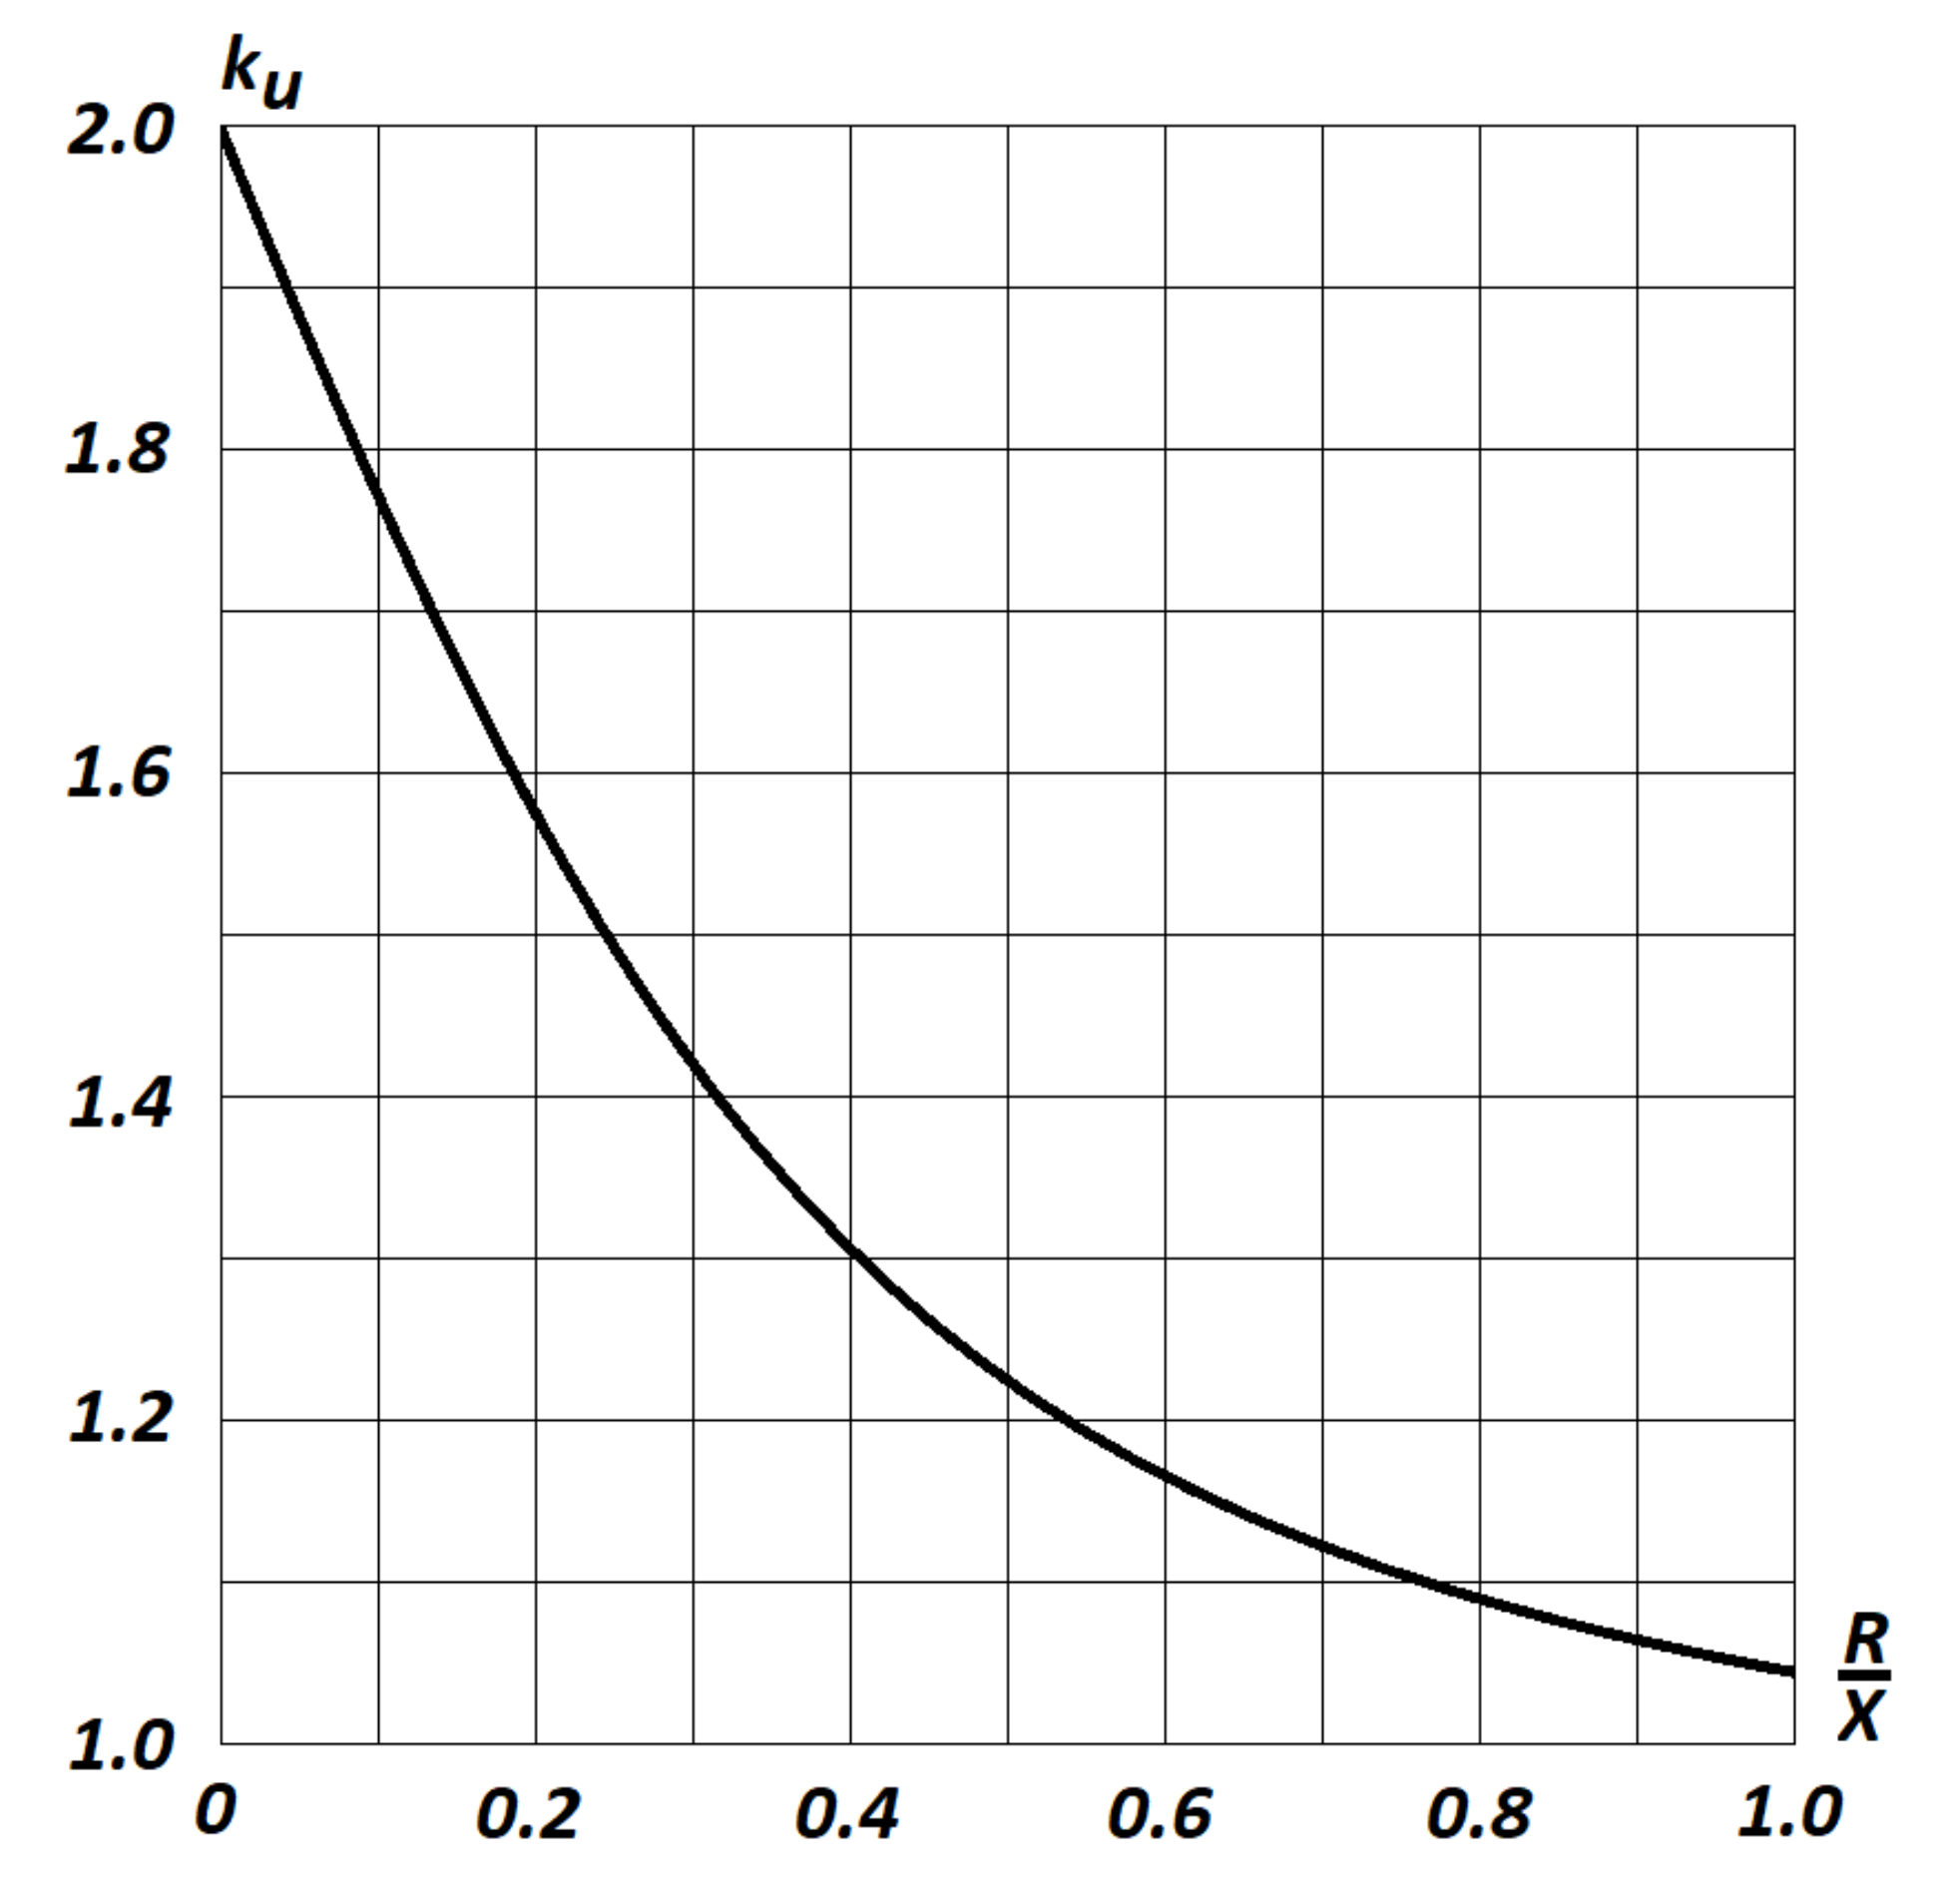
  • Surge current values. The surge current iu is the maximum short circuit current that can be reached. This current occurs when the voltage crosses zero, i.e., for a phase angle of voltage equal to 0 or π. In the case of calculations the surge current (reaching very large values) rose to the square is taken into account, this is the main parameter that has the greatest impact on the value of electrodynamic forces (the higher the electric current, the greater the interaction between conductors).
  • Distances between two supporting insulators of one phase. The distance at which two support insulators of one phase are laid, which was determined in the calculations as ‘l’ may affect both the value of electrodynamic forces and the natural frequency of the system. If the calculated natural frequency of the system is within the range defined as dangerous, a modification of the parameter ‘l’ can be performed to offset the value of natural frequency from an undesirable resonant frequency. The distance between the brackets is also used when determining the bending moment of the rail, which is necessary to calculate the mechanical stress acting on the system.
  • Distance between the axles of individual phase conductors. The distance between the axles of the conductors marked as ’d’ is used in the formula expressing the shape factor of the current circuit system—kF. The greater the distance ‘d’, the smaller the kF value is, which directly reduces the value of interacting electrodynamic forces.
  • Busbar cross-section shape. In the case of circular conductors, calculations are carried out in the same way as for conductors with a negligible cross-section. Using conductors with a rectangular cross-section, it is necessary to take into account the influence of the cross-sectional shape on the values of arising electrodynamic forces. This influence is expressed in simplified formulas for engineering calculations by using a special coefficient called the Dwight coefficient.
Based on the information discussed, it can be concluded that the operational safety of the system exposed to electromagnetic forces depends on many different factors, the values of which are often related to each other. The most important of these factors, however, is the maximum short circuit current that may flow in the circuit. Therefore, in order to maintain stable operation of the system, methods should be used to limit the frequency of short circuits and their duration.

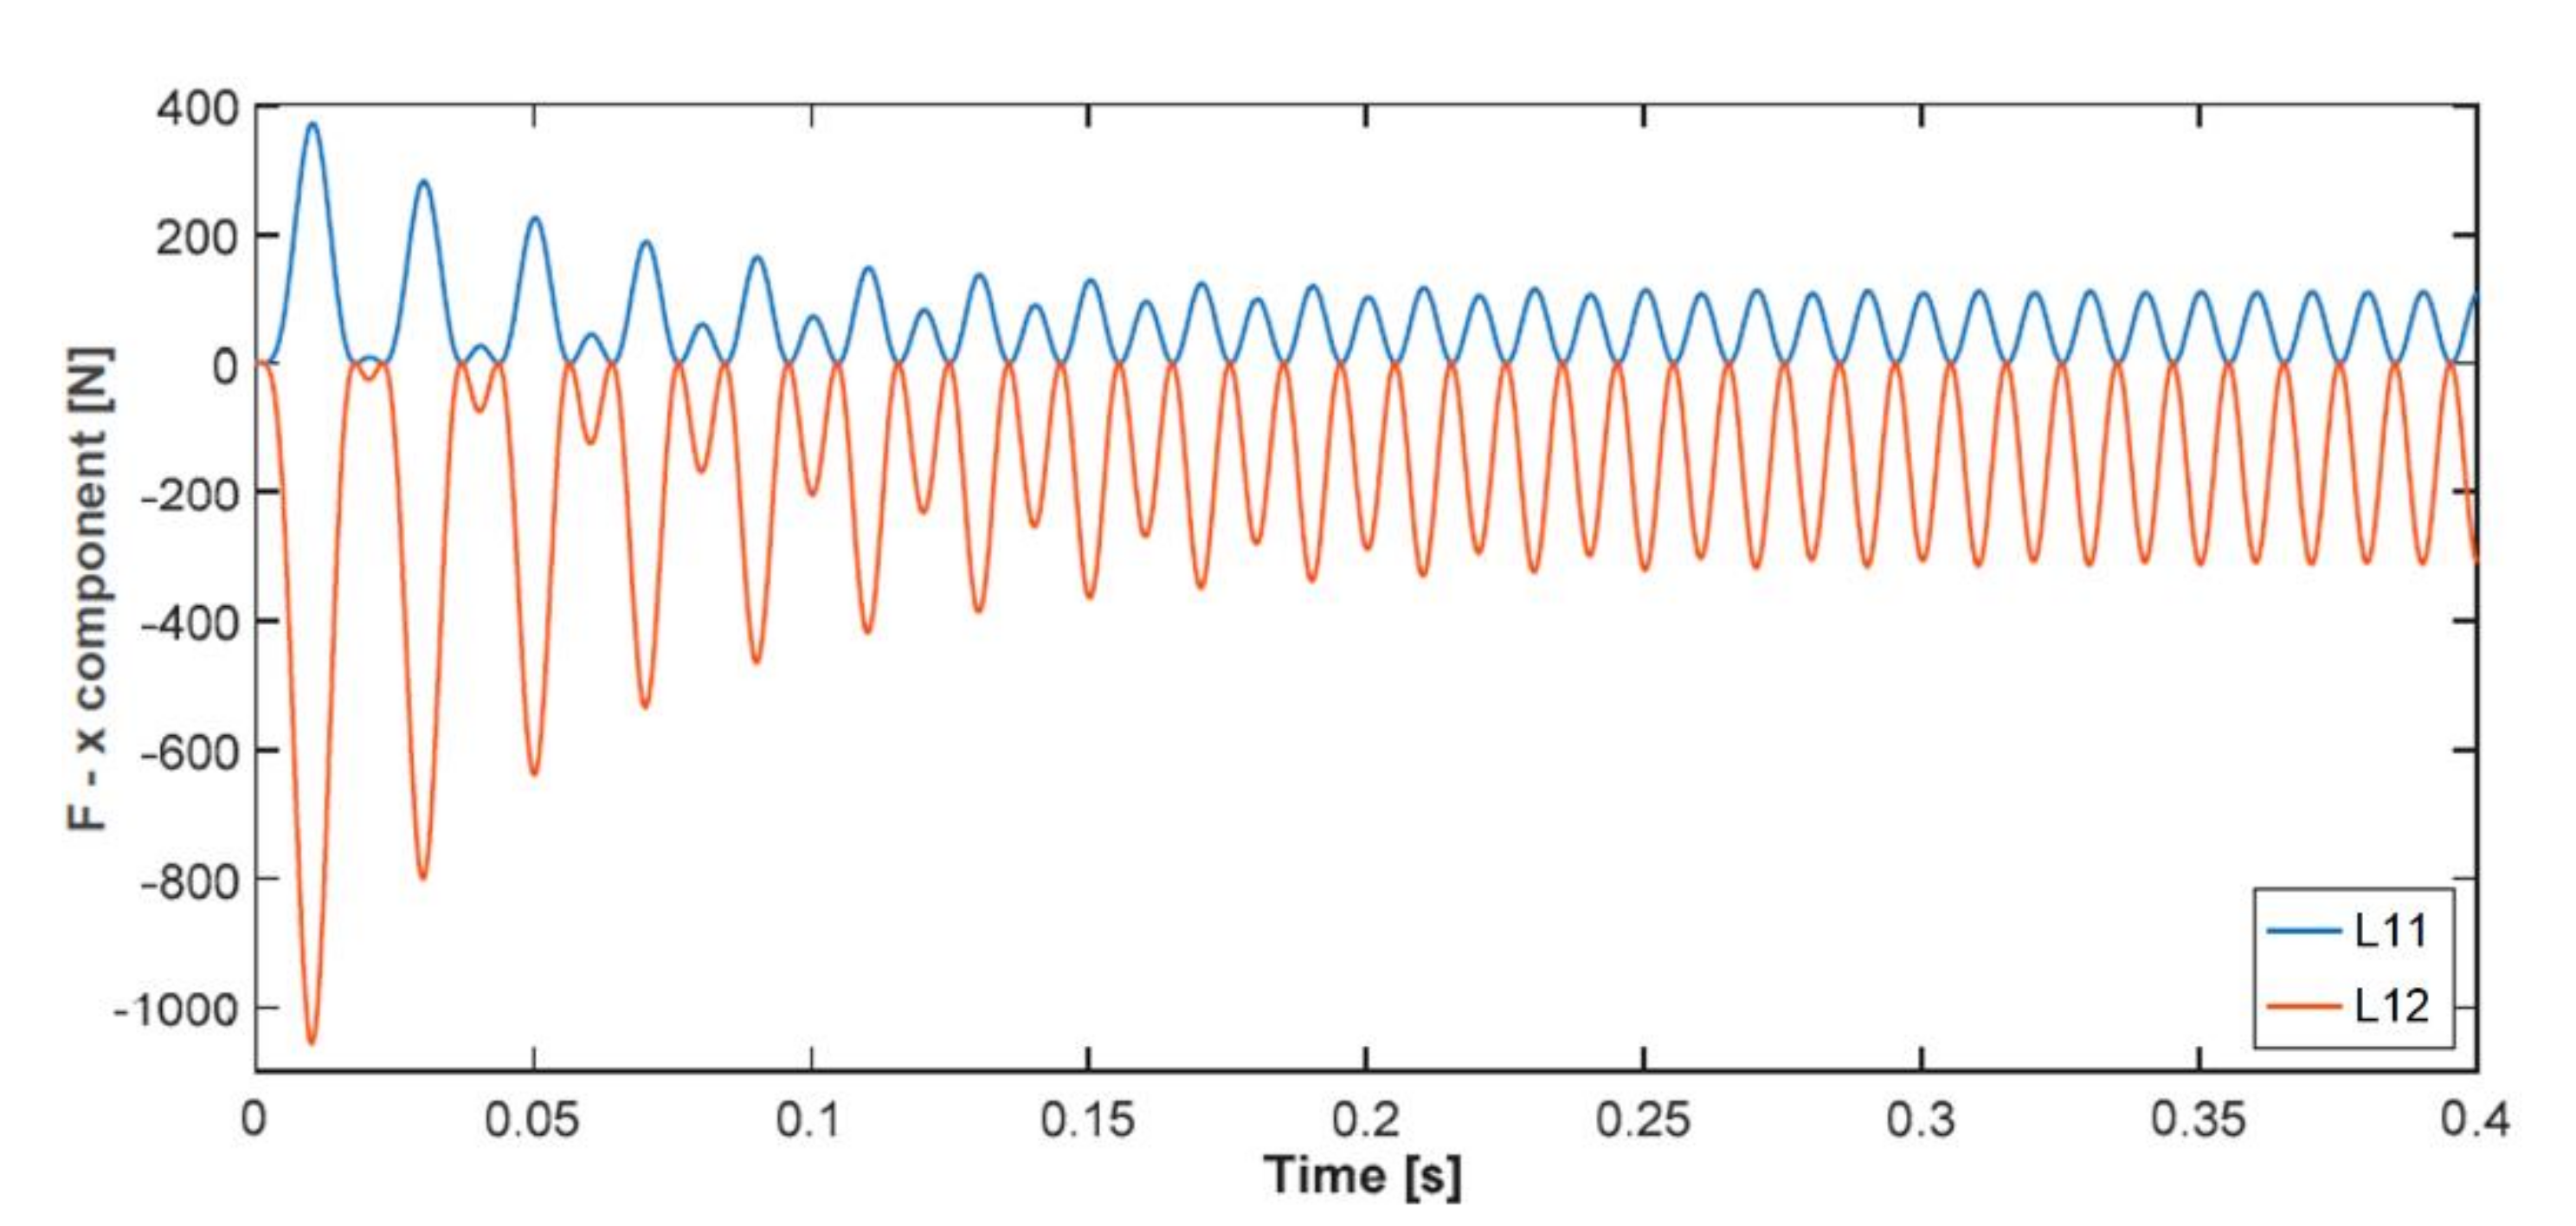
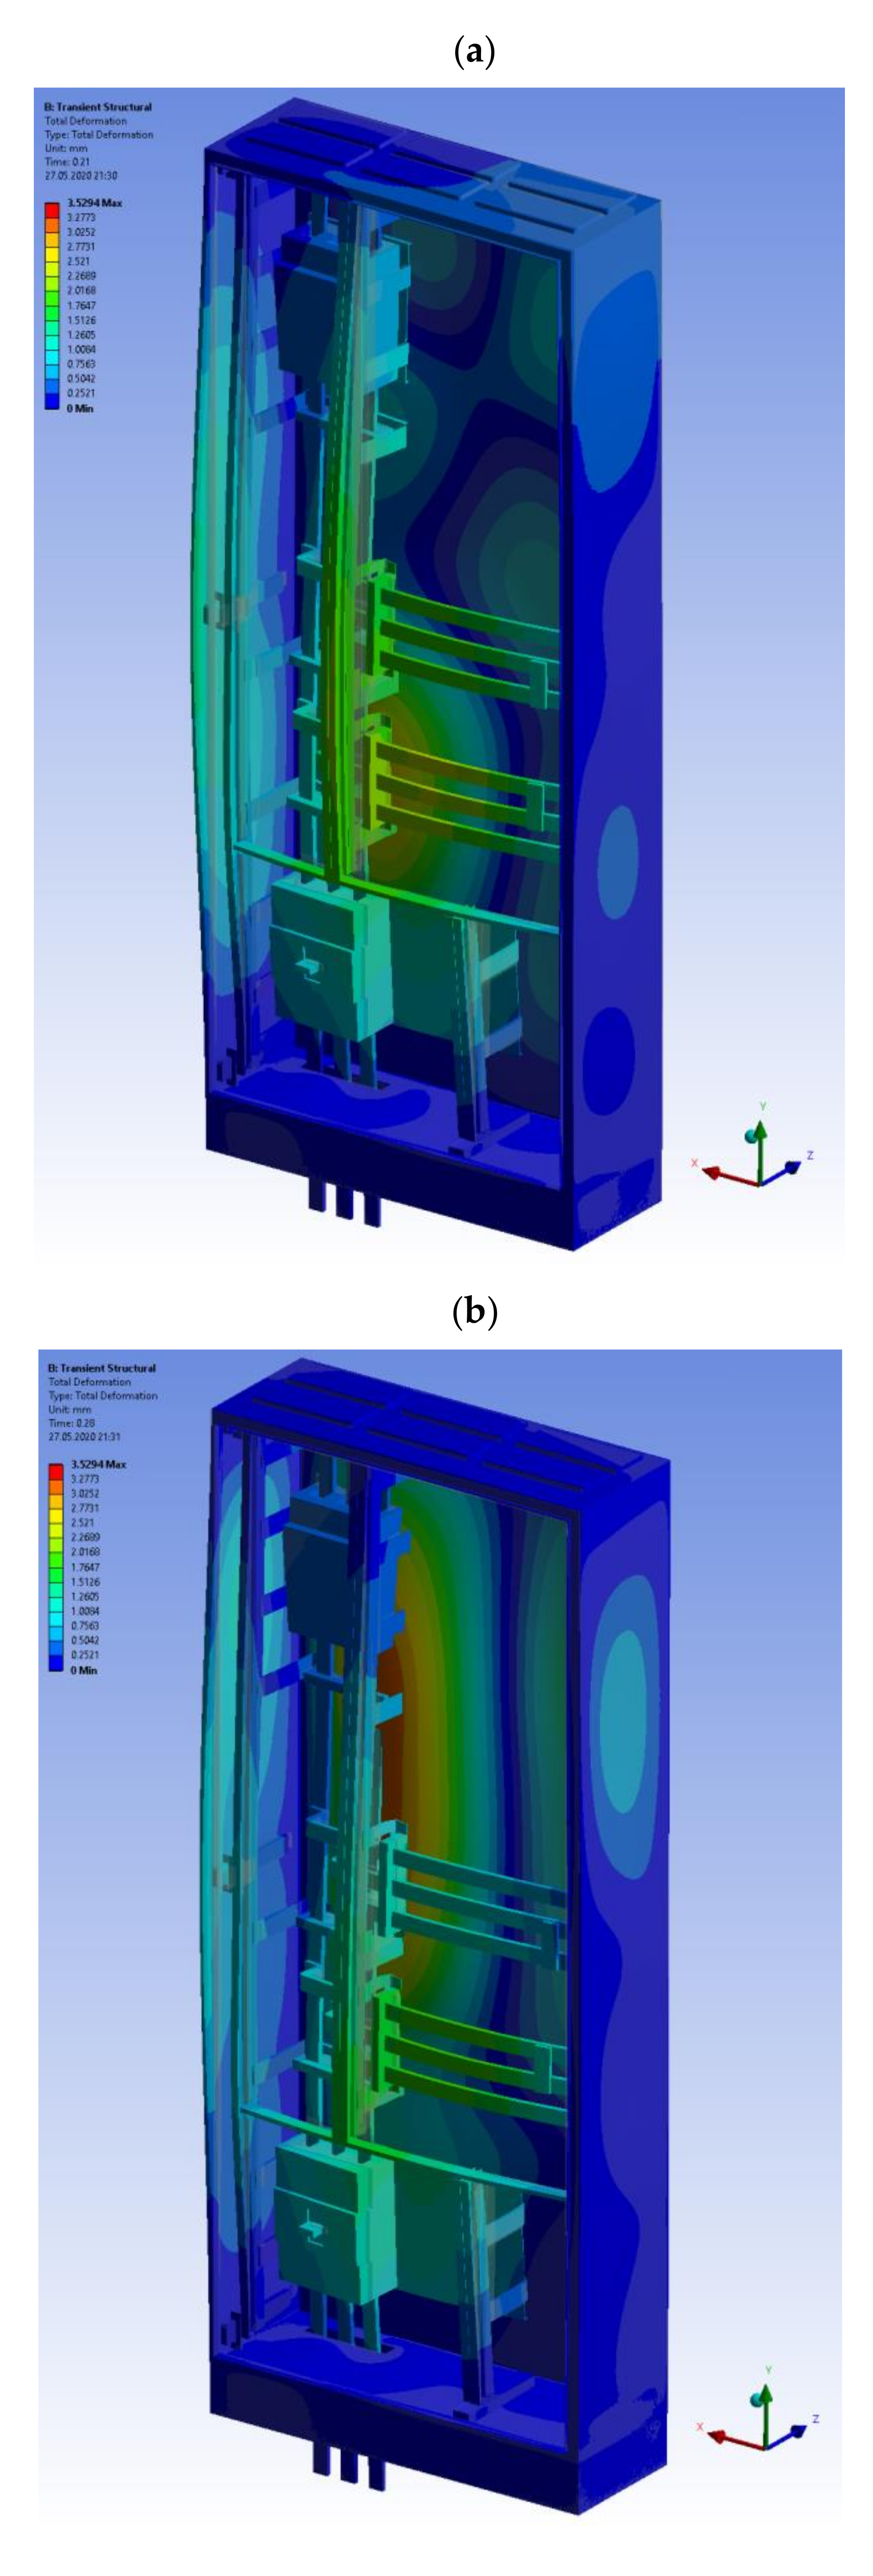
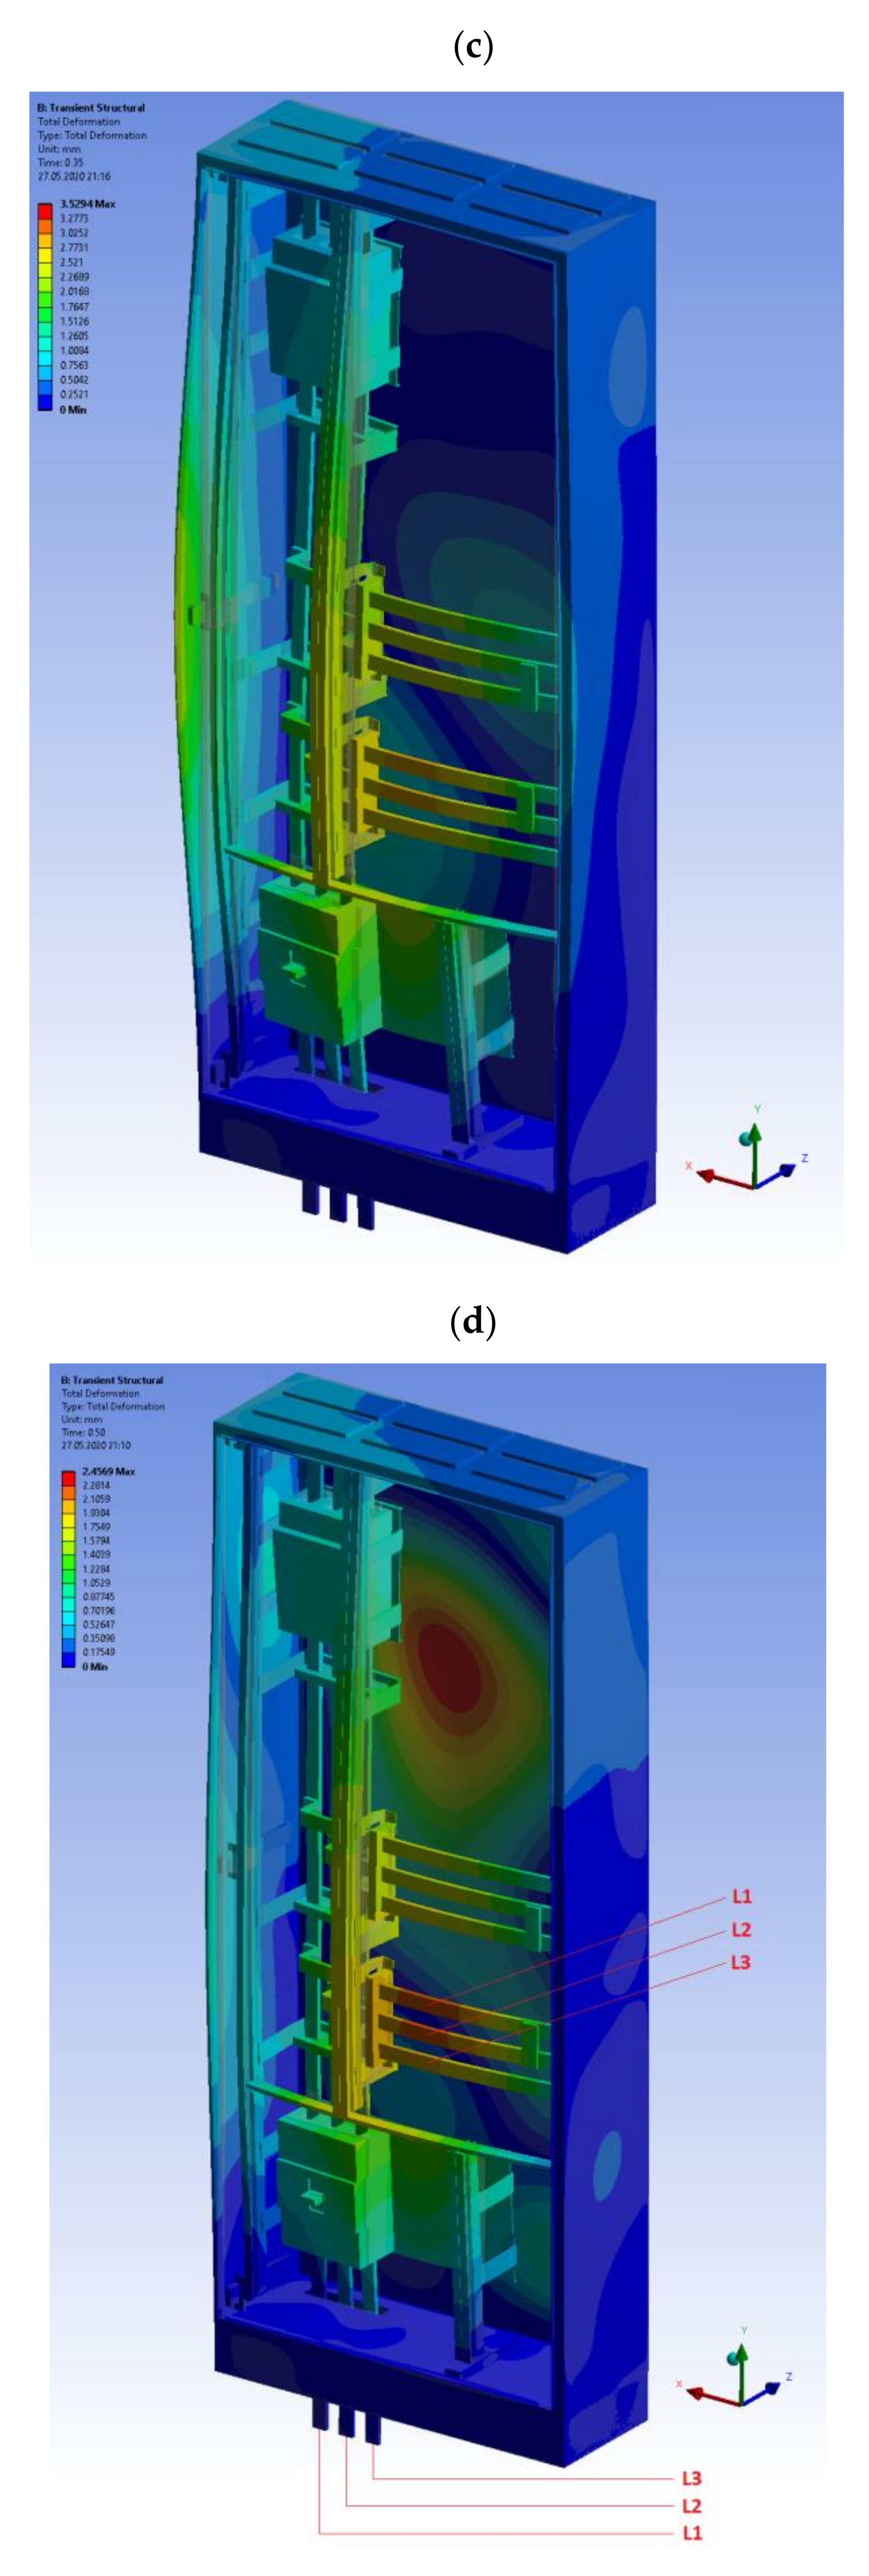
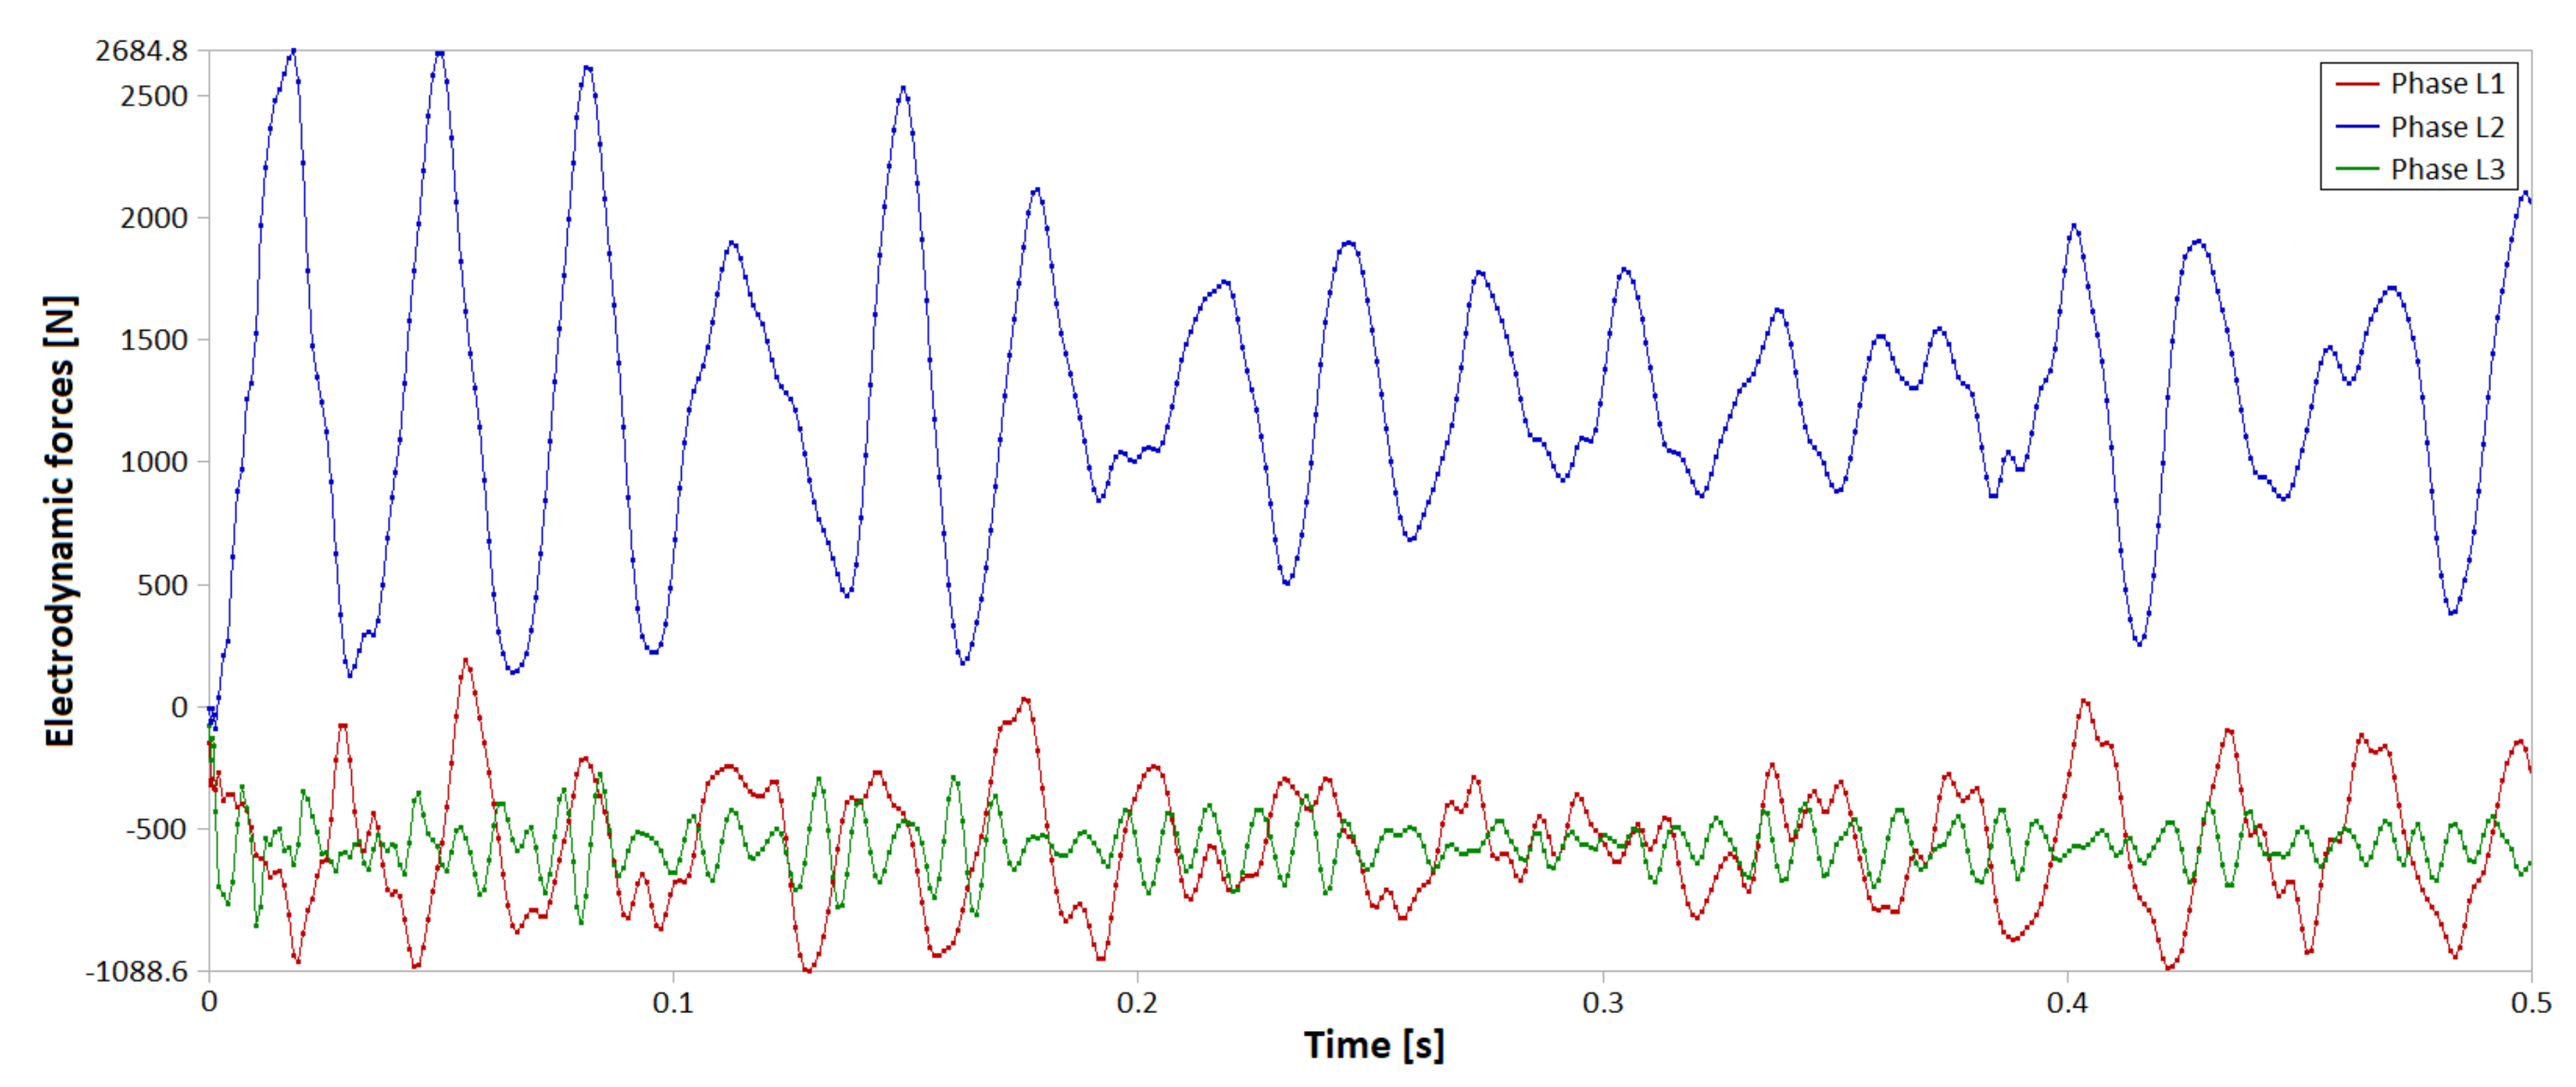
5. Simulations Results for Three-Phase Busbar System

The subject of the simulations was the analysis of the high-current circuit model in the FEM environment. The study aimed to determine electrodynamic interactions in the high-current circuits. The current circuits have been modeled as part of the busbar models of the medium voltage switchgear. The software (2019 R2, Ansys® Academic Research, Pittsburgh, PA, USA) was used to perform the analysis. The program uses FEM and gives a very wide spectrum of possibilities for simulating phenomena in the field of mechanics, electrothermics, and electromagnetism.

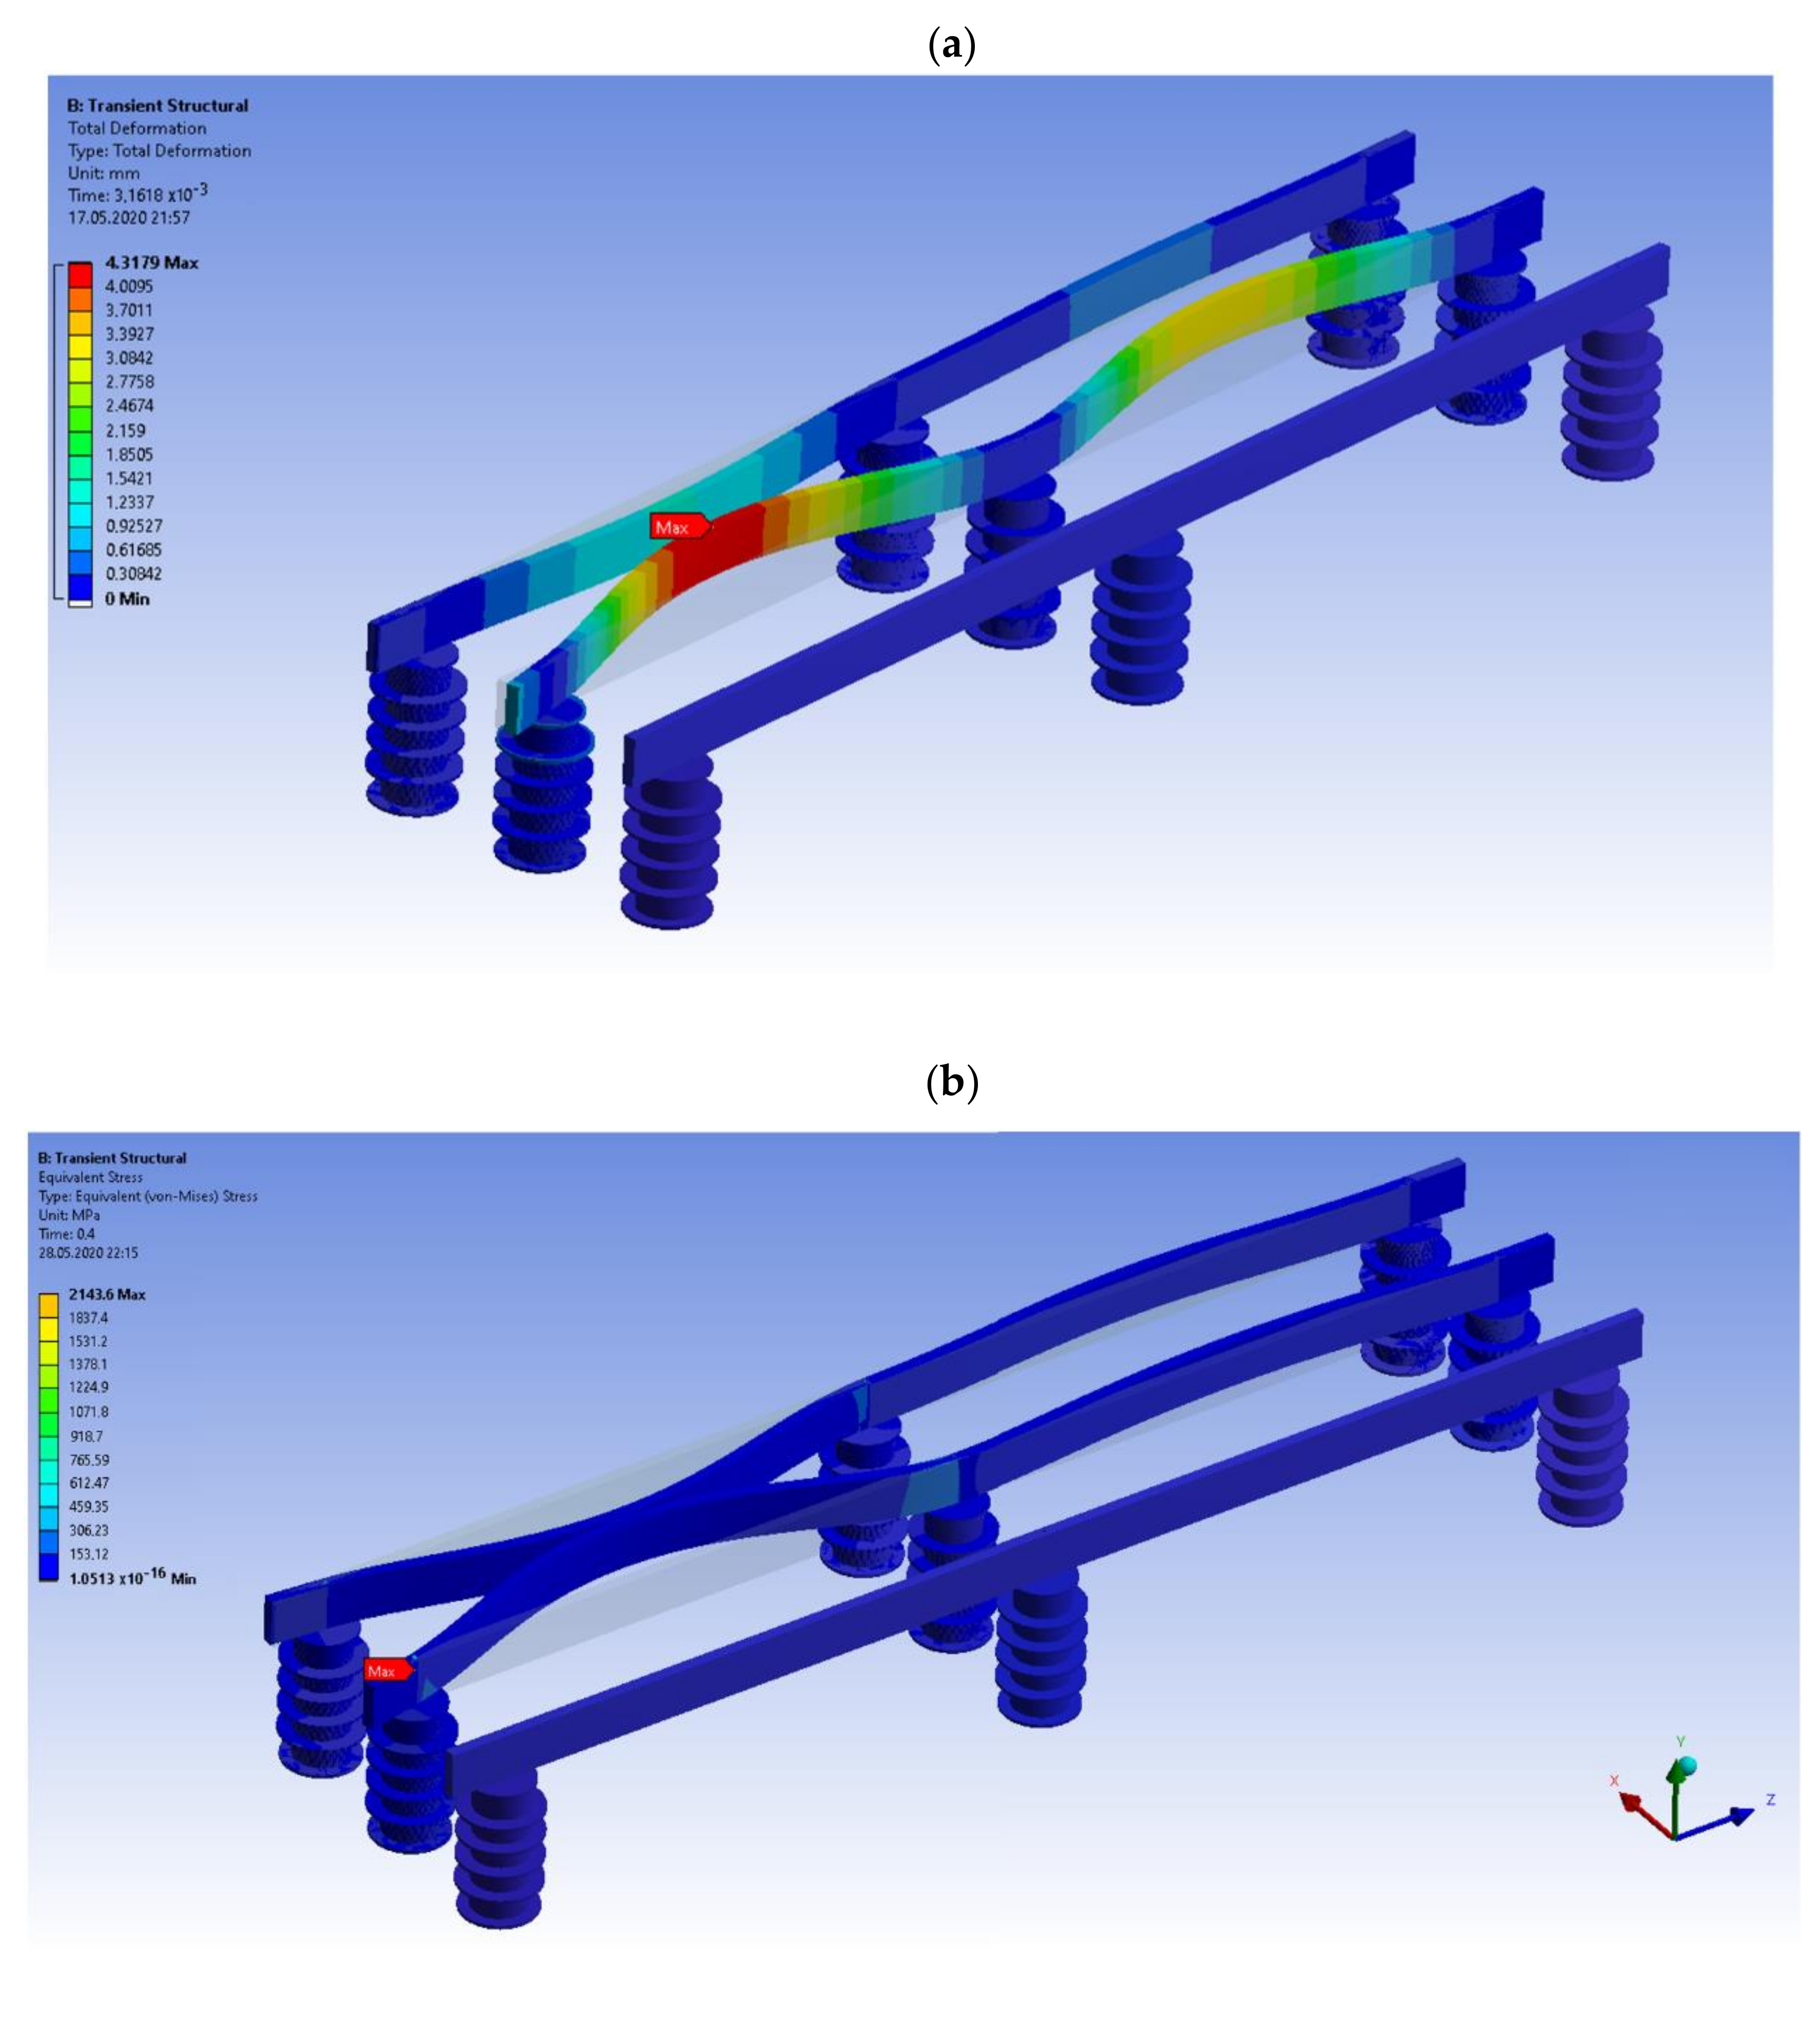
5.1. Simulation Results

The results showing the maximum values were compared. The most interesting values obtained are the values of the mechanical stresses and electrodynamic forces within the insulators’ mountings and the middle part of the busbars between the insulators. Not only were the allowable resistance of the conductor and the selection of insulators checked, but also the convergence with the analytical calculations. Sample results are shown below. The differences obtained as deviations of the maximum values of the electrodynamic forces are equal to 5.5%. In the event of an error at this level, the maximum calculated value of allowable stress in the insulator and conductor is still not exceeded. The simulations were made for the system shown in Figure 9.
In the simulation tests, the currents as shown in Figure 10, were implemented. In the system of parallel rails, the maximum deviation was expressed in mm, reduced mechanical stresses and their time characteristics expressed in MPa (von Mises). The characteristics of the electrodynamic forces are expressed in N. Those results are presented in Figure 11 and Figure 12 below.
Only parallel current circuits (round or rectangular) were considered in this publication. Alternatively, an electrical apparatus was selected for consideration. However, it is a disconnector, i.e., a system of parallel rails (cross-sectional area). Exemplary results are presented in Figure 13 and Figure 14.
In terms of the nature of the electrodynamic forces for time up to 0.24 s, a very large convergence of results can be noticed. This confirms the correctness of the implemented methodology. Correctly specified:
  • Material features;
  • Boundary conditions; and
  • Type and kind of simulation.
It is also worth noting that the results concerning the value of the electrodynamic forces are consistent between the analytical and numerical calculations. Table 4 shows a comparison of the results for selected short circuit currents.
The results in Table 4 show that the differences between the analytical and numerical calculations that are not exceeding 10%. It is worth noting the differences between quite unusual short-circuits from the point of view of analytical calculations are presented here. It is a situation in which the currently used dependencies (not only in standards, but also in the world of science) treat the asymmetric short circuit current as symmetrical. Hence, current circuits may often be oversized (despite the lack of indications from the current and hence thermal exposure), and at the same time underestimating the quantity and quality of insulating supports. The opposite situations are also possible, when the current carrying capacity indicates the correct selection of the cross-sections, but those will not ensure the correct electrodynamic forces value. Hence, building dynamic FEM models in the manner shown above guarantees the correctness of calculations in the construction of not only low voltage switchgears, but also medium voltage and high-voltage secondary circuits. The confirmation of the presented considerations is the implementation into mass production of low voltage switchgear using the above-mentioned model.

5.2. Model Employment in Electrotechnical Analyzes

The model prepared in such a way was successfully used to calculate the power supply and busbars for low voltage switchgear. A series of numerical calculations related to the designation and mechanical checking of current circuits cross-sections, as well as the quantity and quality of insulators were performed. Figure 15 shows the deformations in mm for the four selected times in short circuit conditions.
Figure 16 shows the waveforms of electrodynamic forces for the points in Figure 15d.
Figure 17 shows the waveforms of electrodynamic forces in parallel, flat low-voltage current circuits. These are representations of the results of analytical calculations for the short circuit current, the course of which is shown in Figure 18 [24]. It has been noticed that the rate of the electrodynamic forces value on the exposed rail is twice as high.
The simulation results presented in Figure 12a and Figure 16 show a high convergence with the results of analytical calculations as to the value and nature of changes. Of course, in the case of current circuits in the switchgear, waveforms are caused by the occurrences (especially Figure 16):
-
Contacts (flat connections);
-
Current circuit system (these are not only parallel current circuits);
-
Influence of switchgear operation (natural housing vibrations).
It is worth noting and emphasizing that the results of the calculations were used in the construction of the switchgear. Type tests according to specific subject standards were successful. The presented model and approach to the calculation of electrodynamic forces in high-current circuits can, therefore, be used to build similar switchgears.

6. Conclusions

The results are consistent not only with the theory and examples of normative calculations for asymmetric short circuit currents (IEC 60609 standard), but also with the analytical calculations presented in this work. The discrepancies are the result of simplifications in the case of analytical calculations for asymmetric short circuit currents. Additionally, the analysis of the maximum values of the electrodynamic forces and reduced stresses for certain other short circuit currents for the same rail system were also performed.
The presented results clearly show that it is worth stabilizing the current circuits by choosing proper supporting insulators. Despite the large electrodynamic forces occurring in power supply lines and the mechanical stresses stabilization on the receiving lines is achieved. Not only are the maximum values much lower than those allowed for copper tracks, but also their waveforms are very similar. The work was performed by simulating a three-phase busbar system in a similar way. Hence the force is distributed over the entire discharge system. The risk of transmission of vibrations to the power supply devices was also reduced, which is especially important in the case of a rigid connection.
The work is essential in order to provide the highlights for constructing the new types of medium- and low-voltage switchgears and their simulations, which is considered as future works. This work is also part of electrical contact systems research which are the main subject of this team’s scientific interest.

Author Contributions

Conceptualization, M.S., S.Ł., Ł.K. (Łukasz Kolimas), Ł.K. (Łukasz Kozarek), D.D.R.; Data curation, M.S., S.Ł., Ł.K. (Łukasz Kolimas), Ł.K. (Łukasz Kozarek), D.D.R.; Formal analysis, M.S., S.Ł., Ł.K. (Łukasz Kolimas), Ł.K. (Łukasz Kozarek), D.D.R.; Investigation, M.S., S.Ł., Ł.K. (Łukasz Kolimas), Ł.K. (Łukasz Kozarek), D.D.R.; Methodology, M.S., S.Ł., Ł.K. (Łukasz Kolimas), Ł.K. (Łukasz Kozarek), D.D.R.; Project administration, M.S., S.Ł., Ł.K. (Łukasz Kolimas), Ł.K. (Łukasz Kozarek), D.D.R.; Resources, M.S., S.Ł., Ł.K. (Łukasz Kolimas), Ł.K. (Łukasz Kozarek), D.D.R.; Supervision, M.S., S.Ł., Ł.K. (Łukasz Kolimas), Ł.K. (Łukasz Kozarek), D.D.R.; Validation, M.S., S.Ł., Ł.K. (Łukasz Kolimas), Ł.K. (Łukasz Kozarek), D.D.R.; Visualization, M.S., S.Ł., Ł.K. (Łukasz Kolimas), Ł.K. (Łukasz Kozarek), D.D.R.; Writing—original draft, M.S., S.Ł., Ł.K. (Łukasz Kolimas), Ł.K. (Łukasz Kozarek), D.D.R.; Writing—review & editing, M.S., S.Ł., Ł.K. (Łukasz Kolimas), Ł.K. (Łukasz Kozarek), D.D.R.; All authors have read and agreed to the published version of the manuscript.

Funding

This research received no external funding

Conflicts of Interest

The authors declare no conflict of interest.

References

  1. Wang, S.; Wang, S.; Li, H.; Yuan, D.; Wang, S. Mechanical characteristics analysis of defective transformer windings under short-circuit fault using 3-D FEM. In Proceedings of the 2017 20th International Conference on Electrical Machines and System (ICEMS), Sydney, Australia, 11–14 August 2017. [Google Scholar]
  2. Kadkhodaei, G.; Sheshyekani, K.; Hamzeh, M.; Tavakoli, S.D. Multiphysics analysis of busbars with various arrangements under short-circuit condition. IET Electr. Syst. Transp. 2016, 6, 237–245. [Google Scholar] [CrossRef]
  3. Vladimir, N.; Ančić, I.; Šestan, A. Effect of ship size on EEDI requirements for large container ships. J. Mar. Sci. Technol. 2018, 23, 42–51. [Google Scholar] [CrossRef]
  4. International Electrotechnical Commission. High-Voltage Switchgear and Controlgear—Part 102: Alternating Current Disconnectors and Earthing Switches; IEC 62271-102:2012; International Electrotechnical Commission: Geneva, Switzerland, 2018. [Google Scholar]
  5. International Electrotechnical Commission. Short-Circuit Currents—Calculation of Effects—Part 1: Definitions and Calculation Methods; IEC 60865-1:2011; International Electrotechnical Commission: Geneva, Switzerland, 2012. [Google Scholar]
  6. Kulas, S.; Kolimas, Ł.; Piskała, M. Electromagnetic forces on contacts. In Proceedings of the IEEE Confrerence, Padova, Italy, 1–4 September 2008. [Google Scholar]
  7. Kolimas, Ł.; Łapczyński, S.; Szulborski, M. Tulip contacts: Experimental studies of electrical contacts in dynamic layout with the use of FEM software. Int. J. Electr. Eng. Educ. 2019, 1, 1–4. [Google Scholar] [CrossRef]
  8. Kolimas, Ł.; Łapczyński, S.; Szulborski, M.; Świetlik, M. Low voltage modular circuit breakers: FEM employment for modelling of arc chambers. Bull. Pol. Acad. Sci. Tech. Sci. 2020, 68, 1–10. [Google Scholar]
  9. Jiaxin, Y.; Yang, W.; Lei, W.; Xiaoyu, L.; Huimin, L.; Longqing, B. Thermal dynamic stability analysis for the enclosed isolated-phase bus bar based on the subsegment calculation model. IEEE Trans. Compon. Packag. Manuf. Technol. 2018, 8, 626–634. [Google Scholar] [CrossRef]
  10. Williams, D.M. Human factors affecting bolted busbar reliability. In Proceedings of the 2016 IEEE 62nd Holm Conference on Electrical Contacts (Holm), Clearwater Beach, FL, USA, 9–12 October 2016; pp. 86–93. [Google Scholar]
  11. Yang, J.; Liu, Y.; Hu, D.; Wu, B.; Li, J. Transient vibration study of GIS bus based on FEM. In Proceedings of the IEEE PES Asia–Pacific Power and Energy Engineering Conference (APPEEC), Xi’an, China, 25–28 October 2016; pp. 1092–1095. [Google Scholar]
  12. Triantafyllidis, D.G.; Dokopoulos, P.S.; Labridis, D.P. Parametric short-circuit force analysis of three-phase busbars-a fully automated finite element approach. IEEE Trans. Power Deliv. 2003, 18, 531–537. [Google Scholar] [CrossRef]
  13. Yang, J.; Liu, Y.; Hu, D.; Wu, B.; Che, B.; Li, J. Transient electromagnetic force analysis of GIS bus based on FEM. In Proceedings of the International Conference on Condition Monitoring and Diagnosis (CMD), Xi’an, China, 25–28 September 2016; pp. 554–557. [Google Scholar]
  14. Guan, X.; Shu, N. Electromagnetic field and force analysis of three-phase enclosure type GIS bus capsule. In Proceedings of the IEEE PES T&D Conference and Exposition, Chicago, IL, USA, 14–17 April 2014; pp. 1–4. [Google Scholar]
  15. Popa, I.C.; Dolan, A.I. Numerical modeling of three-phase busbar systems: Calculation of the thermal field and electrodynamic forces. In Proceedings of the International Conference on Applied and Theoretical Electricity (ICATE), Craiova, Romania, 6–8 October 2016; pp. 1–9. [Google Scholar]
  16. Jiaxin, Y.; Ruichao, W.; Huimin, L.; Longqing, B.; Hongjian, W. Research on the calculation methods of enclosed isolated phase busbar in short-circuit condition. In Proceedings of the IEEE 62nd Holm Conference on Electrical Contacts (Holm), Clearwater Beach, FL, USA, 9–12 October 2016; pp. 111–114. [Google Scholar]
  17. Park, S.W.; Cho, H. A practical study on electrical contact resistance and temperature rise at at the connections of the copper busbars in switchgears. In Proceedings of the IEEE 60th Holm Conference on Electrical Contacts (Holm), New Orleans, LA, USA, 12–15 October 2014; pp. 1–7. [Google Scholar]
  18. Gatherer, J.; Jackson, R.L. A multi-variable parametric study on the performance of bolted busbar contacts. In Proceedings of the IEEE 61st Holm Conference on Electrical Contacts (Holm), San Diego, CA, USA, 11–14 October 2015; pp. 124–131. [Google Scholar]
  19. Farhana, M.; Jamil, M.K.M.; Dahaman, I.; Syafrudin, M. Study on the electromagnetic force affected by short-circuit current in vertical and horizontal arrangement of busbar system. In Proceedings of the International Conference on Electrical, Control and Computer Engineering 2011 (InECCE), Pahany, Malaysia, 21–22 June 2011; pp. 1–8. [Google Scholar]
  20. Kadkhodaei, G.; Sheshyekani, K.; Hamzeh, M. Coupled electric– magnetic–thermal–mechanical modelling of busbars under shortcircuit conditions. Generat. Transmiss. Distrib. 2016, 10, 955–963. [Google Scholar] [CrossRef]
  21. Zhong, J.Y.; Wu, S.J.; Wang, Z.; Guo, Y.J.; Qin, X.Y. A 3-D steady-state analysis of thermal behavior in EHV GIS busbar. J. Electr. Eng. Technol. 2016, 11, 781–789. [Google Scholar]
  22. Khademi-Zahedi, R.; Alimouri, P. Finite element analysis to the effect of thermo-mechanical loads on stress distribution in buried polyethylene gas pipes jointed by electrofusion sockets, repaired by PE patches. Energies 2018, 11, 2818. [Google Scholar] [CrossRef] [Green Version]
  23. Wang, Q.; Li, Y.; Yang, W.; Jiang, Z.; Song, Y.; Jiang, S.; Luo, Q.; Liu, D. Finite element simulation of multi-scale bedding fractures in tight sandstone oil reservoir. Energies 2020, 13, 131. [Google Scholar] [CrossRef] [Green Version]
  24. Musiał, E. Rated currents in low-voltage AC installations and equipment. Biul. SEP 2011, 40, 3–50. [Google Scholar]
  25. Kowalak, D. The Dynamic of the Low-Voltage Emergency Arc. Ph.D. Thesis, Gdańsk University of Technology, Gdańsk, Poland, 2013. [Google Scholar]
  26. Krčum, M.; Zubčić, M.; Dlabač, T. Electromechanical analysis of the medium voltage earthing switch due to short-time and peak withstand current test. Energies 2019, 12, 3189. [Google Scholar] [CrossRef] [Green Version]
  27. IEC 60609—Short Circuit Current Standard. Available online: https://pdf.wecabrio.com/iec-60609.pdf (accessed on 15 May 2020).
Figure 1. Determination of electrodynamic force value acting on the busbar. (a) the method of determining the direction and sense of magnetic induction; (b) Biot-Savart law.
Energies 13 05477 g001
Figure 2. Busbar system in the switchgear after arc fault tests with the distribution of electrodynamic forces acting on individual rails of the flat busbar system at the time of: (a) metallic fault; (b) arc fault (c) damage of the busbar system after arc fault tests in the switchgear [25].
Energies 13 05477 g002
Figure 3. Example of short circuit current waveform: (a) without non-periodic component, (b) with the highest rate of non-periodic component, ino—non-periodic component, iok—periodic component.
Energies 13 05477 g003
Figure 4. Surge factor characteristics.
Energies 13 05477 g004
Figure 5. Current waveforms and their squares in the case of a single-phase short circuit current in the circuit: (a) symmetrical, (b) asymmetrical.
Energies 13 05477 g005
Figure 6. Graphical representation of modelled busbar system.
Energies 13 05477 g006
Figure 7. Characteristics used to determine the value of the reaction coefficient of the supports.
Energies 13 05477 g007
Figure 8. Graphs for determining the dynamic bending stress coefficient.
Energies 13 05477 g008
Figure 9. EIPB system drawn in ANSYS with the same geometry as for analytical calculations.
Energies 13 05477 g009
Figure 10. Short-circuit current characteristics that were implemented for simulation analyses.
Energies 13 05477 g010
Figure 11. Simulation results for studied EIPB system (graphical): (a) Deformation in mm; (b) deformation in MPa (von Mises).
Energies 13 05477 g011
Figure 12. Simulation results for studied EIPB system (characteristics): (a) Electrodynamic forces characteristic; (b) mechanical stress characteristics.
Energies 13 05477 g012
Figure 13. Top view of the earthing switch—red lines represent current lines; s1–s5 represent segments for force calculation on conductors at right angles; L11-L32 represent designations of each earthing knife [26].
Energies 13 05477 g013
Figure 14. Electrodynamic forces on earthing knifes L11 and L12 [26].
Energies 13 05477 g014
Figure 15. Results of deformations made for the low voltage switchgear at four different short circuit times: (a) T = 0.21 s; (b) T = 0.28 s; (c) T = 0.35 s; (d) T = 0.5 s.
Energies 13 05477 g015aEnergies 13 05477 g015b
Figure 16. Results of tested quantities for low voltage switchgear: electrodynamic forces (points for L1, L2, L3 from the bottom).
Energies 13 05477 g016
Figure 17. An example of the course of electrodynamic forces at a three-phase short circuit in a flat busbar system (the current in phase 1 runs as shown in Figure 15): 1—force acting on the middle rail L2, 2—force acting on the busbars L3 and L1 [24].
Energies 13 05477 g017
Figure 18. An example of the prospective short circuit current waveform at a remote short circuit in a low-voltage circuit, iAC—periodic component, iDC—non-periodic component, ik—peak current [24].
Energies 13 05477 g018
Table 1. Formulas for determining the frequency of natural vibrations concerning the wire shape and material.
Busbar
Cross-Section
Energies 13 05477 i001 Energies 13 05477 i002 Energies 13 05477 i003 Energies 13 05477 i004
Material
Copper 3.62 b l 2 · 10 5 3.62 b l 2 · 10 5 3.13 d l 2 · 10 5 3.13 d z 2 + d w 2 l 2 · 10 5
Aluminum 5.17 b l 2 · 10 5 5.17 b l 2 · 10 5 4.48 d l 2 · 10 5 4.48 d z 2 + d w 2 l 2 · 10 5
Table 2. Permissible mechanical stress values for busbars with specific shapes made of copper and aluminum.
Current Busbar MaterialType of Current Busbar Permissible Stress σ m a x
(daN/cm2)
CopperAll types1400
AluminumRectangular, round or tubular current busbar700
C-section current busbar500
Table 3. Graphs for determining the dynamic bending stress coefficient.
Cross-Section System of Current BarsStrength Index
Energies 13 05477 i005 W = h b 2 6   0.167   b h 2
Table 4. Comparison of the results for selected short circuit currents.
Short Circuit Current I (kA)Electrodynamic Forces (N)—Analytical CalculationsElectrodynamic Forces (N)—Numerical CalculationsPercentage Difference (%)
208908069.4
40193617857.8
60260023848.3
Publisher’s Note: MDPI stays neutral with regard to jurisdictional claims in published maps and institutional affiliations.

