Membrane-Assisted Removal of Hydrogen and Nitrogen from Synthetic Natural Gas for Energy-Efficient Liquefaction
by
 , , ,
, , ,
Muhammad Abdul Qyyum
1,† ,
,
Yus Donald Chaniago
1,† ,
,
Wahid Ali
2 ,
,
Hammad Saulat
3 and
Moonyong Lee
1,* 1
School of Chemical Engineering, Yeungnam University, Gyeongsan 712-749, Korea
2
Department of Chemical Engineering and Technology, Jazan University, Jazan 45971, Saudi Arabia
3
State Key Laboratory of Fine Chemicals, School of Chemical Engineering, Dalian University of Technology, Dalian 116024, China
*
Author to whom correspondence should be addressed.
†
These authors contributed equally.
Energies 2020, 13(19), 5023; https://doi.org/10.3390/en13195023
Submission received: 19 August 2020
/
Revised: 16 September 2020
/
Accepted: 17 September 2020
/
Published: 24 September 2020
(This article belongs to the Special Issue Energy-Saving Opportunities in Liquefied Methane Value Chains)
Abstract
:Synthetic natural gas (SNG) production from coal is one of the well-matured options to make clean utilization of coal a reality. For the ease of transportation and supply, liquefaction of SNG is highly desirable. In the liquefaction of SNG, efficient removal of low boiling point impurities such as hydrogen (H2) and nitrogen (N2) is highly desirable to lower the power of the liquefaction process. Among several separation processes, membrane-based separation exhibits the potential for the separation of low boiling point impurities at low power consumption as compared to the existing separation processes. In this study, the membrane unit was used to simulate the membrane module by using Aspen HYSYS V10 (Version 10, AspenTech, Bedford, MA, United States). The two-stage and two-step system designs of the N2-selective membrane are utilized for SNG separation. The two-stage membrane process feasibly recovers methane (CH4) at more than 95% (by mol) recovery with a H2 composition of ≤0.05% by mol, but requires a larger membrane area than a two-stage system. While maintaining the minimum internal temperature approach value of 3 °C inside a cryogenic heat exchanger, the optimization of the SNG liquefaction process shows a large reduction in power consumption. Membrane-assisted removal of H2 and N2 for the liquefaction process exhibits the beneficial removal of H2 before liquefaction by achieving low net specific power at 0.4010 kW·h/kg·CH4.
1. Introduction
Energy plays a pivotal role in the economic and social development of any country and is considered as the backbone of industrialization. The industrial development and sustainable economic growth of any developing, and even developed, country are directly related to their energy demands. Energy demand has been increasing rapidly owing to the swiftly growing population and human activities aiming toward improved living standards [1]. According to the U.S. Energy Information Administration (EIA), the global energy demand is expected to increase by 48% between 2012 and 2040 [2].
Among all fossil fuels, coal has been a major source of energy. However, the direct use of coal has been proscribed due to the significant toxic emissions during its burning. Therefore, the clean utilization of coal is gaining much importance [3]. Synthetic natural gas (SNG), also known as substitute natural gas [4], has emerged as a potential solution to use coal cleanly because SNG mainly consists of methane. Like conventional natural gas (NG), SNG is considered to be a clean and energy-efficient fuel that has the potential to fulfill global clean energy demands.
The conventional method of SNG production is based on the gasification of coal and biomass. Gasification of coal for the production of SNG is one of the most optimal approaches for the effective usage of coal in an environment-friendly manner [5]. Coal-rich countries such as Russia, China, and Australia are moving toward the adoption of coal gasification for the production of SNG [6]. Moreover, with the adoption of gasification techniques, low-grade coal and coal at remote locations can also be used effectively for the production of SNG [7].
To facilitate the economical and feasible transportation of SNG, liquefaction is considered as one of the best approaches, so far. The SNG can be liquefied (liquefied synthetic natural gas (LSNG)) by reducing its volume up to 600 times (analogous to conventional liquefied natural gas (LNG)) the gaseous volume at a slightly higher pressure than the atmospheric pressure [8]. SNG can be transported in both gaseous and liquid forms. In the gaseous form, it can be transported through a web of distribution pipelines, while in the liquid phase it can be easily transported over long distances (more than 3500 km) through cargo shipping [9,10]. To liquefy SNG, impurities such as CO2, CO, and low boiling point contaminations (H2 and N2) should be removed. The SNG liquefaction rate mainly depends on the proportion of CH4 gas [3], which varies between 70 and 90% [11]. The maximum feasible amount of CO2 and CO should be converted to CH4 by adopting different processes such as methanation to avoid the major problem related to CO2 freezing during liquefaction. There should be at least 90–95% CH4 content before considering liquefaction. The process of liquefaction becomes complicated and energy-intensive in the presence of H2 (−252 °C) and N2 (−195 °C). Lin et al. [6] presented SNG liquefaction processes integrated with a combined (distillation and flash columns) technique for H2 separation from CH4. They considered SNG as a binary mixture of H2 and CH4 with a composition of 3% and 97% by mole, respectively. They reported that SNG can be liquefied at the energy consumption of approximately 1086.12 kJ/Nm3 with a liquefaction rate of 90%. Whereas, most recently, Qyyum et al. [3] considered SNG (obtained after methanation) as a ternary mixture (H2 = 3.2%, N2 = 12.38%, and CH4 = 84.42% by mol). They investigated flash, stripper, and distillation-based approaches for the separation of H2 and N2 from CH4 integrated with a single mixed refrigerant (SMR) liquefaction process.
In comparison with cryogenic separation, membranes have numerous advantages, such as small footprint, simple continuous operation, and low cost [12,13,14]. However, an appropriate selection of the membrane material is crucial for achieving good gas separation (in terms of permeance and selectivity) and long-term stability [15]. N2 and H2 can be separated from CH4 via membrane technology through the molecular sieving or solution diffusion models [16]. Different types of material-based membranes such as zeolites, metal-organic frameworks (MOFs), and polymers have been studied for gas separation [17,18,19]. Membranes such as MOFs and other inorganic membranes demonstrate excellent performance under lab-scale research conditions. However, their large-scale fabrication is significantly expensive, making it difficult to compete with the polymeric membranes [14]. Compared to other types of membranes, polymeric membranes are widely used for gas separation due to the ease of large-scale preparation. Amorphous perfluoro polymers were developed as a membrane material for gas separation; polytetrafluoroethylene, Teflon, Hyflon, and Cytop exhibit decent H2 permeability, as well as other gases (such as N2 and CH4), which also exhibit decent selectivity [20].
To the best of the authors’ knowledge, in the open literature, no investigation relevant to membrane-assisted separation of H2 and N2 from CH4 integrated with a two-phase expander liquefaction process is available. In this study, SNG liquefaction performance and what can be achieved by utilization of membrane-based configurations for H2 and N2 removal from CH4 are investigated using membrane unit v3.0a [21] through Aspen HYSYS V10®. An N2-selective or glassy membrane is employed in the module for simulation with a high portion of CH4 in the ternary mixture. The investigated SNG consists of a ternary mixture of CH4, N2, and H2. However, data on ternary gases are considerably limited. Therefore, this study considers the binary mixture gas permeability for CH4 and N2 and the pure gas permeability for H2 for calculating the ideal configuration for the separation of these low boiling point impurities. For liquefaction, propane–nitrogen two-phase expander refrigeration cycle is used. The membrane separation section is optimized using a knowledge-based approach whereas the liquefaction process is optimized using Coggin’s optimization algorithm.
2. Membrane-Assisted Separation of Hydrogen and Nitrogen
This section deals with the fundamental theory of membranes, membrane model simulation, and optimization of membrane area to get efficient separation.
2.1. Fundamental Theory of Membranes
High selectivity and permeability are always desirable because a low driving force and a smaller membrane area will be needed to achieve a given separation. However, membrane materials are limited by the combination of high permeability and high selectivity, resulting in a trade-off relationship [22,23]. The primary process in the membrane process is the membrane itself, and the solution–diffusion model has been successfully used to describe the mechanism of gas transport through a polymer membrane. Gas transport through a polymer membrane can be used to describe permeation using a standard solution diffusion, as expressed in Equation (1) [16],
where (m3(STP)/m2 h) is the flux of the gas component i, is is the membrane diffusion coefficient (cm2/s) of component i, is the sorption coefficient (cm3(STP)/cm3 cm·Hg) of component i, l is the membrane thickness, and are the partial pressures of component i on either side of the membrane (surface o and l), and is the gas-phase permeability coefficient. Equation (1) can be simplified by avoiding the vapor pressure calculation [18], as shown in Equations (2) and (3),
where is the concentration-based permeability (mols/cm·s), is the Henry’s Law coefficient, is the activity coefficient of component i in the feed liquid, and is the vapor pressure of the pure component i feed. However, using Equation (2) is a poor approach because the dependence of vapor pressure (driving force) on the temperature and activity coefficients is not obscured by the term , which is a varying parameter. Therefore, it should be avoided. To achieve an appropriate solution for the membrane during the application process, the driving force needs to be calculated and the accurate equation of state should be used. Currently, available computer simulation programs facilitate the calculation of partial vapor pressures, even in the case of complex liquid mixtures, provided the appropriate equation of state is selected.
The ability of a membrane to separate two gases depends on the ratio of their permeabilities or the membrane selectivity ; for example, this ratio for N2 and CH4 can be expressed as [24]
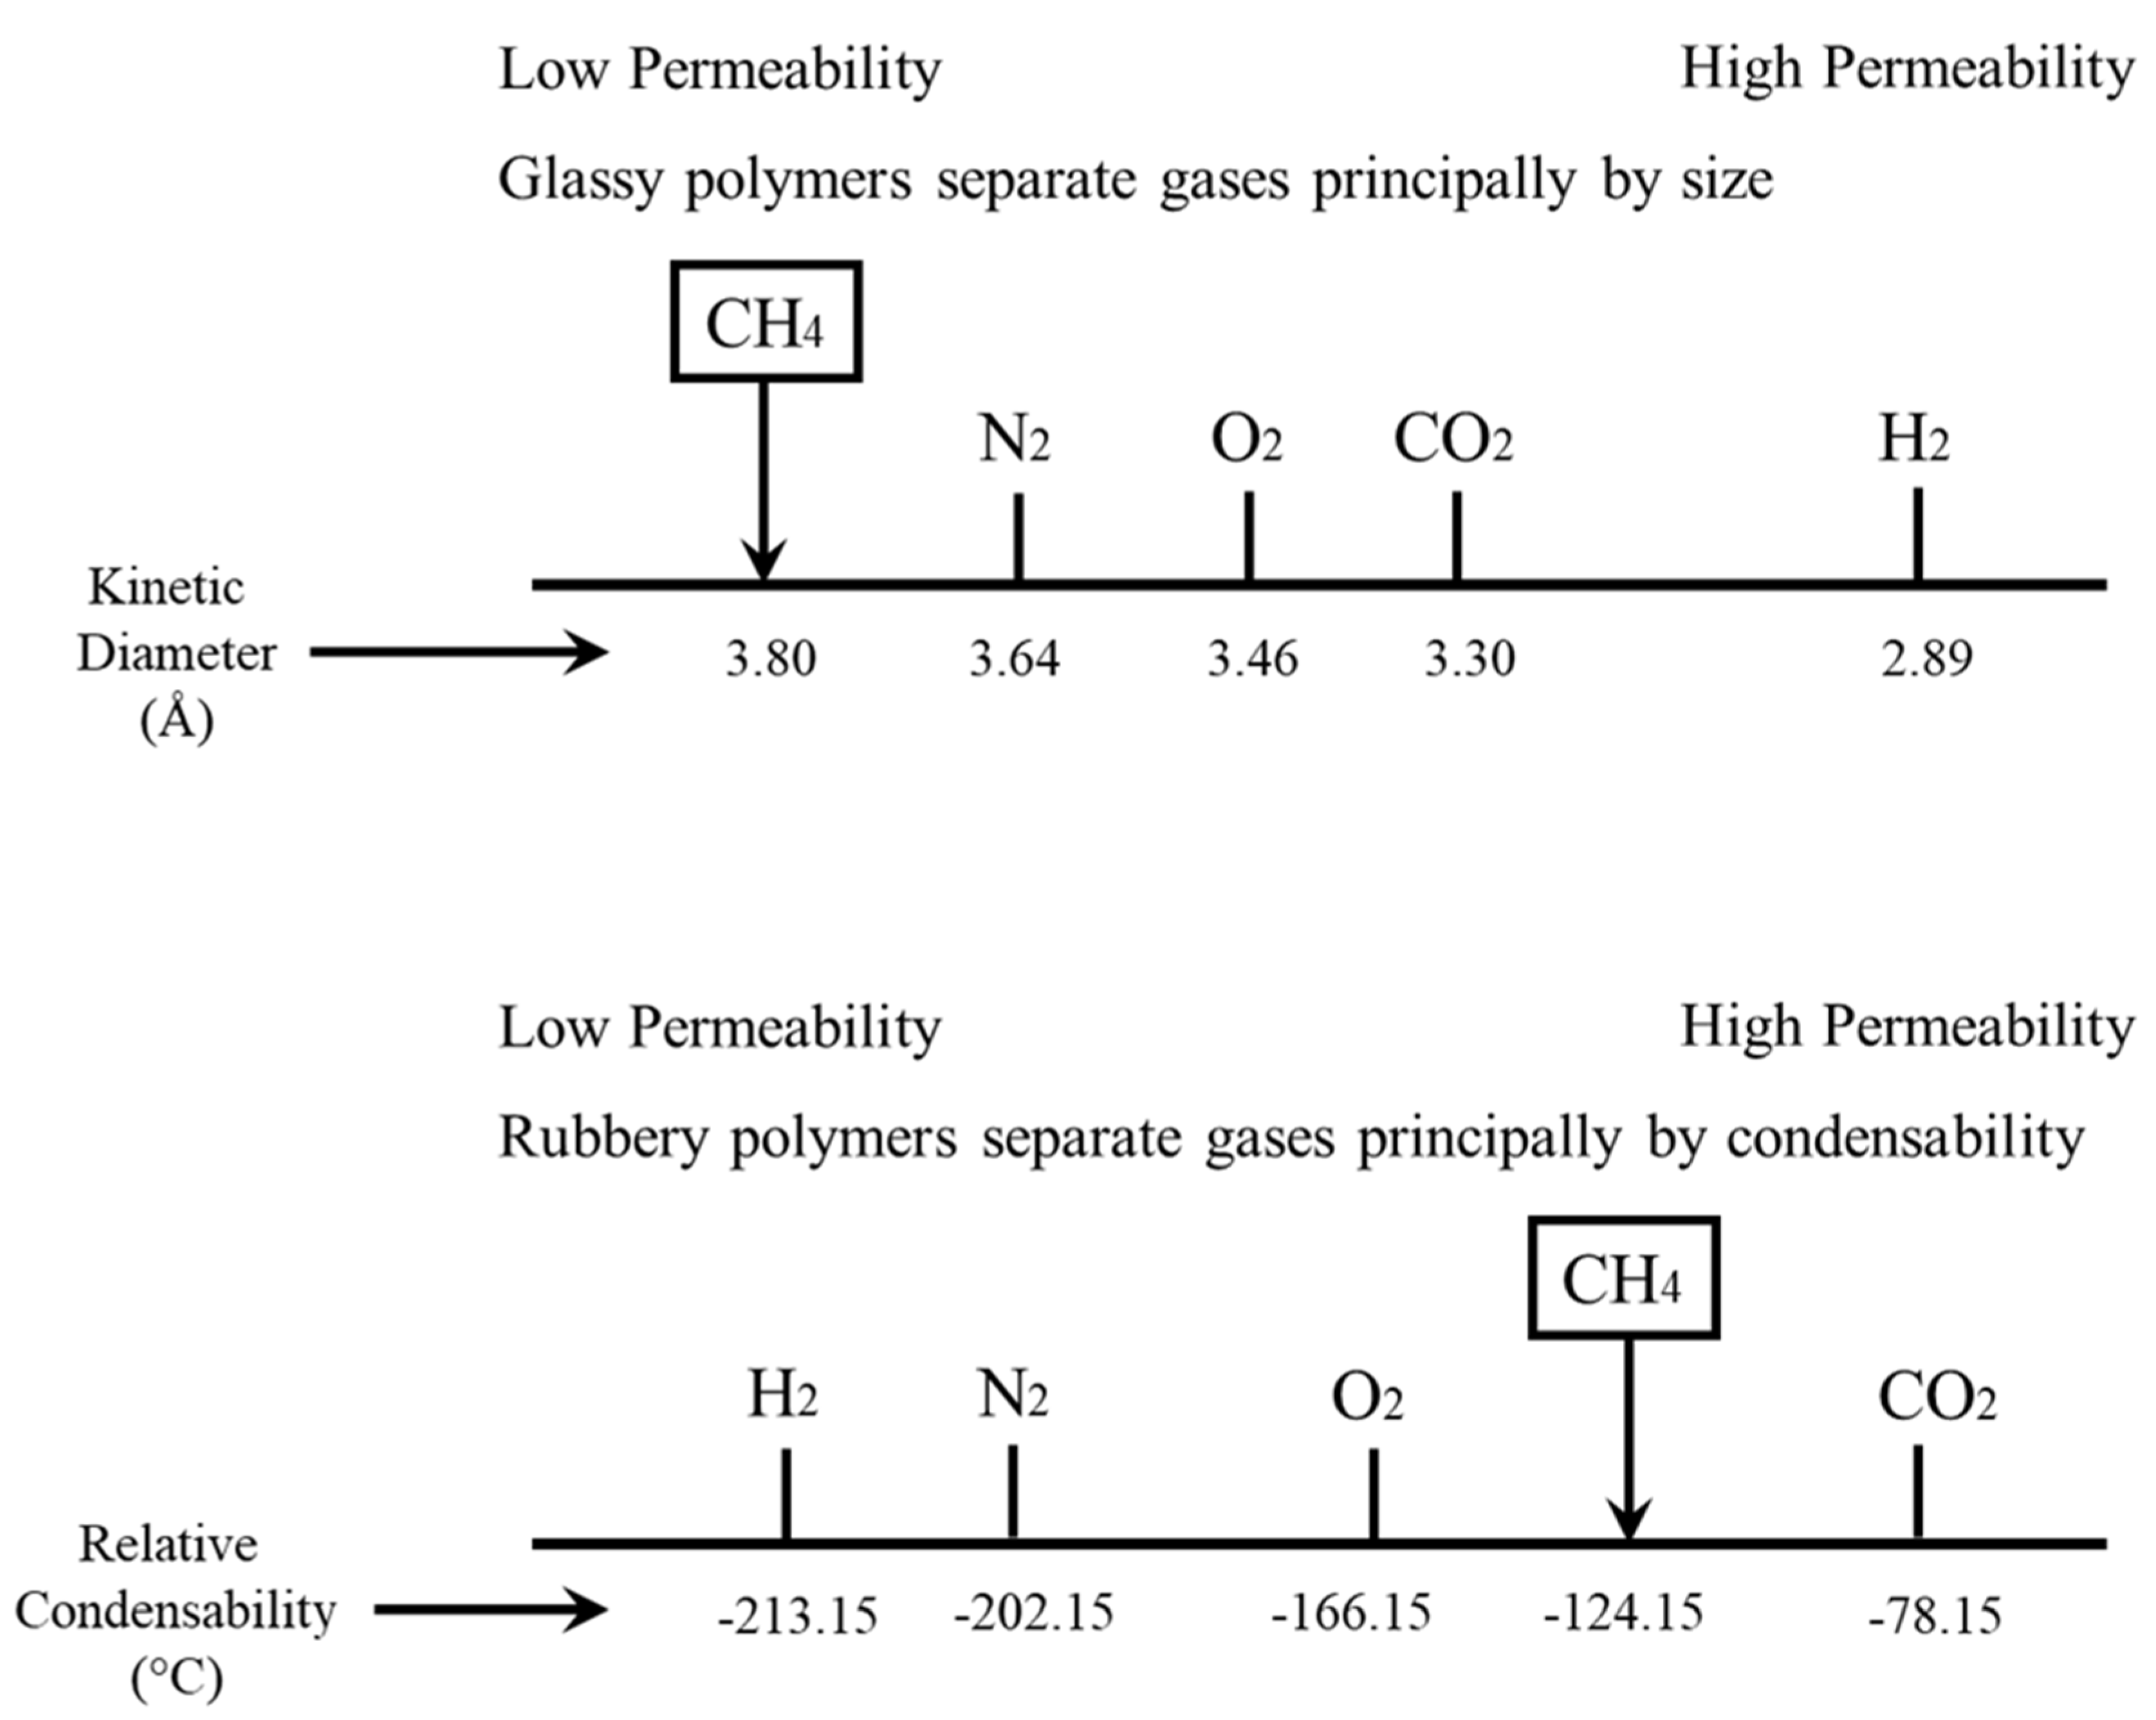
is the ratio of the diffusion efficiencies of the two gases, which is determined by the relative sizes of the two components in the gaseous mixture. The permeation of the smaller molecule is always faster as compared to their larger counterparts. The kinetic diameter of N2 is 3.64 Å, which is smaller than that of CH4 (3.80 Å). Therefore, the mobility of N2 molecules through the membrane is higher than that of CH4 molecules. is the ratio of the sorption coefficients that favor the sorption of the more condensable CH4 gas at the normal boiling point (NBP), i.e., −161.5 °C, over the less condensable gas N2 (NBP at −195.8 °C) [25]. Thus, the effect of mobility and sorption selectivity on the separation N2 and CH4 is different. The significance of the mobility selectivity term depends on the type of polymer membrane. Glassy polymers tend to permeate smaller molecules, whereas rubbery polymers tend to permeate more condensable gases. In terms of pure gas permeability, N2 permeance is faster than CH4 when using a glassy polymer membrane. However, when using a rubbery polymer membrane, CH4 is faster than N2. The gas permeabilities for several gases are illustrated in Figure 1 [20,25,26].
In this work, the proportion of CH4 in the mixture is high, and a glassy membrane or N2-selective membrane is selected for separation. During the separation process, a rubbery membrane or a CH4-selective membrane requires two separate compressors [24], which is a primary disadvantage of using such membranes. Another factor determining gas permeation is the purity of the gas; the permeation of mixed gas differs from that of pure gas. In the case of CH4 and N2, each gas permeability is varied when it in the mixture for glassy polymer membrane [27]. The gas used in this study is a ternary mixture of CH4, N2, and H2. However, permeability data on ternary gases are considerably limited. Recently, CH4, N2, and H2 ternary mixture permeability data are not available in the literature. The mixed gas permeability presents more accurate gas transport that promotes better membrane design and optimization results for further evaluation. Therefore, we consider the binary mixture gas permeability for CH4 and N2 and the pure gas permeability for H2. H2 gas has the lowest concentration in the mixture and it has the fastest permeation while using a glassy membrane. The major separation for N2 and CH4 is required after that the permeability of pure H2 in the glassy polymer membrane is reasonably applied.
2.2. Membrane Model
Membrane technology is effective when applied to small scale (6000–50,000 Nm3/h) processes [14]. In this work, a feed of 10,000 Nm3/h containing a composition from previous work is assumed [3]. Several types of membrane models have been proposed by previous studies. In one such simulation study, membrane permeability is assumed to be independent of pressure [28]. The variations in shell side pressure are considered to be negligible due to constant bulk flow in an axial direction; alternatively, the permeate side pressure drop is determined using the Hagen–Poiseuille equation; it is considered as a reasonable assumption for sufficiently low feed flow rates and small membrane areas [28,29]. In another study, a simplified short-cut model was employed to describe the gas transport through membranes [30]; this model considers the feed pressure and the permeate while neglecting the pressure drop in the retentate. A combination of CH4− and N2−selective membranes resulted in an optimal process configuration. In another approach, the HYSYS membrane module is utilized for evaluating the membrane separation process [31] by employing the membrane unit v3.0a [21]. The HYSYS membrane module has been assessed and presents good agreement results with reference literature [32]. It uses the membrane equation, which considers the log-mean pressure (LMP) and delta P in the retentate side; it is expressed in Equation (5). The HYSYS model solver uses an iterative method that is utilized also by another work [33]. In this work, the same membrane module was simulated using Aspen HYSYS V10 which utilizes Equation (5).
where,
- Fx: Permeate molar flow for component x (kmol/h)
- Perx: Permeability for component x (kmol/1000 kPa-h-m2)
- Px1: Partial pressure of component x in the input (kPa)
- Px2: Partial pressure of component x in the output (kPa)
- A: Area per unit (m2)
- N: Total number of units
Pressure and temperature affect gas transport, and the vapor pressure (i.e., the driving force of separation) depends on the temperature and activity coefficient. The pressure and temperature tend to affect the permeability of glassy polymeric membranes [34,35,36], particularly when large feed flow rates and membrane areas are used. This highlights the importance of process engineering (i.e., simulation) for determining the optimal design, because the vapor pressure and density, which also affect permeability, are highly susceptible to changes in the temperature. In this work, the membrane permeability was assumed to vary concerning the changes in pressure and temperature. As the thickness of the permselective Hyflon AD60 layer is 1 μm, the permeances expressed in gas permeation unit (GPU) coincide numerically with the permeabilities expressed in Barrer [37]. The permeance values of CH4 and N2 and the permeability of H2 are sourced from the literature [20]. However, the membrane model from HYSYS is incapable of automatically calculating the permeability at different temperatures. The model is not predictive but rather a fractionation separator. Therefore, it needs to be improved before it can be implemented in a process simulator. This is achieved by enhancing the logical unit in HYSYS. One benefit of this model is that it can control the retentate and permeate side pressure drops through the LMP. Therefore, it is feasible to control the output retentate as one of the specifications, because the output pressure will determine the temperature at the following membrane and the feed of the CH4 liquefaction process. In addition, the following conditions were assumed for the membrane model.
- The membrane model solves the permeate components flow rate for the given condition. Retentate side flowrate is solved by input and output material balance.
- There is a pressure drop on the retentate side.
- Non-ideal gas, as each component vapor pressure is calculated using the Peng–Robinson equation of the HYSYS thermodynamic package.
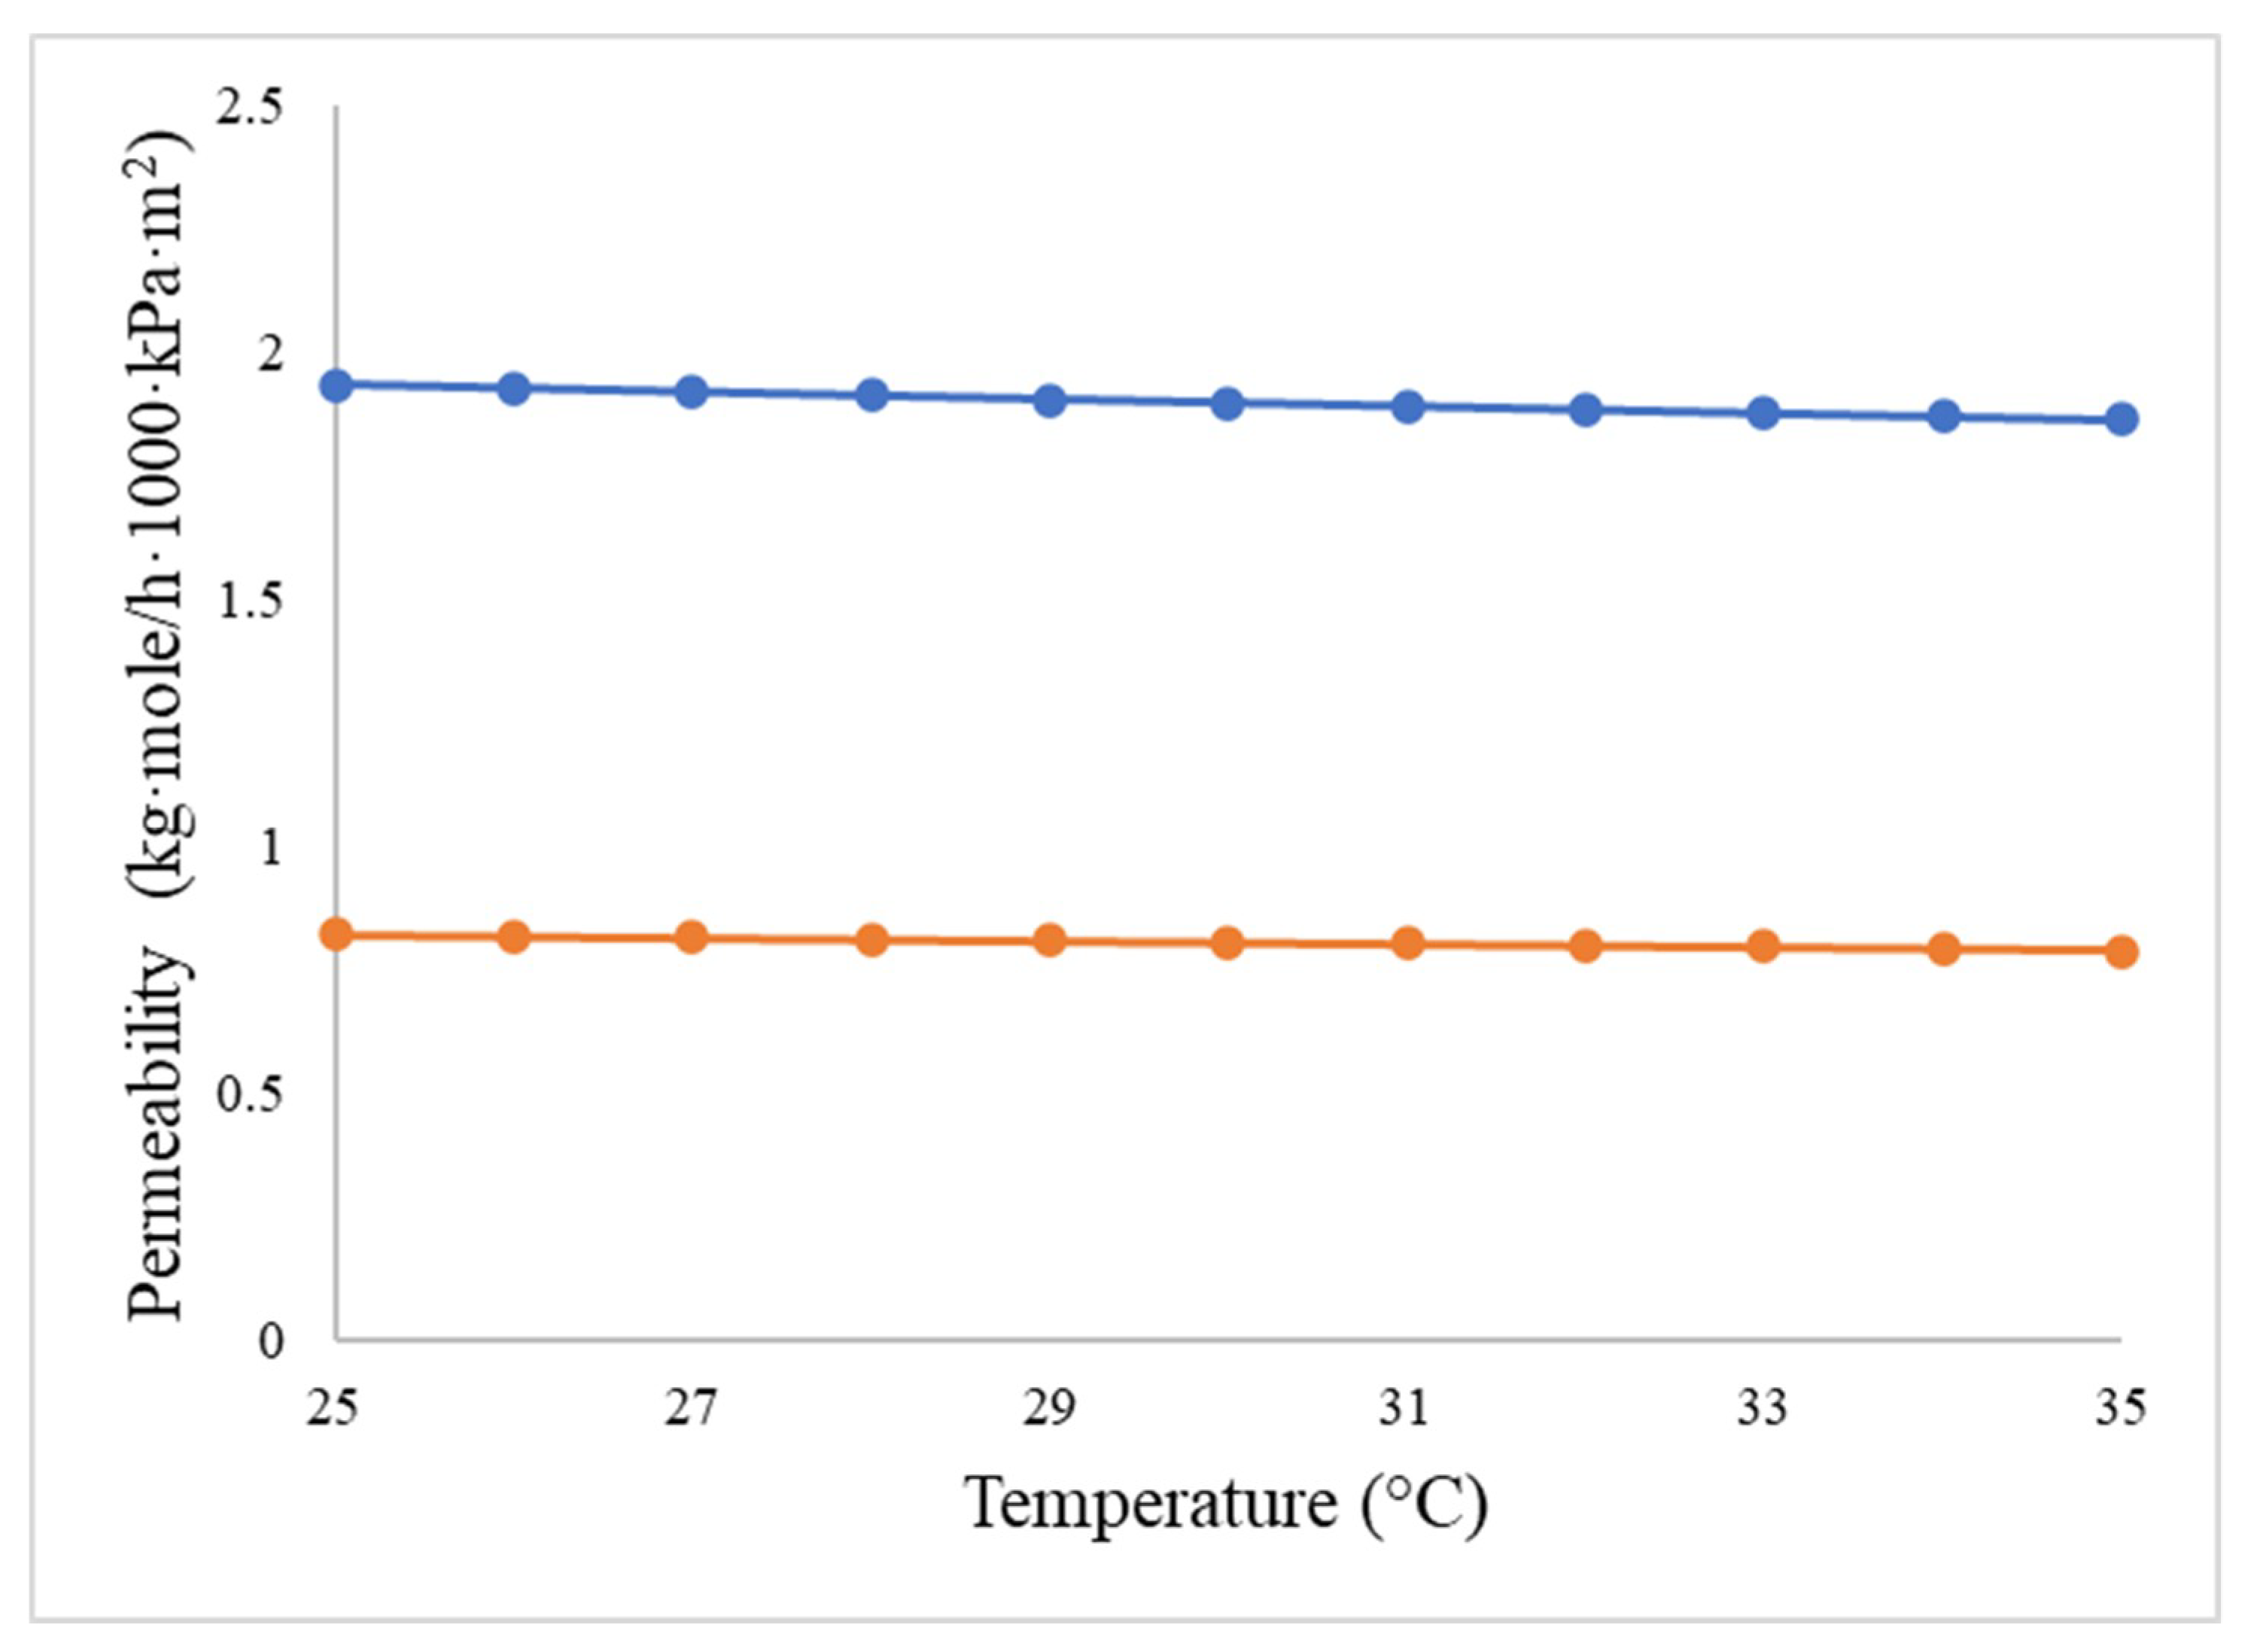
The permeability at a given pressure and temperature is used for simulating the membrane separation process after the value converges with the membrane model of HYSYS to ensure consistency. With the molar volume of gas (STP), the permeability unit is kg·mol/h·1000·kPa·m2. The permeability values are N2 = 0.060418904, CH4 = 0.024167562, and H2 = 0.435016112. Selectivity N2/CH4 = 2.5. Figure 2 shows the permeability of N2/CH4 at different temperature and constant pressure 35 bar.
2.3. Optimization of Membrane Area
Process knowledge is applied to determine the accurate membrane area for a given pressure and temperature [38]. In this case, two cases of the membrane process, two-stage membrane, and two-step membrane are explored as shown in Figure 3. The areas of Membrane 1 (MEM-1) and Membrane 2 (MEM-2) are adjusted until they converge, to determine the feasible maximum recovery and purity of CH4 for the two-stage and two-step system designs of the N2-selective membrane. To minimize the effect of H2 in the liquefaction process and storage [39], the proportion of H2 in the product before liquefaction is maintained at 0.05% mol or less.
The energy efficiency of the process depends on the key decision variables that ultimately determine the objective. It has been reported that the non-optimal selection of design variables can cause significant exergy destruction, which results in the low energy efficiency of the process. Therefore, the optimization of the process is necessary. In this study, two techniques were employed for process optimization. In the membrane separation process that removes H2 and traces of N2, a knowledge-based optimization (KBO)-based approach was used. As it is difficult to obtain the global optimum in complex processes, and due to membrane module performance, KBO-based optimization techniques can be applied to ensure the possibility to adjust the variables manually for the rigorous optimal value of the objective.
The areas of MEM-1 and MEM-2 are adjusted to obtain the maximum product at retentate-1 (RET-1) for two-stage and retentate-2 (RET-2) for the two-step membrane process. Permeate-1 (PERM-1) and permeate-2 (PERM-2) pressure and temperature for each membrane process are taken from the literature [24]. The objective in both cases was to minimize the total membrane area with feasible maximum recovery and purity of CH4 by using an N2-selective membrane. The membrane area was optimized by keeping the H2 composition ≤0.05 % mol before the liquefaction of the SNG, the details are shown in Table 1 and Table 2.
The areas of MEM-1 and MEM-2 for the two-step membrane are determined similarly.
The two-stage membrane process can maximize the recovery of CH4 at 95.934%, satisfying the H2 constraints of ≤0.05% by mole, whereas the two-step membrane process fails to achieve a CH4 recovery ≥95% at H2 constraints ≤0.05% mol, although a large membrane area is used. Both processes can achieve a methane purity of ≥89%. The key decision variables for membrane-assisted separation are shown in Table 3 and Table 4.
3. Proposed Integrated Process
This section deals with the process description, simulation basis, and optimization of the proposed integrated process.
3.1. Process Description and Simulation Basis
The proposed integrated SNG liquefaction process was simulated using a renowned commercial simulator Aspen HYSYS® V10. For the liquefaction of purified SNG, the nitrogen–propane two-phase expander refrigeration cycle presented by Qyyum et al. [40,41] was used. The thermodynamic states were determined using the Peng–Robinson equation of state. Besides, the following conditions were assumed for the simulation.
- All permeate membrane pressures are fixed at 100 kPa [24].
- Heat loss to the environment is negligible.
- The pressure drop across each interstage cooler and multistream cryogenic exchanger is negligible [42].
- The LSNG storage tank pressure is 2.0 bar [44].
- The minimum internal temperature approach (MITA) is selected as 3.0 °C, for the multi-stream cryogenic heat exchanger.
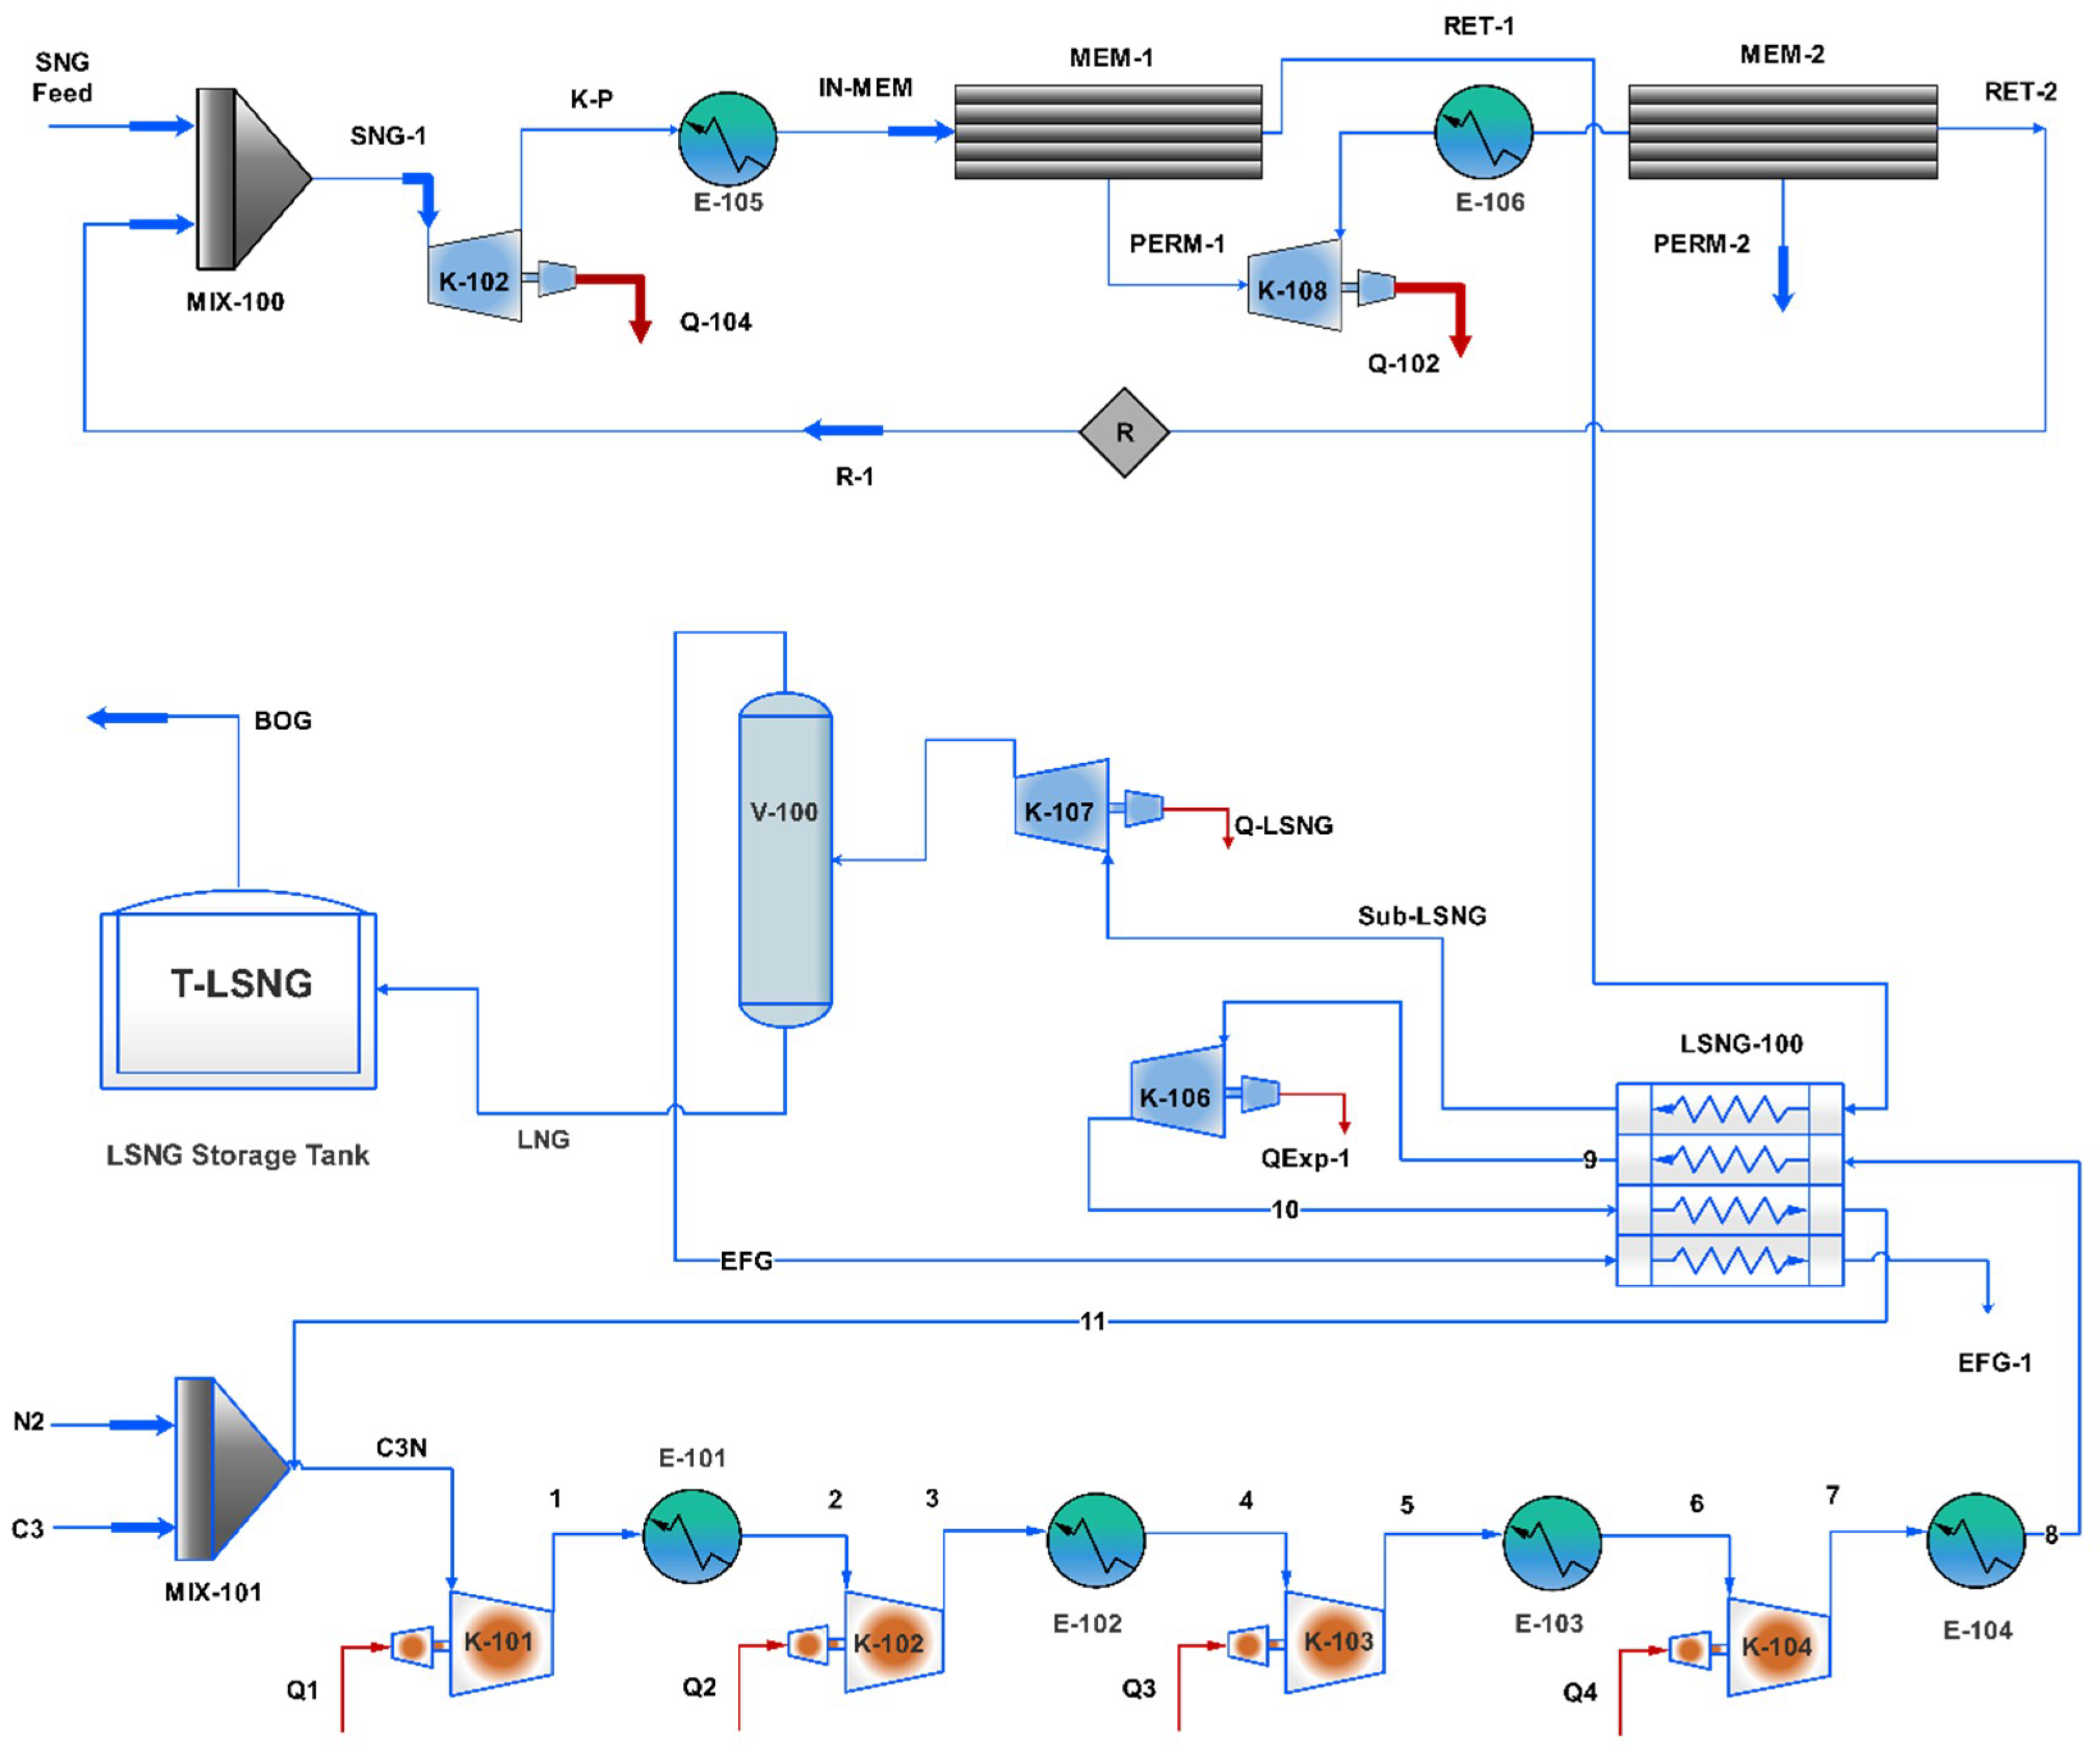
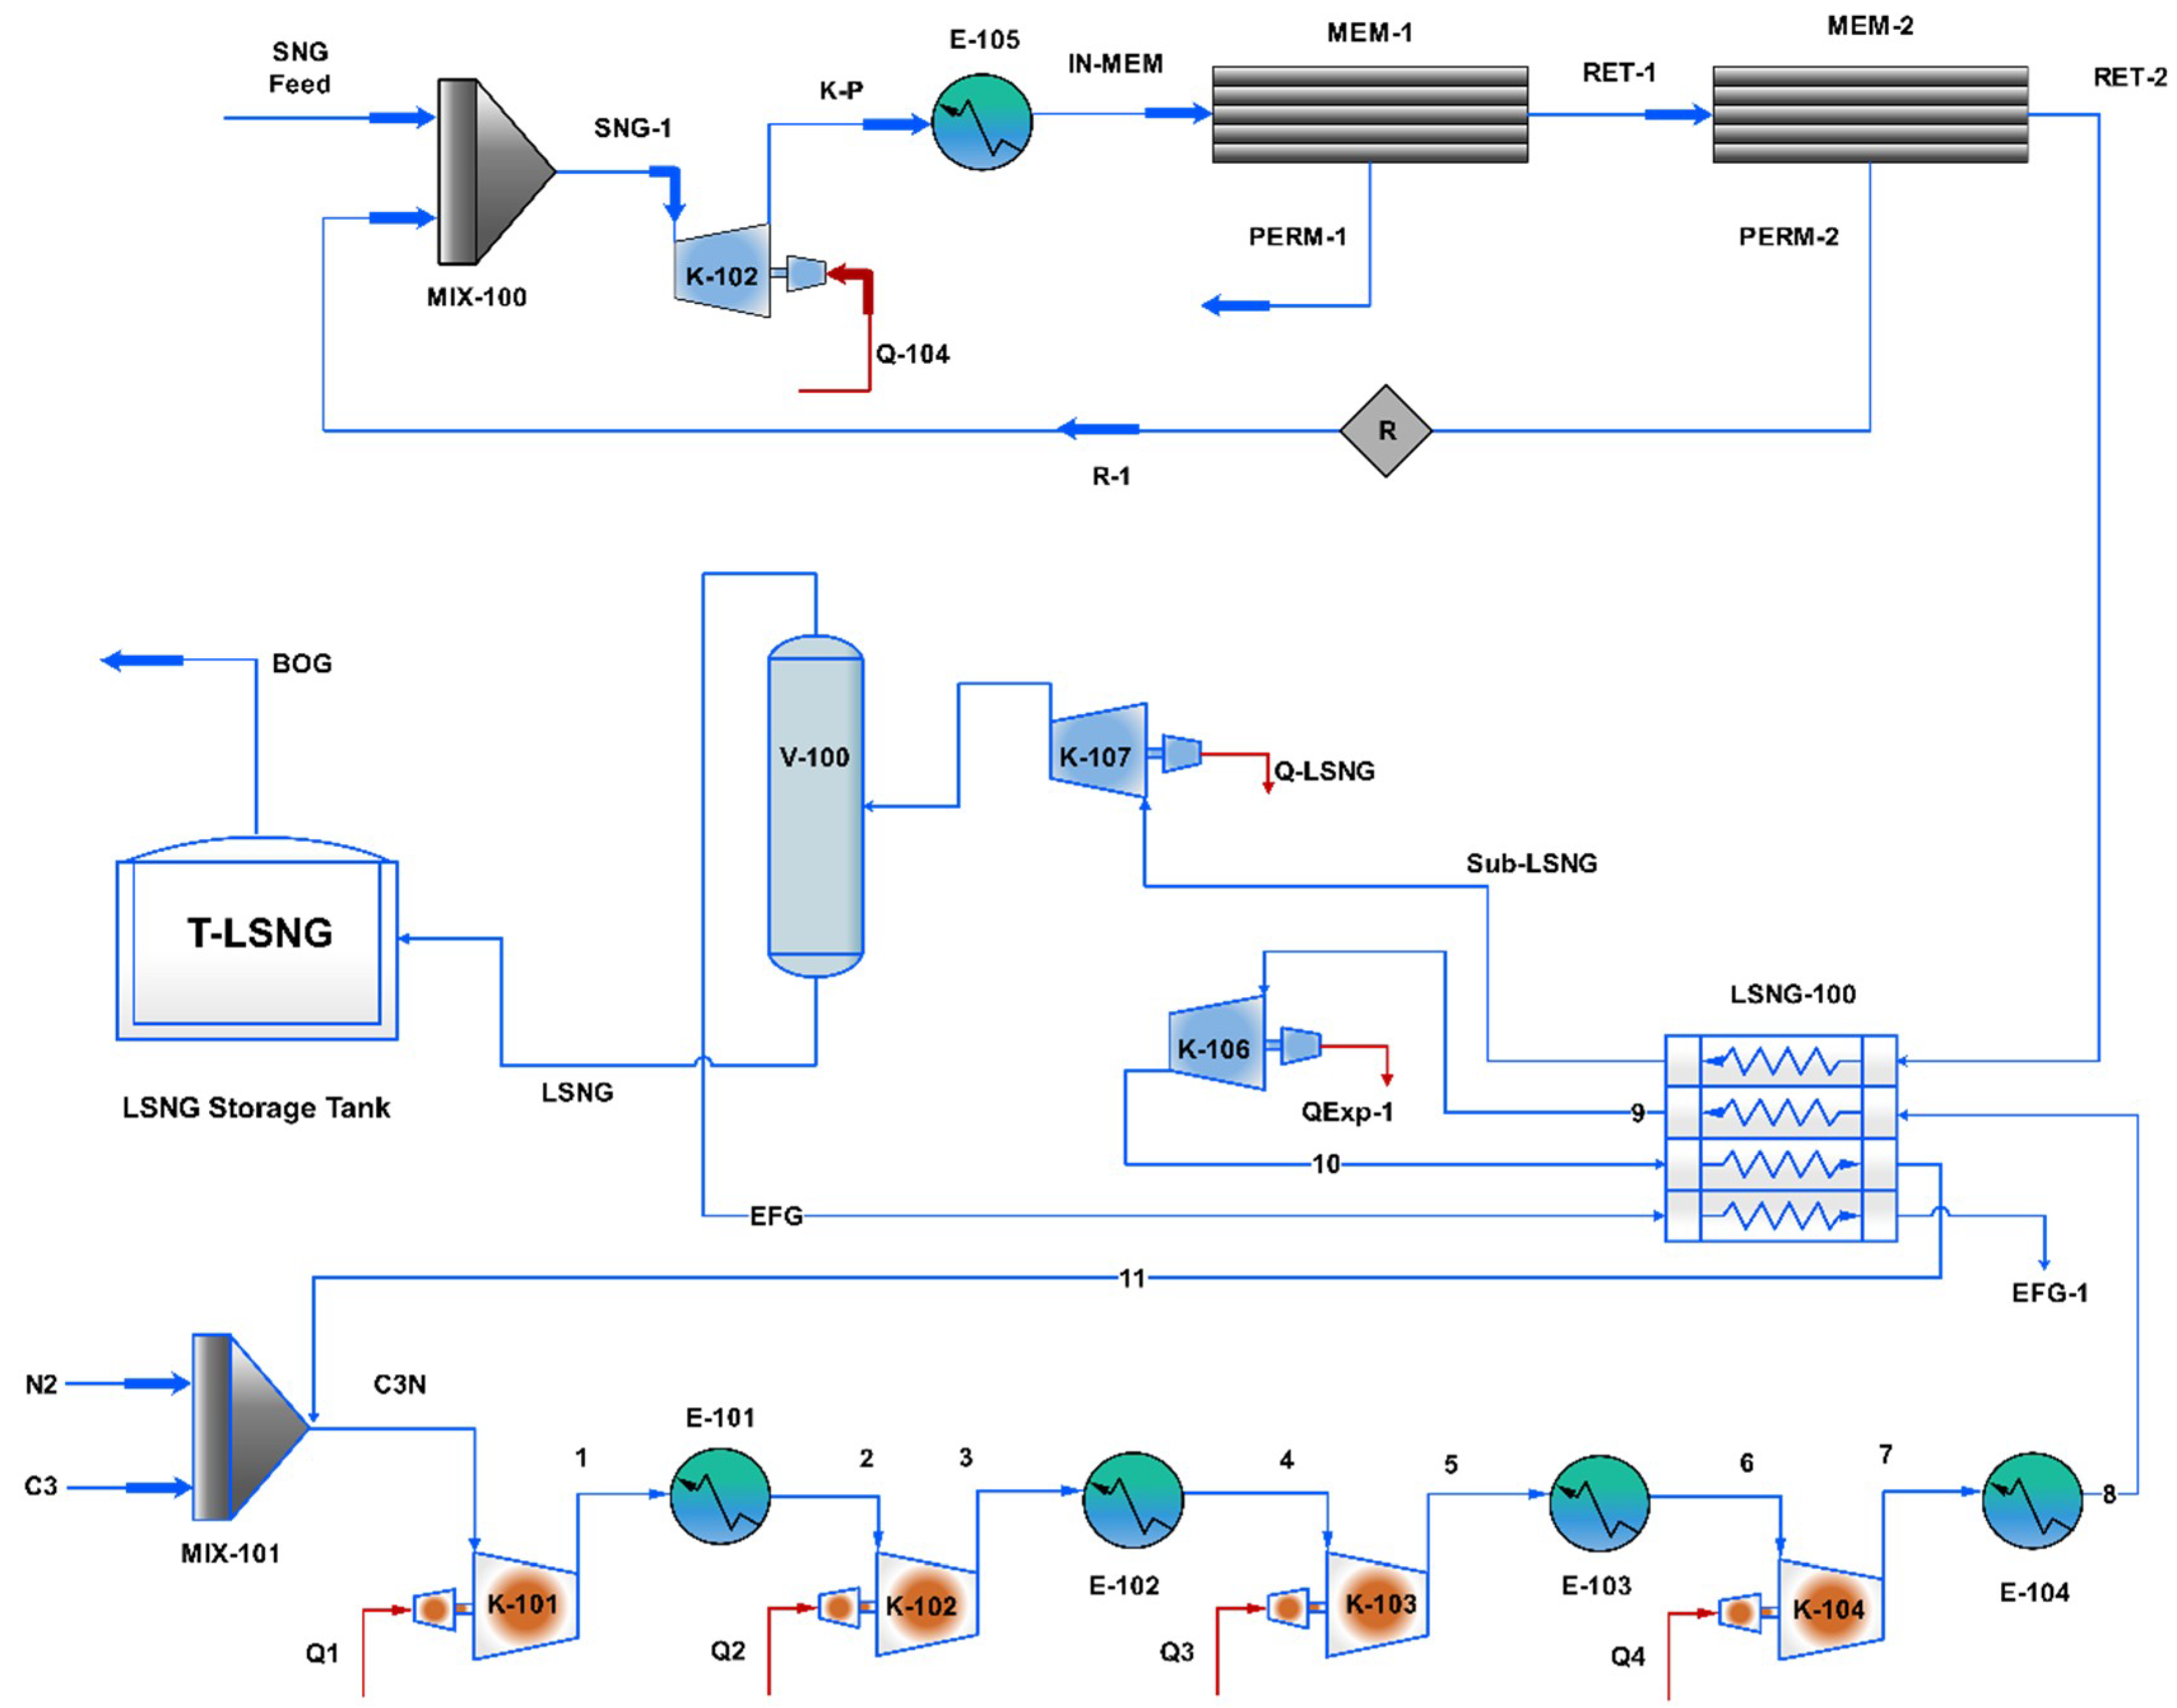
The SNG feed compositions, conditions, and basis for simulation are shown in Table 5. The process flow diagrams of the two cases (based on membrane separation configurations) of the proposed integrated process are shown in Figure 4 and Figure 5. Figure 4 presents the two-stage membrane separation integrated with the propane–nitrogen (C3N) two-phase expander liquefaction process. Figure 5 shows the two-step membrane separation integrated with C3N two-phase expander liquefaction process.
3.2. Optimization of C3N Two-Phase Expander Liquefaction Process
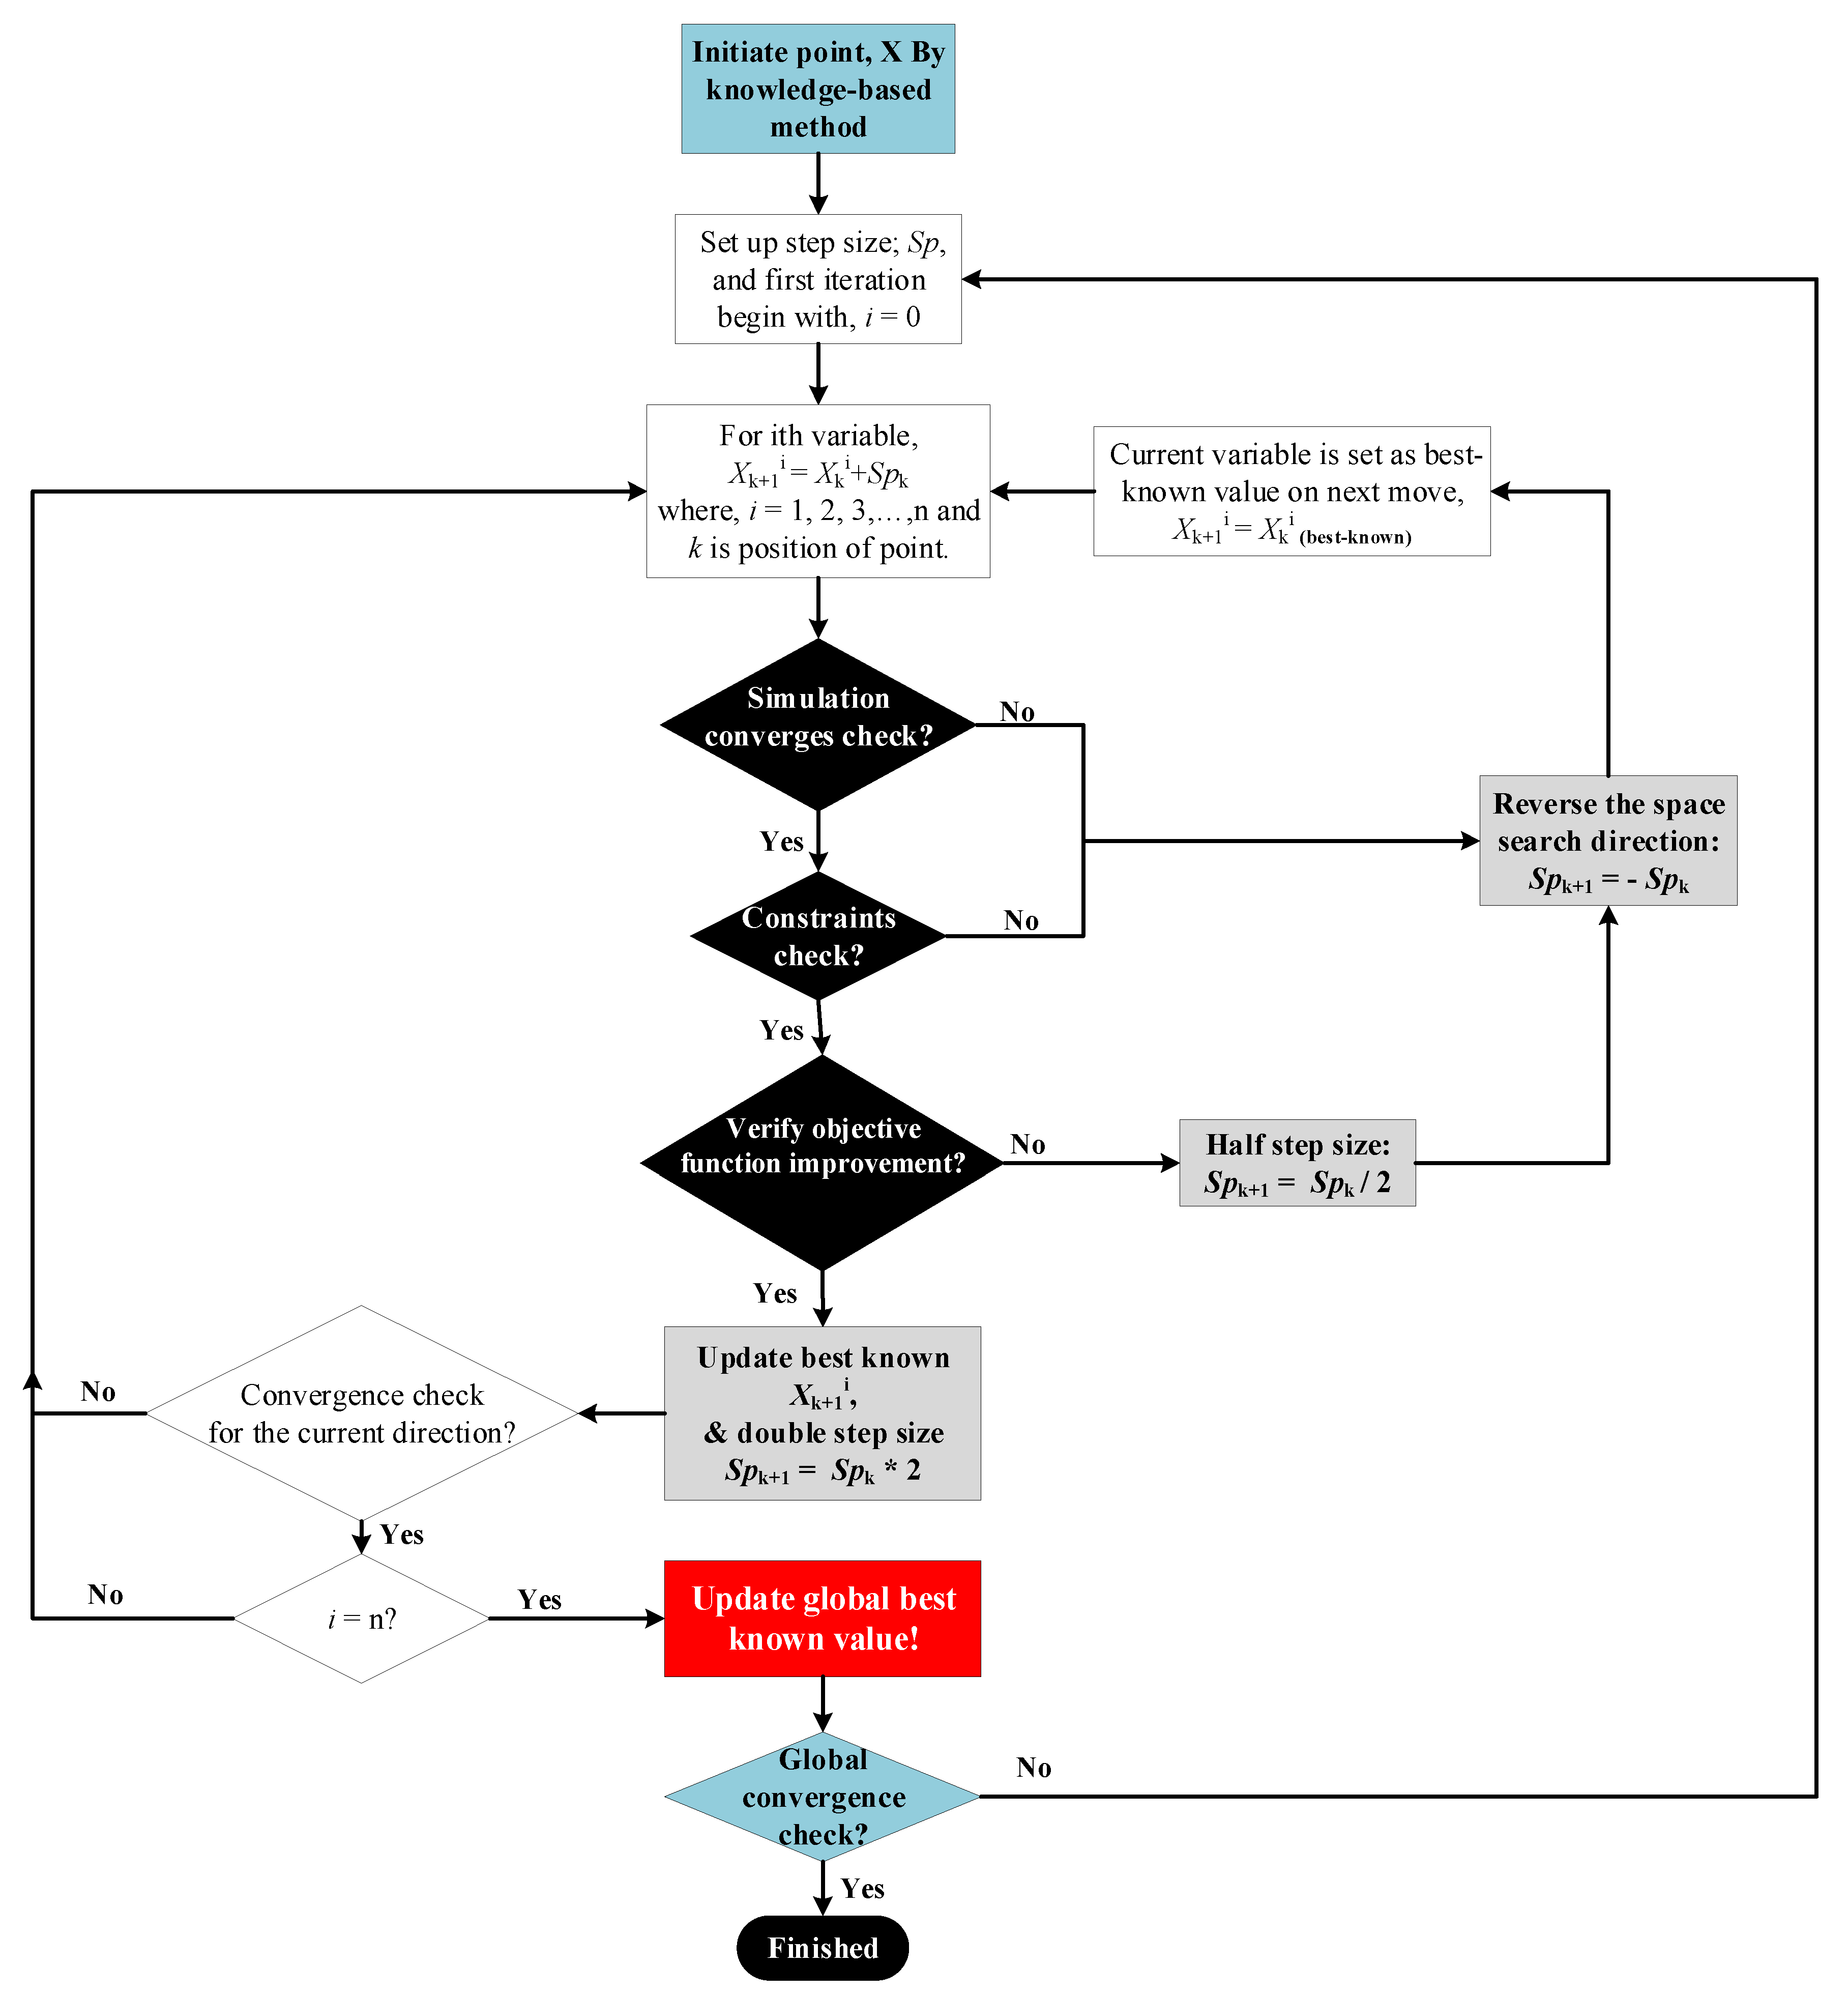
Conventional LNG processes are considered highly nonlinear, mainly due to the complex thermodynamic interactions among the design variables, constraints, and objective function [45]. The conventional optimization algorithms and built-in HYSYS optimization algorithm often fail to find the best optimal solution, owing to the termination in the infeasible region (negative MITA value) before achieving an optimal and/or meaningful solution. Therefore, this study uses the Coggins’s multivariate optimization (MCO) algorithm [46], which has been shown its potential to solve optimization problems of conventional LNG processes [47,48]. The MCO algorithm was initially proposed by Bamigbola et al. [46] for different problem sets, such as those of unconstrained n-dimensional optimization. However, unlike univariate problems, MCO requires high computational resources. For each optimization, the initial generation/guessing of points is crucial for determining the best solution with minimum computational efforts. Coggin’s algorithm focuses on an extended version of the univariate optimization method with a knowledge-based initial set of decision variables. This set is updated by the optimizer through a random search algorithm, which acquires the objective underlying constraints and the key design (decision) variables. The conceptual algorithm used for the optimization of the liquefaction section is shown in Figure 6.
The key design parameters influencing process efficiencies, such as the refrigerant flow rate, refrigerant evaporation pressure, condensation pressures, and precooling and subcooling temperatures, need to be optimized to obtain optimum design variables corresponding to minimize energy consumption. The design variables for the optimization of the liquefaction section are presented in Table 6, along with the upper and lower limits.
The optimization objective was to minimize the total power consumption while constraining the MITA value to 3.0 °C in the multi-stream cryogenic heat exchanger. The objective function can be represented as:
The objective function subjected to the MITA as constraint is
and
4. SNG Liquefaction Analysis
This section presents the analysis of SNG liquefaction process. The presented analysis consists of optimal design variables analysis and composite curves analysis.
4.1. Parametric Analyses
In this study, the impurities in the NG feed were separated using an energy-inefficient membrane process. Two base cases were proposed: case 1: two-stage process; case 2: two-step process. These processes were examined before and after the optimization. A parameter-based analysis of the processes was also performed, as depicted in Table 7. The most crucial parameter is the total amount of refrigerant flow, which was significantly high in the non-optimal case 1; it decreased from 57.61 × 10⁶ kg/h to 26.32 × 10⁶ kg/h in the optimal case 1. However, this refrigerant amount was found to be 30.92 × 10⁶ kg/h, which indicates a 46.3288% decrease compared to the base case 1.
The membrane-based impurity removal process was selected by examining the specific energy consumption (SEC) of all studies. It can be determined that the energy consumption ratio of the proposed base case 1 to that of base case 2 was 2.4071, which indicates an energy reduction of approximately 58.46% without applying optimization. Furthermore, the parameters of both base cases were optimized and the energy was compared among all alternatives. The optimal parameters are listed in Table 7; these values indicate that the total pressure required in the liquefaction cycle (i.e., a sum of low and high pressures) for MR is 56.40 bar, which is the second lowest compared to the optimized case 1. This results in the lowest energy consumption of 1.06 × 10⁶ kW. Furthermore, Table 7 reveals that the relative energy saving of the optimized case 2 is 82.61%, compared to the other optimal case. This indicates that it exhibits a higher thermodynamic efficiency than that of the optimal case 1.
Furthermore, only one compression unit and cooler are sufficient for the required pressure and cooling temperature of the membrane unit, unlike the other cases. Moreover, the MITA value of the optimal case 2 is not close to 3 °C as it further decreases power. Therefore, it shows the room to reduce its overall power. The objective (Net Specific Power) (kW/(kg⁄h)) of case 1 is 0.4010, which is lower than previous work [3] due to H2 removal before the liquefaction process.
4.2. Composite Curve Analysis
4.2.1. The Composite Curve for the Two-Stage Process
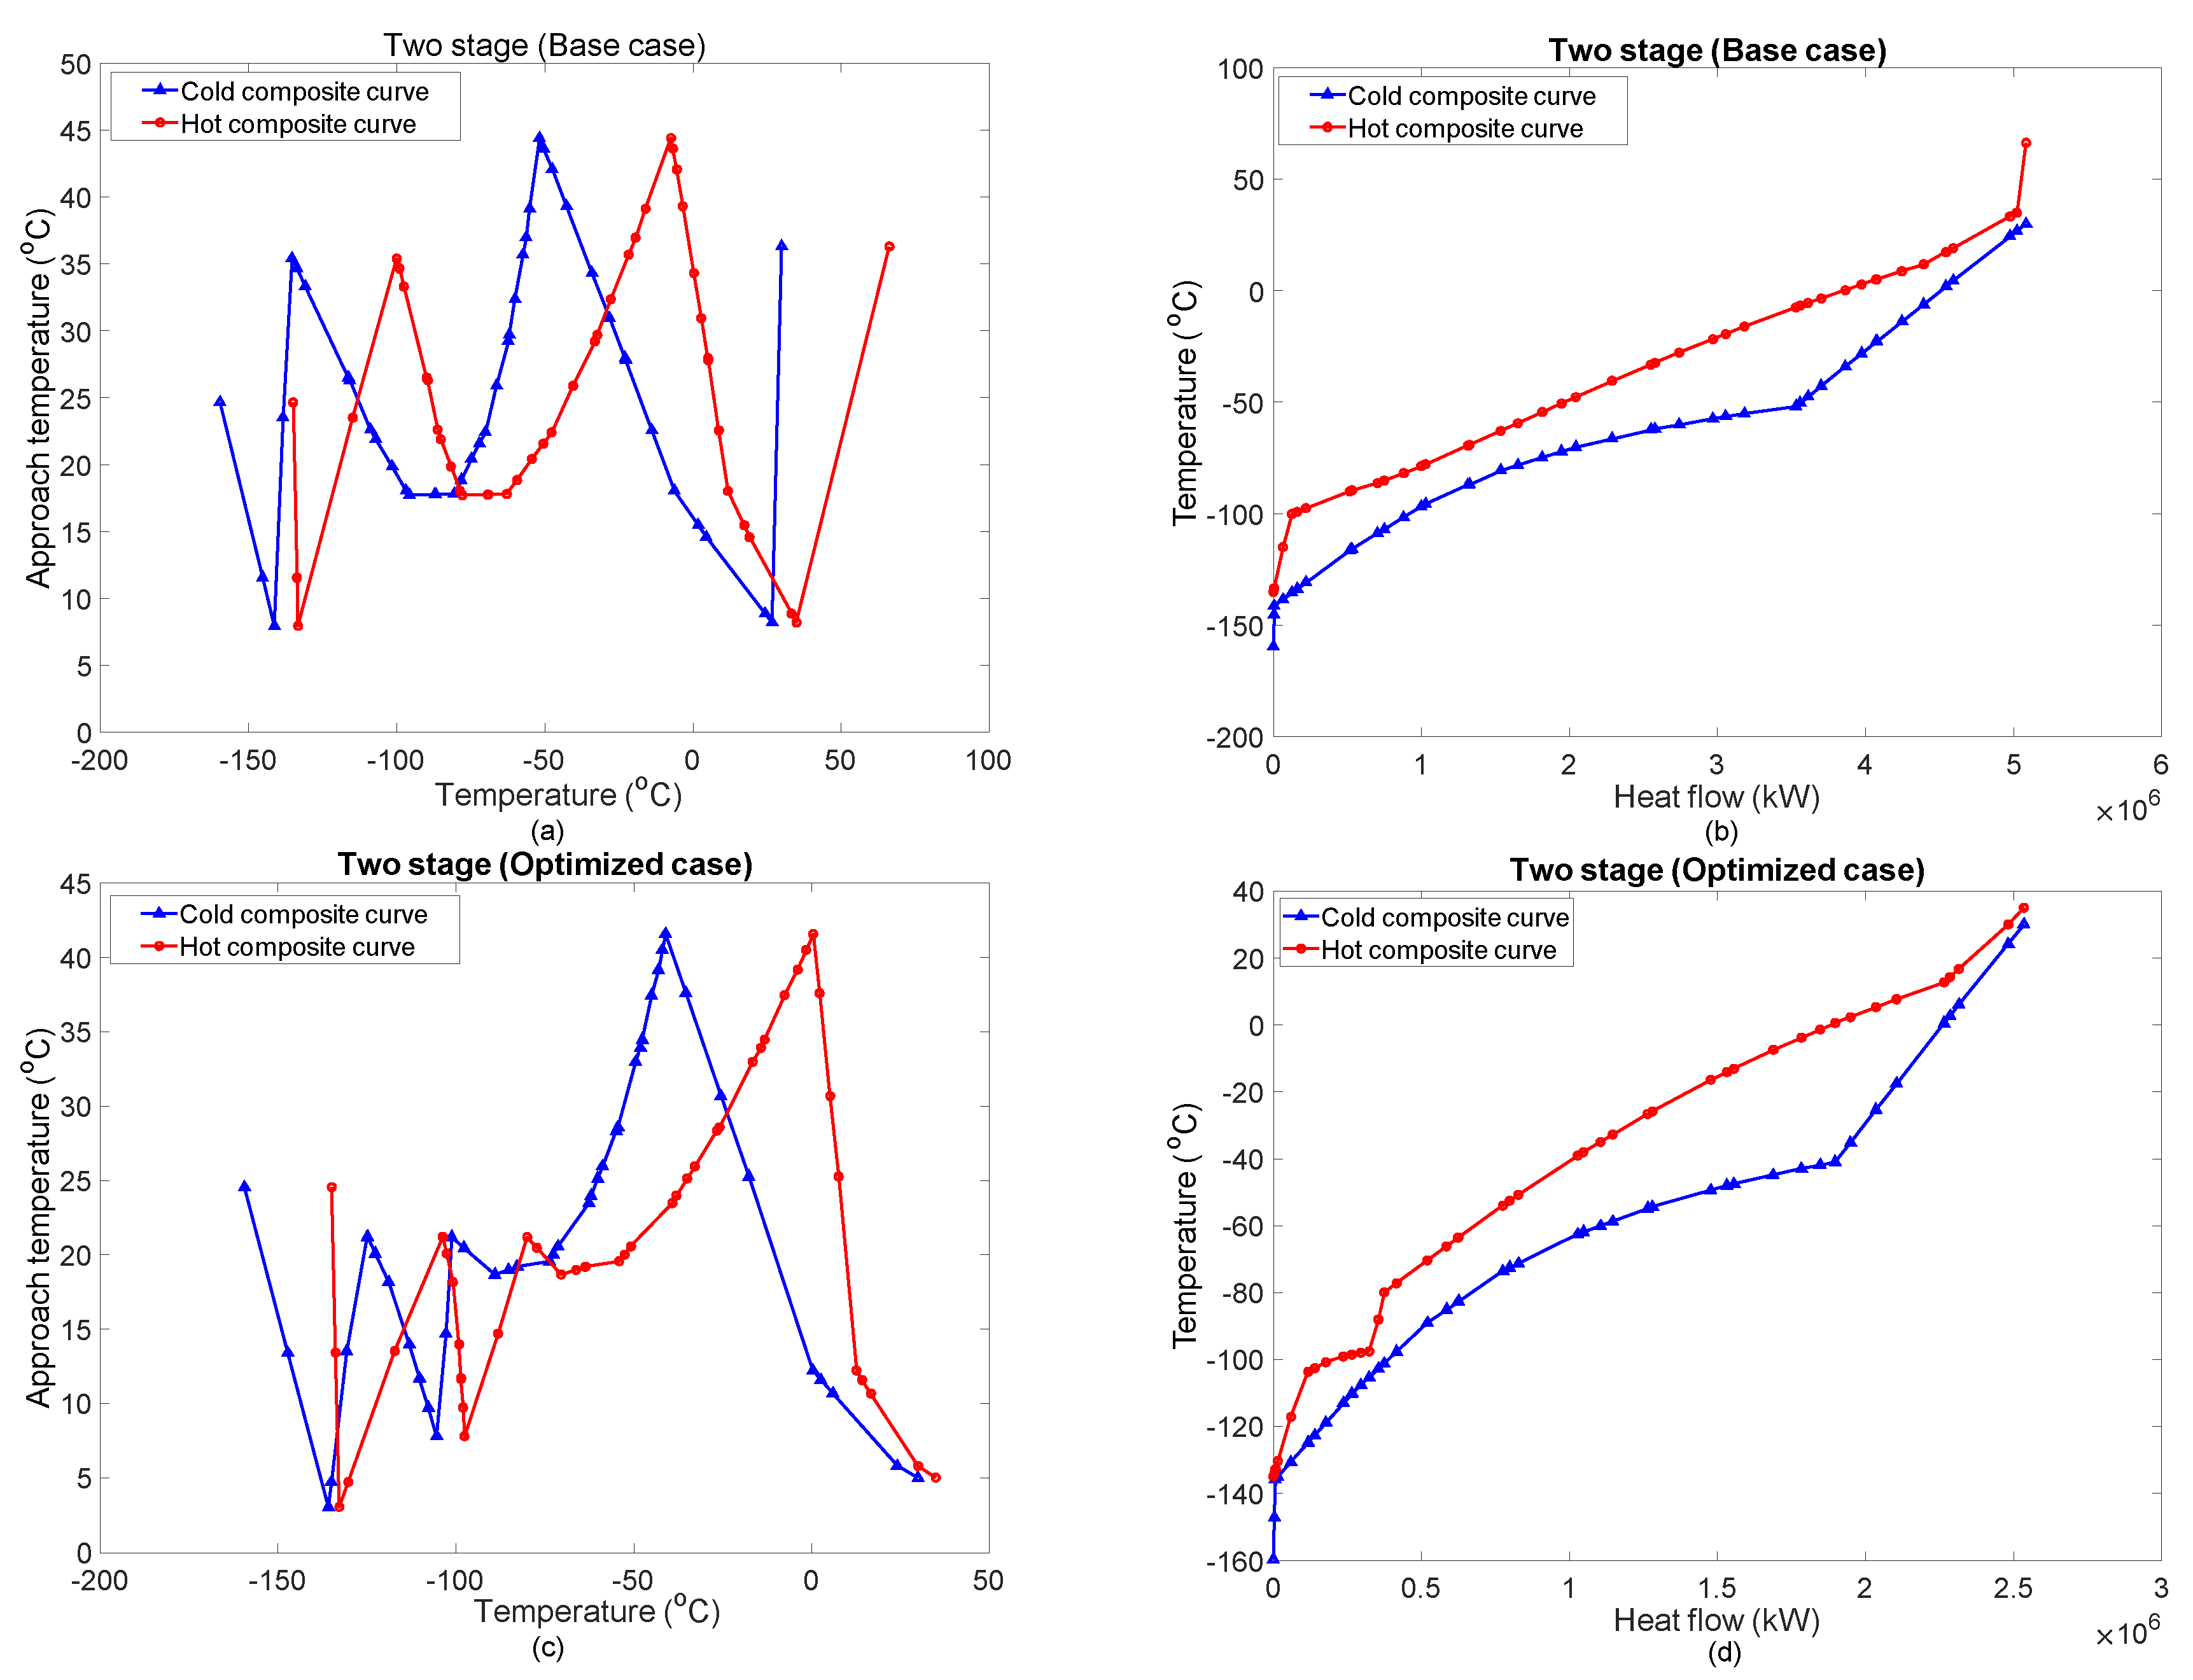
N2 and CH4 in the membrane-based liquefaction process were used as the mixed refrigerant (MR) to liquefy the NG. Figure 7 depicts the temperature difference composite curves (TDCC) and the temperature-heat flow composite curves (THCC) for case 1, i.e., the two-stage, base, and optimized process studies. The plot of TDCC can be used to analyze the effect of each component of the refrigerant on the performance of the liquefaction process. By analyzing the TDCC for the base case 1, which is shown in Figure 7a, the MITA throughout the length of the cryogenic heat exchanger (CHX) can be elucidated. Former reports suggest that the internal approach temperature should remain within the range of 1 to 3 °C in the CHX, to ensure an efficient and economic LSNG process. Figure 7a indicates that the MITA peak value in the base case 1 varies from 7.5 to 45 °C, over a temperature range of 70 to 155 °C. This is a significantly high temperature, which suggests an inefficient process. This information can be used to analyze the impact of all design variables on the overall power consumption during the liquefaction of NG. Therefore, the process needs to be further improved by varying a few key decision variables using the optimization approach, as mentioned in Table 7. After the optimization of the proposed case 1, the MITA values inside the CHX change their position in the range of 3 to 32 for the cryogenic temperature of −70 °C to −160 °C, as evidenced in Figure 7c. This improvement in the MITA value lowers the entropy generation during the process. On the contrary, the THCC help determines the efficiency of the LSNG liquefaction in the CHX. Alternatively, it is also useful to demonstrate the exergy destruction in the exchanger by analyzing the gap between the hot and cold curves. As shown in Figure 7b,d, the heat flow reduces from 5.08 × 10⁶ kW to 2.54 × 10⁶ kW in the optimal case 1. However, there is no significant gap in the THCC for the base and optimal cases.
4.2.2. The Composite Curve for the Two-Step Process
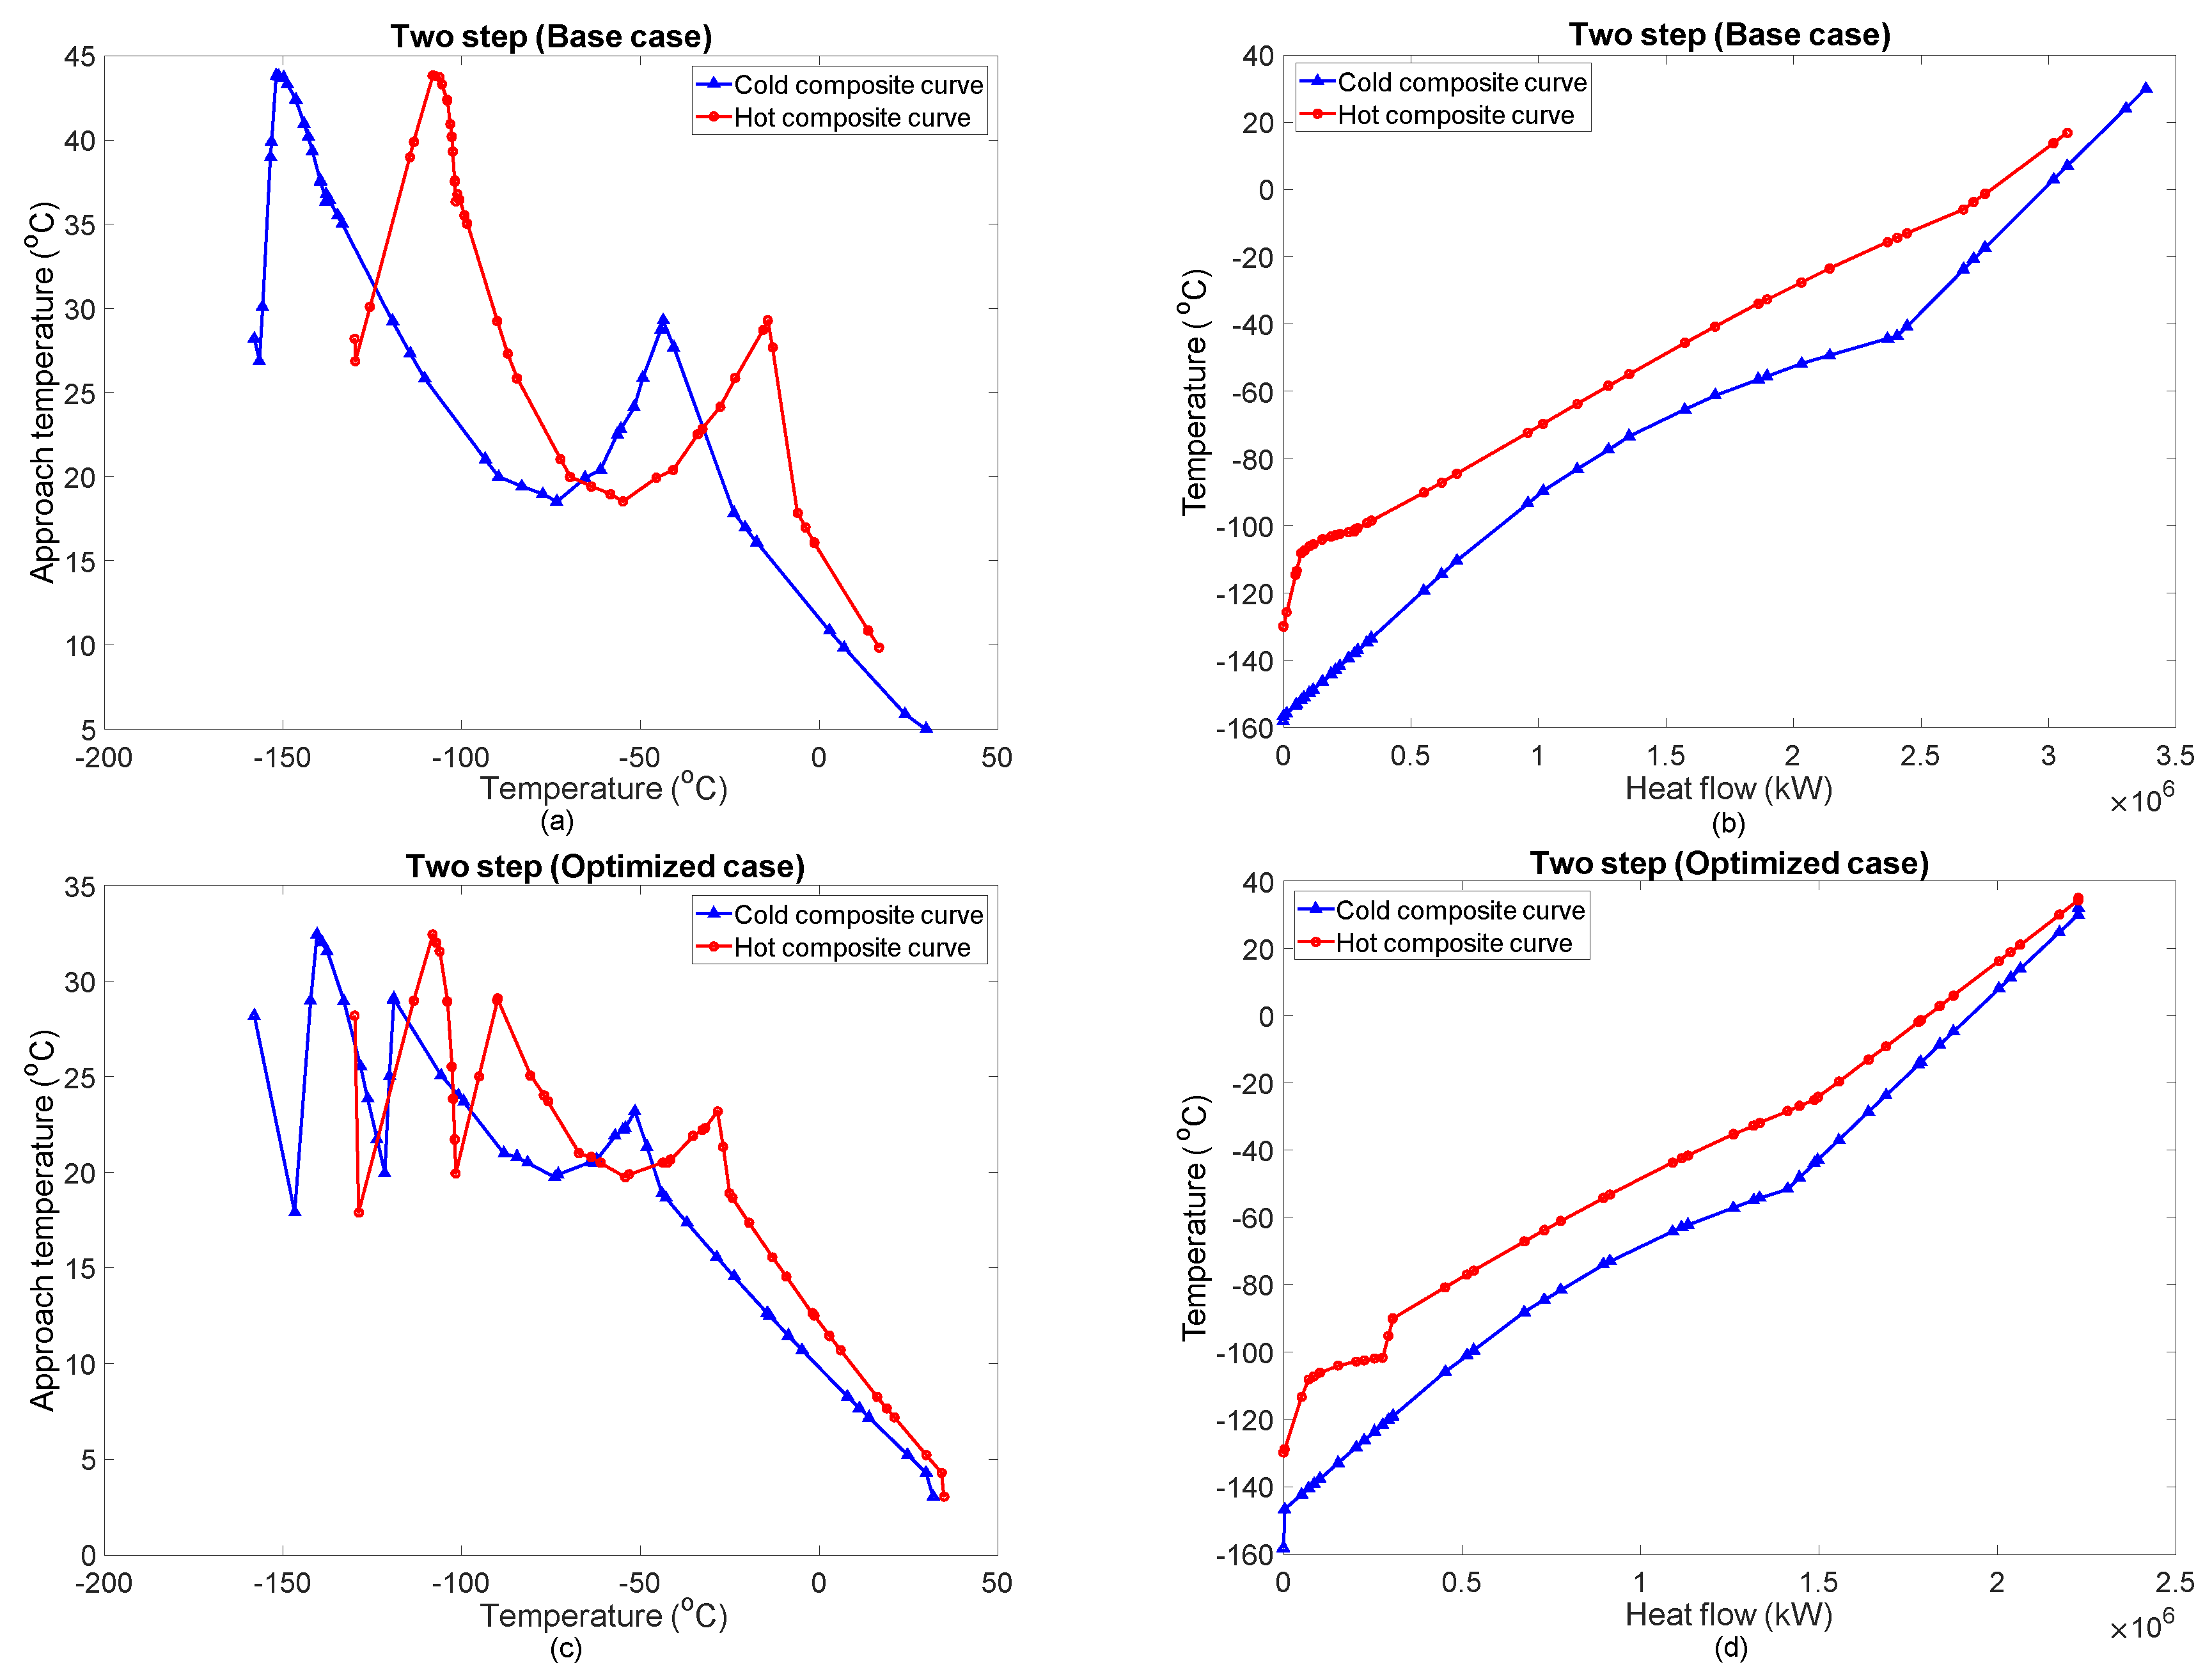
Figure 8 represents the TDCC and THCC for the base case 2 (two-step process) and case 2 (two-step process) optimal study. Figure 8a illustrates that the peak MITA value varies from 5 to 45 °C for the temperature range of −160 to 37 °C, across the entire length of the CHX. However, in the optimized case, the maximum temperature reaches 32 °C. Thus, a variation from 3 °C to a maximum of 32 °C can be observed in the MITA value (Figure 8c), during the subcooled stage in the liquefaction process. Khan et al. [49] reported that the MITA value in the middle section of the exchanger can be determined via the composite curves, which results in irreversibility and hence increases the required power. However, this decrease in the approach temperature between the composite curves improves the energy efficiency of the process. Energy efficiency can be further improved by increasing the flow rate of the heavy refrigerant.
From the THCC in Figure 8b, a significant gap in the base case scenario is observed. This gap indicates the exergy losses caused by non-optimal values of the key decision variables. From the optimal curve in Figure 8b, it is evident that heat flow decreases from 3.38 × 10⁶ kW to 2.08 × 10⁶ kW. Furthermore, the gap between the cold and hot composites is comparatively less, which improves the efficiency of case 2. The optimal stream conditions are presented in Table 8.
5. Conclusions and Scope of Future Research
The results of this study show that the gas permeation membrane yields high purity SNG with a negligible H2 content, which is beneficial for the subsequent SNG liquefaction. The two-stage membrane process feasibly recovers CH4 more than 95% with purity more than 89% but a larger membrane area (total area 23,000 m2) than the two-step membrane process. For the base case, the two-step membrane process requires lower power, resulting in energy savings of approximately 58.46% without optimization. However, the optimization of the SNG liquefaction process significantly reduces the power consumption of the two-stage process and yields a more competitive result compared to the two-step process, which exhibits superior CH4 recovery. However, the result shows the trade-off between the two-stage membrane area and net specific power of liquefaction. The utilization of a two-stage membrane in H2 removal for the liquefaction process is beneficial to achieve low net specific power at 0.4010 kW-h/kgCH4, which is lower than the previous study; the lower the net specific power, the higher the liquefaction energy efficiency. As an extension of the current study, the commercial feasibility of the proposed liquefaction schemes can be investigated via better membrane selectivity, robust membrane modeling for optimization, and advanced exergoeconomic evaluations.
Author Contributions
Conceptualization, M.A.Q. and Y.D.C.; methodology, M.A.Q. and Y.D.C.; software (Liquefaction and Optimization), M.A.Q. and W.A.; software (Membrane and Optimization), Y.D.C.; formal analysis, M.A.Q., Y.D.C. and W.A.; investigation, M.A.Q. and W.A.; writing—original draft preparation, M.A.Q., Y.D.C., W.A. and H.S.; writing—review and editing, Y.D.C.; supervision, M.L. All authors have read and agreed to the published version of the manuscript.
Funding
This work was supported by the Priority Research Centers Program through the National Research Foundation (NRF) of Korea, funded by the Ministry of Education (2014R1A6A1031189).
Conflicts of Interest
The authors declare no conflict of interest.
References
- Qyyum, M.A.; Qadeer, K.; Lee, M. Comprehensive Review of the Design Optimization of Natural Gas Liquefaction Processes: Current Status and Perspectives. Ind. Eng. Chem. Res. 2018, 57, 5819–5844. [Google Scholar] [CrossRef]
- EIA. Today in Energy. 2017. Available online: https://www.eia.gov/todayinenergy/detail.php?id=26212#:~:text=The%20U.S.%20Energy%20Information%20Administration’s,48%25%20between%202012%20and%202040 (accessed on 25 August 2020).
- Qyyum, M.A.; Chaniago, Y.D.; Ali, W.; Qadeer, K.; Lee, M. Coal to clean energy: Energy-efficient single-loop mixed-refrigerant-based schemes for the liquefaction of synthetic natural gas. J. Clean. Prod. 2019, 211, 574–589. [Google Scholar] [CrossRef]
- Naqvi, M.; Dahlquist, E.; Yan, J.; Naqvi, S.R.; Nizami, A.S.; Salman, C.A.; Danish, M.; Farooq, U.; Rehan, M.; Khan, Z.; et al. Polygeneration system integrated with small non-wood pulp mills for substitute natural gas production. Appl. Energy 2018, 224, 636–646. [Google Scholar] [CrossRef]
- Gao, J.; Wang, Y.; Ping, Y.; Hu, D.; Xu, G.; Gu, F.; Su, F. A thermodynamic analysis of methanation reactions of carbon oxides for the production of synthetic natural gas. RSC Adv. 2012, 2, 2358–2368. [Google Scholar] [CrossRef]
- Lin, W.; Xu, J.; Zhang, L.; Gu, A. Synthetic natural gas (SNG) liquefaction processes with hydrogen separation. Int. J. Hydrogen Energy 2017, 42, 18417–18424. [Google Scholar] [CrossRef]
- Bhutto, A.W.; Bazmi, A.A.; Zahedi, G. Underground coal gasification: From fundamentals to applications. Prog. Energy Combust. Sci. 2013, 39, 189–214. [Google Scholar] [CrossRef]
- He, T.; Karimi, I.A.; Ju, Y. Review on the design and optimization of natural gas liquefaction processes for onshore and offshore applications. Chem. Eng. Res. Des. 2018, 132, 89–114. [Google Scholar] [CrossRef]
- Dutta, A.; Karimi, I.A.; Farooq, S. Economic Feasibility of Power Generation by Recovering Cold Energy during LNG (Liquefied Natural Gas) Regasification. ACS Sustain. Chem. Eng. 2018, 6, 10687–10695. [Google Scholar] [CrossRef]
- Karimi, I.A.; Khan, M.S. Special Issue on PSE Advances in Natural Gas Value Chain. Ind. Eng. Chem. Res. 2018, 57, 5733–5735. [Google Scholar] [CrossRef]
- Kopyscinski, J.; Schildhauer, T.J.; Biollaz, S.M.A. Production of synthetic natural gas (SNG) from coal and dry biomass—A technology review from 1950 to 2009. Fuel 2010, 89, 1763–1783. [Google Scholar] [CrossRef]
- Choi, S.-H.; Brunetti, A.; Drioli, E.; Barbieri, G. H2 separation from H2/N2 and H2/CO mixtures with co-polyimide hollow fiber module. Sep. Sci. Technol. 2010, 46, 1–13. [Google Scholar] [CrossRef]
- Sholl, D.S.; Lively, R.P. Seven Chemical Separations to Change the World. Nature 2016, 532, 435. [Google Scholar] [CrossRef] [PubMed]
- Baker, R.W. Future Directions of Membrane Gas Separation Technology. Ind. Eng. Chem. Res. 2002, 41, 1393–1411. [Google Scholar] [CrossRef]
- Dalane, K.; Dai, Z.; Mogseth, G.; Hillestad, M.; Deng, L. Potential applications of membrane separation for subsea natural gas processing: A review. J. Nat. Gas Sci. Eng. 2017, 39, 101–117. [Google Scholar] [CrossRef]
- Baker, R.W.; Wijmans, J.G.; Huang, Y. Permeability, permeance and selectivity: A preferred way of reporting pervaporation performance data. J. Memb. Sci. 2010, 348, 346–352. [Google Scholar] [CrossRef]
- Hong, M.; Li, S.; Falconer, J.L.; Noble, R.D. Hydrogen purification using a SAPO-34 membrane. J. Memb. Sci. 2008, 307, 277–283. [Google Scholar] [CrossRef]
- Lu, C.; Wang, G.; Wang, K.; Guo, D.; Bai, M.; Wang, Y. Modified porous SIO2-supported Cu3 (BTC)2 membrane with high performance of gas separation. Materials 2018, 11, 1207. [Google Scholar] [CrossRef] [Green Version]
- Adhikari, S.; Fernando, S. Hydrogen membrane separation techniques. Ind. Eng. Chem. Res. 2006, 45, 875–881. [Google Scholar] [CrossRef]
- Merkel, T.C.; Pinnau, I.; Prabhakar, R.; Freeman, B.D. Gas and Vapor Transport Properties of Perfluoropolymers. In Materials Science of Membranes for Gas and Vapor Separation; John Wiley & Sons Ltd.: Hoboken, NJ, USA, 2006; pp. 251–270. ISBN 9780470029039. [Google Scholar]
- Martin, J. Aspen Hysys Membrane Unit Extension v3.0a; User Guide; AspenTech Global Customer Support & Training, AspenTech: Bedford, MA, USA, 2003. [Google Scholar]
- Robeson, L.M. Correlation of separation factor versus permeability for polymeric membranes. J. Memb. Sci. 1991, 62, 165–185. [Google Scholar] [CrossRef]
- Freeman, B.D. Basis of Permeability/Selectivity Tradeoff Relations in Polymeric Gas Separation Membranes. Macromolecules 1999, 32, 375–380. [Google Scholar] [CrossRef]
- Lokhandwala, K.A.; Pinnau, I.; He, Z.; Amo, K.D.; DaCosta, A.R.; Wijmans, J.G.; Baker, R.W. Membrane separation of nitrogen from natural gas: A case study from membrane synthesis to commercial deployment. J. Memb. Sci. 2010, 346, 270–279. [Google Scholar] [CrossRef]
- Gas Separation. Membrane Technology and Applications; John Wiley & Sons Ltd.: Hoboken, NJ, USA, 2004; pp. 301–353. ISBN 9780470020395. [Google Scholar]
- Orme, C.J.; Klaehn, J.R.; Harrup, M.K.; Luther, T.A.; Peterson, E.S.; Stewart, F.F. Gas permeability in rubbery polyphosphazene membranes. J. Memb. Sci. 2006, 280, 175–184. [Google Scholar] [CrossRef]
- Tanis, I.; Brown, D.; Neyertz, S.; Heck, R.; Mercier, R.; Vaidya, M.; Ballaguet, J.-P. A comparison of pure and mixed-gas permeation of nitrogen and methane in 6FDA-based polyimides as studied by molecular dynamics simulations. Comput. Mater. Sci. 2018, 141, 243–253. [Google Scholar] [CrossRef]
- Ahmad, F.; Lau, K.K.; Shariff, A.M.; Murshid, G. Process simulation and optimal design of membrane separation system for CO2 capture from natural gas. Comput. Chem. Eng. 2012, 36, 119–128. [Google Scholar] [CrossRef] [Green Version]
- Qi, R.; Henson, M.A. Modeling of Spiral-Wound Permeators for Multicomponent Gas Separations. Ind. Eng. Chem. Res. 1997, 36, 2320–2331. [Google Scholar] [CrossRef]
- Ohs, B.; Lohaus, J.; Wessling, M. Optimization of membrane based nitrogen removal from natural gas. J. Memb. Sci. 2016, 498, 291–301. [Google Scholar] [CrossRef]
- Gutierrez, J.P.; Ale Ruiz, E.L.; Erdmann, E. Energy requirements, GHG emissions and investment costs in natural gas sweetening processes. J. Nat. Gas Sci. Eng. 2017, 38, 187–194. [Google Scholar] [CrossRef]
- Gutierrez, J.P.; Ale Ruiz, E.L.; Erdmann, E. Design assessment of polymeric membranes modules to separate carbon dioxide from a binary mixture with methane. Chem. Eng. Process. Process Intensif. 2020, 150, 107883. [Google Scholar] [CrossRef]
- Ahsan, M.; Sweeney, O.M.; Hussain, A. Development of User-Defined Extension for the Simulation of Membrane Process in Aspen Hysys. Sigma J. Eng. Nat. Sci. 2017, 35, 35–45. [Google Scholar]
- Wang, L.; Shao, C.; Wang, H. Operation optimization of a membrane separation process through auto-controlling the permeate gas flux. Sep. Purif. Technol. 2007, 55, 30–34. [Google Scholar] [CrossRef]
- Safari, M.; Ghanizadeh, A.; Montazer-Rahmati, M.M. Optimization of membrane-based CO2-removal from natural gas using simple models considering both pressure and temperature effects. Int. J. Greenh. Gas Control 2009, 3, 3–10. [Google Scholar] [CrossRef]
- Fuoco, A.; Comesaña-Gándara, B.; Longo, M.; Esposito, E.; Monteleone, M.; Rose, I.; Bezzu, C.G.; Carta, M.; McKeown, N.B.; Jansen, J.C. Temperature Dependence of Gas Permeation and Diffusion in Triptycene-Based Ultrapermeable Polymers of Intrinsic Microporosity. ACS Appl. Mater. Interfaces 2018, 10, 36475–36482. [Google Scholar] [CrossRef] [PubMed] [Green Version]
- Arcella, V.; Ghielmi, A.; Tommasi, G. High Performance Perfluoropolymer Films and Membranes. Ann. N. Y. Acad. Sci. 2003, 984, 226–244. [Google Scholar] [CrossRef]
- Khan, M.S.; Chaniago, Y.D.; Getu, M.; Lee, M. Energy saving opportunities in integrated NGL/LNG schemes exploiting: Thermal-coupling common-utilities and process knowledge. Chem. Eng. Process. Process Intensif. 2014, 82, 54–64. [Google Scholar] [CrossRef]
- Gahleitner, G. Hydrogen from renewable electricity: An international review of power-to-gas pilot plants for stationary applications. Int. J. Hydrogen Energy 2013, 38, 2039–2061. [Google Scholar] [CrossRef]
- Qyyum, M.A.; Qadeer, K.; Ahmad, A.; Lee, M. Gas–liquid dual-expander natural gas liquefaction process with confirmation of biogeography-based energy and cost savings. Appl. Therm. Eng. 2020, 166, 114643. [Google Scholar] [CrossRef]
- Qyyum, M.A.; Qadeer, K.; Lee, S.; Lee, M. Innovative propane-nitrogen two-phase expander refrigeration cycle for energy-efficient and low-global warming potential LNG production. Appl. Therm. Eng. 2018, 139. [Google Scholar] [CrossRef]
- Ding, H.; Sun, H.; He, M. Optimisation of expansion liquefaction processes using mixed refrigerant N2–CH4. Appl. Therm. Eng. 2016, 93, 1053–1060. [Google Scholar] [CrossRef]
- Qyyum, M.A.; Ali, W.; Long, N.V.D.; Khan, M.S.; Lee, M. Energy efficiency enhancement of a single mixed refrigerant LNG process using a novel hydraulic turbine. Energy 2018, 144, 968–976. [Google Scholar] [CrossRef]
- Abdul Qyyum, M.; Qadeer, K.; Lee, M. Closed-loop self-cooling recuperative N2 expander cycle for the energy efficient and ecological natural gas liquefaction process. ACS Sustain. Chem. Eng. 2018, 6, 5021–5033. [Google Scholar] [CrossRef]
- Khan, M.S.; Lee, M. Design optimization of single mixed refrigerant natural gas liquefaction process using the particle swarm paradigm with nonlinear constraints. Energy 2013, 49, 146–155. [Google Scholar] [CrossRef]
- Bamigbola, O.M.; Agusto, F.B. Optimization in ℝ n by Coggin’s method. Int. J. Comput. Math. 2004, 81, 1145–1152. [Google Scholar] [CrossRef]
- Nawaz, A.; Qyyum, M.A.; Qadeer, K.; Khan, M.S.; Ahmad, A.; Lee, S.; Lee, M. Optimization of mixed fluid cascade LNG process using a multivariate Coggins step-up approach: Overall compression power reduction and exergy loss analysis. Int. J. Refrig. 2019, 104, 189–200. [Google Scholar] [CrossRef]
- Pham, T.N.; Khan, M.S.; Minh, L.Q.; Husmil, Y.A.; Bahadori, A.; Lee, S.; Lee, M. Optimization of modified single mixed refrigerant process of natural gas liquefaction using multivariate Coggin’s algorithm combined with process knowledge. J. Nat. Gas Sci. Eng. 2016, 33, 731–741. [Google Scholar] [CrossRef]
- Khan, M.S.; Lee, S.; Rangaiah, G.P.; Lee, M. Knowledge based decision making method for the selection of mixed refrigerant systems for energy efficient LNG processes. Appl. Energy 2013, 111, 1018–1031. [Google Scholar] [CrossRef]
Figure 1.
Glassy vs. rubbery membranes.

Figure 2.
Permeability of N2/CH4 at different temperatures and constant pressure 35 bar.

Figure 3.
Membrane-assisted separation schemes (a) Two-stage. (b) Two-step.

Figure 4.
Two-stage membrane separation integrated with C3N two-phase expander liquefaction process.
Figure 4.
Two-stage membrane separation integrated with C3N two-phase expander liquefaction process.

Figure 5.
Two-step membrane separation integrated with C3N two-phase expander liquefaction process.

Figure 6.
Coggins’s multivariate optimization (MCO) search flow pattern algorithm.

Figure 7.
Case 1: Two-stage base and optimized process curves. (a) Base case—temperature difference composite curves (TDCC). (b) Base case—temperature–heat flow composite curves (THCC). (c) Optimum—temperature difference composite curves (TDCC). (d) Optimum case—temperature–heat flow composite curves (THCC).

Figure 8.
Case 2: two-step base and optimized process curves. (a) Base case—temperature difference composite curves (TDCC). (b) Base case—temperature–heat flow composite curves (THCC). (c) Optimum—temperature difference composite curves (TDCC). (d) Optimum case—temperature–heat flow composite curves (THCC).


Table 1.
Membrane area for two-stage membrane process.
| MEM-1 (m2) | MEM-2 (m2) | CH4 Purity (%mol) | CH4 Recovery (%mol) | H2 to Liquefaction (%mol) |
|---|---|---|---|---|
| 19,000 | 3000 | 88.810 | 96.558 | 0.087 |
| 19,000 | 3500 | 89.000 | 95.908 | 0.082 |
| 20,500 | 3500 | 89.068 | 95.914 | 0.066 |
| 21,000 | 3500 | 89.066 | 95.877 | 0.062 |
| 22,000 | 3500 | 89.089 | 95.918 | 0.054 |
| 23,000 | 3500 | 89.142 | 95.934 | 0.047 |
| 24,000 | 3000 | 88.918 | 96.565 | 0.045 |
| 25,000 | 3500 | 89.193 | 95.943 | 0.036 |
Table 2.
Membrane area for the two-step membrane.
| MEM-1 (m2) | MEM-2 (m2) | CH4 Purity (%mol) | CH4 Recovery (%mol) | H2 to Liquefaction (%mol) |
|---|---|---|---|---|
| 8000 | 6000 | 88.970 | 88.792 | 0.188 |
| 10,000 | 7000 | 89.581 | 85.939 | 0.092 |
| 11,000 | 7000 | 89.845 | 84.498 | 0.070 |
| 12,000 | 7000 | 90.094 | 83.049 | 0.054 |
| 12,000 | 8000 | 90.148 | 83.068 | 0.046 |
| 12,000 | 9000 | 90.219 | 83.091 | 0.038 |
| 11,000 | 9000 | 89.968 | 84.538 | 0.047 |
| 10,000 | 9000 | 89.696 | 85.976 | 0.066 |
Table 3.
Two-stage membrane process and the key decision variables with their bounds.
| Decision Variables | Optimum Values of the Decision Variables | Lower Bounds | Upper Bounds |
|---|---|---|---|
| MEM-1 Area (m2) | 23,000 | 5000.0 | 25,000 |
| IN-MEM * Pressure (bar) | 34 | 30 | 40 |
| IN-MEM * TEMP (°C) | 30 | 25 | 30 |
| RET-1 Pressure (bar) | 33 | 30 | 39 |
| MEM-2 Area (m2) | 3500 | 1000 | 10,000 |
| MEM-2 IN Pressure (bar) | 35 | 2000 | 4000 |
| MEM-2 TEMP (°C) | 30 | 25 | 30 |
| RET-2 Pressure (bar) | 32 | 25 | 39 |
| PERM-1 Pressure (bar) | 6.895 (Fixed) | - | - |
| PERM-1 TEMP (°C) | 25 (Fixed) | - | - |
| PERM-2 Pressure (bar) | 6.895 (Fixed) | - | - |
| PERM-2 TEMP (°C) | 25 (Fixed) | - | - |
* IN-MEM = membrane inlet.
Table 4.
Two-step membrane process and key decision variables with their bounds.
| Decision Variables | Optimum Values of the Decision Variables | Lower Bounds | Upper Bounds |
|---|---|---|---|
| MEM-1 Area (m2) | 11,000 | 5000 | 25,000 |
| IN-MEM * Pressure (bar) | 35 | 30 | 40 |
| IN-MEM * TEMP (°C) | 30 | 25 | 30 |
| RET-1 Pressure (bar) | 33 | 30 | 39 |
| MEM-2 Area (m2) | 9000 | 1000 | 10,000 |
| RET-2 Pressure (bar) | 27 | 20 | 30 |
| PERM-1 Pressure (bar) | 6.895 (Fixed) | - | - |
| PERM-1 TEMP (°C) | 25 (Fixed) | - | - |
| PERM-2 Pressure (bar) | 6.895 (Fixed) | - | - |
| PERM-2 TEMP (°C) | 25 (Fixed) | - | - |
* IN-MEM = membrane inlet.
Table 5.
Feed composition, conditions, and basis for the simulation of H2 and N2 separation via membranes.
Table 5.
Feed composition, conditions, and basis for the simulation of H2 and N2 separation via membranes.
| SNG Feed | SNG Feed: Membrane Process (Inlet) | Case 1: The Outlet from the Two-Stage Membrane Process for LSNG Production | Case 2: The Outlet from the Two-Step Membrane Process for LSNG Production |
|---|---|---|---|
| Composition | |||
| Methane (mole %) | 84.4156 | 89.1424 | 89.9681 |
| Nitrogen (mole %) | 12.3876 | 10.810 | 9.938 |
| Hydrogen (mole %) | 3.1968 | 0.0047 | 0.0047 |
| Temperature (°C) | 23 | 30 | 30 |
| Pressure (bar) | 27 | 33 | 28 |
| Flow rate (kg/h) × 106 | 3.3843 | 3.0580 | 2.6538 |
Table 6.
Key decision variables with upper and lower limits for the proposed dual expander processes.
Table 6.
Key decision variables with upper and lower limits for the proposed dual expander processes.
| Streams | Optimum | Lower | Upper |
|---|---|---|---|
| Nitrogen flow rate (kg/h) × 107 | 1.8147 | 1.3610 | 2.2684 |
| Propane flow rate (kg/h) × 106 | 8.1666 | 0.6125 | 1.0208 |
| MR Low Pressure (bar) | 5.180 | 3.8850 | 6.4750 |
| MR High Pressure (bar) | 50.0 | 37.50 | 62.50 |
| MR Recuperation Temperature (°C) | −80 | −60 | −100 |
Table 7.
Decision variables and SEC of two-stage and two-step processes after optimization.
| Parameters | Case 1: Two-Stage | Case 2: Two-Step | Case 1: Optimized | Case 2: Optimized |
|---|---|---|---|---|
| Mass flow rate of Nitrogen (kg/h) × 106 | 43.25 | 34.13 | 18.15 | 27.40 |
| Mass flow rate of Propane (kg/h) × 106 | 14.36 | 7.022 | 8.167 | 3.52 |
| MR low Pressure (bar) | 4.0 | 9.53 | 5.18 | 10.40 |
| MR high Pressure (bar) | 110.0 | 84.370 | 50.0 | 46.00 |
| MR recuperation Temperature (°C) | −100.0 | −101.20 | −80.0 | −81.00 |
| Pressure ratio | 2.2899 | 1.7249 | 1.7626 | 1.4502 |
| MITA value (°C) | 7.9477 | 5.0 | 3.0278 | 5.0 |
| Net specific power (kW-h/kg) | 1.7992 | 0.7474 | 0.4010 | 0.7165 |
| Net Power (kW) × 106 | 6.09 | 2.53 | 1.36 | 1.06 |
| Relative energy saving % | - | 58.46 | 77.71 | 82.61 |
| No. of compression unit in membrane part | 3 | 1 | 2 | 1 |
| No. of cooler in membrane part | 2 | 1 | 2 | 1 |
Table 8.
Optimal stream conditions associated with C3N two-phase expander liquefaction process.
| Stream | Case 1 Two-Stage | Case 2 Two-Step | ||
|---|---|---|---|---|
| T (°C) | P (bar) | T (°C) | P (bar) | |
| 1 | 77.05 | 9.13 | 70.71 | 15.57 |
| 2 | 30 | 9.13 | 30 | 15.57 |
| 3 | 77.32 | 16.09 | 70.79 | 23.32 |
| 4 | 30 | 16.09 | 30 | 23.32 |
| 5 | 77.73 | 28.37 | 70.89 | 34.91 |
| 6 | 30 | 28.37 | 30 | 34.91 |
| 7 | 78.26 | 50 | 70.97 | 52.28 |
| 8 | 35 | 50 | 35 | 52.28 |
| 9 | −80 | 50 | −90 | 52.28 |
| 10 | −135.9 | 5.18 | −146.8 | 10.4 |
| 11/C3N | 30 | 5.18 | 30 | 10.4 |
| SNG Feed | 30 | 33 | 30 | 28 |
| Sub-LSNG | −135 | 33 | −130 | 28 |
| LSNG-1 | −159.5 | 2 | −158.2 | 2 |
| EFG | −159.5 | 2 | −158.2 | 2 |
| EFG-1 | −35.26 | 2 | 31.97 | 2 |
| LSNG | −159.5 | 2 | −158.2 | 2 |
© 2020 by the authors. Licensee MDPI, Basel, Switzerland. This article is an open access article distributed under the terms and conditions of the Creative Commons Attribution (CC BY) license (http://creativecommons.org/licenses/by/4.0/).
Share and Cite
MDPI and ACS Style
Qyyum, M.A.; Chaniago, Y.D.; Ali, W.; Saulat, H.; Lee, M. Membrane-Assisted Removal of Hydrogen and Nitrogen from Synthetic Natural Gas for Energy-Efficient Liquefaction. Energies 2020, 13, 5023. https://doi.org/10.3390/en13195023
AMA Style
Qyyum MA, Chaniago YD, Ali W, Saulat H, Lee M. Membrane-Assisted Removal of Hydrogen and Nitrogen from Synthetic Natural Gas for Energy-Efficient Liquefaction. Energies. 2020; 13(19):5023. https://doi.org/10.3390/en13195023
Chicago/Turabian StyleQyyum, Muhammad Abdul, Yus Donald Chaniago, Wahid Ali, Hammad Saulat, and Moonyong Lee. 2020. "Membrane-Assisted Removal of Hydrogen and Nitrogen from Synthetic Natural Gas for Energy-Efficient Liquefaction" Energies 13, no. 19: 5023. https://doi.org/10.3390/en13195023
Note that from the first issue of 2016, this journal uses article numbers instead of page numbers. See further details here.