Article

A New Approach to Optimal Location and Sizing of DSTATCOM in Radial Distribution Networks Using Bio-Inspired Cuckoo Search Algorithm

by
Devabalaji Kaliaperumal Rukmani
1,
Yuvaraj Thangaraj
2,
Umashankar Subramaniam
3,
Sitharthan Ramachandran
4,
Rajvikram Madurai Elavarasan
5,*,
Narottam Das
6,7,*,
Luis Baringo
8 and
Mohamed Imran Abdul Rasheed
9
1
Department of Electrical and Electronics Engineering, Hindustan Institute of Technology and Science, No. 1, OMR Road, Chennai 600077, India
2
Department of Electrical and Electronics Engineering, Saveetha School of Engineering, Saveetha Institute of Medical and Technical Sciences, Chennai 600077, India
3
Renewable Energy Lab, College of Engineering, Prince Sultan University, Riyadh 11586, Saudi Arabia
4
School of Electrical Engineering, Vellore Institute of Technology, Vellore 632014, India
5
Electrical and Automotive parts Manufacturing Unit, AA Industries, Chennai 600123, India
6
School of Engineering and Technology, Central Queensland University, Melbourne, VIC 3000, Australia
7
Centre for Intelligent Systems, School of Engineering and Technology, Central Queensland University, Brisbane, QLD 4000, Australia
8
Escuela Técnica Superior de Ingeniería Industrial, Universidad de Castilla-La Mancha, Campus Universitario s/n, 13071 Ciudad Real, Spain
9
School of Electrical Engineering, Vellore Institute of Technology, Chennai 600127, India
*
Authors to whom correspondence should be addressed.
Energies 2020, 13(18), 4615; https://doi.org/10.3390/en13184615
Submission received: 25 June 2020 / Revised: 29 August 2020 / Accepted: 2 September 2020 / Published: 4 September 2020
(This article belongs to the Special Issue Planning and Economics of Electric Energy Systems)

Abstract

:
This article proposes a new approach based on a bio-inspired Cuckoo Search Algorithm (CSA) that can significantly envisage with several issues for optimal allocation of distribution static compensator (DSTATCOM) in Radial Distribution System (RDS). In the proposed method, optimal locations of the DSTATCOM are calculated by using the Loss Sensitivity Factor (LSF). The optimal size of the DSTATCOM is simulated by using the newly developed CSA. In the proposed method, load flow calculations are performed by using a fast and efficient backward/forward sweep algorithm. Here, the mathematically formed objective function of the proposed method is to reduce the total system power losses. Standard 33-bus and 69-bus systems have been used to show the effectiveness of the proposed CSA-based optimization method in the RDS with different load models. The simulated results confirm that the optimal allocation of DSTATCOM plays a significant role in power loss minimization and enhanced voltage profile. The placement of DSTATCOM in RDS also plan an important role for minimizing uncertainties in the distribution level. The proposed method encourages one to use renewable-based resources, which results in affordable and clean energy.

1. Introduction

The voltage levels of distribution networks reduce as the buses moved away from the substation, and the power losses will be high in case of distribution networks. So far, the literature survey shows that nearly 10–13% of the whole generated power is wasted as I2R losses in Radial Distribution Systems (RDS) [1]. Losses in distribution systems can be reduced by placing proper compensating devices. In this sense, capacitors play a vital role in reducing power losses in distribution systems. Capacitors are also utilized to enhance the voltage levels across buses; however, it is very difficult to provide variable reactive power. Hence, the distributors need to take care of these capacitor costs, as well as to place them at optimal locations with optimal sizes. Another issue of the capacitor placement is that the balancing of the load is not granted because of the capacitor operating problems like resonance. Furthermore, the major complication accomplice with the utilization of capacitors in distribution systems is the oscillation in nature of capacitors devices when placed along with inductive components with similar circuits [2]. To resolve these drawbacks, custom power devices (CPD) are utilized in distribution systems to reduce power losses and to enhance bus voltages. The most widely used CPDs are Distribution Static Compensator (DSTATCOM), Static Synchronous Series Compensator (SSSC), Unified Power Quality Conditioner (UPQC), and Dynamic Voltage Restorer (DVR). Among these devices, DSTATCOM is the most appropriate device, as it delivers effective reactive power and avoids unbalance loading in RDS. In addition, it exhibits superior features like no resonance or transient harmonics problems, low harmonic content production, and small size [3,4]. Custom DSTATCOM devices incorporate voltage source converters. It is also used as a shunt device, capacitor link, and coupling transformer. It compensates the bus voltages in RDS, and is used to control power factor, real, and reactive power. DSTATCOM has the ability of providing fast and continuous inductive and capacitive mode compensation [5]. DSTATCOM is the best device to remove harmonic distortion from the system and to avoid unbalances [6]. Optimum placement of DSTATCOMs improves the annual cost saving, reduces power losses, improves load ability, enhances stability, compensates the reactive power, and improves the quality of the power [7]. Therefore, determining the optimal allocation of DSTATCOMs has an important impact in RDS.

Literature Survey

Only a few researchers have been concentrated to work in the area of DSTATCOM allocation. For allocation of DSTATCOM, various methodologies have been implemented so far, like (i) modal analysis, (ii) analytical methods, and (iii) optimization algorithms. Initially, the time domain simulation and modal analysis methods have been used for the DSTATCOM allocation problem in the distribution network for power quality improvement [8]. On the other hand, analytical methods are used to resolve the DSTATCOM placement problems for loss reduction and bus voltage improvement in RDS [9]. Furthermore, the stability index (SI) and power loss index (PLI) [10,11] are considered to solve DSTATCOM allocation problems in RDS. To determine the optimal allocation of DSTATCOMs, many researchers worked on various algorithms, like particle swarm optimization (PSO) [12], differential evolution algorithm (DEA) [3], immune algorithm (IA) [4], bat algorithm (BA) [13], and bacterial foraging optimization algorithm (BFOA) [14] to decrease losses and improve the voltage profile in RDS. In [3], the authors solved the problem of DSTATCOM placement with the consideration of reconfiguration in the distribution network and using the differential evolution optimization algorithm. A nature-inspired immune algorithm has been utilized for the optimal allocation of the DSTATCOM problem with a newly framed objective function of power and energy losses reduction in [4]. A popular stochastic-based PSO is implemented for the simultaneous allocation of DG and DSTATCOM problem in RDS for power loss reduction and voltage profile enhancement [12]. An echolocation-based bat algorithm is taken into account to determine the candidate location and sizing of DSTATCOM for the power loss reduction of the system [13]. Further in [14], the authors used BFOA to solve the DG and DSTATCOM allocation problem with multi objective function in RDS.
As per the information mentioned in the existing literatures [8,9,10,11,12,13,14] have solved the DSTATCOM placement problem in radial distribution systems, and they got some encouraging results, even though there are shortcomings in different respects, such as:
  • Complex calculation in case of analytical method.
  • Slower convergence of the optimization procedure.
  • Only single DSTATCOM placed.
  • Constant load alone considered.
In addition, the utilization of cuckoo search algorithms (CSAs) has not been previously considered in the literature for the problem of DSTATCOM allocation in RDS. This inspires the authors to solve the optimal DSTATCOM problem in RDS to decrease power losses with the utilization of CSA.
The contributions of this work are listed as follows,
  • A new optimization procedure is implemented to find the optimal location and sizing of single and multiple DSTATCOMs for the reduction of power losses in RDS.
  • The proposed method is tested on three different load models to check the robustness of the test system.
  • Integrated loss sensitivity and optimization technique are considered to find near global optimal location and size of the DSTATCOMs.
  • The feasibility and efficiency of the present approach is tested on standard IEEE 33 and 69 bus systems.
The remainder of the work is classified into various sections. Section 2 presents the formulation of the DSTATCOM allocation problem with different load models. Section 3 explains the implementation of the cuckoo search algorithm for optimal allocation of DSTATCOMs. Section 4 presents the simulation results and discussion. Finally, the conclusion is drawn in Section 5.

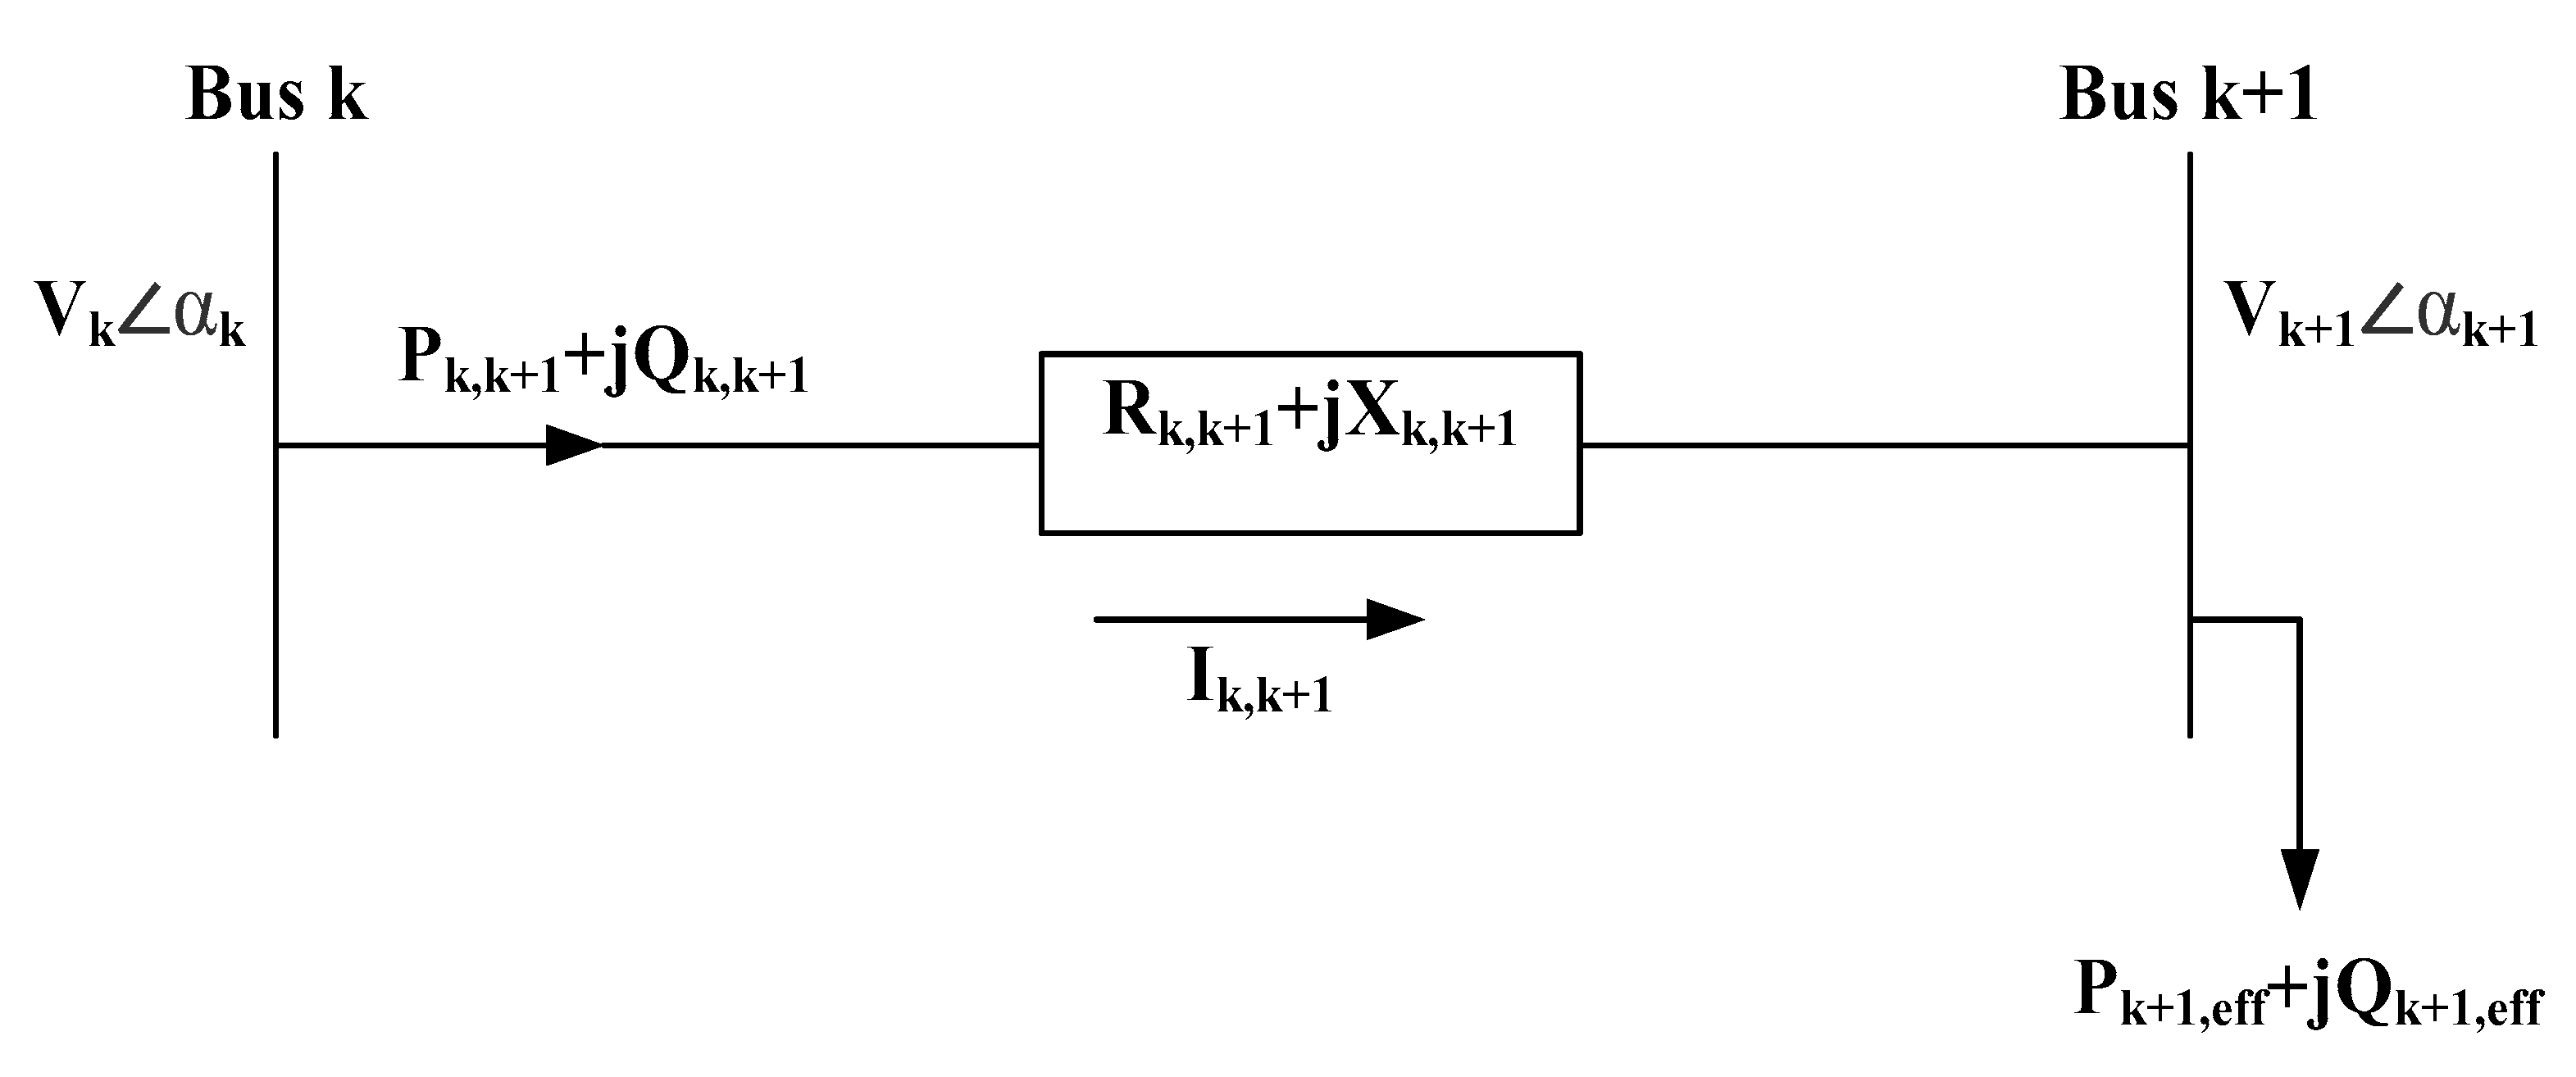
2. Load Modelling and Problem Formulation

In the proposed approach, different load models have been considered to benefit the entire system.

2.1. Formulation of Load Models

From a practical viewpoint, the present approach is attuned to combine real-time voltage dependent load models. To measure the effect of several load models on DSTATCOM sizing, static load models are used to represent different types of consumers. Generally, the load of the distribution networks can be divided into three categories, namely, industrial, residential, and commercial loads. Based on the load types, the real and reactive power values are varied, which affects the voltage and frequency of the system. In this work, the voltage dependent load models, for example industrial, residential, and commercial loads, have been considered. The mathematical expression for the voltage dependent load model is represented as:
P = P 0 V α
Q = Q 0 V β
Parameters α and β values for different load models are shown in Table 1 [15].

2.2. Load Flow Analysis

The transmission system has lower resistance-reactance ration when compared with the distribution side power transmission. Hence, the following existing load flow analysis cannot guarantee the best solutions for line flow and voltage across buses in RDS:
  • Fast decoupled load flow.
  • Gauss–Seidal load flow.
  • Newton Raphson load flow.
The efficient power flow analysis named the backward/forward sweep (BFS) algorithm has been used to find power losses and voltage levels across buses [16]. This method has unique features such as fast computation, requires less memory, and is very simple to use with accurate results, as well as robust convergence [17,18].
Let us consider only two buses interconnected through a branch in an RDS as depicted in Figure 1. P k , k + 1 and Q k , k + 1 are the real and imaginary power flows between buses k and k + 1, respectively, and can be simulated as:
P k , k + 1 = P k + 1 , e f f + P L o s s ( k , k + 1 )
Q k , k + 1 = Q k + 1 , e f f + Q L o s s ( k , k + 1 )
The current flow through buses k and k + 1 can be written as:
I k , k + 1 = ( P k , k + 1 j Q k , k + 1 V k + 1   α k + 1 )
Additionally:
I t , t + 1 = ( V k   α k V k + 1 α k + 1 R k , k + 1 + j X k , k + 1 )
From Equations (4) and (5), it can be found that:
V k 2 V k V k + 1 ( α k + 1 α k ) = ( P k , k + 1 j Q k , k + 1 ) ( R k , k + 1 + j X k , k + 1 )
After separating the real and imaginary parts in Equation (6), we obtain:
V k V k + 1 cos ( α k + 1 α k ) = V k 2 ( P k , k + 1 R k , k + 1 + Q k , k + 1 X k , k + 1 )
V k V k + 1 sin ( α k + 1 α k ) = Q k , k + 1 R k , k + 1 P k , k + 1 X k , k + 1
After squaring and adding (6) and (7), then (8) is obtained as follows:
V k + 1 2 = V k 2 2 ( P k , k + 1 R k , k + 1 + Q k , k + 1 X k , k + 1 ) + ( R k , k + 1 2 + X k , k + 1 2 ) ( P k , k + 1 2 + Q k , k + 1 2 | V k | 2 )
The real and reactive power losses can be determined mathematically as follows:
P Loss ( k , k + 1 ) = I k , k + 1 2 R k , k + 1
P Loss ( k , k + 1 ) = ( P k , k + 1 2 + Q k , k + 1 2 | V k + 1 | 2 ) R k , k + 1
Q Loss ( k , k + 1 ) = I k , k + 1 2 X k , k + 1
Q Loss ( k , k + 1 ) = ( P k , k + 1 2 + Q k , k + 1 2 | V k + 1 | 2 ) X k , k + 1
The real and reactive power losses of each section can be found using Equations (11) and (13), respectively. These equations are used to find the total power loss of the radial distribution system.
By adding all line section losses, we can calculate the total real and reactive power losses of the distribution networks, which is shown below:
P TL = k = 1 nb P Loss   ( k , k + 1 )
Q TL = k = 1 nb Q Loss   ( k , k + 1 )

2.3. Objective Function

The objective of the proposed DSTATCOM placement problem is to reduce the total active power losses in the RDS, which is formulated by the following equation:
Min ( F ) = M in ( P TL )
The objective function (16) is formulated to minimize the total power loss of the radial distribution systems. The objective function must satisfy the following inequality and equality constraints.

2.3.1. Voltage Constraint

The optimization procedure shall not exceed these voltage constraints. If the optimized value does not obey these constraints, then the result obtained is not valid. The optimization procedure will be carried out until these voltage levels are within these bounds. The voltage magnitude can be expressed as:
V k min | V k | V k max

2.3.2. Active Power Balance Constraints

The system power generation is equal to the addition of total power losses and power demand, which can be expressed by the following equation:
P T L + P D ( k ) = P D S T A T C O M ( k )
According to Equation (18), unfeasible solutions that violate the operating constraints will not be further considered.

2.3.3. Reactive Power Balance Constraints

The injected reactive power at each candidate node should be within their minimum and maximum allowable limits:
Q D S T A T C O M ( k ) min Q D S T A T C O M ( k ) Q D S T A T C O M ( k ) max   k = 1 , 2 , n b
The minimum and maximum allowable limits for reactive power are imposed using Equation (19).

2.4. Loss Sensitivity Factor (LSF)

Optimal locations for DSTATCOM installation can be determined by using the loss sensitivity factor [19,20,21]. This process allows decreasing the search space and time consumption for the optimization work. The LSF at each bus can be calculated by differentiating the Equation (12) with respect to reactive power:
LSF ( k , k + 1 ) = P Loss ( k , k + 1 ) Q ( k + 1 , eff ) = ( 2 Q k + 1 , eff R k , k + 1 | V k , k + 1 | 2 )
The sensitivity factor can be calculated using Equation (20) for all buses. The obtained values are then sorted in descending order. The bus with the highest loss sensitivity factor can be identified as the weakest bus. This bus can be compensated by placing DSTATCOM with optimal size. The optimal size of this DSTATCOM will be calculated by running the CSA described in the following section.

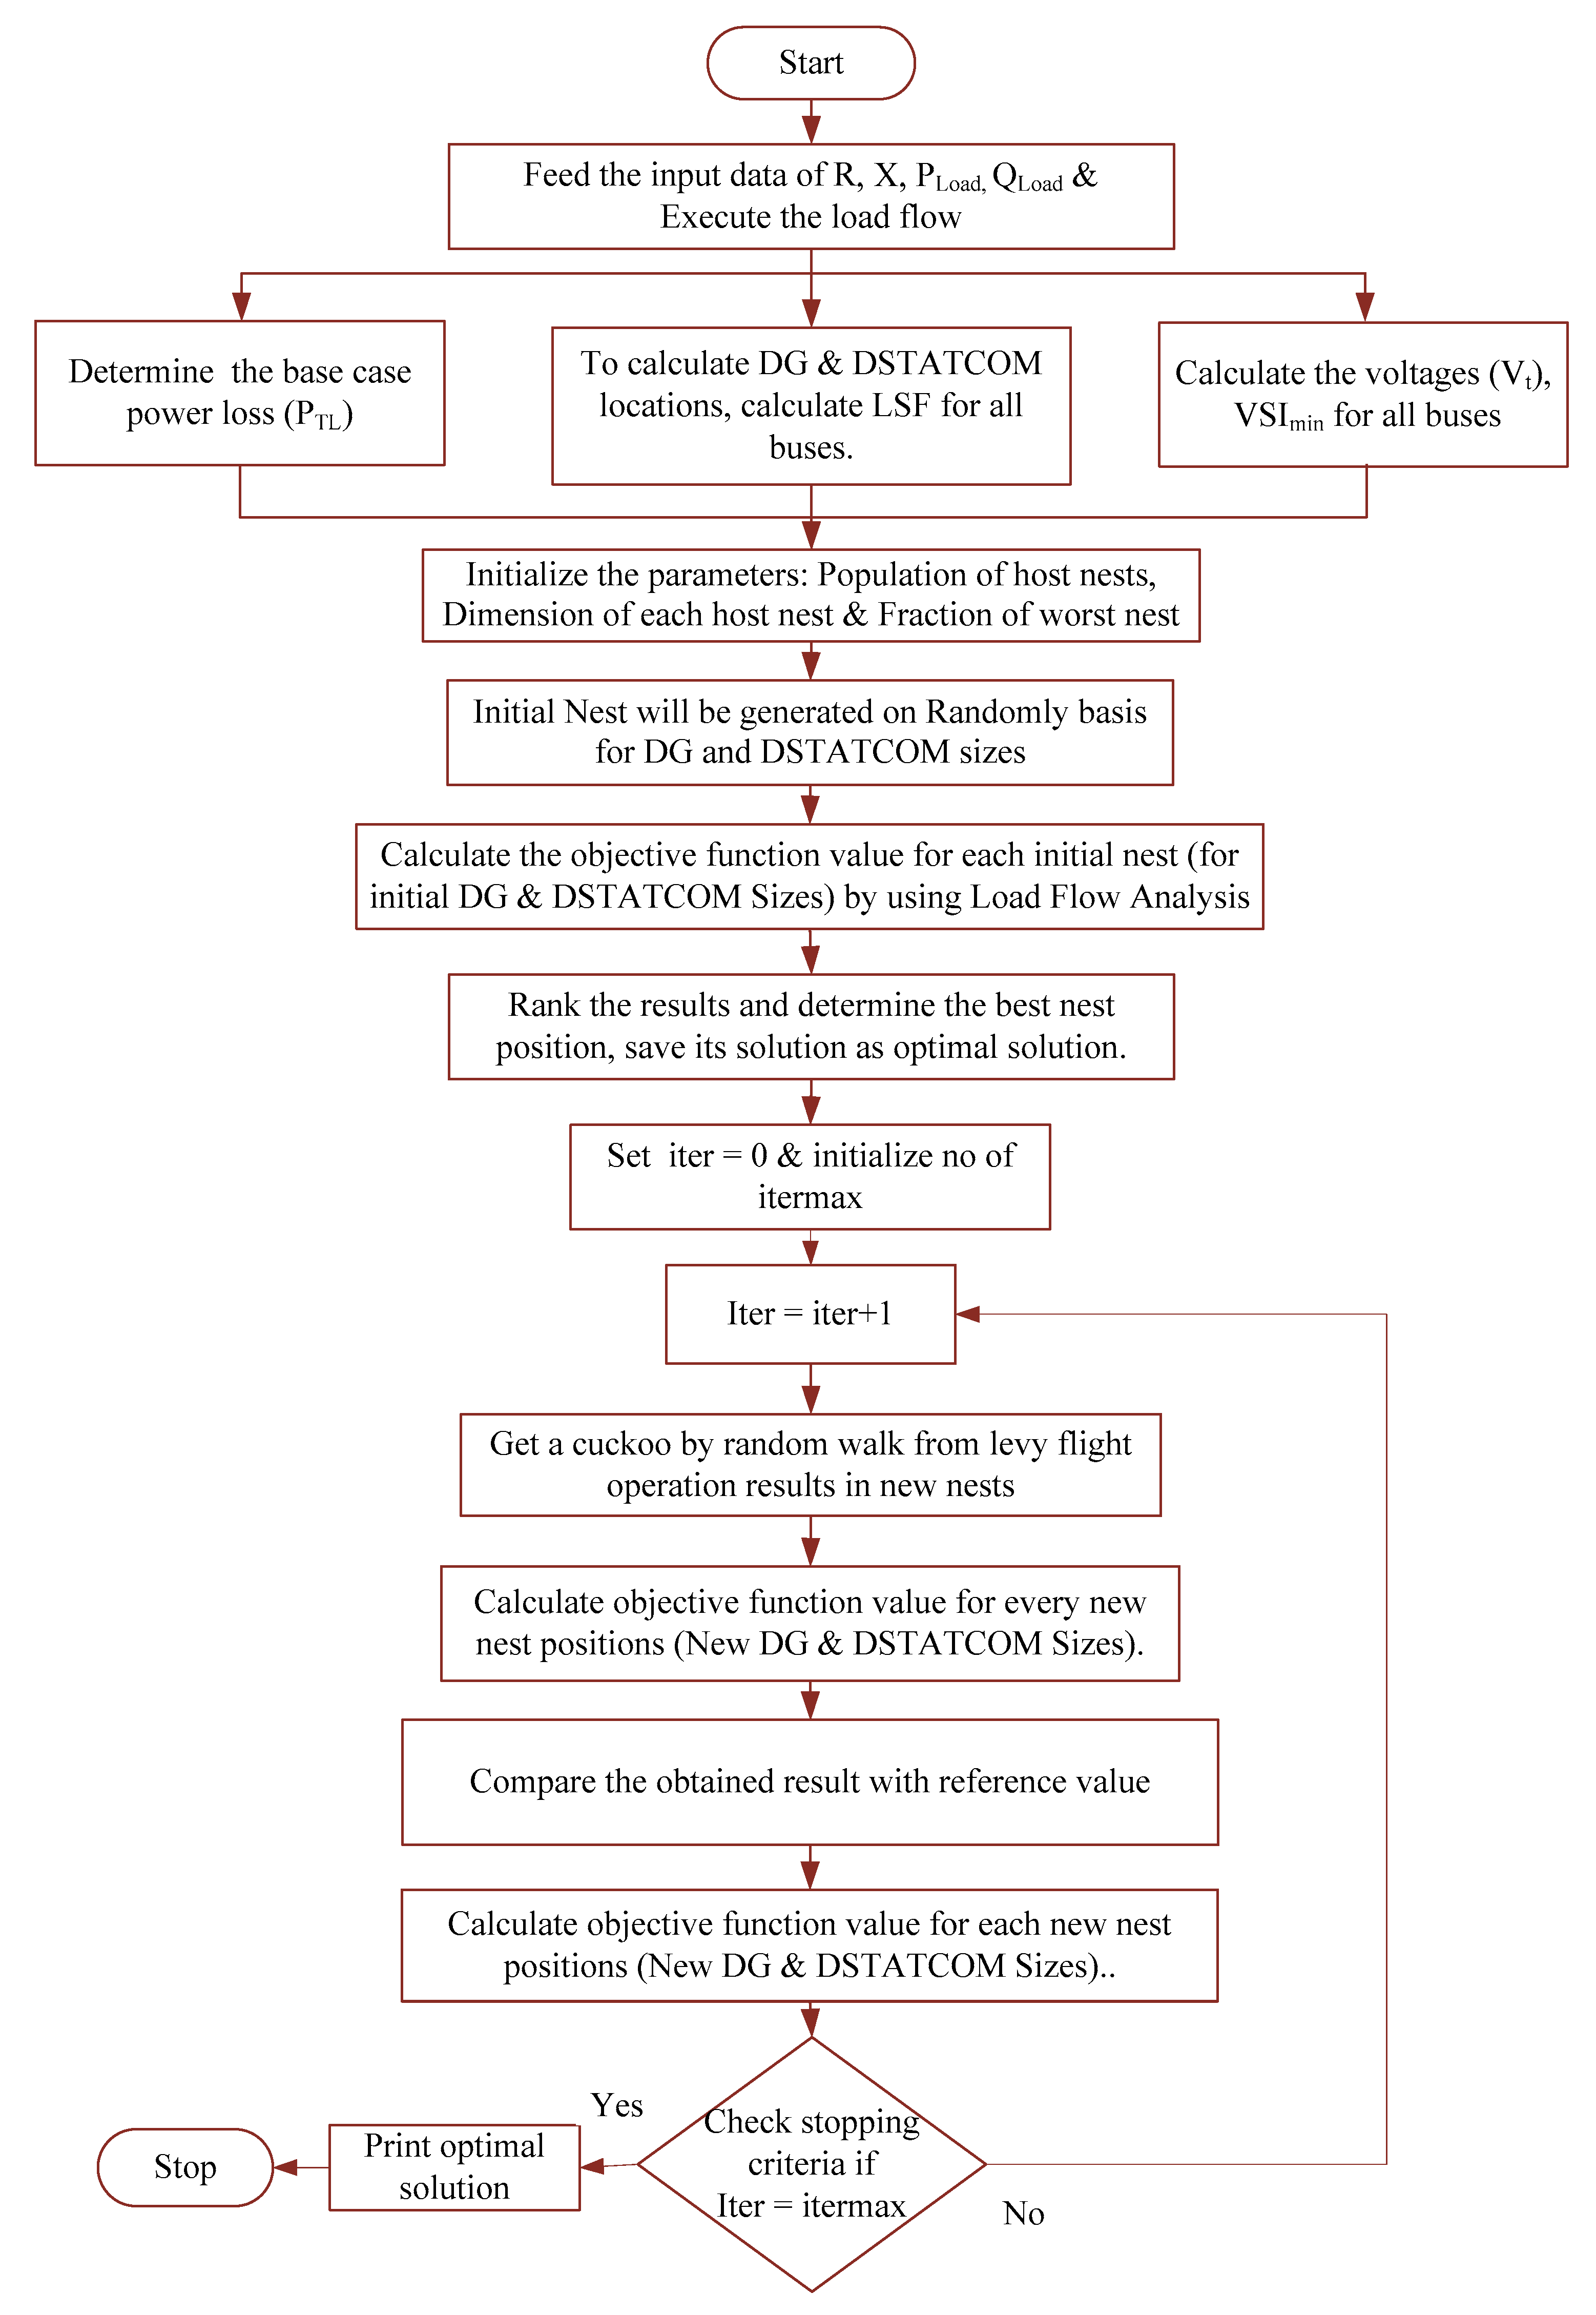
3. Cuckoo Search Algorithm

Yang and Deb [22,23] have recently introduced an effective nature inspired optimization algorithm named the cuckoo search algorithm. Unlike other optimization algorithms, the CSA has two search spaces through Levy flights and random fly. In the Levy flight, each individual produced is often very different from the previous solution due to the random distribution of Levy flight. These two processes for exploration and exploitation of the cuckoo search algorithm are very effective for finding near global optimal solutions [24].
To represent the CSA in a simple way, the following three idealized rules are considered:
Rule 1#:
One egg will be laid at a time by every cuckoo, which dumps its egg in a randomly chosen nest.
Rule 2#:
The best nests, which have a high quality of eggs (solutions), will be carried over to the forthcoming generation.
Rule 3#:
The number of available host nests is fixed, and the egg laid by a cuckoo can be discovered by the host bird with a probability p ∈ [0, 1]. In this case, the host bird can either throw the egg away or abandon the nest, so to build a completely new nest in a new location.
The fitness or aspect of the solution is proportional to the objective function in the case of a maximization problem. The problem can be broken down to simpler steps. For example, let us consider that each egg in a nest represents a solution, and a cuckoo egg represents a new solution, the objective is to replace the not-so-good solution in the nests with new and potentially better solutions (i.e., cuckoos). Hence, the authors in this work employ a simpler method for the proposed optimization process where each nest has only a single egg. The CSA can also be continued to a more convoluted problem where each nest has multiple eggs representing a set of solutions.
The initial solutions a i k + 1 for cuckoo i can be generated when a L’evy flight is performed:
a i k + 1 = a i k + δ L evy ( λ )
The scales of problems of interest should be related to the step size which is represented as δ > 0 . δ = 1 is used in most cases. The stochastic equation for random walk is represented in Equation (21). In most obvious cases, a random walk is a Markov chain whose next status/location only depends on the current location ( a i k ) and the transition probability ( δ L evy ( λ ) ). The symbol indicates the entry wise multiplications. As used in the PSO, the symbol ( ) used is similar, but in this case, the random walk via L’evy flight is more effective in exploring the search space, as its step length is much longer in the long run.
The L’evy flights basically deliver a random walk, while their random steps are strained from a L’evy distribution for large steps:
L evy u   =   t λ , ( 1 < λ 3 )
A randomly populated host nest is generated, and then the population of solutions is subject to repeated cycles of the search process of cuckoo birds. The randomly chosen nest position to lay the eggs can be determined by using Equation (22). It has an infinite variance and mean. In this case, the power-law step length distribution with a heavy tail is obeyed by the consecutive jumps/steps of a cuckoo that essentially form a random walk process. The fact is that in the real world, if a cuckoo’s egg is very similar to a host egg, then this cuckoo’s egg is less likely to be discovered, and thus the fitness should be related to the difference in solutions. A random walk in a biased way with random step sizes is an excellent idea.

Steps for Implementation of Proposed Work by Using CSA

In this section, the step by step implementation of CSA for resolving the problem of optimal allocation of DSTATCOMs in RDS is described.
Step 1: Parameters initialization.
In step 1, the algorithm parameters should be initialized, e.g., the size of the population (POP), the maximum number of iterations (itermax), and dimensions. In addition to that, the problem parameters, like the number of DSTATCOMs to be used, the DSTATCOM size limits, the limitation of bus voltages, and the system line and bus data limits are given.
The parameters used in the CSA are:
  • Number of nests = 25.
  • Discovery rate of alien eggs/solutions = 0.25.
  • Levy coefficient = 0.5.
Step 2: Generate DSTATCOM sizes and locations randomly:
D S T L O C = [ a 1 1 a 2 1 a d 1 1 a d 1 a 1 2 a 2 2 a d 1 2 a d 2 a 1 p o p 1 a 2 p o p 1 a d 1 p o p 1 a d p o p 1 a 1 p o p a 2 p o p a d 1 p o p 1 a d p o p 1 ]
D S T S I Z E = [ b 1 1 b 2 1 b d 1 1 b d 1 b 1 2 b 2 2 b d 1 2 b d 2 b 1 p o p 1 b 2 p o p 1 b d 1 p o p 1 b d p o p 1 b 1 p o p b 2 p o p b d 1 p o p 1 b d p o p 1 ]
a i j = a min , i + ( a max , i a min , i ) r a n d ( )
b i j = b min , i + ( b max , i b min , i ) r a n d ( )
where d is the dimension of search space, a i j is the optimal location of DSTATCOM to be generated by algorithm, b i j is the optimal size of DSTATCOM to be generated by algorithm.
These parameters can be generated randomly between a max , i and a min , i , which are the ith DSTATCOM location limits, while b max , i and b min , i are the ith DSTATCOM size limits. Here, rand () is a random number between zero and one.
Step 3: Evaluation of fitness function.
Evaluate its fitness (Fi) according to objective function.
Step 4: Initiate evolution procedure of CSA for proposed work.
The following equations can be used to find new locations and sizing of DSTATCOM:
n e w   d s t l o c       i , d = D S T L O C       i , d + δ L evy ( λ )
n e w   d s t s i z e       i , d = D S T S I Z E       i , d + δ L evy ( λ )
n e w   n e s t       i , d = [ n e w d s t l o c       i , d n e w   d s t s i z e       i , d ]
Step 5: Evaluation of fitness (Fj).
Again, the base case values for a given objective function can be determined by the load flow method for every new nest.
Step 6: If (Fi < Fj), then replace the nest j with the cuckoo i.
Step 7: The fraction of worst nests among new nests are abandoned, and new ones are built using L’evy flight in those nests.
Step 8: The load flow is run again to calculate the power losses and voltages of the system and hence the corresponding objective function value for each new nest.
Step 9: If the maximum iteration is not reached, then go to step 6, otherwise it is the best nest (optimal solution).
Step 10: The criterion is stopped.
Algorithm is terminated if the iteration counter reaches the maximum value. If not, Steps 4 to 9 are repeated as shown in Figure 2.

4. Simulation Results and Discussion

The simulation is programmed and implemented on the standard 33-bus and 69-bus RDS within a MATLAB/ Simulink environment. The values of the parameters used for the calculation of total annual cost savings (TACS) of DSTATCOM are taken from the References [25,26]. The values of the parameters are common for both the test systems.

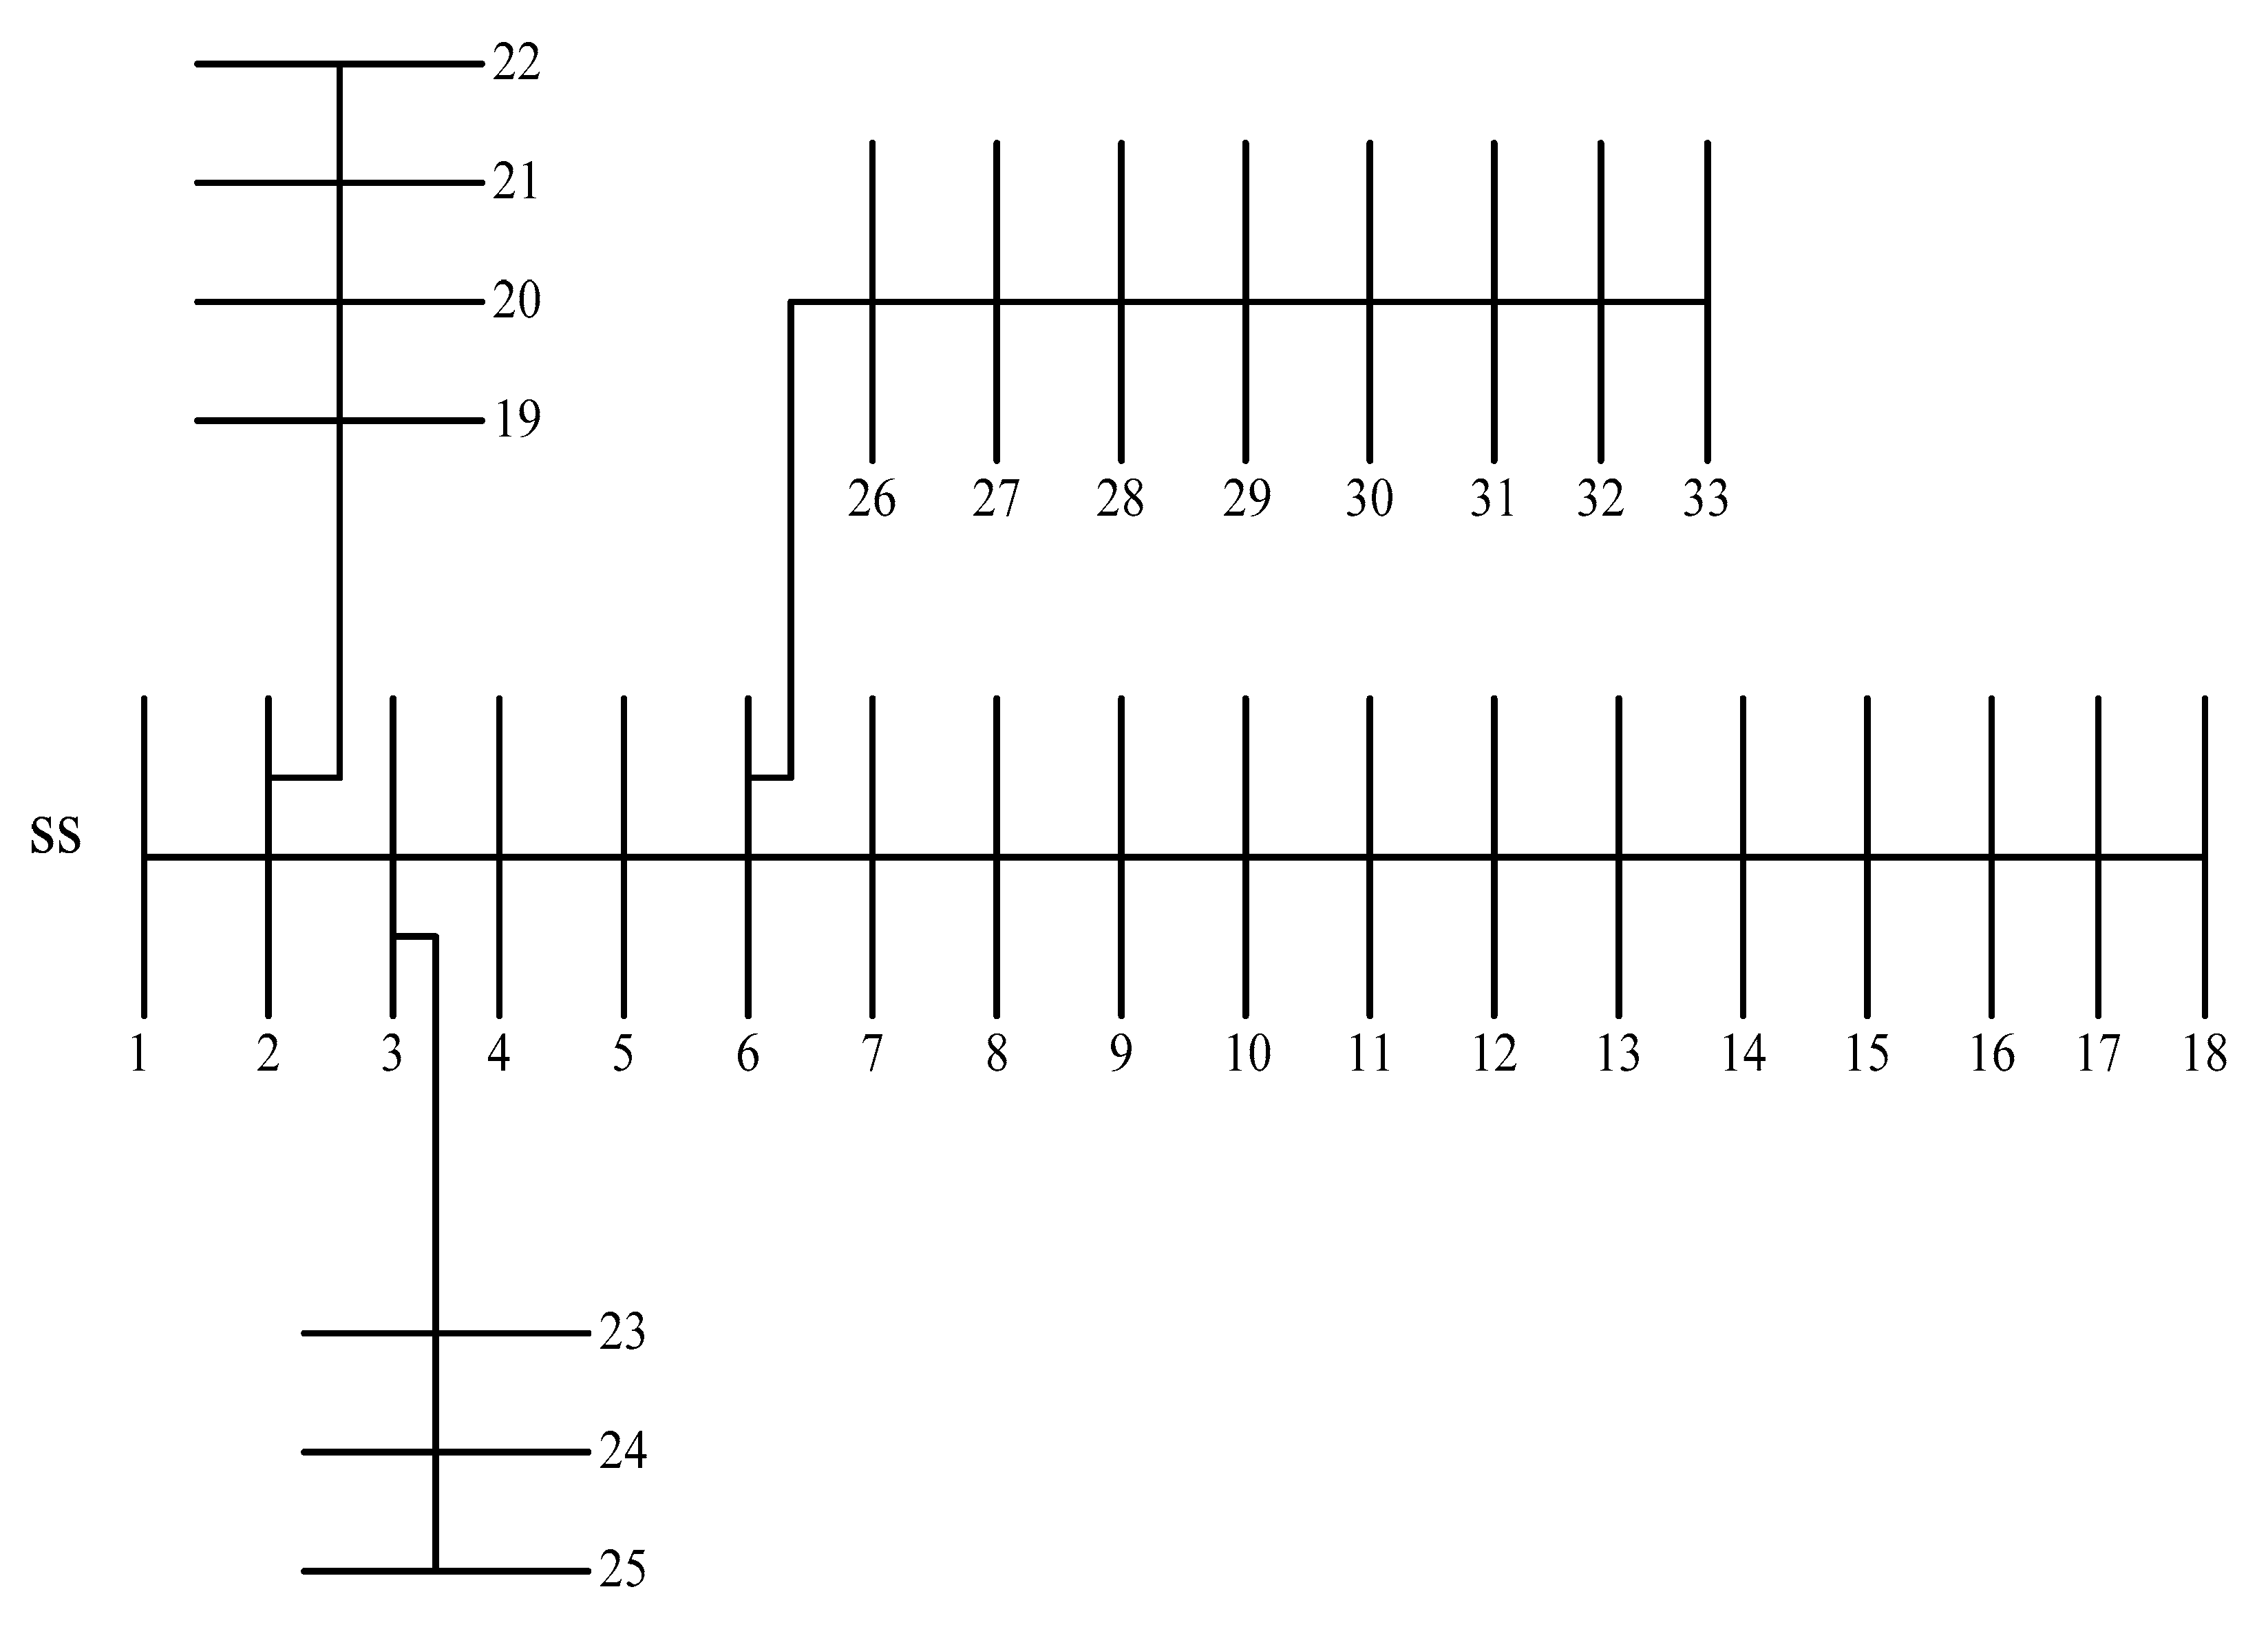
4.1. Test System 1: IEEE 33-Bus Test System

The first tested case is the medium-scale sample 33-bus test system, as illustrated in Figure 3. The line data, as well as the bus data for this system are taken from [27]:
  • 3.72 MW and 2.3 Mvar are the total active and reactive power demand for this test system.
  • 12.66 kV is the base voltage of this test system.
  • 201.98 kW is the uncompensated total real power loss with a minimum voltage of 0.9037 p.u.
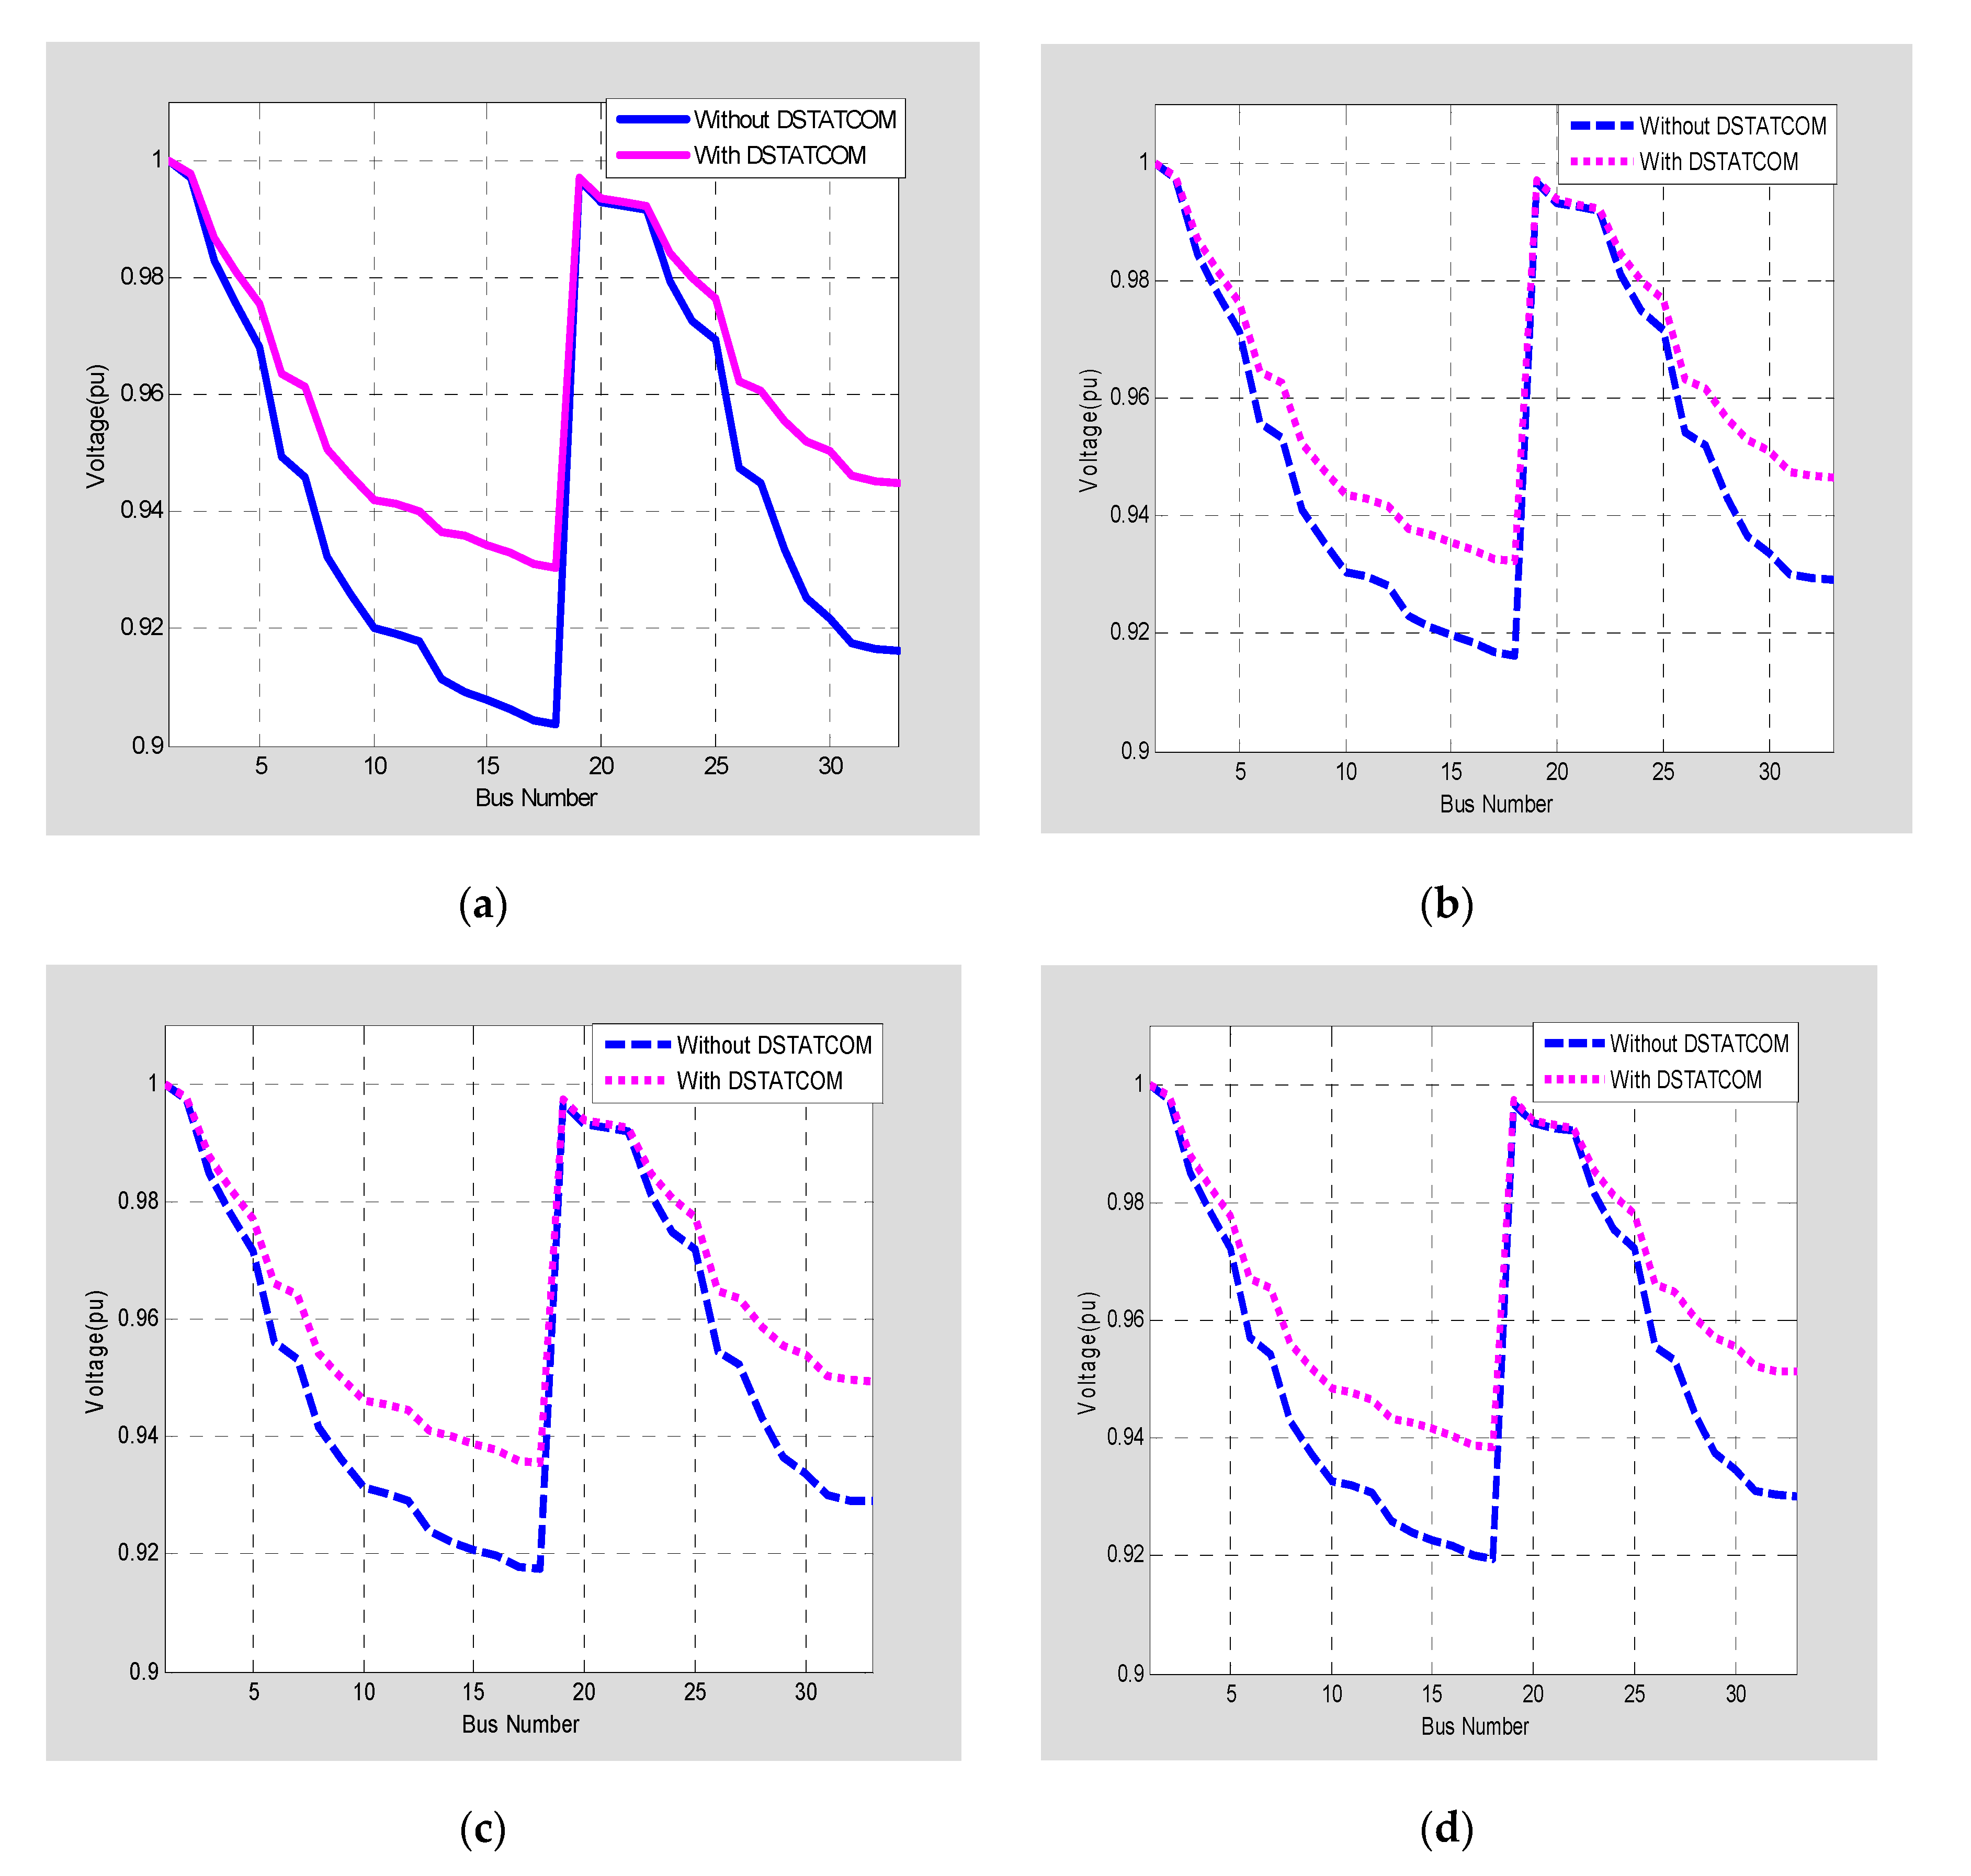
In the standard 33-bus test system, multiple DSTATCOMs have been optimally placed at the 14th, 24th and 30th buses with the help of the loss sensitivity factor (LSF). The maximum power loss reduction and enhancement of the voltages between the buses are attained using the proposed CSA. The active power loss, locations and sizes (kvar) of DSTATCOMs, TACS, minimum bus voltage and VSI for the presented CSA and other methods are presented in Table 2. The results of BFOA, PLI, SI and IA are directly quoted from the references. The total power loss reduced by placing DSTATCOM is 138.45 kW, which is better when compared to the base case of 210.98 kW. To compare the proposed method effectively, the DSTATCOM placement problem is solved 100 times repeatedly. The best, worst and average solutions are compared and presented in Table 2. The existing method’s best, worst and average solutions are not available for comparison. The power loss reduction by the proposed method is 34.37%, which is far better than 31.56% by BFOA, 27.44% by PLI, 19.52% by SI and 15.24% by IA. It is found that, after compensating the total loss reduction, TCAS, voltage profile is improved significantly.
The minimum voltage and voltage stability index have been improved from 0.9037 p.u and 0.6610 p.u to 0.9304 p.u and 0.7432 p.u, respectively. The proposed CSA-based approach gives more annual cost savings (USD 28,150), which is the maximum TACS compared with other methods. The TACS using the proposed method gives encouraging results. From the above discussion, it can be concluded that the CSA-based methodology shows better performance than other existing methods, in terms of power loss reduction, voltage enhancement, and TACS.
The electrical load in the distribution system is non-linear in nature. Next, the distribution system is analyzed by considering three different loads:
  • Industrial load
  • Residential load
  • Commercial load
The base power loss of industrial, residential and commercial loads are 163.66 kW, 159.09 kW and 152.59 kW, respectively. The optimization procedure is followed for all the three loads and the results are provided in Table 3. The power loss reductions obtained after DSTATCOM placement for industrial, residential and commercial loads are 18.45%, 24.54% and 27.66%, respectively. Figure 4a–d show the enhancement in the bus voltage profile under different load models. As can be seen from Table 3 and Figure 4a–d, after placing DSTATCOM using the proposed technique, the power and voltage profiles have been enhanced.
The DSTATCOM placement in radial distribution systems has many benefits, such as voltage profile enhancement, real power loss minimization and intake minimization of reactive power from the substation, which result in an important benefit for the distributor network operators (DNOs). In order to show the effective comparison, the power loss reduction by CSA is graphically compared with other classical methods and shown in Figure 5. This figure shows that the power loss reduction achieved by the proposed method is far better than that of other techniques. Hence, CSA is very accurate in finding the near global optima solutions.
In order to check the impacts of different CSA parameters for quality solutions, computational time and convergence behavior, it is necessary to do an empirical analysis to fine tuning of CSA parameters. The CSA parameters are tuned manually with 12 different cases as tabulated in Table 4. In the case 1, the parameter “Number of Nest (n)” is kept constant and the parameter “Discovery rate of alien eggs (pa)” is varied manually. In case 2, the parameter “pa” is kept constant and the parameter “n” is tuned manually. The total power loss, number of iteration and computational time for 33 bus system by varying the parameters are summarized in Table 4. It is noted that the best solutions are obtained when the n is 25 and the parameter pa is 0.25. The adaptive stopping criterion is set as 100, and it is fixed as constant to run the test system for 100 runs. Hence, the optimal parameter settings to solve the DSTATCOM problem using CSA method are found using empirical analysis.
In order to illustrate the convergence of the cuckoo search algorithm, the convergence characteristic of CSA for the best solution is shown in Figure 6. It is very clear that the CSA takes only 10 iterations to converge to the best solution, which takes less then 7 s. CSA shows a steady and rapid convergence with near global searching ability in solving DSTATCOM placement in a RDS.

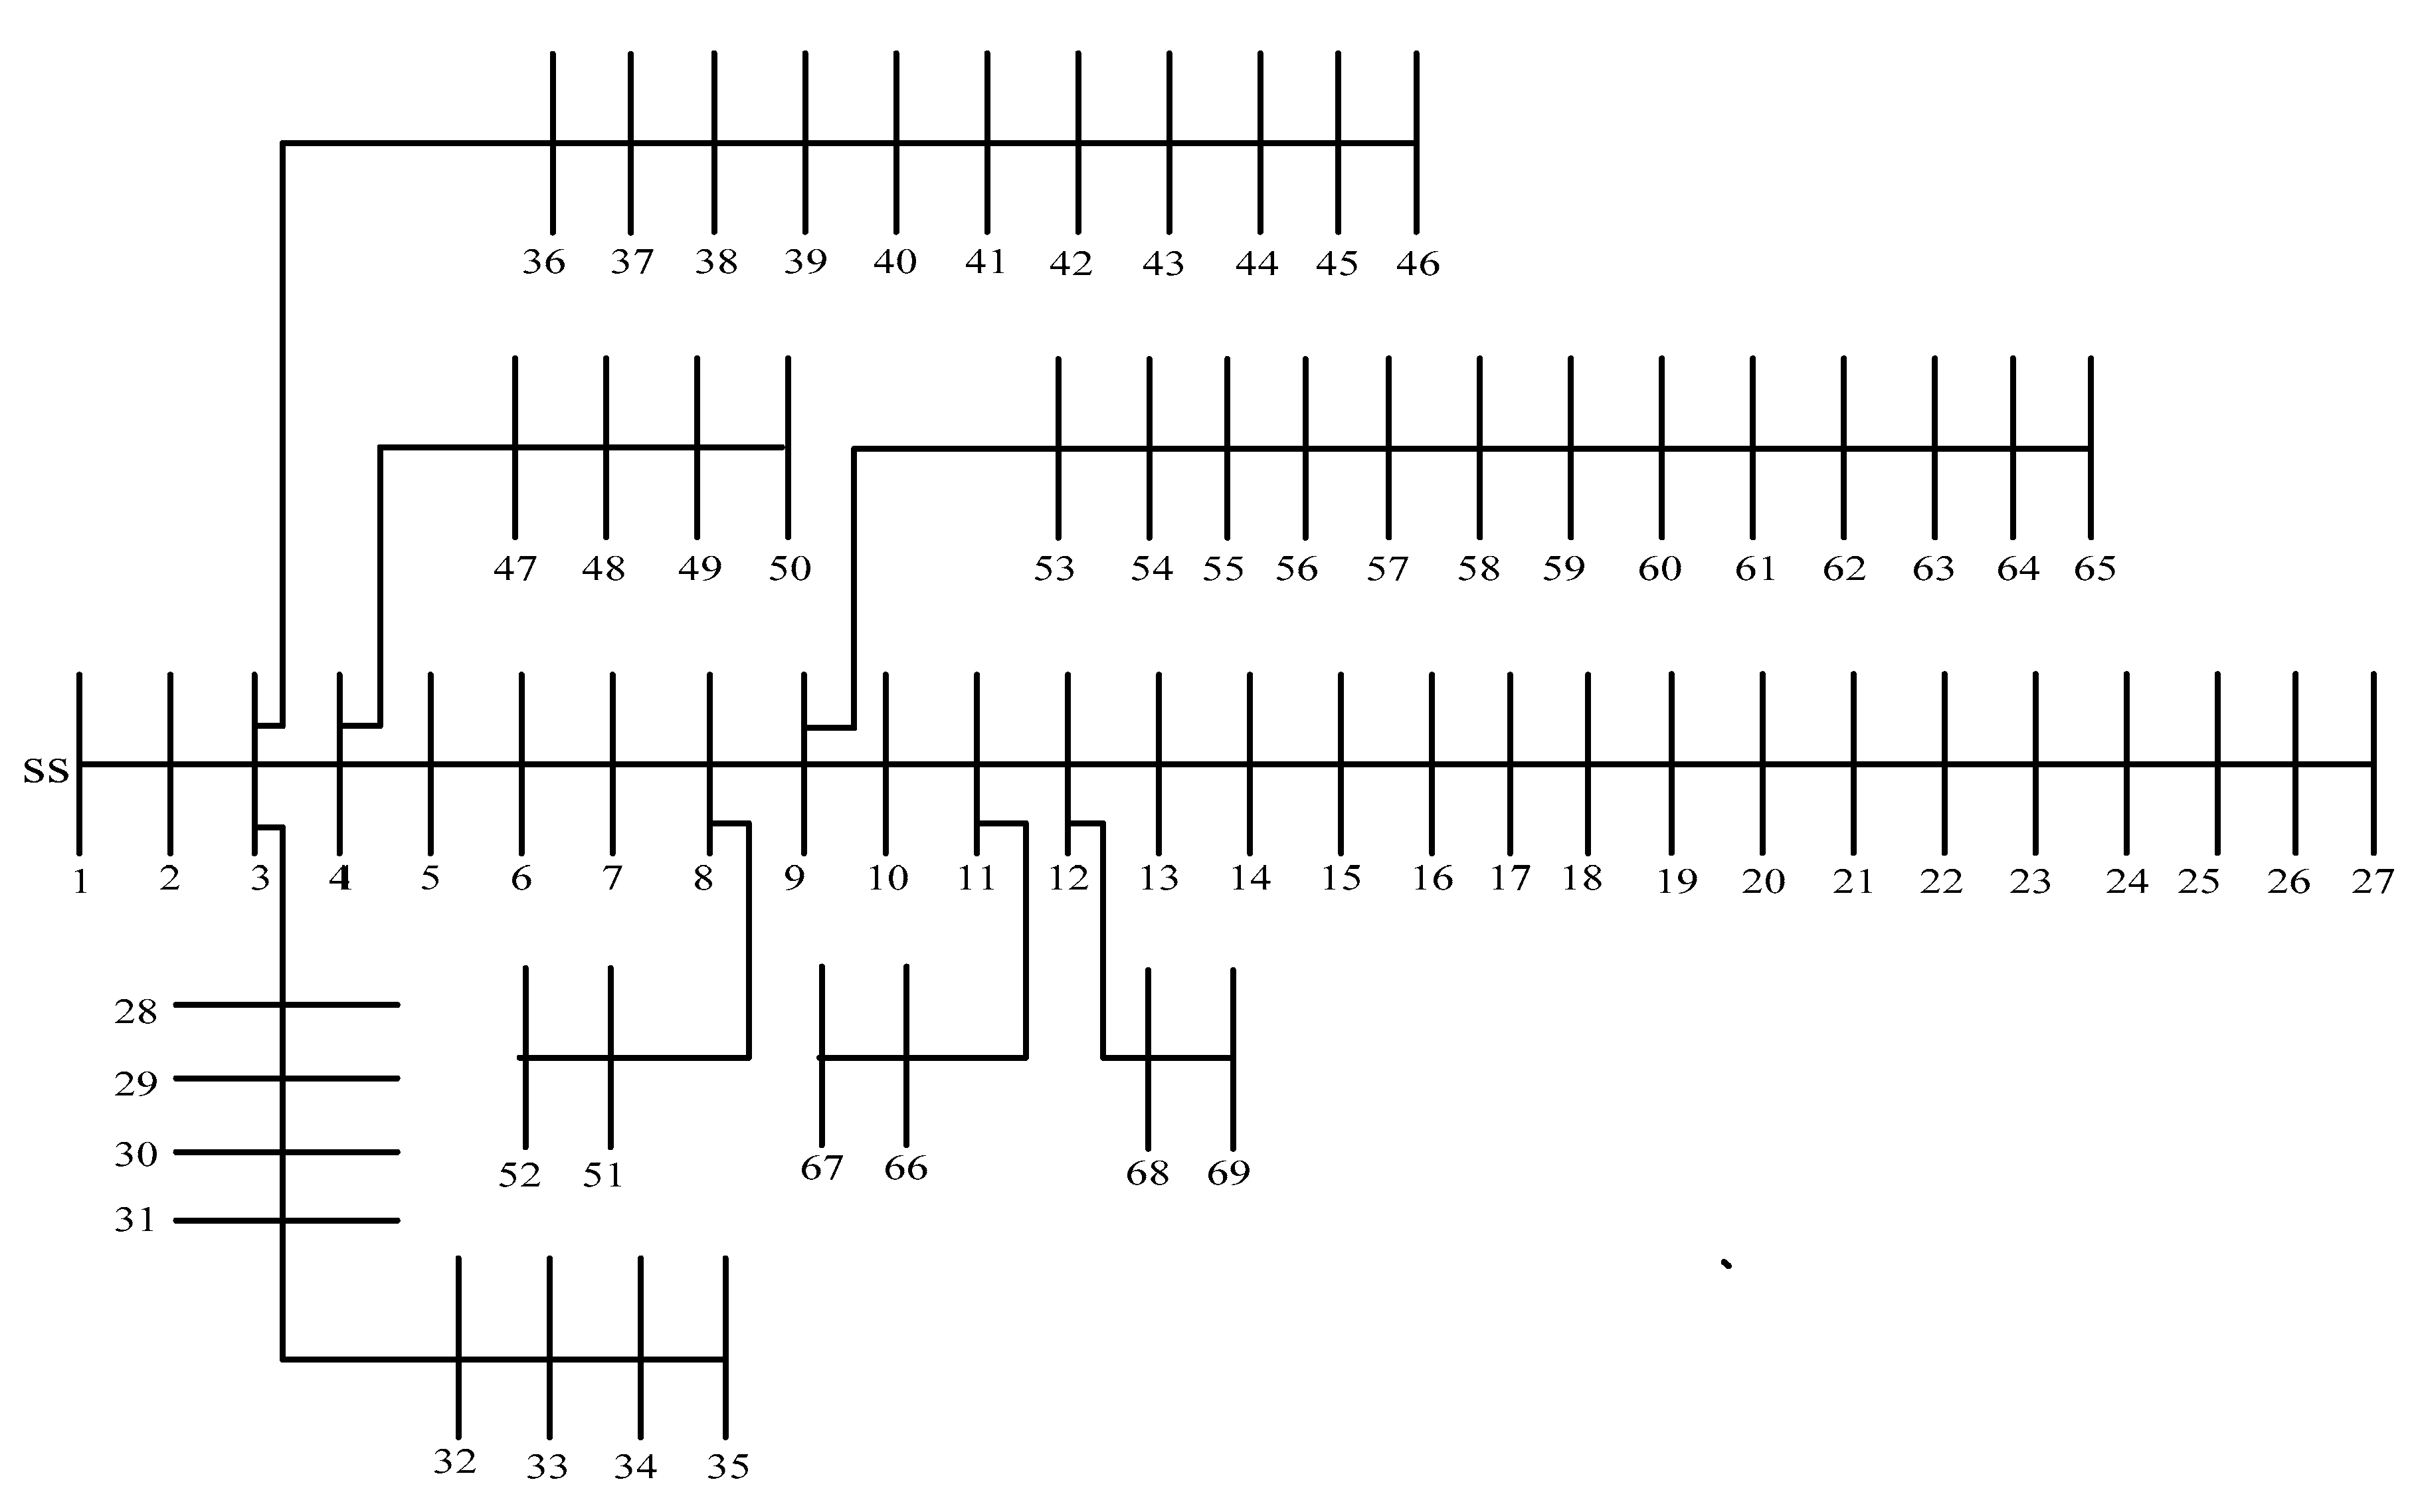
4.2. Test System 2: Standard 69-Bus Test System

The next case study is based on the large scale 69-bus test system as shown in Figure 7, with total active and reactive demand of 3.80 MW and 2.69 Mvar, respectively. The system comprises 69 buses and 68 branches within a radial distribution system, and the substation voltage is considered as 1 p.u. The uncompensated real power and reactive power losses are 225 kW and 102.2 kvar, respectively. The required demands for this test system are taken from [29,30]. This large-scale test system is considered to check the feasibility of the proposed technique. In order to validate the effectiveness of the proposed method to determine the optimal placement of DSTATCOMs, the results are compared with those achieved, considering other techniques.
For the standard 69-bus test system, three DSTATCOMs are optimally sized and placed. LSA is used to find the optimal locations of the DSTATCOMs and the CSA is used to find the optimal sizing of the DSTATCOMs. To show the performance of the present approach, the attained results are compared with other methods. Table 5 presents the optimal kvar, candidate location of the DSTATCOM placement, minimum bus voltage, power loss, and TACS of the proposed and existing methods. The proposed method is solved 100 times with optimal CSA parameters. The best, worst and average solutions of this 100 runs are tabulated in Table 5. After compensating the system using the proposed approach, the real loss has been decreased from 225 kW to 145.34 kW. The system bus voltage is significantly enhanced from 0.9090 p.u to 0.9301 p.u. In addition, the TACS of the proposed method is USD 32,587. From Table 5, it is noted that the decrease of power loss and total annual cost saving obtained from the proposed method is significantly high, compared to other methods like PSO, BA, and IA. This illustrates that the present approach is more effective than other methods.
To investigate the performance of the present approach in depth, it has been applied to different load models. The DSTATCOM sizes and locations, power loss, minimum voltage and VSI for all load models are illustrated in Table 6. This table represents a noteworthy enhancement in the power loss reduction in all load models when compared with the base case. The power loss reductions by industrial, residential and commercial are 18.07%, 27.81% and 28.41%, respectively. Figure 8a–d show the improvement in the voltage profile under different load models. As shown in these figures, the voltage levels at all buses significantly improve for all load models due to the insertion of DSTATCOMs in the RDS. This demonstrates that the present approach is very accurate in finding the power loss and voltage values for the system with different load models.
The convergence of the algorithm should be as stable as possible to get near global optimal solutions. In order to predict the performance of the CSA, the convergence characteristic of CSA for this test system is compared with other existing algorithms, as shown in Figure 9. It is very clear that the CSA takes only 10 iterations to converge to the best solution. In addition to that, the CSA shows a stable and quick convergence with a near global searching ability, to find the optimal DSTATCOM sizes. In general, CSA has very fast convergence speed. It converges fastest on both the test systems, and has the highest convergence accuracy. The CSA has strong competitiveness and can be applied to more complex particle problems.
The advantages of CSA are as follows,
  • Only two parameters are required to tune for optimization procedure.
  • Convergence speed is high.
  • Simple to alter the coding for any kind of optimization problem.
  • Easy to implement.
Note that it is not possible to prove that the solution achieved by the proposed algorithm is the global optimum. However, in order to show the superiority of the CSA, its performance is compared with other classical techniques, like BA [13], IA [28] and PSO [12], available in the literature of CSA optimization curve for standard 69 bus system. This analysis is provided in Figure 10, which shows that the CSA provides the lowest value of the objective function.
The superiority of the proposed method is summarized as follows.
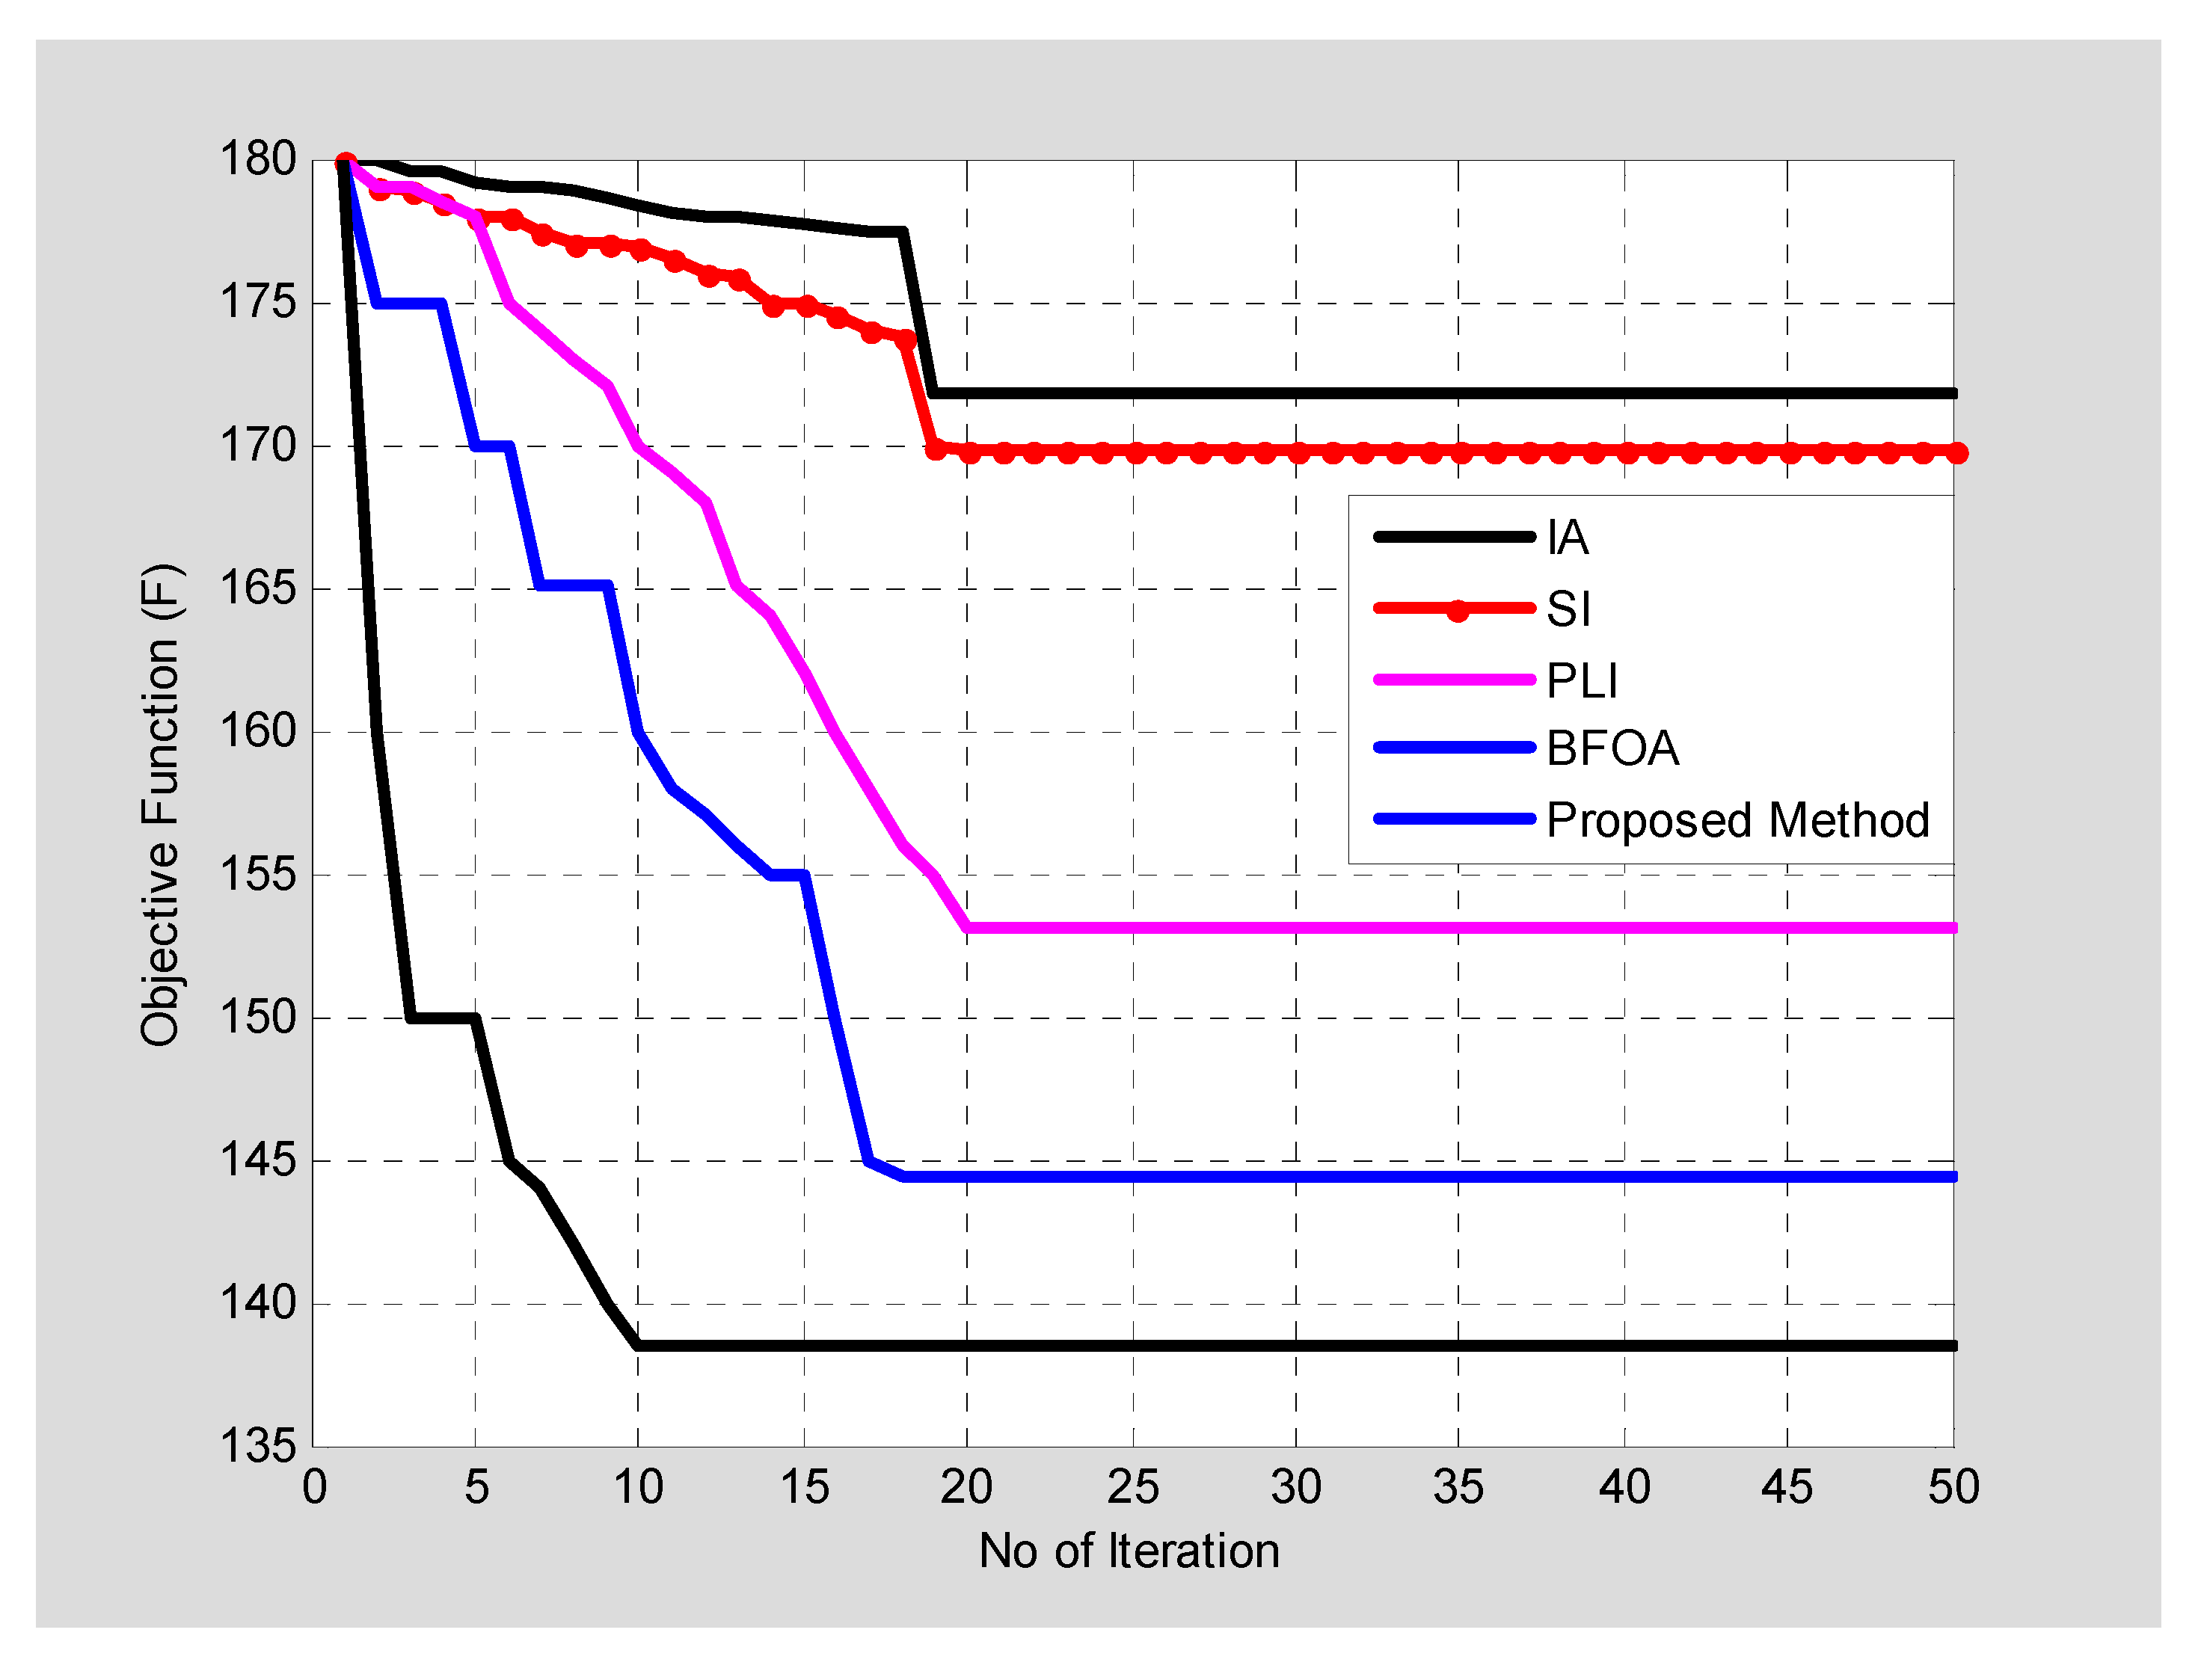
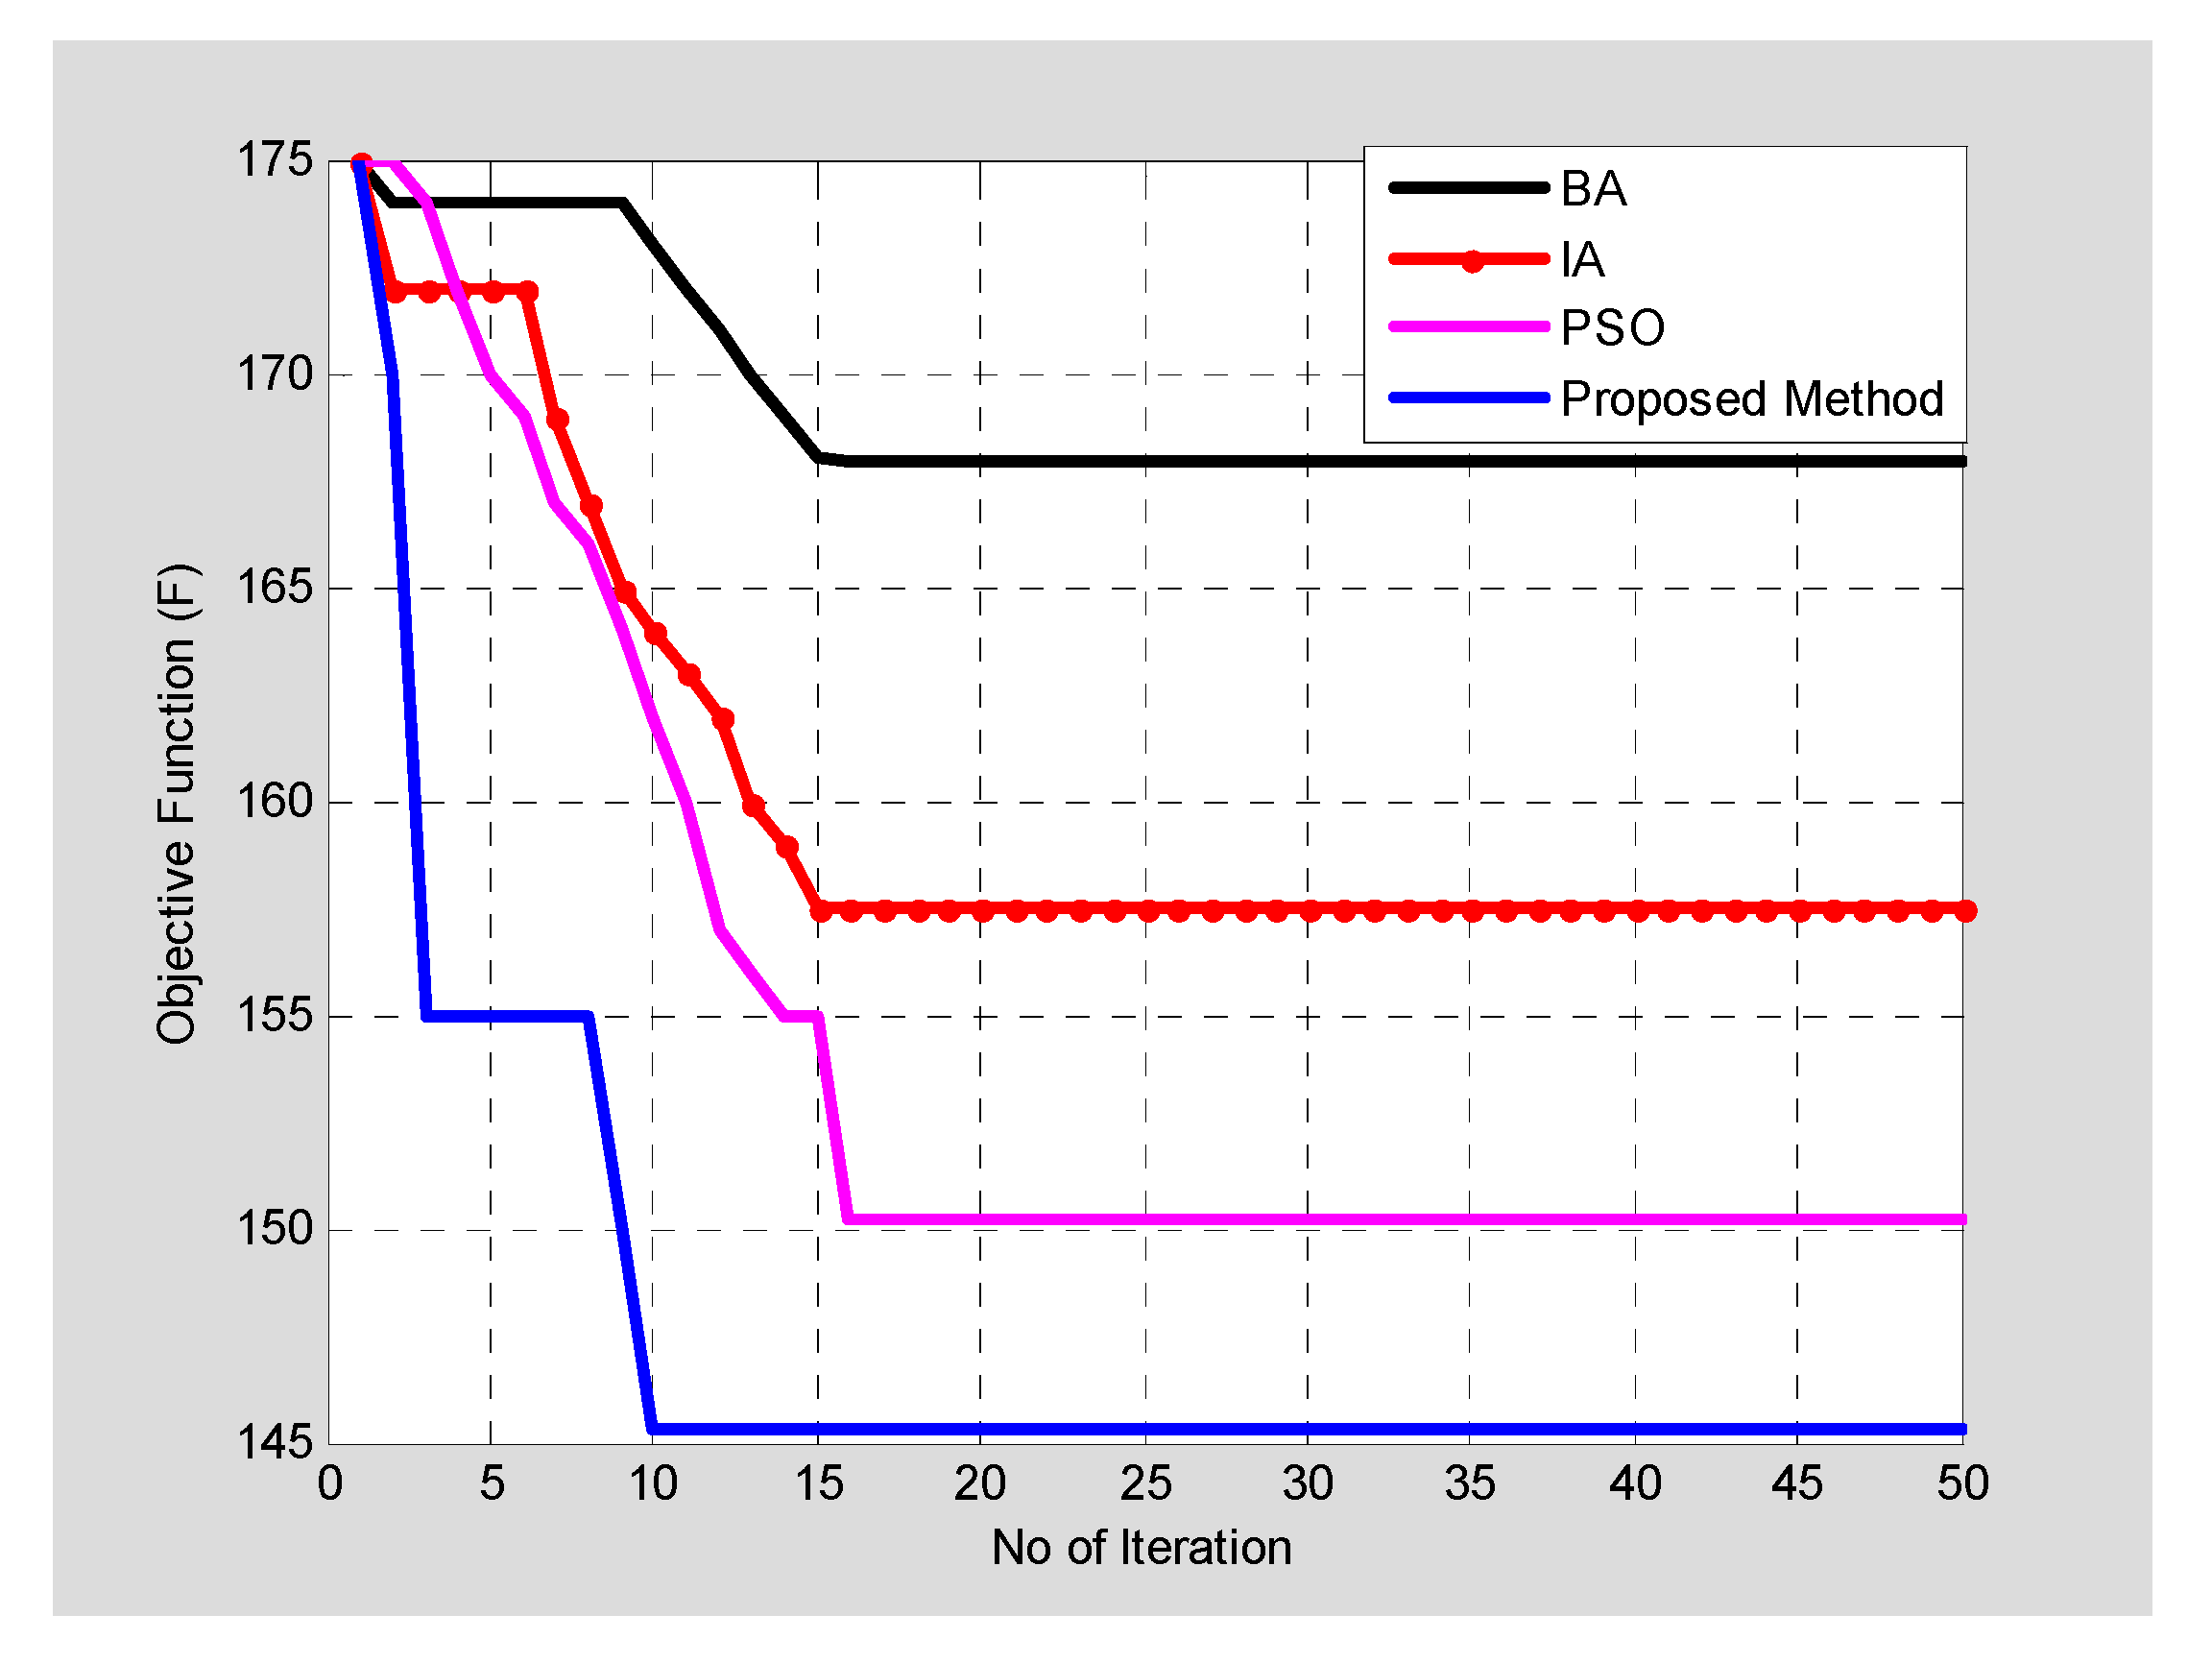
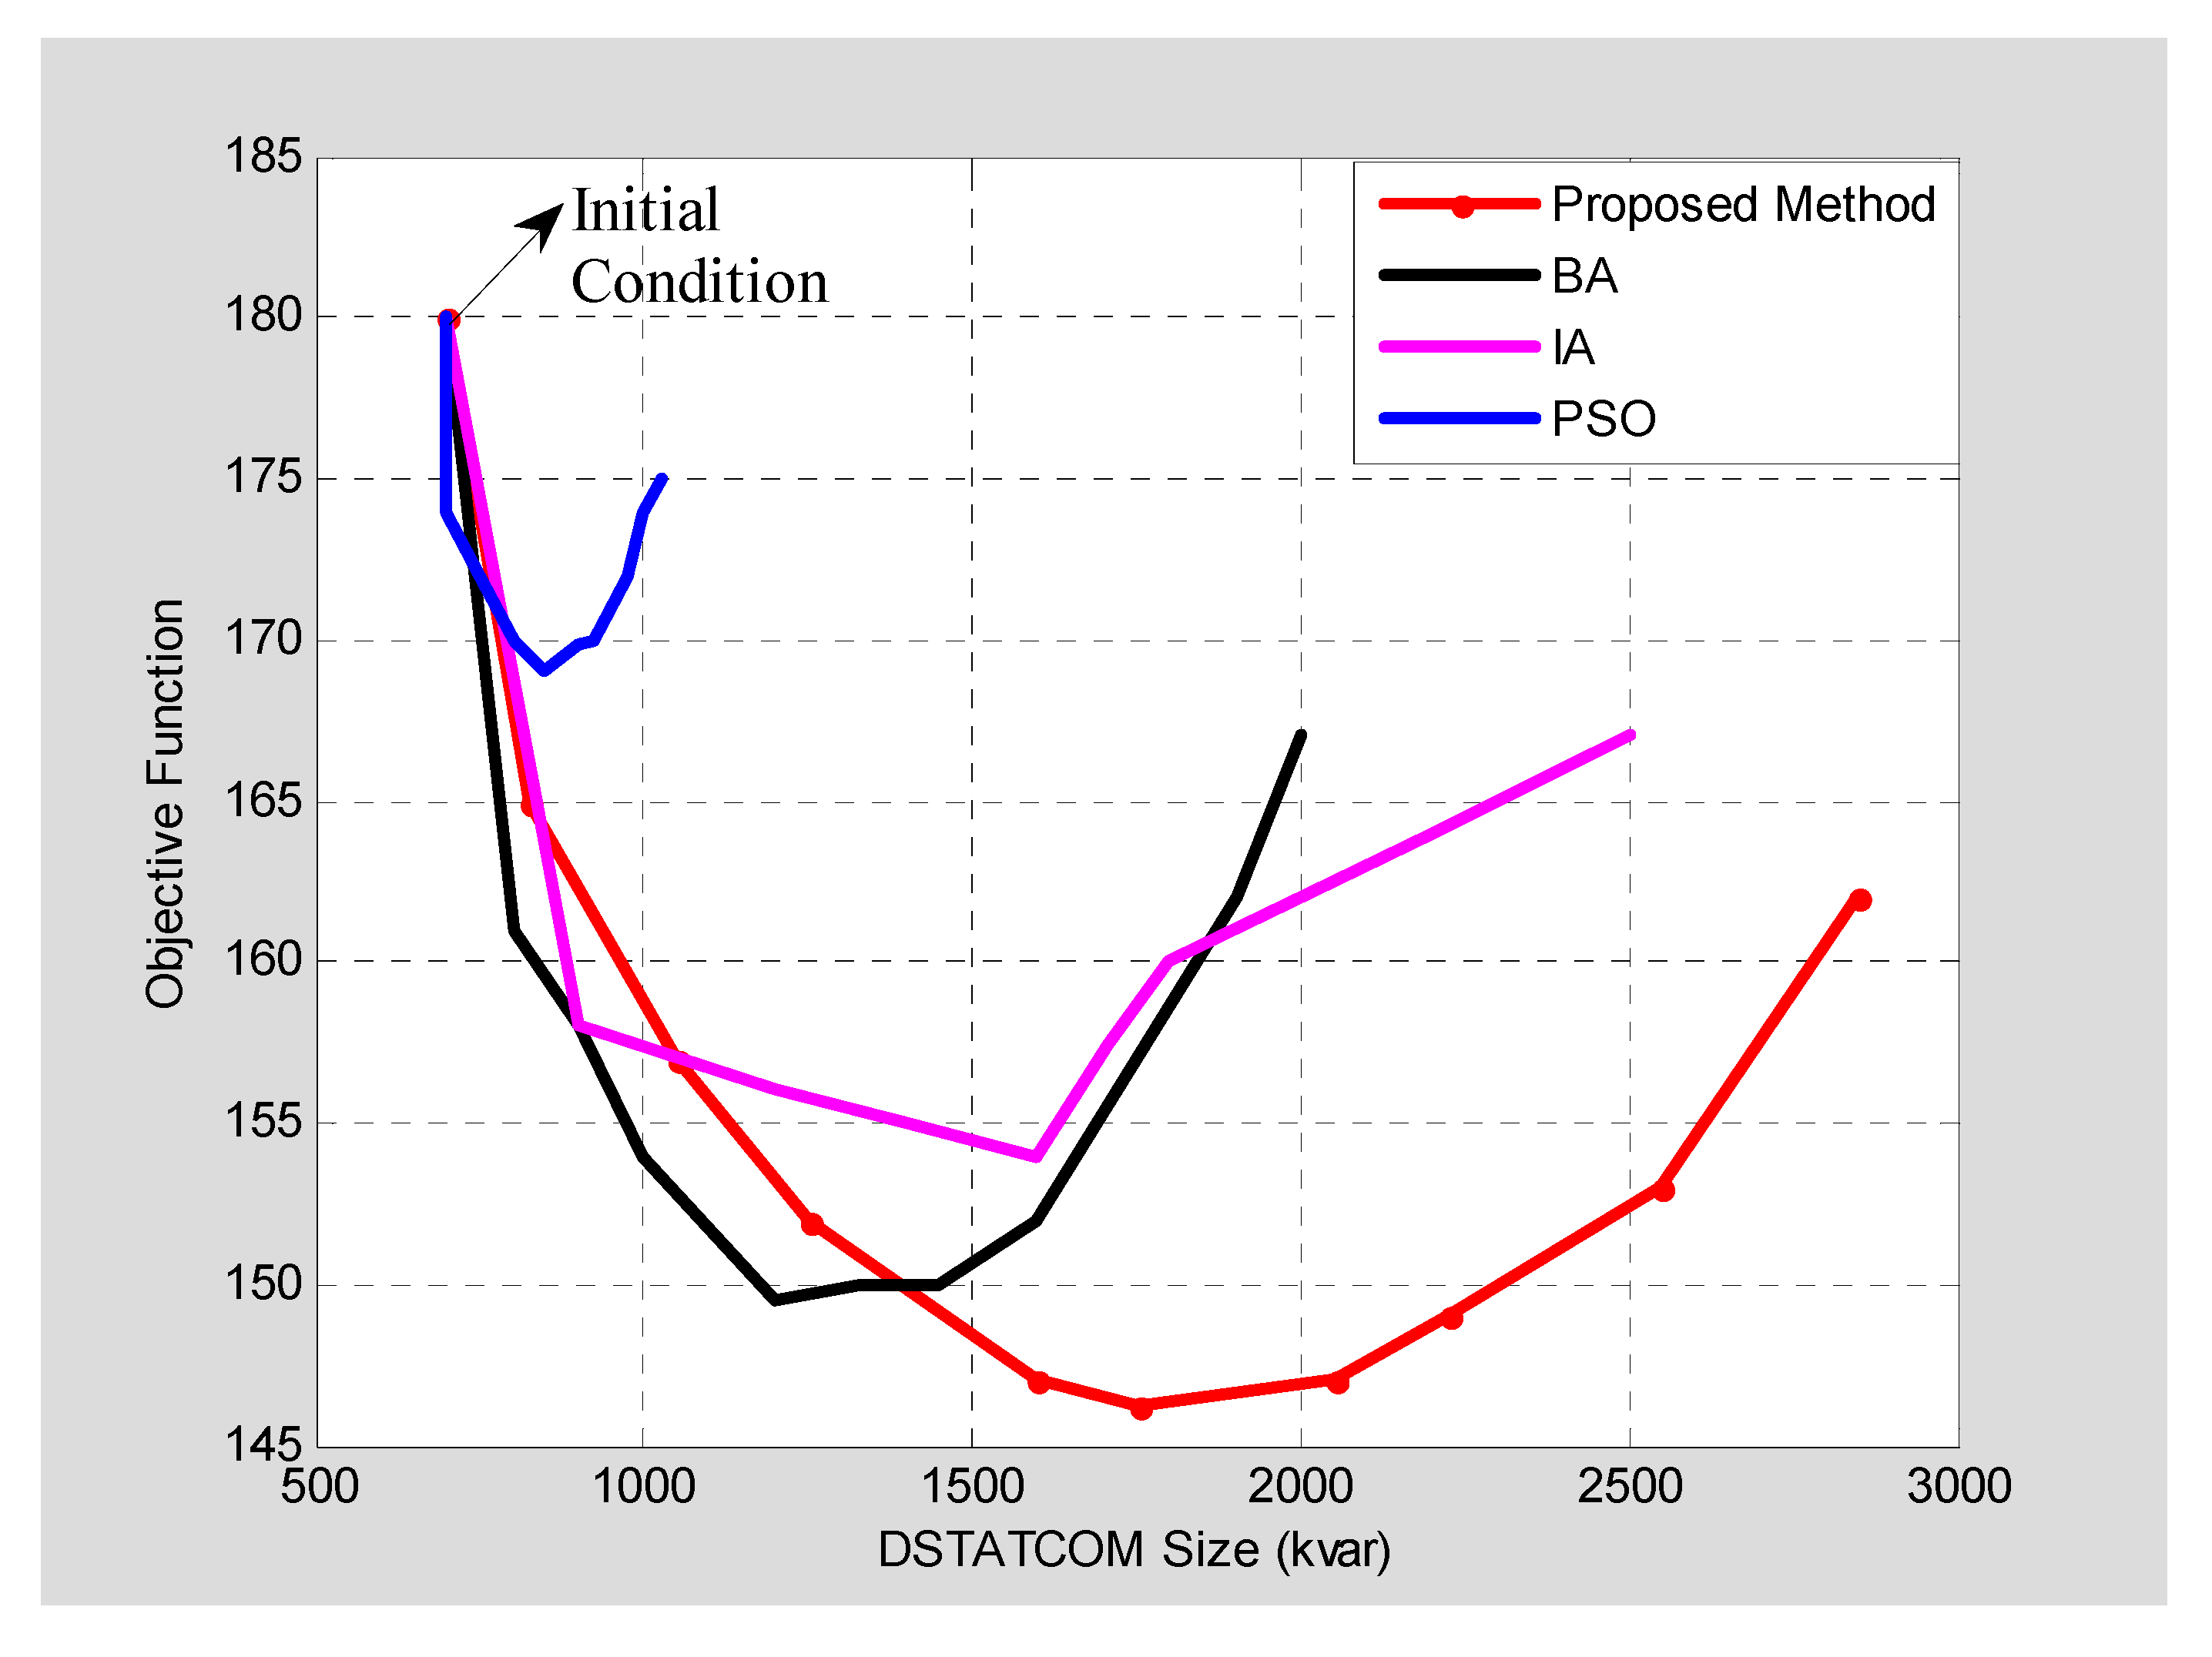
  • The power loss reduced by using the proposed method is 145.34 kW, which is better when compared with other classical techniques as shown in Table 7.
  • Total annual cost saved by the proposed method is 32587 USD, which is a huge saving when compared with other classical techniques. Additionally, 305 USD is saved by implementing a CSA-based approach.
  • CSA optimization procedure is simple when compared with other classical techniques.
  • The line loss of each section for standard 33 bus system is shown in Figure 11. It shows that the proposed method largely reduces the power loss when compared with other classical techniques.

5. Conclusions

In this work, a new approach is proposed for the optimization problem of DSTATCOM placement in a distorted unbalanced radial distribution system using the cuckoo search algorithm. This method is tested on standard 33- bus and 69-bus systems to evaluate the optimal location and sizing of DSTATCOM with different load models. The objective is to minimize the active power loss in the distribution system, as well as to enhance the voltage profile of the system. The simulated results were compared with other artificial techniques, such as BA, IA and PSO. The simulated results show that the cuckoo search algorithm is more effective than other methods investigated in this work in terms of active power loss minimization.
The main outcomes of this study are as follows:
  • The power loss obtained for the standard 33-bus system using the proposed method is 144.38 kW, which is far better than the 153-kW losses obtained using the PLI method.
  • Similar for the standard 69-bus system, the power loss is 145.34 kW, which is far better than the 150.2-kW losses obtained by the BA method.
  • The attained results show that the present approach reduces the power loss and improves the bus voltage profile accurately and effectively in RDS.
  • In addition to that, the study identifies the constant load model amongst various load models are sufficed and viable to place DSTATCOM for network losses and voltage studies.

Author Contributions

Conceptualization, D.K.R.; Methodology, Y.T.; Software, R.M.E.; Investigation, S.R. and M.I.A.R.; Writing—original draft preparation, R.M.E.; Writing—review and editing, U.S., N.D. and L.B.; Visualization, R.M.E.; All authors have read and agreed to the published version of the manuscript.

Funding

This research received no external funding.

Acknowledgments

The authors would like to thank Hindustan Institute of Technology and Science, Vellore Institute of Technology, Saveetha Institute of Medical and Technical Science, Prince Sultan University, Saudi Arabia; Central Queensland University, Australia; and Universidad de Castilla-La Mancha, Spain, for constant encouragement and support to perform this research work.

Conflicts of Interest

The authors declare that there are no conflict of interest.

Nomenclature

P and QActive and reactive power
P0 and Q0Nominal active and reactive power
α and βActive and reactive power exponents
P k , k + 1 & Q k , k + 1 Active and reactive power flow between buses k and k + 1
P k + 1 , e f f & Q k + 1 , e f f Total effective real and reactive power supplied beyond bus k + 1
P L o s s ( k , k + 1 ) & Q L o s s ( k , k + 1 ) Real and reactive power losses between buses k and k + 1 respectively
k and k + 1Sending and receiving end buses
V k min Minimum voltage at bus k
V k max Maximum voltage at bus k
P D S T A T C O M ( k ) Power generation using DSTATCOM
P D ( k ) Power demand at bus k
V k & V k + 1 Voltage magnitude across k and k + 1 buses
Q D S T A T C O M ( k ) min & Q D S T A T C O M ( k ) min Lower and upper ranges of the reactive power of compensated bus k

References

  1. Rohouma, W.; Balog, R.S.; Peerzada, A.A.; Begovic, M.M. D-STATCOM for harmonic mitigation in low voltage distribution network with high penetration of nonlinear loads. Renew. Energy 2020, 145, 1449–1464. [Google Scholar] [CrossRef]
  2. Ahmad, A.L.; Reza Sirjani, A. Optimal placement and sizing of multi-type FACTS devices in power systems using metaheuristic optimisation techniques: An updated review. Ain Shams Eng. J. 2019, 1–12. [Google Scholar] [CrossRef]
  3. Ali, M.S.; Haque, M.M.; Wolfs, P. A review of topological ordering based voltage rise mitigation methods for LV distribution networks with high levels of photovoltaic penetration. Renew. Sustain. Energy Rev. 2019, 103, 463–476. [Google Scholar] [CrossRef]
  4. Bayat, A.; Bagheri, A. Optimal active and reactive power allocation in distribution networks using a novel heuristic approach. Appl. Energy 2019, 233–234, 71–85. [Google Scholar] [CrossRef]
  5. Kazmi, S.A.; Ameer Khan, U.; Ahmad, H.W.; Ali, S.; Shin, D.R. A techno-economic centric integrated decision-making planning approach for optimal assets placement in meshed distribution network across the load growth. Energies 2020, 13, 1444. [Google Scholar] [CrossRef] [Green Version]
  6. Chandan, K.; Mahesh, K.M. A control algorithm for flexible operation of DSTATCOM for power quality improvement in voltage and current control mode. In Proceedings of the IEEE International Conference on Power Electronics, Drives and Energy Systems (PEDES), Bengaluru, India, 16–19 December 2012. [Google Scholar]
  7. Wasiak, I.; Rozmyslaw, M.; Ryszard, P.; Piotr, G. Application of DSTATCOM compensators for mitigation of power quality disturbances in low voltage grid with distributed generation. In Proceedings of the 9th International Conference on Electrical Power Quality and Utilisation, Barcelona, Spain, 9–11 October 2007. [Google Scholar] [CrossRef]
  8. Gupta, A.R.; Ashwani, K. Energy Saving Using D-STATCOM Placement in Radial Distribution System under Reconfigured Network. Energy Procedia 2016, 90, 1–6. [Google Scholar] [CrossRef]
  9. Hussain, S.M.; Subbaramiah, M. An analytical approach for optimal location of DSTATCOM in radial distribution system. In Proceedings of the International Conference on Energy Efficient Technologies for Sustainability, Nagercoil, India, 10–12 April 2013. [Google Scholar] [CrossRef]
  10. Jain, A.; Gupta, A.; Kumar, A. An efficient method for D-STATCOM placement in radial distribution system. In Proceedings of the IEEE 6th International Conference on Power Electronics (IICPE), Kurukshetra, India, 8–10 December 2014. [Google Scholar] [CrossRef]
  11. Gupta, A.R.; Kumar, A. Energy savings using D-STATCOM placement in radial distribution system. Procedia Comput. Sci. 2015, 70, 558–564. [Google Scholar] [CrossRef] [Green Version]
  12. Devi, S.; Geethanjali, M. Optimal location and sizing determination of distributed generation and DSTATCOM using particle swarm optimization algorithm. Int. J. Electr. Power Energy Syst. 2014, 62, 562–570. [Google Scholar] [CrossRef]
  13. Khorram-Nia, R.; Baziar, A.; Kavousi-Fard, A. A novel stochastic framework for the optimal placement and sizing of distribution static compensator. J. Intell. Learn. Syst. Appl. 2013, 5, 90–98. [Google Scholar] [CrossRef] [Green Version]
  14. Devabalaji, K.; Ravi, K. Optimal size and siting of multiple DG and DSTATCOM in radial distribution system using bacterial foraging optimization algorithm. Ain Shams Eng. J. 2016, 7, 959–971. [Google Scholar] [CrossRef] [Green Version]
  15. Singh, D.; Singh, D.; Verma, K.S. Multiobjective optimization for DG planning with load models. IEEE Trans. Power Syst. 2009, 24, 427–436. [Google Scholar] [CrossRef]
  16. Khushalani, S.; Schulz, N. Unbalanced distribution power flow with distributed generation. In Proceedings of the 2005/2006 IEEE/PES Transmission and Distribution Conference and Exhibition, Dallas, TX, USA, 21–24 May 2006. [Google Scholar] [CrossRef]
  17. Lata, P.; Vadhera, S. Reliability improvement of radial distribution system by optimal placement and sizing of energy storage system using TLBO. J. Energy Storage 2020, 30, 101492. [Google Scholar] [CrossRef]
  18. Devabalaji, K.; Ravi, K.; Kothari, D. Optimal location and sizing of capacitor placement in radial distribution system using bacterial foraging optimization algorithm. Int. J. Electr. Power Energy Syst. 2015, 71, 383–390. [Google Scholar] [CrossRef]
  19. Prakash, K.; Sydulu, M. Particle swarm optimization based capacitor placement on radial distribution systems. In Proceedings of the IEEE Power Engineering Society General Meeting, Tampa, FL, USA, 24–28 June 2007. [Google Scholar] [CrossRef]
  20. Ebrahim, M.A.; Wadie, F.; Abd-Allah, M.A. Integrated fault detection algorithm for transmission, distribution, and microgrid networks. IET Energy Syst. Int. 2019, 1, 104–113. [Google Scholar] [CrossRef]
  21. Al-Jaafreh, M.A.; Mokryani, G. Planning and operation of LV distribution networks: A comprehensive review. IET Energy Syst. Int. 2019, 1, 133–146. [Google Scholar] [CrossRef]
  22. Nguyen, T.T.; Nguyen, T.T. An improved cuckoo search algorithm for the problem of electric distribution network reconfiguration. Appl. Soft Comput. 2019, 84, 105720. [Google Scholar] [CrossRef]
  23. Yang, X.S.; Deb, S. Cuckoo search via Levy flights. In Proceedings of the World Congress on Nature & Biologically Inspired Computing (NaBIC 2009), Coimbatore, India, 9–11 December 2009. [Google Scholar] [CrossRef]
  24. Yang, X.; Deb, S. Cuckoo search: Recent advances and applications. Neural Comput. Appl. 2013, 24, 169–174. [Google Scholar] [CrossRef] [Green Version]
  25. Yome, A.S.; Mithulananthan, N.; Kwang, L. Voltage Stability Assessment and Enhancement of the Thailand Power System. IFAC Proc. Vol. 2006, 39, 119–124. [Google Scholar] [CrossRef]
  26. Vijayakumar, K.; Kumudinidevi, R.P. A new method for optimal location of FACTS controllers using genetic algorithm. J. Theor. Appl. Inf. Technol. 2007, 3, 1–6. [Google Scholar]
  27. Sahoo, N.; Prasad, K. A fuzzy genetic approach for network reconfiguration to enhance voltage stability in radial distribution systems. Energy Convers. Manag. 2006, 47, 3288–3306. [Google Scholar] [CrossRef]
  28. Taher, S.A.; Afsari, S.A. Optimal location and sizing of DSTATCOM in distribution systems by immune algorithm. Int. J. Electr. Power Energy Syst. 2014, 60, 34–44. [Google Scholar] [CrossRef]
  29. Baran, M.; Wu, F. Network reconfiguration in distribution systems for loss reduction and load balancing. IEEE Trans. Power Deliv. 1989, 4, 1401–1407. [Google Scholar] [CrossRef]
  30. Baran, M.; Wu, F. Optimal sizing of capacitors placed on a radial distribution system. IEEE Trans. Power Deliv. 1989, 4, 735–743. [Google Scholar] [CrossRef]
Figure 1. Single line diagram of distribution system.
Energies 13 04615 g001
Figure 2. Flow Chart of CSA.
Energies 13 04615 g002
Figure 3. Sample line diagram of standard 33-bus test system.
Energies 13 04615 g003
Figure 4. Voltage profile of standard 33-bus test system under different load models: (a) Constant Load, (b) Industrial Load, (c) Residential Load, and (d) Commercial Load.
Energies 13 04615 g004
Figure 5. Comparison of power loss reduction by CSA with other classical techniques.
Energies 13 04615 g005
Figure 6. Comparison of Convergence characteristic of Objective Function for standard 33 Bus system.
Energies 13 04615 g006
Figure 7. Sample line diagram of standard 69-bus test system.
Energies 13 04615 g007
Figure 8. Voltage profile of standard 69-bus test system under different load models: (a) Constant Load. (b) Industrial Load. (c) Residential Load. (d) Commercial Load.
Energies 13 04615 g008aEnergies 13 04615 g008b
Figure 9. Comparison of convergence characteristics for standard 69-bus system.
Energies 13 04615 g009
Figure 10. Performance of different methods for standard 69-bus system.
Energies 13 04615 g010
Figure 11. Comparison of performance of line losses for standard 33 bus system.
Energies 13 04615 g011
Table 1. Load types and exponent values.
Load Typeαβ
Commercial load1.513.4
Residential load0.924.04
Industrial load0.186
Constant00
Table 2. Results of 33-bus system (Constant Load).
Type ParametersProposed Method BFOA [14]PLI [11]SI [10]IA [28]
Before CompensationPloss(kW)210.98210.98210.98210.98202.67
Vmin(p.u)0.90370.90370.90370.90370.9131
VSImin(p.u)0.66100.66100.66100.66100.6890
After CompensationSize in kvar (location)350 (14)
520 (24)
1010 (30)
1102.7 (30)1300 (29)1993 (30)962.49 (12)
Ploss(kW)(100Runs)
Best138.45144.38153.07169.795171.79
Worst 158.24----
Average147.24----
% Ploss Reduction34.3731.5627.4419.5215.24
Vmin(p.u)0.93040.92400.91640.92300.9258
VSImin(p.u)0.74320.72280.69940.71750.7266
TACS28,15028,10523,54311,07311,126
Table 3. Results of 33-bus system with different Load Models.
ParametersIndustrialResidentialCommercial
B.CA.CB.CA.CB.CA.C
Size (kvar) and Locations-------210 (14)
420 (24)
630 (30)
-------230 (14)
440 (24)
740 (30)
-------240(14)
450(24)
760(30)
P l o s s (kW)163.66133.46159.09120.04152.59110.37
% Reduction in P l o s s -------18.45-------24.54-------27.66
V min (p.u)0.91620.93220.91750.93550.91950.9383
V S I min (p.u)0.69870.74920.7030.76050.70970.7699
TACS-------9190-------1304-------1450
Where, B.C and A.C are before and after compensations.
Table 4. Optimal parameter setting of CSA for 33-bus system.
CaseParameter Settings Power Loss (kW)No of IterationCPU Time (s)Adaptive Stopping Criterion (Iterative)
npa
1250.10145.25129100
250.15143.25129100
250.20140.25108100
250.25137.48107100
250.30139.25108100
250.35142.35129100
250.40146.35139100
2100.25146.321211100
200.25142.361010100
300.25143.251011100
400.25145.361111100
500.25148.251212100
Table 5. Results of standard 69-bus system (Constant Load).
TypeParametersProposed Method BA [13]IA [28]PSO [12]
Before CompensationPloss(kW)225225225225
Vmin(p.u)0.90900.90900.90900.9090
VSImin(p.u)0.68220.68220.68220.6822
After Compensation Size in kvar (location)350 (11)
230 (18)
1170 (61)
1326 (61)1704.42 (61)901 (61)
Ploss(kW)(100runs)
Best145.34150.2157.5167.9
Worst166.85---
Average158.85---
% Ploss Reduction35.433.243025.37
Vmin(p.u)0.93010.93090.93530.9241
VSImin(p.u)0.74280.74240.75610.7255
TACS32,58732,28226,43825,233
Table 6. Results of standard 69-bus system with different Load Models.
ParametersIndustrialResidentialCommercial
B.CA.CB.CA.CB.CA.C
Size (kvar) and Locations-------300 (11)
170 (18)
700 (61)
-------320 (11)
200 (18)
820 (61)
-----320 (11)
200 (18)
880 (61)
P l o s s (kW)171.39140.42164.87123.96156.92112.33
% Reduction in P l o s s -------18.07-------24.81 28.41
V min (p.u)0.91960.93190.92170.93610.92420.9396
V S I min (p.u)0.71360.74770.72110.76250.72890.7742
TACS-------10,072-------14,395-------16,011
Table 7. Comparative analysis of proposed method with other classical methods for standard -69 bus Test System.
ParametersProposed Method BA [13]IA [28]PSO [12]
Power Loss (kW)145.34150.2157.5167.9
TACS (USD)32,58732,28226,43825,233
Optimization ProcedureSimpleComplexComplexComplex

