1. Introduction
In conditions when all of humanity is switching to digitalization of all areas of its activity, the need for protecting the information resources, including energy power grids that appear on the network, arises very urgently. Information protection is of great importance in times of crisis, in particular, at present time, which is characterized by the struggle of almost all countries of the world with the covid-19 infection. At the moment, there is no accurate analytical data on the growth of cyber crime during the pandemic, but there are reliable estimates that confirm that such an increase is observed, up to 400% [
1,
2]. However, even the World Health Organization (WHO) found that since the beginning of the pandemic, there has been a sharp increase in the number of cyberattacks against WHO staff and cases of e-mail fraud directed against the population in general. [
3]. According to WHO, we can talk about a fivefold increase in the number of these cyberattacks. Similar examples make cyber security even more attentive. In [
4,
5,
6,
7,
8,
9,
10,
11,
12,
13,
14,
15], various types of cyber attacks were considered, and the most damaging of them were attacks based on the collection of data on the attack target. The preparation process consists of a certain sequence of actions, and the revealing of this sequence is the task of early attack detection methods. This approach minimizes the loss from an attack or even prevent it.
The idea of the method of early detection of cyber impact by the method of extreme filtering was presented by the authors in [
16]. This method is based on the decomposition of a fast variable process into extreme values. Selected extrema are filtered using a smoothing operator:
where
ysi is the value at point i relative to which smoothing is performed,
yei is the extremum at point i.
Then we distinguish the alternating component:
where
ypi are the values of the distinguished component at point i.
After these actions, interpolation is performed.
Using the previously described mathematical apparatus, it was possible to detect with high accuracy an equal periodic effect in the network, the amplitude of which was comparable with the amplitude of the legitimate component of the traffic. However, this function does not describe the impact of an attacker preparing an attack against a telecommunication network. In such cases, the intruder’s goal is to obtain information about the network, while remaining unnoticed. That is, the illegitimate component of the traffic that needs to be detected has a low frequency and low amplitude, and the packets follow in small bundles. According to the simulation results, it was not possible to detect the introduced component, the mathematical expectation of which is significantly lower than the mathematical expectation of the legitimate component of the network traffic. Thus, the aim of the work is to develop a methodology that allows one to detect an additively superimposed illegitimate component corresponding to the process of preparing an attack on a telecommunication network and assessing the effect that this method brings.
The theoretical contribution of the article lies in the further development of the original method of early detection of anomalies in the traffic of telecommunication networks, which makes it possible to detect rather complex cyber attacks, including target attacks. The approach, proposed in the article, increases the sensitivity of the method of early detection of cyber-attacks by identifying the actions of the intruder that he/she wants to hide.
The further structure of the article is as follows.
Section 2 analyzes related work. A description of the proposed method is given in
Section 3.
Section 4 discusses the implementation of the proposed method and the results of its experimental evaluation. The main conclusions and directions for further research are presented in
Section 5.
2. Related Work
Research and development of methods for detecting and countering cyber attacks is one of the most promising and actively developing areas in the field of cyber security over the past decade. Moreover, research is being conducted for various types of cyber attacks, for various fields of their application and for various methods of protection against them, while emphasizing the enormous importance of these studies [
17]. Therefore, in [
5,
6], a classification of one of the most dangerous and complex types of cyber attacks, which is distributed denial of service (DDoS), as well as a classification of possible countermeasures for an attack of this type, is given. In this work, it is shown that all methods for detecting DDoS attacks are divided into two types: Signature methods, which take into account predefined rules and patterns, and data analysis, in which anomalies in the traffic of the telecommunication network or in user behavior are detected. At the same time, signature methods become less effective when new types of attacks appear and their complexity increases.
In [
7,
8], features of the implementation of cyber attacks in cloud systems are considered. In these works, it was shown that, due to the high scalability of such systems, complex cyber attacks (DDoS attacks and target attacks) do not lead to disruption of the computational process. However, they have a significant impact on the economic performance of end users, as users are forced to use additional computing resources. Therefore, methods of counteracting this type of attack should detect these attacks in the shortest time and provide mitigation of the consequences of their implementation. The approach proposed in this article has the same purpose.
It was shown in [
9] that complex cyber attacks can be implemented, not only in traditional computer networks, but also in networks of a cyber physical nature, for example, in the networks of the Internet of things. Most of the devices that make up the Internet of things, including power management devices, are vulnerable to such cyber attacks. Complex target attacks can also include domain name attacks [
18].
Considering the methods of protection against complex cyber attacks, we can come to the conclusion that, as a rule, they combine the following two directions: (1) Identification of anomalies signaling the presence of a cyber attack, and (2) proactive defense associated with preempting the actions of the intruder and introducing him misleading. The first area includes works [
10,
11,
12], in which the method of detecting cyber attacks is based on building a traffic model and identifying anomalies in it based on the use of artificial neural networks and various machine learning models, such as Naïve Bayes, Support Vector Machine, K-Nearest Neighbors, K-means and other. In [
19,
20], a number of heuristic methods for detecting anomalies in the energy control network were proposed. These methods take into account the context of an energy meter (temperature, humidity, occupancy, occupant type, building area etc.) and make it possible to identify abnormal energy consumption based on the analysis of this context.
The second direction includes many different approaches. So, in [
13] it is proposed to deal with complex cyber attacks with the help of constant reconfiguration of virtual networks. Due to this, the enemy loses knowledge about the configuration of the protected system and plans for the attack. This idea, which hides the behavior of the protected system, is partially implemented in our approach. In [
21], it was proposed to combat cyber attacks by studying the year-long trace from an edge network and exploring the direct and indirect control external entities have on local IT resources. In [
14], to counter DDoS attacks, it is proposed to use the capabilities inherent in the concepts of Smart City and Sofware-Defined Networking. This approach is also aimed at hiding knowledge of the protected system and at quickly detecting a cyber attack. In [
22], an approach based on the use of logical attack graphs, which take into account the dependencies between the objectives of the attack and the configuration of the protected system, is proposed to counter cyber attacks.
Therefore, the analysis of related work showed that protection against cyber attacks is a rather complex and rapidly developing field of research. The method proposed in this article contributes to the further development of this direction, which is associated with obtaining the ability to detect with high accuracy a cyber attack at an early stage of its implementation, by analyzing traffic in the telecommunication network.
3. Method of Increasing the Sensitivity of Extreme Filtering
The problem statement is as follows. Let there be some statistics of the network traffic, which is characterized by the mathematical expectation Mx and dispersion D. Some illegitimate component is additively superimposed on this traffic, and this component is characterized by the mathematical expectation MxNoice and dispersion DNoice. This component is a sequence of pulses, the mathematical expectation of which is a fraction of the mathematical expectation of the legitimate traffic. Pulses have a short duration τ and a low repetition rate. It is required to detect an additively superimposed illegitimate component (noise).
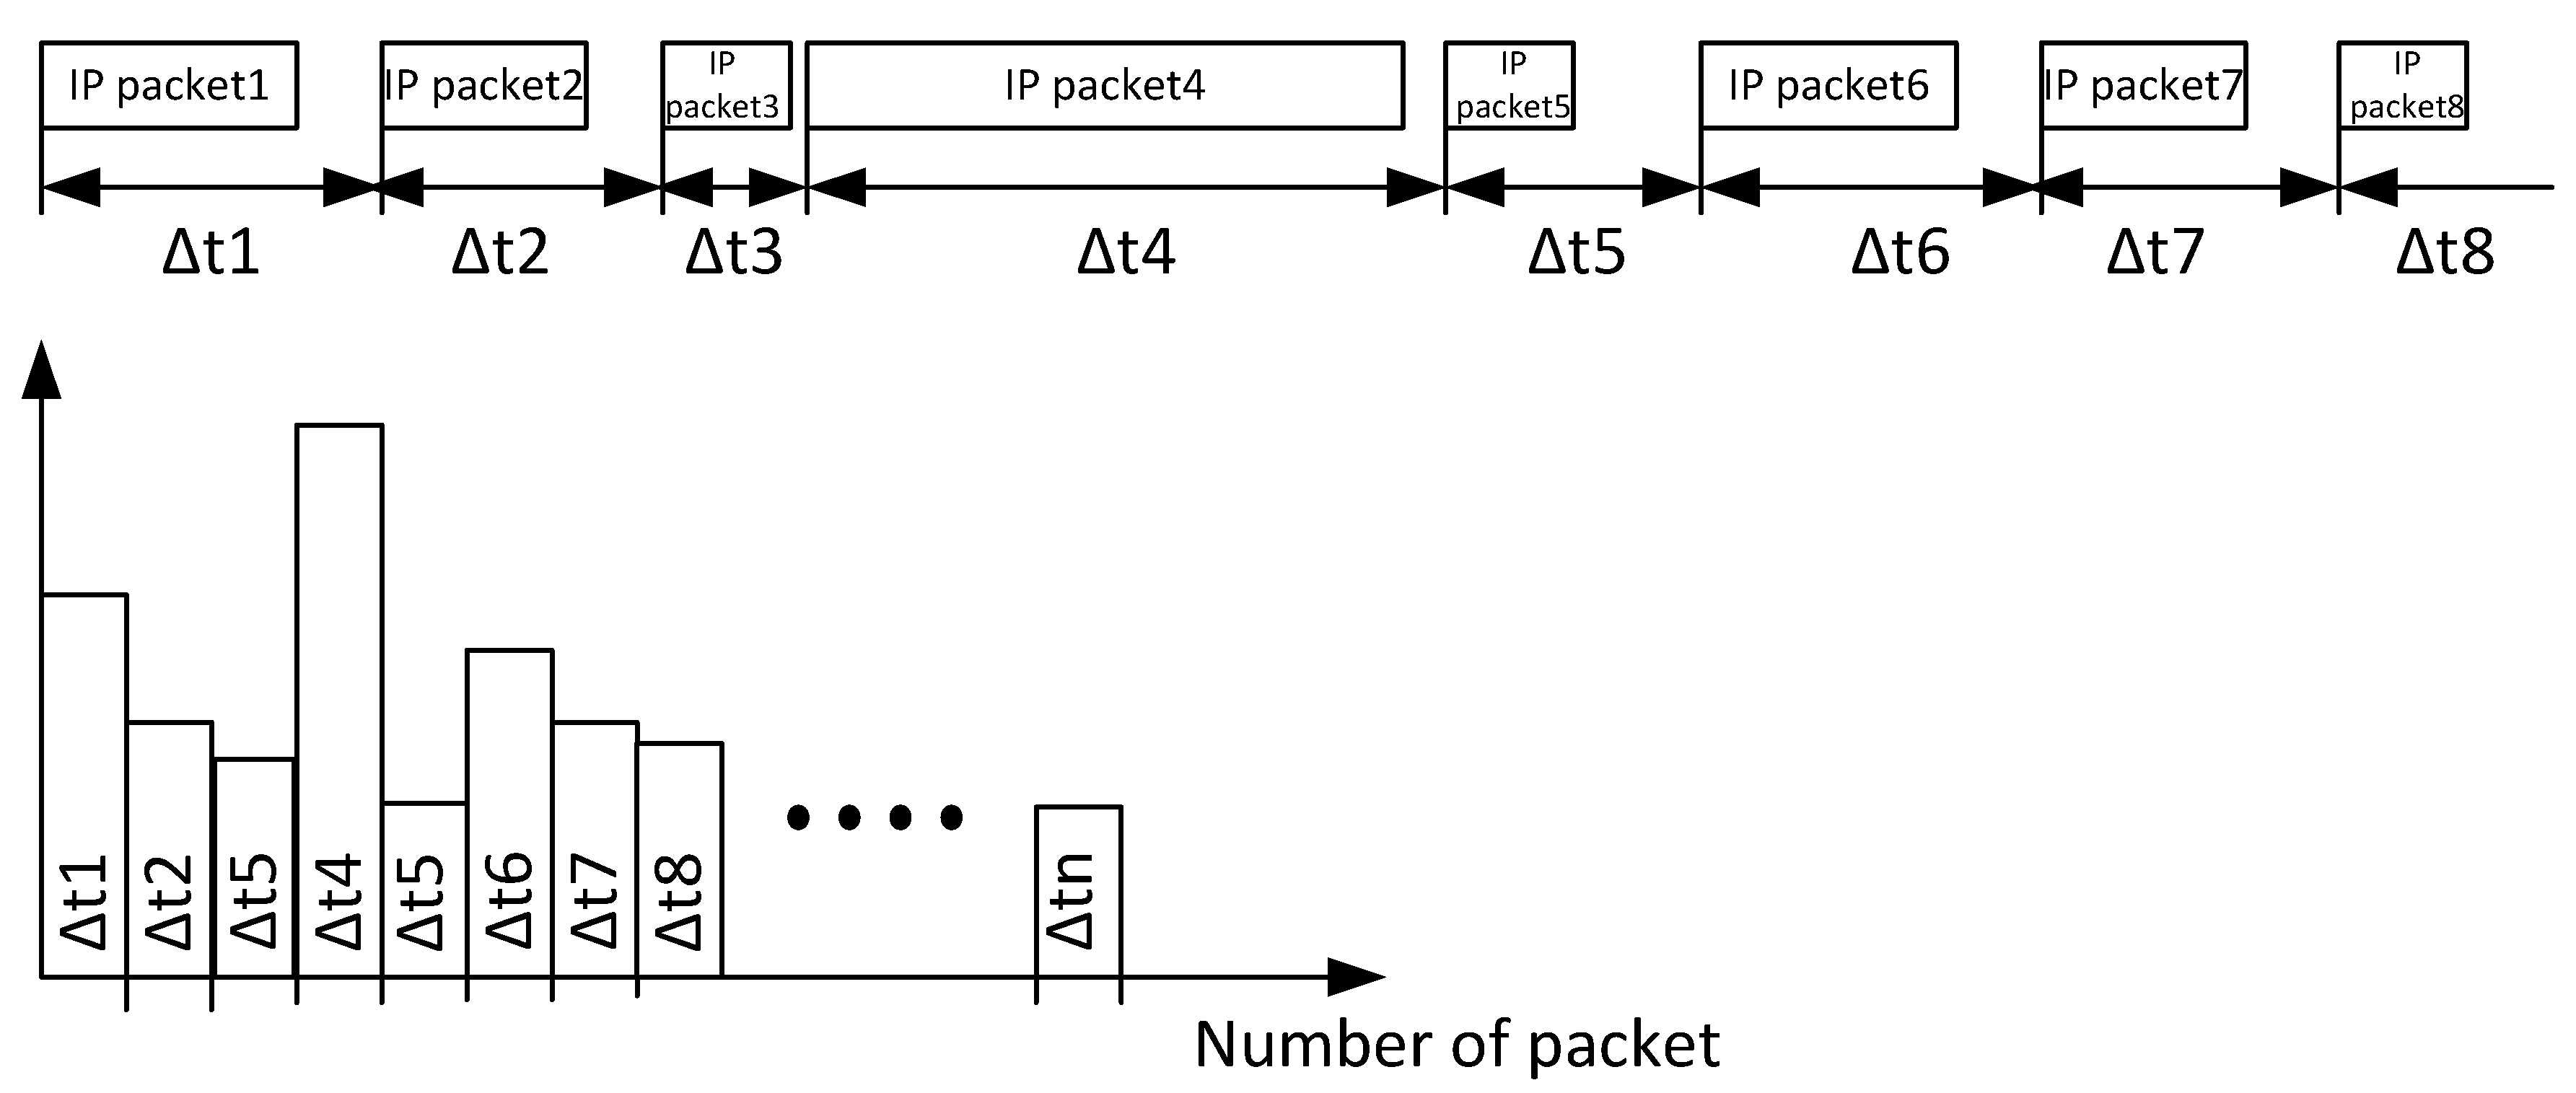
Let us now consider the solution to this problem. For a proper understanding of the source data, we will determine what constitutes the network traffic. As the network traffic, we take the distribution of time between packets depending on the packet numbers, both incoming and outgoing. Then the amplitude represents the time between packets, and the abscissa axis is represented by the numbers of packets (
Figure 1).
Thus, when additional requests appear on the network, the time between packets will decrease. Since the traffic is recorded in both directions, then the desired packets will arrive in batches (request-response). Therefore, the detected effect must be set in the form of pulses of negative polarity, short duration and low repetition rates. Taking this data as the source, we will carry out a parallel decomposition of the legitimate traffic (the original network traffic) and the total traffic (with the additive addition of the illegitimate component to the legitimate traffic [
23,
24,
25,
26,
27,
28]).
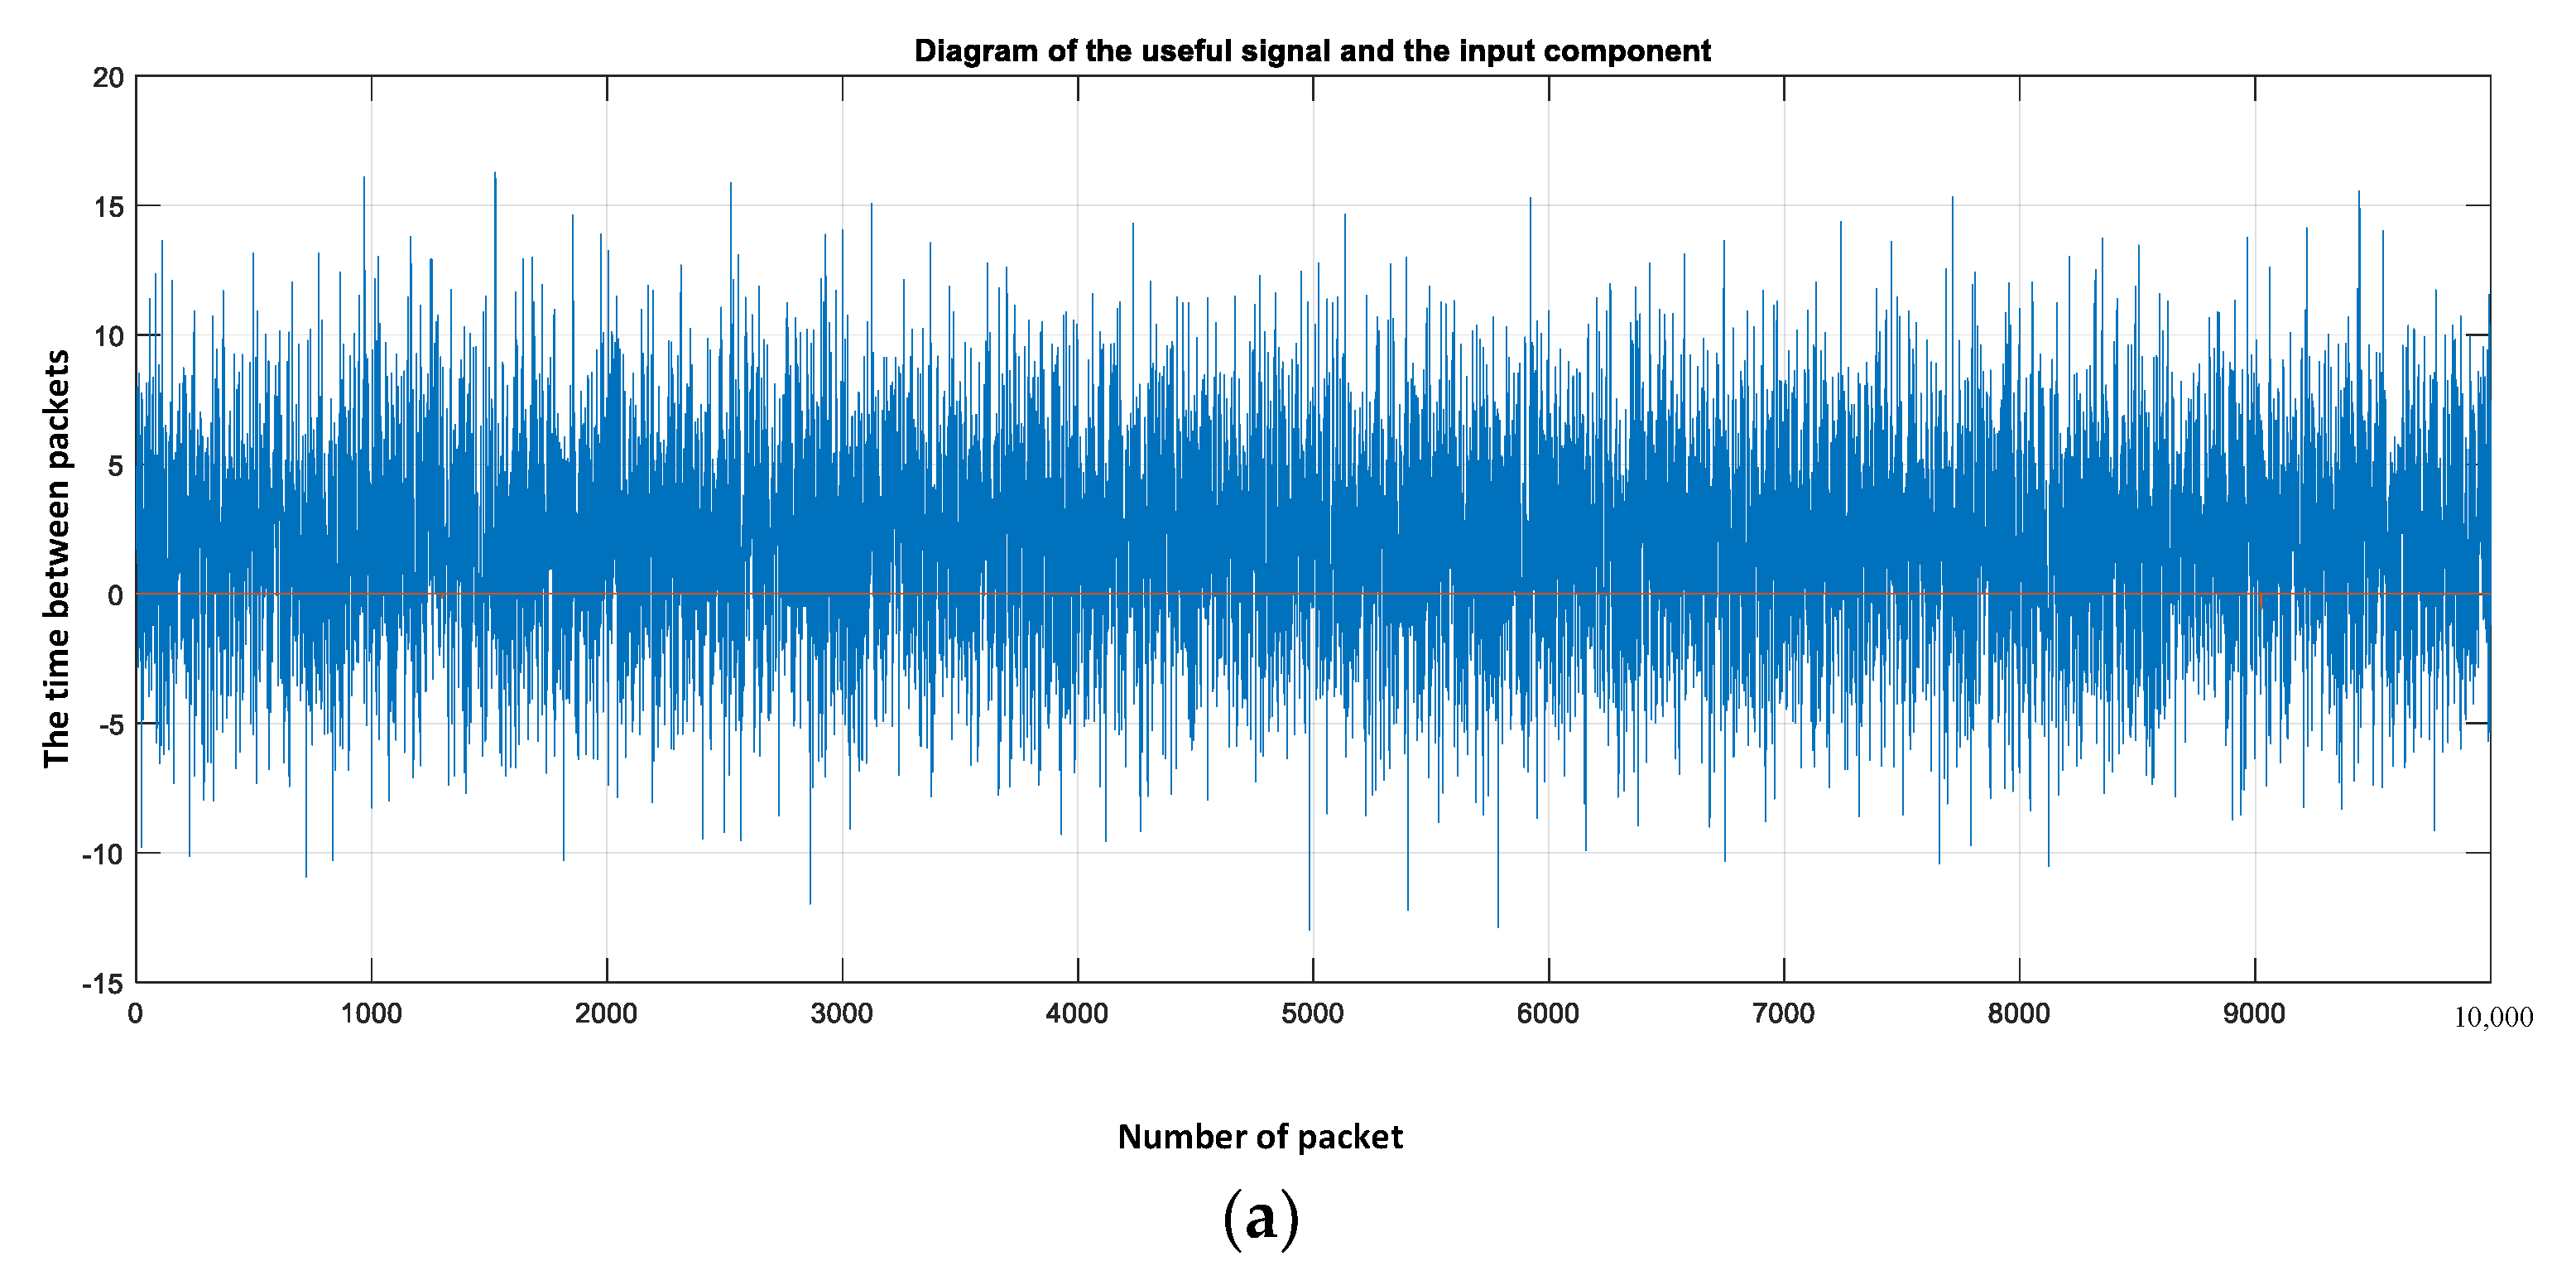
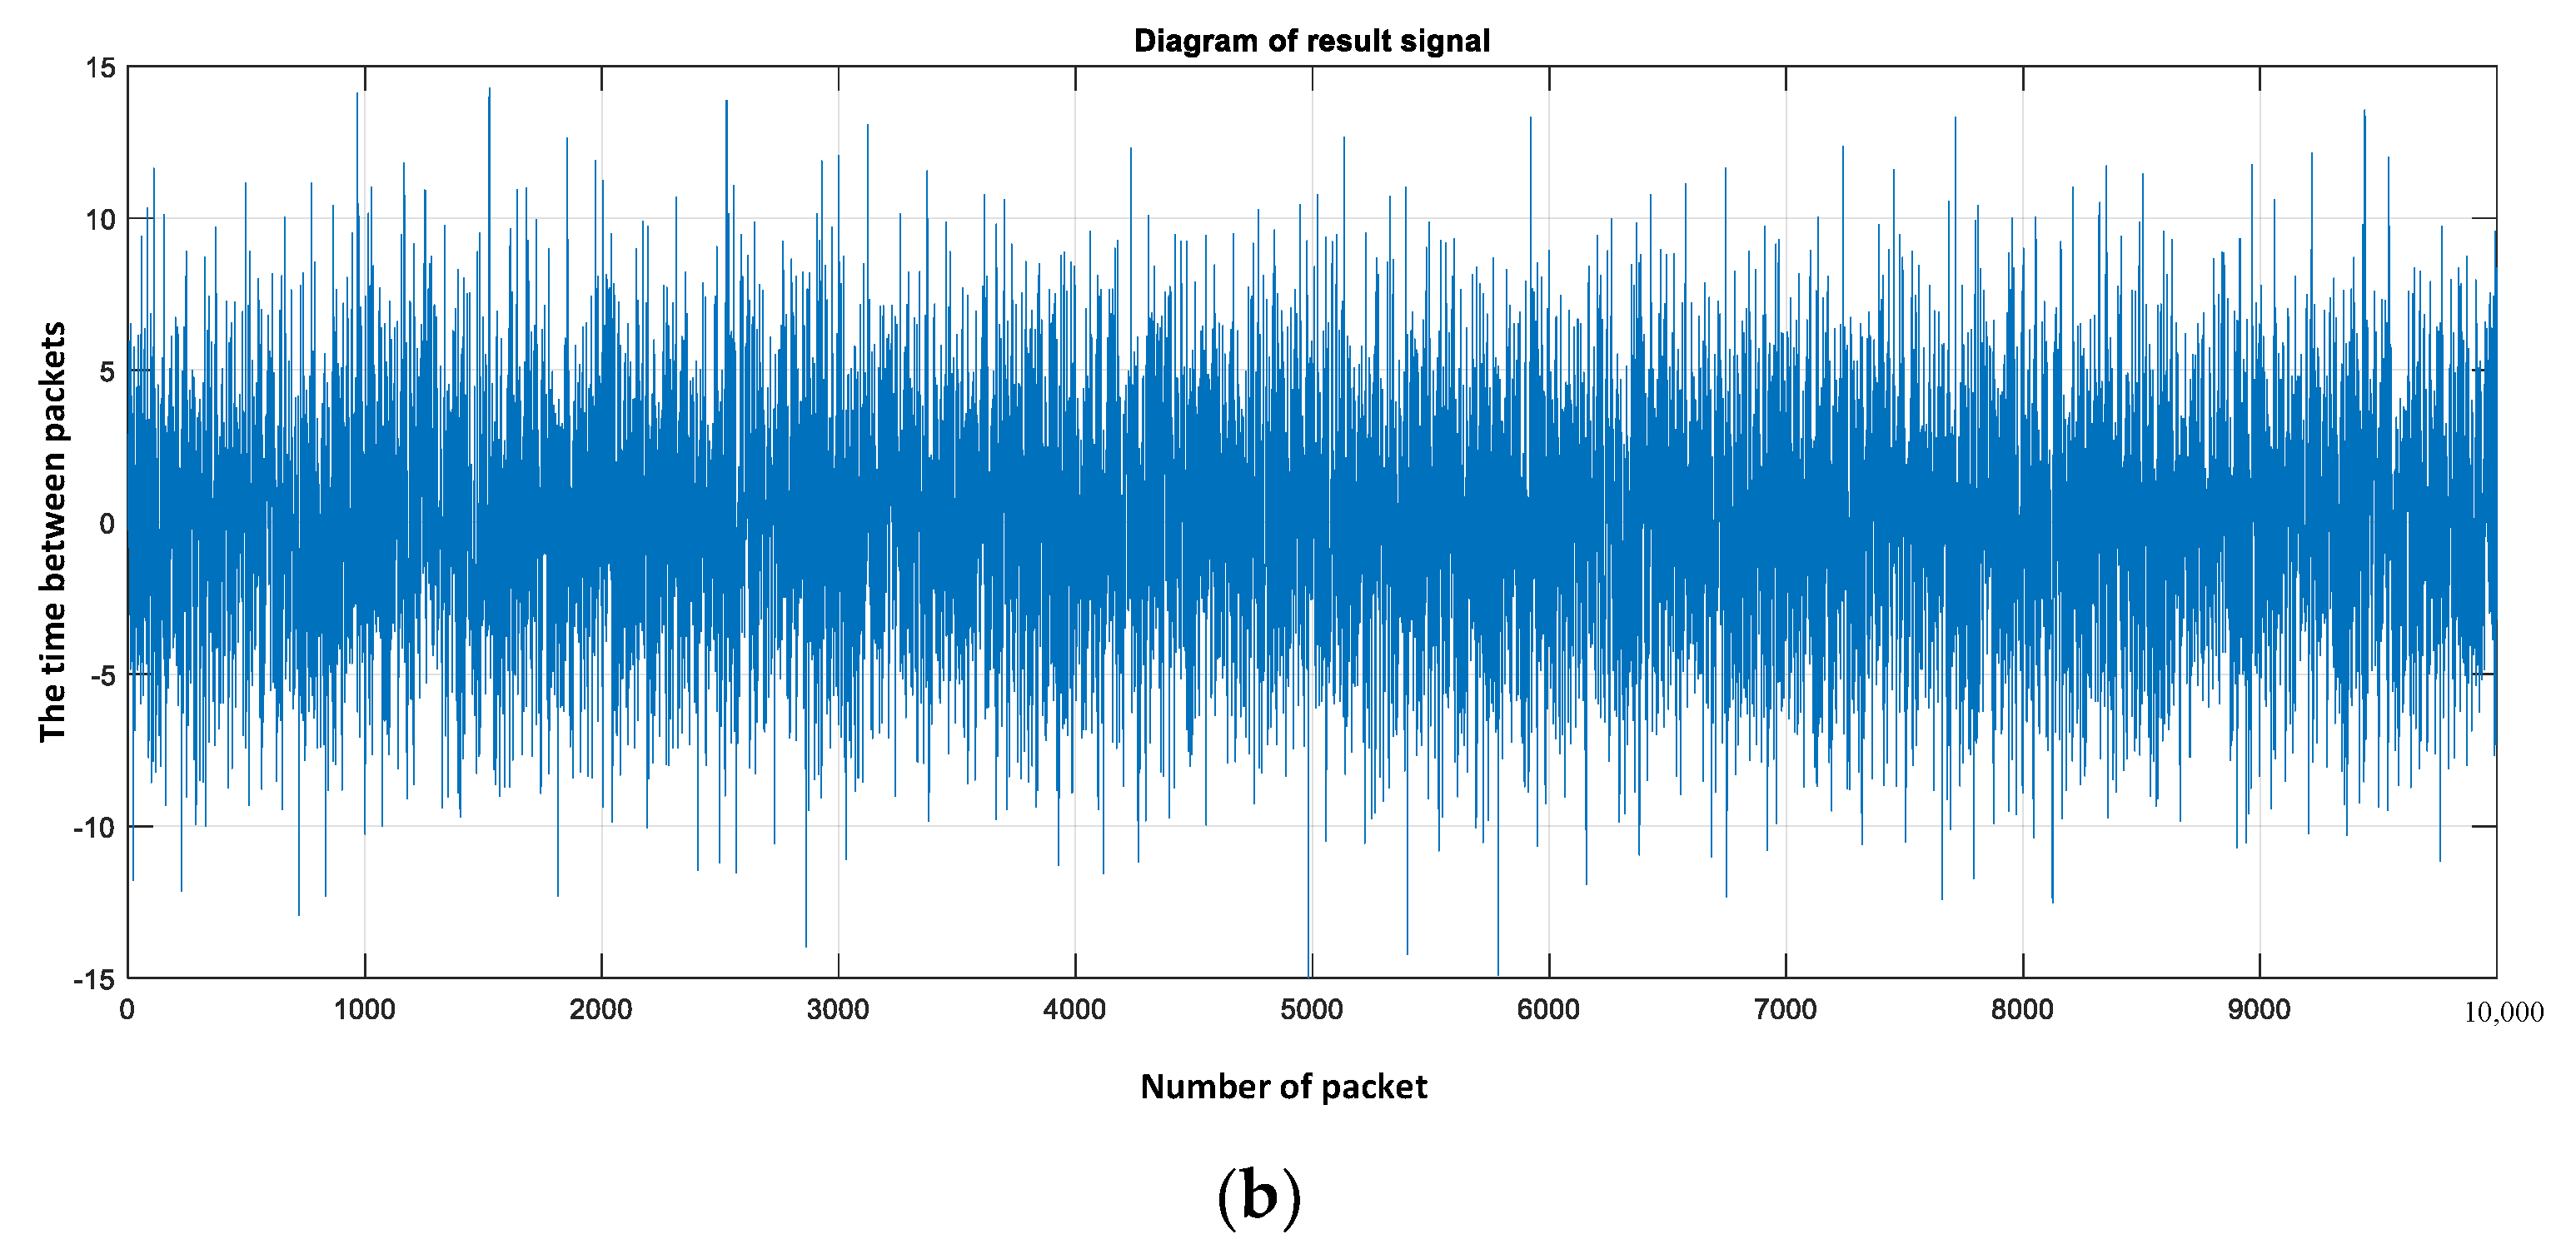
Figure 2a shows a graph of the simulated traffic, where the legitimate component is specified by a generator with a normal distribution, mathematical expectation 2 and dispersion 4, the color of the legitimate component is blue, the illegitimate component of the intended impact is shown in red, pulse duration 2, the mathematical expectation is equal to 5.02 × 10
−5, the number of pulses is equal to 2; the width of the analyzed window is equal to 10,000.
Figure 2b shows a graph of the obtained additive mixture, estimated relative to the mathematical expectation of the additive mixture.
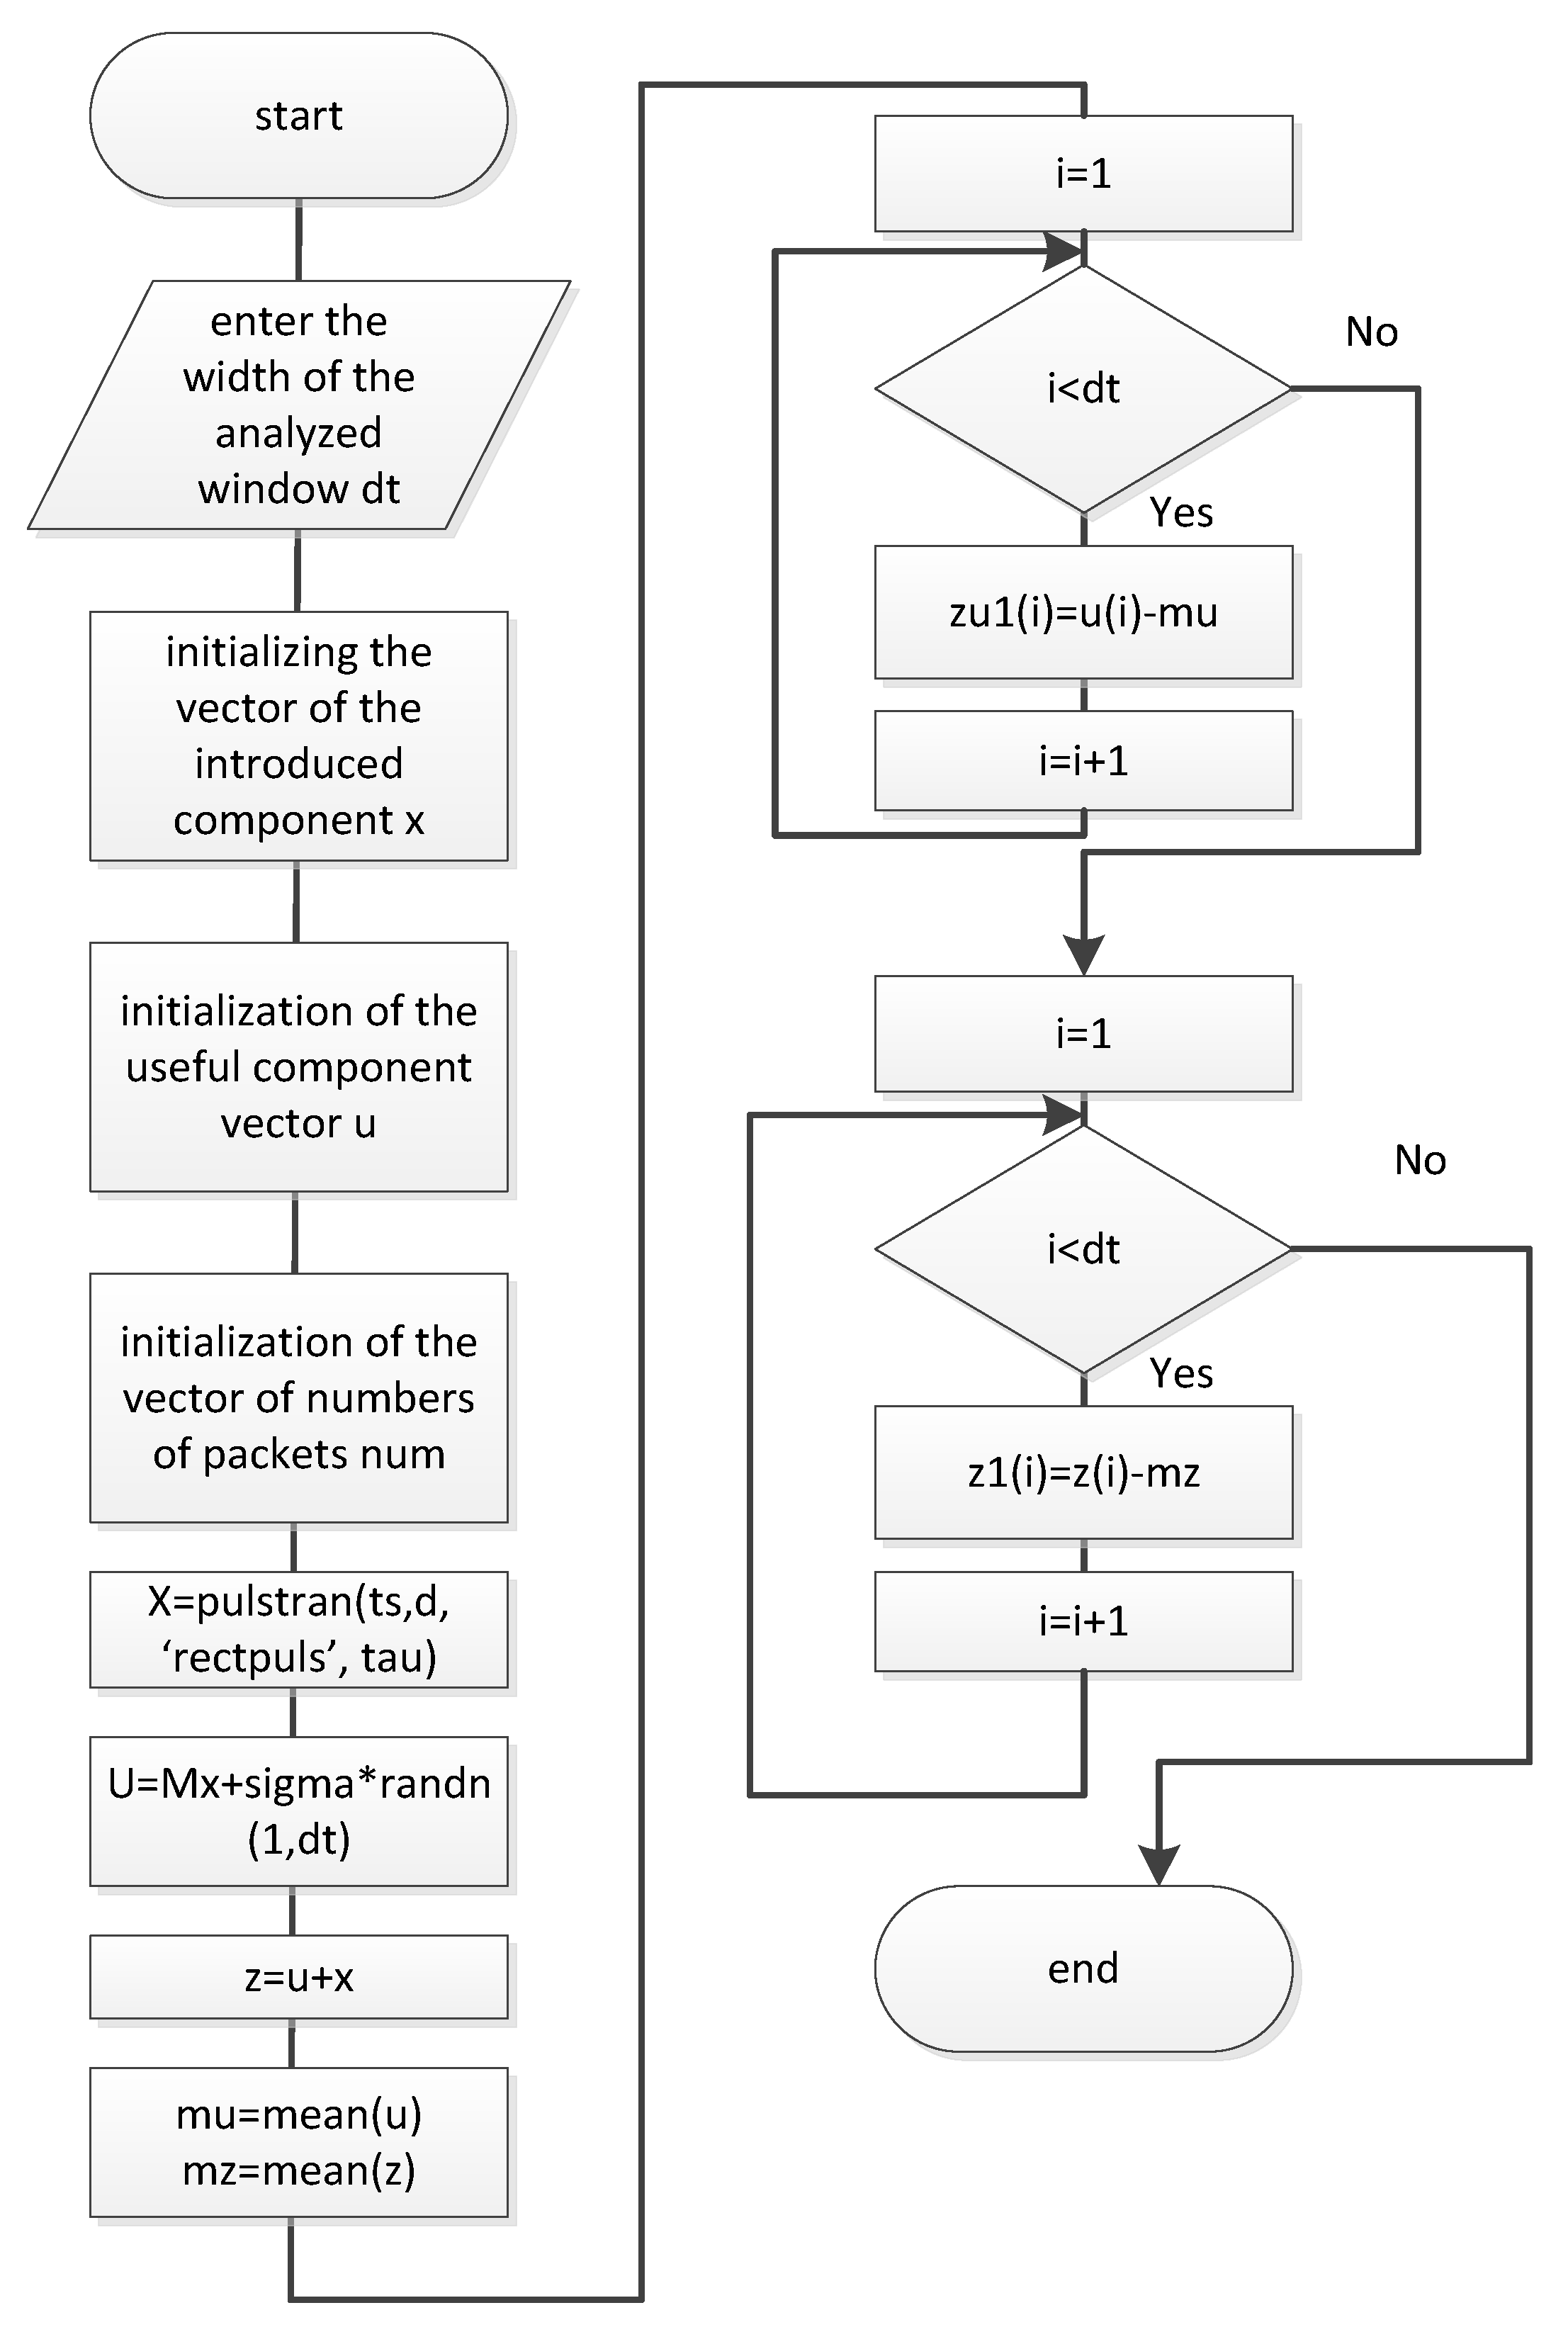
The algorithm for specifying the legitimate and illegitimate components is formalized in
Figure 3. It can be seen from the algorithm that further traffic analysis will occur relative to the mathematical expectation of each of the components.
Earlier in [
16], the authors evaluated the sample values relative to the expectation of the total traffic and graphically compared the components obtained during the decomposition with the introduced component. Such a technique gave low accuracy in detecting an illegitimate component at all stages of decomposition, since the extracted component was interpolated, mainly by the extremes of legitimate traffic at all iterations. Thus, it was not possible to achieve a graphic similarity between the components extracted from the additive mixture and the original introduced.
To increase the efficiency of the extreme filtering method, the authors performed a parallel decomposition of the total and legitimate traffic [
29,
30,
31]. Each of them was evaluated in relation to its own mathematical expectation.
Figure 4 shows the algorithm for extracting extrema from traffic. The difference from the earlier presented model is in the analysis of not only the additive mixture, but also the legitimate traffic, moreover, the comparison is not at the level of graphic similarity of the selected components, but the analysis is performed according to the statistical characteristics of the selected components (legitimate and total).
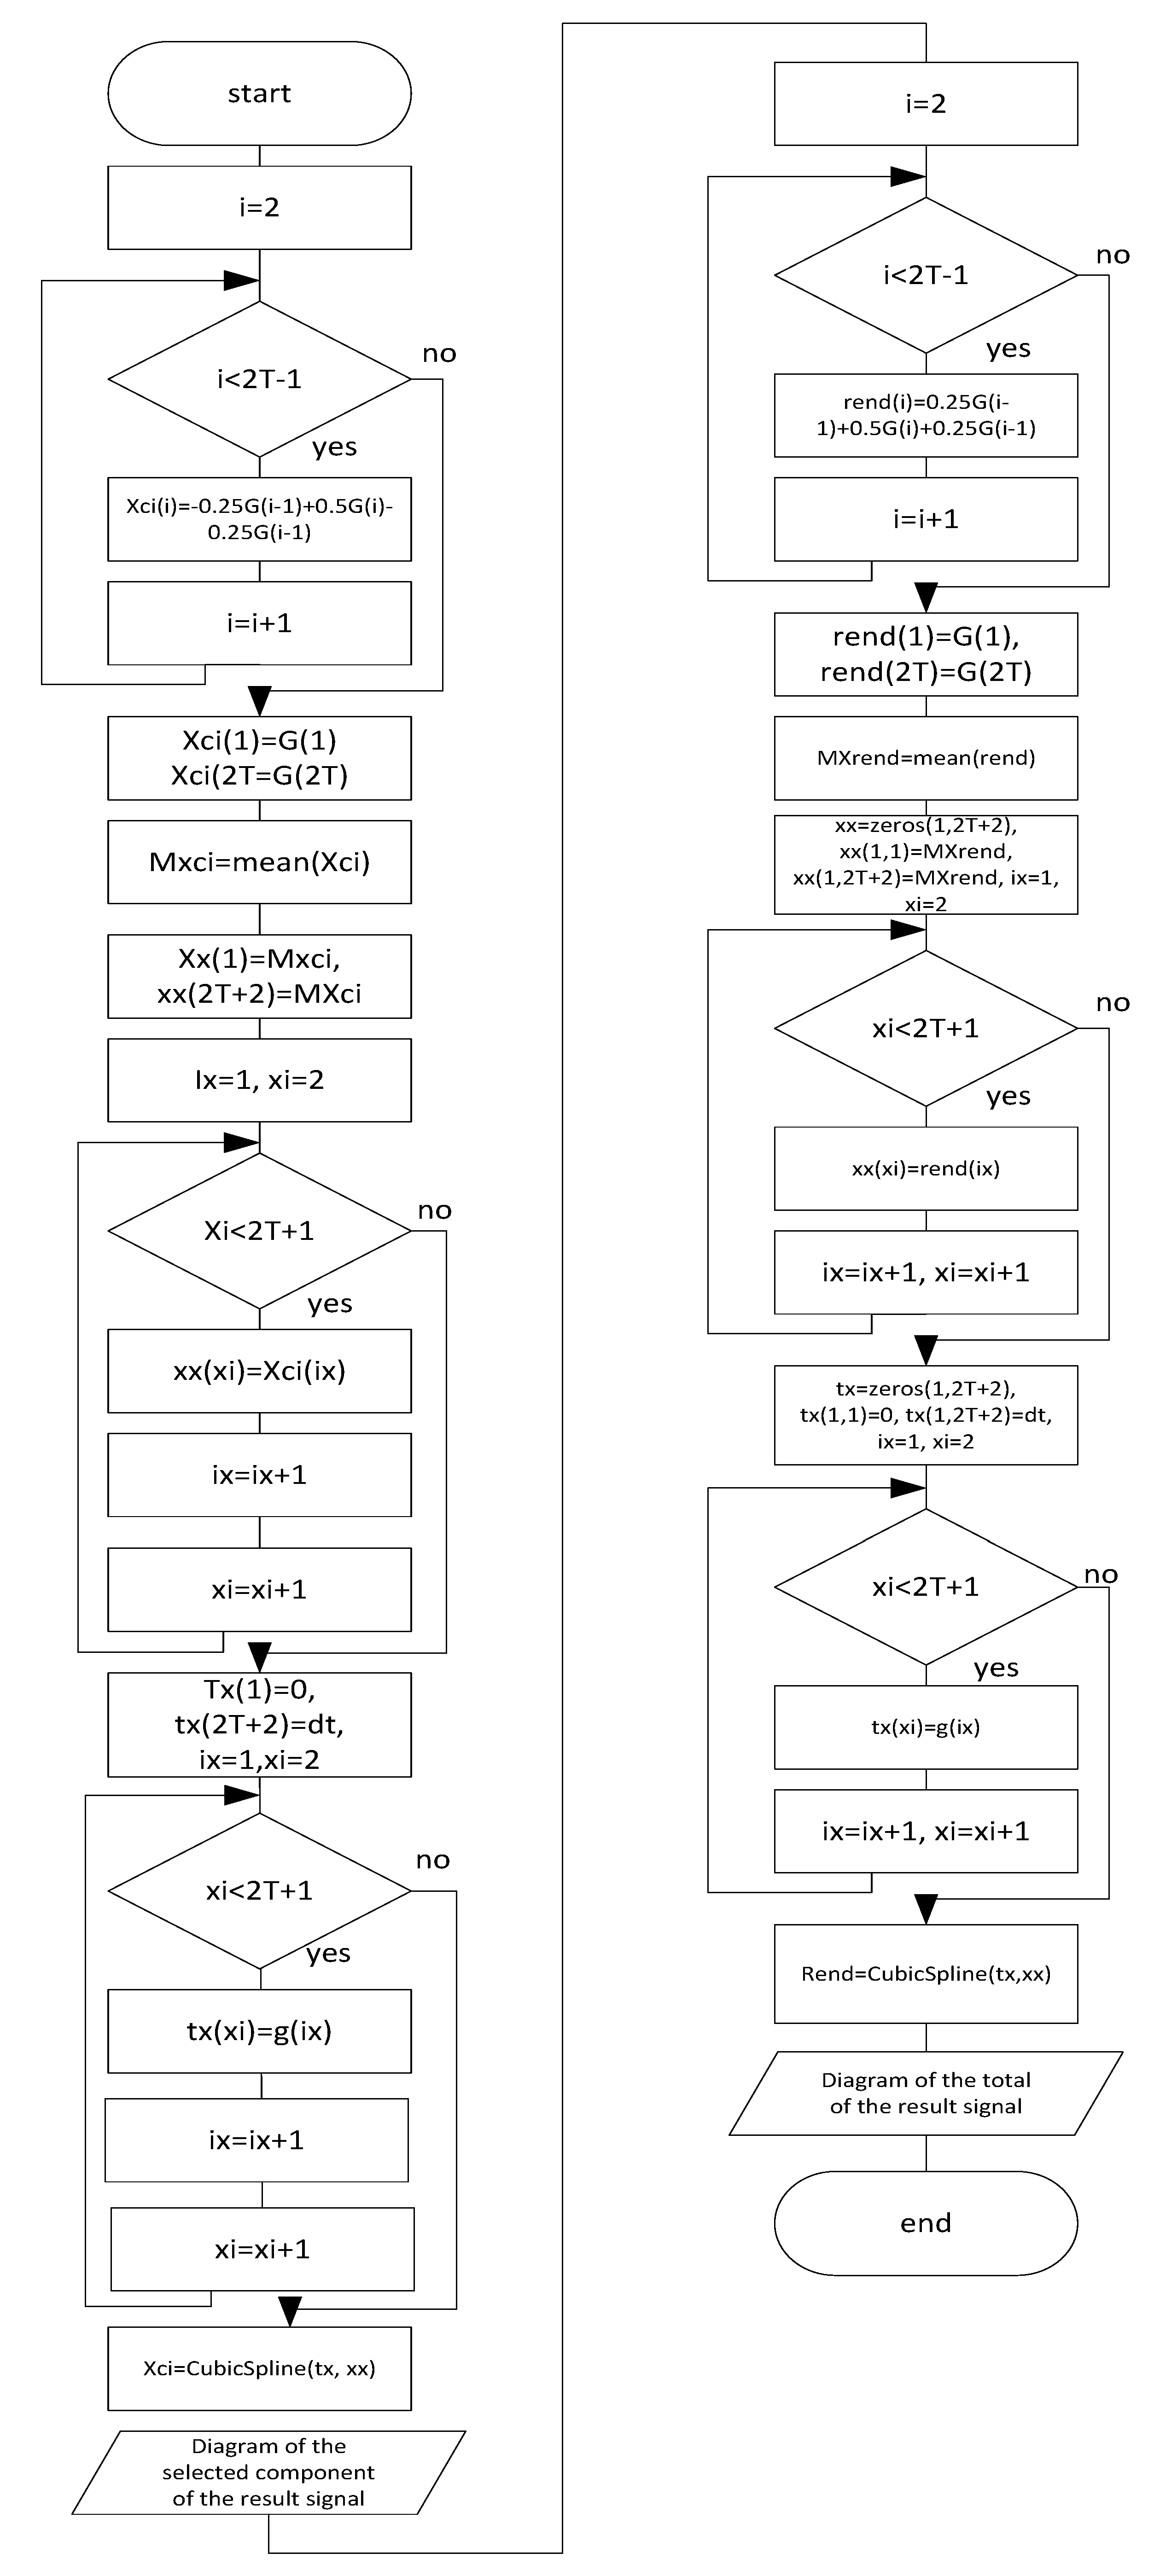
To interpolate the selected component, the obtained sample must be filtered with the help of a smoothing operator and then interpolated using the obtained values (the authors used cubic spline interpolation to minimize the error in the selection of components).
The algorithm for smoothing, extracting the component, as well as the remainder for further decomposition is presented in
Figure 5.
In order to analyze the resulting model, a series of 35 experiments was carried out (in this case, the analysis was carried out according to five parameters in each of 3 iterations, thus, the analyzed sample was actually expanded to 525 experiments), in which the following characteristics of the selected components were evaluated:
standard deviation,
expected value,
covariance,
amplitude of the autocorrelation function,
correlation interval for parallel decomposition of the total and legitimate traffic.
In this case, the width of the analyzed window is equal to 10,000, the mathematical expectation of legitimate traffic is equal to 2, and the variance is equal to 1. For the first series of experiments, 8 pulses were introduced with different repetition rates and average amplitude of 0.2012. Thus, the ratio of legitimate traffic to an illegitimate component is equal to 9.94.
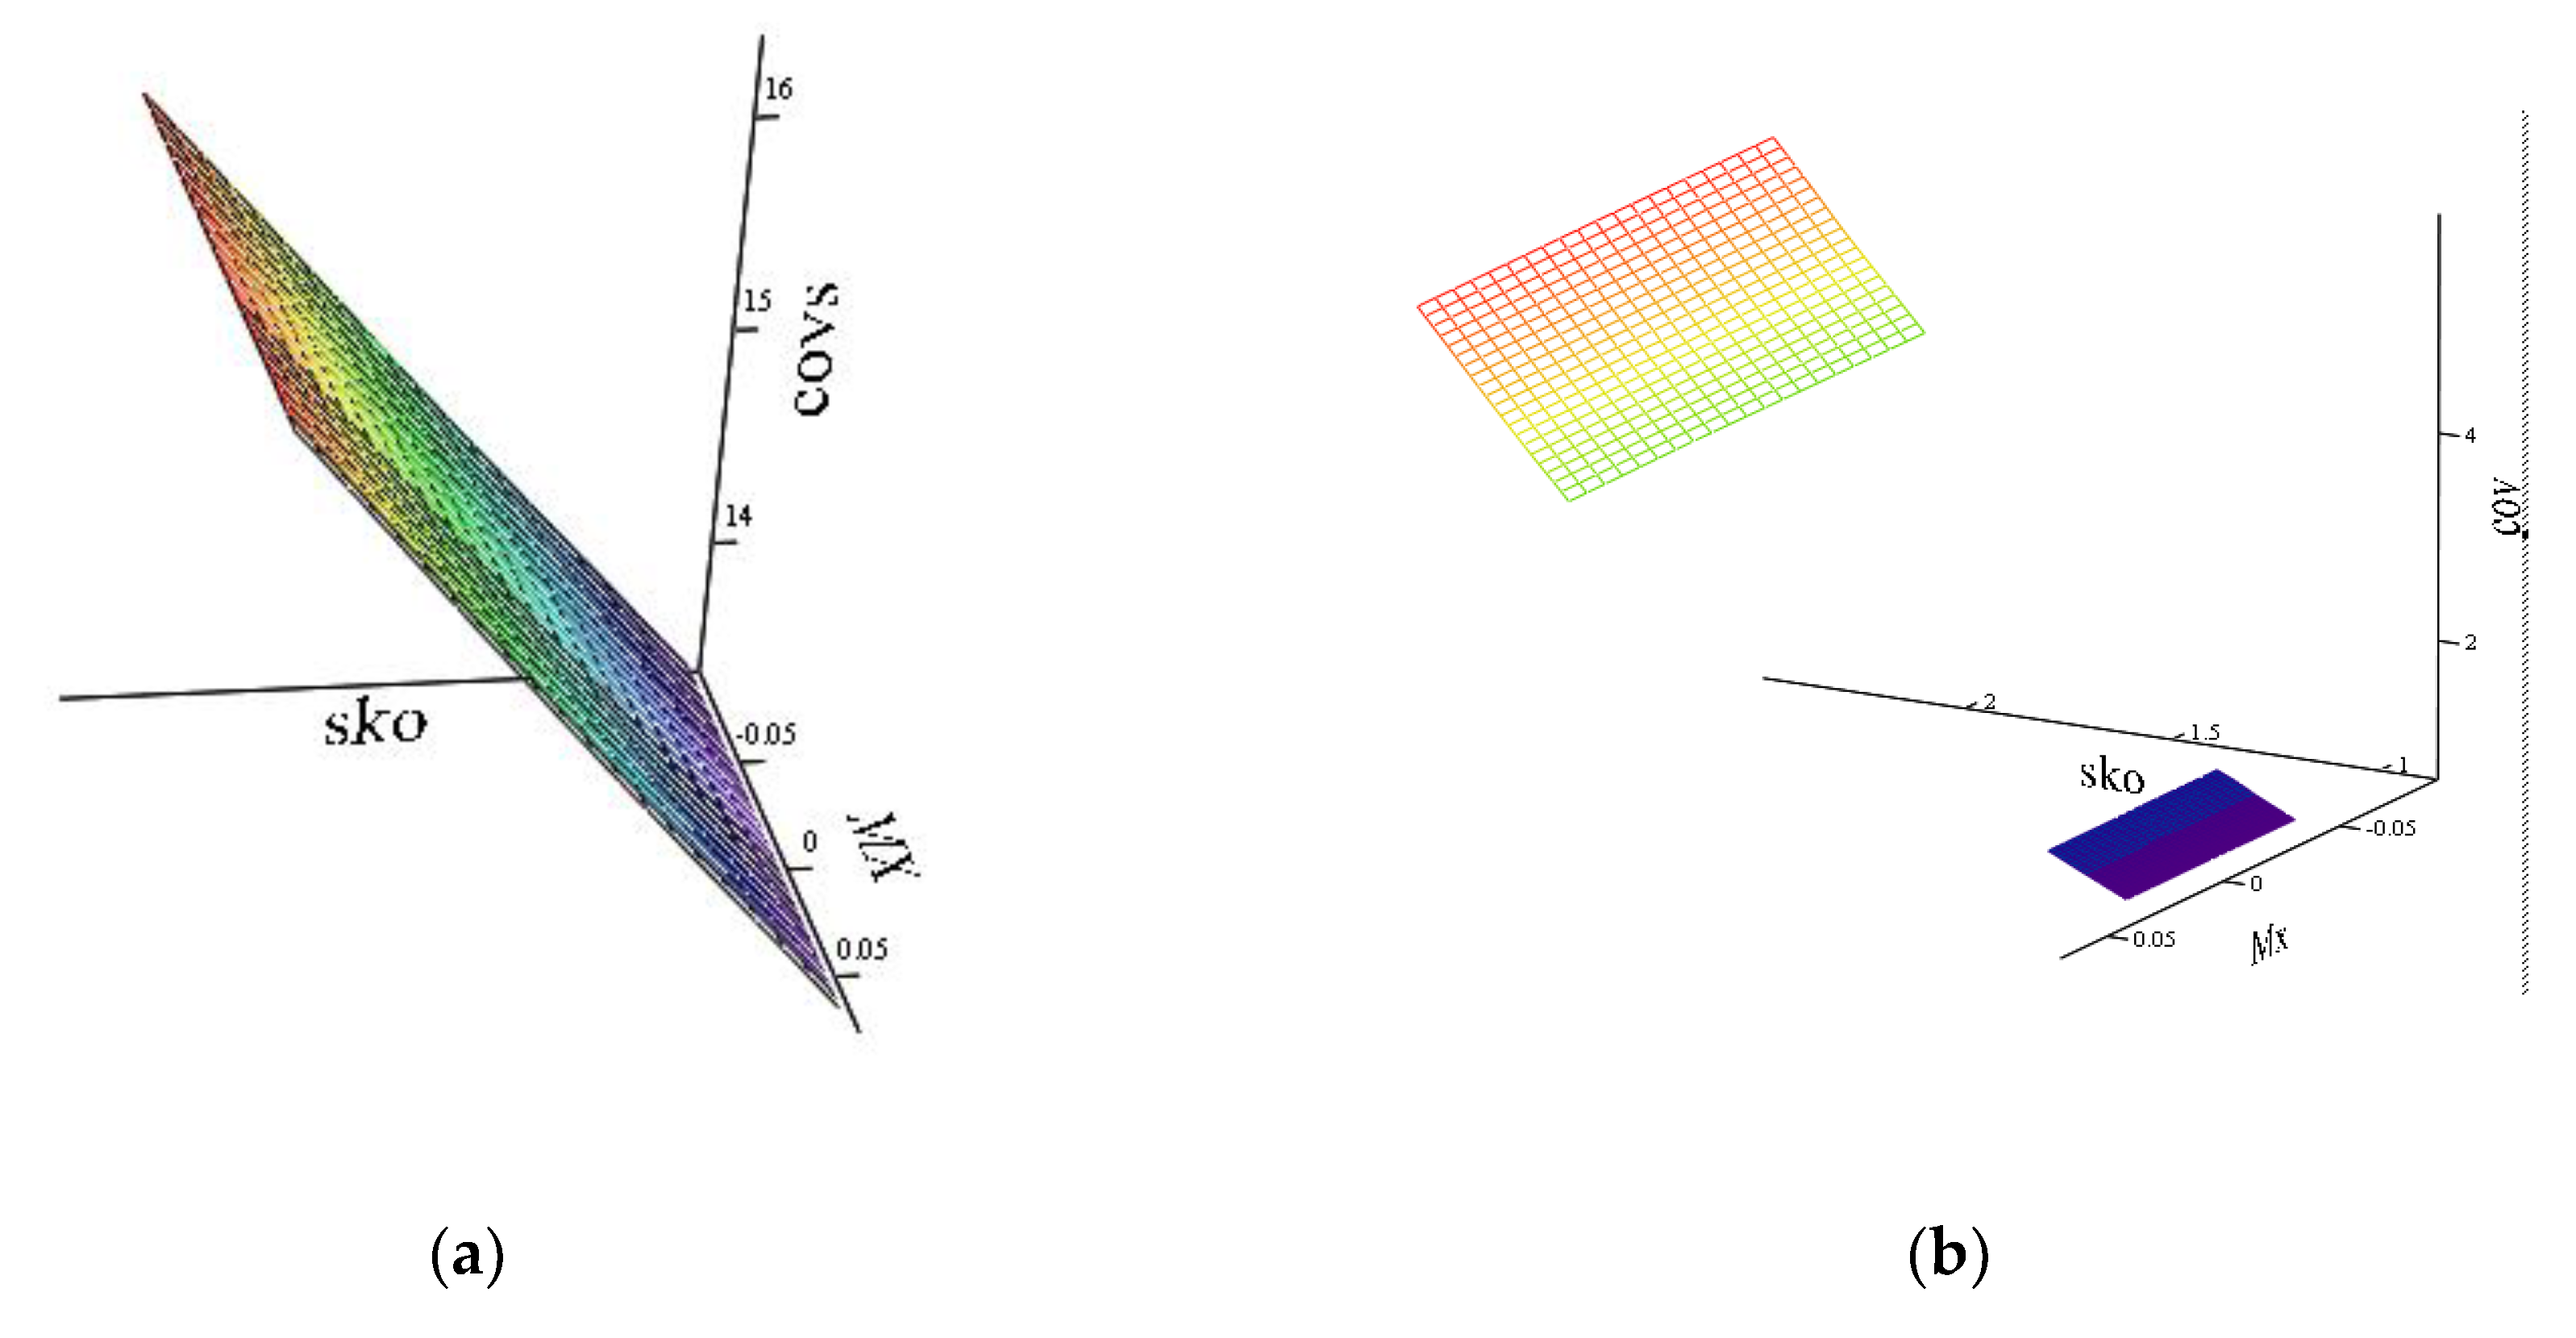
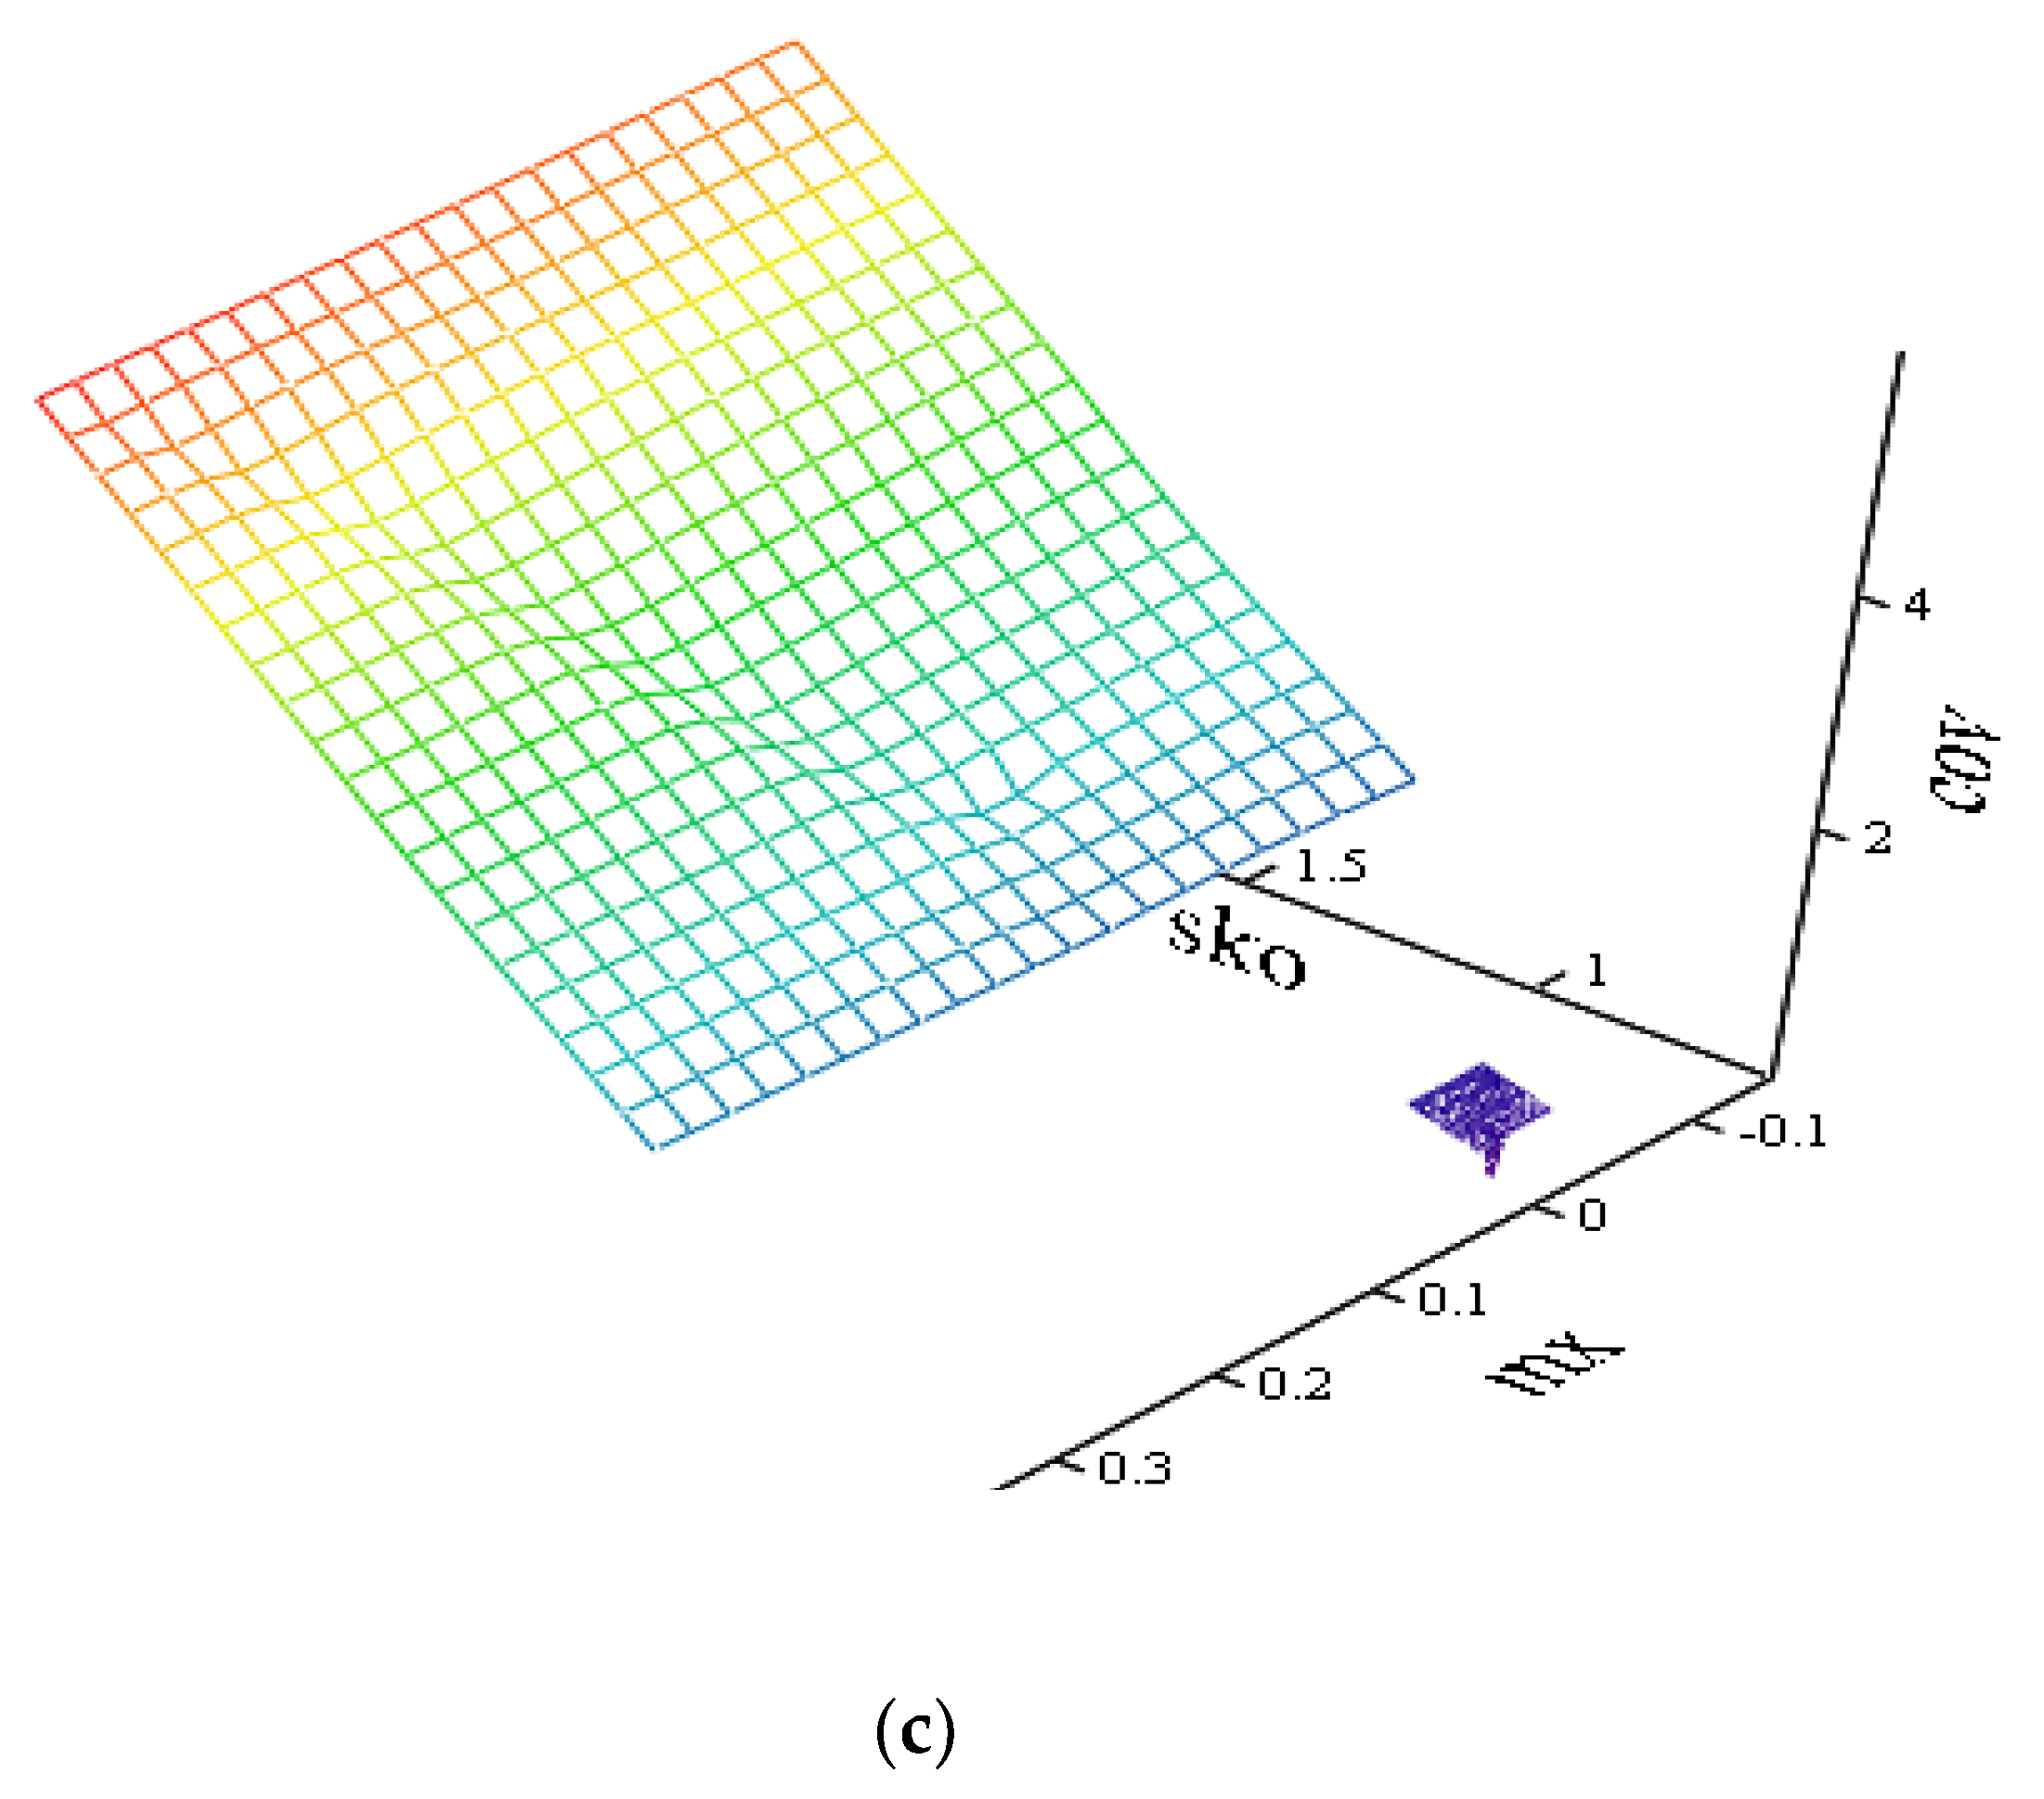
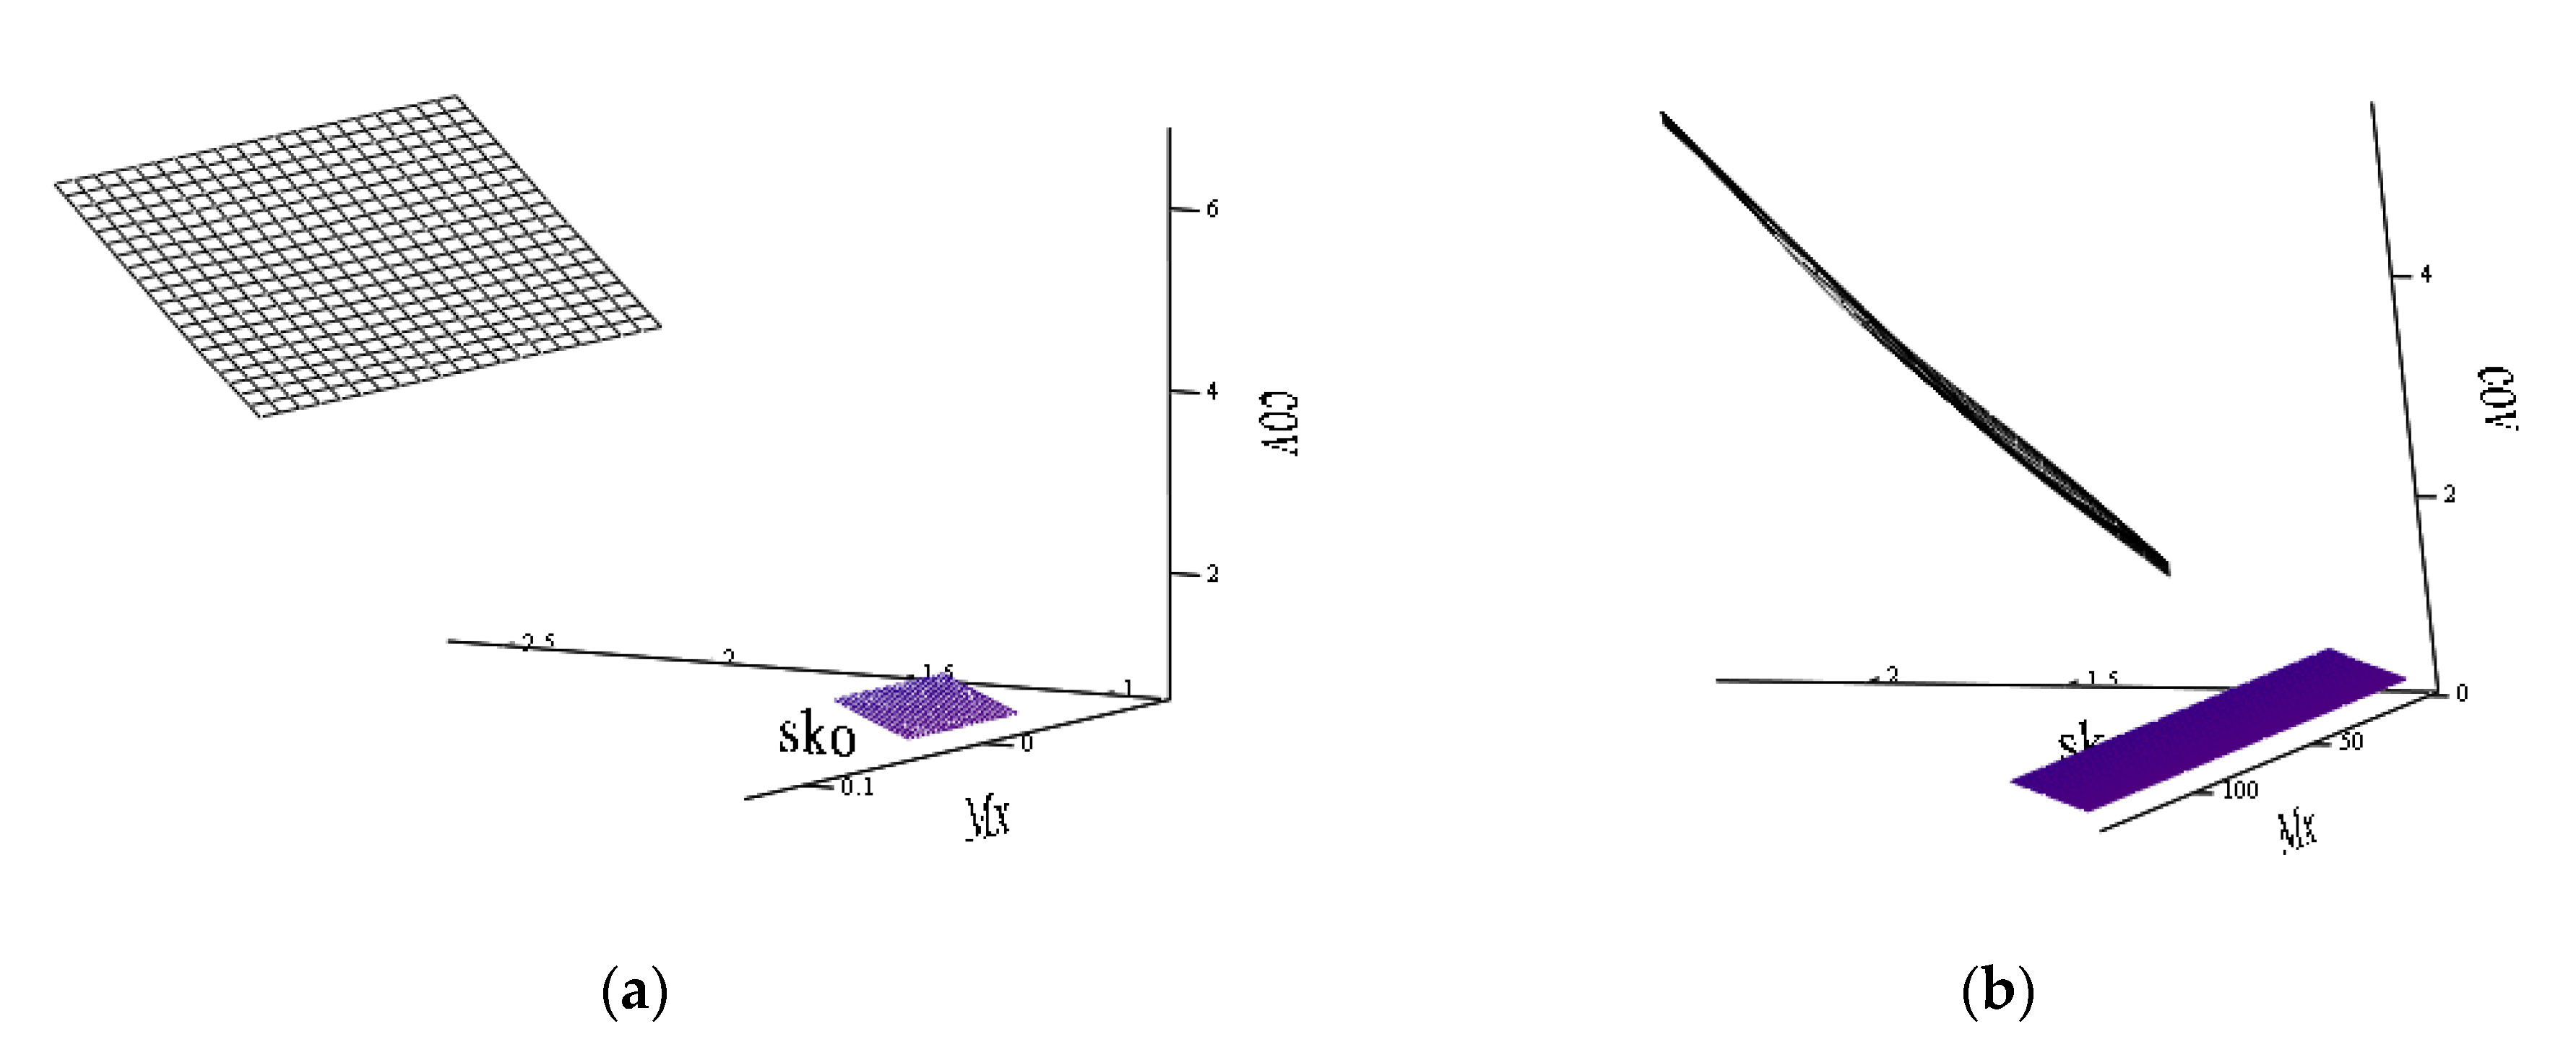
As can be seen from
Figure 6a, at the second iteration, the plane of the values of the distinguished components of the legitimate and total traffic almost coincides. The difference between the selected components becomes more apparent at the third iteration (
Figure 6b). The planes are spaced in the space of values, and the plane of legitimate traffic is most different from the mean square deviation and covariance from the values of the selected component of the total traffic. At the fourth iteration (
Figure 6c), the nature of the mutual arrangement of the planes is preserved, however, there is a greater variation in the values of the component of legitimate traffic, while the plane of the values of the total traffic has a smaller area.
Therefore, it can be assumed that the statistical characteristics of the total traffic with decreasing frequency results in the distinguished component tending to the statistical characteristics of the illegitimate component.
In order to establish a statistical relationship between the obtained extremes of the selected components, the autocorrelation functions of the legitimate and total traffic were analyzed.
Figure 7 shows a sample of the amplitude of the autocorrelation function in this series of experiments at the third iteration. Obviously, the ranges of values do not overlap, and the values of the autocorrelation function of legitimate traffic have a greater deviation from the average than the values of the autocorrelation function of the total traffic, which indicates a greater determinism of the selected component of the total traffic.
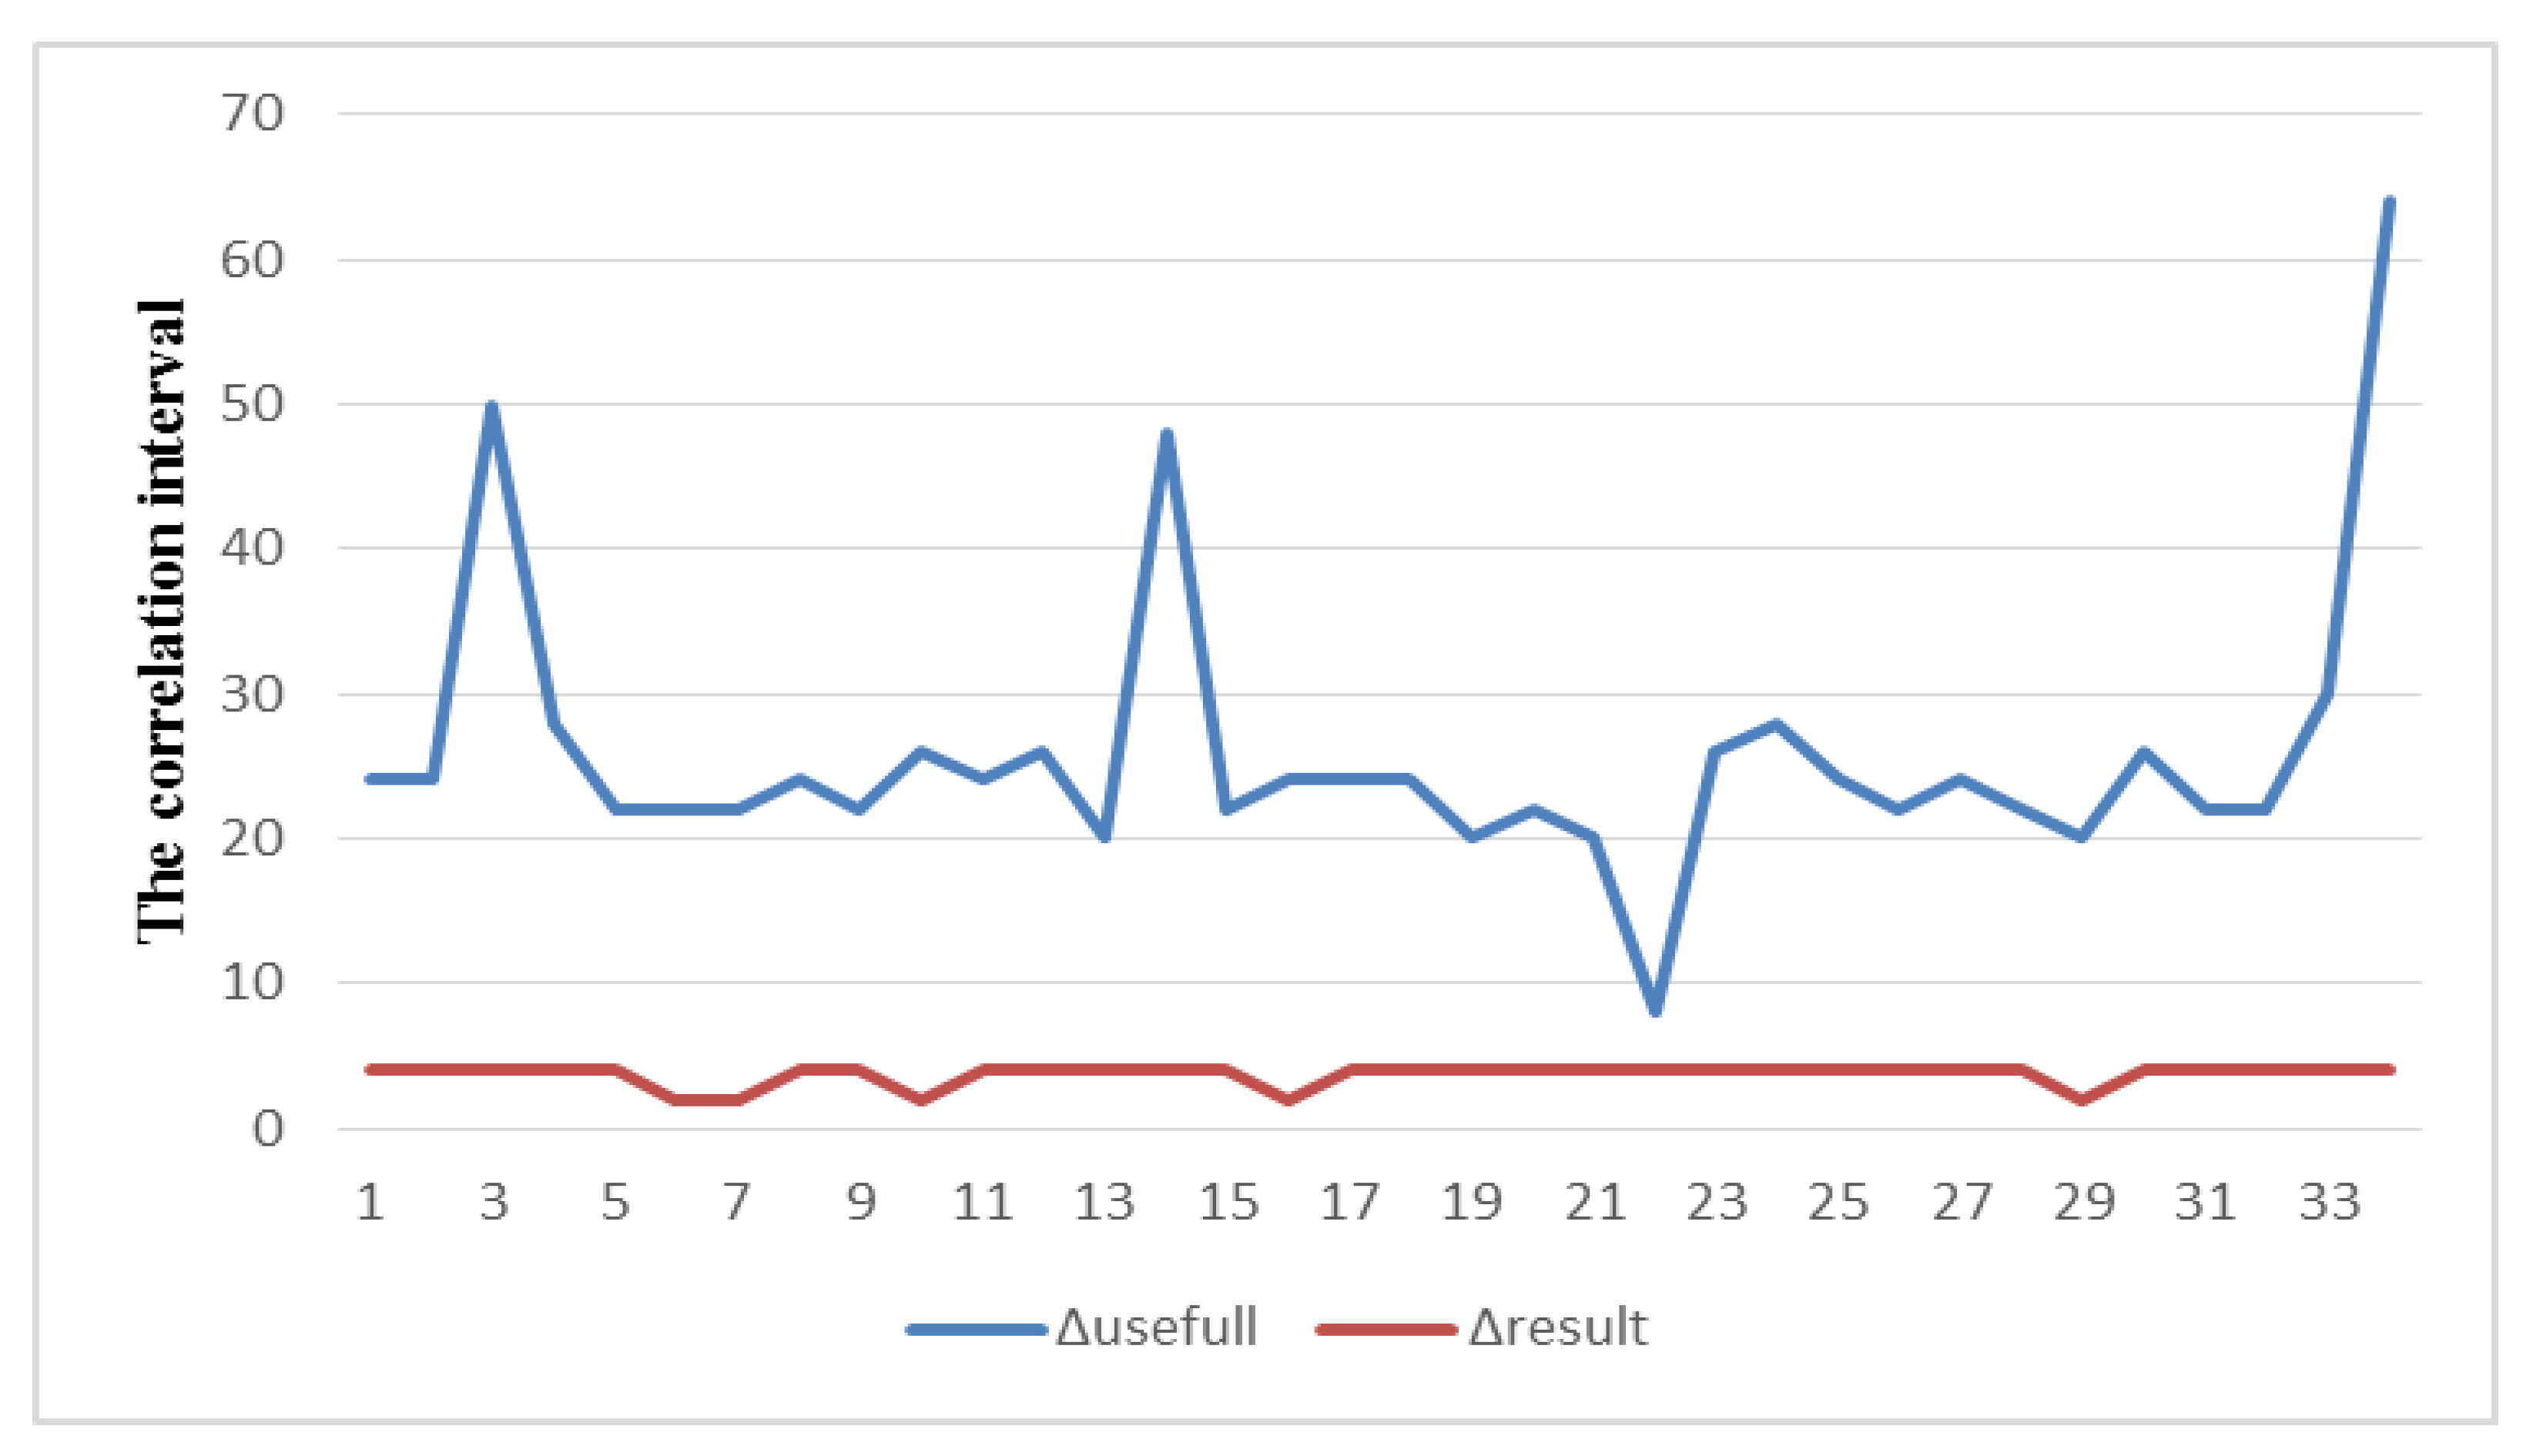
The correlation interval was analyzed, in order to establish a relationship between the rate of change of the components, (
Figure 8).
When adding an additional component to legitimate traffic, the rate of change of the process should increase. This will be more obvious with decomposition. The ranges of the correlation interval also do not overlap, and the sample of legitimate traffic values (blue) has a more pulsating character, while the values of the total traffic are smoother. The correlation interval of the total traffic at the third and fourth iterations is always much less than the correlation interval of the legitimate traffic. That is, the rate of change of the extracted component from the total traffic is higher than the rate of change of the extracted component from the legitimate traffic.
It is important for signaling the presence of an attacker to be sufficient, but not redundant. In order to make a decision about the presence of unauthorized actions on the network, the changes in the statistical parameters of the total and legitimate traffic at several iterations should be considered, and take the second iteration and two subsequent iterations, which have the most distinguishable characteristics.
From
Figure 9 we can conclude that the values of the standard deviation of the selected components should be taken into account when deciding on the absence/presence of an illegitimate component. The areas of the obtained values are significantly spaced in space, and the distribution over the sample of values of the total traffic components is more predictable and linear (only small bursts are observed), than over the sample of legitimate traffic. It allows predicting various scenarios of the attacker’s behavior when analyzing several windows with traffic anomalies.
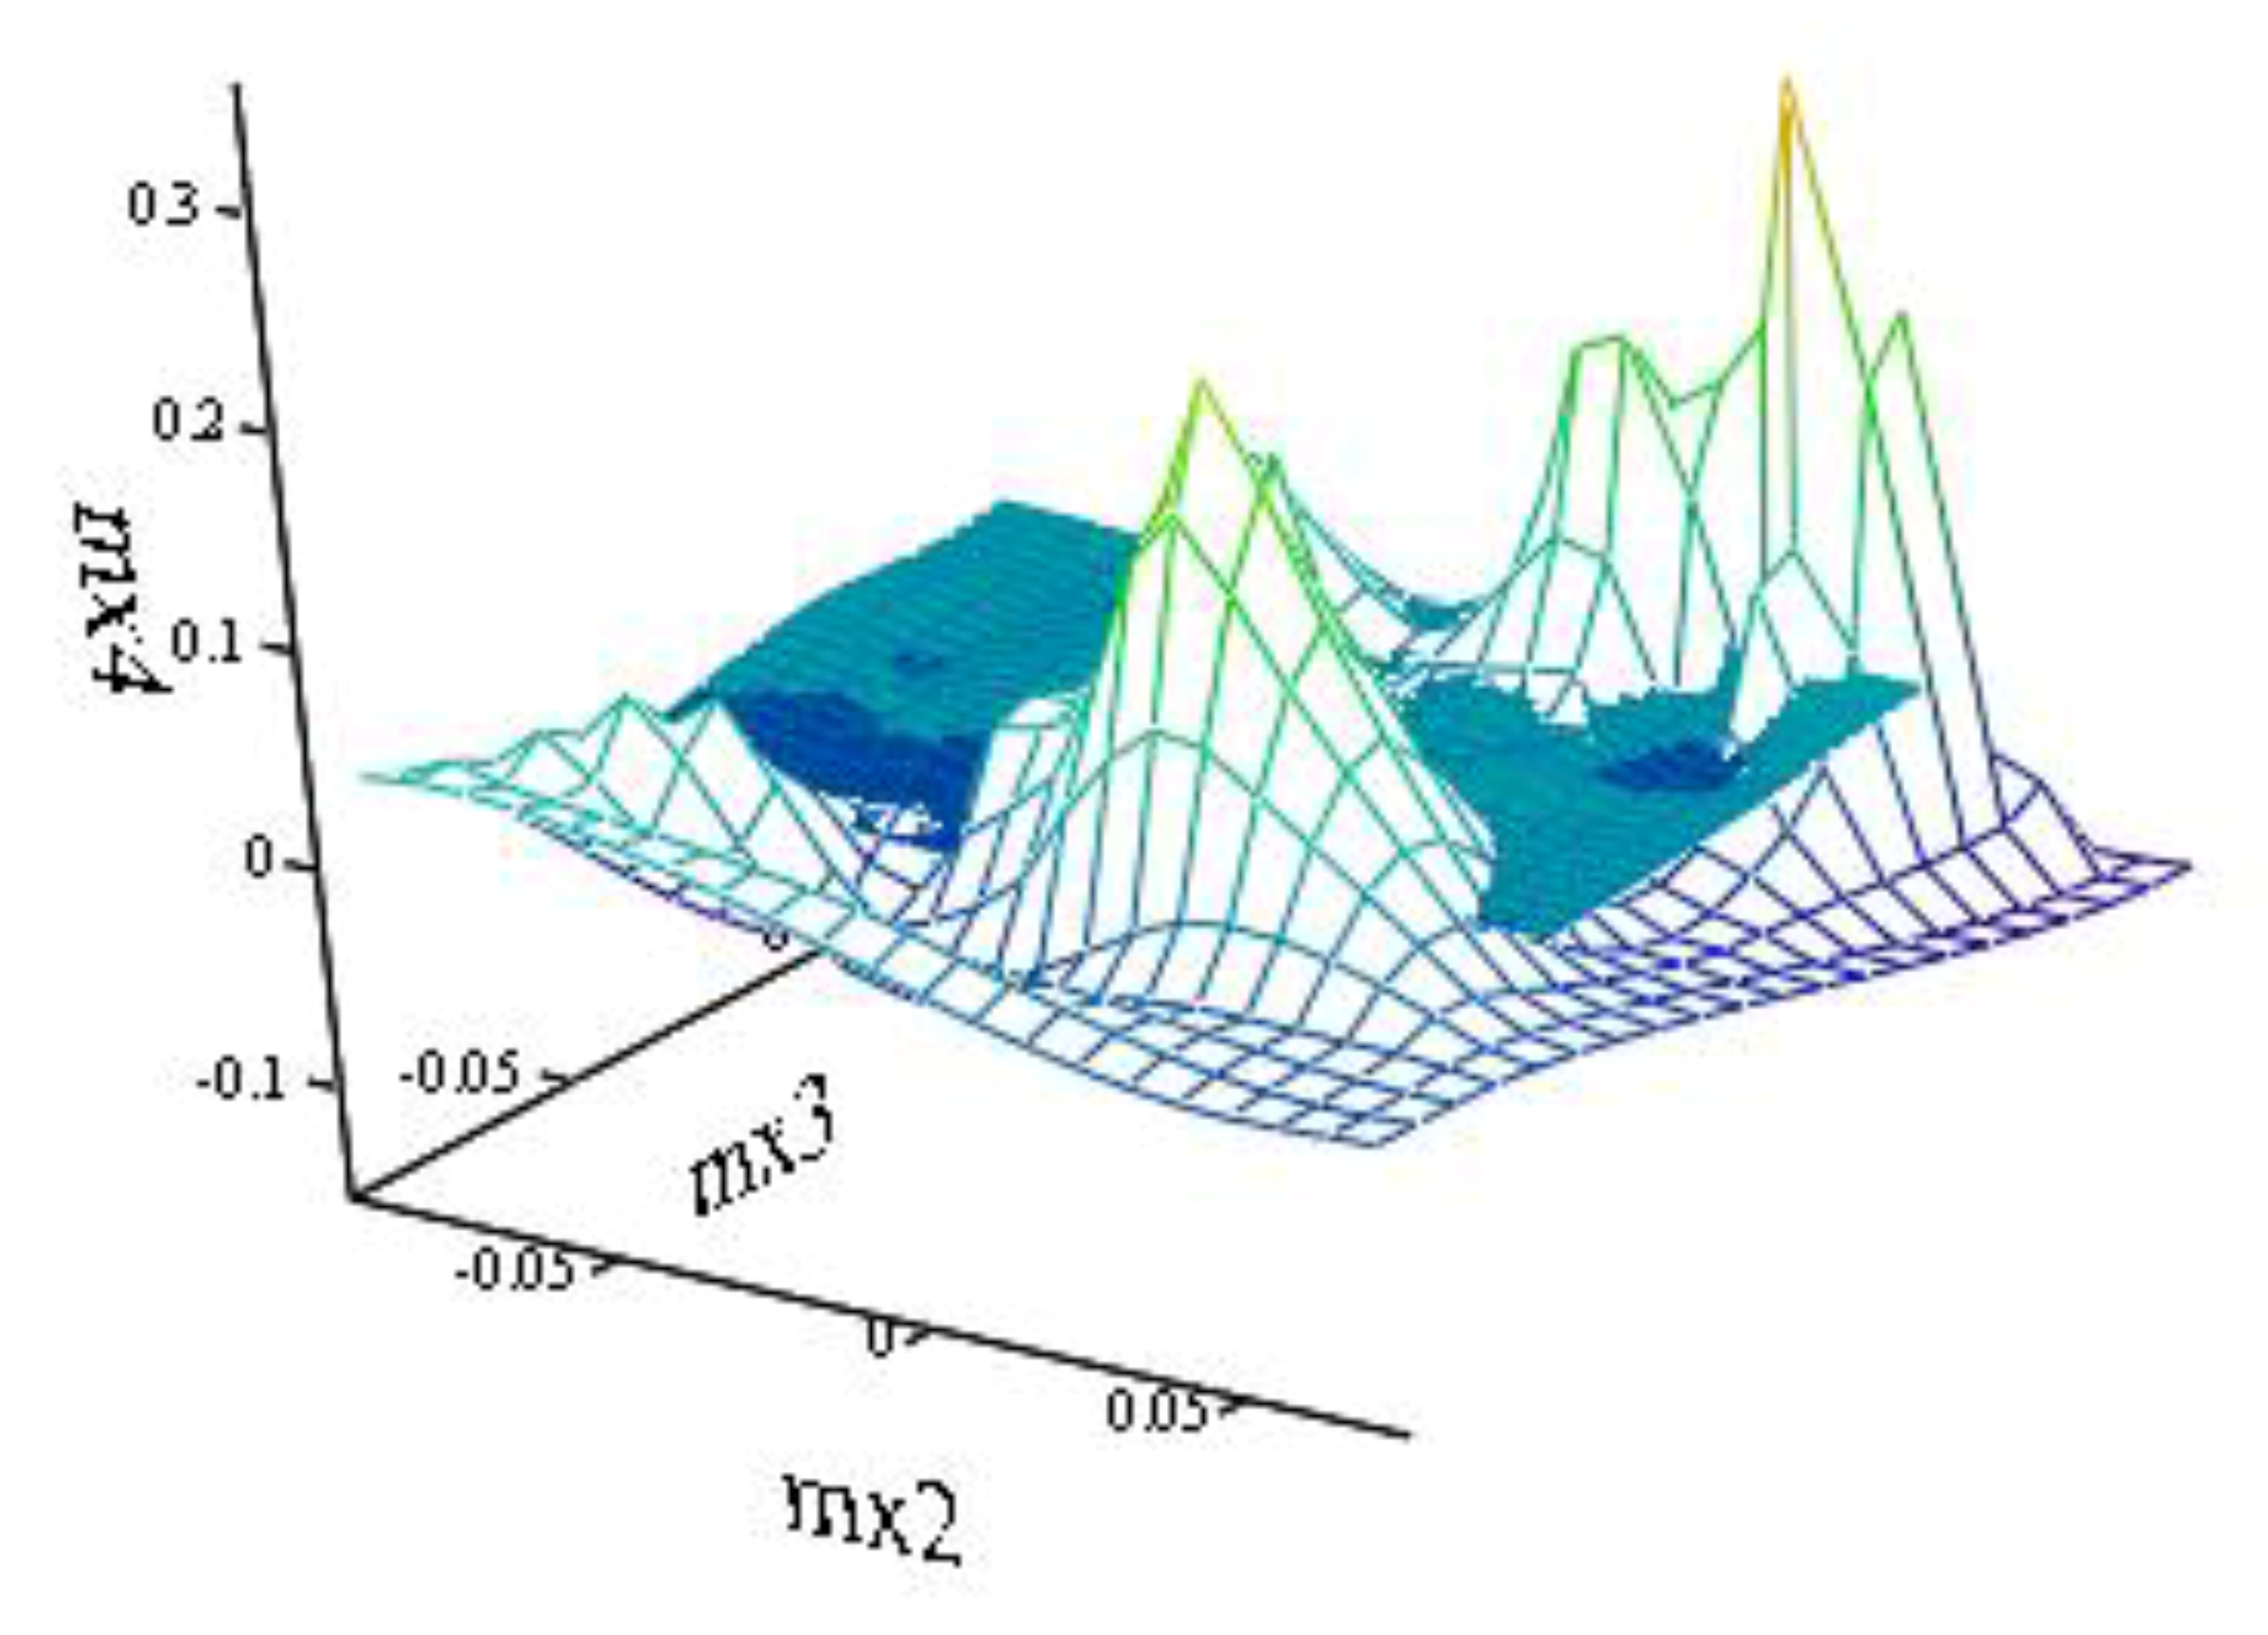
Since the ranges of the expected values of the legitimate and total traffic (
Figure 10) for the selection of the selected components from iteration to iteration are very close, it is not advisable to consider the mathematical expectation when deciding on the absence/presence of an illegitimate component, since it is not informative.
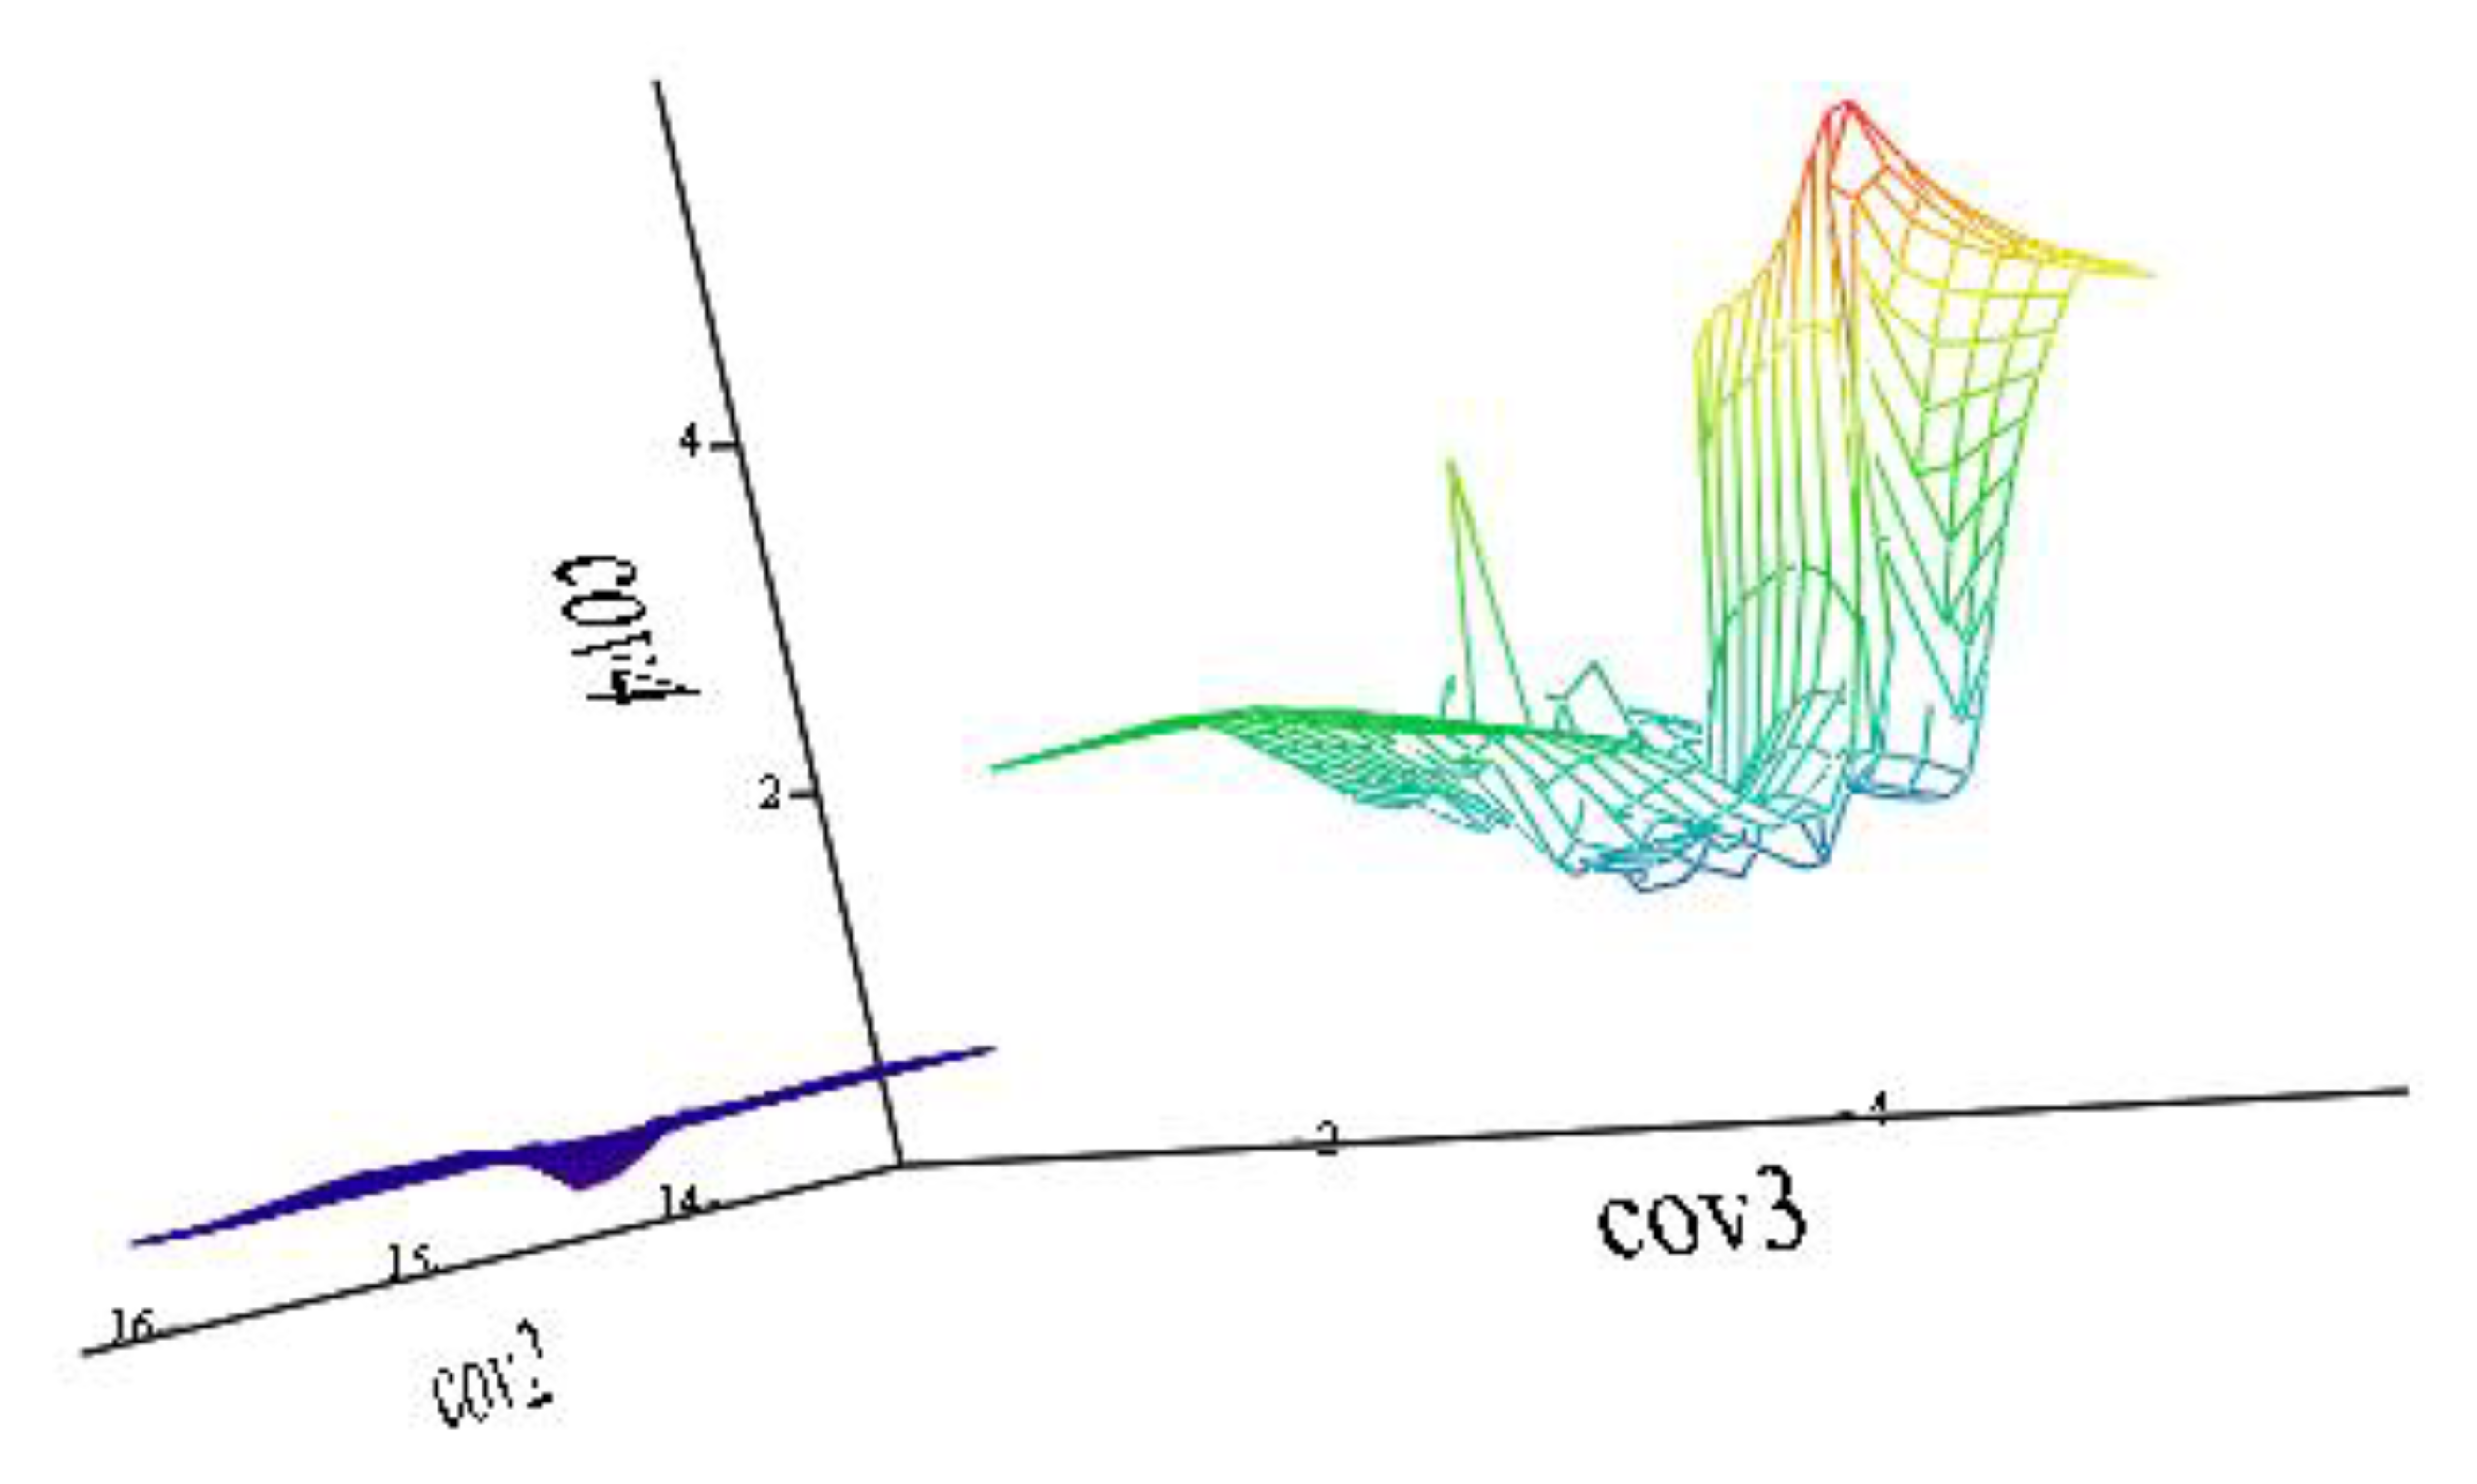
The nature of the change in the planes of the covariance values (
Figure 11) in three iterations (second, third, fourth iterations) is similar to the nature of the change in the standard deviation (
Figure 9), that is, covariance analysis is possible in order to eliminate the error in deciding on the mean square deviation.
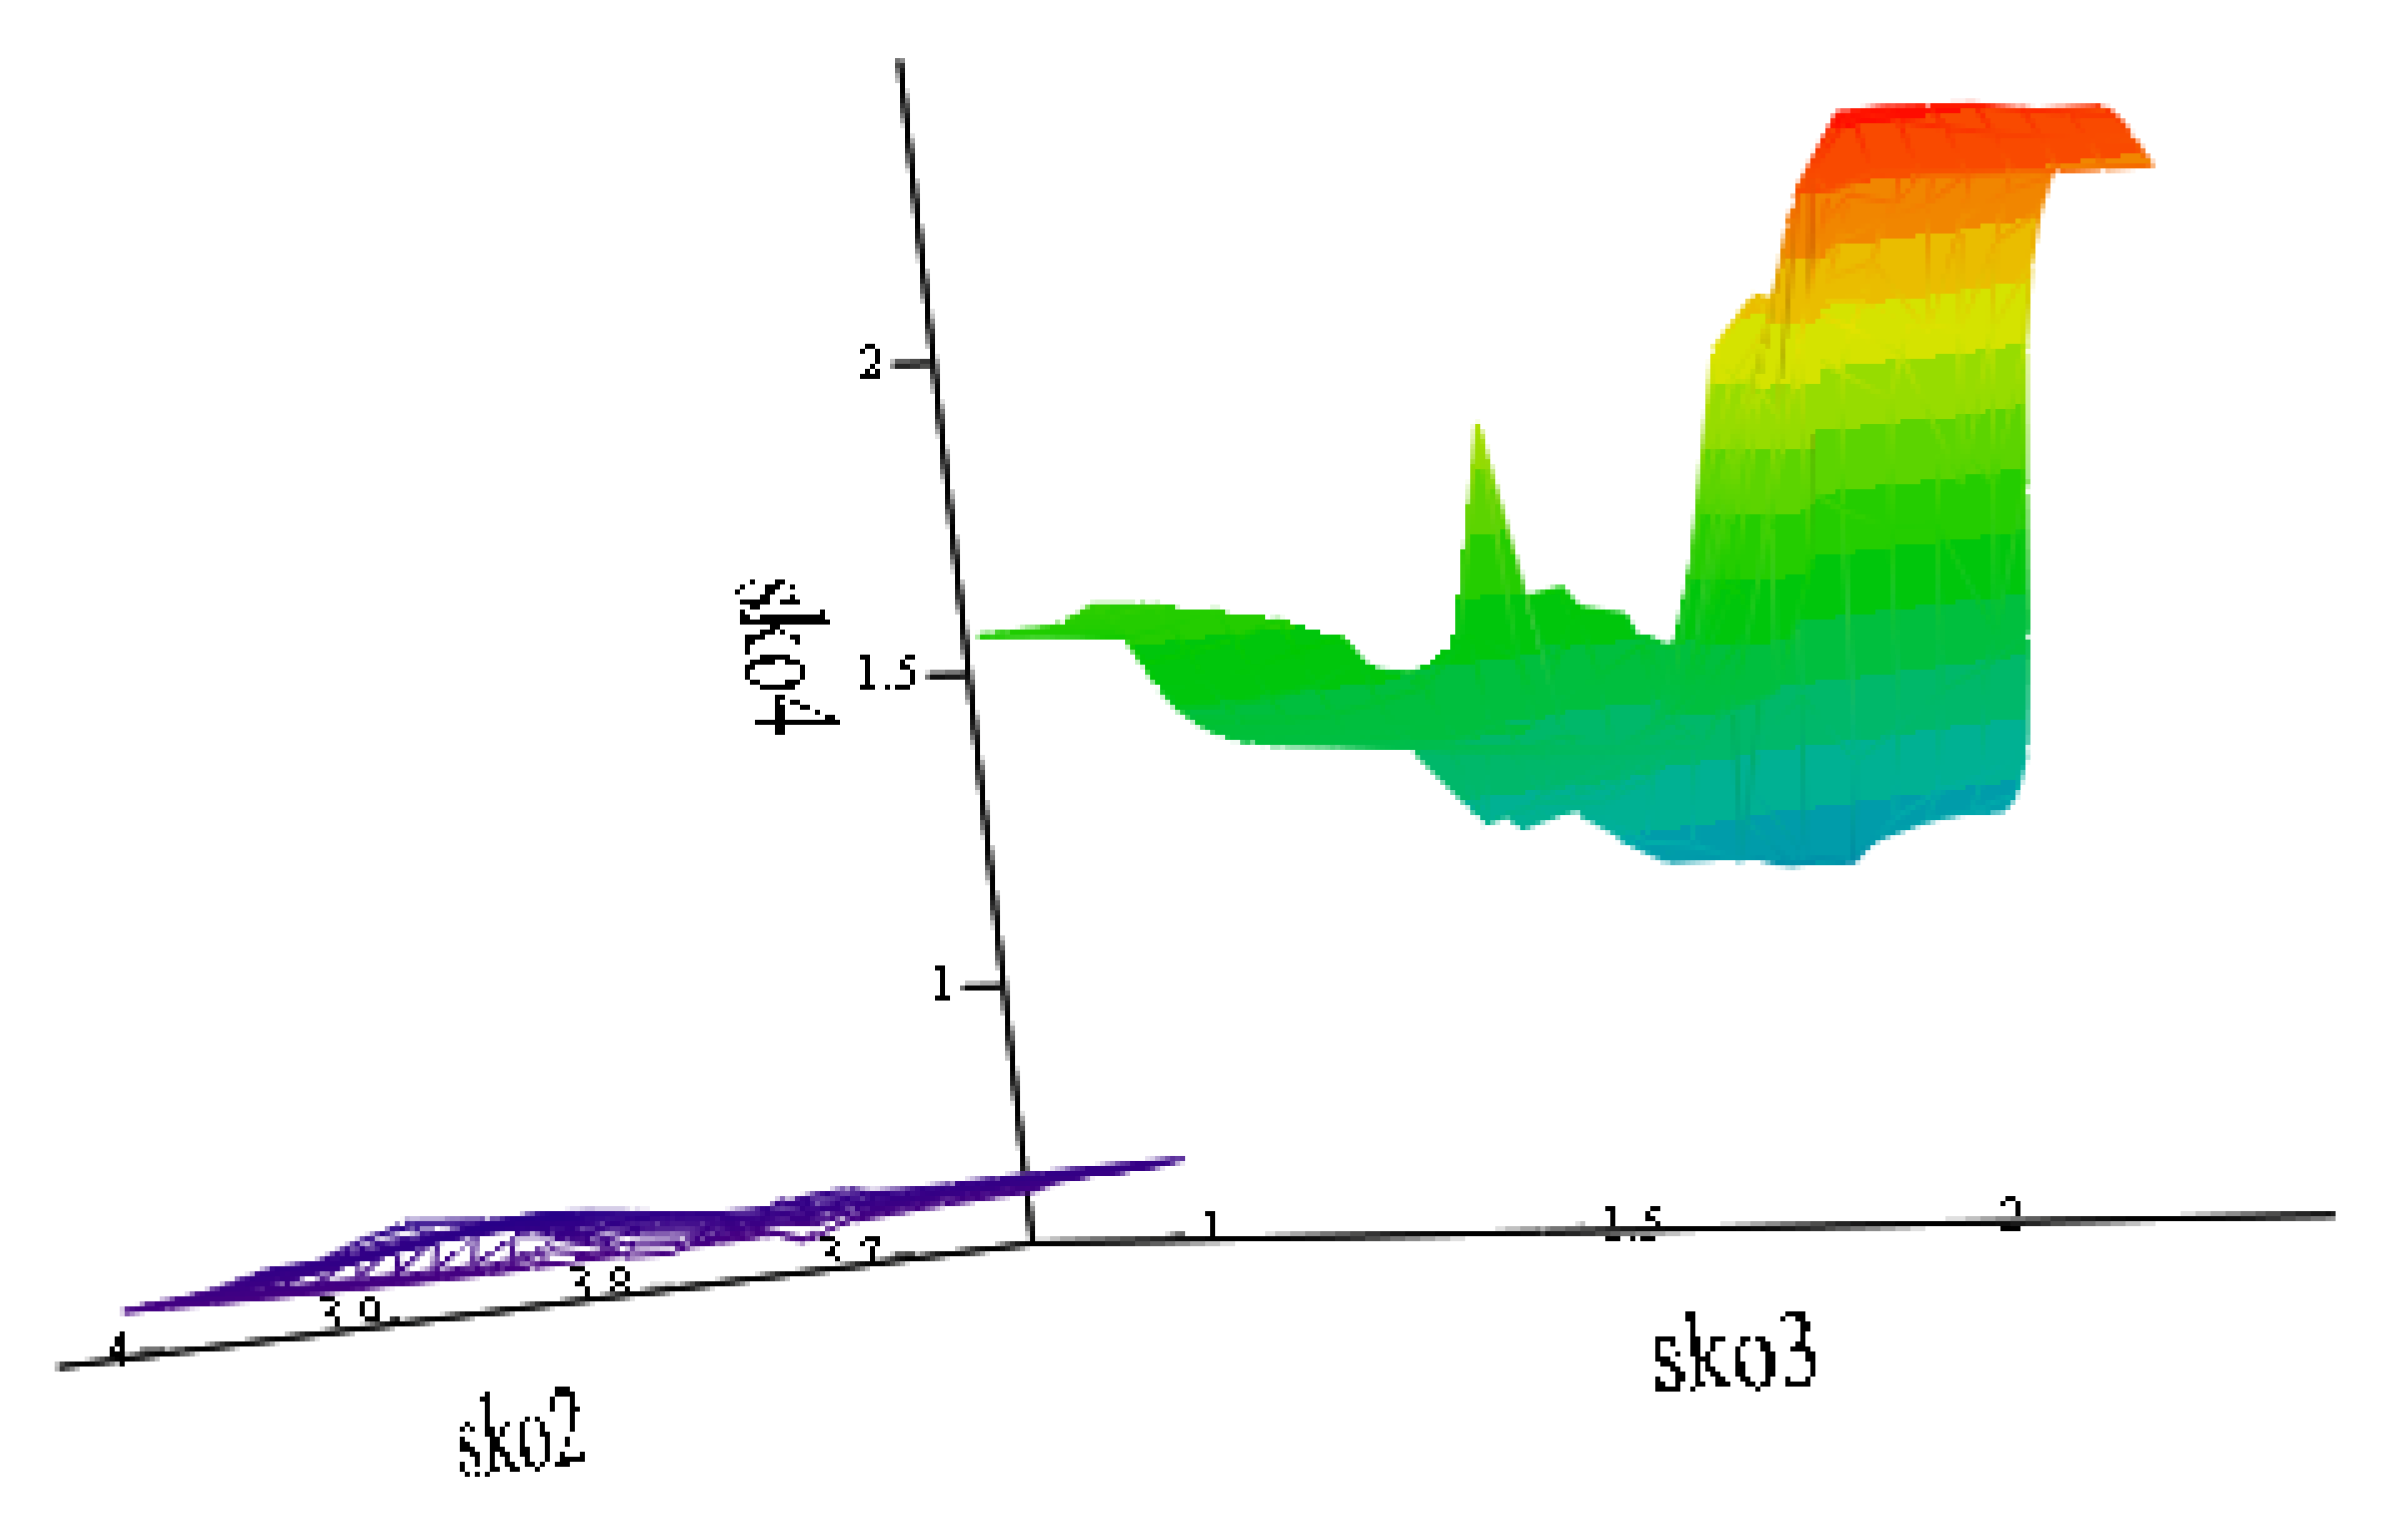
Therefore, according to the data obtained during the modeling process, it is possible to distinguish the main statistical parameters, which, starting from the third iteration, are signaling devices of unauthorized actions in the network:
The standard deviation of the extracted component is 1.5–2 times less than the standard deviation of the extracted component during normal network operation;
The covariance of the selected component is four to five times less than the covariance of the selected component during normal network operation;
The correlation interval of the autocorrelation function is two times less than during normal network operation;
The amplitude of the autocorrelation function is 20 times less than with normal network operation.
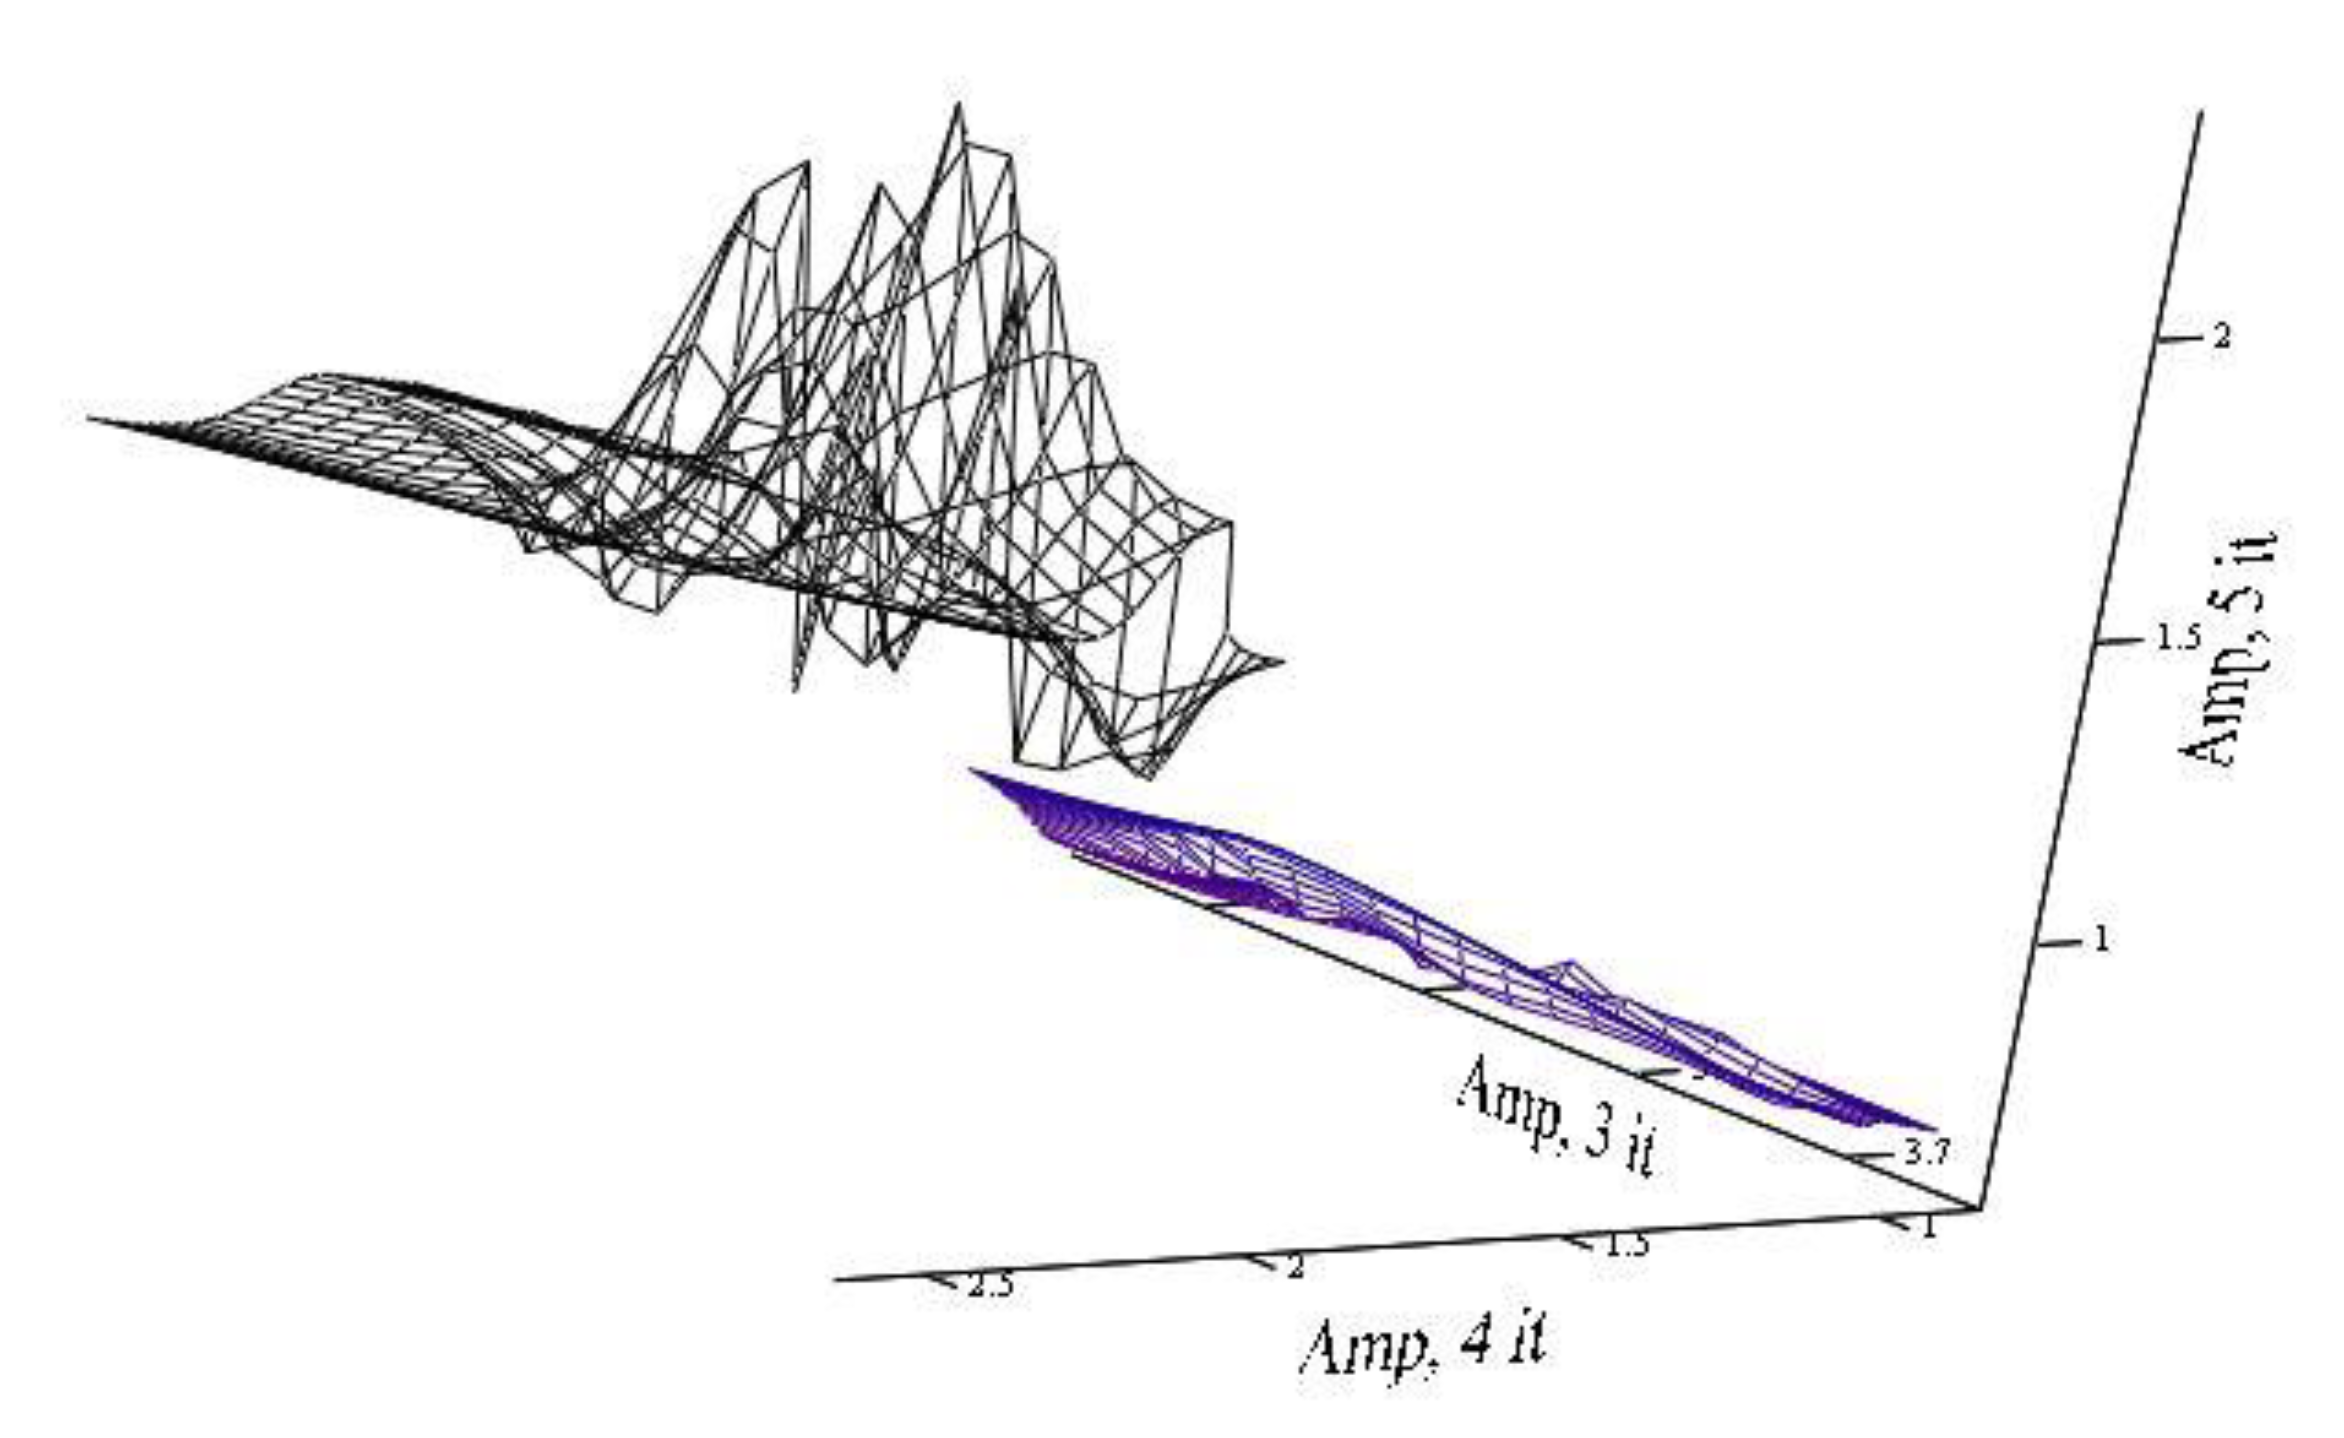
In order to establish the sensitivity of the model to a decrease in the repetition rate of the introduced pulses and their amplitude, as well as changes in the statistical characteristics of legitimate traffic, a series of 35 experiments was carried out. In the legitimate traffic, the variance was changed to 4, the ratio of the legitimate traffic/illegitimate traffic was increased to 11.11, and the number of introduced pulses was simultaneously reduced to 5 with average amplitude equaled to −0.18.
Figure 12a,b are similar in nature to the location of the planes at the iteration in the previous series of experiments. However, the number of iterations has increased to highlight features indicative of the introduction of an illegitimate component. It is also obvious that the plane of values of the component of legitimate traffic at iteration 5 (
Figure 12b) has a significantly smaller area with increasing dispersion. That is, with a decrease in the activity of the intruder, as well as with a decrease in the length of packets sent to the network, the model allows one to detect deviations from legitimate traffic and to predict statistical characteristics in the next window of anomalous traffic. These alarms of unauthorized actions in the network will allow one to classify an attack.
Figure 13 shows the change in the amplitude of the autocorrelation function by iterations. Obviously, when analyzing the selected components according to the results of the decomposition of three iterations (the third, fourth, and fifth iterations), the value planes do not intersect. However, the third iteration is not informative, and the fourth and fifth iterations are visual, and are similar to the previous series of experiments. It was also found that the correlation interval varies similarly to the previous series of experiments, however, the difference between the components of legitimate and illegitimate becomes apparent from the fourth iteration.
With a decrease in the number of introduced pulses to two, the character of the characteristics described above is preserved, but the number of iterations necessary to identify differences in the value planes increases, which indicates a high sensitivity of the model. However, the optimal number of pulses should be determined by which to make a decision, since from two to four, the introduced pulses can be random events in the network (it is assumed that the minimum quantity for one action in the network is two pulses: Request-response), then optimally analyzed a sequence of at least five pulses.
Based on the results obtained during the modeling process, the authors consider the results of the fourth iteration of extreme traffic decomposition sufficient to make a decision on the presence/absence of unauthorized actions in the network. It is proposed that the values of the standard deviation and the correlation interval should be used as the analyzed parameters of the selected component, since these parameters take into account statistical changes in the total traffic, and also unambiguously establish the fact of a change in the speed of the initial process.
4. Experimental Results
The decision rule can be formalized using fuzzy logic [
32,
33,
34,
35]: According to the results of the first, second and third iterations, the parameters are not calculated, after the fourth iteration, the standard deviation is calculated and the correlation interval for the selected components. These parameters were used to formulate a decision rule in MATLAB (Version R2017, MathWorks, Natick, MA, USA), using the Fuzzy Logic Designer block.
Based on the available samples, the Sugeno algorithm with two inputs and one output was simulated (
Figure 14a). As inputs, signs were used in which the ranges of values are divided into three:
detect,
use,
unknown (
Figure 14b).
At each of the entrances, the areas characterize:
Detect—the sample values of the total traffic by the standard deviation and the correlation interval, the distribution law psigmf;
Use—the sample values of legitimate traffic according to the standard deviation and correlation interval, the distribution law psigmf;
Unknown—the remaining values by the standard deviation and the correlation interval, the distribution law psigmf.
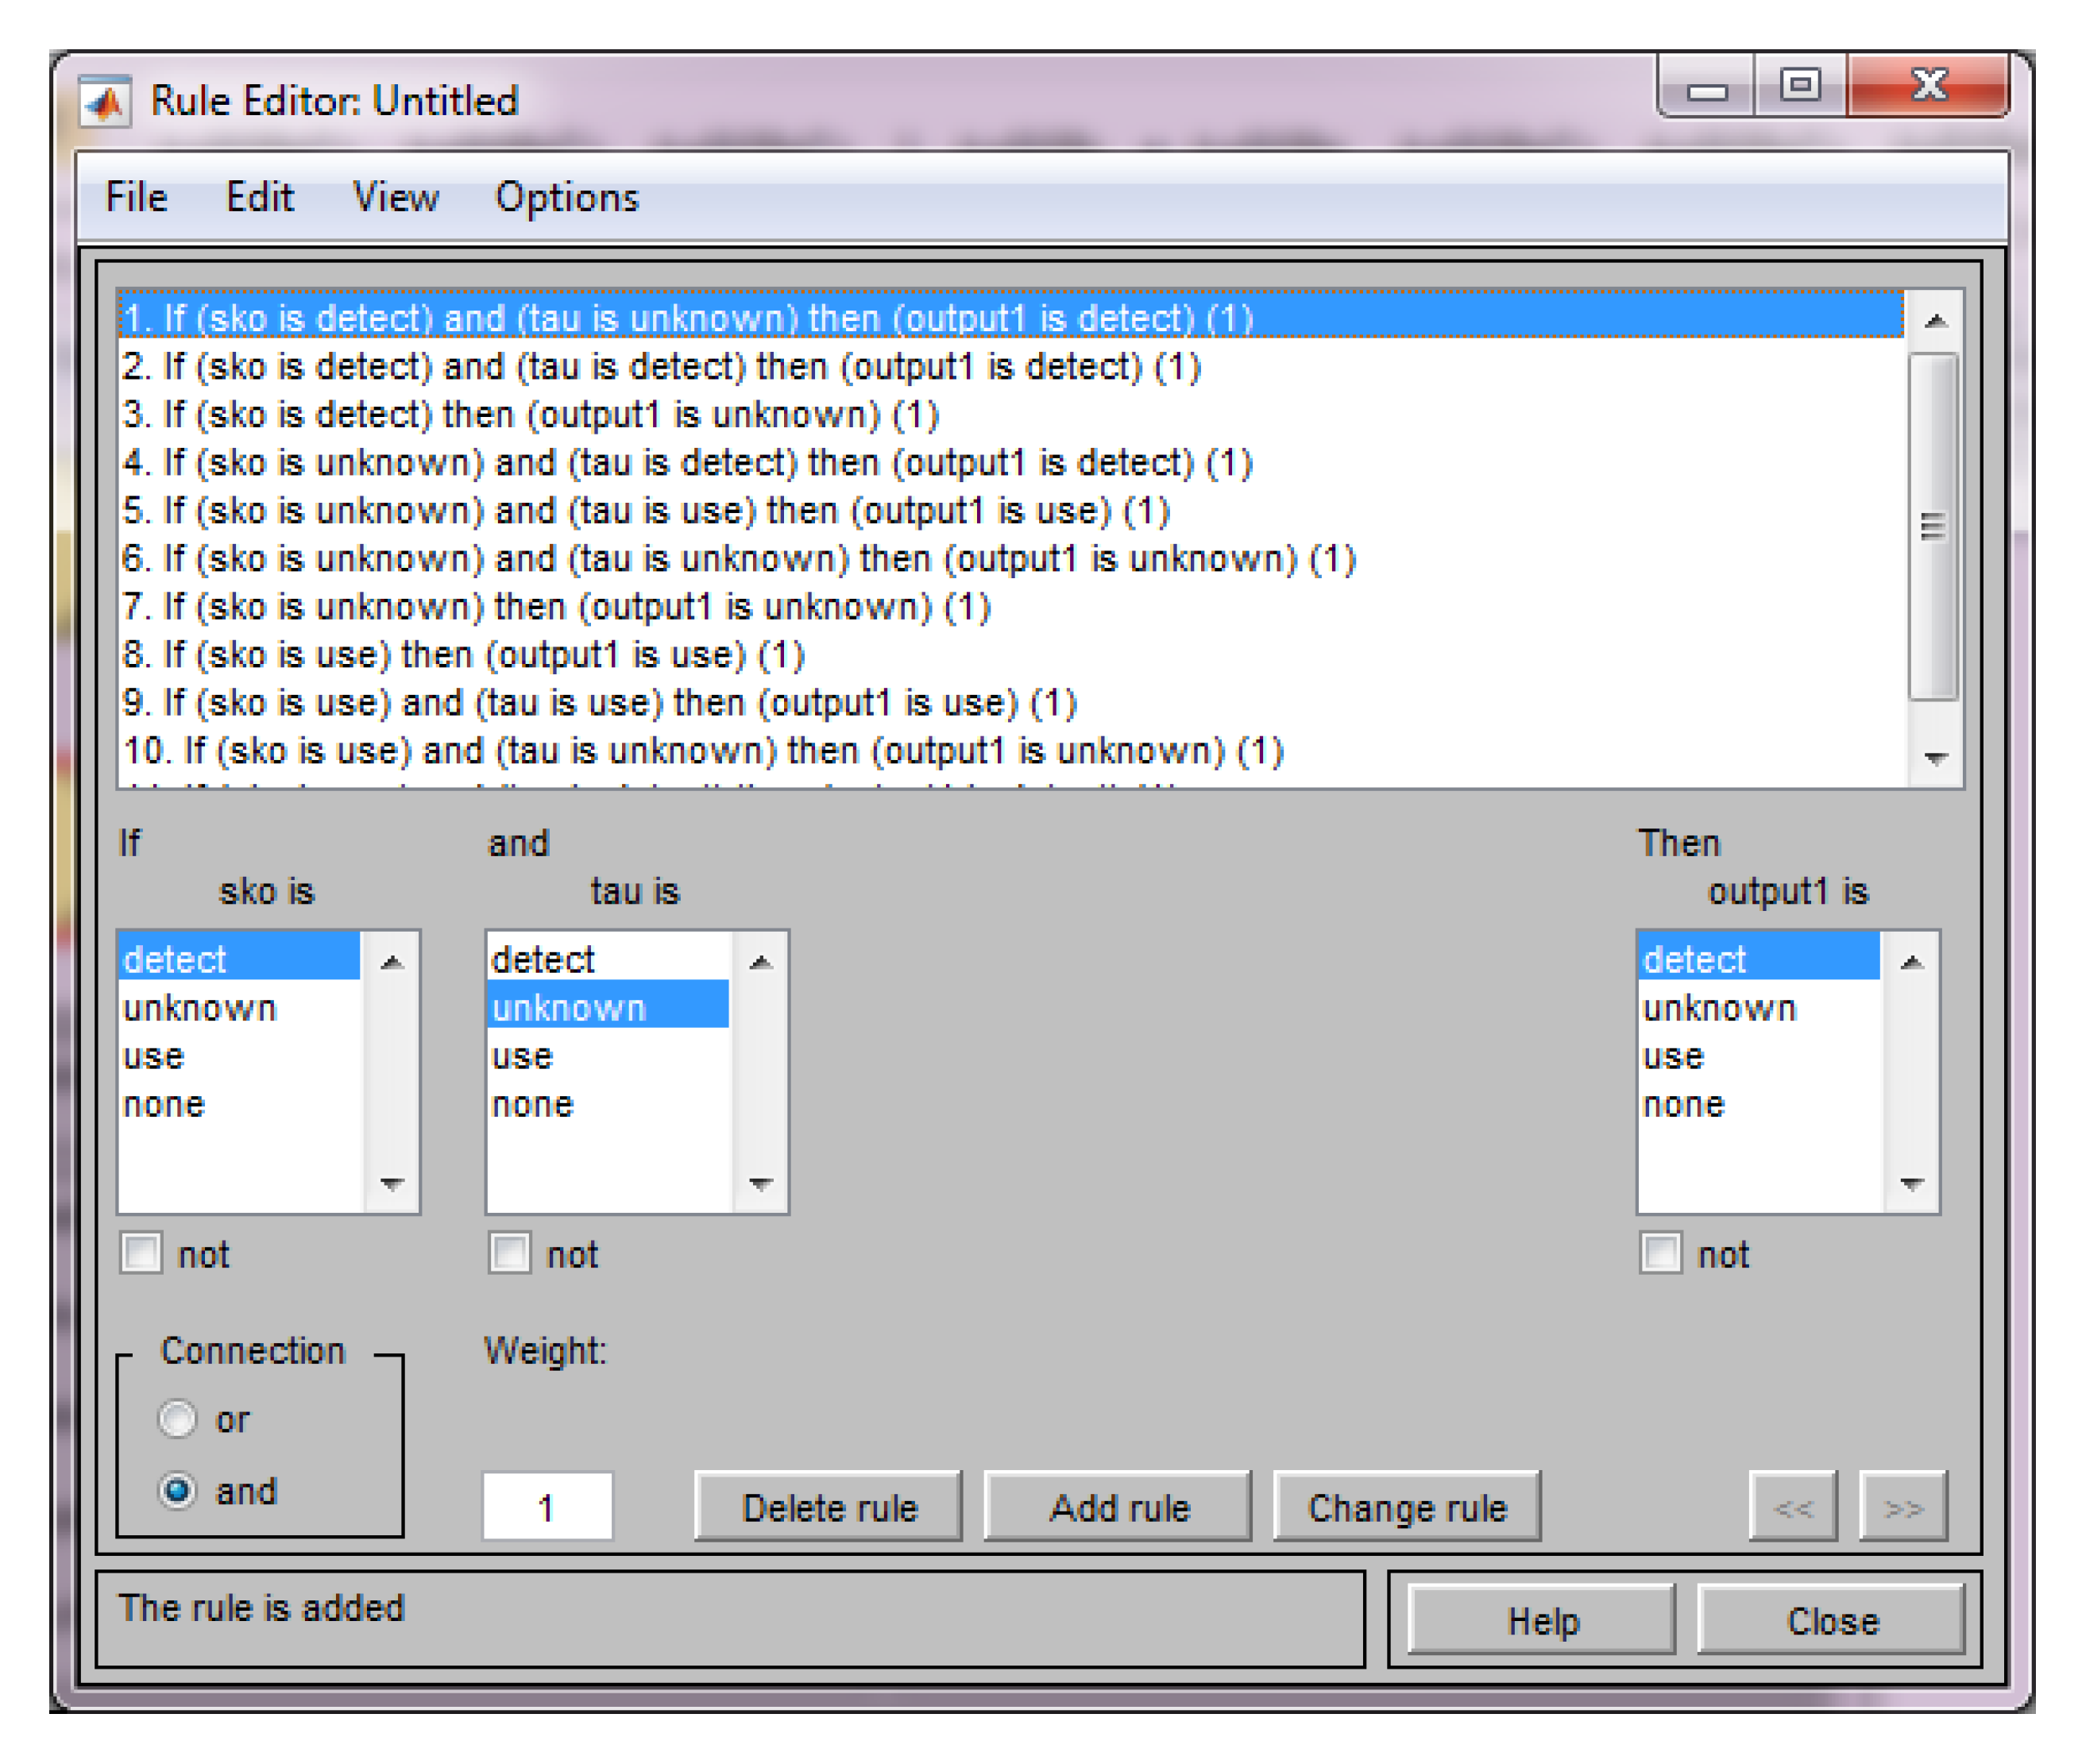
To make a decision in fuzzy logic, the rules were set (
Figure 15).
Algorithm for setting fuzzy logic rules is as follows:
if a value from the detect area appears on one of the inputs, then detect is the value of the algorithm,
if both inputs have an unknown value range, then the value of the algorithm is unknown,
if the unknown value is combined with the use value, then the output is use.
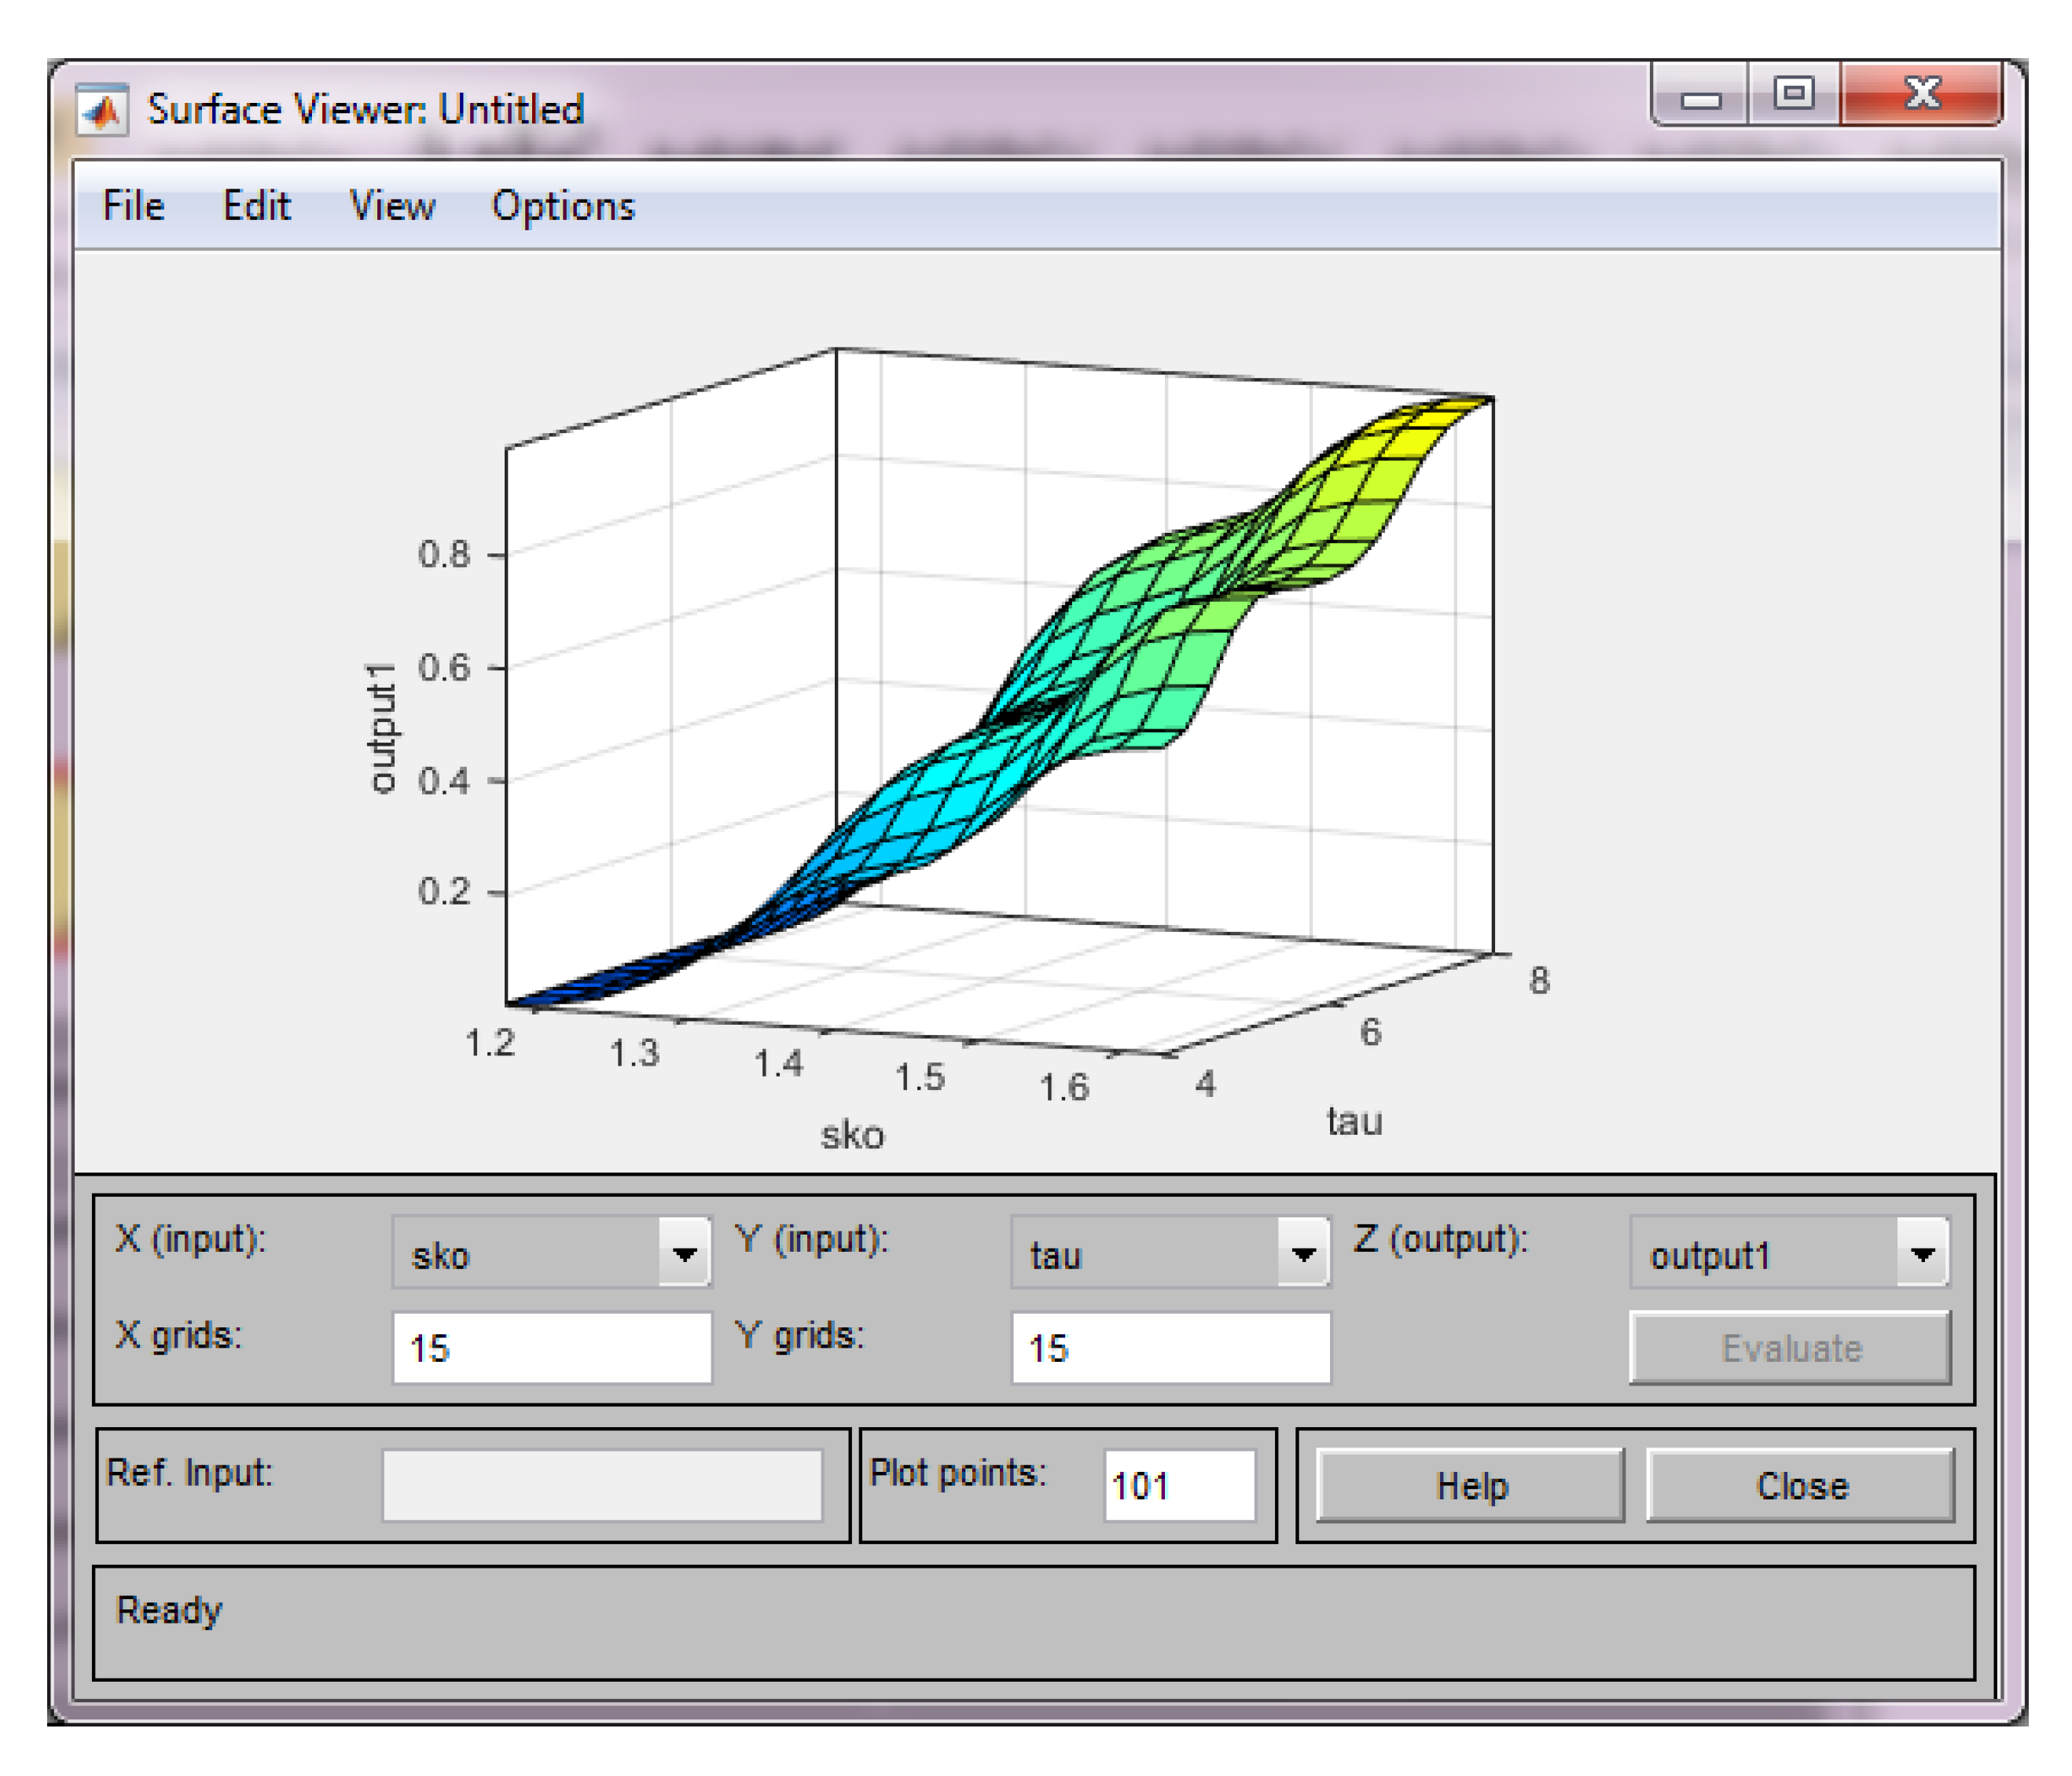
The results of modeling fuzzy logic are presented in
Figure 16.
The values of the outputs are assigned by a constant:
detect is equal to 0,
unknown is equal to 0.5,
use is equal to 1.
Based on the values related to the unknown output, it is possible to construct a trend of values, which, if there is an illegitimate component in the traffic, will be saved in the next analyzed window.
Table 1 shows a comparative assessment of the proposed method of extreme filtering with parametric detection, which is described in this article, with the extreme filtering method with graphical detection of the impact, which was described earlier in [
16].
Table 1 shows that the method of extreme filtering with parametric detection of cyber attacks has a higher sensitivity compared to the method with graphical detection. This is manifested in the fact that the proposed method is capable of detecting unauthorized influences in the telecommunication network traffic, not only at a high amplitude of the introduced traffic, compared with the amplitude of the useful traffic, but also in two other cases when the known method ceases to work. These are cases when the amplitude of the introduced traffic is very small and when the impact has different repetition periods and different amplitudes. These cases correspond to the most difficult to detect cyber attacks, for example, target attacks, for which currently there are still not enough effective detection tools and methods.


