Unintended Consequences of National Climate Policy on International Electricity Markets—Case Finland’s Ban on Coal-Fired Generation


Abstract
:
1. Introduction
2. Literature Review
3. European and National Energy and Climate Policies in the Region
3.1. Finland
3.2. Sweden
- Energy use would be 50% more efficient than in 2005
- Emission from non-ETS activities would be decreased by 63% compared to 1990.
- Transport’s emission would fall by 70% compared to 2010
3.3. Estonia
- Electricity system is synchronized with the EU
- 80% of generated heat is renewable-based
- 50% of domestic final electricity consumption is renewable-based
- Unsubsidized and open fuel and electricity market would operate
- Market concentration in the gas market would dramatically fall
- Gas market supplier’s share would be less than 70%
- Gas market seller’s share would be less than 32%
3.4. Latvia
3.5. Lithuania
4. Data and Methods
4.1. Modeling of the Energy System
4.1.1. Hydropower Simulation
4.1.2. Power and District Heating Sector Optimization
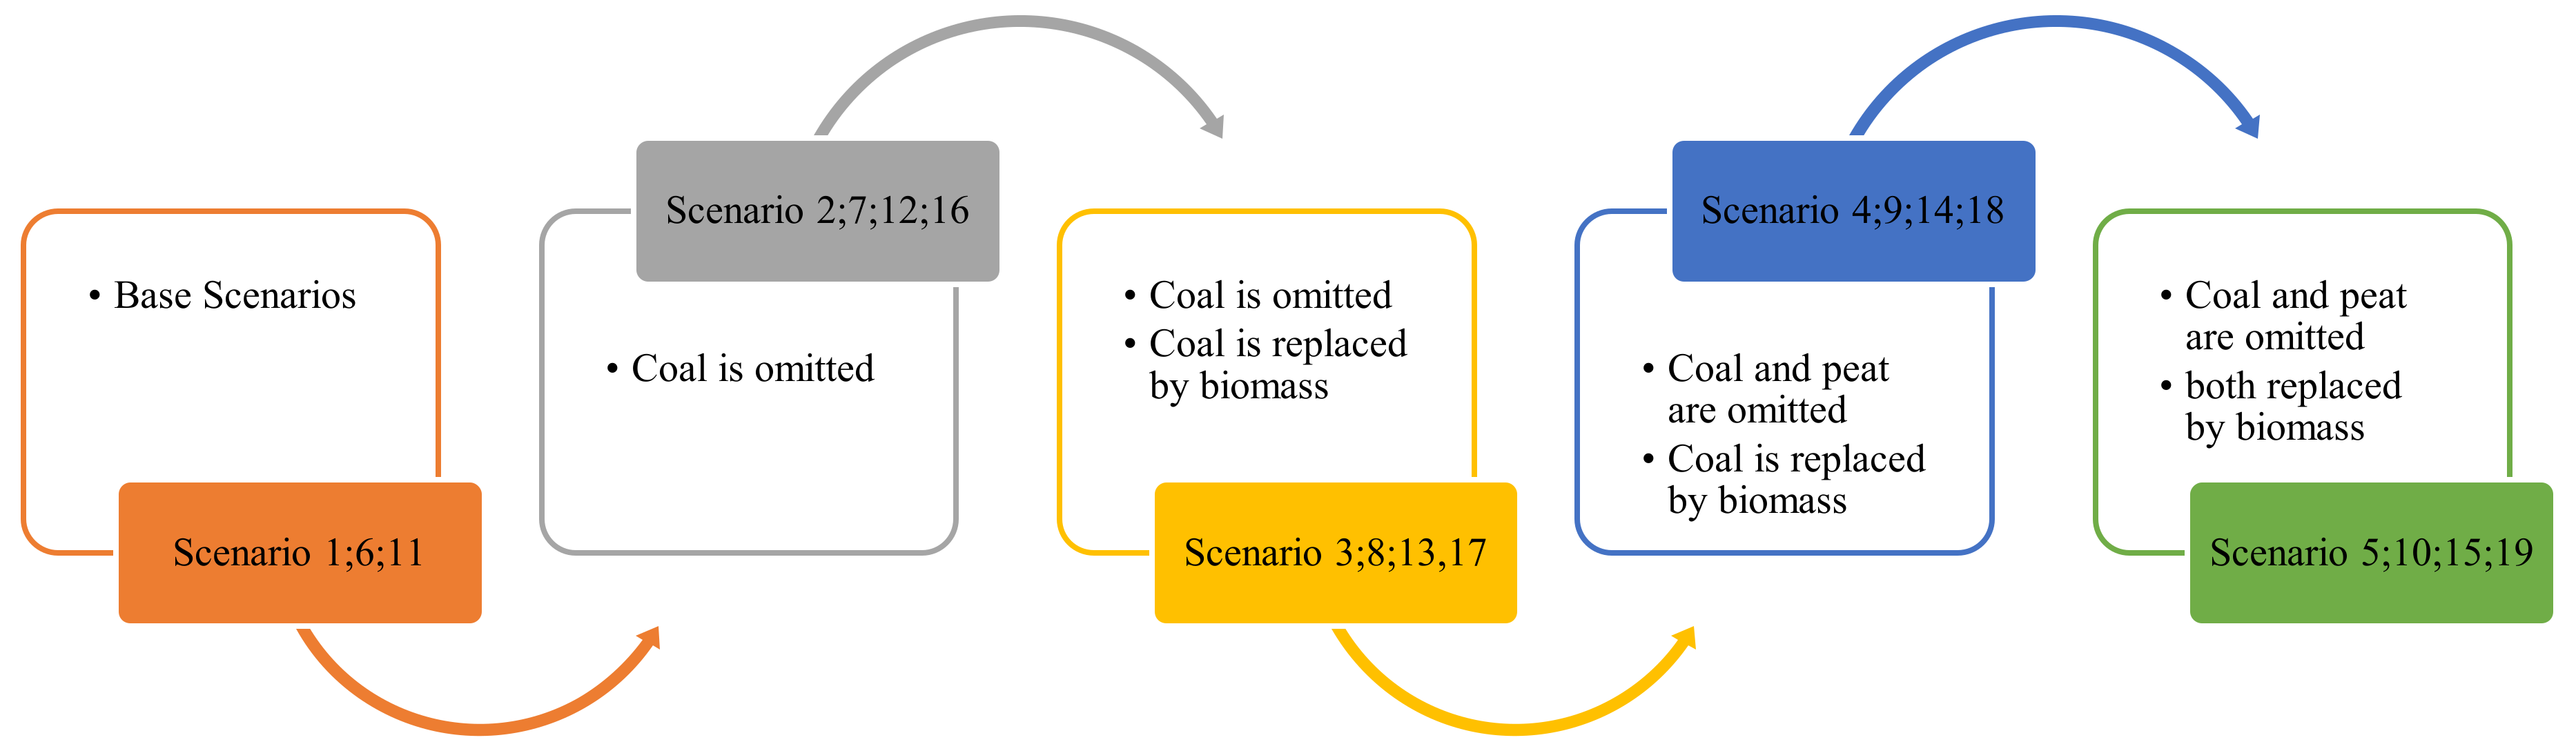
4.2. Scenarios
4.3. Data
5. Results
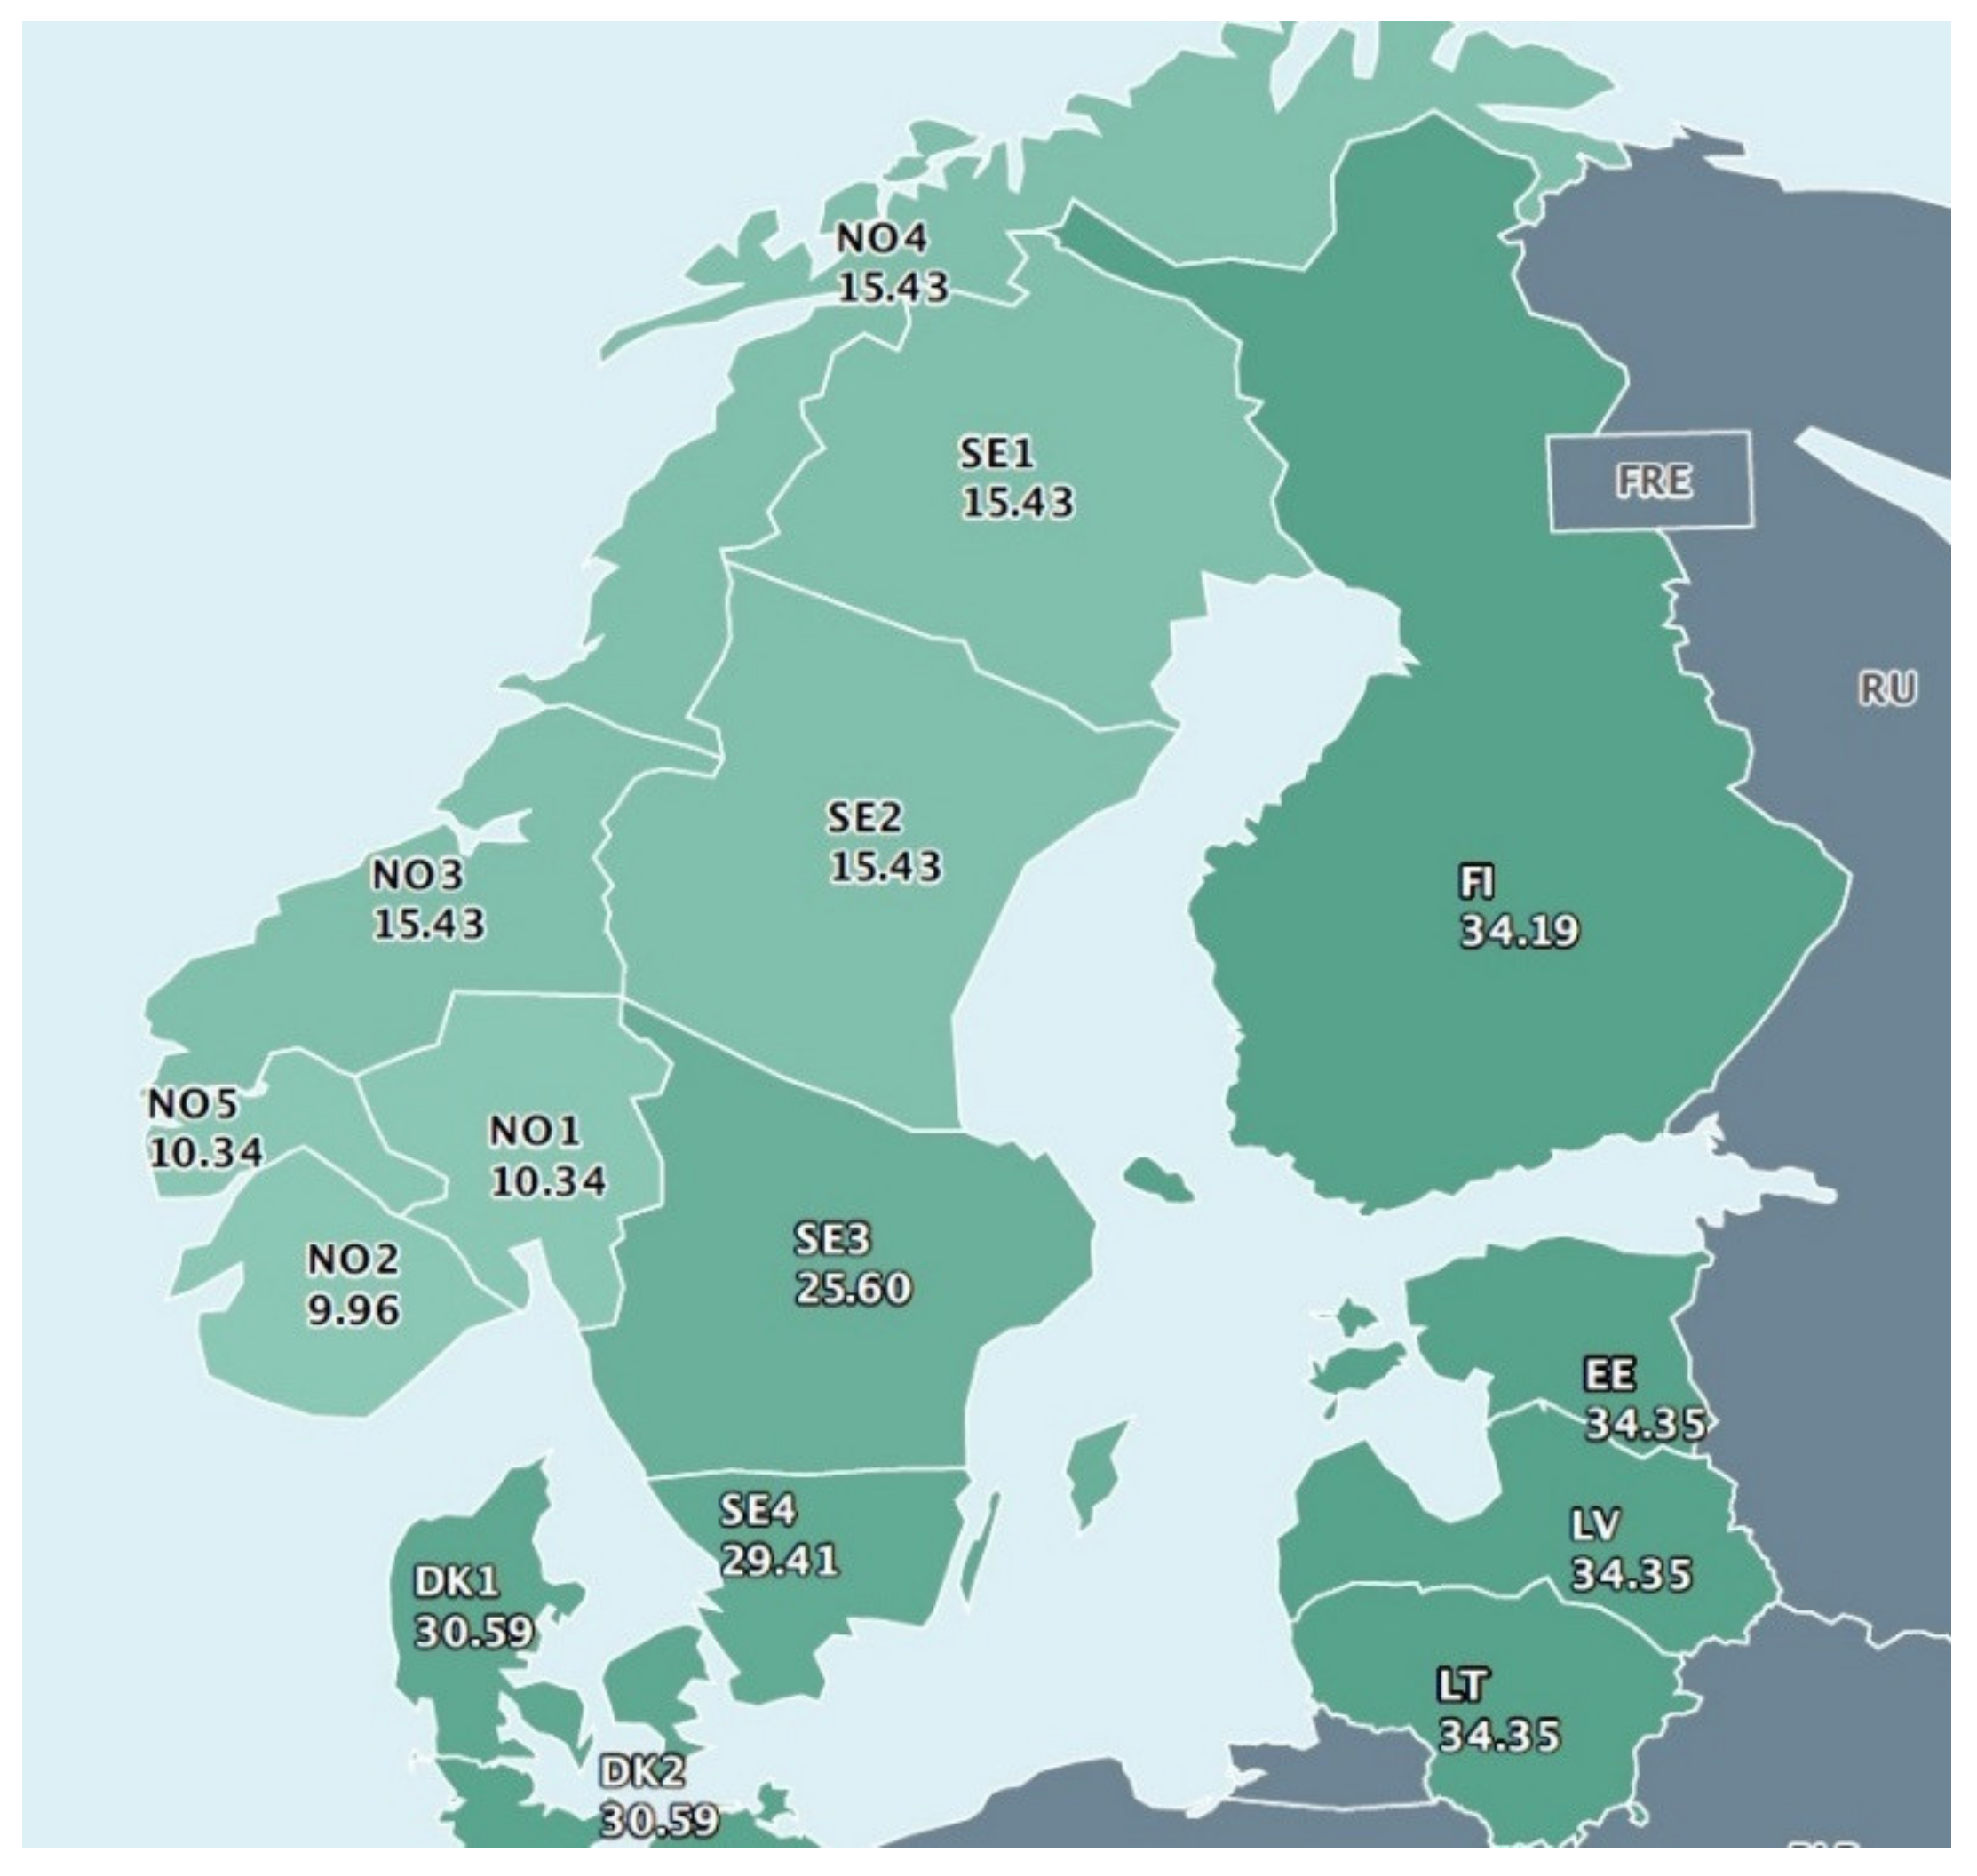
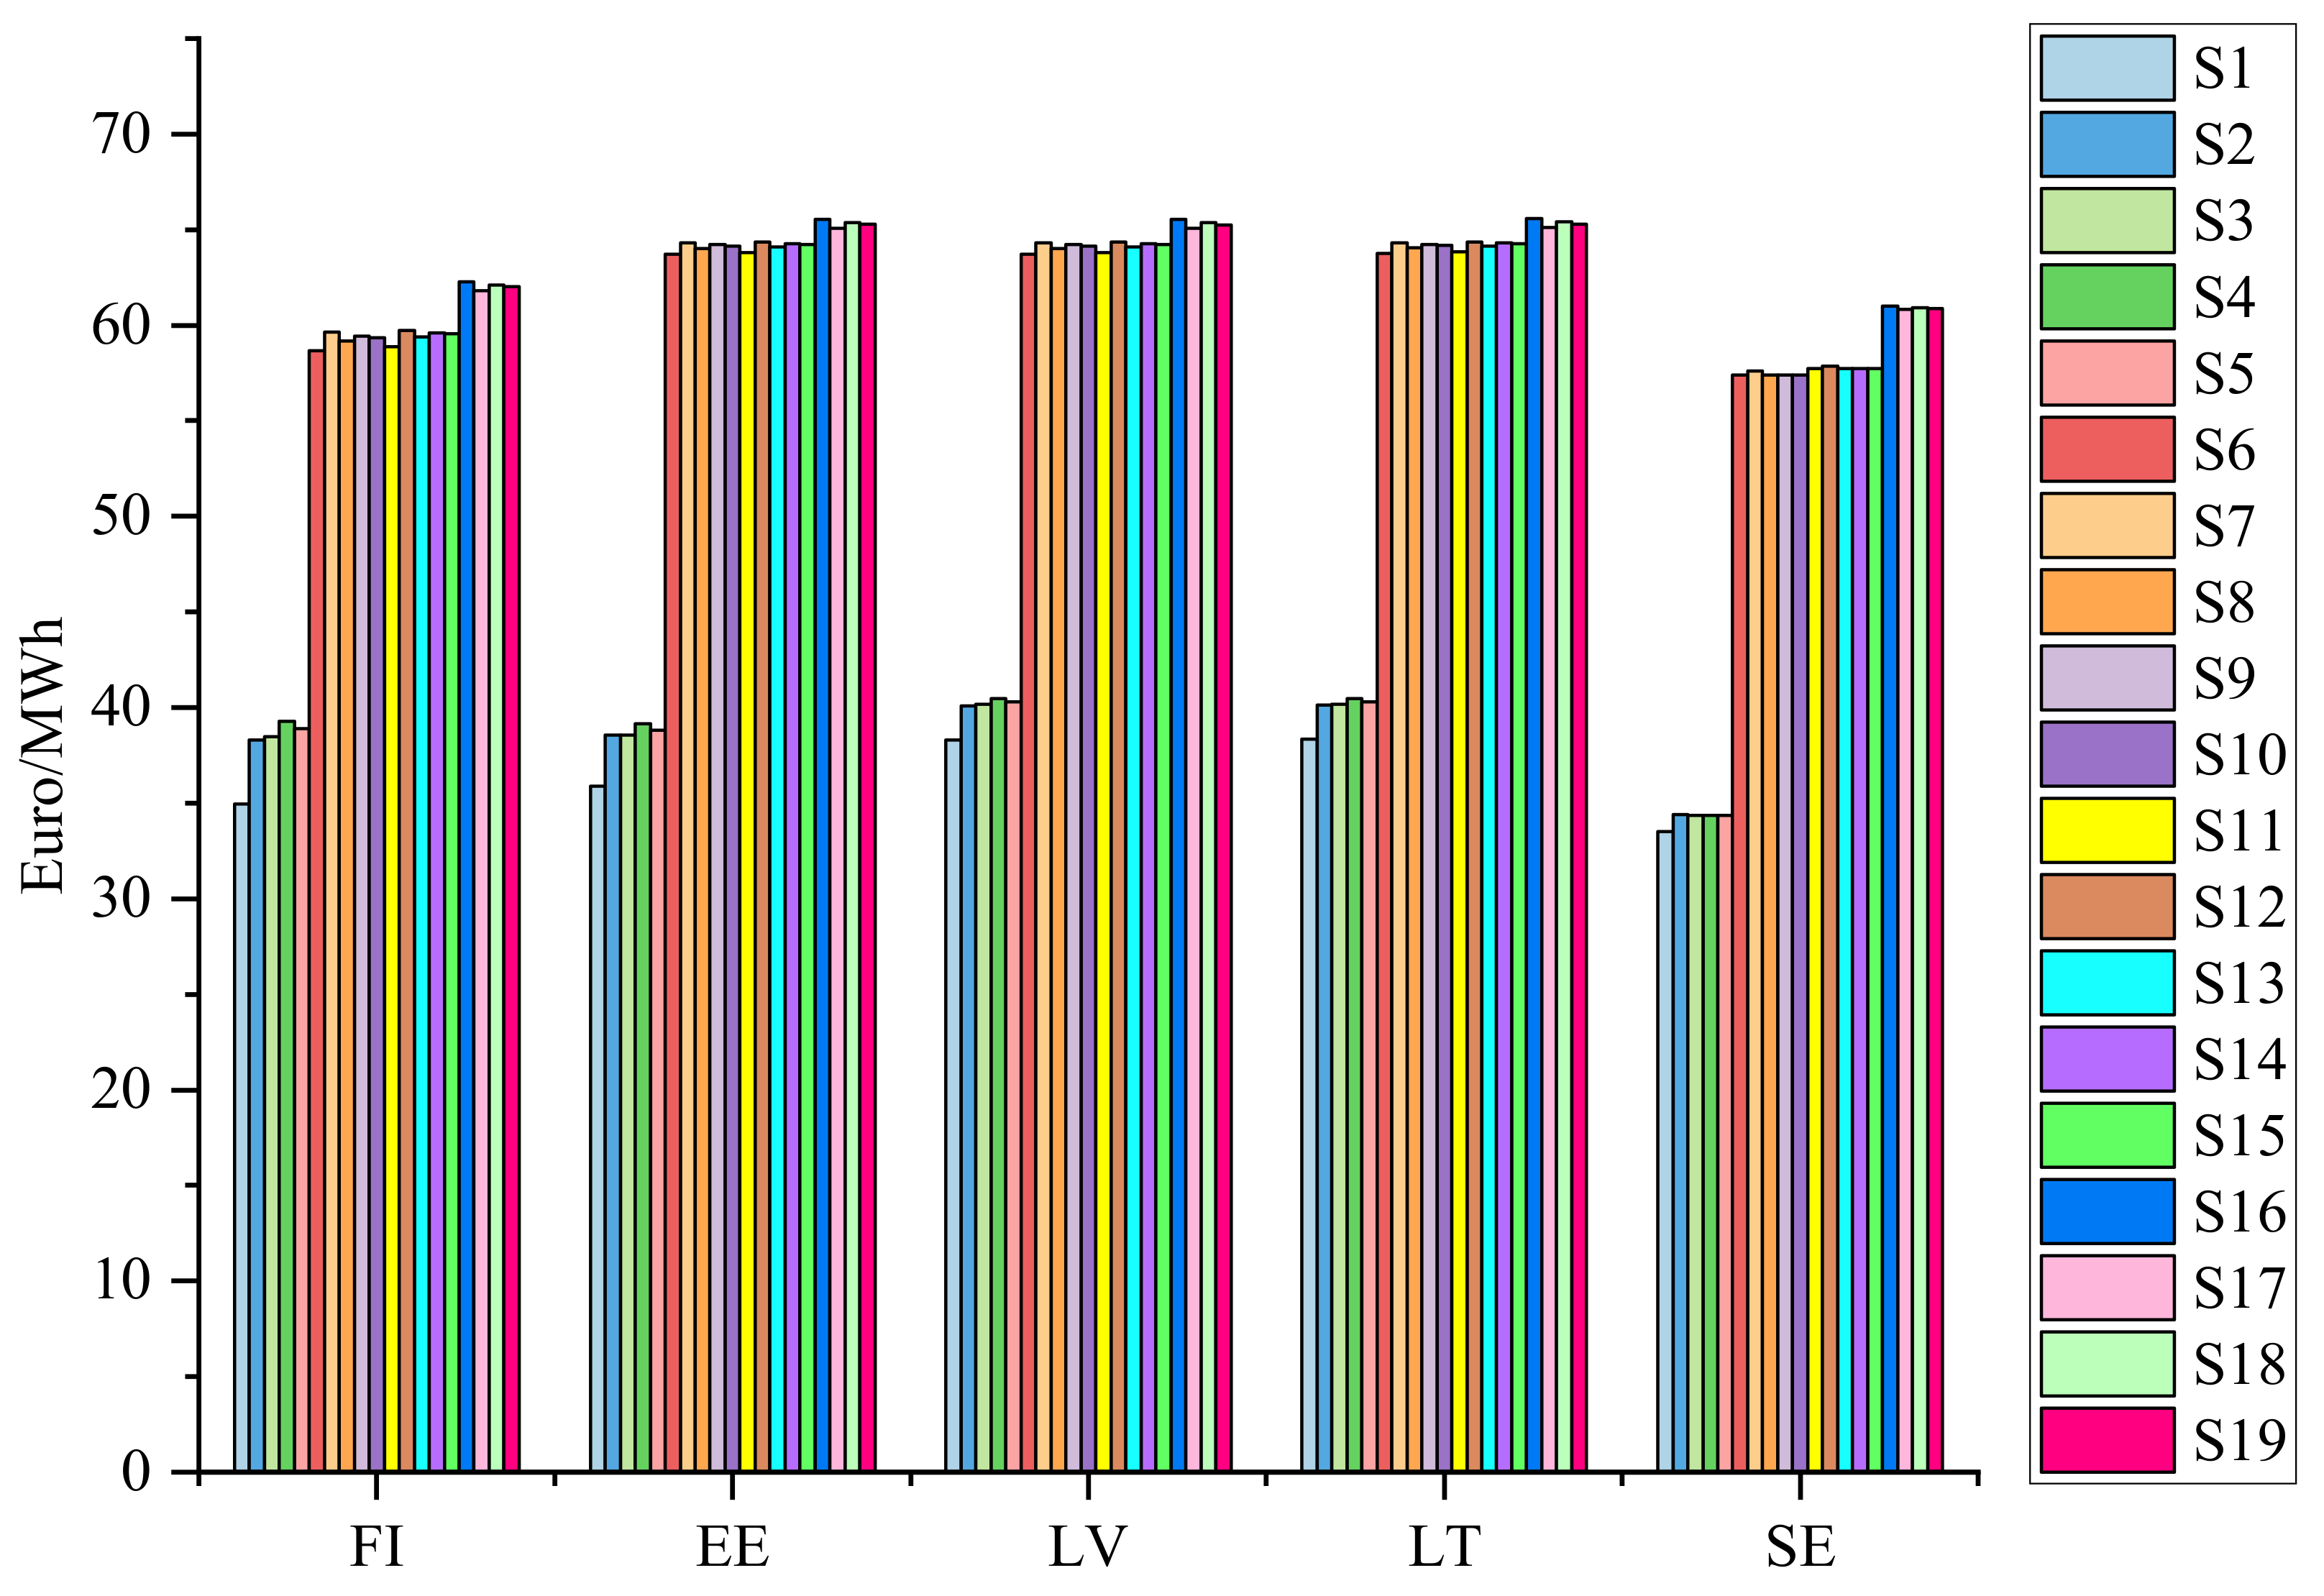
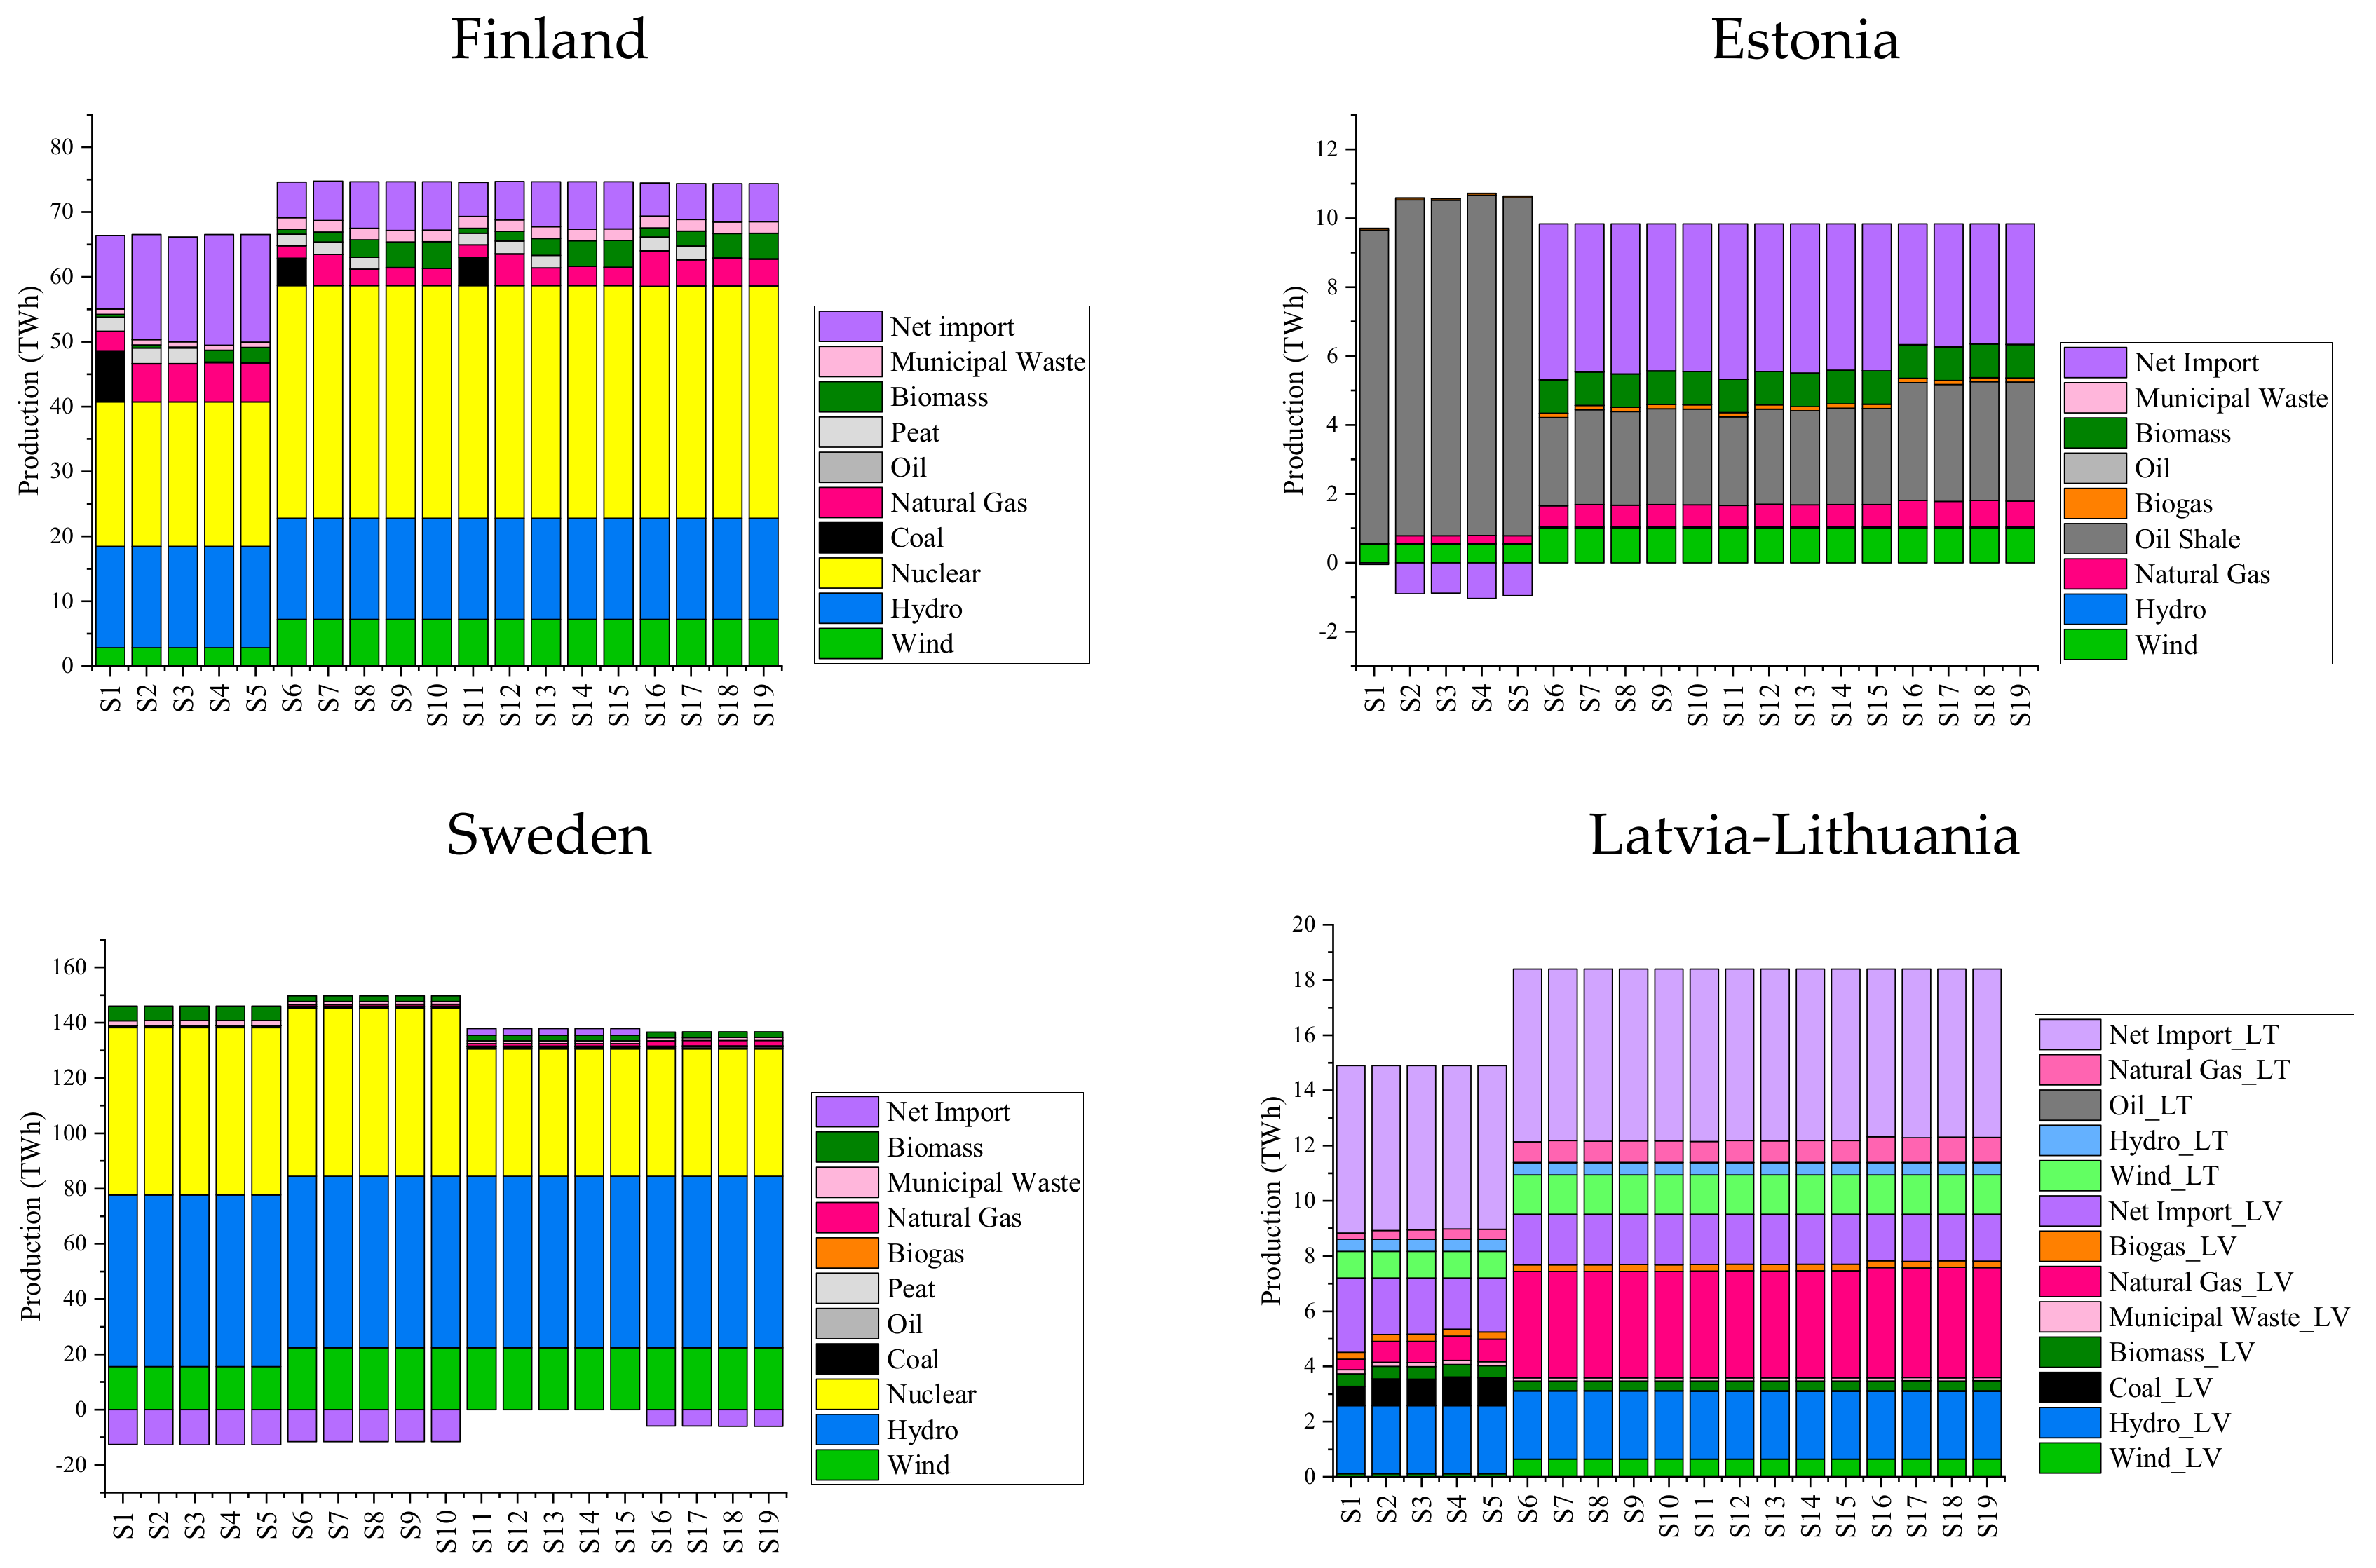
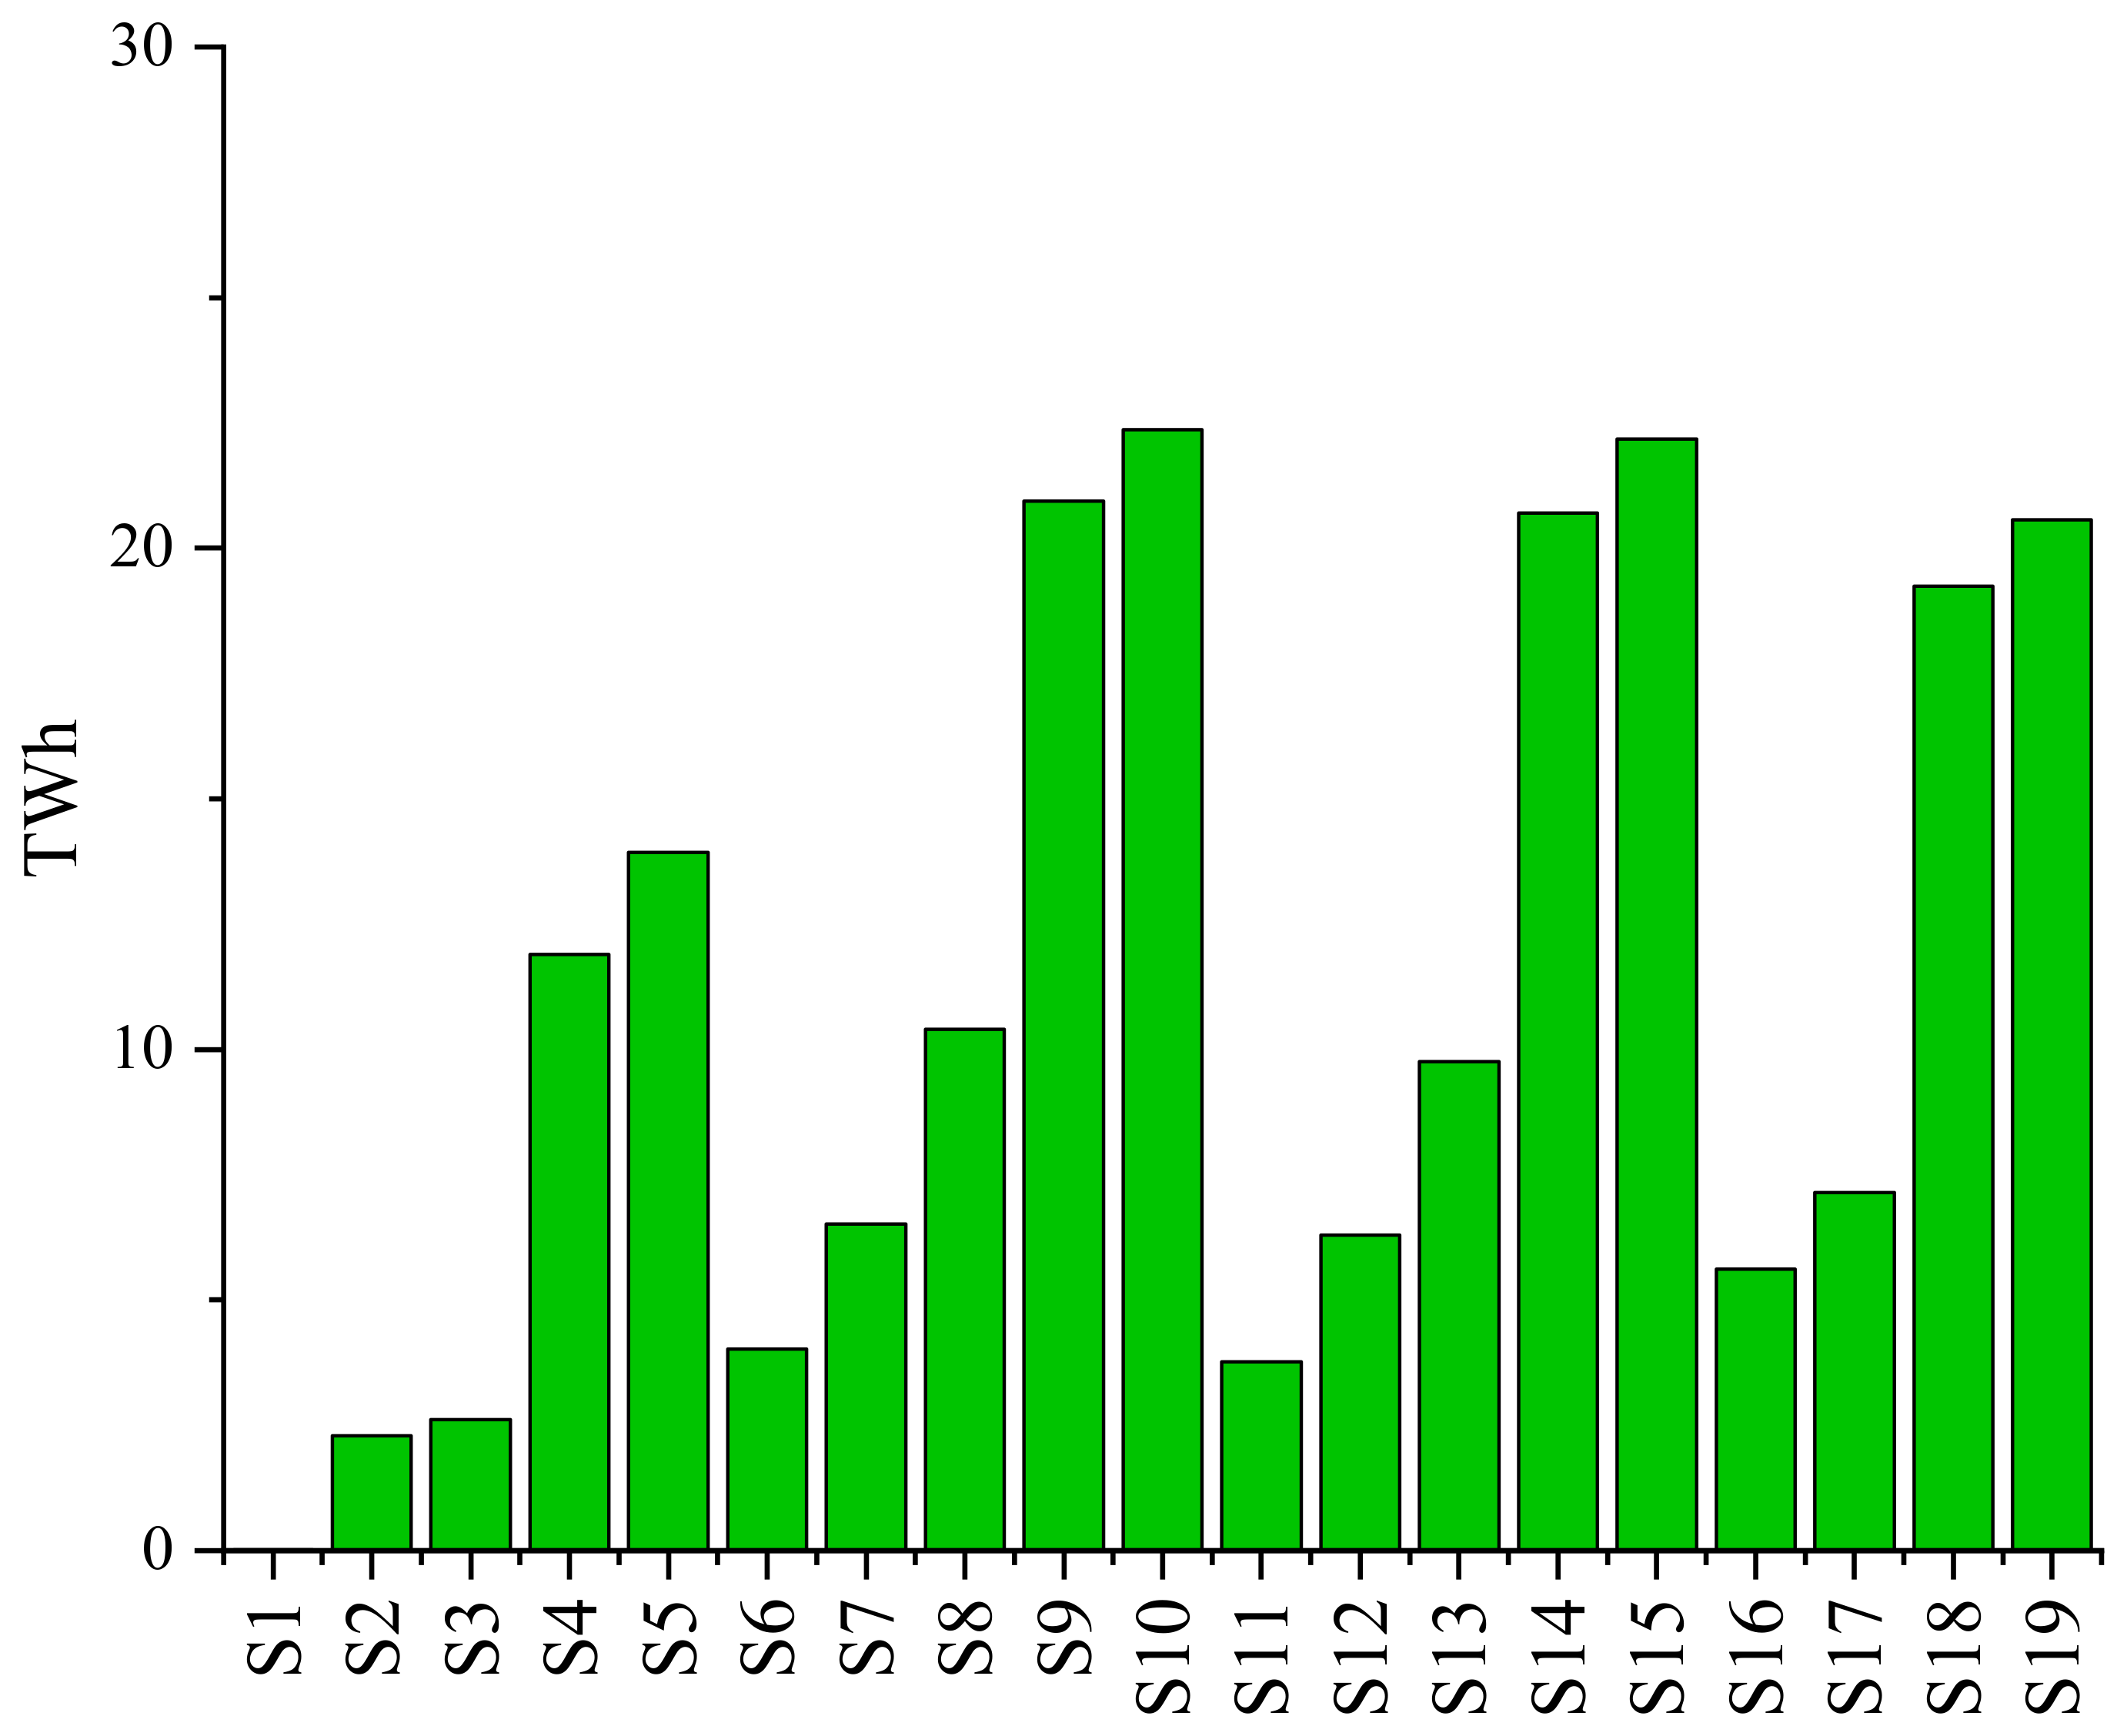
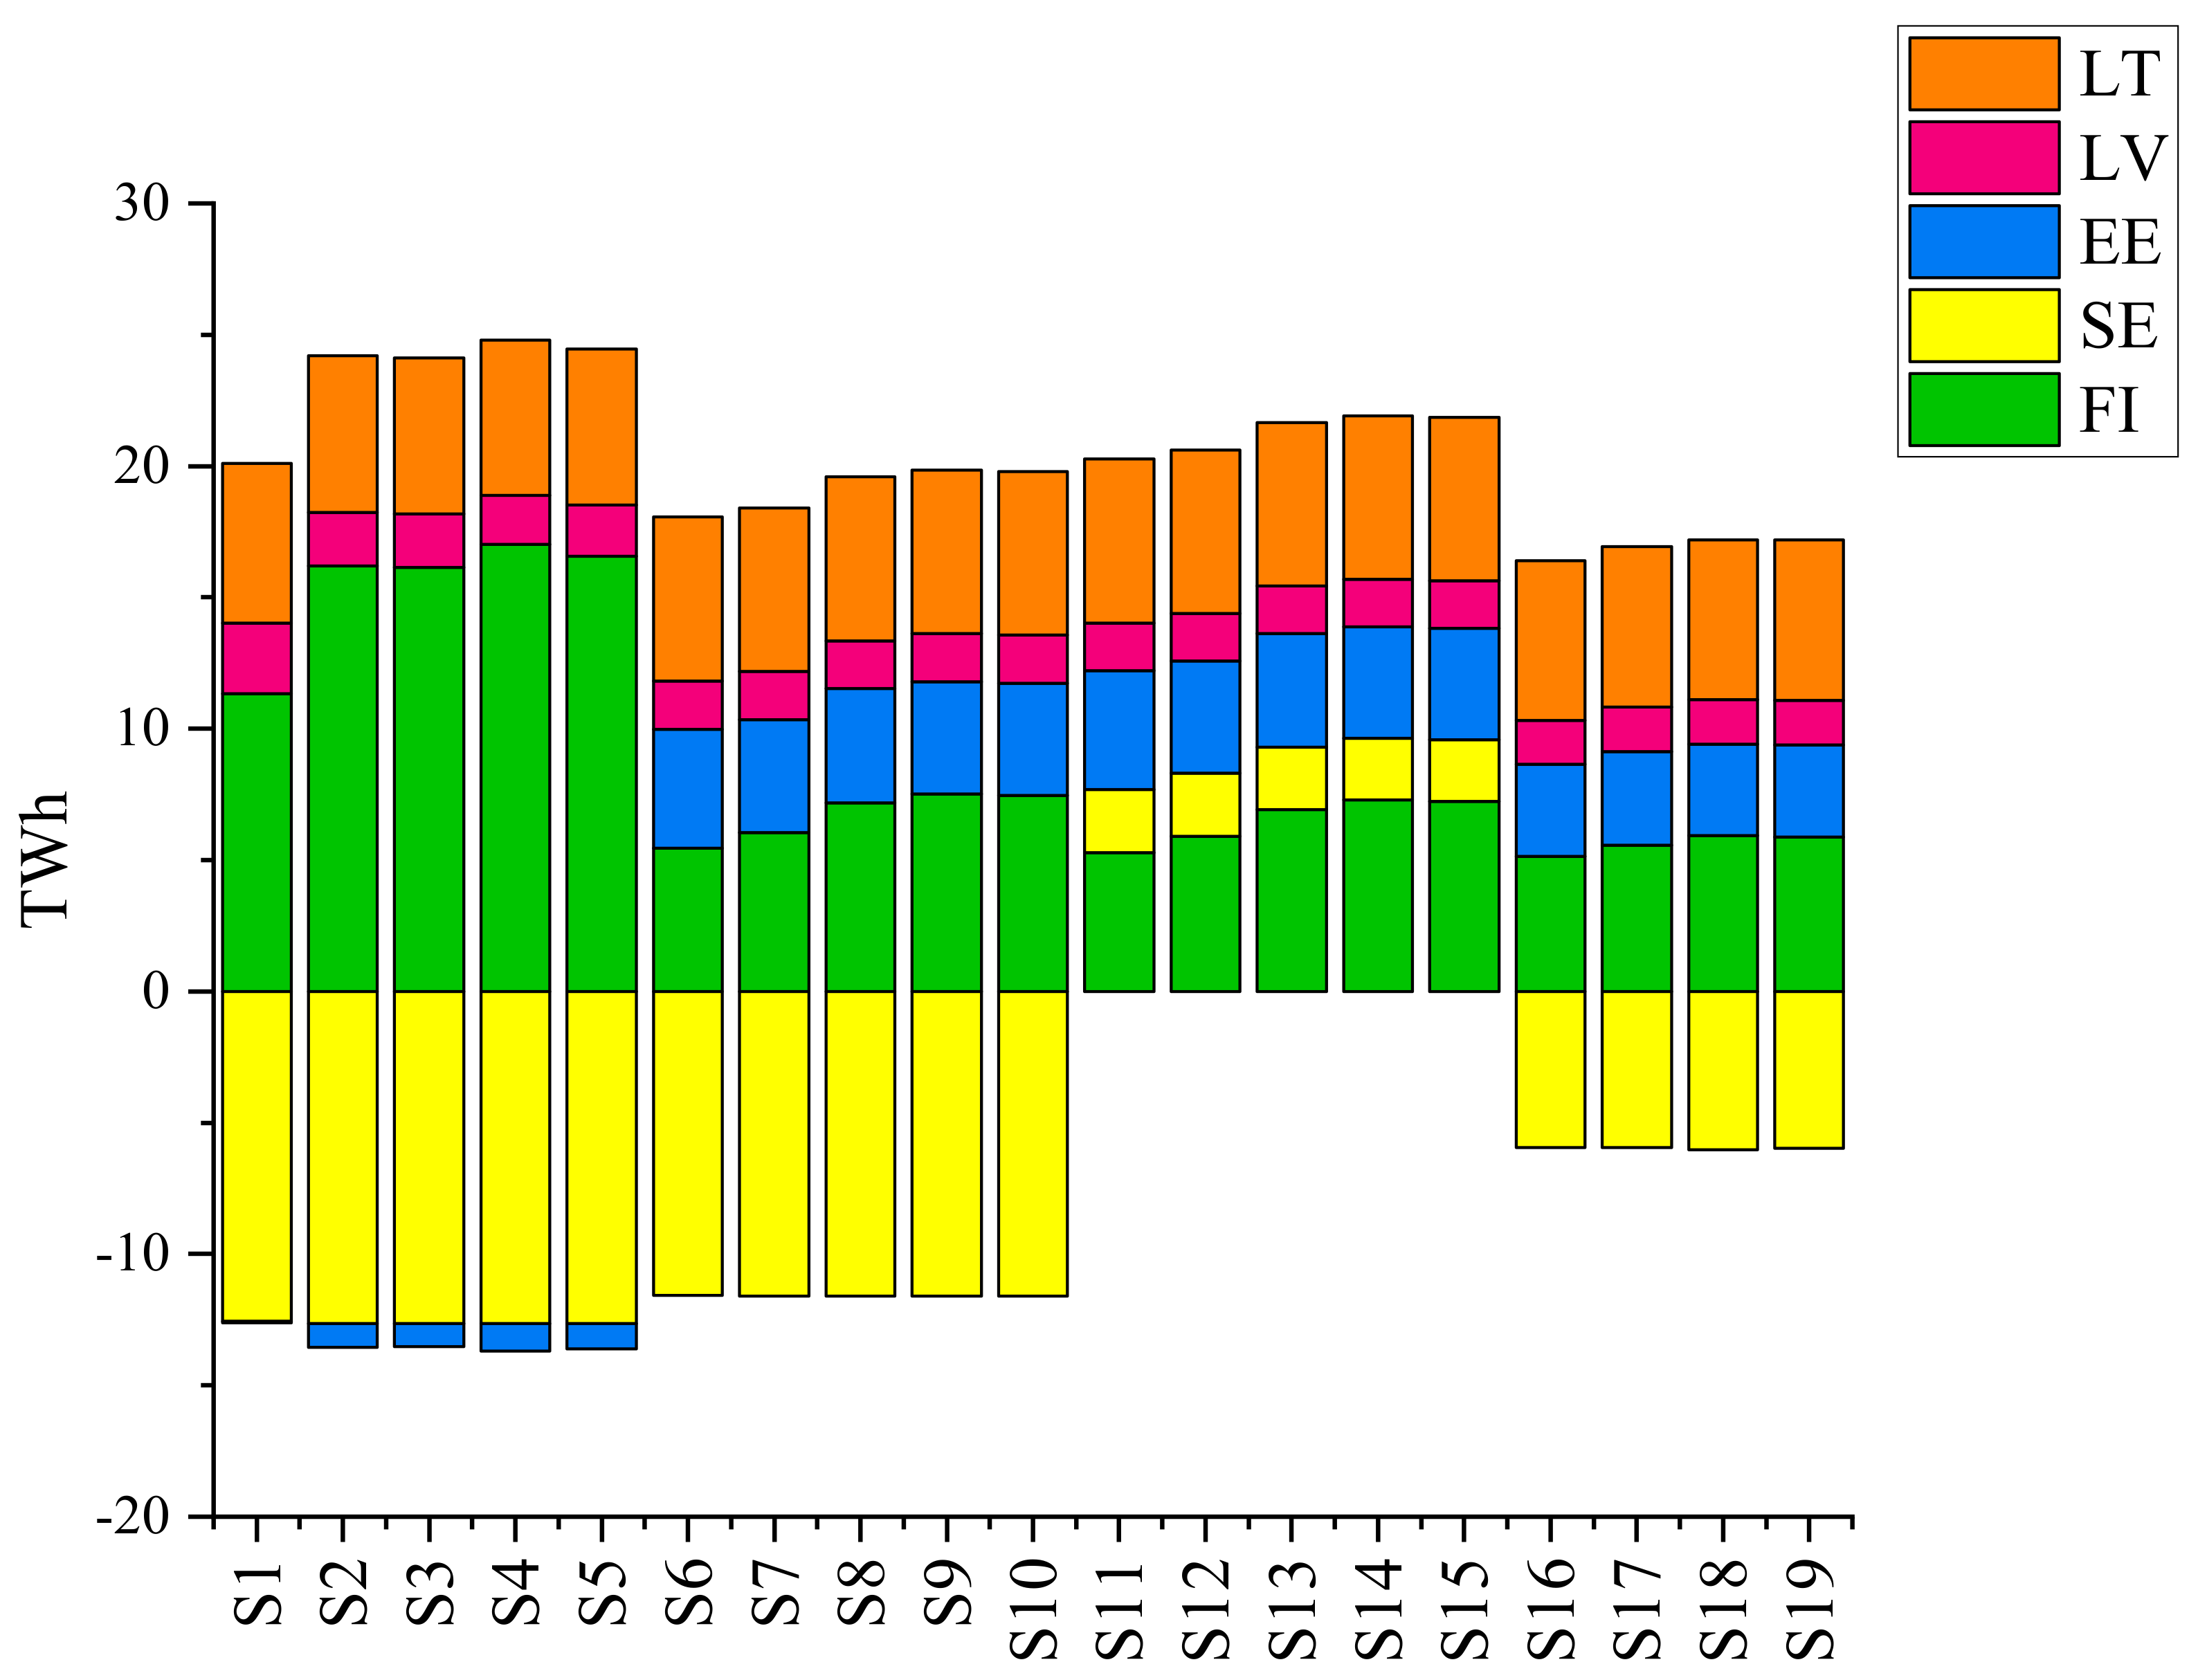
5.1. Changes in Electricity Supply and Prices
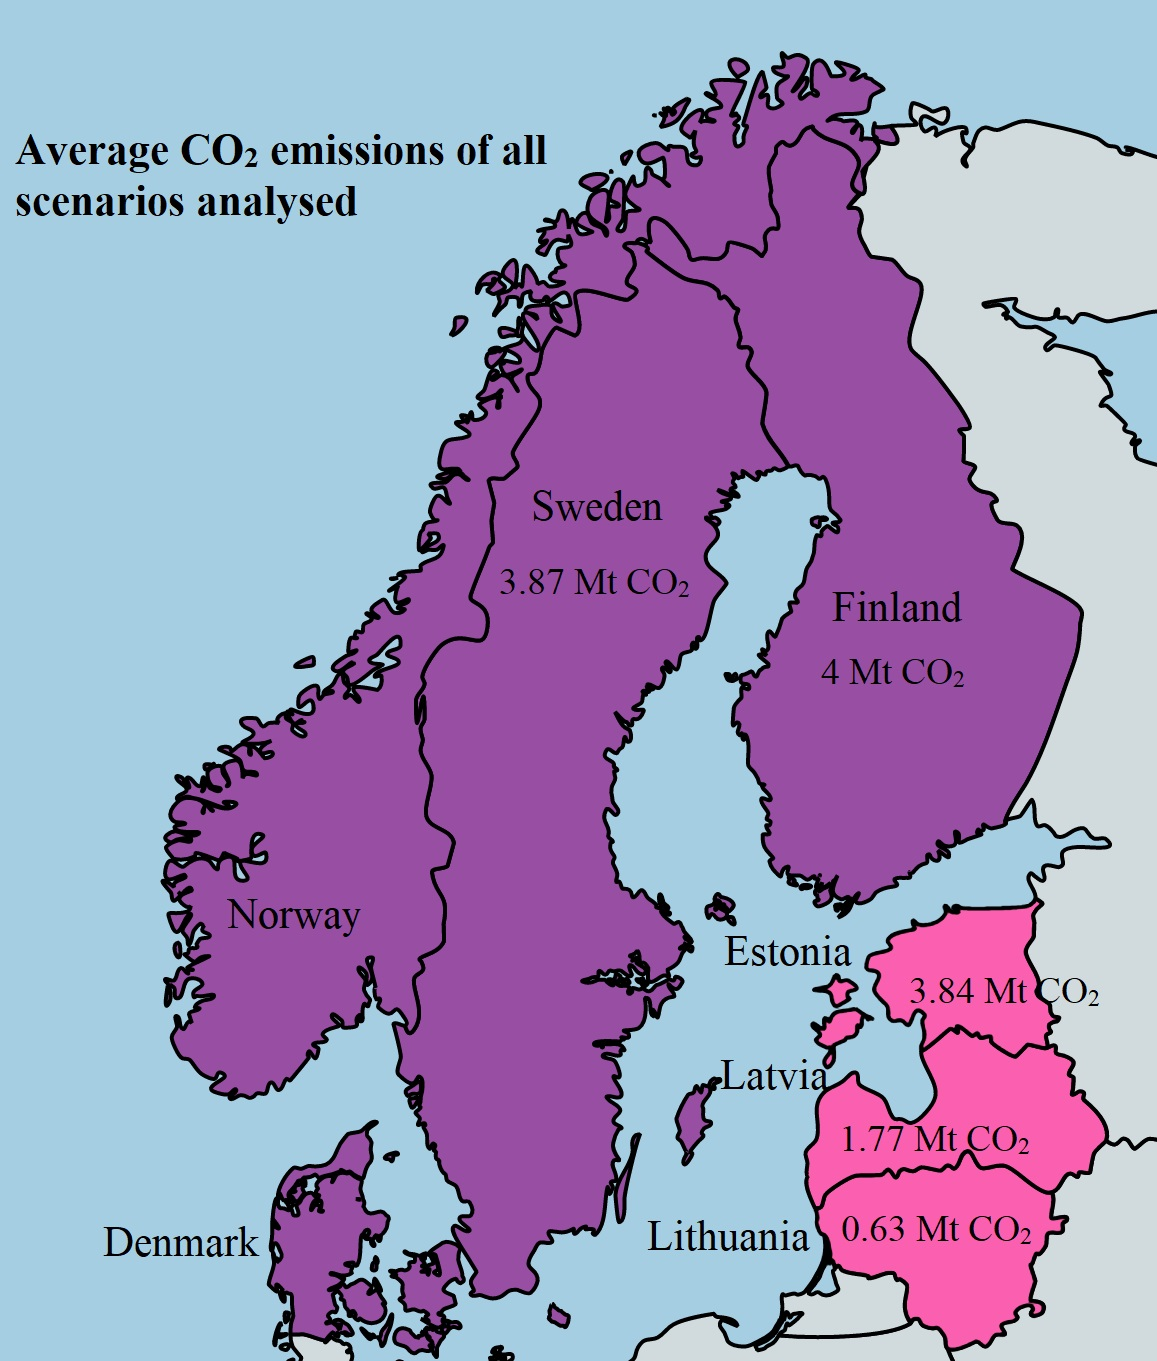
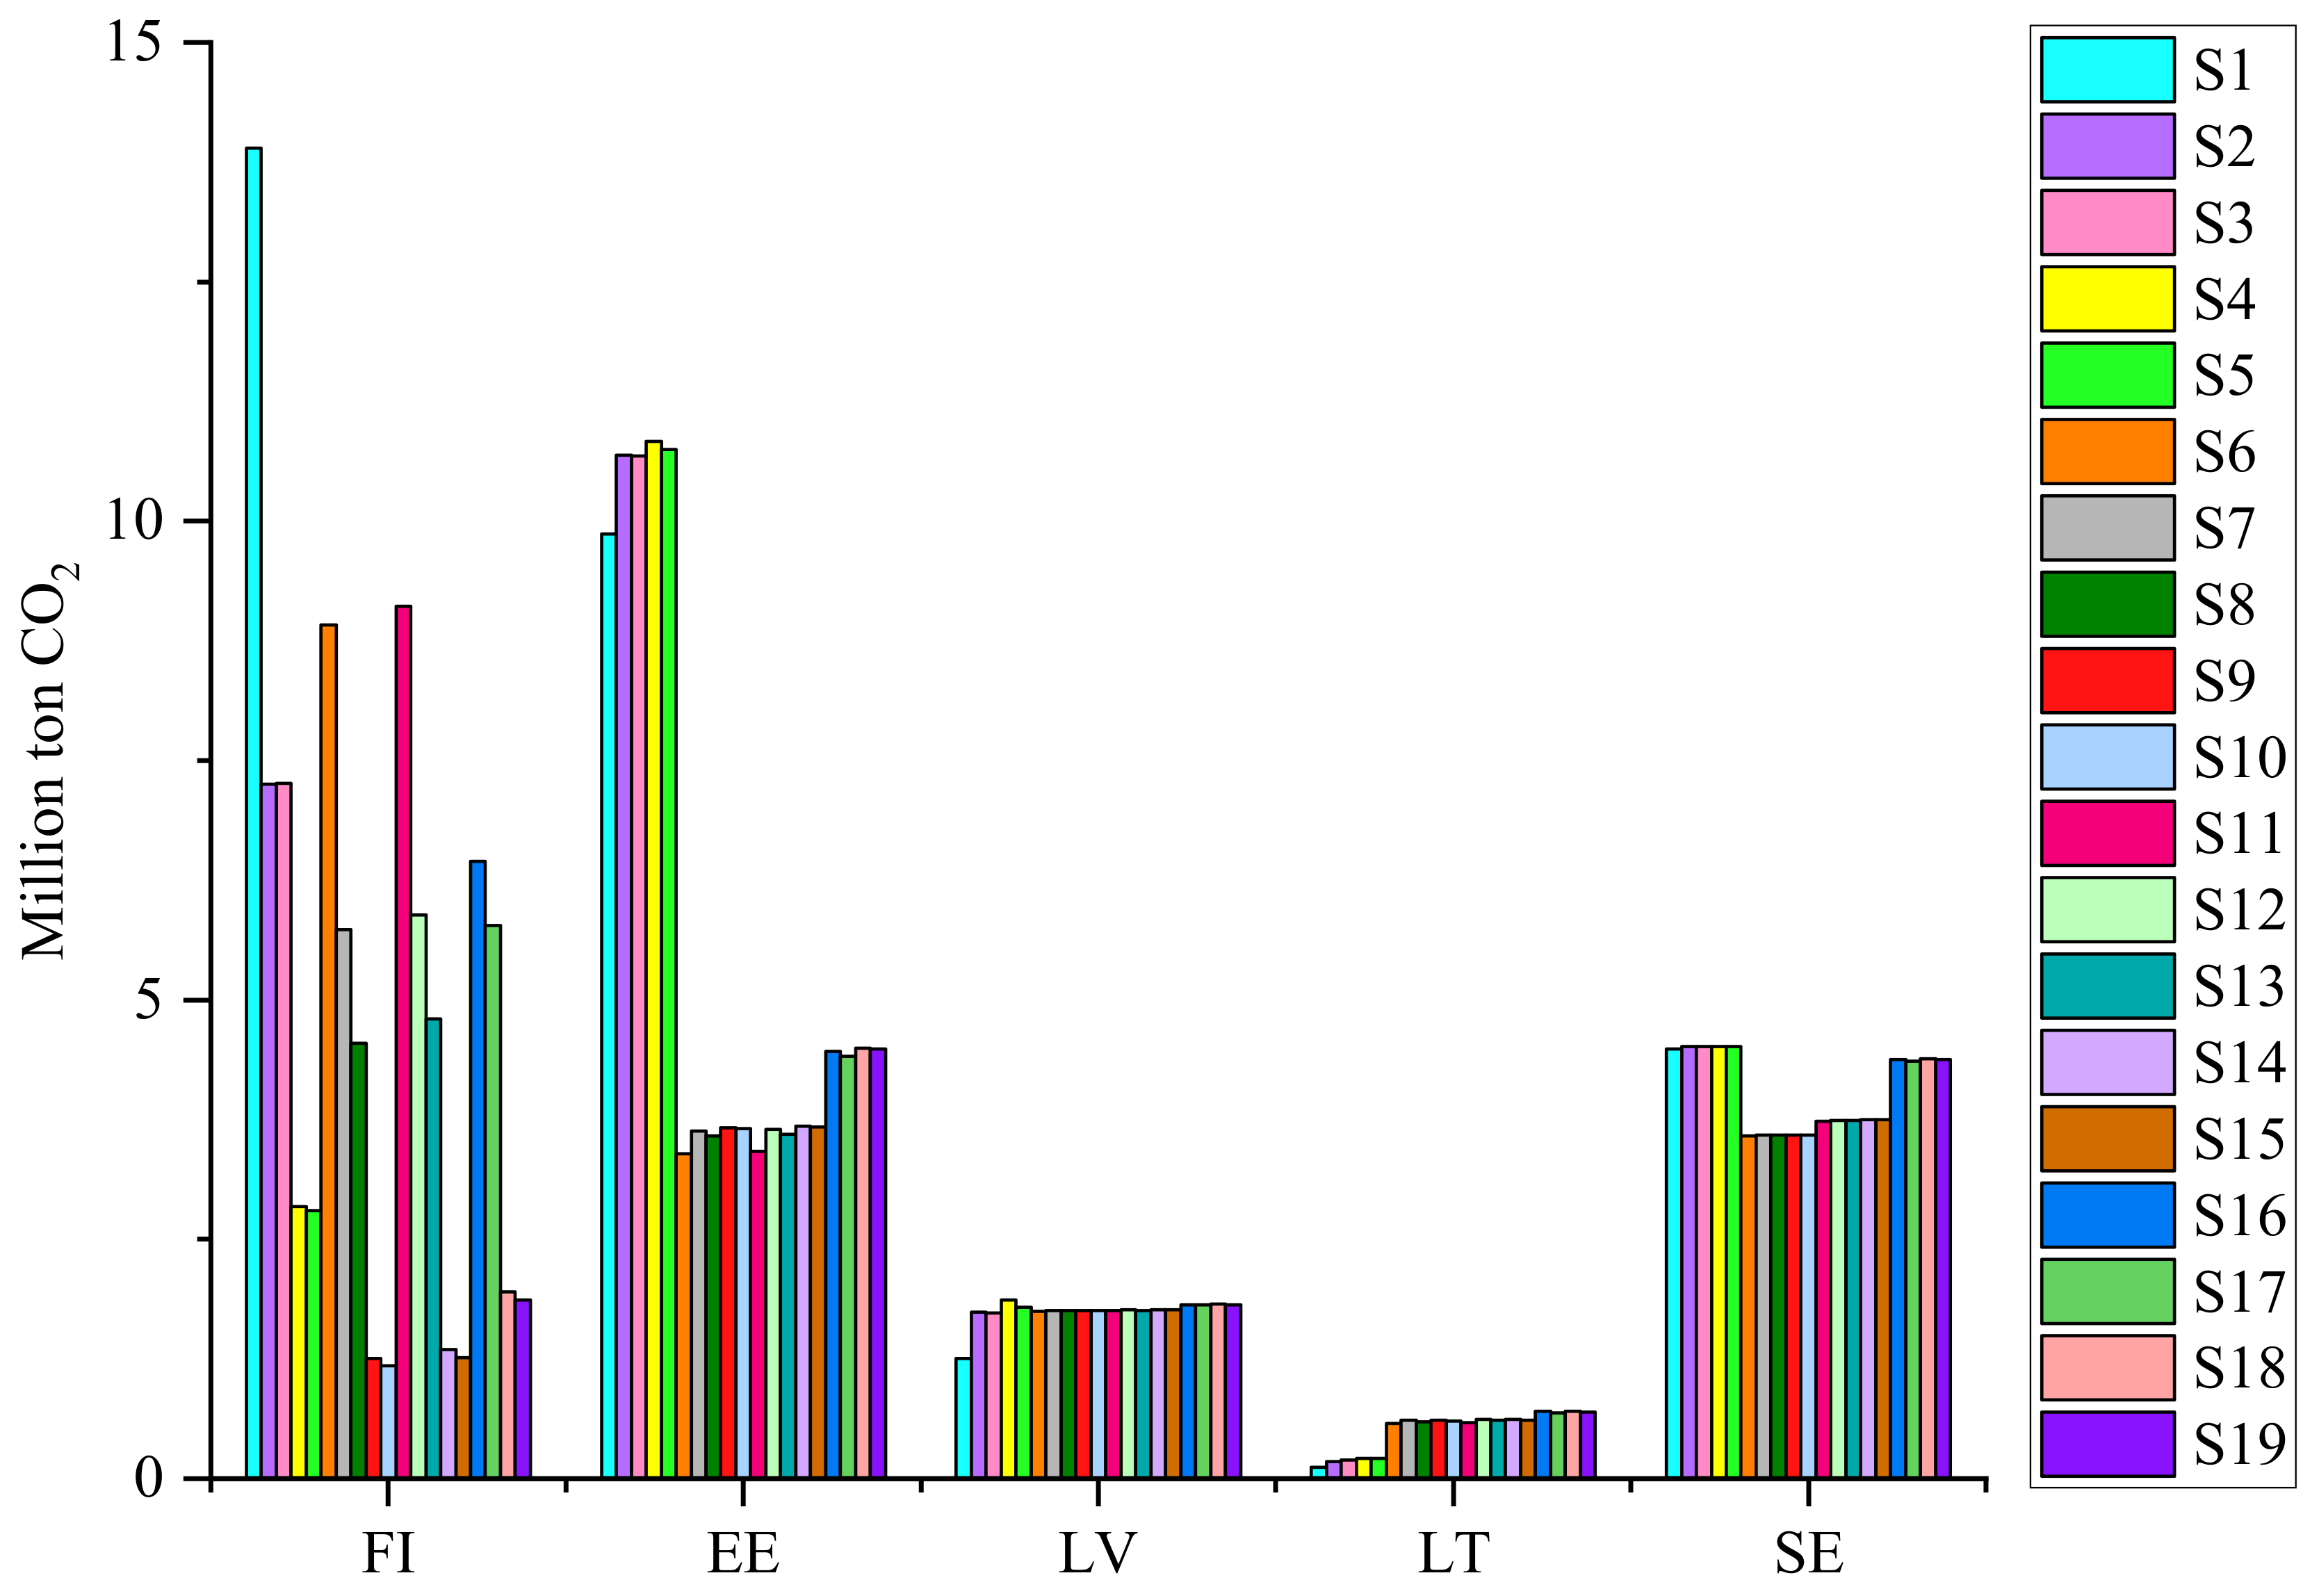
5.2. Impacts on CO2 Emissions
6. Discussion and Conclusions
Author Contributions
Acknowledgments
Conflicts of Interest
Appendix A

| FI | Wind | Hydro | Nuclear | Coal | Natural Gas | Oil | Peat | Biomass | Municipal Waste |
|---|---|---|---|---|---|---|---|---|---|
| S1 | 2.86 | 15.61 | 22.26 | 7.77 | 3.10 | 0.01 | 2.18 | 0.45 | 0.80 |
| S2 | 2.86 | 15.61 | 22.26 | 0.00 | 5.83 | 0.05 | 2.42 | 0.49 | 0.80 |
| S3 | 2.86 | 15.61 | 22.26 | 0.00 | 5.84 | 0.05 | 2.43 | 0.15 | 0.80 |
| S4 | 2.86 | 15.61 | 22.26 | 0.00 | 6.07 | 0.08 | 0.00 | 1.81 | 0.80 |
| S5 | 2.86 | 15.61 | 22.26 | 0.00 | 6.01 | 0.07 | 0.00 | 2.33 | 0.80 |
| S6 | 7.19 | 15.61 | 35.86 | 4.23 | 1.91 | 0.01 | 1.77 | 0.80 | 1.78 |
| S7 | 7.19 | 15.61 | 35.86 | 0.00 | 4.78 | 0.03 | 1.93 | 1.51 | 1.78 |
| S8 | 7.19 | 15.61 | 35.86 | 0.00 | 2.52 | 0.01 | 1.85 | 2.68 | 1.78 |
| S9 | 7.19 | 15.61 | 35.86 | 0.00 | 2.74 | 0.02 | 0.00 | 3.94 | 1.78 |
| S10 | 7.19 | 15.61 | 35.86 | 0.00 | 2.61 | 0.02 | 0.00 | 4.14 | 1.78 |
| S11 | 7.19 | 15.61 | 35.87 | 4.30 | 1.96 | 0.01 | 1.81 | 0.76 | 1.79 |
| S12 | 7.19 | 15.61 | 35.87 | 0.00 | 4.85 | 0.03 | 1.99 | 1.49 | 1.79 |
| S13 | 7.19 | 15.61 | 35.87 | 0.00 | 2.71 | 0.02 | 1.93 | 2.60 | 1.79 |
| S14 | 7.19 | 15.61 | 35.87 | 0.00 | 2.94 | 0.03 | 0.00 | 3.92 | 1.79 |
| S15 | 7.19 | 15.61 | 35.87 | 0.00 | 2.81 | 0.02 | 0.00 | 4.12 | 1.79 |
| S16 | 7.19 | 15.61 | 35.77 | 0.00 | 5.41 | 0.05 | 2.13 | 1.41 | 1.79 |
| S17 | 7.19 | 15.61 | 35.79 | 0.00 | 4.04 | 0.02 | 2.12 | 2.28 | 1.79 |
| S18 | 7.19 | 15.61 | 35.79 | 0.00 | 4.28 | 0.04 | 0.00 | 3.74 | 1.79 |
| S19 | 7.19 | 15.61 | 35.79 | 0.00 | 4.16 | 0.02 | 0.00 | 3.92 | 1.79 |

| Fuel | 2016 | 2030 | ||||||||
|---|---|---|---|---|---|---|---|---|---|---|
| FI | EE | LV | LT | SE | FI | EE | LV | LT | SE | |
| Biogas | 19 | 1 | 16 | - | 10 | 19 | 1 | 16 | - | 10 |
| Waste Liquors | 1 | - | - | - | 3 | 1 | - | - | - | 3 |
| Blastfurnace Gas | - | - | 1 | - | - | - | - | 1 | - | - |
| Forest Fuel wood | 21 | 12 | 7 | 1 | - | 25 | 12 | 7 | 1 | - |
| Fuel Oil | 34 | 41 | 41 | 41 | 34 | 42 | 42 | 42 | 42 | 42 |
| Hard Coal | 8 | 7 | 9 | - | 11 | 8 | 8 | 8 | - | 8 |
| Heavy Fuel Oil | 22 | 30 | 29 | 40 | 38 | 42 | 42 | 42 | 42 | 42 |
| Hydrogen | 1 | - | - | - | - | 1 | - | - | - | - |
| IndustryWood Residue | 21 | - | 3 | - | - | 25 | - | 3 | - | - |
| Kerosene | - | - | - | - | 26 | - | - | - | - | 26 |
| Landfill Gas | - | 1 | - | - | 10 | - | 1 | - | - | 10 |
| Light Fuel Oil | 34 | 41 | - | - | 34 | 42 | 42 | - | - | 42 |
| Milled Peat | 13 | 1 | - | - | 26 | 13 | 1 | - | - | 26 |
| Municipal Waste | 1 | 35 | 1 | - | 1 | 0 | 35 | 1 | - | -5 |
| Natural Gas | 21 | 28 | 26 1 | 30 | 35 | 24 | 24 | 24 | 24 | 24 |
| Oil Shale | - | 5 | - | - | - | - | 8 | - | - | - |
| Reaction Heat Of Industry | - | - | - | 1 | 1 | - | - | - | 1 | 1 |
| Refinery Gas | - | - | - | - | 7 | - | - | - | - | 7 |
| Sod Peat | 17 | - | - | - | 16 | 17 | - | - | - | 16 |
| Straw | - | 8 | 8 | - | - | - | 22 | 22 | - | - |
| Uranium Oxide | 2 | 1 | - | - | 2 | 2 | 1 | - | - | 2 |
| Wood Chips | - | - | 3 | - | 8 | - | - | 26 | - | 26 |
| Wood Pellet | 44 | - | 24 | - | 28 | 32 | - | 32 | - | 32 |
| Solid Fuel | - | - | - | 8 | - | - | - | - | 8 | - |
References
- UNFCCC. The Paris Agreement; UNFCCC: New York, NY, USA. Available online: https://unfccc.int/process-and-meetings/the-paris-agreement/the-paris-agreement (accessed on 13 March 2020).
- Amanatidis, G. European policies on climate and energy towards 2020, 2030 and 2050. 2019. Available online: www.europarl.europa.eu/supporting-analyses (accessed on 25 November 2019).
- IEA. Nordic Energy Technology Perspectives 2016: Cities, Flexibility and Pathways to Carbon-Neutrality; IEA: Paris, France, 2016. [Google Scholar]
- FINLEX FINLEX ®—Säädökset alkuperäisinä: Laki hiilen energiakäytön kieltämisestä 416/2019. Available online: https://www.finlex.fi/fi/laki/alkup/2019/20190416 (accessed on 14 January 2020).
- HELEN. Company Vuosaari Power Plants; HELEN: Helsinki, Finland. Available online: https://www.helen.fi/en/company/energy/energy-production/power-plants/vuosaari-power-plants (accessed on 14 January 2020).
- Fortum. All Inkoo coal-fired power plant boiler buildings have been demolished and 92% of the materials have been recycled; Fortum: Espoo, Finland. Available online: https://www.fortum.com/media/2019/12/all-inkoo-coal-fired-power-plant-boiler-buildings-have-been-demolished-and-92-materials-have-been-recycled (accessed on 14 January 2020).
- Fortum. Fortum’s Meri-Pori Power Plant Selected for Peak-Load Reserve Capacity System for the Period 1 July 2020–30 June 2022; Fortum: Espoo, Finland; Available online: https://www.fortum.com/media/2019/12/fortums-meri-pori-power-plant-selected-peak-load-reserve-capacity-system-period-1-july-2020-30-june-2022 (accessed on 11 February 2020).
- Energia Energiateollisuus. Available online: https://energia.fi/ (accessed on 14 January 2020).
- Moro, A.; Lonza, L. Electricity carbon intensity in European Member States: Impacts on GHG emissions of electric vehicles. Transp. Res. Part. Transp. Environ. 2018, 64, 5–14. [Google Scholar] [CrossRef] [PubMed]
- Purvins, A.; Fulli, G.; Covrig, C.-F.; Chaouachi, A.; Bompard, E.F.; Carpaneto, E.; Huang, T.; Pi, R.J.; Mutule, A.; Oleinikova, I.; et al. The Baltic Power System between East and West. Interconnections. First Results from a Security Analysis and Insights for Future Work; European Union Joint Research Centre: Brussels, Belgium, 2016; p. 52. [Google Scholar]
- Zakeri, B.; Virasjoki, V.; Syri, S.; Connolly, D.; Mathiesen, B.V.; Welsch, M. Impact of Germany’s energy transition on the Nordic power market – A market-based multi-region energy system model. Energy 2016, 115, 1640–1662. [Google Scholar] [CrossRef] [Green Version]
- Zakeri, B.; Price, J.; Zeyringer, M.; Keppo, I.; Mathiesen, B.V.; Syri, S. The direct interconnection of the UK and Nordic power market – Impact on social welfare and renewable energy integration. Energy 2018, 162, 1193–1204. [Google Scholar] [CrossRef] [Green Version]
- Newcomer, A.; Apt, J. Near-Term Implications of a Ban on New Coal-Fired Power Plants in the United States. Environ. Sci. Technol. 2009, 43, 3995–4001. [Google Scholar] [CrossRef] [PubMed] [Green Version]
- Lund, H.; Mathiesen, B.V. Energy system analysis of 100% renewable energy systems—The case ofDenmark in years 2030 and 2050. Energy 2009, 34, 524–531. [Google Scholar]
- Venkatesh, A.; Jaramillo, P.; Griffin, W.M.; Matthews, H.S. Implications of Near-Term Coal Power Plant Retirement for SO 2 and NO X and Life Cycle GHG Emissions. Environ. Sci. Technol. 2012, 46, 9838–9845. [Google Scholar] [CrossRef] [PubMed]
- Elliston, B.; MacGill, I.; Diesendorf, M. Comparing least cost scenarios for 100% renewable electricity with low emission fossil fuel scenarios in the Australian National Electricity Market. Renew. Energy 2014, 66, 196–204. [Google Scholar] [CrossRef]
- Heinrichs, H.U.; Markewitz, P. Long-term impacts of a coal phase-out in Germany as part of a greenhouse gas mitigation strategy. Appl. Energy 2017, 192, 234–246. [Google Scholar] [CrossRef]
- Pilpola, S.; Lund, P.D. Effect of major policy disruptions in energy system transition: Case Finland. Energy Policy 2018, 116, 323–336. [Google Scholar] [CrossRef]
- Hong, S.; Qvist, S.; Brook, B.W. Economic and environmental costs of replacing nuclear fission with solar and wind energy in Sweden. Energy Policy 2018, 112, 56–66. [Google Scholar] [CrossRef]
- Hansen, K.; Mathiesen, B.V.; Skov, I.R. Full energy system transition towards 100% renewable energy in Germany in 2050. Renew. Sustain. Energy Rev. 2019, 102, 1–13. [Google Scholar] [CrossRef]
- NORDPOOL. Day-Ahead Overview. Available online: https://www.nordpoolgroup.com/maps/ (accessed on 1 April 2020).
- European Commission. Final Report of the Sector Inquiry on Capacity Mechanisms; European Commission: Brussels, Belgium, 2016. [Google Scholar]
- World Energy Council (WEC). Energy Trilemma Index Tool. Available online: https://trilemma.worldenergy.org/ (accessed on 26 November 2019).
- European Commission. 2020 Climate & Energy Package. Available online: https://ec.europa.eu/clima/policies/strategies/2020_en (accessed on 1 April 2020).
- Dijkstra, L.; Athanasoglou, S. The Europe 2020 Index: The Progress of Europe Countries, Regions And Cities To The 2020 Targets; European Commission, Regional and Urban Policy: Brussels, Belgium, 2015. [Google Scholar]
- European Commission. 2030 Climate & Energy Framework. Available online: https://ec.europa.eu/clima/policies/strategies/2030_en (accessed on 27 January 2020).
- European Commission. EU Emissions Trading System (EU ETS). Available online: https://ec.europa.eu/clima/policies/ets_en (accessed on 27 January 2020).
- IEA. Data & Statistics. Available online: https://www.iea.org/data-and-statistics (accessed on 27 January 2020).
- OECD. Compare your Country—Climate Change Mitigation Policies. Available online: //www.compareyourcountry.org/climate-policies?lg=en (accessed on 10 February 2020).
- Statistics Finland. Statistics Finland—Energy Supply and Consumption. Available online: https://www.stat.fi/til/ehk/2018/04/ehk_2018_04_2019-03-28_tie_001_en.html (accessed on 27 January 2020).
- Ministry of Economic Affairs and Employment of Finland. Government Report on the National Energy and Climate Strategy for 2030; Ministry of Economic Affairs and Employment of Finland: Helsinki, Finland, 2017. [Google Scholar]
- Statistics Finland. Electricity and heat production by production mode and fuel in 2016. Available online: https://www.stat.fi/til/salatuo/2016/salatuo_2016_2017-11-02_tau_001_en.html (accessed on 25 November 2019).
- THE World Bank. Population-European Union Data. Available online: https://data.worldbank.org/indicator/SP.POP.TOTL?locations=EU (accessed on 10 February 2020).
- Eurostat GDP and main components. Available online: http://appsso.eurostat.ec.europa.eu/nui/show.do?query=BOOKMARK_DS-406763_QID_1F4AE322_UID_-3F171EB0&layout=TIME,C,X,0;GEO,L,Y,0;UNIT,L,Z,0;NA_ITEM,L,Z,1;INDICATORS,C,Z,2;&zSelection=DS-406763UNIT,CP_MEUR;DS-406763INDICATORS,OBS_FLAG;DS-406763NA_ITEM,B1GQ;&rankName1=TIME_1_0_0_0&rankName2=UNIT_1_2_-1_2&rankName3=GEO_1_2_0_1&rankName4=INDICATORS_1_2_-1_2&rankName5=NA-ITEM_1_2_-1_2&sortC=ASC_-1_FIRST&rStp=&cStp=&rDCh=&cDCh=&rDM=true&cDM=true&footnes=false&empty=false&wai=false&time_mode=NONE&time_most_recent=false&lang=EN&cfo=%23%23%23%2C%23%23%23.%23%23%23 (accessed on 10 February 2020).
- Ministry of the Environment and Energy, Government Offices of Sweden. Sweden’s Draft Integrated National Energy and Climate Plan; Ministry of the Environment and Energy, Government Offices of Sweden: Stockholm, Sweden, 2018.
- Ministry of Economic Affairs and Communications of Republic of Estonia. National Development Plan. of the Energy Sector until 2030; Ministry of Economic Affairs and Communications of Republic of Estonia: Tallinn, Estonia, 2017; pp. 1–124. [Google Scholar]
- European Commission. National Energy and Climate Plan of Latvia 2021–2030; European Commission: Brussels, Belgium, 2018. [Google Scholar]
- Ministry of Energy, Ministry of Environment of the Republic of Lithuania. Integrated National Energy and Climate Plan of the Republic of Lithuania 2018; European Commission: Brussels, Belgium, 2018. [Google Scholar]
- European Commission. Summary of the Commission assessment of the draft National Energy and Climate Plan 2021–2030; European Commission: Brussels, Belgium, 2018. [Google Scholar]
- European Commission. Commission Recommendation on the draft integrated National Energy and Climate Plan of Estonia covering the period 2021–2030; European Commission: Brussels, Belgium, 2019. [Google Scholar]
- Renã-Fãlt, B.M.; Jansson, R.; Nilsson, C. Effects of hydropower generation and opportunities for environmental flow management in Swedish riverine ecosystems: Hydropower and environmental flow management. Freshw. Biol. 2010, 55, 49–67. [Google Scholar] [CrossRef]
- Finnish Ministry of Economic Affairs and Employment. Taustaraportti Kansalliselle Energia-ja Ilmastostrategialle Vuoteen 2030 (Background Report for the National Energy and Climate Strategy Until Year 2030); Finnish Ministry of Economic Affairs and Employment: Helsinki, Finland, 2017. [Google Scholar]
- Jääskeläinen, J.; Zakeri, B.; Syri, S. Adequacy of power capacity during winter peaks in Finland. In Proceedings of the 2017 14th International Conference on the European Energy Market (EEM), Dresden, Germany, 6–9 June 2017; pp. 1–6. [Google Scholar]


| Country | Index Rank | Energy Security Rank | Energy Equity Rank | Environmental Sustainability Rank |
|---|---|---|---|---|
| Sweden (SE) | 2 | 1 | 40 | 3 |
| Denmark (DK) | 3 | 2 | 28 | 2 |
| Finland (FI) | 5 | 3 | 33 | 28 |
| Norway (NO) | 11 | 73 | 20 | 5 |
| Latvia (LV) | 22 | 4 | 60 | 25 |
| Estonia (EE) | 30 | 31 | 38 | 63 |
| Lithuania (LT) | 36 | 74 | 51 | 21 |
| Country | Carbon Intensities of Gross Electricity Production (Combustion Only) (g/KWh) |
|---|---|
| Finland (FI) | 171 |
| Sweden (SE) | 16 |
| Estonia (EE) | 1020 |
| Latvia (LV) | 134 |
| Lithuania (LT) | 204 |
| Norway (NO) | 8 |
| Denmark (DK) | 316 |
| Poland (PL) | 770 |
| Policy Outcome | EU | Latvia |
|---|---|---|
| GHG emission reduction target (% compared to 1990) | −40 | −55 |
| Non-ETS activities (% compared to 2005) | −30 | −6 |
| ETS activities (% compared to 2005) | −43 | - |
| Share of energy produced from RES in gross final energy consumption (%) | 32 | 45 |
| Share of energy produced from RES in gross final energy consumption in transport (%) | 14 | 14 |
| Share of advanced biofuels in gross final energy consumption in transport | 3.5 | 3.5 |
| Increase in energy efficiency (%) | 32.5 | - |
| Target | EU | Lithuania |
|---|---|---|
| GHG reduction targets according to KP Doha amendment and Paris agreement compared to 1990 level | At least −40% | EU level target |
| GHG reduction targets in ETS sectors compared to the 2005 level | −43% | EU level target |
| GHG reduction targets in non-ETS sectors compared to 2005 level | −30% | −9% |
| RES utilization target in final energy | 27% | 45% |
| RES utilization target in transport | 14% | 15% |
| Interconnectivity level | 15% | EU level target |
| Energy Efficiency targets | 27.3% | Energy intensity 1.5 times lower than in 2017 |
| Target | EU | FI | SE | EE | LV | LT |
|---|---|---|---|---|---|---|
| Population (million) | 512 | 5.5 | 10 | 1 | 2 | 2 |
| GDP (million Euro) | 15,890,000 | 234.37 | 471.21 | 26.04 | 29.15 | 45.26 |
| GHG targets in non-ETS sectors compared to 2005 level | −30% | −39% | −50%–−59% | −13% | −6% | −9% |
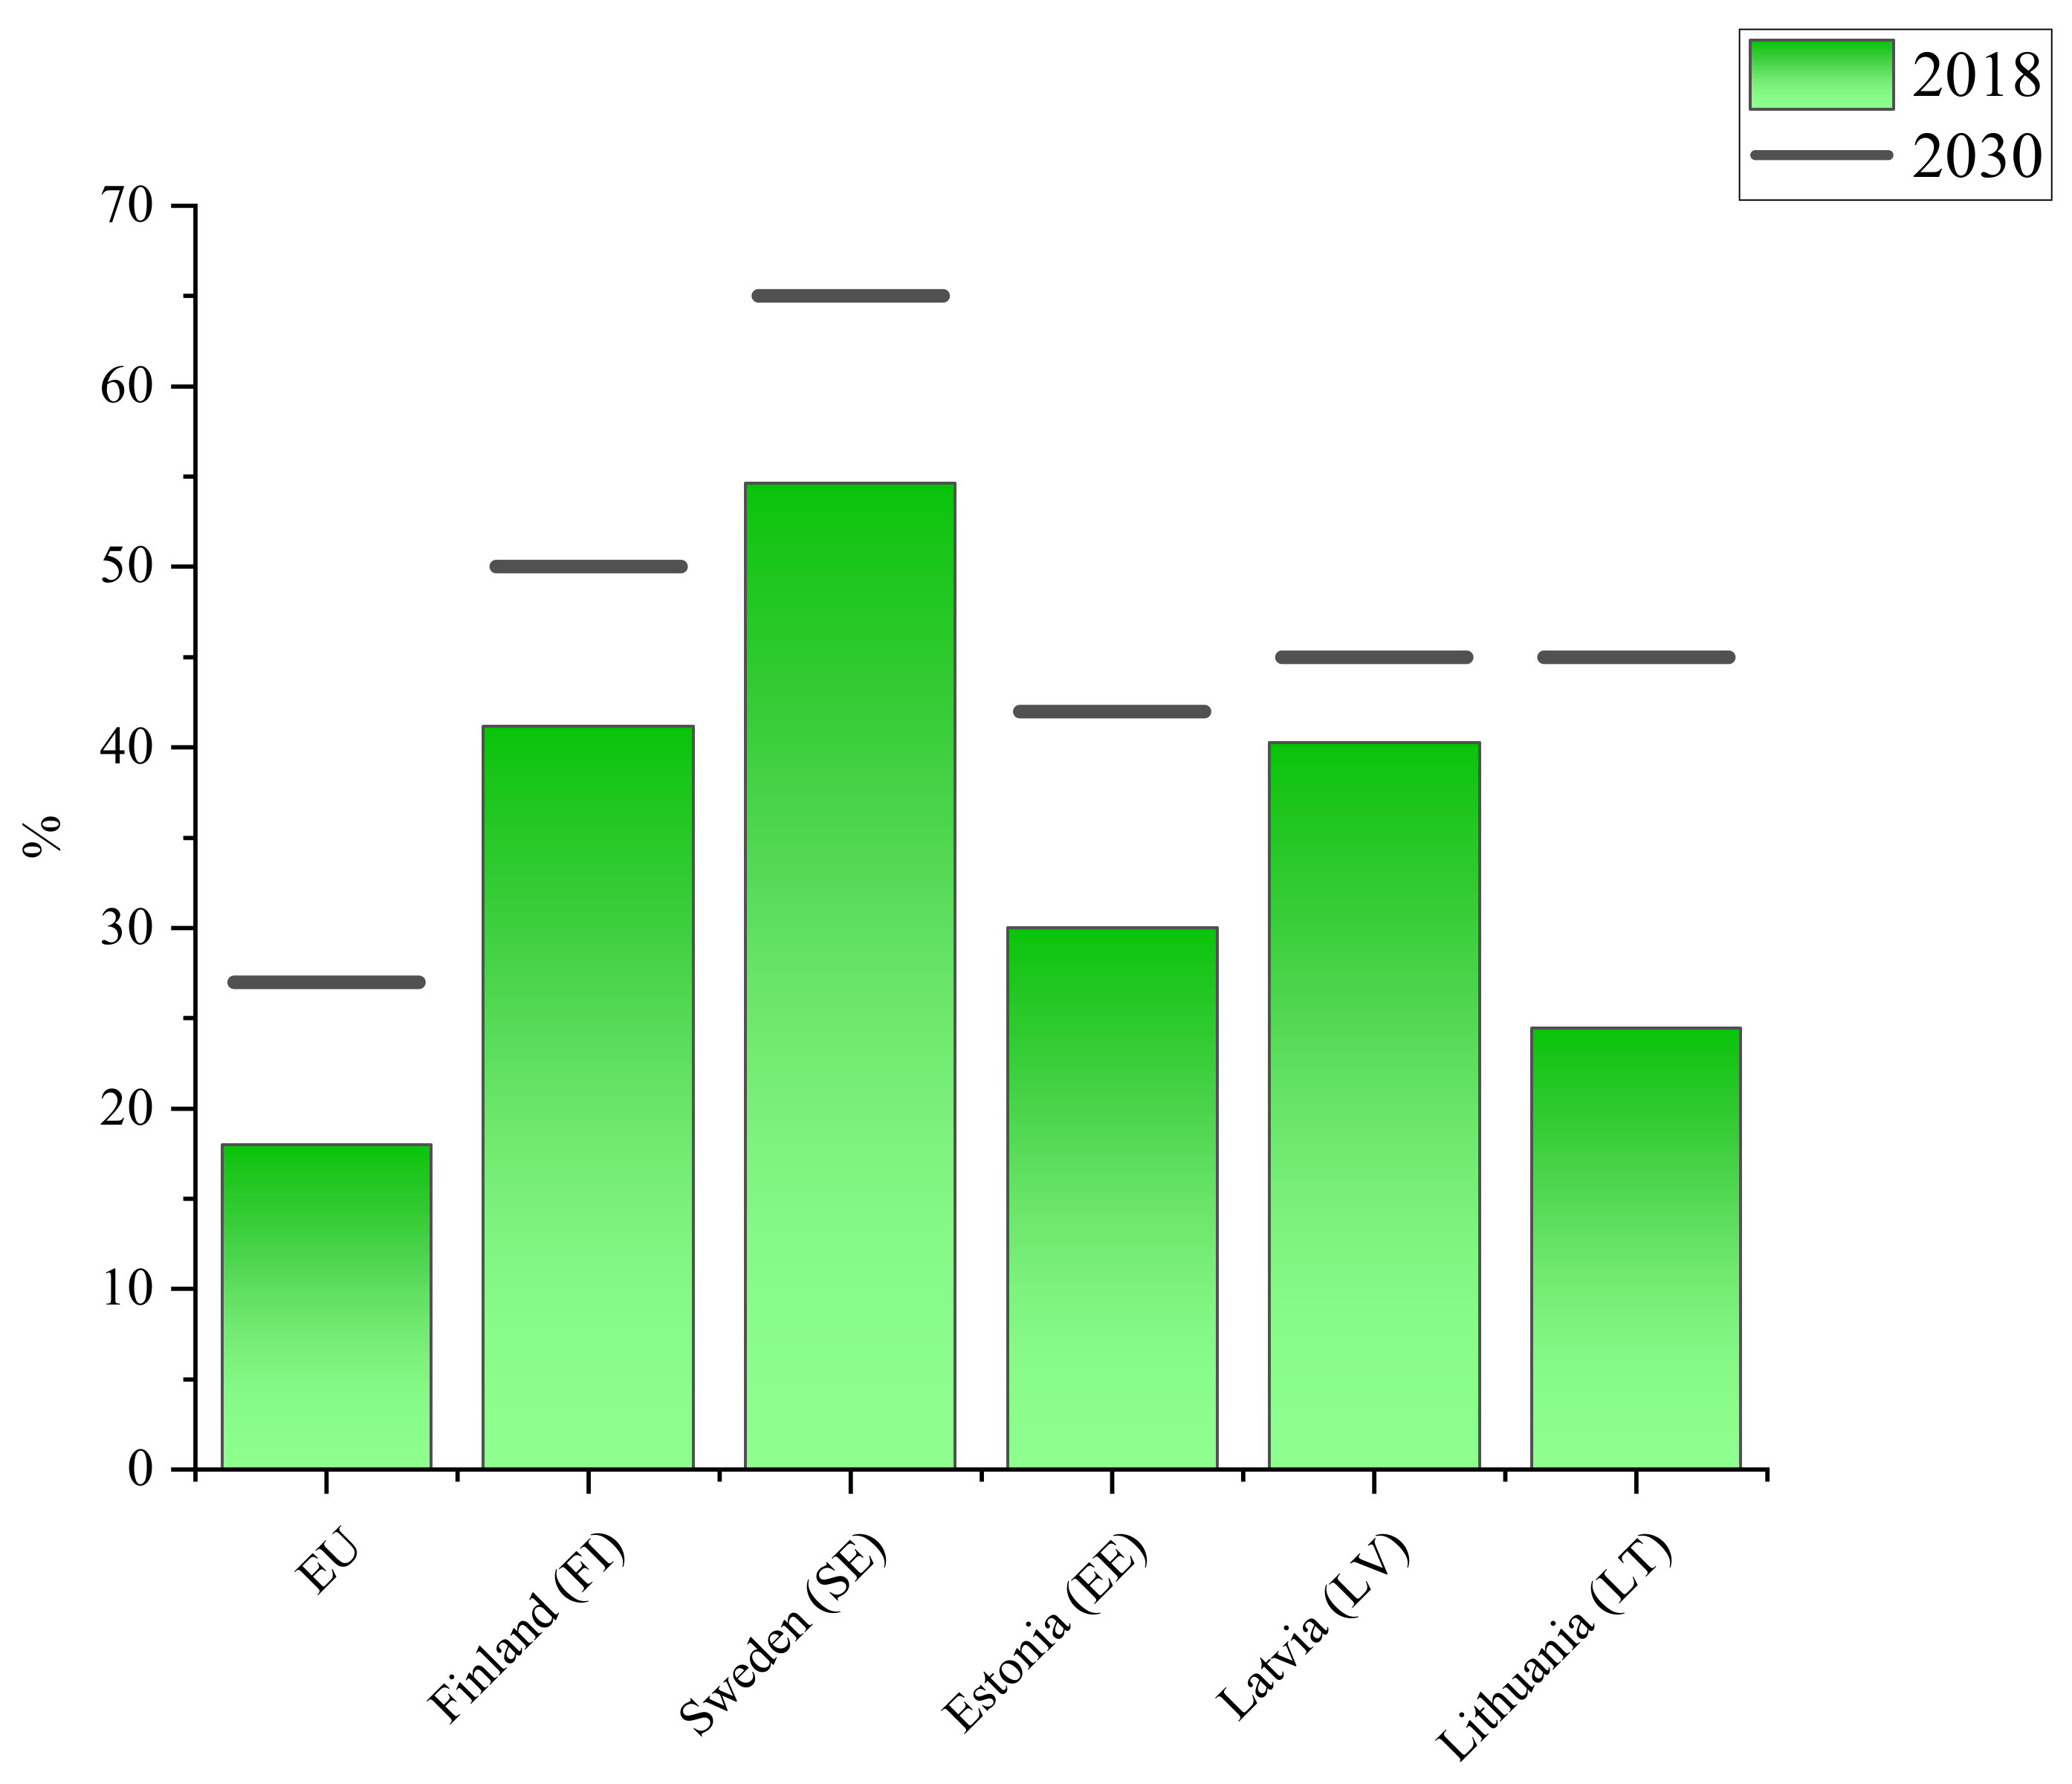
| RES utilization target in final energy | 27% | >50% | 65% | 42% | 45% | 45% |
| No. | Year | Scenario Description for Finland | |
|---|---|---|---|
| Removed | Added | ||
| 1 | 2016 | - | - |
| 2 | Coal | - | |
| 3 | Coal | Biomass | |
| 4 | Coal + peat | Biomass instead of Coal | |
| 5 | Coal + peat | Biomass | |
| 6 | 2030-constant nuclear for SE | - | - |
| 7 | Coal | - | |
| 8 | Coal | Biomass | |
| 9 | Coal + peat | Biomass instead of Coal | |
| 10 | Coal + peat | Biomass | |
| 11 | 2030-DECREASE Nuclear for SE | - | - |
| 12 | Coal | - | |
| 13 | Coal | Biomass | |
| 14 | Coal + peat | Biomass instead of Coal | |
| 15 | Coal + peat | Biomass | |
| 16 | 2030-DECREASE Nuclear for SE, Connection with Norway excluded, Norway’s net import is considered constant at 2016 level | Coal | - |
| 17 | Coal | Biomass | |
| 18 | Coal + peat | Biomass instead of Coal | |
| 19 | Coal + peat | Biomass | |
| Year | Country | Electricity Demand | Capacity (MW) | |||||||
|---|---|---|---|---|---|---|---|---|---|---|
| (TWh) | Wind | PV | Hydro | Nuclear | IndustrialCHP | CHP | Other Thermal | Reserve | ||
| 2016 | FI | 84 | 1 753 | - | 3 112 | 2 788 | 1972 | 3471 | 655 | 1575 |
| SE | 138 | 6 417 | 103 | 16 909 | 9 139 | - | 3735 | 1878 | 705 | |
| EE | 8 | 331 | - | 8 | - | - | - | 1633 | 250 | |
| LV | 7 | 70 | - | 1 565 | - | - | 1096 | 400 | - | |
| LT | 11 | 509 | 70 | 127 | - | - | 1098 | 755 | 900 | |
| FI_S2 | 84 | 1 753 | - | 3 112 | 2 788 | 1783 | 2534 | 90 | 1337 | |
| FI_S3 | 84 | 1 753 | - | 3 112 | 2 788 | 1972 | 4036 | 90 | 1575 | |
| FI_S4 | 84 | 1 753 | - | 3 112 | 2 788 | 1897 | 3161 | 90 | 1575 | |
| FI_S5 | 84 | 1 753 | - | 3 112 | 2 788 | 1972 | 4036 | 90 | 1575 | |
| 2030 | FI | 92 | 3252 | - | 3 112 | 4 388 | 1972 | 5106 | 397 | 1532 |
| SE | 141 | 9 013 | 103 | 16 742 | 6 949 1 | 1982 | 3097 | 771 | 705 | |
| EE | 10 | 445 | - | 8 | - | - | - | 1182 | 250 | |
| LV | 9.5 | 310 | - | 1 589 | - | - | 584 | 19 | - | |
| LT | 14 | 800 | 80 | 141 | - | - | 498 | 343 | 900 | |
| FI_S7 | 92 | 3252 | - | 3 112 | 4 388 | 1972 | 4124 | 397 | 1421 | |
| FI_S8 | 92 | 3252 | - | 3 112 | 4 388 | 1972 | 5106 | 397 | 1532 | |
| FI_S9 | 92 | 3252 | - | 3 112 | 4 388 | 1972 | 4084 | 397 | 1532 | |
| FI_10 | 92 | 3252 | - | 3 112 | 4 388 | 1972 | 5106 | 397 | 1532 | |
| CO2 Emission (Mt CO2) | Sweden Net Import from Selected Countries (TWh) | Net Import | CO2 Emission (Mt CO2) PL Prices 2016 | Sweden Net Import from Selected Countries (TWh) | Net Import | |||||||||||||||||
|---|---|---|---|---|---|---|---|---|---|---|---|---|---|---|---|---|---|---|---|---|---|---|
| Scenarios | FI | EE | LV | LT | SE | Total | DK | NO | DE | PL | Region (TWh) | FI | EE | LV | LT | SE | Total | DK | NO | DE | PL | Region (TWh) |
| S1 | 13.90 | 9.87 | 1.26 | 0.12 | 4.49 | 29.63 | 2.40 | 9.02 | −0.69 | −3.21 | 7.49 | |||||||||||
| S2 | 7.26 | 10.69 | 1.74 | 0.18 | 4.52 | 24.38 | 3.72 | 10.46 | −0.46 | −3.09 | 10.67 | |||||||||||
| S3 | 7.26 | 10.68 | 1.73 | 0.20 | 4.51 | 24.39 | 3.70 | 10.41 | −0.46 | −3.10 | 10.60 | |||||||||||
| S4 | 2.84 | 10.84 | 1.87 | 0.22 | 4.52 | 20.28 | 3.88 | 10.68 | −0.43 | −3.09 | 11.11 | |||||||||||
| S5 | 2.80 | 10.75 | 1.79 | 0.21 | 4.51 | 20.07 | 3.81 | 10.53 | −0.45 | −3.10 | 10.86 | |||||||||||
| S6 | 8.92 | 3.40 | 1.75 | 0.58 | 3.58 | 18.23 | 5.12 | 11.28 | −4.57 | −5.09 | 6.49 | 8.84 | 3.05 | 1.70 | 0.52 | 3.55 | 17.65 | 3.78 | 10.28 | −4.63 | −3.01 | 6.77 |
| S7 | 5.74 | 3.63 | 1.75 | 0.61 | 3.59 | 15.32 | 5.23 | 11.45 | −4.56 | −5.09 | 6.80 | 5.70 | 3.29 | 1.70 | 0.54 | 3.55 | 14.79 | 3.89 | 10.42 | −4.62 | −3.00 | 7.06 |
| S8 | 4.55 | 3.58 | 1.75 | 0.60 | 3.59 | 14.07 | 5.75 | 12.09 | −4.56 | −5.08 | 7.98 | 4.50 | 3.23 | 1.70 | 0.53 | 3.55 | 13.51 | 4.41 | 11.09 | −4.62 | −2.98 | 8.28 |
| S9 | 1.25 | 3.67 | 1.76 | 0.61 | 3.59 | 10.87 | 5.79 | 12.26 | −4.55 | −5.08 | 8.22 | 1.21 | 3.32 | 1.70 | 0.54 | 3.55 | 10.33 | 4.46 | 11.23 | −4.61 | −2.97 | 8.51 |
| S10 | 1.18 | 3.65 | 1.75 | 0.60 | 3.59 | 10.78 | 5.82 | 12.20 | −4.56 | −5.08 | 8.17 | 1.14 | 3.30 | 1.70 | 0.54 | 3.55 | 10.23 | 4.48 | 11.19 | −4.62 | −2.97 | 8.47 |
| S11 | 9.11 | 3.42 | 1.76 | 0.59 | 3.73 | 18.60 | 11.18 | 18.30 | −4.20 | −4.85 | 20.28 | 9.01 | 3.06 | 1.70 | 0.52 | 3.65 | 17.95 | 9.70 | 17.28 | −4.37 | −2.33 | 20.75 |
| S12 | 5.89 | 3.65 | 1.76 | 0.62 | 3.74 | 15.66 | 11.23 | 18.52 | −4.20 | −4.83 | 20.60 | 5.84 | 3.28 | 1.71 | 0.55 | 3.66 | 15.04 | 9.78 | 17.51 | −4.37 | −2.31 | 24.84 |
| S13 | 4.80 | 3.60 | 1.76 | 0.61 | 3.74 | 14.51 | 11.67 | 19.11 | −4.16 | −4.83 | 21.66 | 4.74 | 3.53 | 1.75 | 0.60 | 3.67 | 14.30 | 10.98 | 17.94 | −2.15 | −4.96 | 21.65 |
| S14 | 1.35 | 3.68 | 1.76 | 0.62 | 3.75 | 11.16 | 11.68 | 19.28 | −4.14 | −4.81 | 21.90 | 1.27 | 3.32 | 1.71 | 0.55 | 3.66 | 10.50 | 10.24 | 18.28 | −4.34 | −2.21 | 22.45 |
| S15 | 1.27 | 3.67 | 1.76 | 0.61 | 3.75 | 11.06 | 11.74 | 19.20 | −4.15 | −4.82 | 21.86 | 1.19 | 3.30 | 1.71 | 0.54 | 3.66 | 10.40 | 10.30 | 18.20 | −4.34 | −2.23 | 22.42 |
| S16 | 6.45 | 4.46 | 1.82 | 0.71 | 4.38 | 17.82 | 15.14 | −1.49 | −2.50 | 10.46 | 6.34 | 3.97 | 1.77 | 0.65 | 4.17 | 16.91 | 13.94 | −2.55 | 0.18 | 11.40 | ||
| S17 | 5.78 | 4.41 | 1.81 | 0.69 | 4.36 | 17.05 | 15.70 | −1.46 | −2.54 | 11.00 | 5.58 | 3.88 | 1.76 | 0.63 | 4.16 | 16.00 | 14.52 | −2.51 | 0.30 | 12.15 | ||
| S18 | 1.95 | 4.49 | 1.82 | 0.70 | 4.39 | 13.36 | 15.68 | −1.40 | −2.44 | 11.16 | 1.78 | 4.00 | 1.78 | 0.64 | 4.18 | 12.38 | 14.50 | −2.45 | 0.34 | 12.24 | ||
| S19 | 1.87 | 4.49 | 1.82 | 0.69 | 4.38 | 13.24 | 15.80 | −1.43 | −2.49 | 11.20 | 1.69 | 3.96 | 1.77 | 0.63 | 4.17 | 12.22 | 14.64 | −2.47 | 0.33 | 12.33 | ||
© 2020 by the authors. Licensee MDPI, Basel, Switzerland. This article is an open access article distributed under the terms and conditions of the Creative Commons Attribution (CC BY) license (http://creativecommons.org/licenses/by/4.0/).
Share and Cite
Farsaei, A.; Syri, S.; Olkkonen, V.; Khosravi, A. Unintended Consequences of National Climate Policy on International Electricity Markets—Case Finland’s Ban on Coal-Fired Generation. Energies 2020, 13, 1930. https://doi.org/10.3390/en13081930
Farsaei A, Syri S, Olkkonen V, Khosravi A. Unintended Consequences of National Climate Policy on International Electricity Markets—Case Finland’s Ban on Coal-Fired Generation. Energies. 2020; 13(8):1930. https://doi.org/10.3390/en13081930
Chicago/Turabian StyleFarsaei, Anahita, Sanna Syri, Ville Olkkonen, and Ali Khosravi. 2020. "Unintended Consequences of National Climate Policy on International Electricity Markets—Case Finland’s Ban on Coal-Fired Generation" Energies 13, no. 8: 1930. https://doi.org/10.3390/en13081930