Assessment of the Resistance Value of Trash Racks at a Small Hydropower Plant Operating at Low Temperature


1
Department of Hydraulic and Sanitary Engineering, Poznan University of Life Sciences, 60-637 Poznań, Poland
2
Institute of Construction and Geoengineering, Poznan University of Life Sciences, 60-637 Poznań, Poland
*
Author to whom correspondence should be addressed.
Energies 2020, 13(7), 1775; https://doi.org/10.3390/en13071775
Submission received: 18 March 2020
/
Revised: 1 April 2020
/
Accepted: 3 April 2020
/
Published: 7 April 2020
(This article belongs to the Section A5: Hydrogen Energy)
Abstract
:Trash racks are the first element mounted in inlet channels of hydraulic structures. Their primary task is to capture coarse pollutants flowing in the riverbed/river channel and protect water facilities downstream. With the use of these devices, it is possible to separate coarse suspended matter, branches carried with the current, floating plastic elements, etc., which undoubtedly contributes to a trouble-free flow through culverts or channels and prevents hydroelectric power plant turbines from failure. An important issue here is also to ensure the proper operation of trash racks, particularly in respect of hydraulic structures whose task is to convert water energy into electricity (hydropower plants). Proper operation of trash racks minimizes losses arising from obstructing the free flow of water through accumulated waste or, in the wintertime, through icing. Incorrect work in this area entails specific head losses, and consequently leads to economic harm. In the paper, the resistance values of trash racks were analyzed at small hydropower plants (SHPs) operating at low temperatures, determined under laboratory conditions, with the occurrence of frazil ice and ice. The results indicate that the added ice into the channel resulted in the formation of a cover in front of the trash racks with an average thickness of about 0.02 m. The accumulated ice increased the head losses up to 14%. The range of the ice cover depended on the weight added ice and reached 0.6 m in analyzed cases.

1. Introduction
The process of ice formation in rivers is more complex than in lakes, primarily due to the movement of water itself and the phenomenon of turbulence, which causes the water to supercool evenly throughout its depth profile. The first form of ice are loose, randomly oriented collections of plate-shaped and disk-shaped crystals. Supercooling of river water, although this involves only a few hundredths of a degree Celsius or even less, allows ice particles to adhere to each other, because in such conditions they are not stable and can aggregate actively. Such a process causes major problems with, e.g., water intakes [1].
The phenomenon of river ice jams caused by ice occurrence includes multiple interactions between hydrodynamic, mechanical and thermal processes and justifies the development of river ice research [2,3], all the more so since its negative consequences affect society, hydropower, ecology and the environment [2,4,5]. For instance, Prowse and Beltaos [6] cited several examples of extreme ice-jam flood events documented around the world, and a comparison between open water flooding and ice-induced floods can be found in other work [7]. Until recently, most data on the formation of river ice cover included only large watercourses, while information on smaller rivers was relatively scarce [8,9]. Winter river management is a key element of sustainable development regarding the use of water resources in cold regions [10].
Buffin-Bélange et al. [11] noted that freezing processes occurring in smaller rivers are strongly dependent on their morphology, and because of their smaller size freezing actions are more contrasting and extreme. They result from a larger decrease in the water table and higher values of hydraulic forces characteristic for small watercourses. In addition, there is a risk that one watercourse can undergo several cycles of freezing processes, which can lead to aggregation of ice forms, with their varied shapes affected by the exchange process between ground and surface waters.
Climate change is another important factor. However, it is pointed out that even if individual countries can feel the significant effects of climate change in connection with the production of hydropower, in global terms these changes should not lead to significant changes in hydropower generation [12]. Changes in ice and river regimes caused by climate change can have both positive and negative consequences for the operation of hydropower plants. The positive consequences are due to the shortening of icing time and the reduction of static ice loads. Negative consequences will be associated with unstable winters, which can lead to increased frequency of freezing and thawing in the winter season [13].
Ice phenomena are generally various forms of ice found in surface waters. The basic condition for initiating the process of river icing is that river water is supercooled, which means that it reaches a temperature below freezing point. Depending on the river size, these situations usually occur after several frosty days, during which the water and the river bottom emit heat into the atmosphere intensively (Kreft 2013). The intensity and duration of ice phenomena, as well as their nature, depend on the climatic conditions found in the river valley, and the main factor determining the emergence and course of river icing is the air temperature [14]. The thermal-ice regime of rivers is also shaped by the manner and intensity of the water supply, particularly groundwater; moreover, and no less important, it can be strongly modified by anthropogenic activities related to the use of catchment areas and river valley developments [15]. Technical transformations in rivers, such as hydraulic structures, riverbed regulation, construction of barrages, dams and reservoirs, discharge of warm municipal and post-industrial waters, have a significant impact on the course and nature of ice phenomena [16,17].
The occurrence of ice jams may disrupt inland navigation and cause excessive riverside erosion [18]. Ice jams on hydraulic structures can lead to water retention due to a reduction in the cross-section of flow and an increase in flow resistance. Consequently, it results in the flooding of adjacent areas. The subject of ice occurrence and its impact on flows in open channels has been widely analyzed by numerous researchers, including [19,20].
Turcotte and Morse [9] presented a global conceptual river ice model that can be used as a primary tool to predict ice cover types and recognize ice processes. They identified six ice cover types (ice shells, suspended ice cover, surface floating ice cover, surface confined ice cover, solid ice and no ice) and five ice processes (active frazil ice, anchor ice, hanging dams, ice dams and ice jams). The model elaborated by the authors requires to use input parameters that can be determined visually (channel profile and patterns) and by accessing historical meteorological data (winter intensity) or climate maps. Turcotte and Morse presented the potential impact of specific ice cover types and processes on the hydraulics, hydrology and infrastructure of river channels. River-ice breakup timing forecasting is crucial for supporting emergency responses to river-ice related flooding. Therefore, Sun [21] proposed a framework of a stacking ensemble tree model (Stacking Ensemble Tree Models, SETM), which consists of numerous types of model trees of classification and regression (Classification And Regression Tree CART) in a two-level structure: base and ensemble models for river-ice breakup timing forecasting. To verify the assumptions applied in the model, the author used the historical data of 36 years on river-ice occurrence on the Athabasca River at Fort McMurray, which is the largest unregulated river in Alberta, Canada.
The ice jam theory based on static balance of floating ice has already been thoroughly analyzed [22]. The basic concept of river ice transport is a more dynamic phenomenon, although similar to sea ice transport [23] and lake ice transport [24].
In order to understand the physical mechanism of ice jam formation, Shen et al. [25] and Shen et al. [26] developed a one-dimensional model that simulates the process of ice accumulation and transport, whereas one-dimensional models for calculating static ice jam profiles were developed by Flato and Gerard [27,28] and Beltaos [28]. Due to the three-dimensional (3D) nature of flow under ice cover and its complex geometry, the approach proved to be not entirely correct. Therefore, Shen [10] proposed a simplified two-dimensional (2D) model that was used to simulate ice transport and ice jam formation during the freezing of the Clair River [29].
The numerical calculations for the influence of trash-rack and bar geometry on head losses are common [30]. Lucin et al. [31] pointed out that the differences between 2D and 3D numerical modeling did not exceed 1% while reducing the calculation time for 2D models. The two-dimensional numerical model of ice transport in rivers by Shen [18] took into account hydrodynamic and dynamic ice components, treating the ice surface itself as continuous. The model was verified with the use of an analytical solution, for a simple homogeneous rectangular channel with a uniform current, for which it is typically assumed that wind speed, bottom friction and water surface slope are zero. The model was used to explore the applicability of ice booms in order to reduce ice retention potential for the Mississippi-Missouri River catchment area.
Hydropower is based on the use of water potential and its transformation into mechanical energy with water turbines, and then into electricity through hydro-generators. It relies on the use of water with a high flow rate and a high difference in levels (head) [32].
The input of small hydropower plants (SHP) can be adversely affected by numerous factors obstructing their operation [33,34], i.e., flooding, inundation, hurricanes, heavy rain and snow load. The following phenomena should also be included in the risk group: frazil ice, ice jams and high water flows, as well as pollutants/suspended matter of different origins [35] and plant debris. The work of a small hydropower plant in an annual cycle covers both an operational period with higher temperatures associated with a vegetation season and a post-vegetation season—autumn and winter—with lower temperatures. Each period encounters different operational problems, particularly related to inlet trash racks. The risks to power plant stability can be divided into hydraulic, water table fluctuation-induced and ecological (resulting from the growth phases of riparian vegetation and other plants found in the immediate vicinity). Some threats, i.e., a reduction in inlet channel capacity due to blocking the inlet area with plant debris, are easily manageable by a facility’s caretakers. In autumn, when the air temperature drops, frazil ice may appear. Ice pulp floating in water literally stains inlet trash racks, significantly reducing the flow and preventing SHPs from normal operation. The practically constant level of damming and low flow rates in the reservoir before inlet trash racks and the presence of hanging frazil conduce prolonged retention of ice cover near trash racks, particularly in relation to the river flowing freely above. Gebre et al. [36] demonstrated that ice creates a number of operational constraints for various elements of the hydropower system at a time when energy demand is at its peak. Accumulation of ice cover can also lead to a serious threat of ice jamming, primarily during the period of ice breakup resulting in sudden SHP shutdown or severe damage to hydropower equipment. Unfortunately, the experience of recent years has shown that this phenomenon might be even more onerous. The situation occurred twice in winter at the turn of 2011 and 2012, namely, at the power plant in the Prosna and Radomka rivers, which, without any form of protection against frazil ice, were completely immobilized for 2 to 3 weeks (https://sites.google.com/site/frazilnet/). Alternating warming periods followed by a strong and rapid cooling causes current winter periods, which would be called mild previously, are becoming unpredictable and dangerous for the operation of water devices.
The occurrence of frazil ice in the upstream can lead to a complete blockage of these devices, including damming facilities. Fortunately, due to its structure, frazil ice can be easily and quickly removed, minimizing the negative effects of SHP downtime. Frazil ice takes various shapes: needles, disks or stars, with the diameter of particles ranging from hundredths of a millimeter to several millimeters. It forms in a turbulent and supercooled water mass, which conjointly with bottom ice, forms slush, pulp and frazil ice rings or balls. In contrast to bottom ice (gray), frazil ice in every variant has a white color. There are two differentiated types of frazil ice: active and passive [37]. Active frazil ice exhibits combining properties of forming spongy ice cakes, and due to adhesion, it accumulates on objects in water becoming a serious operational problem for water intakes and hydropower plants. Passive frazil ice occurs in water at a temperature higher than 0 °C; it neither shows cake-combining properties nor ‘sticks’ to objects immersed in water. Another phenomenon is frazil jam (hanging frazil/hanging dam), which can reach the bottom of the riverbed; however, due to its structure, it requires more accurate hydraulic tests, i.e., an observation how the density of hanging frazil increases as a result of drowning crystals and decreasing its thickness, and as a consequence, how it achieves better compactness. These jams result in increased water levels and a higher risk of overflow.
There are methods that reduce the likelihood or exclude the formation of frazil ice in SHP’s inflow channel. It is important here to isolate water from atmospheric factors through forming an ice cover in a static form. Under such conditions, no frazil ice or bottom ice will occur in reservoirs, which translates into lower values of flow resistance and, consequently, lower hydraulic head loss. The disadvantage of this method is the period of ice cover stabilization, during which it is required to reduce or completely stop the production of energy. Such analyzes for hydropower developments were carried out in, e.g., Canada, the USA and Scandinavia [38,39,40].
It is worth noting that the actual value of a hydraulic head in a hydroelectric power plant depends on the water level downstream to trash racks. Hydraulic losses on trash racks can be compensated for by using efficient, automatically controlled machines for trash racks cleaning that control the differences in the water level upstream and downstream, thus, they switch on automatically when the difference is too large. Attention should also be drawn to checking the spacing between trash rack bars, if a trash rack is made of fine elements. If bars are too densely spaced, hydraulic losses are higher. Effective trash rack cleaning has an impact on the annual efficiency of a hydropower plant [41]. Additionally, as Zayed et al. [42] reported that screens with a triangular V-shaped may be more likely to deflect floating matter to the channel sides without human interference (self-cleaning screens).
The head losses on clean trash racks can be estimated using the equation of Meusburger et al. [43]:
where
K—form factor [[–],
Δ—horizontal angle of inflow [o],
b—clear spacing between the bars [m],
l—length of the bars [m],
θ—vertical angle between the main direction of the local current and the trash rack [o],
v—local flow velocity ahead of the trashrack [ms−1],
p—blockage ratio [-]:
where
Ars is the area blocked by the bars [m2], Aah the area blocked by the horizontal spacing elements [m2] and Arf the total area of the trash rack field [m2].
The impact of blocking the trash racks by debris or ice can be taken into account by modifying the blockage factor [44]:
where
Ac is the area blocked by the accumulated debris/ice [m2].
The demand for renewable energy sources is increasing. Water energy is the most dominant type of green energy. According to the International Renewable Energy Agency IRENA report (accessed 2020-03-29), global energy production from hydropower sources has reached 48%. In many countries, hydropower is the main source of energy. Examples of such countries are Norway, Canada and Sweden, in which the share of water in energy production is at the level of 90%, 81% and 56%, respectively (IRENA 2020). Undoubtedly, the advantage of SHP is the continuity of power supply which ensures the speed of switching on the system and load balancing. For comparison, wind energy devices operate in an intermittent system and are characterized by high system instability [45]. An important problem is limiting the head losses arising on trash racks. Debris accumulating on the trash racks, as well as ice during the winter, can reduce SHP performance. This article analyzes the impact of ice on trash racks on head losses.
2. Materials and Methods
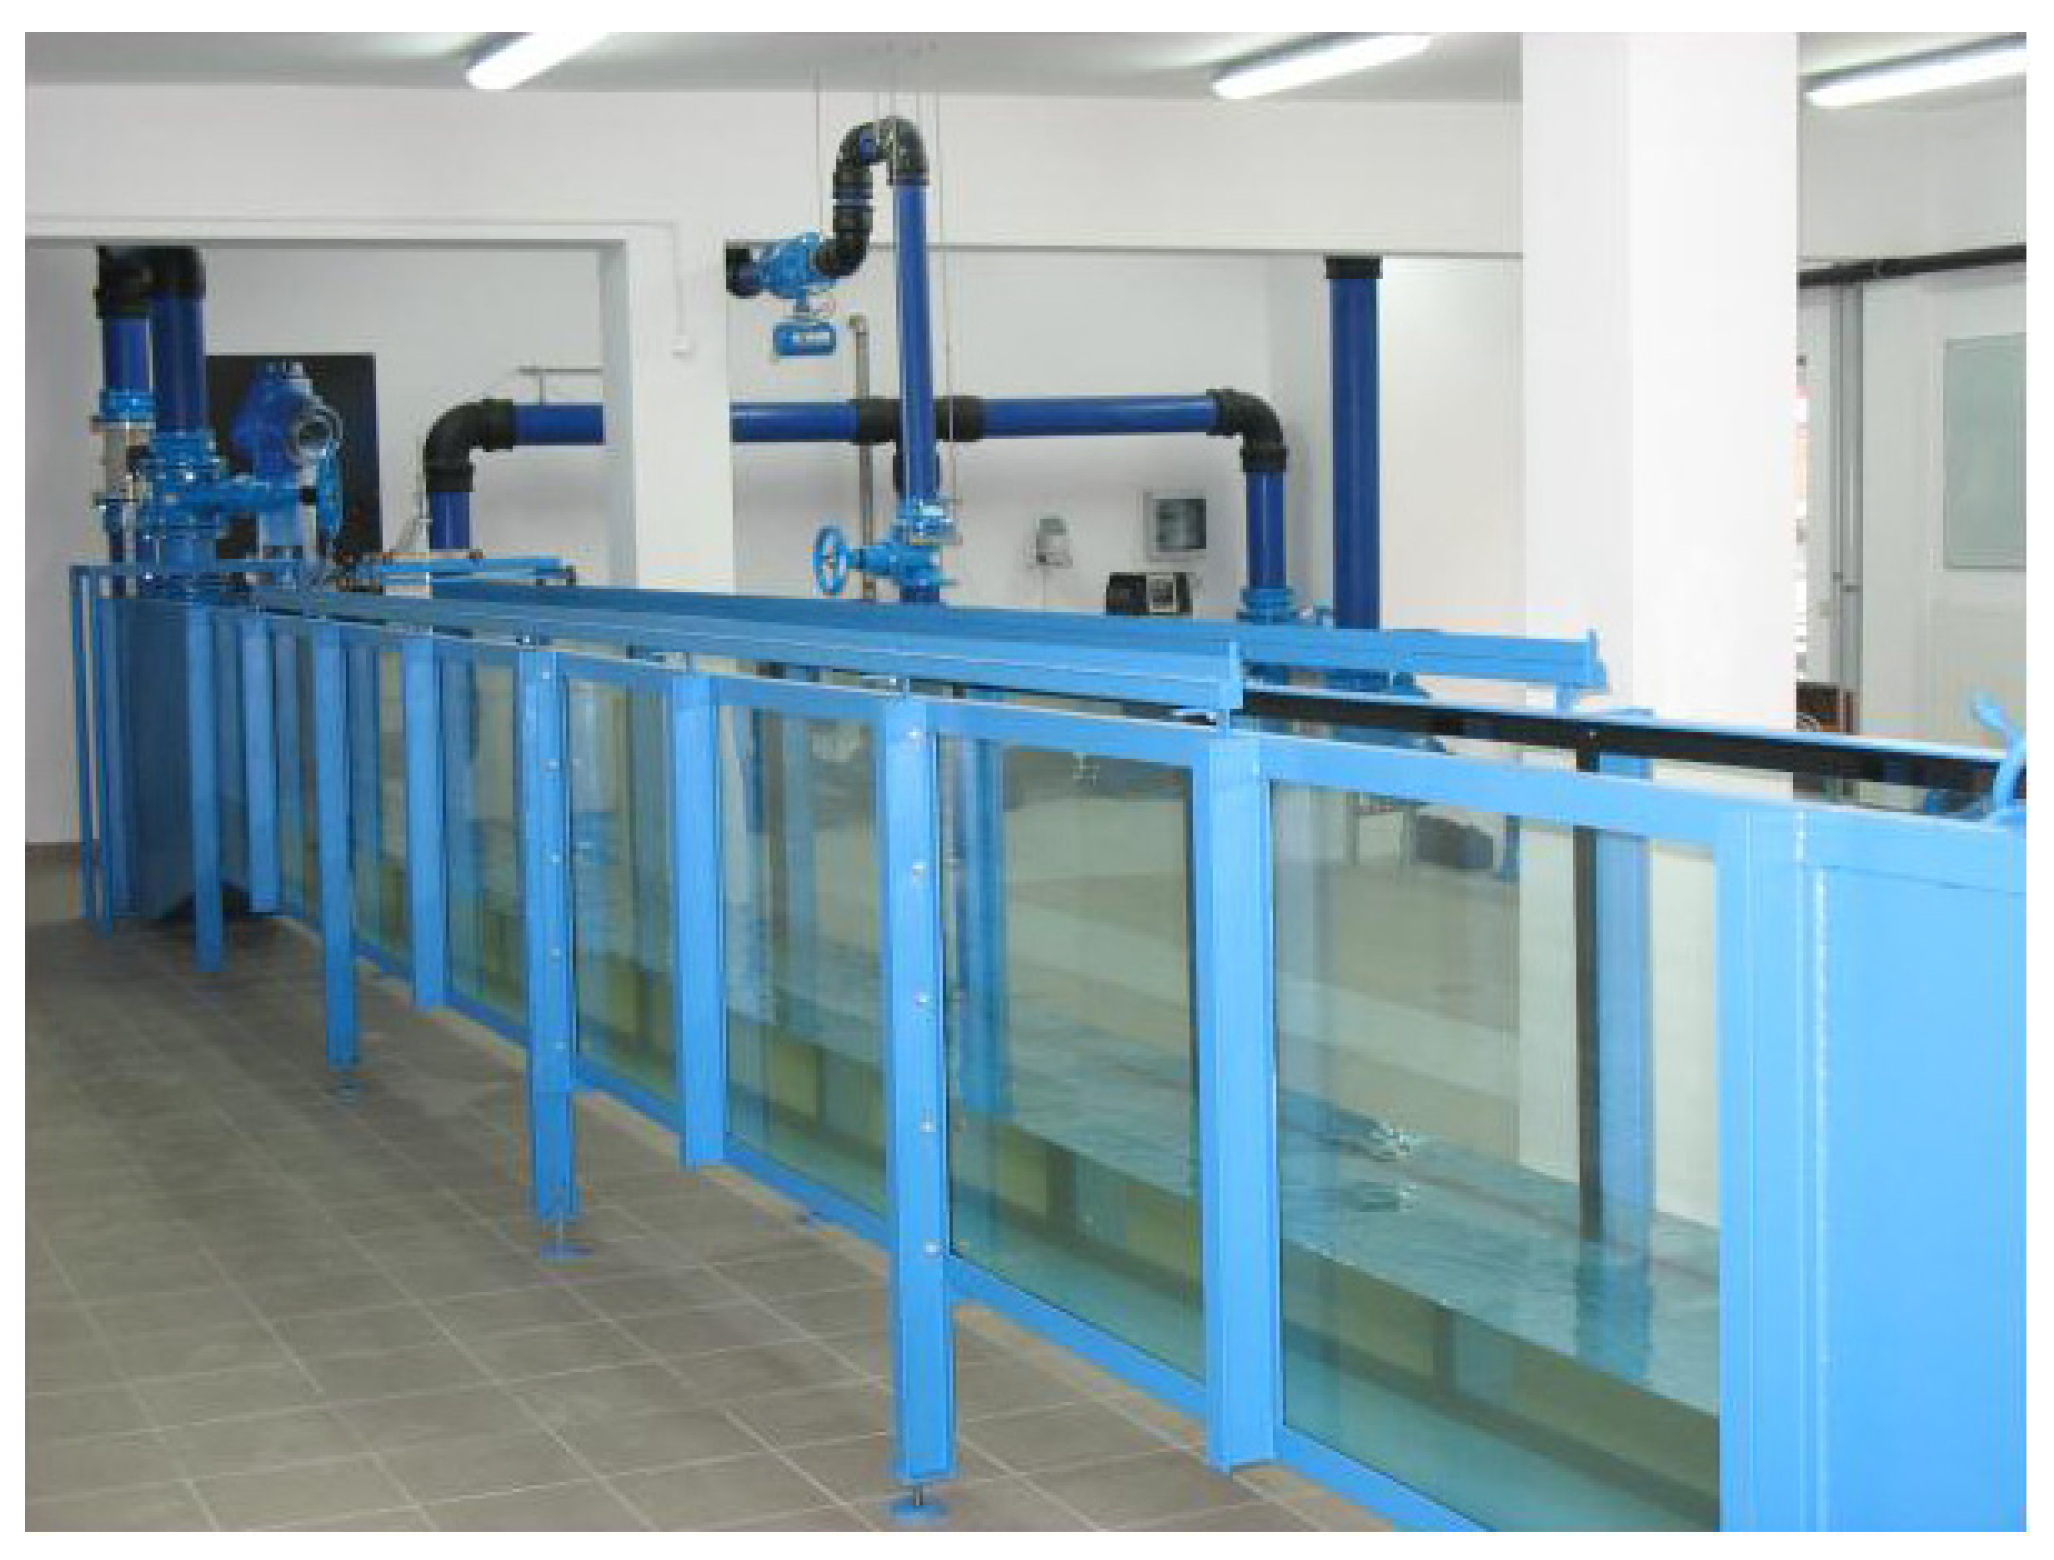
The resistance values of flow through ice-covered trash racks were determined by a strain gauge located in the hydraulic flume (Figure 1) at J.B. Lewandowski Water Laboratory at the Department of Hydraulic and Sanitary Engineering of University of Life Sciences in Poznań.
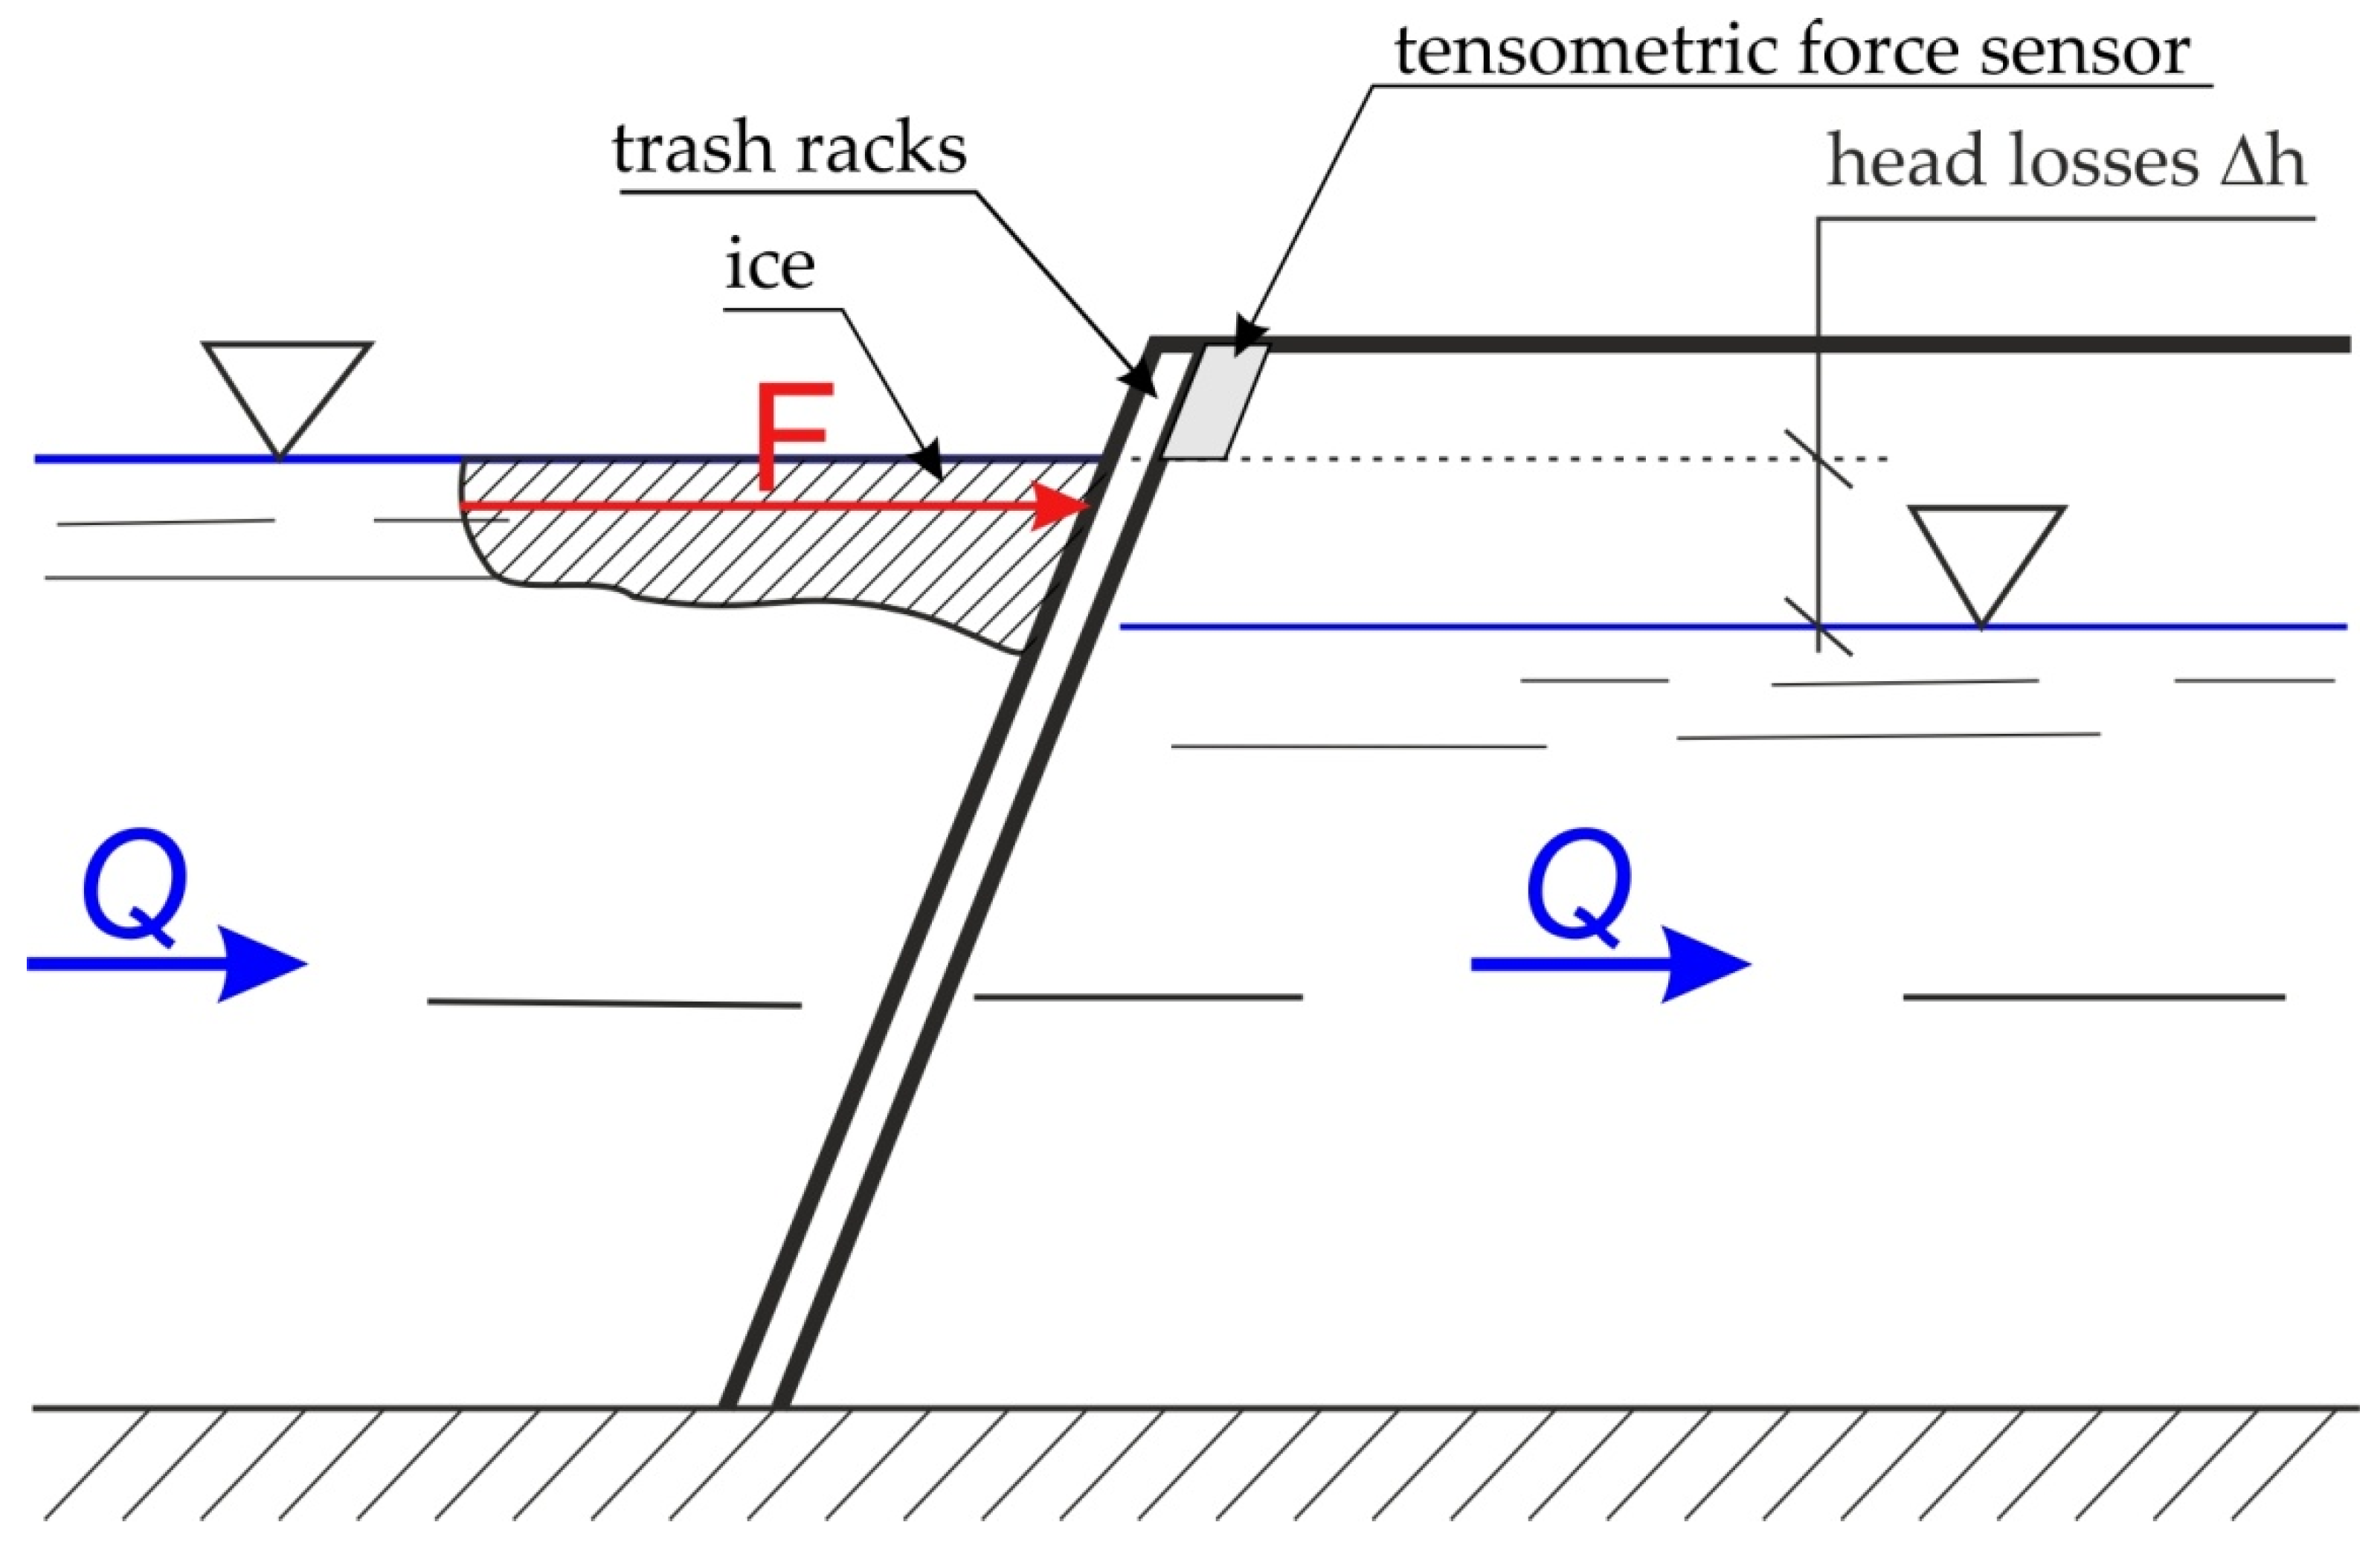
The hydraulic flume is made of metal profiles forming a skeleton 12 m long, 0.47 m wide and 0.9 m high. The inlet and outlet parts and the bottom are made of steel plate and the sides of the flume are made of acrylic glass. The flume is filled with closed circuit water using pumps. Its front part has a stilling basin installed to suppress energy and reduce waving. Its end part features a flap for water level adjustment. Behind the flap there is a vent through which water returns to the bottom tank via a pipeline. The dynamometric platform is located 9.0 m from the water inlet to the hydraulic flume and was used for measuring the forces acting on the installed bars of SHP trash racks (Figure 2).
The dynamometric platform is connected to a tensometric force sensor type CL-17 operating in the 50N range with a sensitivity of 1 mVIV, ensuring stability of a given geometrical arrangement. The research arrangement serves to transfer the force acting on installed trash racks, regardless of where it is applied. The measured values were recorded using RECORDER (software).
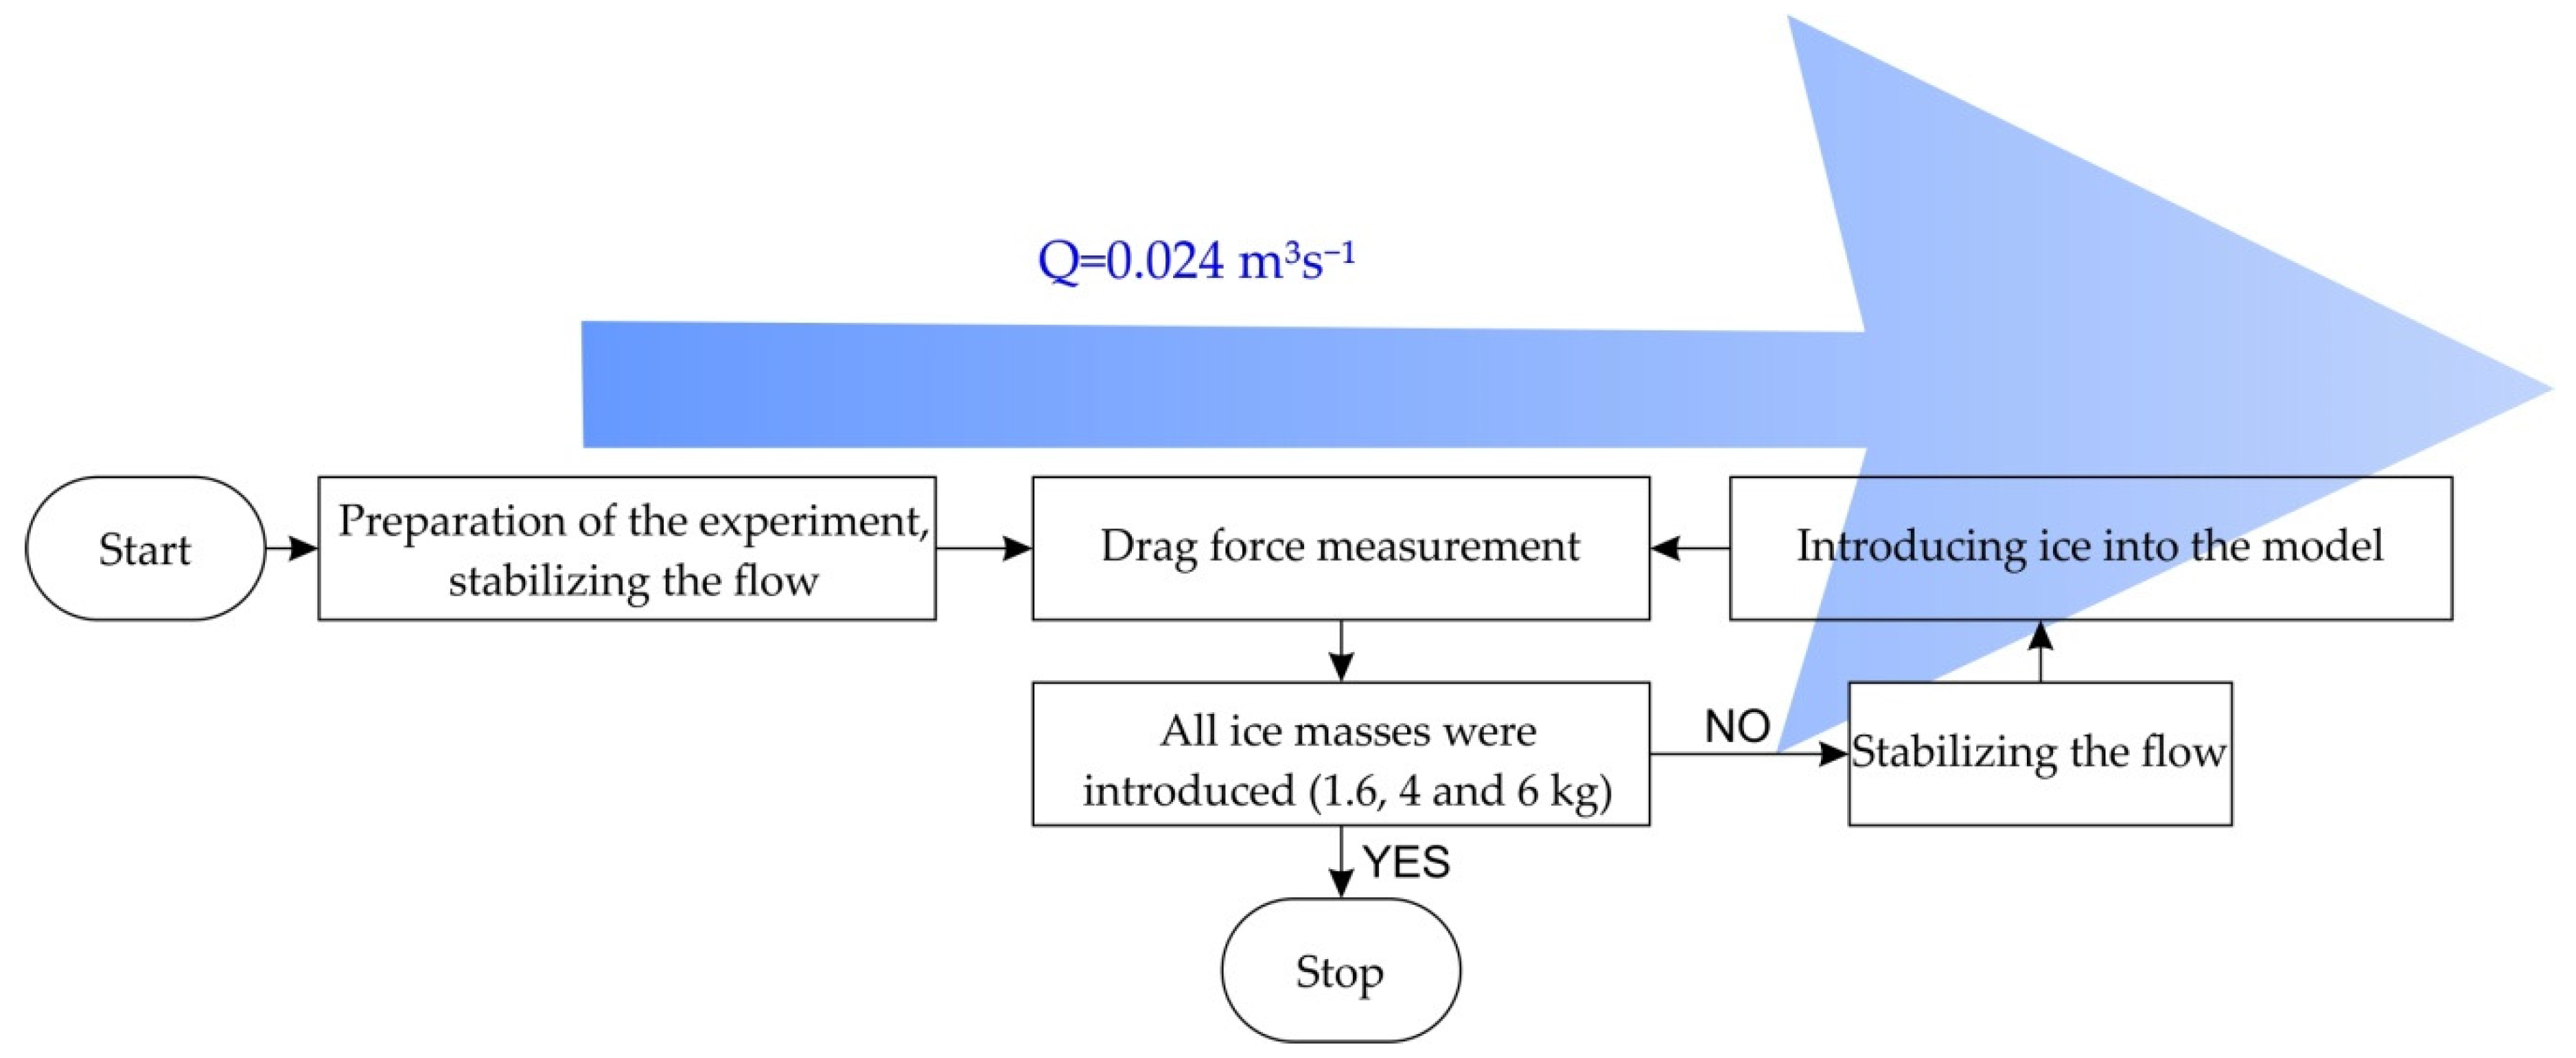
During the laboratory tests the following measurements were made: water depth in front of and behind the trash rack, and the force acting on it. Measurements were made at a constant, regulated flow Q = 0.024 m3s−1.
In order to determine the type of movement, the Reynolds number was determined. In the case of trash racks, the equivalent volume diameter, which takes into account the thickness of bars and ice layer depth, was taken as the value of the hydraulic radius. The value of Reynolds number was determined from the correlation:
where:
Reav—Reynolds number for average flow rate, [-];
vav—average velocity of free water flow for a given flow rate, determined from the continuity equation, [ms−1];
dz—substitute volume diameter, [m],
υ—kinematic viscosity (m2s−1).
The water depth in front of and behind the trash rack was taken as the difference in bottom and water level ordinates near the trash rack (in front of and behind). Bottom and water level ordinates were determined using pin gauges. The values of forces acting on the trash rack were measured using a tensometric bridge. The measured values were used to determine drag force values based on the Newtonian resistance equation. This correlation determines the value of force with which the fluid acts on the body, and its direction is opposite to the movement of water. The value of this parameter results from viscosity of the tested liquid and the difference in pressure in front and behind the analyzed body in water [46]:
where:
F—drag force, [N];
CW—drag coefficient, [-];
Ap—projection field of the flowed element on the surface perpendicular to the flow direction, [m2];
ρ—water density [kgm−3].
Knowing the values of operating forces measured during the laboratory test Fp, the drag coefficient was determined with the following formula:
where Fp—the value of the measured force, [N].
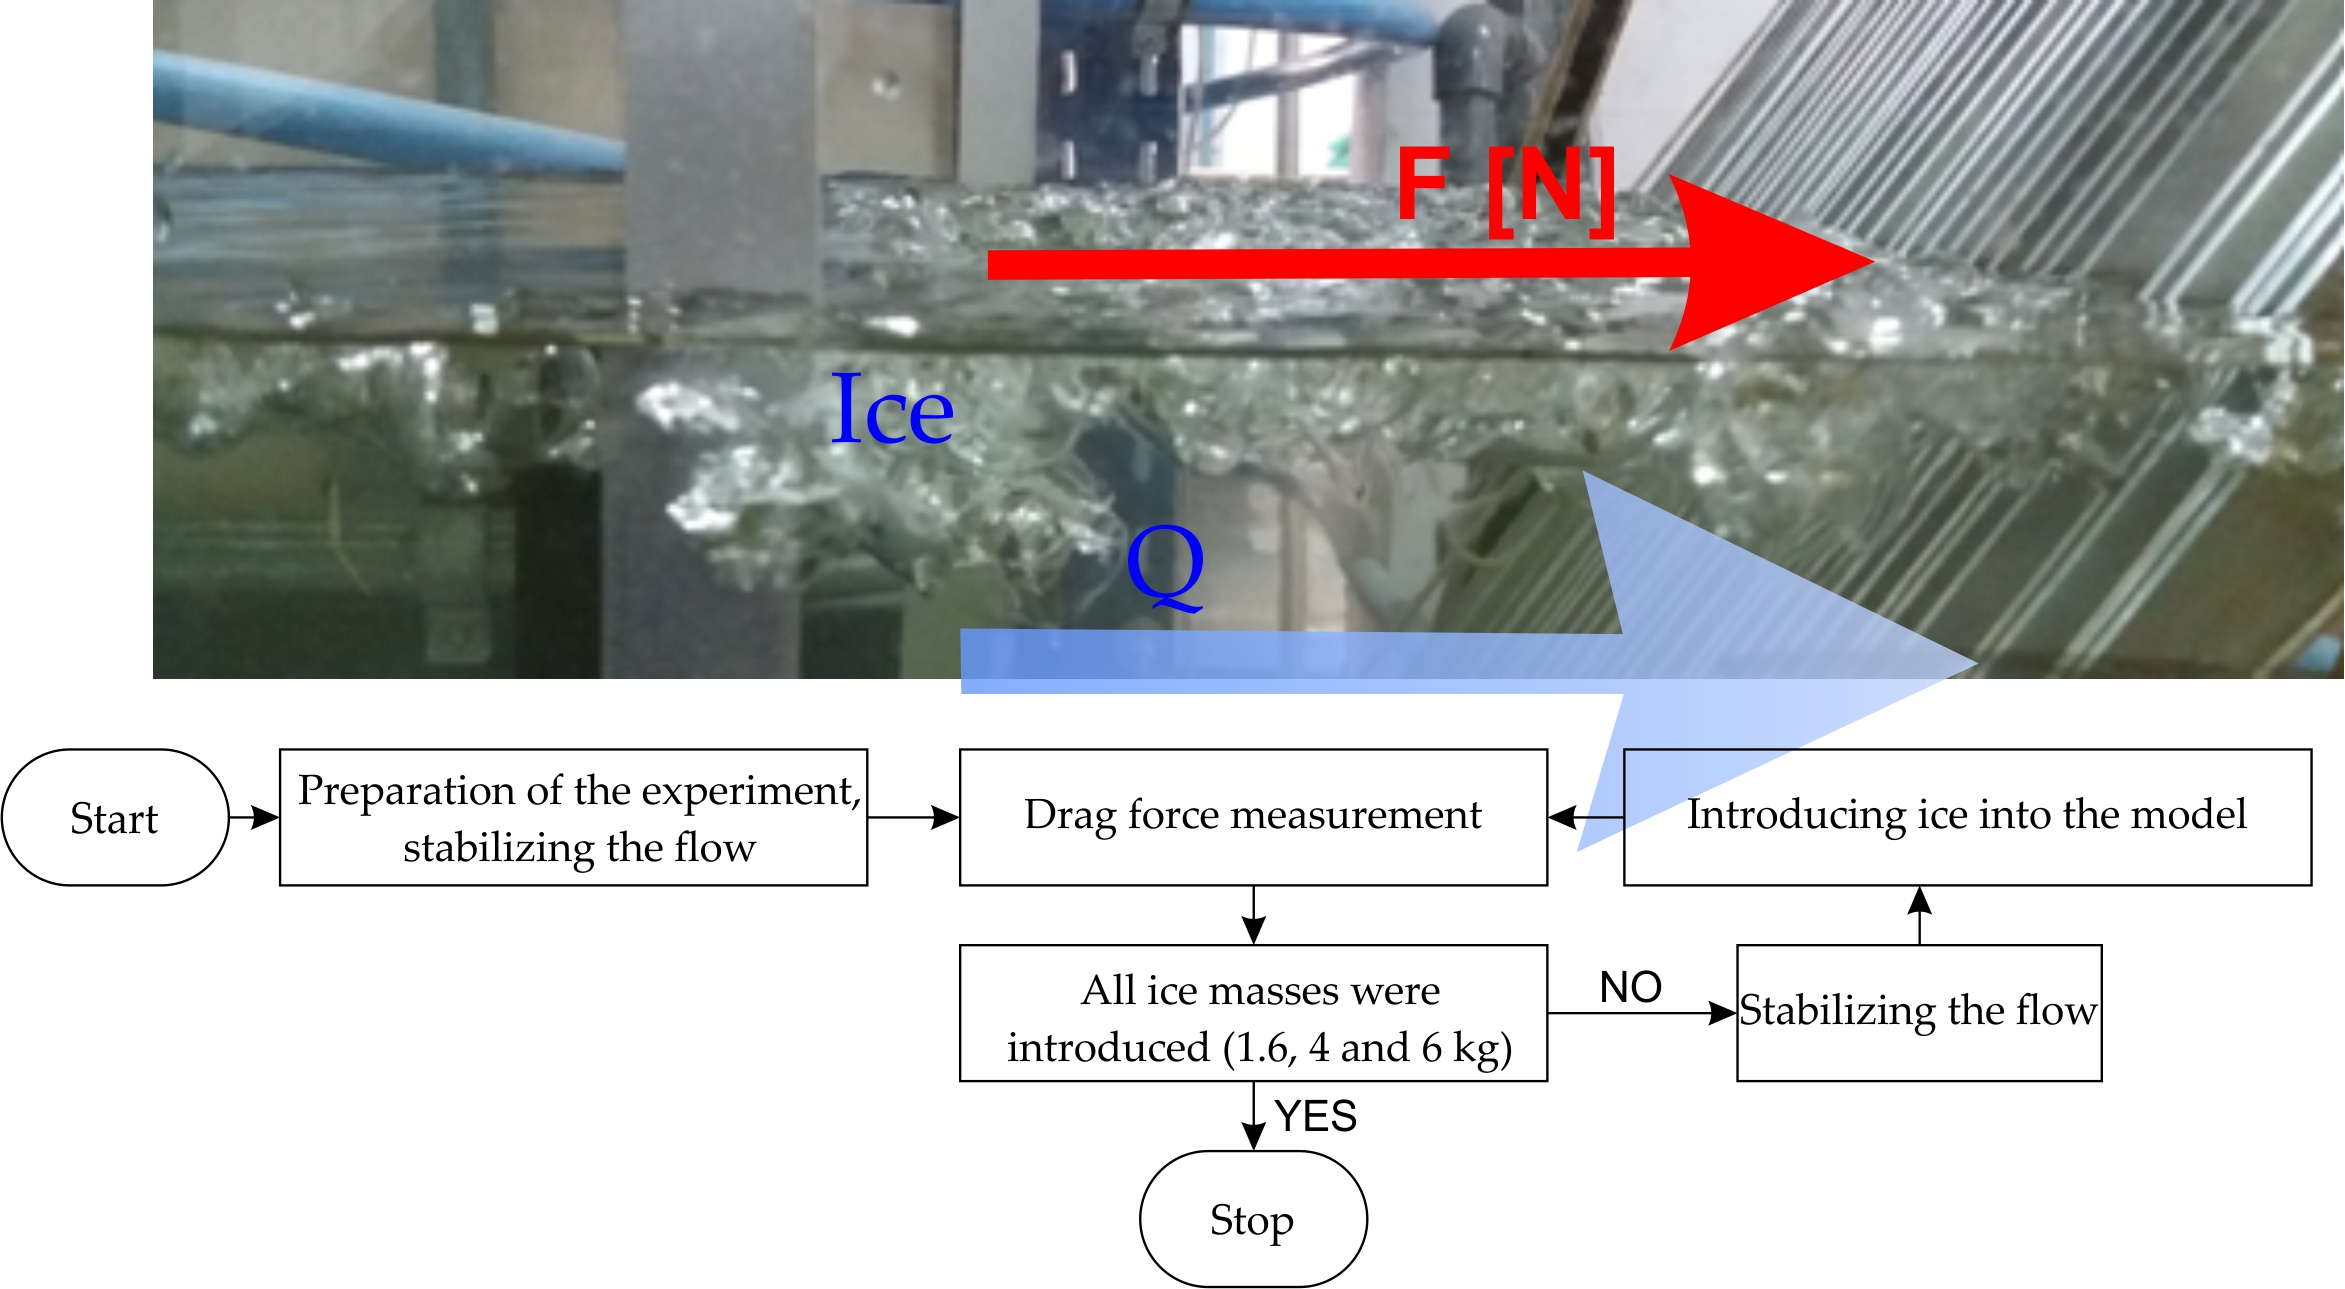
An ice jam on trash rack bars was simulated with 0.05 × 0.05 m ice cubes used in three different weights—1.6, 4 and 6 kg. The cubes were introduced into the system near the entrance to the hydraulic flume. After reaching the trash rack bars, the cubes formed an ice jam (Figure 2). First, after stabilizing the flow, the value of drag force measured in a clean flume without ice was determined. Then ice was introduced into the model and the drag force measurement procedure was repeated (Figure 3).
3. Results and Discussion
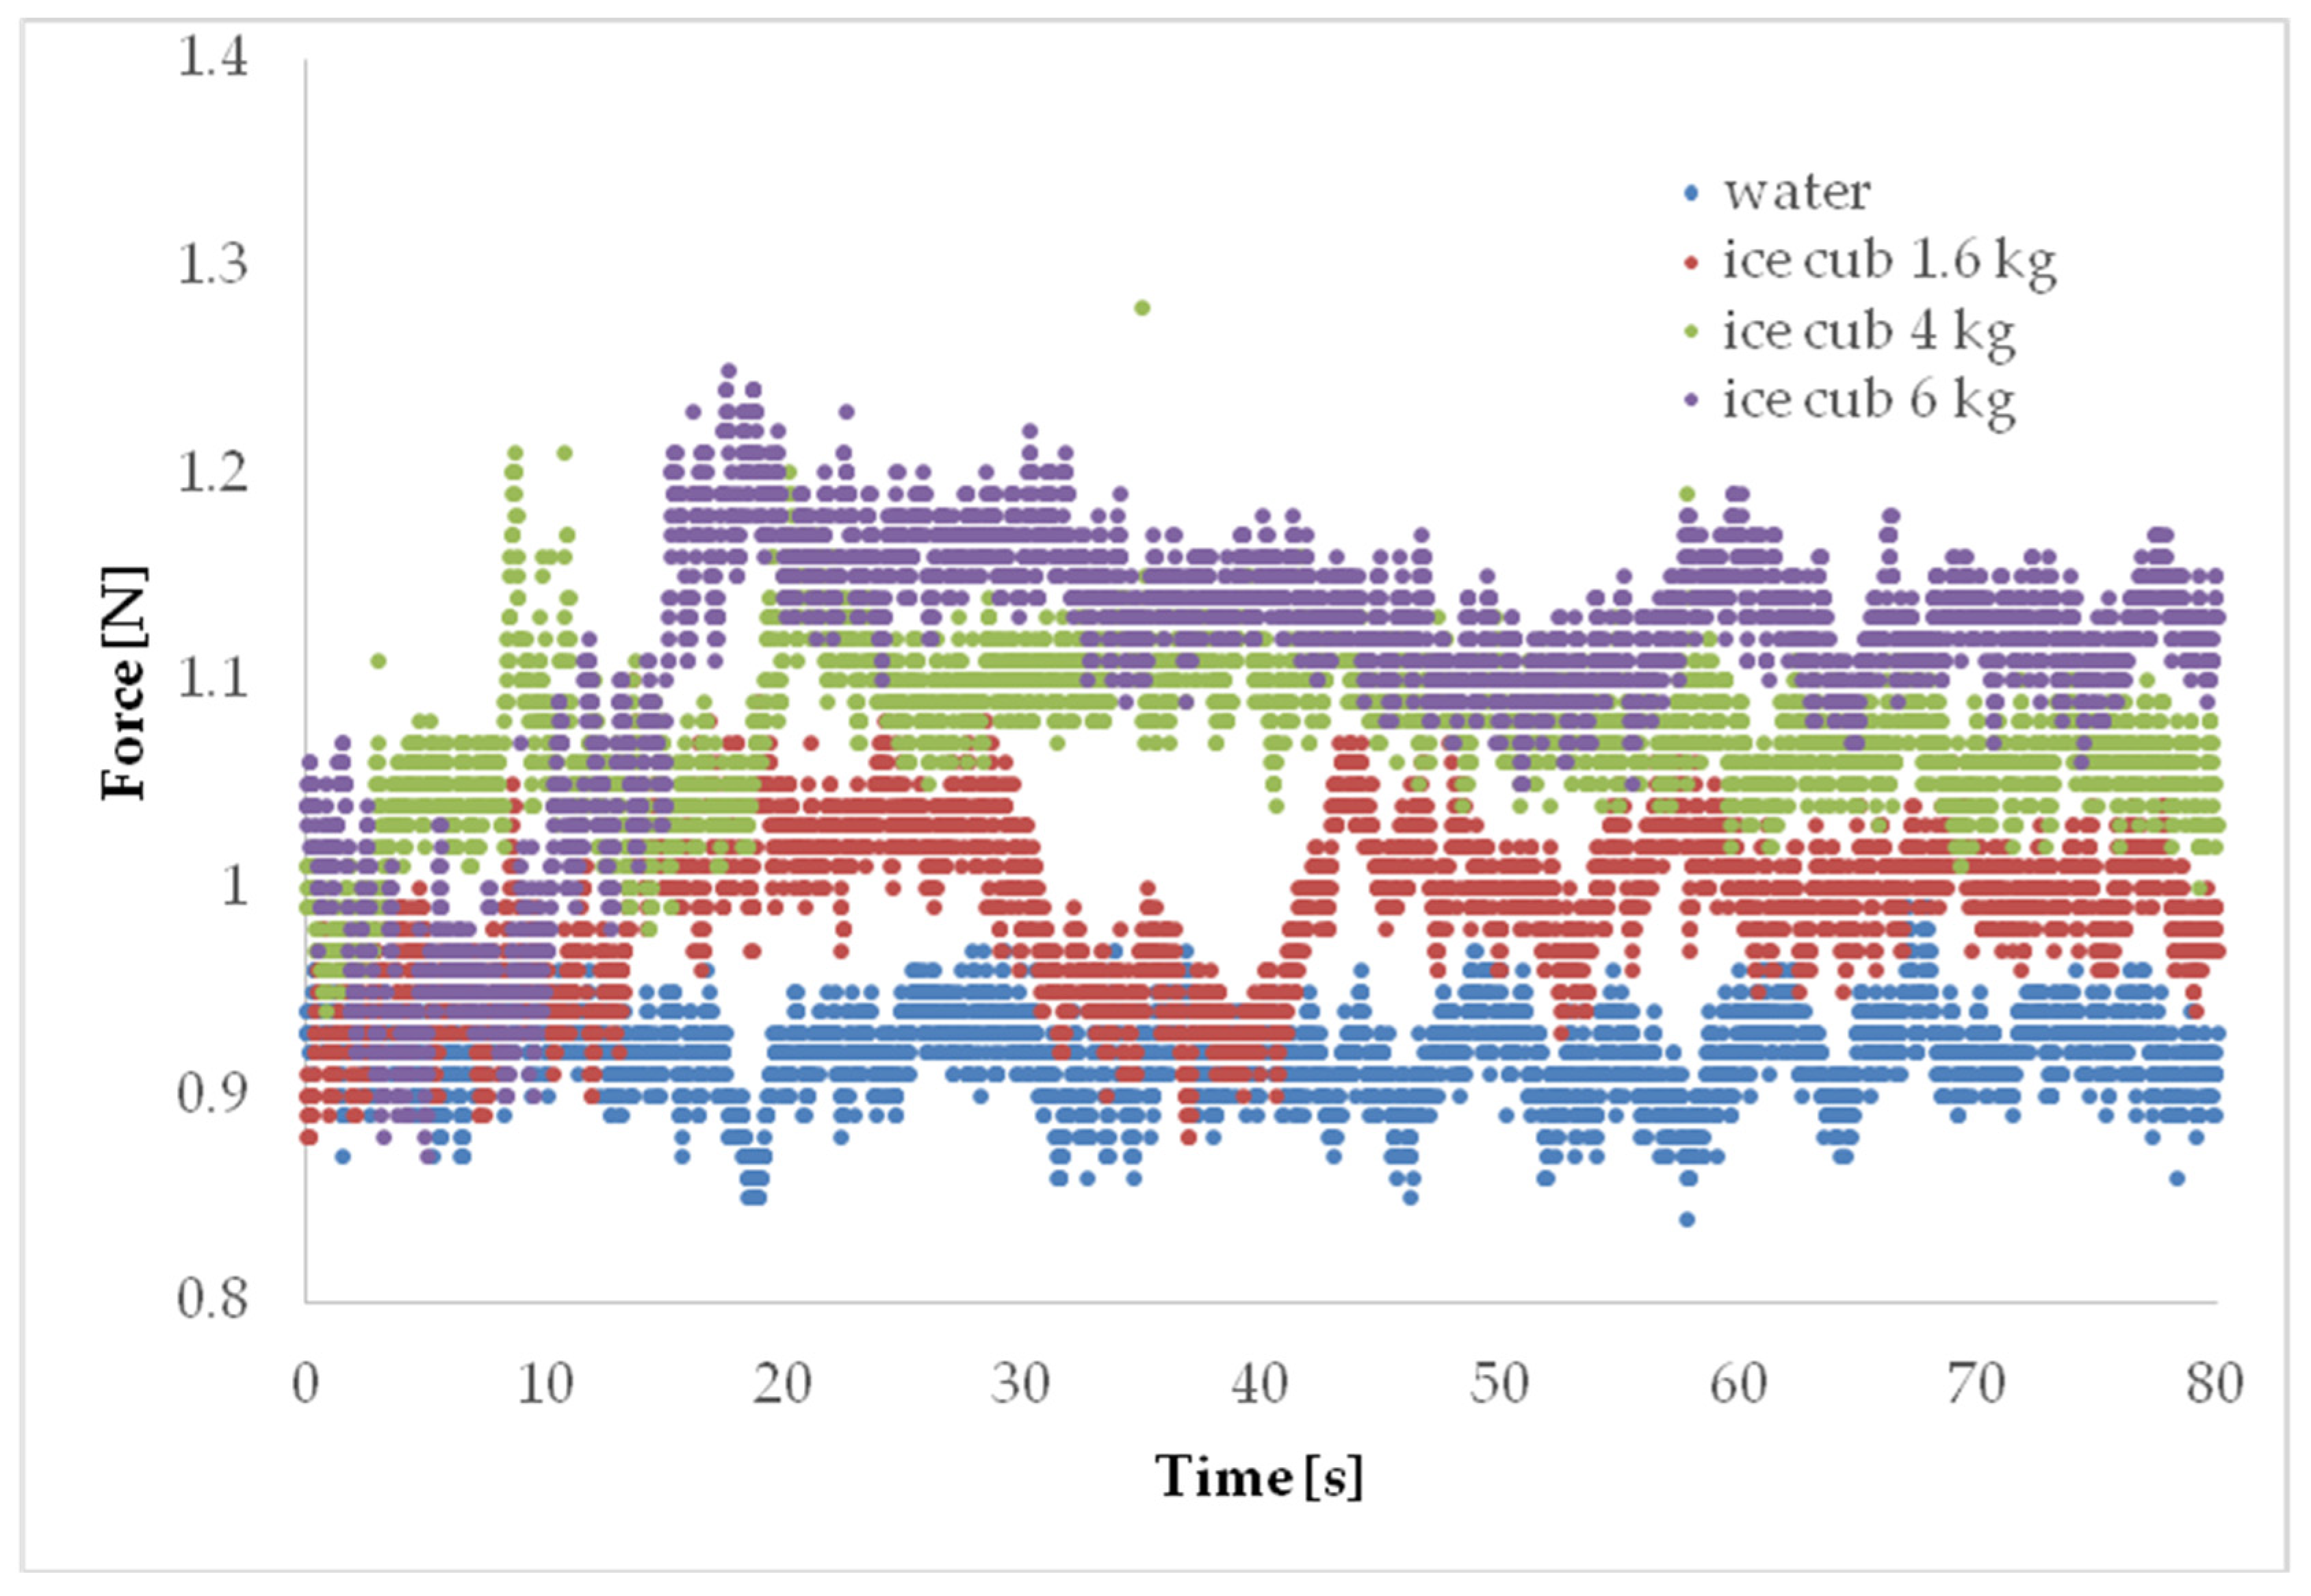
The measured values are summarized in Figure 4. The value of the drag force caused by icing was the difference in the force measured for the trash rack bars without and with icing.
The bars mounted in the trash rack had the shape of a flat bar 0.003 m thick and 0.02 m wide. The trash rack panel had 29 bars spaced every 0.01 m. During the tests, water in the flume had a temperature of 15 °C; after the ice was introduced, it dropped to 10 °C, and for this value the kinematic viscosity coefficient was assumed. The discharge value was constant throughout the entire study for all variants and equaled Q = 0.05 m3s−1.
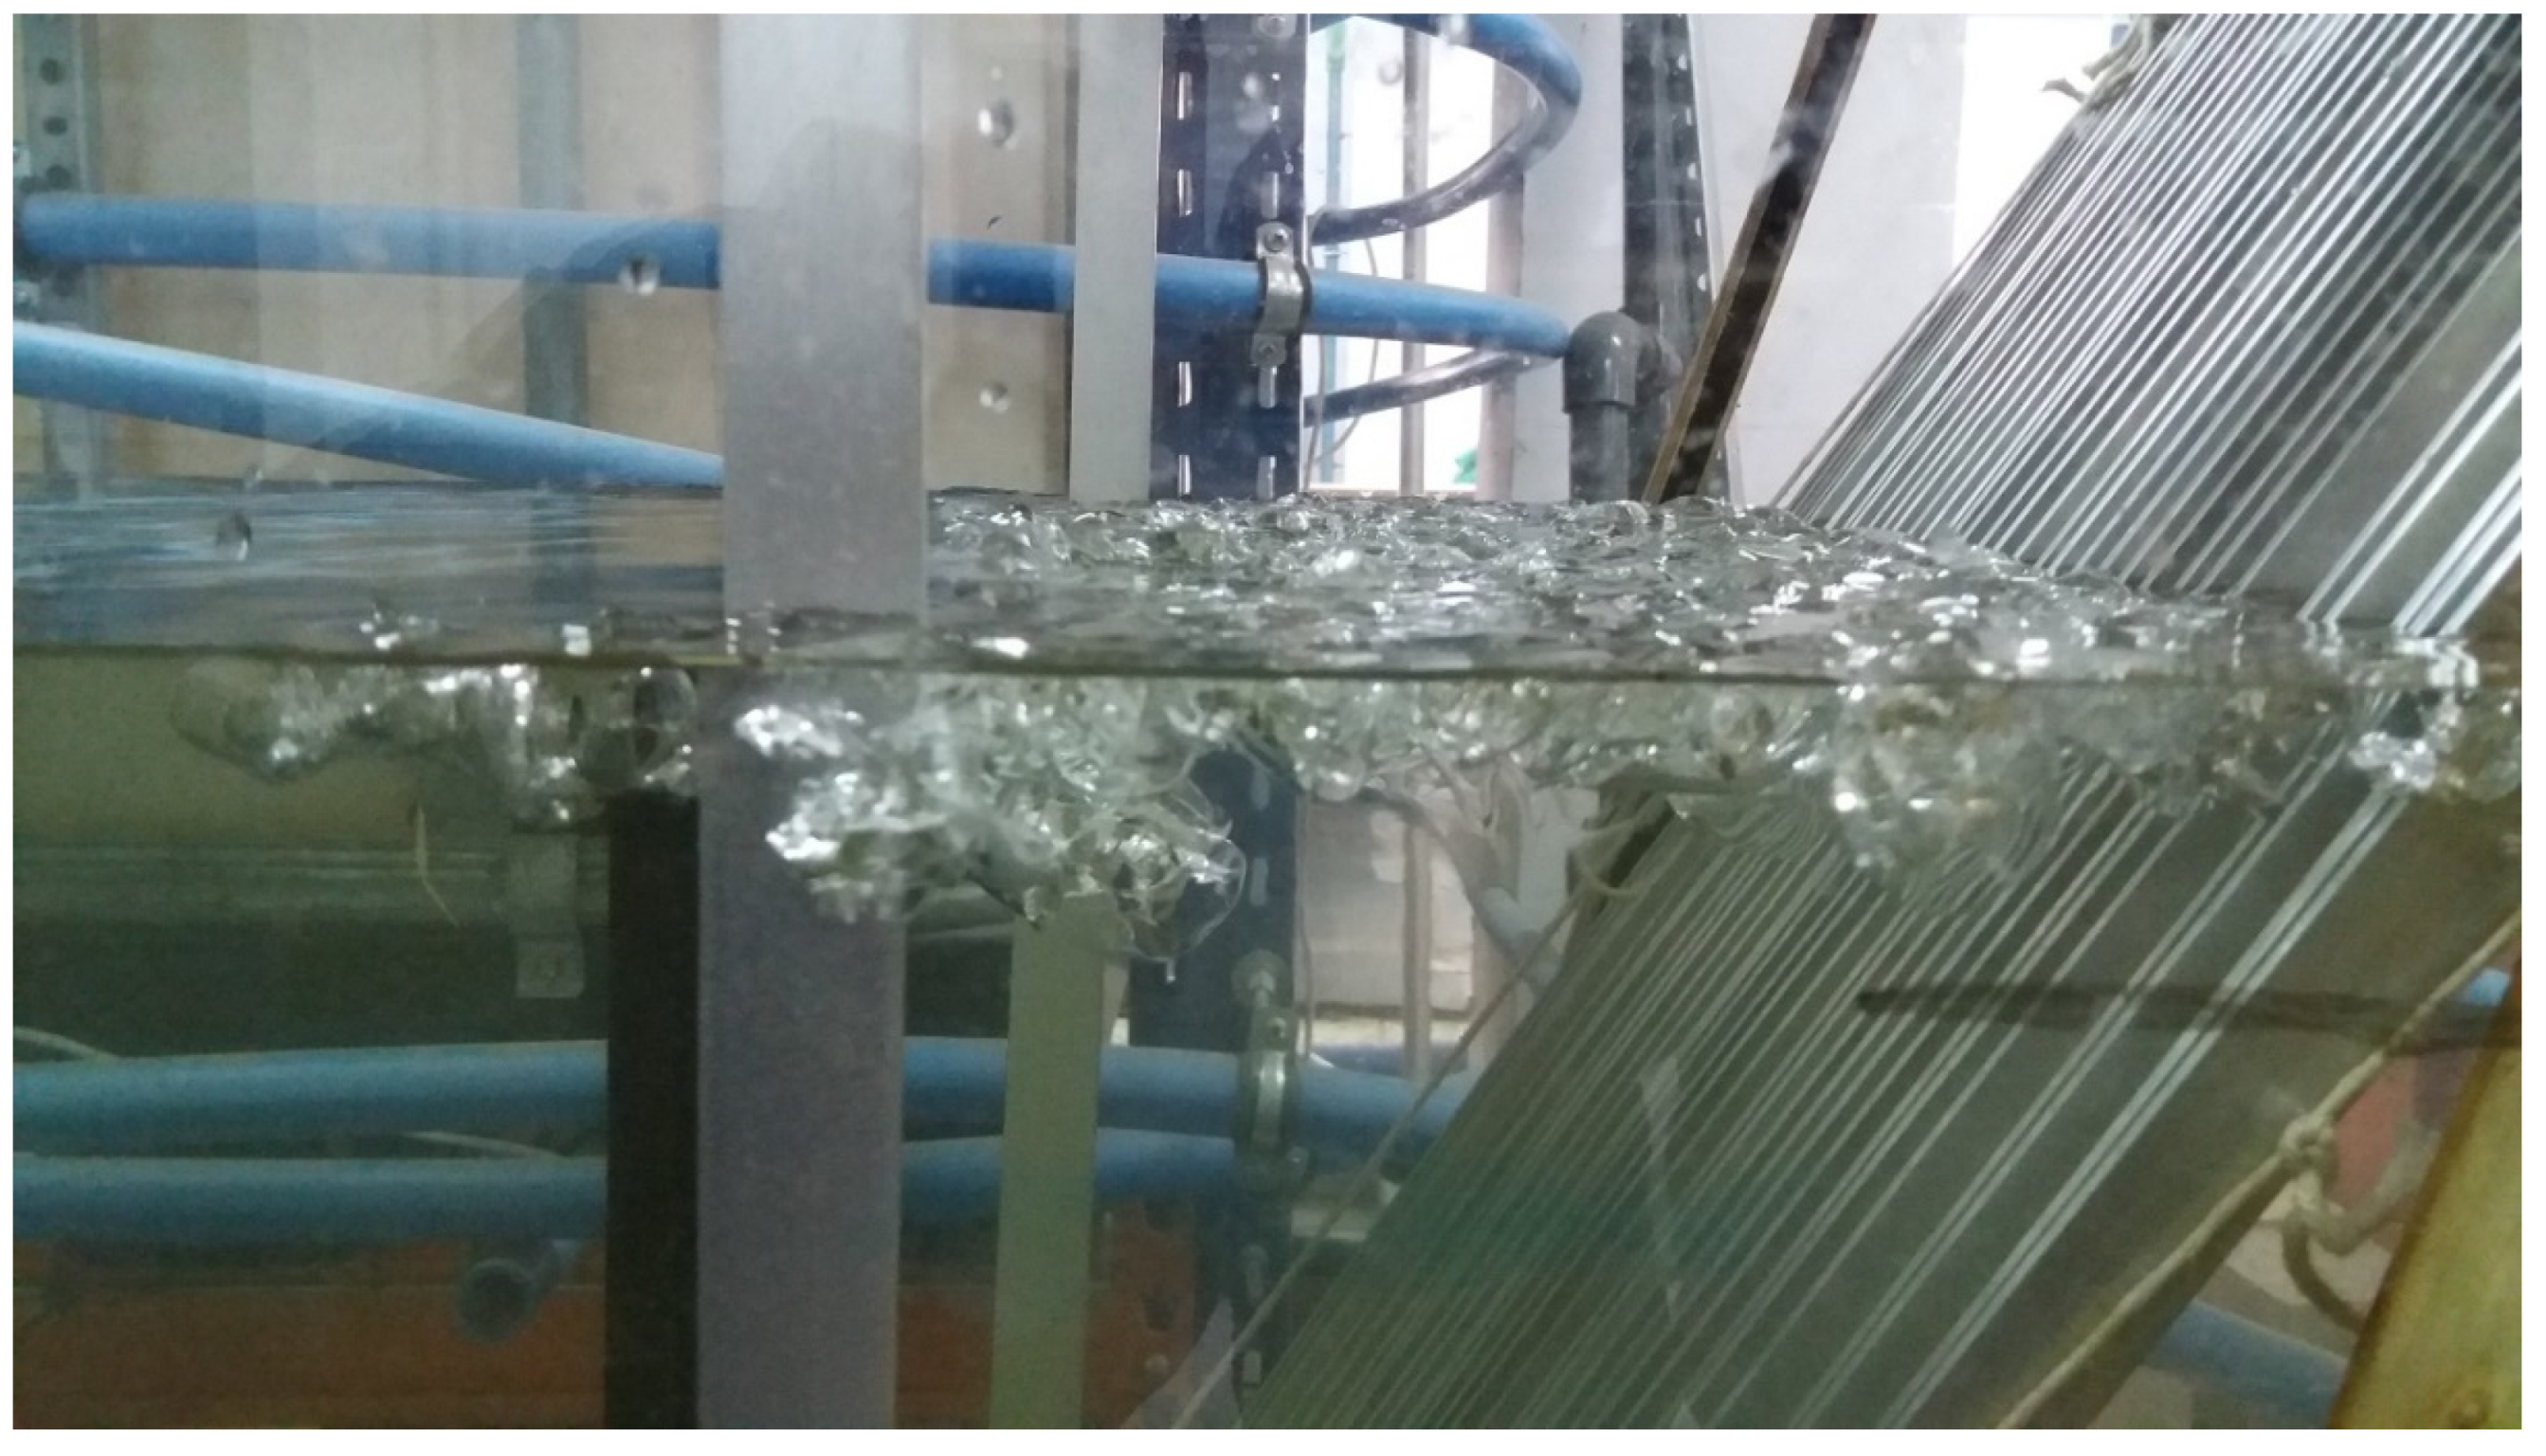
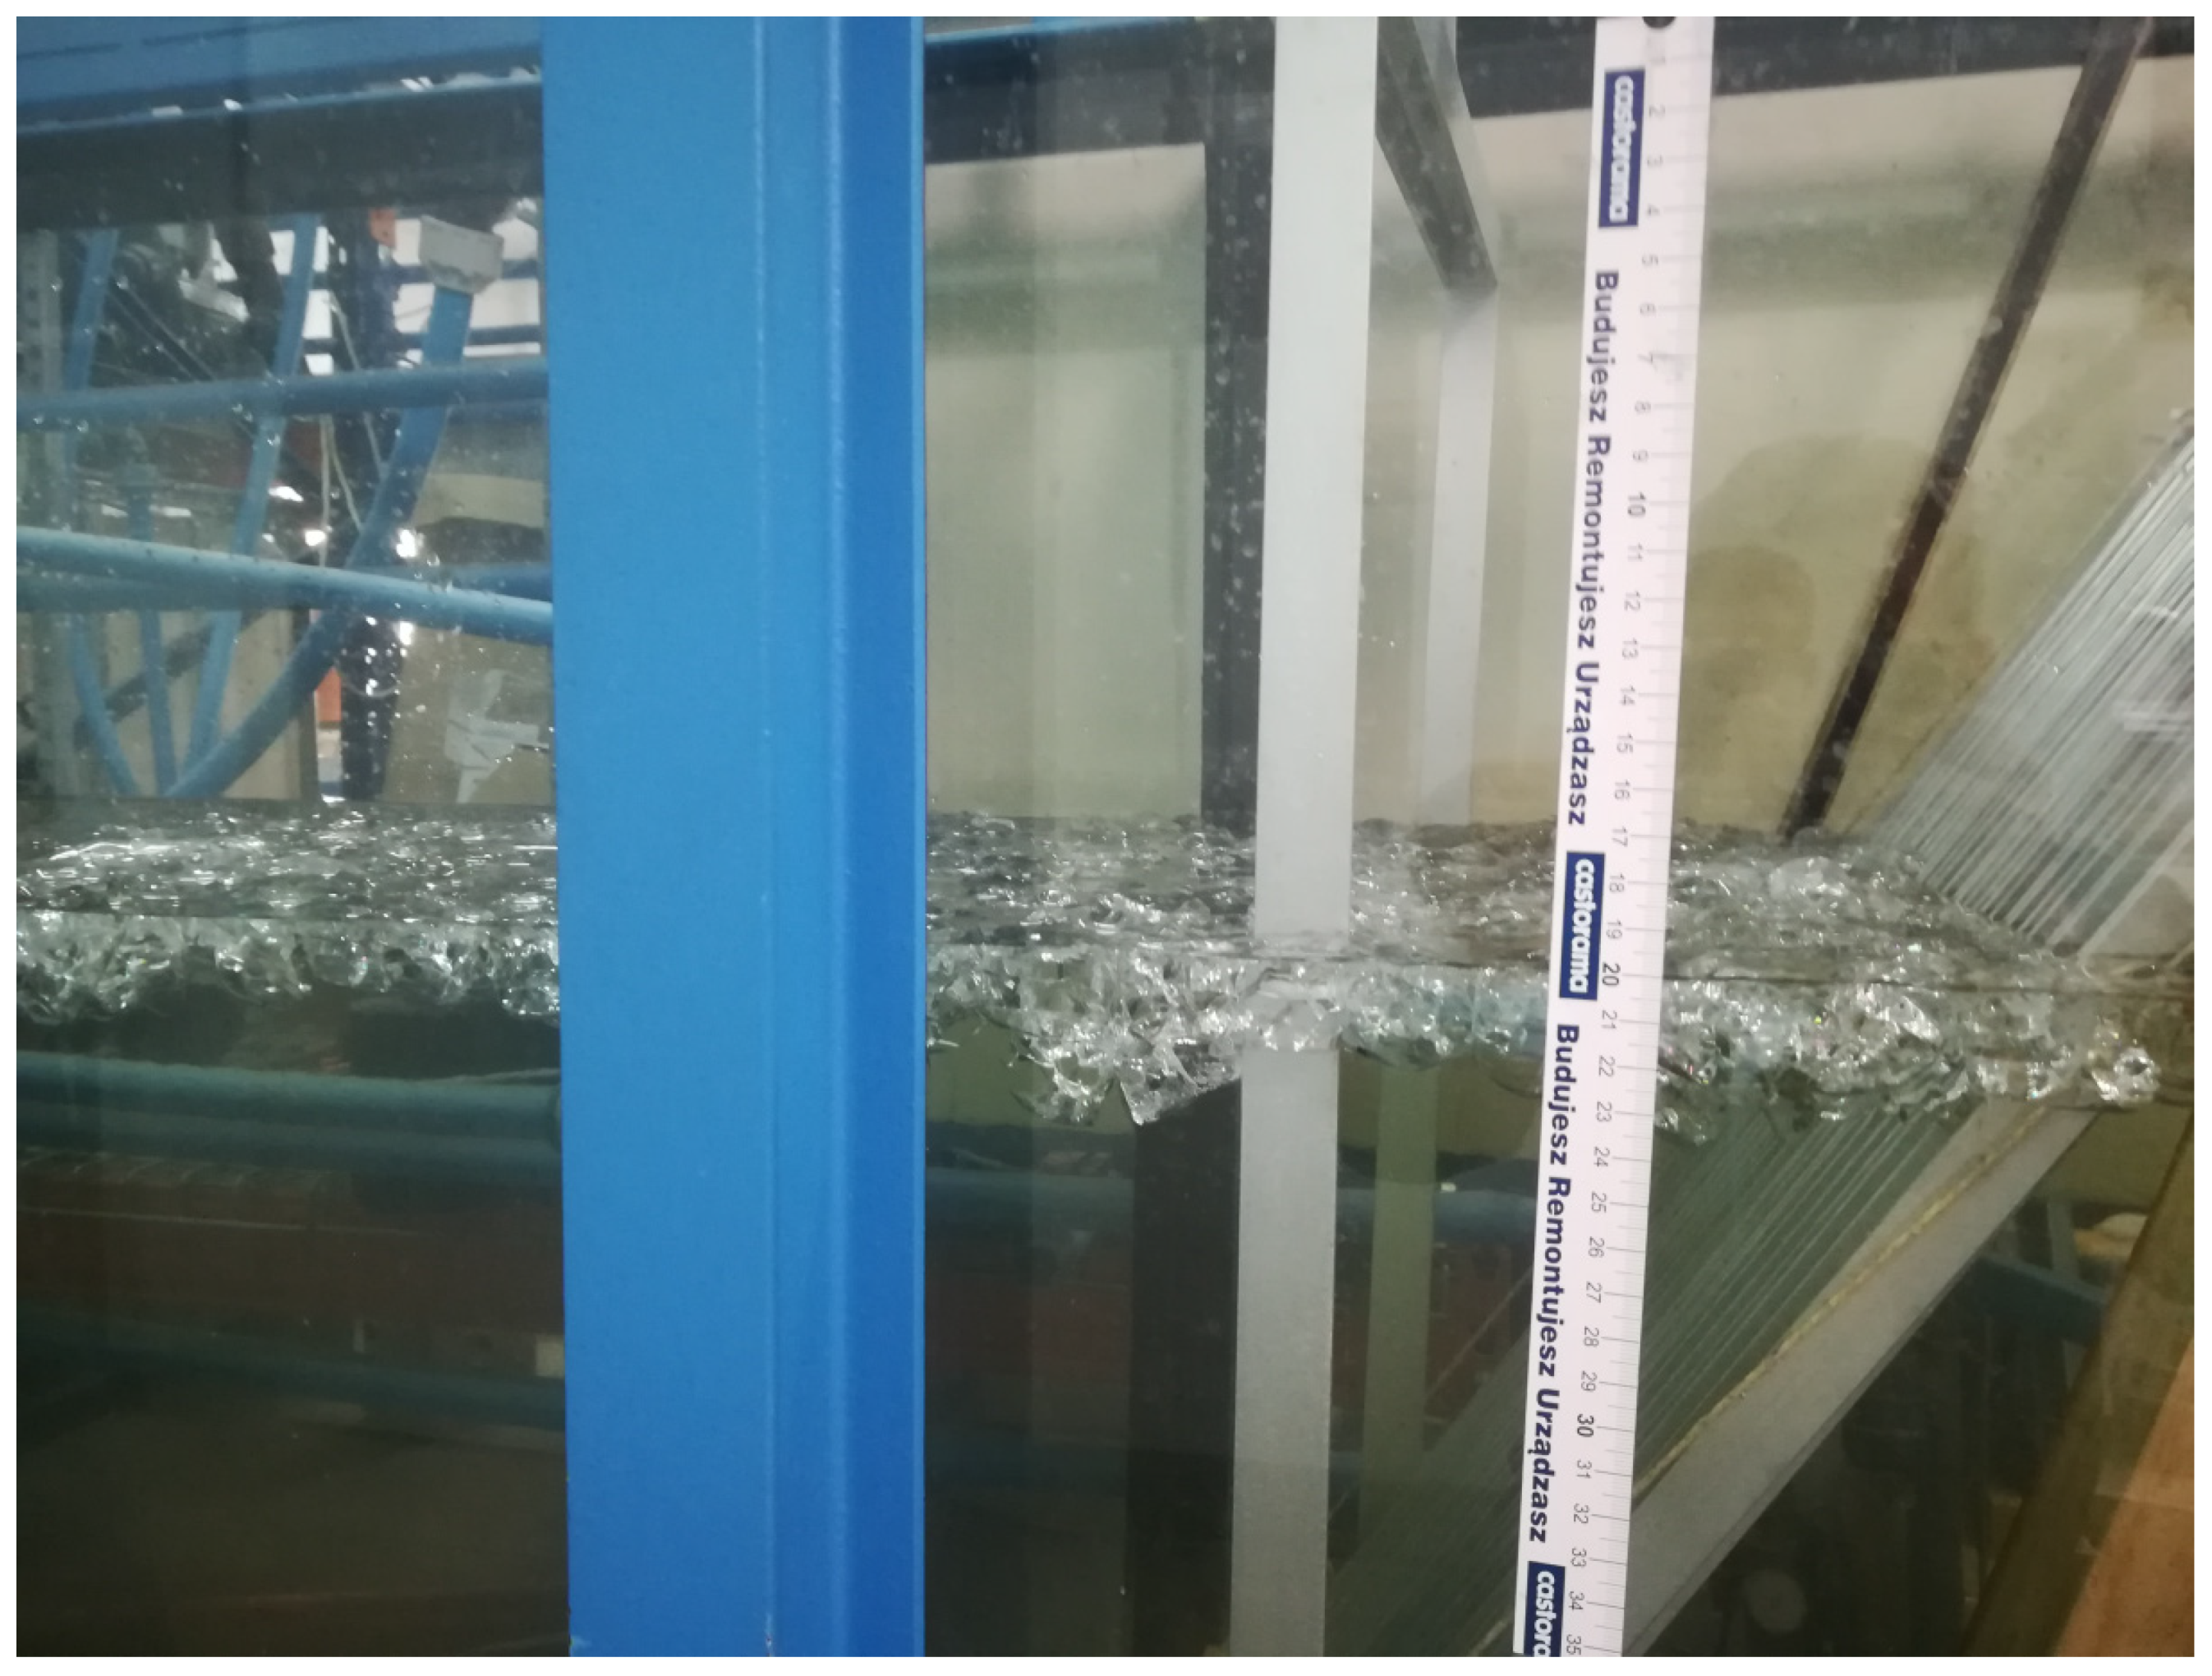
During the study it was observed that a 1.6 kg dose of ice formed a rectangular cover that was 1.5 cm thick and 20 cm of range in the vicinity of the trash rack (Figure 5). A 4 kg dose of ice caused a blockage of free flow through the trash rack over its entire width and was 2 cm thick and approx. 35 cm of range. As the mass of introduced ice increased, its thickness at the trash rack did not change significantly, since it increased by 1 cm, whereas the ice cover range that formed in front of the trash rack build up to 60 cm (Figure 6).
The appearance of ice on trash racks caused a reduction of head by up to 14% (from 6.3 to 14.7%) compared to the flow without ice. Blocking the ice of a hydro power trash racks can develop extremely quickly, and within a few minutes, a large portion of the racks can be blocked [47]. Ice also causes losses in energy production, as confirmed by the analysis of the operation of the 55 MW Svorkmo hydroelectric power plant located on the Orkla River in central Norway. In February 1987, when tracks was blocked by ice, head losses amounted to as much as 10% [36].
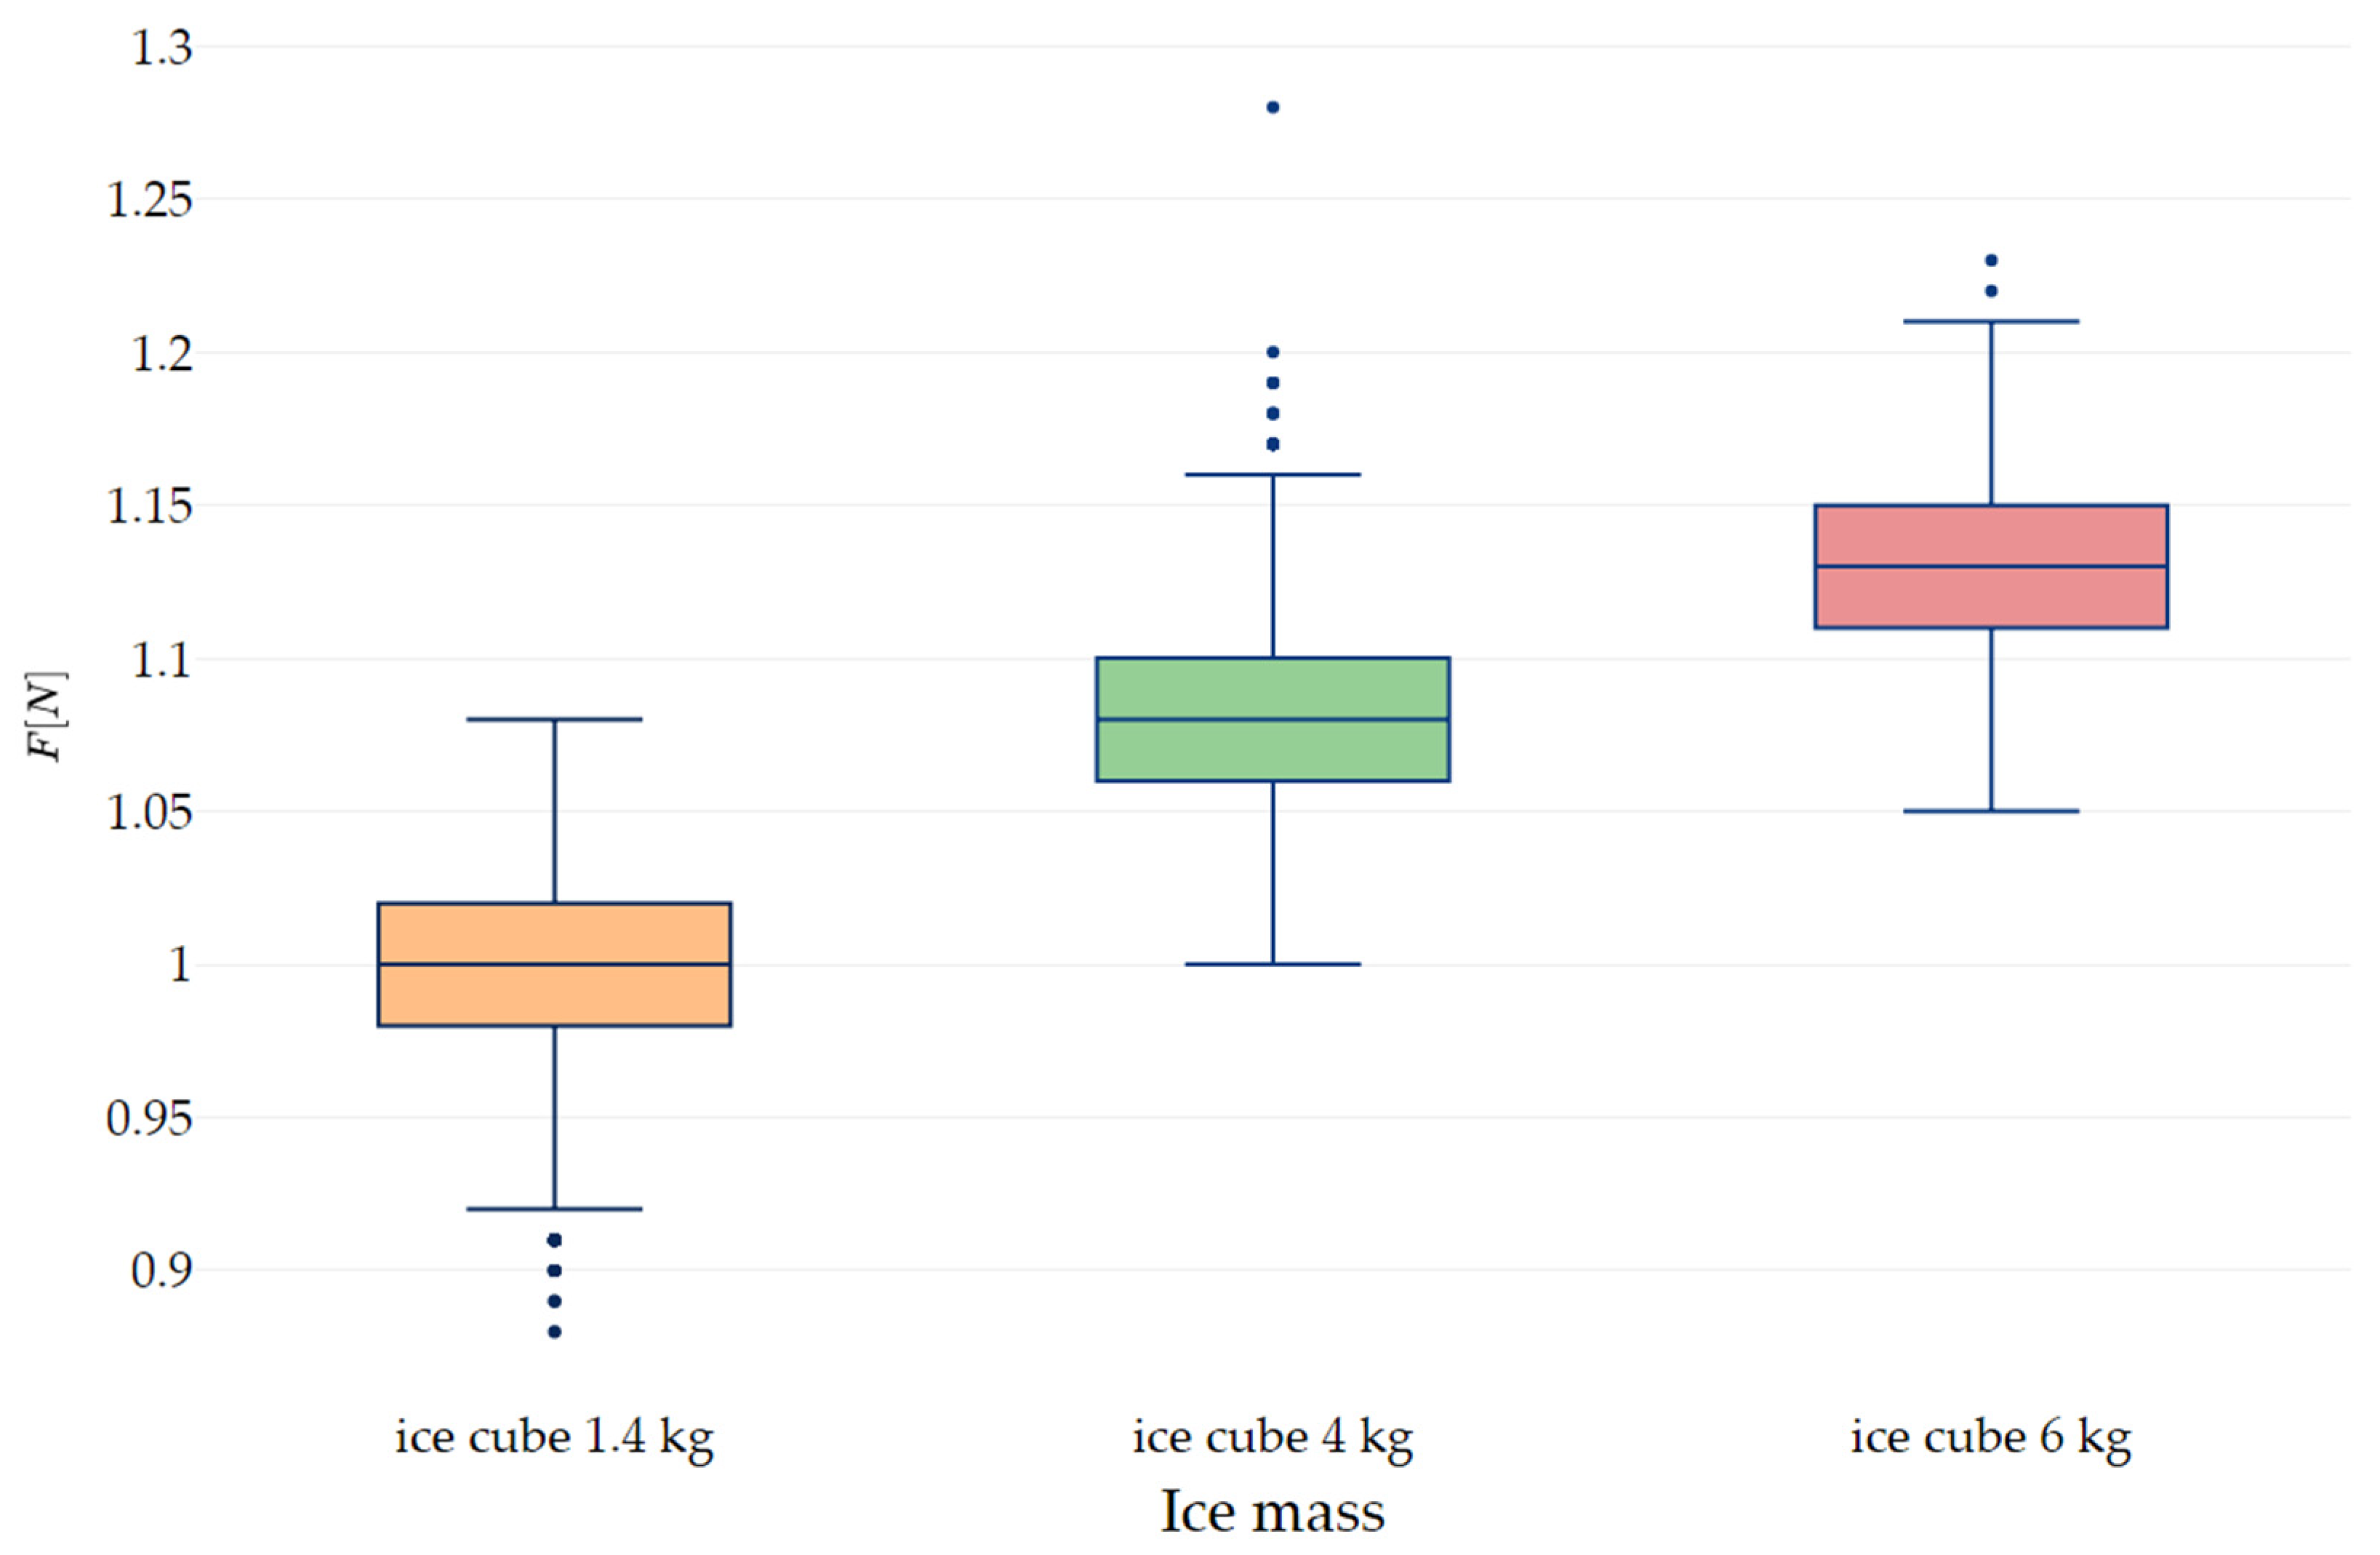
Table 1 shows the average values of flow rate, drag force and drag coefficient. In addition, the Reynolds number was designated to determine the type of movement. The distribution of drag force over the ice mass shown in the Figure 7.
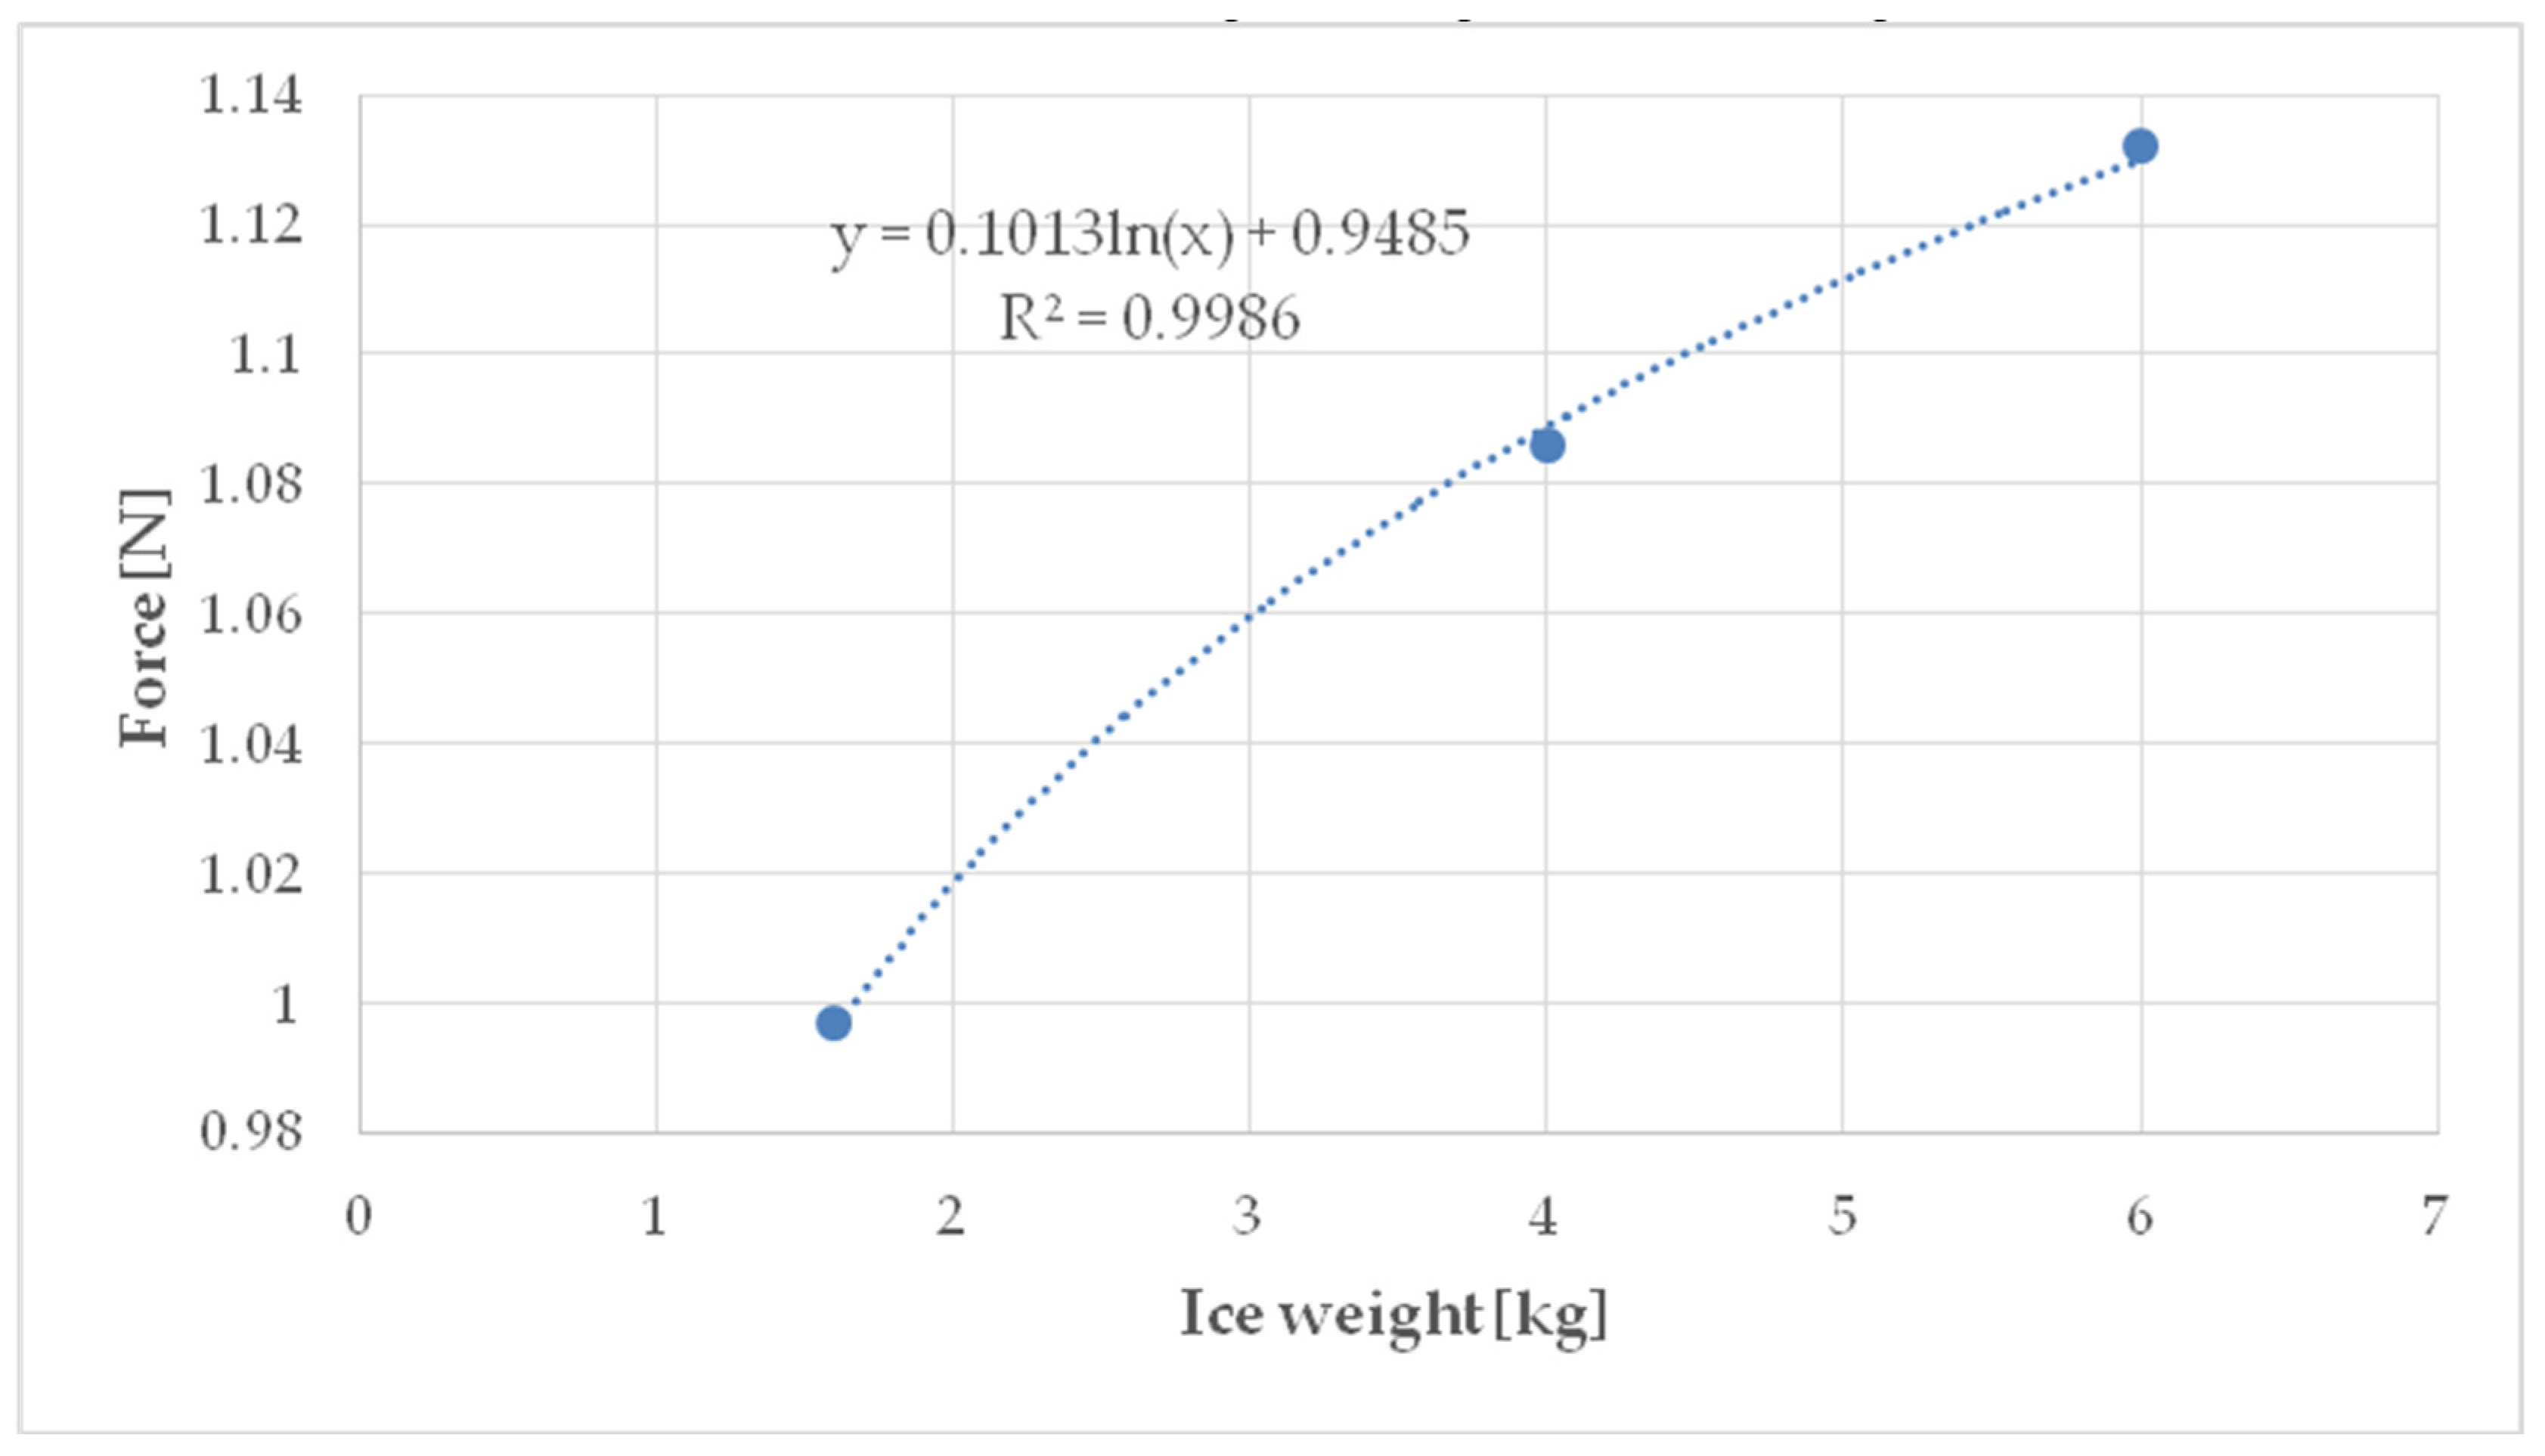
By analyzing Table 1 and Figure 7, it can be observed that the drag force in the examined range increases logarithmically (Figure 8) and is correlated with the increase in ice weight and the area that blocks a free flow of water. The average value of the force F (and Standard Deviation) for ice mass 1.4, 4 and 6 kg were 0.997 (SD = 0.0315), 1.081 (0.0284) and 1.13 (0.0266), respectively. Based on the value of the Reynolds number, the flow rate can be characterized as transient. Böttcher et al. [48] demonstrated that the head loss coefficient is independent from the Reynolds number in a range from 750 to 3500 and increases with an increasing blockage ratio and angle of trash racks.
An almost four-fold increase in weight (3.75) of ice resulted in a nearly three-fold increase in the value of drag force/drag coefficient. This translated into an approx. 0.02 m drop of the water table on the trash rack (measured with a pin gauge in front and behind it). Based on observations during the laboratory tests, it can be stated that ice accumulated in the immediate vicinity of the trash rack and formed an ice cover, whose range obviously depended on the amount of ice introduced in the system (Figure 5 and Figure 6) and in the total covered approx. 5% of the cross-section. With regard to corresponding coverage of the cross section by plant debris [34], it was observable that the water level decreased by 0.05 m. Szabo-Meszaros et al. [49] indicated that hydraulic losses on clean trash racks can reach 0.05 m depending on the trash racks designs.
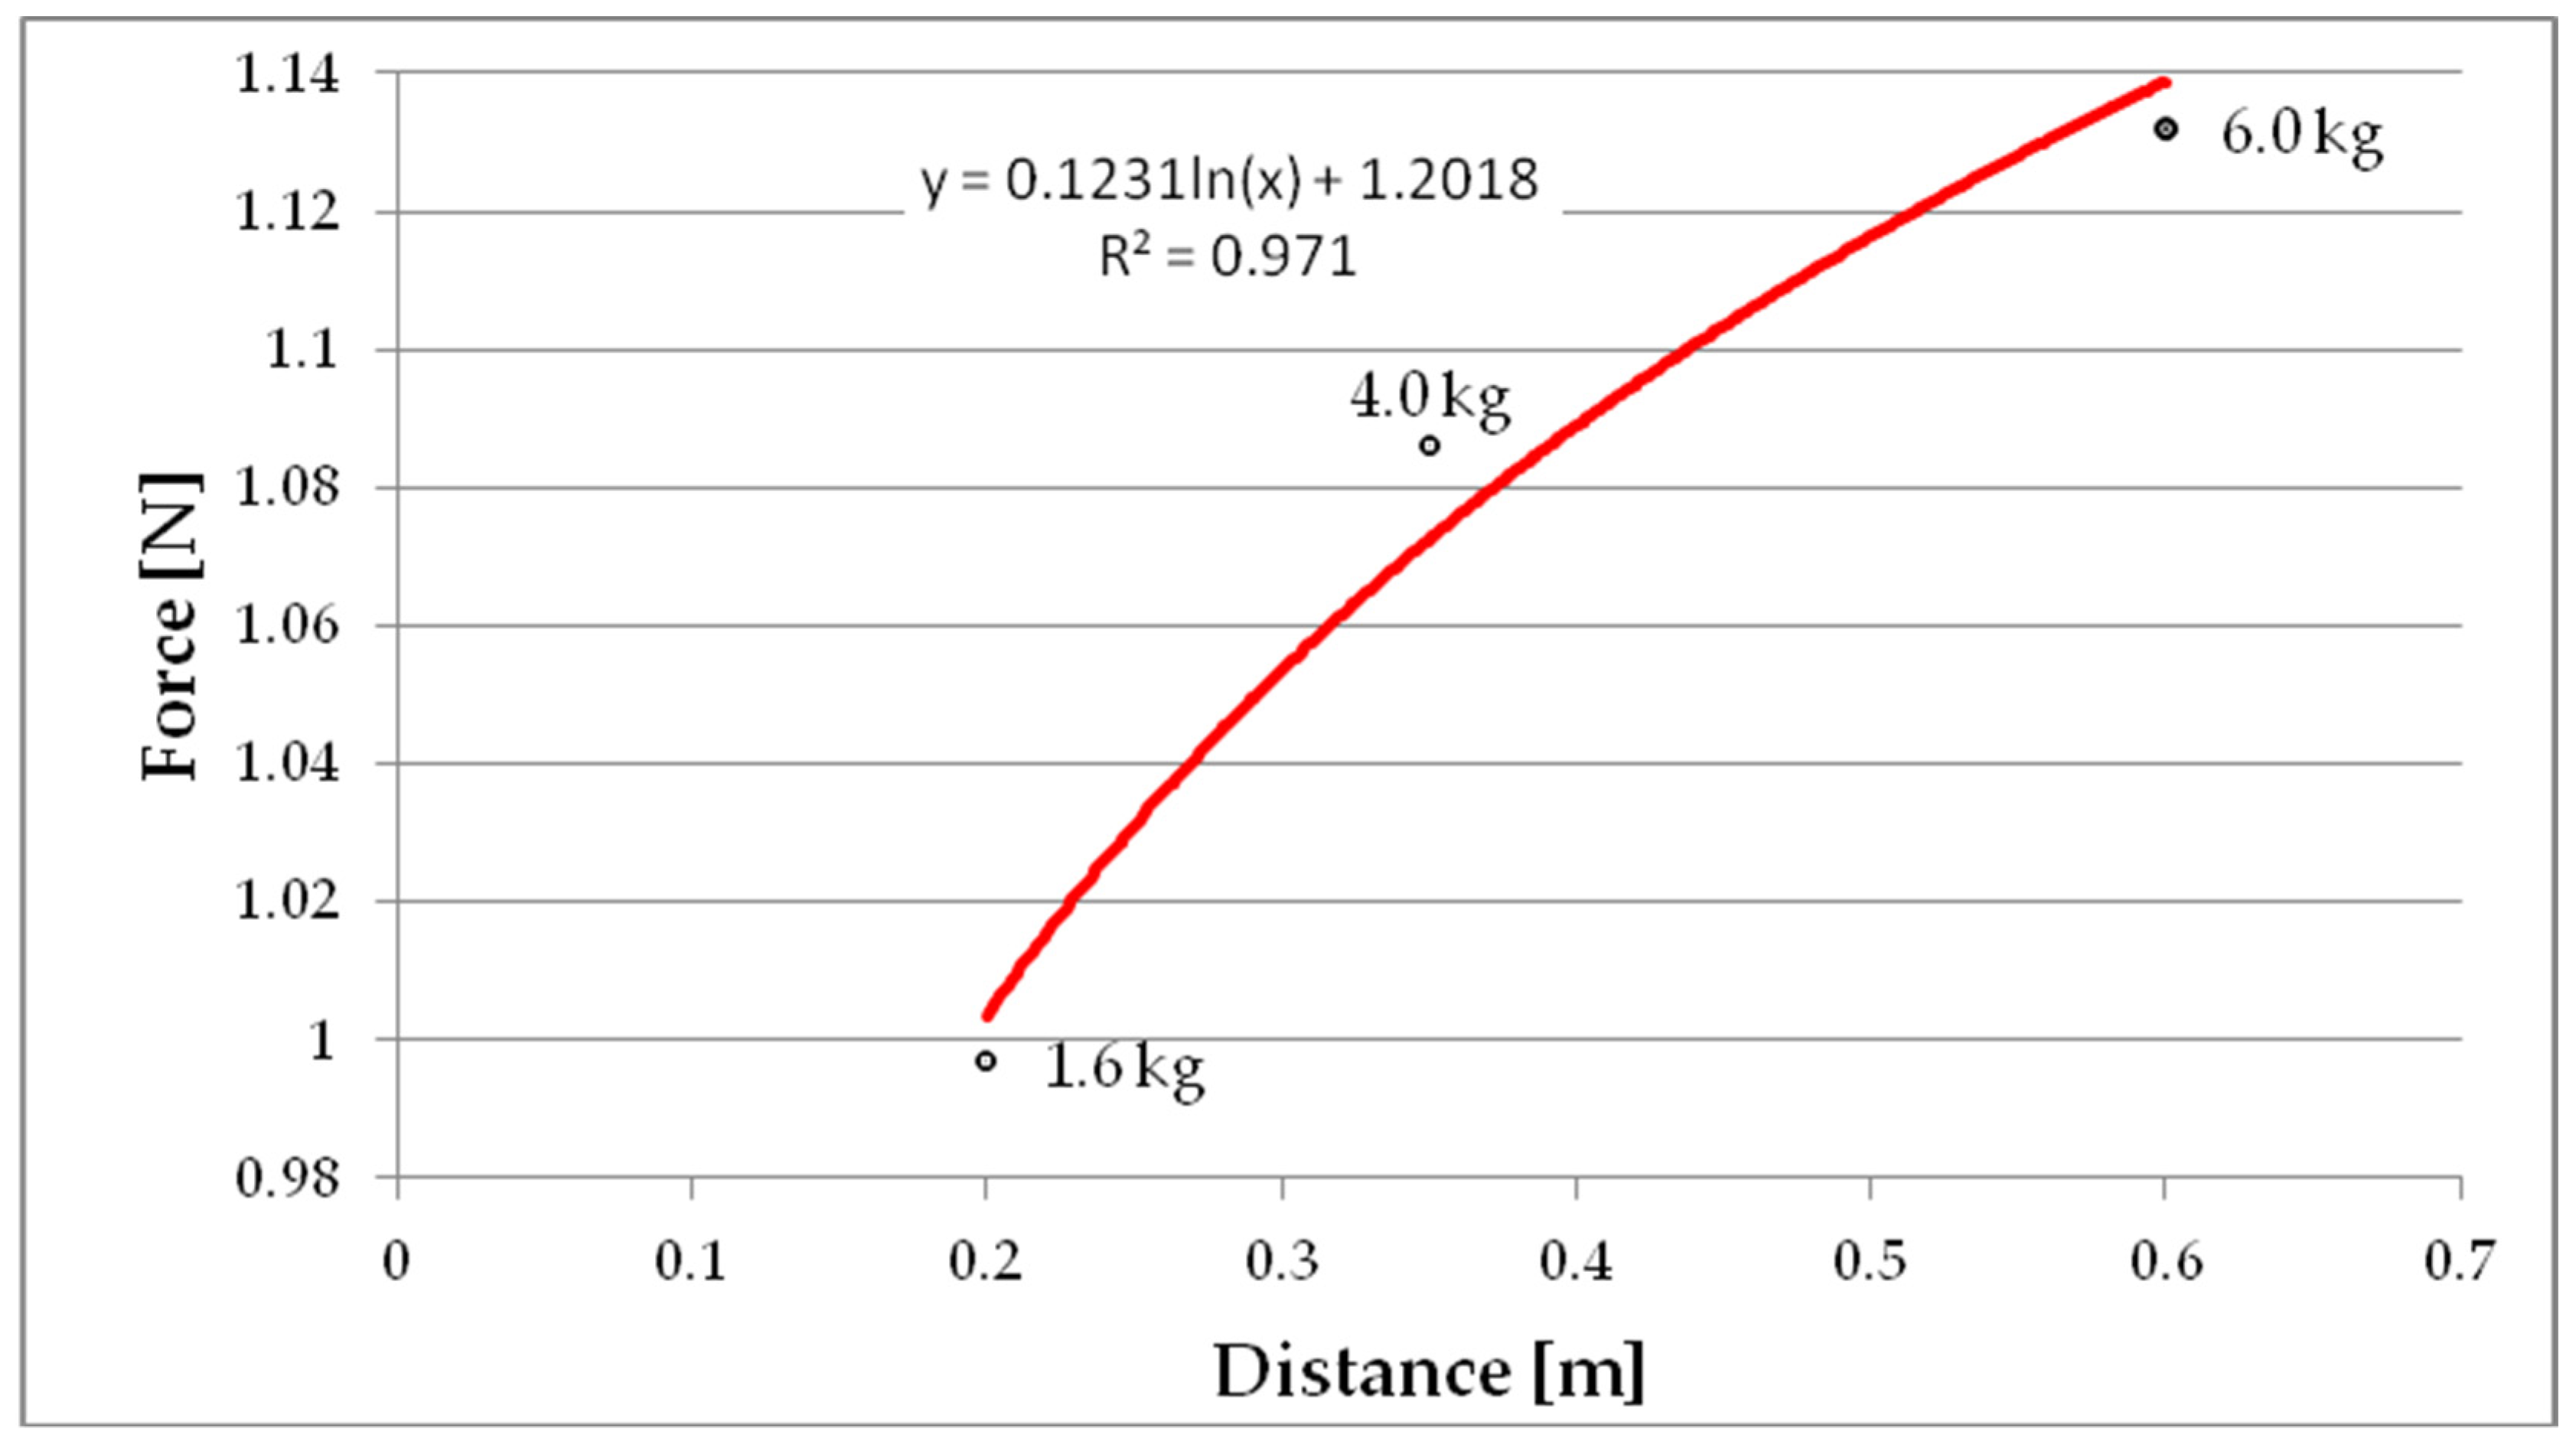
The correlation between the ice cover range and the magnitude of its impact on the trash rack depending on the amount of ice introduced (Figure 9) is characterized by a logarithmic distribution with a coefficient R2 = 0.97. Assuming that the distribution remains unchanged, it is possible to estimate the ice force for a much greater range of the ice cover, and thus determine the coefficient Cw (Table 2) for constant flow values Q.
4. Conclusions
Performing an analysis of ice jams occurring on hydraulic structures and their impact on technical infrastructure should be preceded by model tests. Therefore, laboratory tests seem to be a valuable contribution to the better understanding of physical processes that might be used as tools for planning and designing engineering structures. It should be remembered that the problems related to ice phenomena and their impact on the environment are local. The determination of ice jam duration and intensity should take into account, i.e., the river gradient, anthropogenic factors and characteristics of a given riverbed. The presence of hydraulic structures and various natural factors affects the thermal characteristics of river water and the rate of its freezing. The occurrence of ice jams and icing can be a serious problem to hydraulic structures threatening their stability and proper operation. Currently, climate change is observed, where the period in which ice appears is shortening; nevertheless it can pose significant threats to the operation of the power plant [50]. The instability of climatic conditions can be conducive to the danger of losing stability of the local electrical system. With regard to hydropower structures, losses resulting from increased flow resistance through ice-covered/ice-blocked trash racks may be equally important and will directly translate into financial losses.
The conducted research shows that the accumulated ice on SHP trash racks can negatively affect them, which is mainly associated with the increasing of drag force (increase of head losses). In the analyzed cases, it was shown that the appearance of ice on the racks caused a reductions of head losses up to 14% and it was comparable to the values equal 10% estimated by Gebre et al. [36]. Similar amounts of head losses were shown by others researchers who considered covering the trash racks with debris. Hribernik [51] noted that incomplete debris removal increased head losses up to 18%.
In this research, ice was added into the channel model equipped with trash racks, which caused the formation of an ice rectangular cover in front of them. The average thickness of the ice cover was about 0.02 m; the range was from 0.2 to 0.6 m, which depended on the weight of the added ice. It also caused the water level to drop by about 0.02 m on the trash rack. Hriberinik [44] analyzed head losses at a 20 MW hydropower plant and he estimated that debris caused up to 140 MWh of electricity losses over the year. It was also estimated that head losses at 0.06 mH2O caused about 27 MWh of power losses per year.
The conducted research was of a laboratory nature and verification of a real case in SHP is recommended. The authors plan to undertake further research in this direction, both laboratory and field work on a real object.
The undoubted advantage of this research is information for potential owners of small hydropower plants as to what danger (reduction or loss of water channel capacity and thus profits) can be caused by ice.
Author Contributions
Conceptualization, N.W.; methodology, N.W.; validation, N.W., J.N. and Z.W.; formal analysis, N.W. J.N. and Z.W.; investigation, N.W. and J.N.; writing—original draft preparation, N.W.; writing—review and editing, N.W., J.N. and Z.W.; visualization, Z.W. All authors have read and agreed to the published version of the manuscript.
Funding
This research received no external funding.
Conflicts of Interest
The authors declare no conflict of interest.
References
- Ashton, G.D. River and Lake Ice Engineering; Water Resources Publication: Chelsea, MI, USA, 1986; ISBN 0918334594. [Google Scholar]
- Morse, B.; Hicks, F. Advances in river ice hydrology 1999–2003. Hydrol. Process. 2005, 19, 247–263. [Google Scholar] [CrossRef]
- Beltaos, S. Progress in the study and management of river ice jams. Cold Reg. Sci. Technol. 2008, 51, 2–19. [Google Scholar] [CrossRef]
- Prowse, T.; Shen, H.T. River ice ecology. Impacts of Global Climate Change. In Proceedings of the World Water and Environmental Resources Congress 2005, Anchorage, AK, USA, 15–19 May 2005; p. 1. [Google Scholar]
- Engström, J.; Jansson, R.; Nilsson, C.; Weber, C. Effects of river ice on riparian vegetation. Freshw. Biol. 2011, 56, 1095–1105. [Google Scholar] [CrossRef]
- Prowse, T.D.; Beltaos, S. Climatic control of river-ice hydrology: A review. Hydrol. Process. 2002, 16, 805–822. [Google Scholar] [CrossRef]
- de Rham, L.P.; Prowse, T.D.; Beltaos, S.; Lacroix, M.P. Assessment of annual high-water events for the Mackenzie River basin, Canada. Hydrol. Process. 2008, 22, 3864–3880. [Google Scholar] [CrossRef]
- Alfredsen, K.; Morten, S.; Curtis, P. Ice formation and breakup in steep streams. In Proceedings of the 18th IAHR International Symposium on Ice, Sapporo, Japan, 28 August–1 September 2006. [Google Scholar]
- Turcotte, B.; Morse, B. A global river ice classification model. J. Hydrol. 2013, 507, 134–148. [Google Scholar] [CrossRef]
- Shen, H.T. Mathematical modeling of river ice processes. Cold Reg. Sci. Technol. 2010, 62, 3–13. [Google Scholar] [CrossRef]
- Buffin-Bélanger, T.; Bergeron, N.E.; Dubé, J. Ice formation in small rivers. In River Ice Formation; Beltaos, S., Ed.; Commit-tee on River Ice Processes and Environment, CGU-HS: Edmonton, AB, Canada, 2013; pp. 385–409. [Google Scholar]
- Hamududu, B.; Killingtveit, A. Assessing climate change impacts on global hydropower. Energies 2012, 5, 305–322. [Google Scholar] [CrossRef] [Green Version]
- Gebre, S.; Timalsina, N.; Alfredsen, K. Some aspects of ice-hydropower interaction in a changing climate. Energies 2014, 7, 1641–1655. [Google Scholar] [CrossRef] [Green Version]
- Łukaszewicz, J.; Jawgiel, K. Zmienność częstości i charakteru przebiegu zjawisk lodowych na rzece Parsęcie w aspekcie zmian klimatycznych. Badania Fizjograficzne Seria A 2017, 68, 79–98. [Google Scholar]
- Graf, R. Uwarunkowania termiczne tworzenia się i utrzymywania pokrywy lodowej na Noteci. Pr. Geogr. 2018, 153, 25–47. [Google Scholar]
- Kolerski, T. Modelowanie matematyczne przegród lodowych. Acta Sci. Pol. Form. Circumiectus 2017, 16, 65–76. [Google Scholar] [CrossRef]
- Kolerski, T.; Zima, P.; Szydłowski, M. Mathematical Modeling of Ice Thrusting on the Shore of the Vistula Lagoon (Baltic Sea) and the Proposed Artificial Island. Water 2019, 11, 2297. [Google Scholar] [CrossRef] [Green Version]
- Shen, H.T.; Su, J.; Liu, L. SPH simulation of river ice dynamics. J. Comput. Phys. 2000, 165, 752–770. [Google Scholar] [CrossRef]
- Healy, D.; Hicks, F.E. Experimental study of ice jam formation dynamics. J. Cold Reg. Eng. 2006, 20, 117–139. [Google Scholar] [CrossRef]
- Zaier, I.; Shu, C.; Ouarda, T.; Seidou, O.; Chebana, F. Estimation of ice thickness on lakes using artificial neural network ensembles. J. Hydrol. 2010, 383, 330–340. [Google Scholar] [CrossRef]
- Sun, W. River ice breakup timing prediction through stacking multi-type model trees. Sci. Total Environ. 2018, 644, 1190–1200. [Google Scholar] [CrossRef]
- Beltaos, S. River Ice Jams; Water Resources Publication, LLC: Littleton, CO, USA, 1995; ISBN 091833487X. [Google Scholar]
- Hibler, W.D., III. A dynamic thermodynamic sea ice model. J. Phys. Oceanogr. 1979, 9, 815–846. [Google Scholar] [CrossRef] [Green Version]
- Wake, A.; Rumer Jr, R.R. Great Lakes ice dynamics simulation. J. Waterw. Portcoastaland Ocean Eng. 1983, 109, 86–102. [Google Scholar] [CrossRef]
- Shen, H.T.; Bjedov, G.; Daly, S.F.; Am Lal, W. Numerical model for forecasting Ice Conditions on the Ohio River; CRREL Report 91-16; US Army CRREL: Hanover, NH, USA, 1991. [Google Scholar]
- Shen, H.T.; Wang, D.S.; Am Lal, W. Numerical simulation of river ice processes. J. Cold Reg. Eng. 1995, 9, 107–118. [Google Scholar] [CrossRef]
- Flato, G.; Gerard, R. (Eds.) Calculation of Ice Jam Thickness Profiles. In Proceedings of the 4th Workshop on River Ice, Montreal, QC, Canada, 19–20 June 1986. [Google Scholar]
- Beltaos, S. Numerical computation of river ice jams. Can. J. Civ. Eng. 1993, 20, 88–99. [Google Scholar] [CrossRef]
- Kolerski, T.; Shen, H.T. Possible effects of the 1984 St. Clair River ice jam on bed changes. Can. J. Civ. Eng. 2015, 42, 696–703. [Google Scholar] [CrossRef]
- Beck, C.; Albayrak, I.; Boes, R.M. Improved hydraulic performance of fish guidance structures with innovative bar design. In Proceedings of the 12th International Symposium on Ecohydraulics (ISE 2018), Tokyo, Japan, 19–24 August 2018. [Google Scholar]
- Lučin, I.; Čarija, Z.; Grbčić, L.; Kranjčević, L. Assessment of head loss coefficients for water turbine intake trash-racks by numerical modeling. J. Adv. Res. 2020, 21, 109–119. [Google Scholar] [CrossRef] [PubMed]
- Wojdalska, A. A new dimension of small water power plants in Poland. Globenergia: Odnawialne Źródła Energii 2011, 6, 58–60. [Google Scholar]
- Walczak, N.; Walczak, Z.; Hämmerling, M.; Spychała, M.; Nieć, J. Head losses in small hydropower plant trash racks (SHP). Acta Sci. Polonorum. Form. Circumiectus 2016, 15, 369. [Google Scholar] [CrossRef]
- Walczak, N. Operational evaluation of a small hydropower Plant in the Context of sustainable development. Water 2018, 10, 1114. [Google Scholar] [CrossRef] [Green Version]
- Wieteska, S.; Jeziorska, M. Ocena ryzyka eksploatacji małych elektrowni wodnych dla potrzeb ich ubezpieczenia od wybranych zdarzeń losowych. Studia Ekon. 2018, 353, 125–138. [Google Scholar]
- Gebre, S.; Alfredsen, K.; Lia, L.; Stickler, M.; Tesaker, E. Review of ice effects on hydropower systems. J. Cold Reg. Eng. 2013, 27, 196–222. [Google Scholar] [CrossRef]
- Martin, S. Frazil ice in rivers and oceans. Annu. Rev. Fluid Mech. 1981, 13, 379–397. [Google Scholar] [CrossRef]
- Shen, H.T.; Yapa, P.D. Computer simulation of ice cover formation in the Upper St. Lawrence River. In Proceedings of the 3th Workshop on Hydraulics of River Ice, Fredericton, New Brunswick, 20–21 June 1984. [Google Scholar]
- Ettema, R.; Kirkil, G.; Daly, S. Frazil ice concerns for channels, pump-lines, penstocks, siphons, and tunnels in mountainous regions. Cold Reg. Sci. Technol. 2009, 55, 202–211. [Google Scholar] [CrossRef]
- Gebre, S.B.; Alfredsen, K. (Eds.) Investigation of River Ice Regimes in Some Norwegian Water Courses. In Proceedings of the 16th Workshop on the Hydraulics of Ice Covered Rivers, Winnipeg, MB, Canada, 18–22 September 2011. [Google Scholar]
- Lampl, J. Poprawa wydajności turbin wodnych. Globenergia Odnawialne Źródła Energii 2009, 2, 44–46. [Google Scholar]
- Zayed, M.; El Molla, A.; Sallah, M. An experimental investigation of head loss through a triangular “V-shaped” screen. J. Adv. Res. 2018, 10, 69–76. [Google Scholar] [CrossRef] [PubMed]
- Meusburger, H.; Volkart, P.; Minor, H.E. A new improved formula for calculating trashrack losses. In Proceedings of the Congress-International Association for Hydraulic Research, Beijing, China, 16–21 September 2001. [Google Scholar]
- Hribernik, A. Optimization of a hydropower plant trash rack cleaning frequency. In Proceedings of the 2017 World Congress on Advances in Nano, Bio, Robotics and Energy (ANBRE17), Seoul, Korea, 28 August–1 September 2017. [Google Scholar]
- Benitez, L.E.; Benitez, P.C.; van Kooten, G.C. The economics of wind power with energy storage. Energy Econ. 2008, 30, 1973–1989. [Google Scholar] [CrossRef] [Green Version]
- Jeżowiecka-Kabsch, K.; Szewczyk, H. Mechanika Płynów; Oficyna Wydawnicza Politechniki Wrocławskiej: Wrocław, Poland, 2001; ISBN 8370855911. [Google Scholar]
- Jenssen, L.; Tesaker, E.; Lund, S.; Huber, D. Inntakshåndboken-Rettledning og utforming av inntak til små kraftverk i Norge. Nve’s Hustrykkeri 2006, 1, 1–137. [Google Scholar]
- Böttcher, H.; Gabl, R.; Aufleger, M. Experimental Hydraulic Investigation of Angled Fish Protection Systems—Comparison of Circular Bars and Cables. Water 2019, 11, 1056. [Google Scholar] [CrossRef] [Green Version]
- Szabo-Meszaros, M.; Navaratnam, C.U.; Aberle, J.; Silva, A.T.; Forseth, T.; Calles, O.; Fjeldstad, H.-P.; Alfredsen, K. Experimental hydraulics on fish-friendly trash-racks: An ecological approach. Ecol. Eng. 2018, 113, 11–20. [Google Scholar] [CrossRef]
- Timalsina, N.P.; Alfredsen, K.T.; Killingtveit, Å. Impact of climate change on ice regime in a river regulated for hydropower. Can. J. Civ. Eng. 2015, 42, 634–644. [Google Scholar] [CrossRef]
- Hribernik, A. Evaluation of Clogged Hydropower Plant Trash Rack Losses. Stroj. Vestn./J. Mech. Eng. 2020, 66, 142–152. [Google Scholar] [CrossRef] [Green Version]
Figure 1.
Hydraulic flume.

Figure 2.
Dynamometric platform.

Figure 3.
Diagram of the steps of measurement.

Figure 4.
Changes in drag forces over time for different doses of ice.

Figure 5.
Ice jam, 1.6 kg ice variant.

Figure 6.
Ice jam, 6 kg ice variant.

Figure 7.
The distribution of drag force over the ice mass. The box represents the 25%–75% percentile with median marked, the whiskers are represented upper and lower fences (1.5× the inner quartile range). Dots represent outliers.
Figure 7.
The distribution of drag force over the ice mass. The box represents the 25%–75% percentile with median marked, the whiskers are represented upper and lower fences (1.5× the inner quartile range). Dots represent outliers.

Figure 8.
Correlation between the average drag force and the mass of introduced ice.

Figure 9.
Correlation between the ice cover range and the magnitude of its impact on the trash rack (1.4, 4 and 6—mass of introduced ice).
Figure 9.
Correlation between the ice cover range and the magnitude of its impact on the trash rack (1.4, 4 and 6—mass of introduced ice).


Table 1.
Average values of flow rate, drag force and drag coefficient.
| Ice Weight [kg] | Q [m3s−1] | F [N] | Δh [m] | Vav [ms−1] | Cw [-] | Re [-] |
|---|---|---|---|---|---|---|
| 1.6 | 0.025 | 0.997 | 0.0202 | 0.12 | 0.727 | 1078.6 |
| 4 | 0.024 | 1.086 | 0.0195 | 0.10 | 0.940 | 1005.5 |
| 6 | 0.024 | 1.132 | 0.0205 | 0.11 | 0.906 | 1208.2 |
Table 2.
Estimated Cw values for different ice cover ranges in front of the trash rack.
| L [m] | F [N] | Cw [-] |
|---|---|---|
| 1 | 1.20 | 5.57 |
| 2 | 1.29 | 5.96 |
| 5 | 1.40 | 6.49 |
| 10 | 1.49 | 6.59 |
© 2020 by the authors. Licensee MDPI, Basel, Switzerland. This article is an open access article distributed under the terms and conditions of the Creative Commons Attribution (CC BY) license (http://creativecommons.org/licenses/by/4.0/).
Share and Cite
MDPI and ACS Style
Walczak, N.; Walczak, Z.; Nieć, J. Assessment of the Resistance Value of Trash Racks at a Small Hydropower Plant Operating at Low Temperature. Energies 2020, 13, 1775. https://doi.org/10.3390/en13071775
AMA Style
Walczak N, Walczak Z, Nieć J. Assessment of the Resistance Value of Trash Racks at a Small Hydropower Plant Operating at Low Temperature. Energies. 2020; 13(7):1775. https://doi.org/10.3390/en13071775
Chicago/Turabian StyleWalczak, Natalia, Zbigniew Walczak, and Jakub Nieć. 2020. "Assessment of the Resistance Value of Trash Racks at a Small Hydropower Plant Operating at Low Temperature" Energies 13, no. 7: 1775. https://doi.org/10.3390/en13071775
Note that from the first issue of 2016, this journal uses article numbers instead of page numbers. See further details here.