Rockburst Identification Method Based on Energy Storage Limit of Surrounding Rock

1
School of Civil Engineering, Southwest Jiaotong University, Chengdu 610031, China
2
Key Laboratory of Transportation Tunnel Engineering, Ministry of Education, Southwest Jiaotong University, Chengdu 610031, China
*
Author to whom correspondence should be addressed.
Energies 2020, 13(2), 343; https://doi.org/10.3390/en13020343
Submission received: 11 October 2019
/
Revised: 12 November 2019
/
Accepted: 9 January 2020
/
Published: 10 January 2020
(This article belongs to the Section B: Energy and Environment)
Abstract
:Rockbursts are one of the prominent problems faced by deep underground engineering. Not only do they affect the construction progress, but they also threaten the safety of construction personnel and equipment, and may even induce earthquakes. Therefore, the prediction of rockbursts has very important engineering significance for the excavation of deeply buried tunnels. In this paper, a new indicator for stability and optimization evaluation of hard, brittle surrounding rock under high geo-stresses, namely the minimum energy storage limit of surrounding rock induced by transient unloading, is proposed. In addition, the time for erecting support for tunnel excavation in the rockburst area and the impact of excavation dimensions on rockburst are investigated. The results show that transient unloading during the tunnel excavation process will reduce the energy storage limit of the rock mass. When the strain energy density of the local surrounding rock exceeds the minimum energy storage limit of the rock mass, the rock mass energy is suddenly released, and rockburst occurs. Rockburst is most likely to occur at 0.42–0.65 D away from the working face. The increasing length of a round adopted in high geo-stress areas will make the surrounding rock unstable and increase the probability of rockburst.
1. Introduction
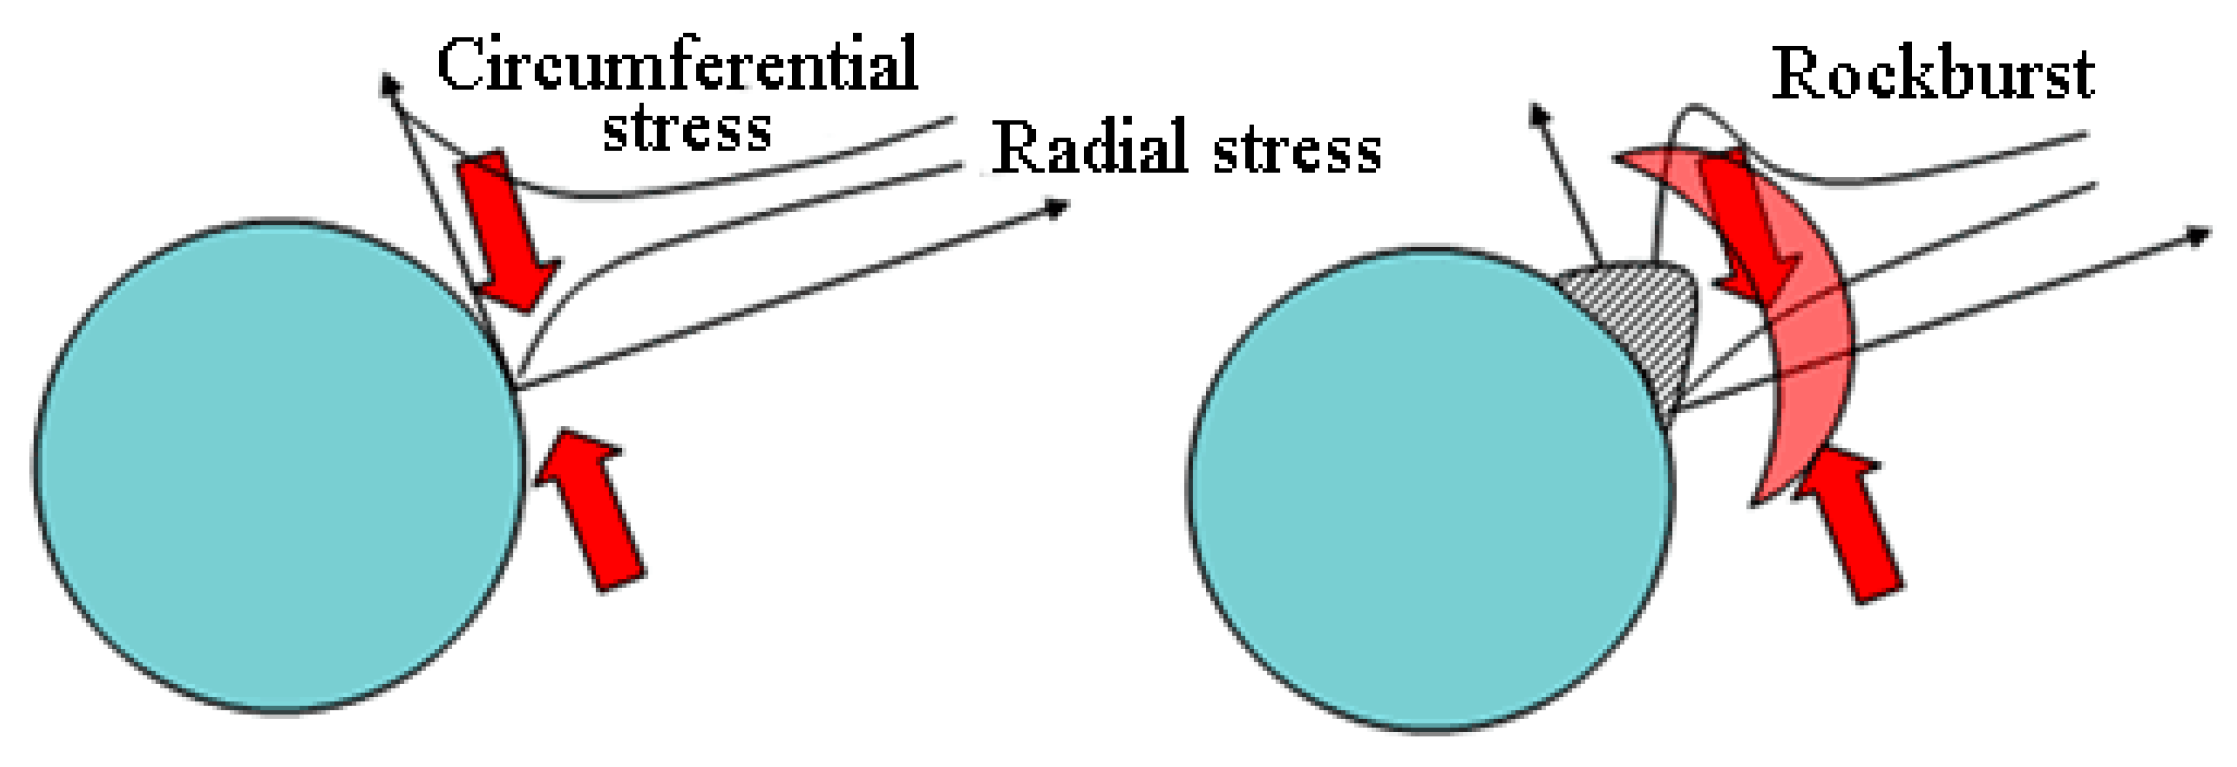
Rapid economic growth is boosting the development of underground resources and the construction of deep underground infrastructure at an unprecedented speed [1,2,3]. Due to the increasing depth and the impact of structural stresses, deeply buried tunnels often pass through high geo-stress areas with complicated strata [4,5,6,7,8,9,10,11]. High elastic strain energy exists in deep rock masses in high geo-stress areas. Affected by far-field stress, energy accumulates near the excavation face during the excavation. When the accumulated strain energy exceeds the energy storage limit of the rock mass, excessive energy will be released abruptly, of the rock mass near the tunnel wall are violently ejected from the parent rock, as shown in Figure 1. This process is referred to as rockburst [12,13,14]. Serious rockbursts have occurred during the construction of many projects. They are a major safety hazard for underground construction, especially deep underground construction, and badly restrict the development of underground space [15,16,17,18,19,20,21].
Numerous researchers have carried out in-depth studies on the generation mechanism and prediction of rockburst. Cook conducted a large number of tests on mine earthquakes via the seismic network and found that the frequency of mine earthquakes is far higher than that of rockburst. This indicates that only a small number of mine earthquakes are related to rockburst. Cook states that if excessive energy exists in the deformation stage after the loads borne by rock reach the limit, the rock mass will be subject to severe failure [22,23]. Since the 1960s, Ortlepp has tracked hundreds of rockburst occurring in gold mines of South Africa and elaborated on the rockburst source and failure mechanisms. He pointed out that strain rockburst was characterized by the occurrence in stress concentration areas, mine earthquakes occurred after rockburst, and the rockburst source was possibly not the same as the failure source [17,24]. Bažant et al. focused on the study of the size effect and energy loss of cracks during their growth, making it possible to estimate the rockburst energy [25,26]. Wang et al. predicted rockburst based on the results of uniaxial cyclic loading and unloading tests [27]. Xie studied the generation mechanism of rockburst based on fractal geometry and proposed a method for predicting rockburst accordingly [28]. Bagde et al. evaluated the stability of burst-prone rocks during mining by conducting uniaxial dynamic cyclic loading and unloading tests [29]. Tang et al. introduced a microseism monitoring system and applied microseism monitoring technology for rockburst monitoring and early warning. By comparing the actual site situation with the microseism monitoring results, they revealed the correlation between the microseism evolution and the rockburst, explained the causes of rockburst in terms of internal and external factors influencing the rockburst, and put forward four rockburst criteria [10,30,31,32,33]. Feng et al. made comprehensive use of positive functions of microseism monitoring and acoustic emission technologies and focused on the study of the generation mechanism of tunnel rockburst, monitoring and early warning, and the dynamic support in the later period. They revealed the generation mechanisms and microseism evolution laws of different types of rockburst and proposed the dynamic prevention and control techniques for different types of rockburst [12,34,35,36,37,38]. Zhang et al. proposed an integrated rockburst criterion composed of five factors and put forward comments and suggestions on criteria, classification, and prevention of rockburst on the basis of the existing data [39]. Gong et al. developed a distance discriminant analysis model for rockburst occurrence and intensity classification prediction based on distance discriminant analysis theory. They proposed a method for predicting rockburst occurrence and intensity based on the failure status of laboratory rock tests [40]. Various researchers analyzed the rockburst source and failure mechanism based on energy theory, strength theory, rigidity theory, instability theory, bump proneness theory, catastrophe theory, chaos theory, fractal theory, and dissipative structure theory. They classified rockburst according to many rockburst experience criteria [19,41,42,43,44,45]. However, there is no unified understanding of the occurrence conditions, mechanism, and criteria of rockbursts. Huge controversies exist. How to effectively and accurately predict and prevent rockburst is a major challenge.
Rockburst is a dynamic phenomenon accompanied by a release of energy. The study of rockburst from the perspective of energy has a reasonable basis. Based on the summary and analysis of the theoretical results of rockburst in South Africa, Cook et al. created an energy theory for the study of rockburst. Based on summarizing the rockburst research and prevention in South Africa over 15 years, he proposed an energy theory which states that a large amount of energy is required for the ejection of rock masses and vibration of surrounding rock during rockburst. Moreover, this is related to the surrounding rock because the failed ore body itself does not have such a large amount of energy [46]. It is apparent from this judgment that the study of rockburst must depend on in-depth analysis of the stress–strain state, bearing capacity, and stored energy of surrounding rock. Many energy theories from different angles and at different levels have been developed in various countries. The representative theory is that proposed by Bieniawski et al. for the study and analysis of rockburst status based on such indicators as the bump energy (KE) and the elastic energy (WET) from the perspective of the mechanical properties of the rock itself. This is of great significance for the study of rockburst potential [47,48]. However, such rockburst propensity indicators cannot reflect the correlation between the rock deformation and failure, and the elastic deformation energy storage, and energy dissipation of deformation and failure during a rockburst. Xie et al. pointed out that the deformation and failure process of rock is a damage evolution process with energy dissipation and set up the strength loss criterion based on energy dissipation [49,50]. You and Hua conducted the routine triaxial test on siltstone and analyzed the energy change of rock specimens in the process of failure [51]. Wang et al. notes that the strain energy of rock masses is the key factor inducing rockburst. The occurrence of rockburst not only depends on the amount of strain energy stored in rock but also on the environment of stress concentration and energy accumulation in construction activities [27]. Weng et al. adopted the energy indicator (i.e., strain energy density (SED)) and a numerical simulation method to analyze the process of energy accumulation and dissipation before and after a rock failure [52]. Zhang et al. carried out the routine triaxial test on marble, limestone, and sandstone to study the nonlinear evolution characteristics of energy in the process of rock deformation [53]. Based on the analysis of energy exchange between the tester and rock specimens, Zhu et al. conducted an overall analysis of the energy dissipation law in the process of a failure at reduced confining pressure of rock specimens, and the correlation between the energy, specimen deformation, and confining pressure [54]. Tang et al. proposed the use of energy storage and dissipation factor (K) as criteria for rockburst propensity from the perspective of energy storage and dissipation in the process of rock strain and failure [55]. The deformation and failure mode of deep rock masses is significantly different from that of shallow rock masses, showing obvious discontinuous and nonlinear characteristics. In fact, in the final analysis, rock failure is a phenomenon of state instability driven by energy [56,57,58,59]. Therefore, if the energy transfer and conversion in the process of deformation and failure of deep rock can be analyzed in detail, and a strength theory based on the energy change as the failure criterion can be established, it is possible to truly reflect the failure law of deep rock masses and provide a method for quantitatively describing the actual degree of rockburst occurring during tunnel construction in deep rock masses, and thus accurately predict rockburst.
From the perspective of energy and engineering applications, a new indicator for evaluating stability and optimization of hard brittle surrounding rock under high geo-stresses is proposed in this paper, namely, the minimum energy storage limit of surrounding rock induced by transient unloading (Umix), based on energy theory to address the limitations of conventional indicators for rockburst energy. By combining the indicator calculation and numerical calculation, the location and strength of rockburst occurring in the process of underground engineering excavation under high geo-stresses can be predicted quantitatively in a more reasonable manner. Based on the study of the Daxiangling Tunnel of the Ya’an–Xichang Expressway in a high geo-stress area, and according to the minimum energy storage limit of surrounding rock induced by transient unloading (Umix), the correlation between the conditions that cause rockburst during tunnel excavation in high geo-stress areas, and the energy distribution and density of surrounding rock, are discussed from the perspective of the energy storage limit and dissipation of rock masses. By tracking changes in the elastic energy density of each unit and recording the locations of high energy density units after the Daxiangling Tunnel was excavated, the possible locations and potential risks of rockburst occurring in the high geo-stress conditions of the tunnel are analyzed. In addition, the time taken to erect support for tunnel excavation in the rockburst area and the impact of excavation dimensions on rockburst are studied. This paper provides a reference for protection and rockburst prediction for deep rock construction.
2. Rockburst Energy Criteria
2.1. Energy Storage Limit Induced by Transient Unloading
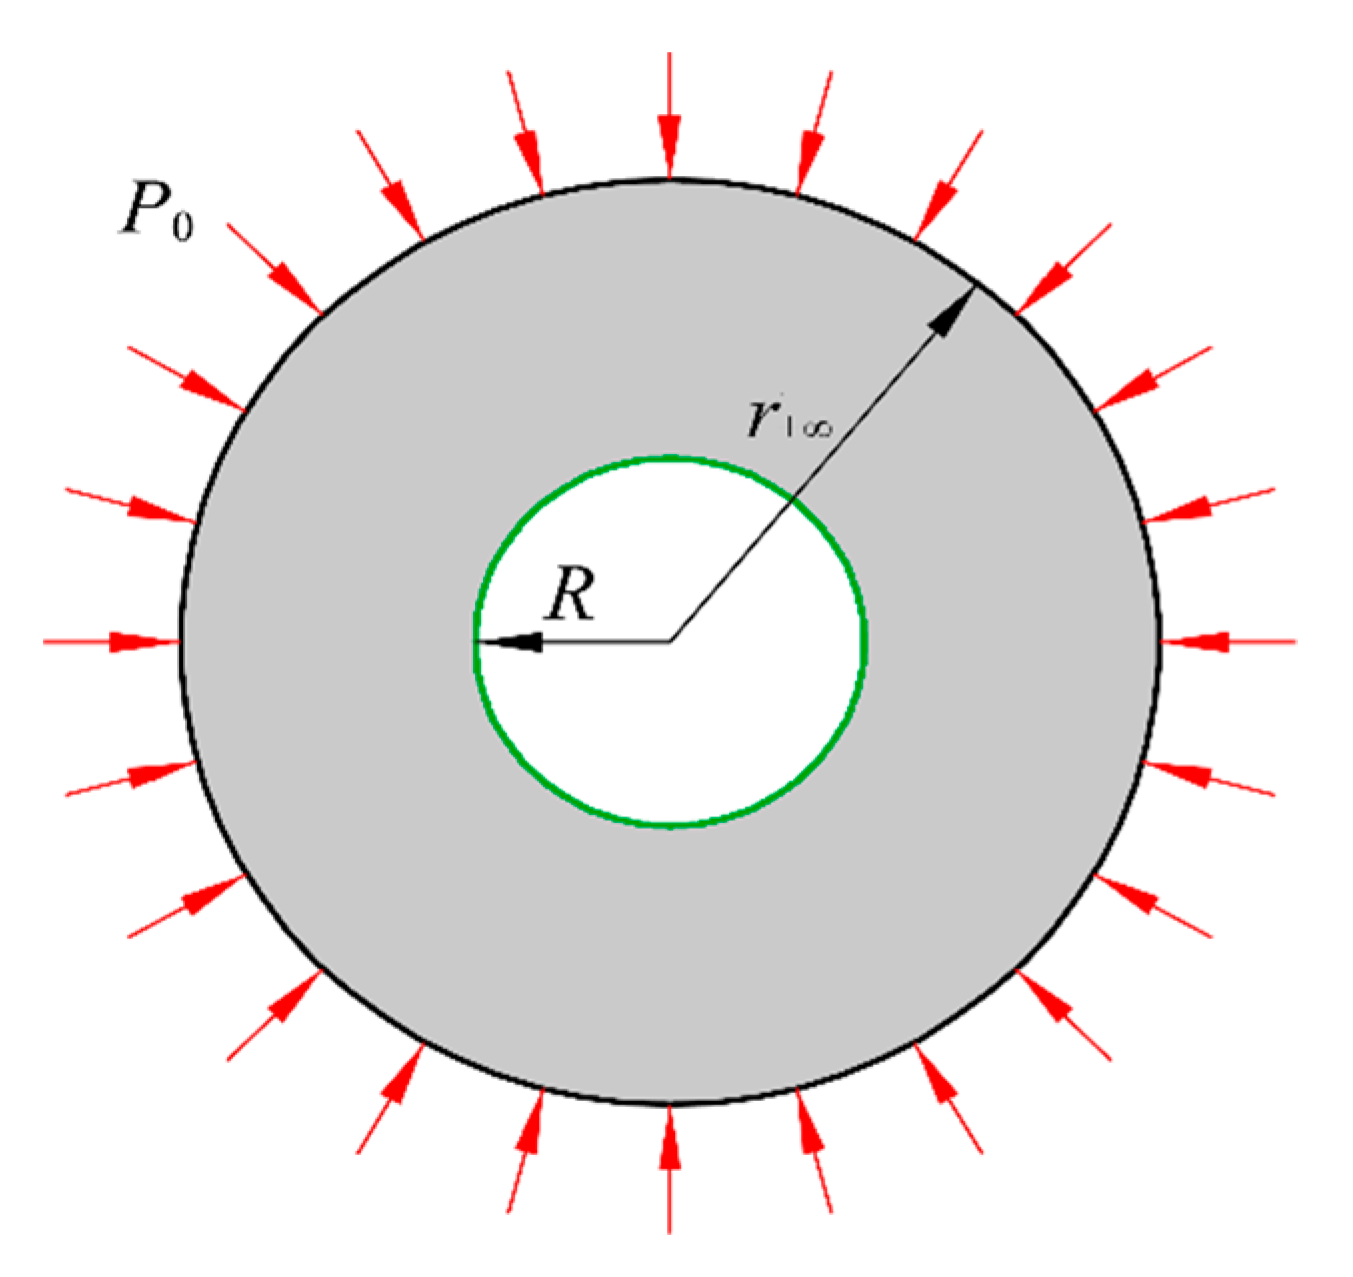
When the energy accumulated in the surrounding rock exceeds its energy storage limit, energy will be released [51,60]. Therefore, determining the energy storage limit of surrounding rock is the key for the analysis of the energy release process of that rock. We assume that a circular tunnel with an infinite length is excavated in a hydrostatic stress field, the tunnel radius is R, and the far-field geo-stress is P0 (Figure 2). In the quasi-static unloading condition, the plane strain axisymmetric result can be directly cited as the surrounding rock stress:
where σθ and σr are the circumferential normal stress and the radial normal stress of the surrounding rock after excavation, respectively; σ1 is the primary principal stress, σ2 is the secondary principal stress, and σ3 is the tertiary principal stress; and r is the distance to the center of the tunnel.
The test study shows that when the surrounding rock is at the same confining pressure, the maximum strain energies that can be stored before the failure are basically the same [61]. This indicates that the energy required for rock failure is a constant value under certain conditions. Because the in-situ geo-stress field of the tunnel is determined before tunnel excavation, the surrounding rock pressure is constant within the local range of tunnel excavation. As a result, it can be considered that in the strata with the same lithology, the energy storage limit of the surrounding rock near the working face is a constant value Uc. Since the energy storage limit is smaller at a shorter distance to the excavation face, determination of the energy storage limit Uc at the excavation face is critical for the quantitative analysis of rockburst from the perspective of energy. In the three-dimensional state of stress, the energy at the occurrence of rock damage and failure, i.e., the energy storage limit Uc, may be calculated by the following equation [62]:
where σc is the compressive strength derived from the rock uniaxial compressive test, determined by the one-dimensional compressive test.
By substituting Equation (1) into Equation (2) we can obtain:
According to Equation (3), with the increase in the distance r between the surrounding rock and the center of the tunnel, the energy storage limit of the surrounding rock rapidly grows quadratically, and the energy storage limit is the minimum at the excavation boundary (r = R). Therefore, for tunnel excavation under high geo-stresses, at a distance closer to the excavation face, the energy storage limit of surrounding rock will be smaller, and the strain energy accumulated in the surrounding rock caused by excavation unloading will be more likely to exceed its energy storage limit, resulting in rockburst. The subsequent numerical simulation can also reflect this result. In a high geo-stress condition, if the tunnel is excavated by drilling and blasting when rock masses are fractured and the excavation contour face is formed, the in-situ stress constraint imposed by the excavated rock mass on the rock mass that is not excavated is instantaneously removed, and transient unloading of geo-stress occurs. In order to conveniently calculate the dynamic stress field and the process of strain energy change of surrounding rock in a transient unloading condition, the transient unloading process is set equivalent to the superposition of the in-situ geo-stress and the dynamic tensile load on the excavation face. After the equivalence processing, the problem may be reduced to a cylinder cavity excitation model: at the moment t = 0, a tensile load varying with time acts on the wall of the cylinder cavity (radius R) [63]. If the tensile stress is negative, and the compressive stress is positive, the governing equation in the cylinder coordinate system will be:
In consideration of the linear attenuation of the tensile load on the excavation face set equal to 0, the boundary conditions are:
In Equations (4)–(6), σr (r, t) and σθ (θ, t) are the radial normal stress and the circumferential normal stress excited by the tensile load in the surrounding rock, respectively; μ (r, t) is the radial displacement of the surrounding rock; CP is the longitudinal wave velocity of rock mass; both λ and η are Lame’s constant; and t0 is the duration of transient unloading of geo-stresses.
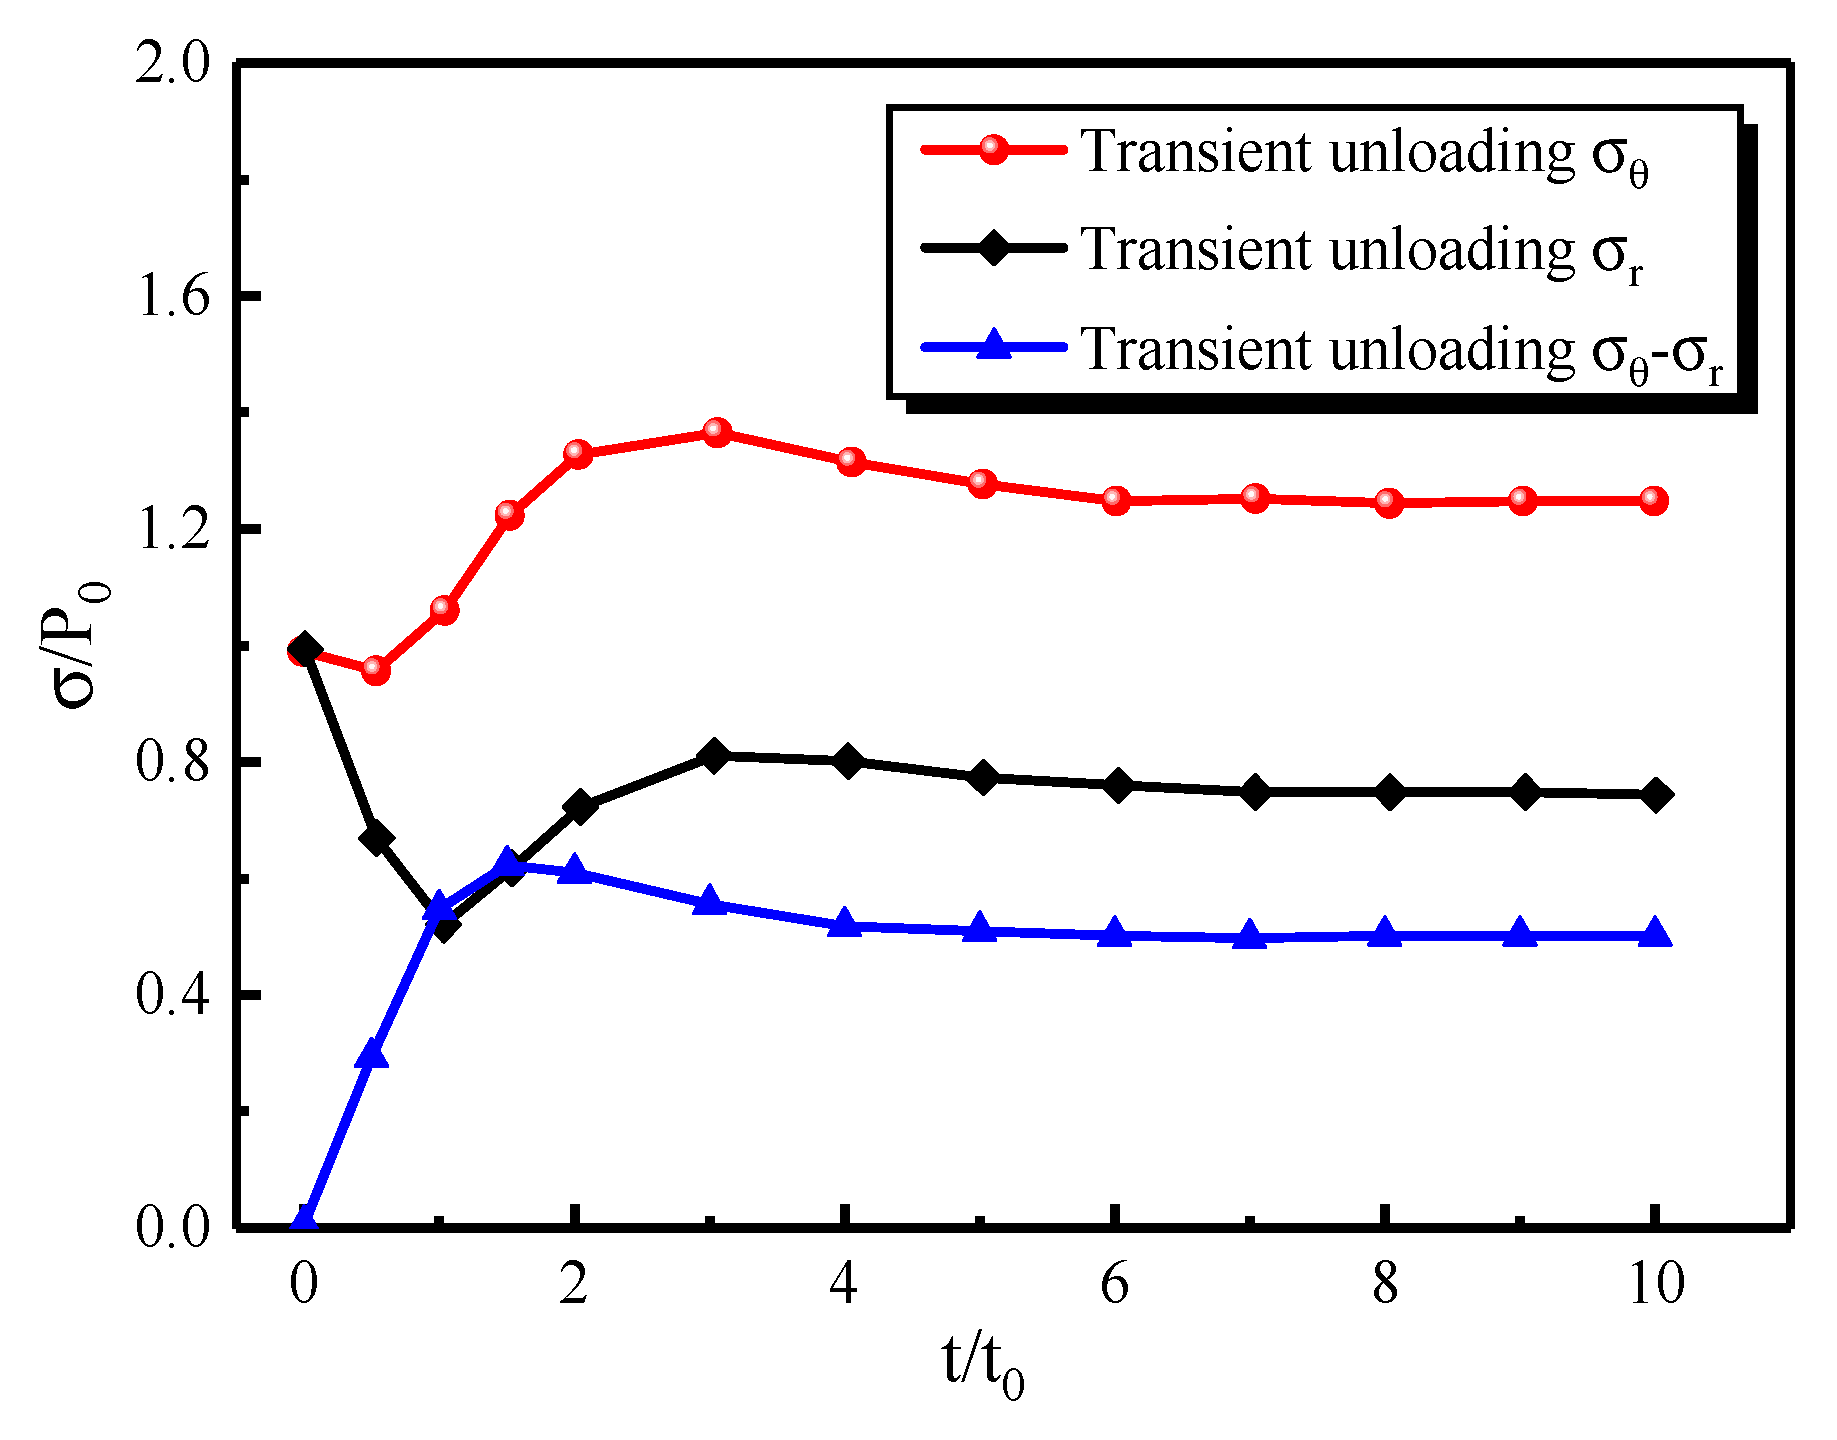
Through the governing Equation (4), the Laplace transform is performed for time t, and the equation is solved for the Laplace space of the dynamic radial normal stress and the tangential normal stress of the dynamic stress field excited by the cylinder cavity. Then, the inverse transform of the Laplace space solution is obtained by contour integration, which is superimposed on the in-situ geo-stress P0. In this way, the dynamic stress field excited by the transient unloading is obtained. According to the analysis described above, the energy storage limit is the minimum at the excavation boundary (r = R). The stress field excited by transient unloading and the difference between the primary and the tertiary principal stresses in the case of r = R are shown in Figure 3.
In Figure 3, the abscissa (t/t0) represents the ratio of time t to transient unloading duration t0, indicating the change in time. The ordinate (σ/P0) represents the ratio of stress σ to in-situ geo-stress P0, indicating the magnitude of stress. It can be seen from Figure 3 that the transient unloading causes the continuous increase in the difference between the primary and the tertiary principal stresses, and the difference will finally become stable. According to Equation (2), it is easy to see that the continuous increase in the difference between the primary and the tertiary principal stresses caused by transient unloading leads to the decrease in the energy storage limit of the surrounding rock. In fact, for hard and brittle rock, the transient unloading causes the strain energy of surrounding rock to undergo a process of elastic change from decrease, then increase, and finally to stabilization. As the transient unloading causes the increase in the difference between the primary and the tertiary principal stresses of the surrounding rock, the energy storage limit of the surrounding rock decreases rapidly. Therefore, in the process of increase, if the strain energy of the surrounding rock fails to reach the energy value of rock required to trigger damage and failure given in Equation (2), it will usually exceed the energy storage limit Uc and result in failure. The minimum energy storage limit of surrounding rock induced by transient unloading Umix is determined and used as the criterion of the energy storage limit of surrounding rock.
2.2. Criterion of Energy Storage Density Limit
The energy stored in a unit volume is referred to as strain energy density [64]. A continuum is composed of many small structural units, and each of the units stores certain strain energy. The strain energy density provides us a new way to understand rock failure. Since the change in strain energy goes through the entire failure process of rock, when the strain energy density exceeds a certain value, the rock yields or fails. As a result, the energy failure criterion based on the strain energy density theory has obvious advantages for rock masses in a complicated stress state. In consideration of strain gradients and high-order stress items, the strain energy density of the surrounding rock units can be expressed as:
where σ1 is the primary principal stress, σ2 is the secondary principal stress, σ3 is the tertiary principal stress, ν is Poisson’s ratio, and E0 is the elastic modulus.
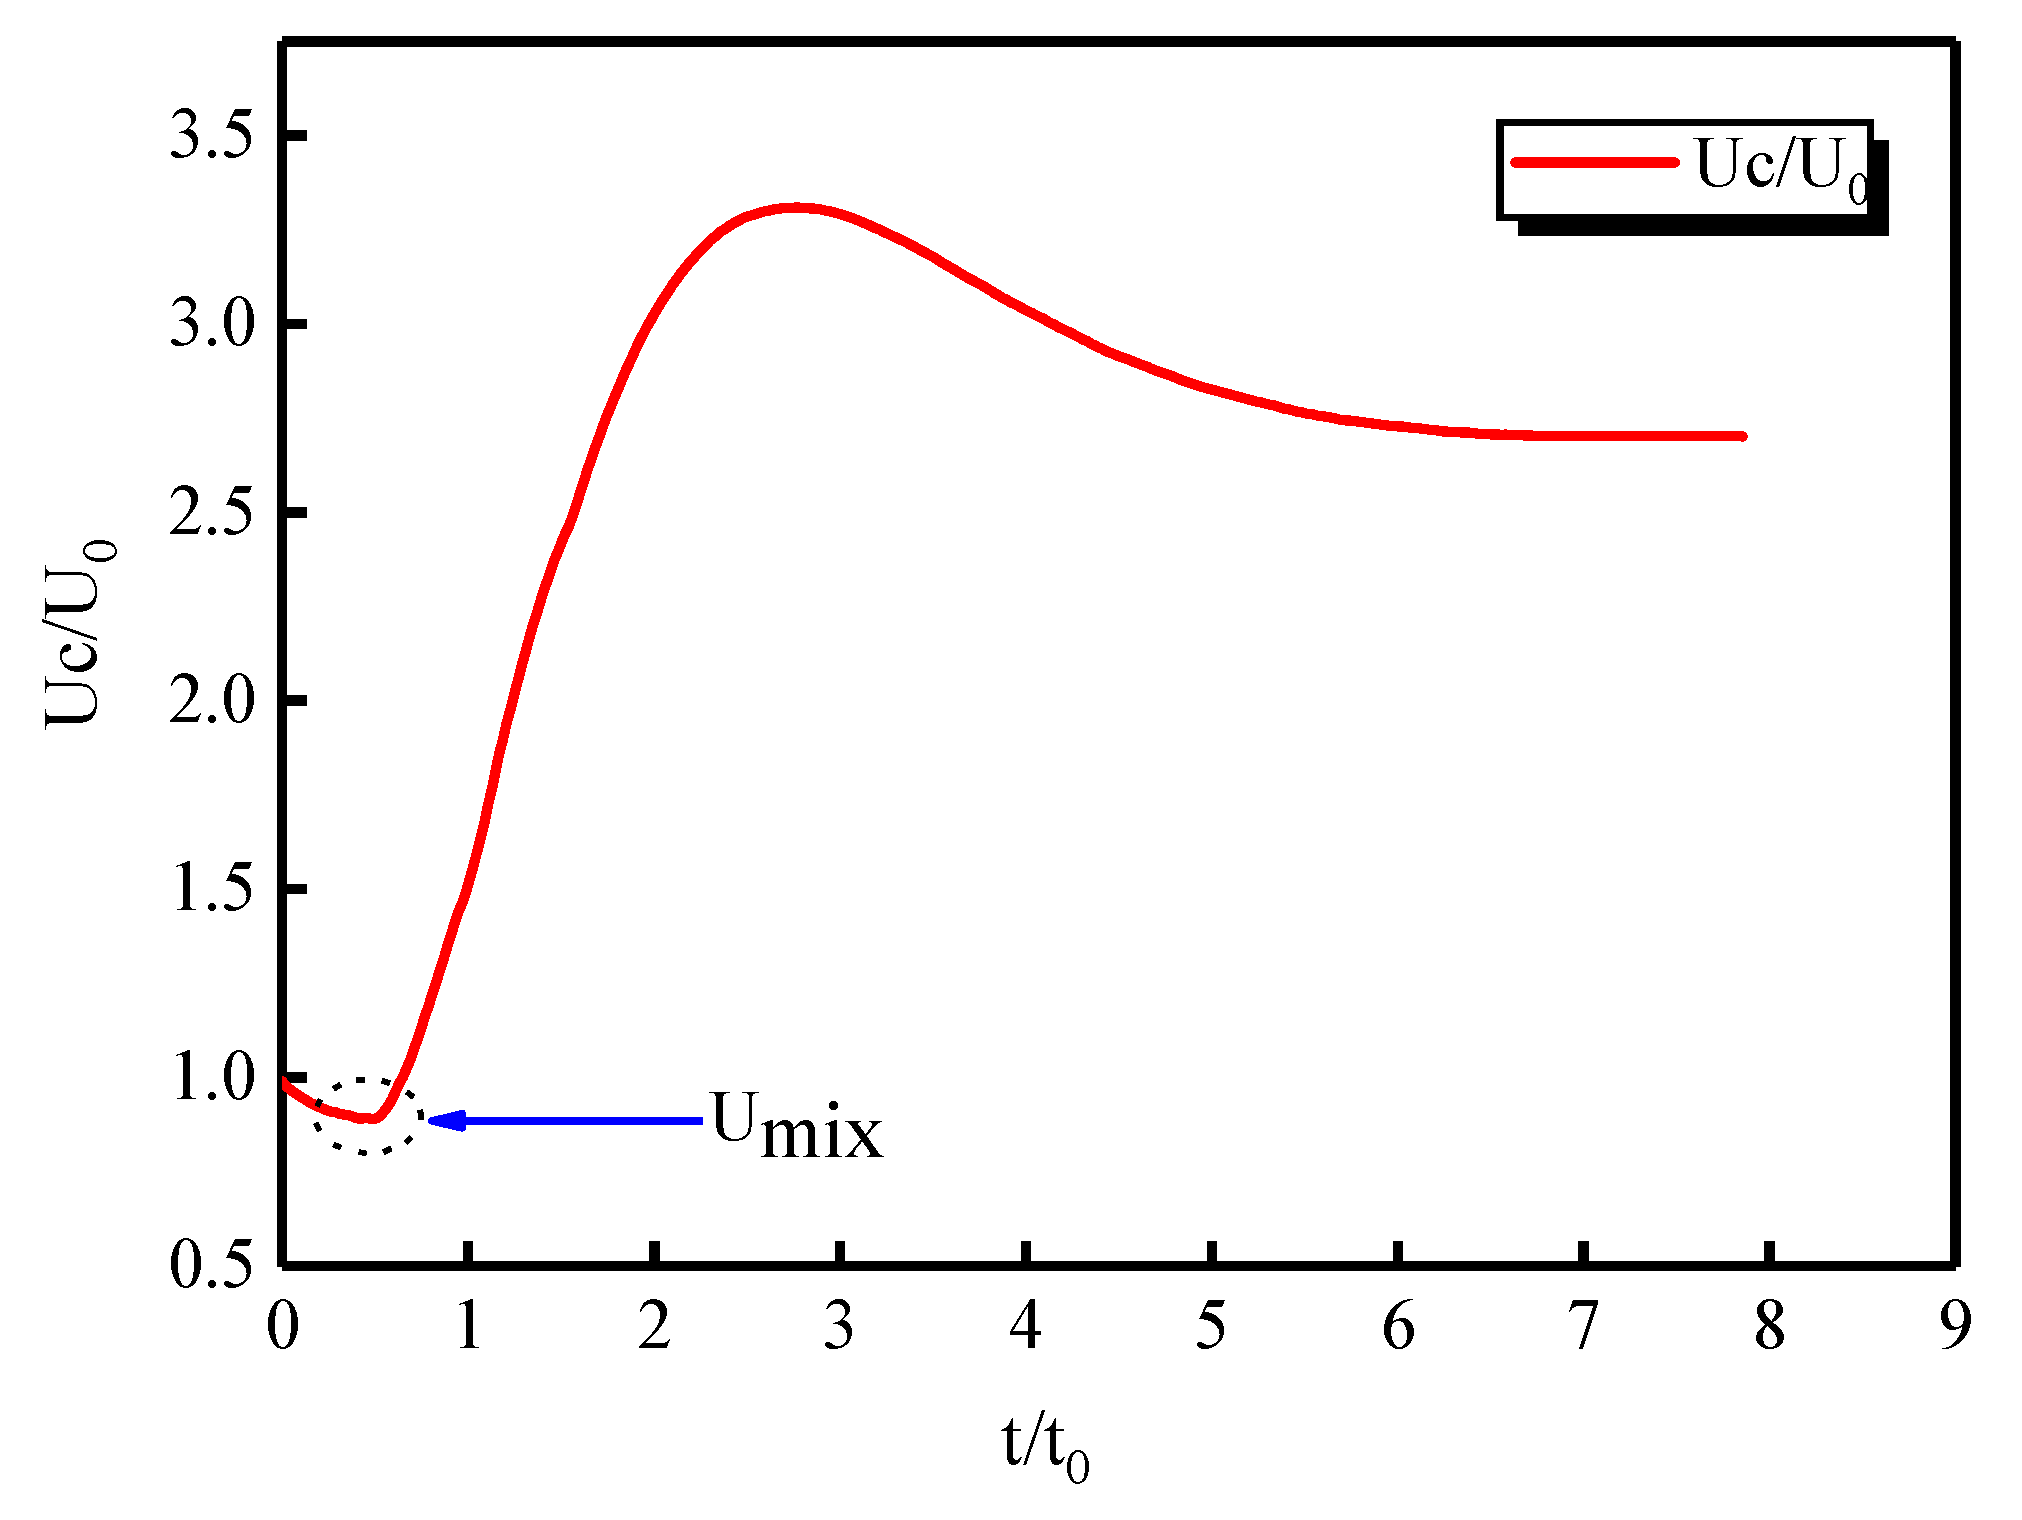
During the tectonic movement of the whole rock, high geo-stress areas were formed. In these areas, a large amount of energy exists in the rock, i.e., the in-situ strain energy density U0. By substituting the dynamic stress field in Figure 3 into Equation (7), the process of change in the energy storage density limit of the surrounding rock of the tunnel wall induced by transient unloading can be derived. According to Equation (3), for tunnel excavation under high geo-stresses, at a distance closer to the excavation face, the energy storage limit of surrounding rock will be smaller, and the strain energy accumulated in the surrounding rock caused by excavation unloading will be more likely to exceed its energy storage limit, resulting in rockburst. The curve of the ratio of the energy storage density limit Uc at transient unloading to the in-situ strain energy density U0 on the tunnel wall () is shown in Figure 4.
2.3. Energy Release Rate
In order to analyze the energy conversion and dissipation during the tunnel excavation under high geo-stresses, the concept of energy release rate is adopted and can be derived from the following equation:
where ERR is energy release rate, TER is total energy released during excavation, and TEV is the total excavation volume.
ERR = TER/TEV
This indicator can be obtained by secondary development through the post-processing of numerical analysis software. By successfully applying the energy release rate to the quantitative analysis of tunnel rockburst under high geo-stresses, the failure degree of surrounding rock can be effectively characterized, and the stability of the tunnel can be evaluated. This will serve the purpose of revealing the failure degree of rockburst occurring in deep-lying tunnels and aiding understanding of the safety status of deep-lying tunnels in complicated stress stages.
3. Back Analysis of In Situ Geo-Stress
3.1. Description of the Project
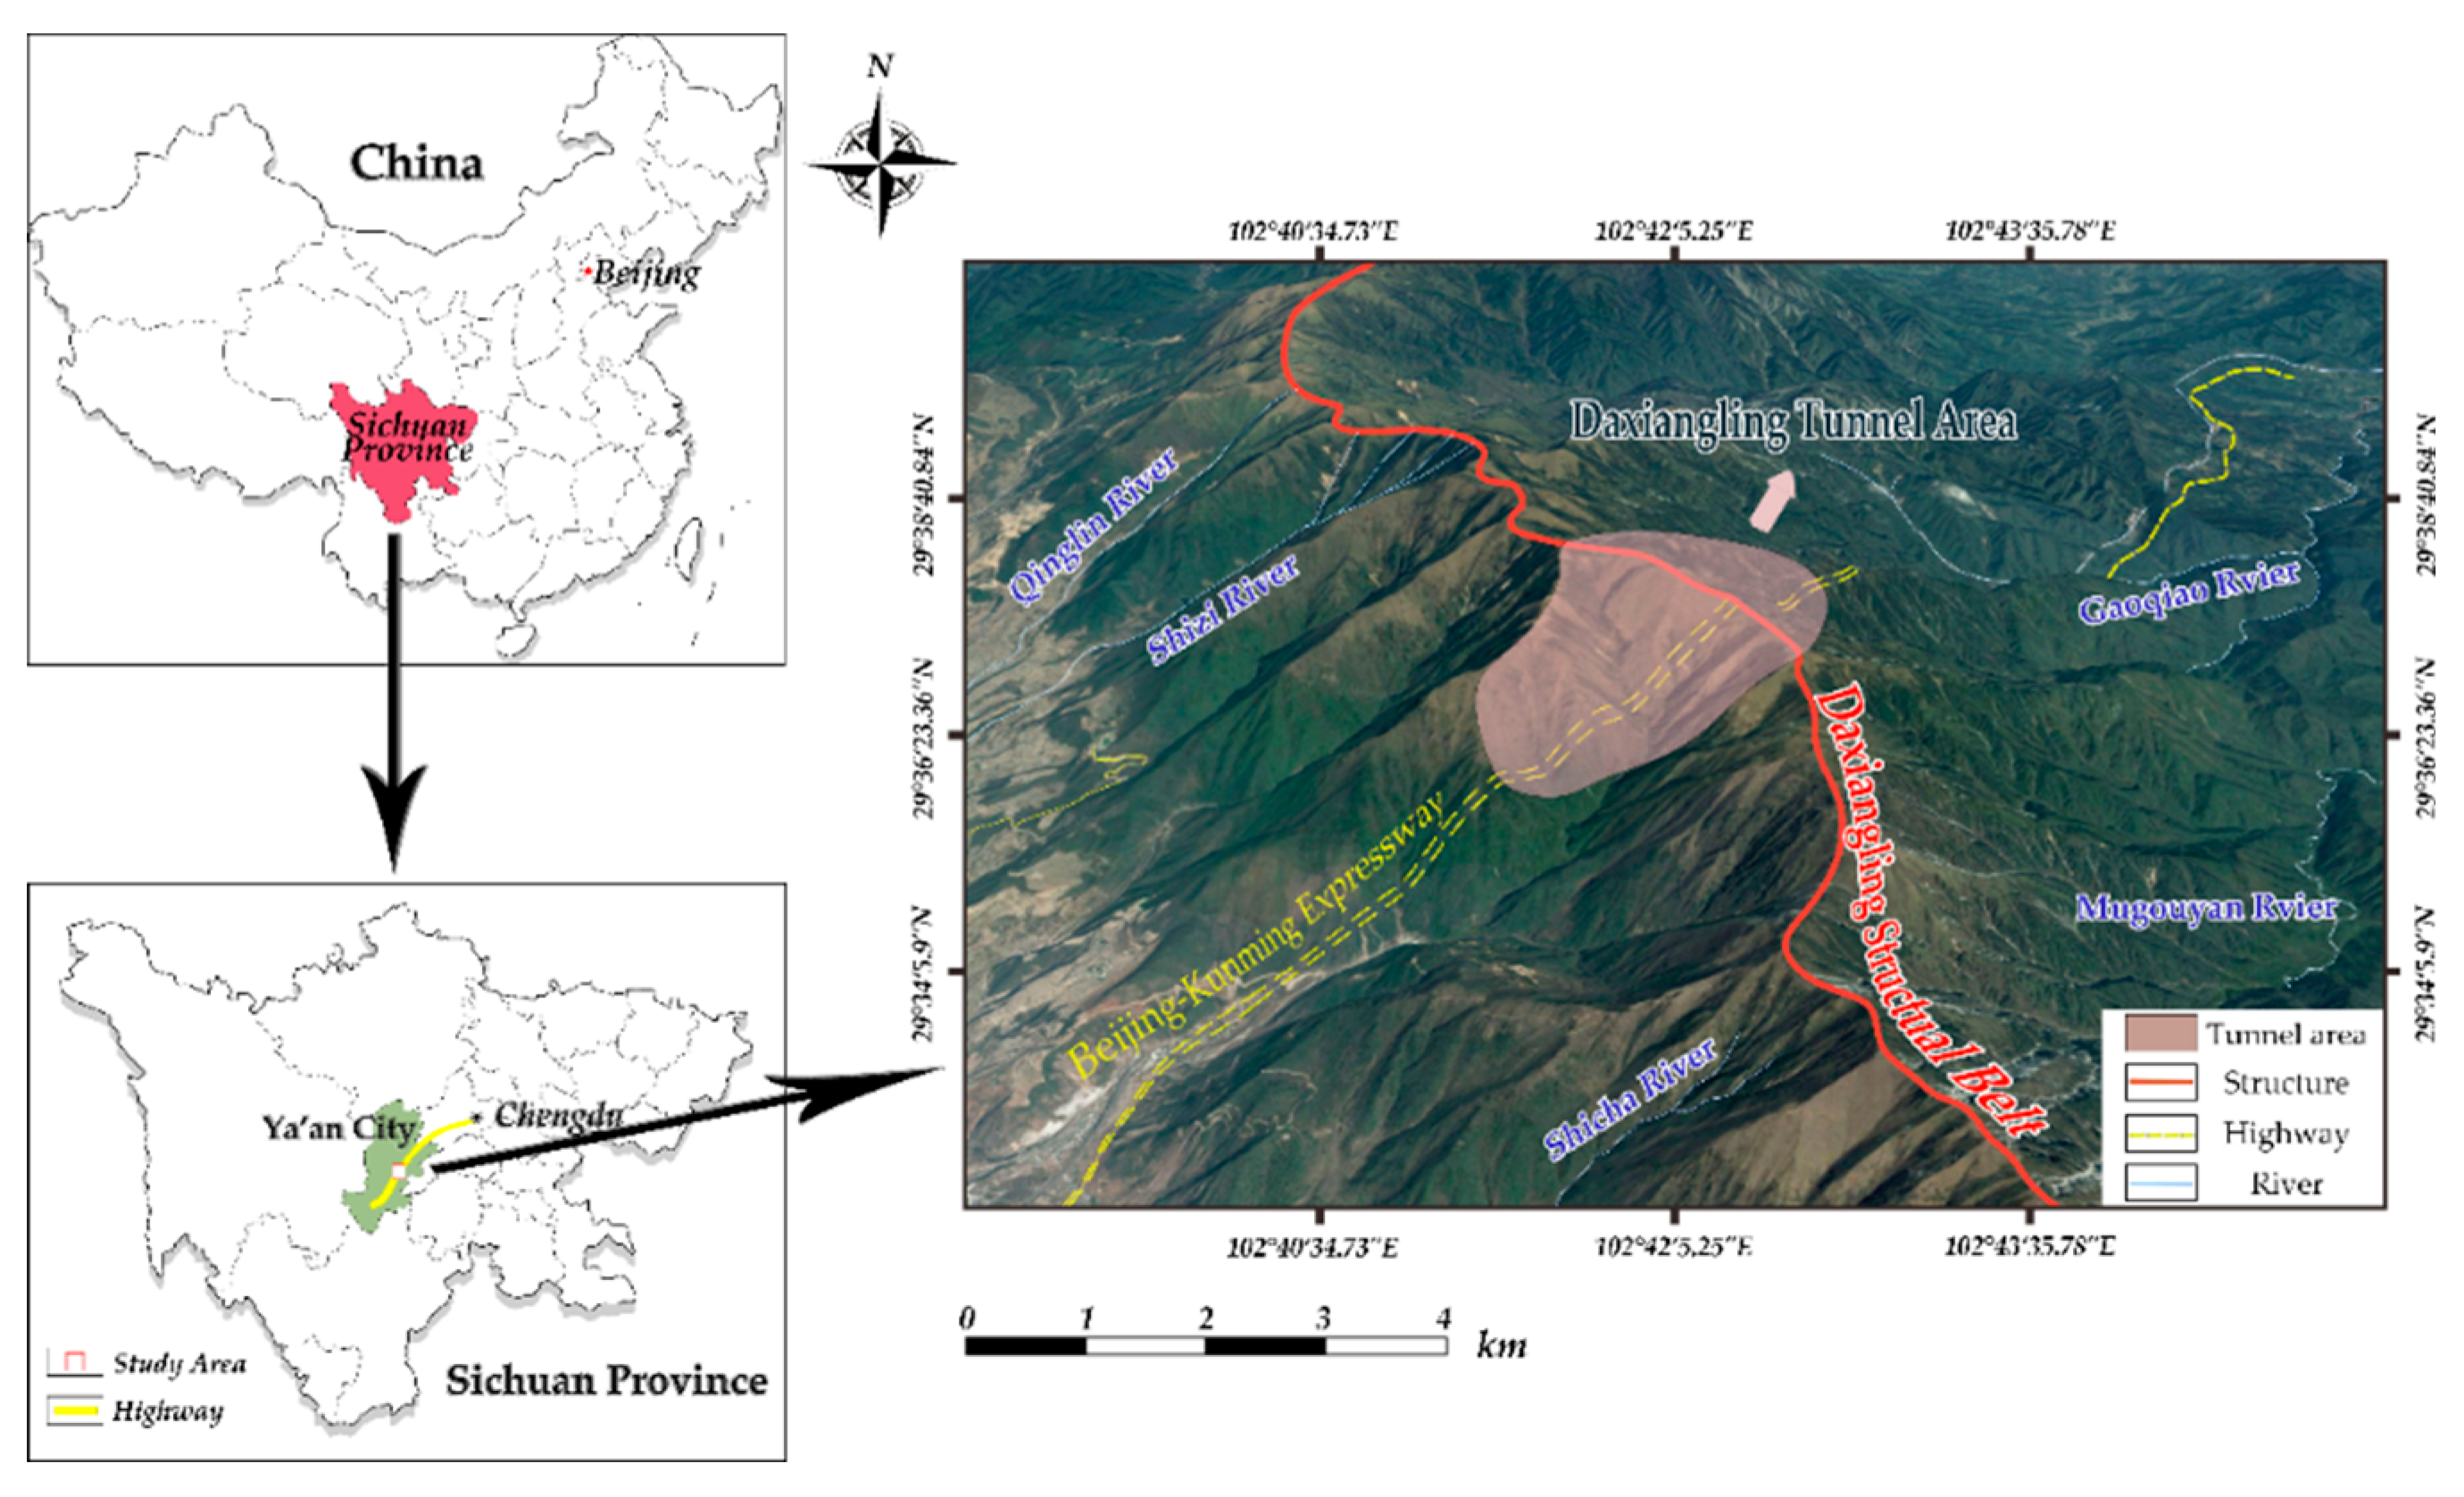
The Daxiangling Tunnel is a typical project of a complicated road tunnel located in a mountain area in western China. It is a critical project for the Beijing–Kunming Expressway. Located in the Daxiangling mountain area at the junction of Yingjing County and Hanyuan County, Ya’an City, Sichuan Province, it has a total length of more than 10 km (Figure 5). It is a separated twin-tube one-way traffic tunnel, with a length of more than 5000 m at a depth of more than 1000 m. Therefore, it is a deep-lying super-long highway tunnel passing through a mountain. In the vicinity of the tunnel, the mountain ridge valley extends for a significant distance and is both steep and deep, with a large altitude difference. In the tunnel area, the average altitude is about 2800 m, and the altitude of the highest point is 3388.3 m (see Figure 6). The tunnel passes through strata composed of rhyolite and andesite, which are hard and brittle. Most of the surrounding rock of the tunnel falls into classes III–IV. Full-face excavation is provided to reduce the disturbance to the surrounding rock, and the diameter of excavation is 12 m. The geo-stresses of the tunnel body section are high, and rockburst occurred during the tunnel excavation.
3.2. In Situ Geo-Stress Conditions
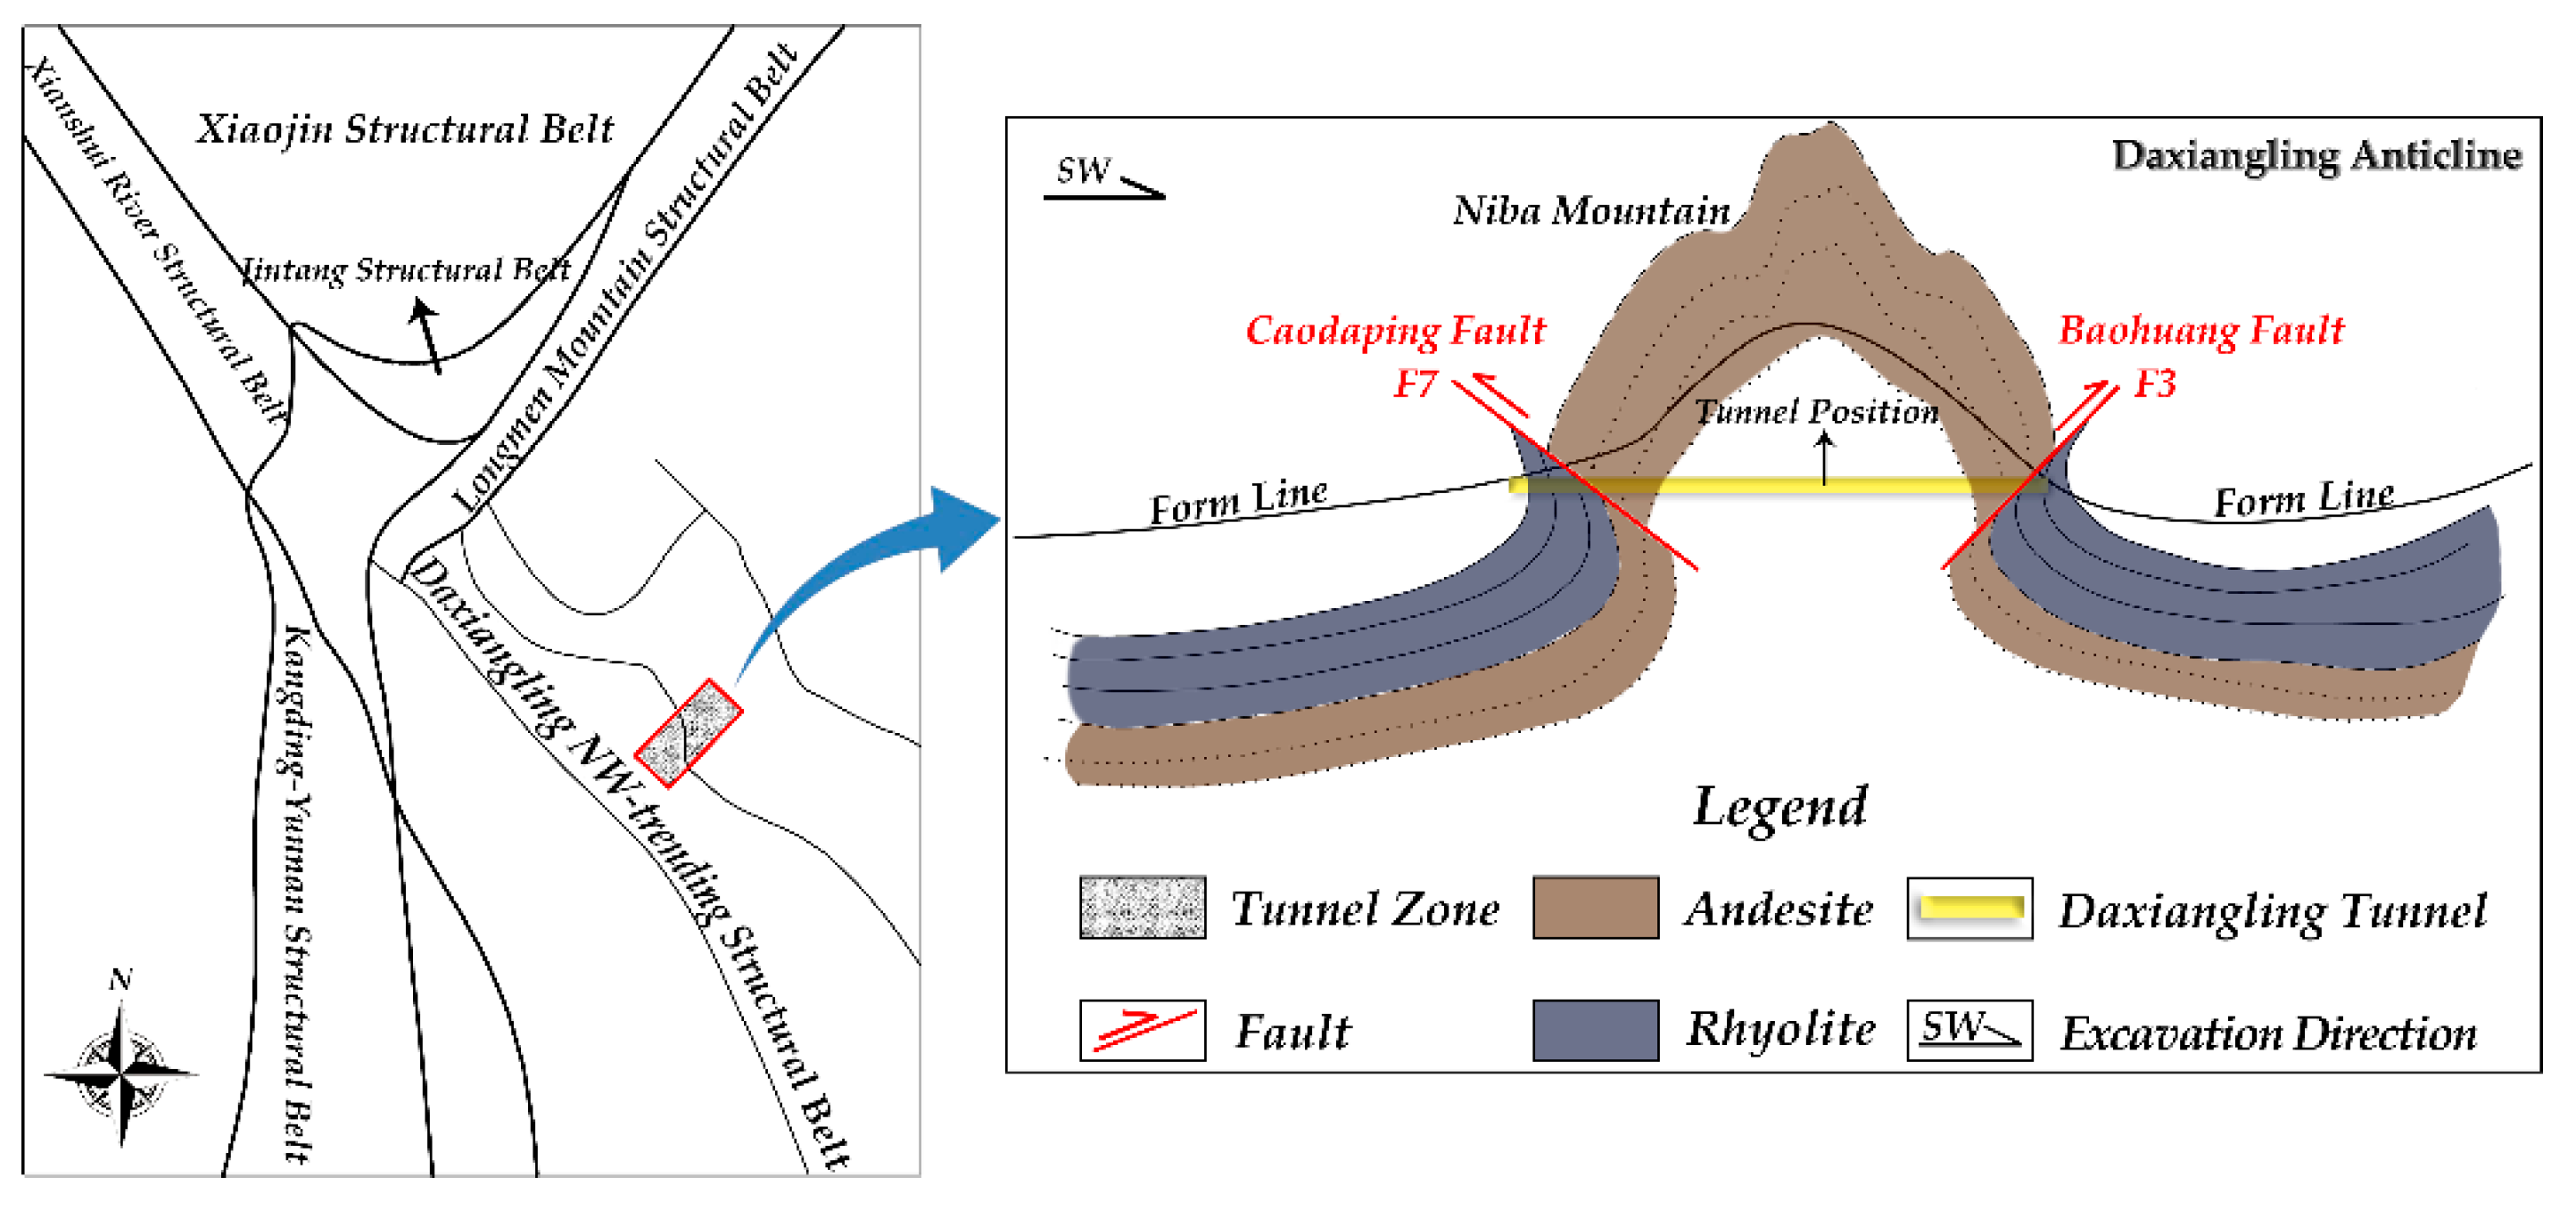
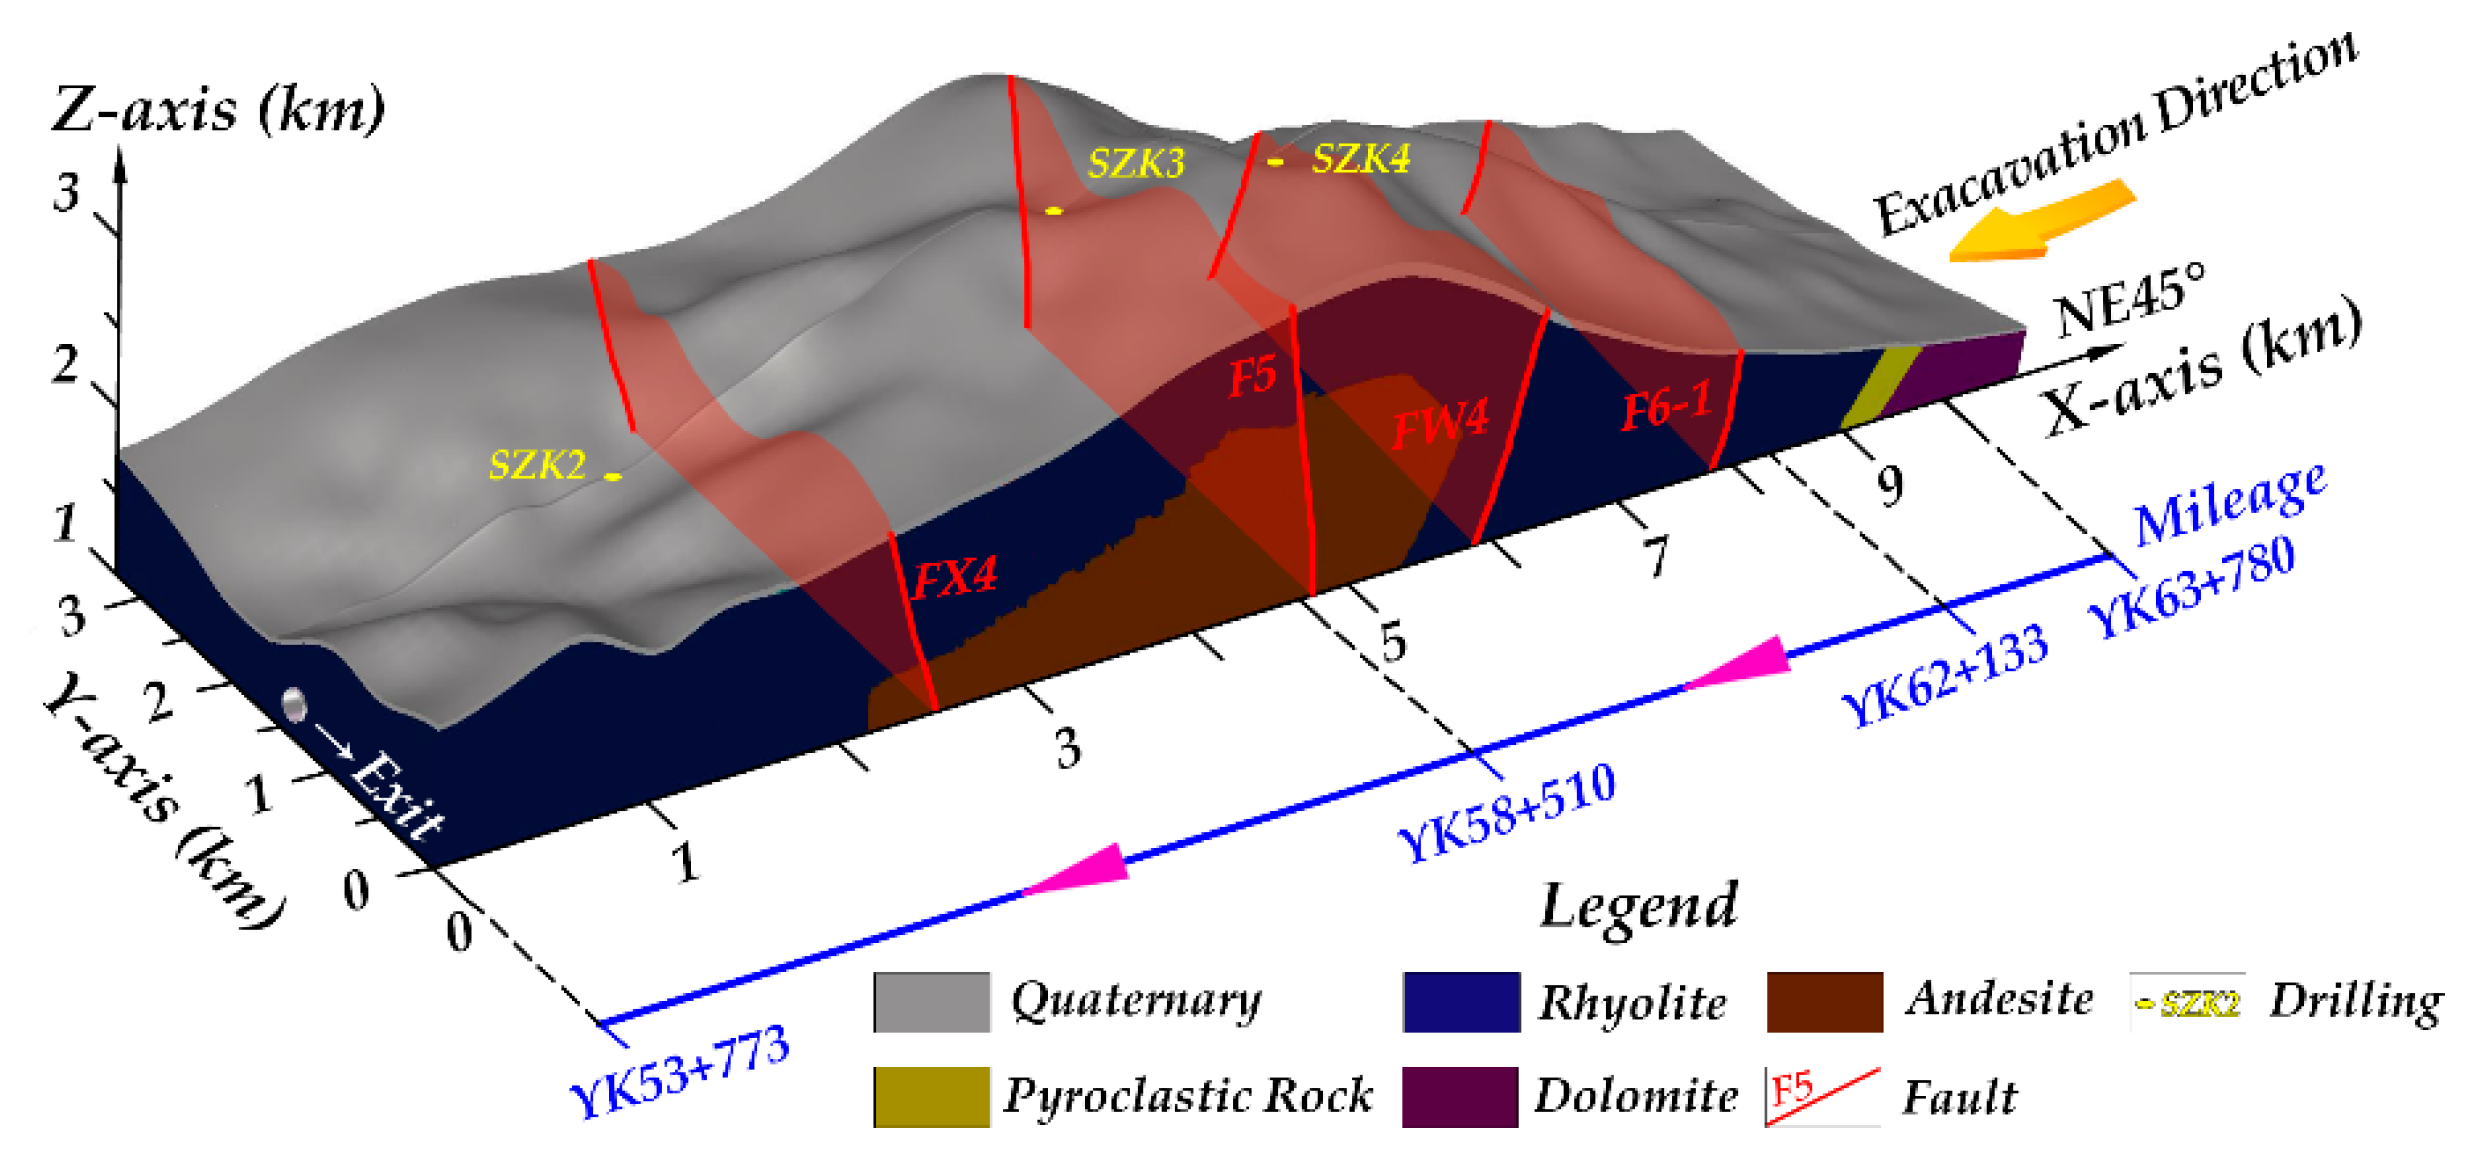
The tunnel site area is a tectonically denuded medium–high mountain area where the surface is subject to intense cutting and mountains are steep. The rocks mainly include Mesozoic red sandy shale, Proterozoic pyroclastic rock, carbonate rock, and magmatic rock. Rock masses exhibit complicated types of structural surfaces, including the primary structural plane and the tectonic structural plane. Faults and tectonic joints are dominant in the tectonic structural plane. In high or extremely high geo-stress environments, among strata with different strengths, rockburst tends to occur in high-strength interbedded strata. In addition, in the site area of Daxiangling Tunnel, there are many rhyolites with joints, so it is highly probable that low strength rockburst with joints occurs; that is, if the surrounding rock strength is not high, rockburst occurs. In order to ascertain the in-situ geo-stress status of Daxiangling Tunnel, three representative in-situ geo-stress test points (SZK2, SZK3, and SZK4) were selected in the tunnel site area during the construction of Daxiangling Tunnel, and the hydraulic fracturing method was used to measure the in-situ geo-stress (Figure 7). The test results are shown in Figure 8.
In the area of the test section, geo-stress values rose with an increase in depth. However, the rise was not linear, indicating the complexity of the geo-stresses in the site area. Based on the engineering rock mass classification criterion, the geo-stresses of the tunnel site area in the area of the three boreholes were extremely high [65].
3.3. Minimum Energy Storage Density Limit
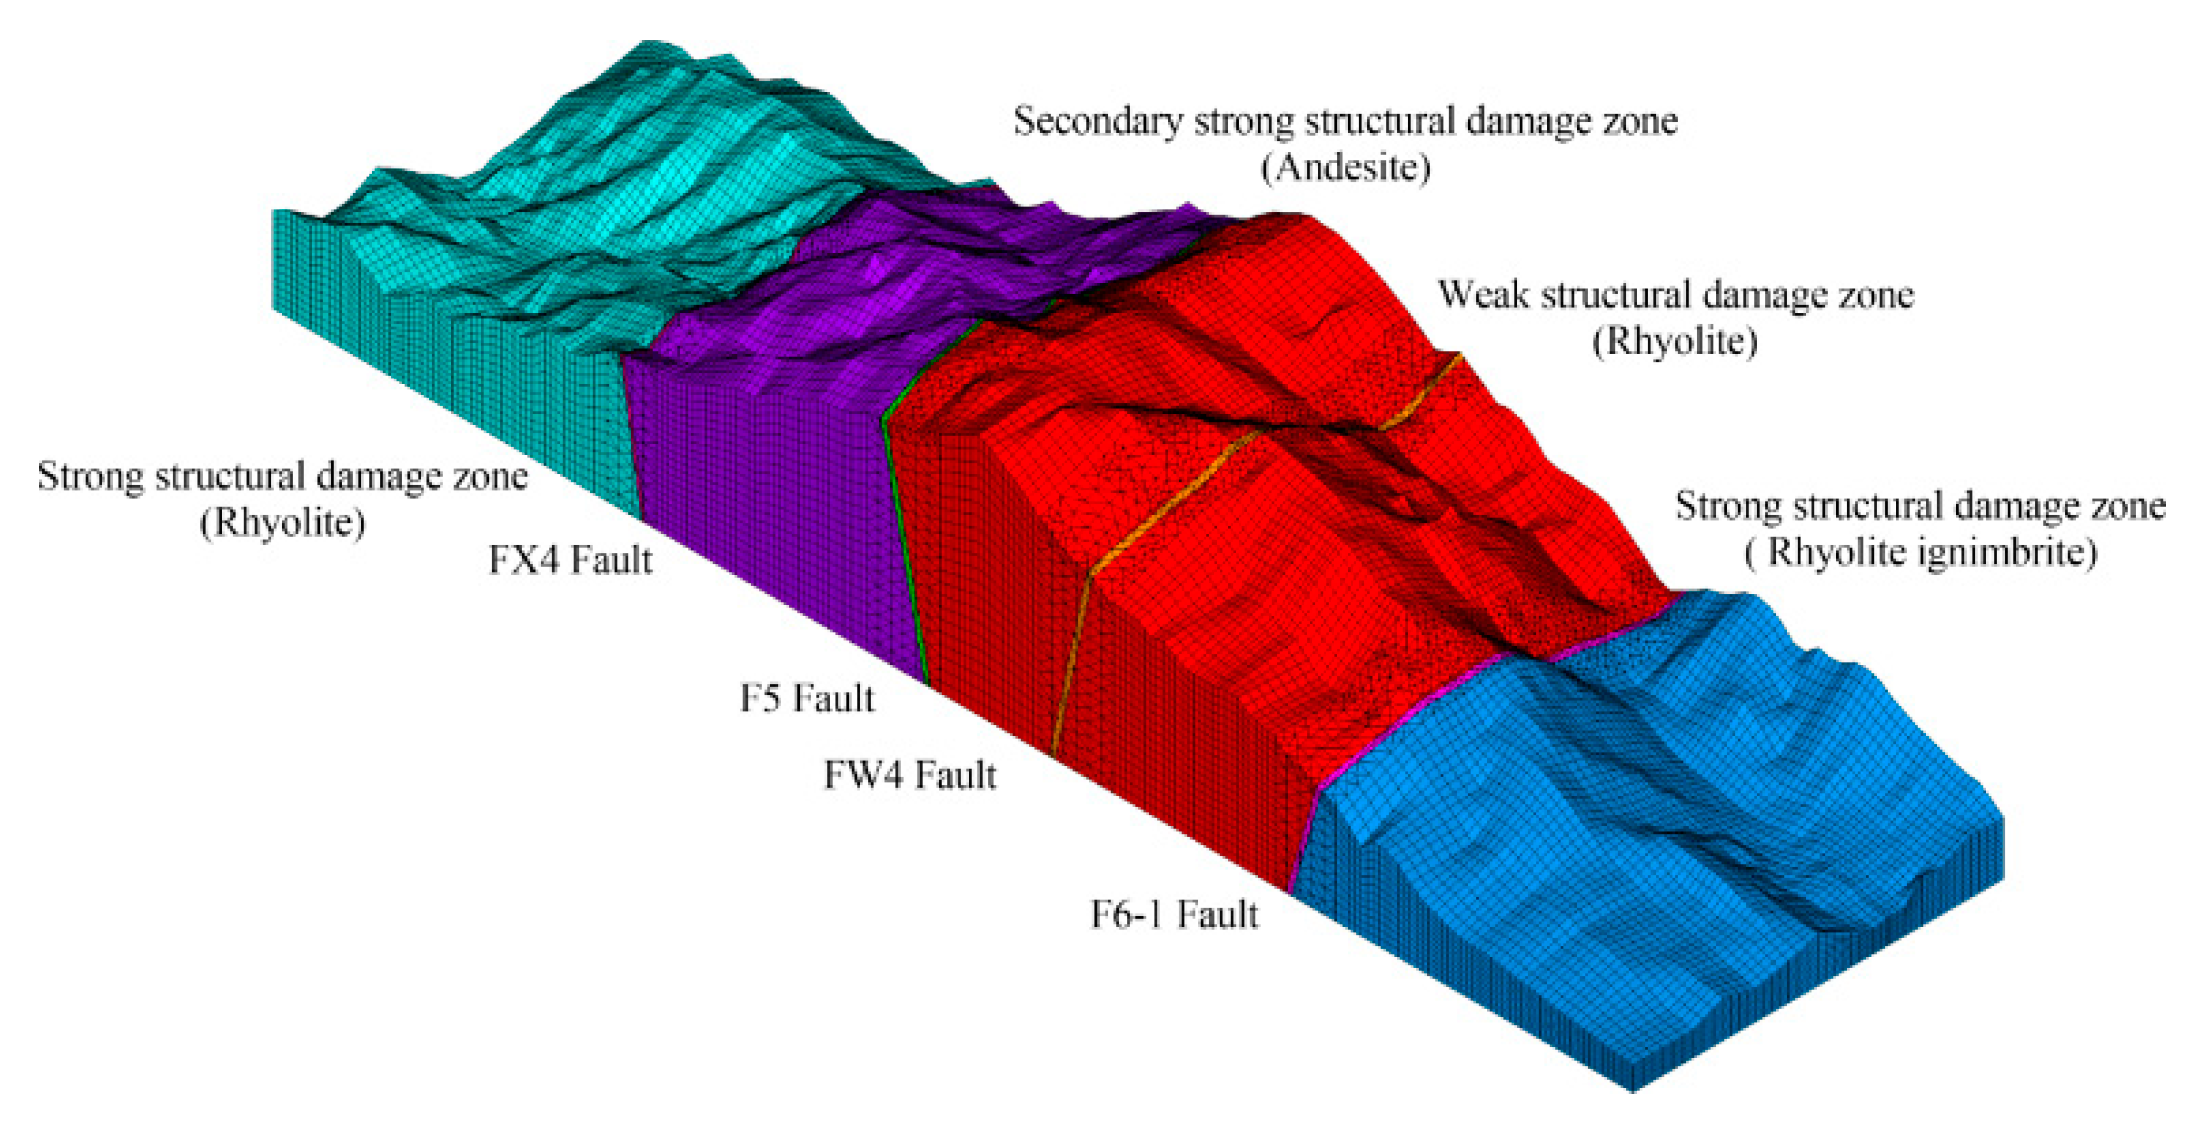
In order to accurately understand the distribution law of the in-situ geo-stress field of the Daxiangling Tunnel site area, according to the geo-stress data measured with the hydraulic fracturing method in the tunnel site area, back analysis was conducted on the geo-stress field using multiple regression and numerical calculation, and the in-situ stress field function of the project area was obtained. Furthermore, the tunnel stress field derived from the back analysis was corrected using the geo-stress statistical relationship formula with the measured in-situ geo-stress data serving as the specimen. Finally, an integrated three-dimensional in-situ stress field for the entire Daxiangling Tunnel was established (Figure 9). The surrounding rock parameters of the three-dimensional finite element numerical calculation model are given in Table 1.
The in-situ strain energy density U0, and the minimum energy storage density Umix were determined, as shown in Table 2.
It can be seen from Table 2 that the criterion of rockburst energy density limit Umix of Daxiangling Tunnel is approximately 40 kJ/m3. That is, during the excavation of underground cavities in rock masses, when the density of strain energy partially accumulated in the surrounding rock exceeds the energy storage limit of the rock mass (i.e., 40 kJ/m3), the energy in the rock mass will be abruptly released, resulting in rockburst. This indicator is an approximate representation of the magnitude of energy released during the brittle failure of unit rock masses. In the subsequent stage, through numerical calculation, we tracked the change of elastic energy density of each unit, recorded the position of the high energy density unit in the tunnel, and combined with the energy density limit of 40 kJ/m3, the location and possibility of rockburst can be predicted.
4. Field Test
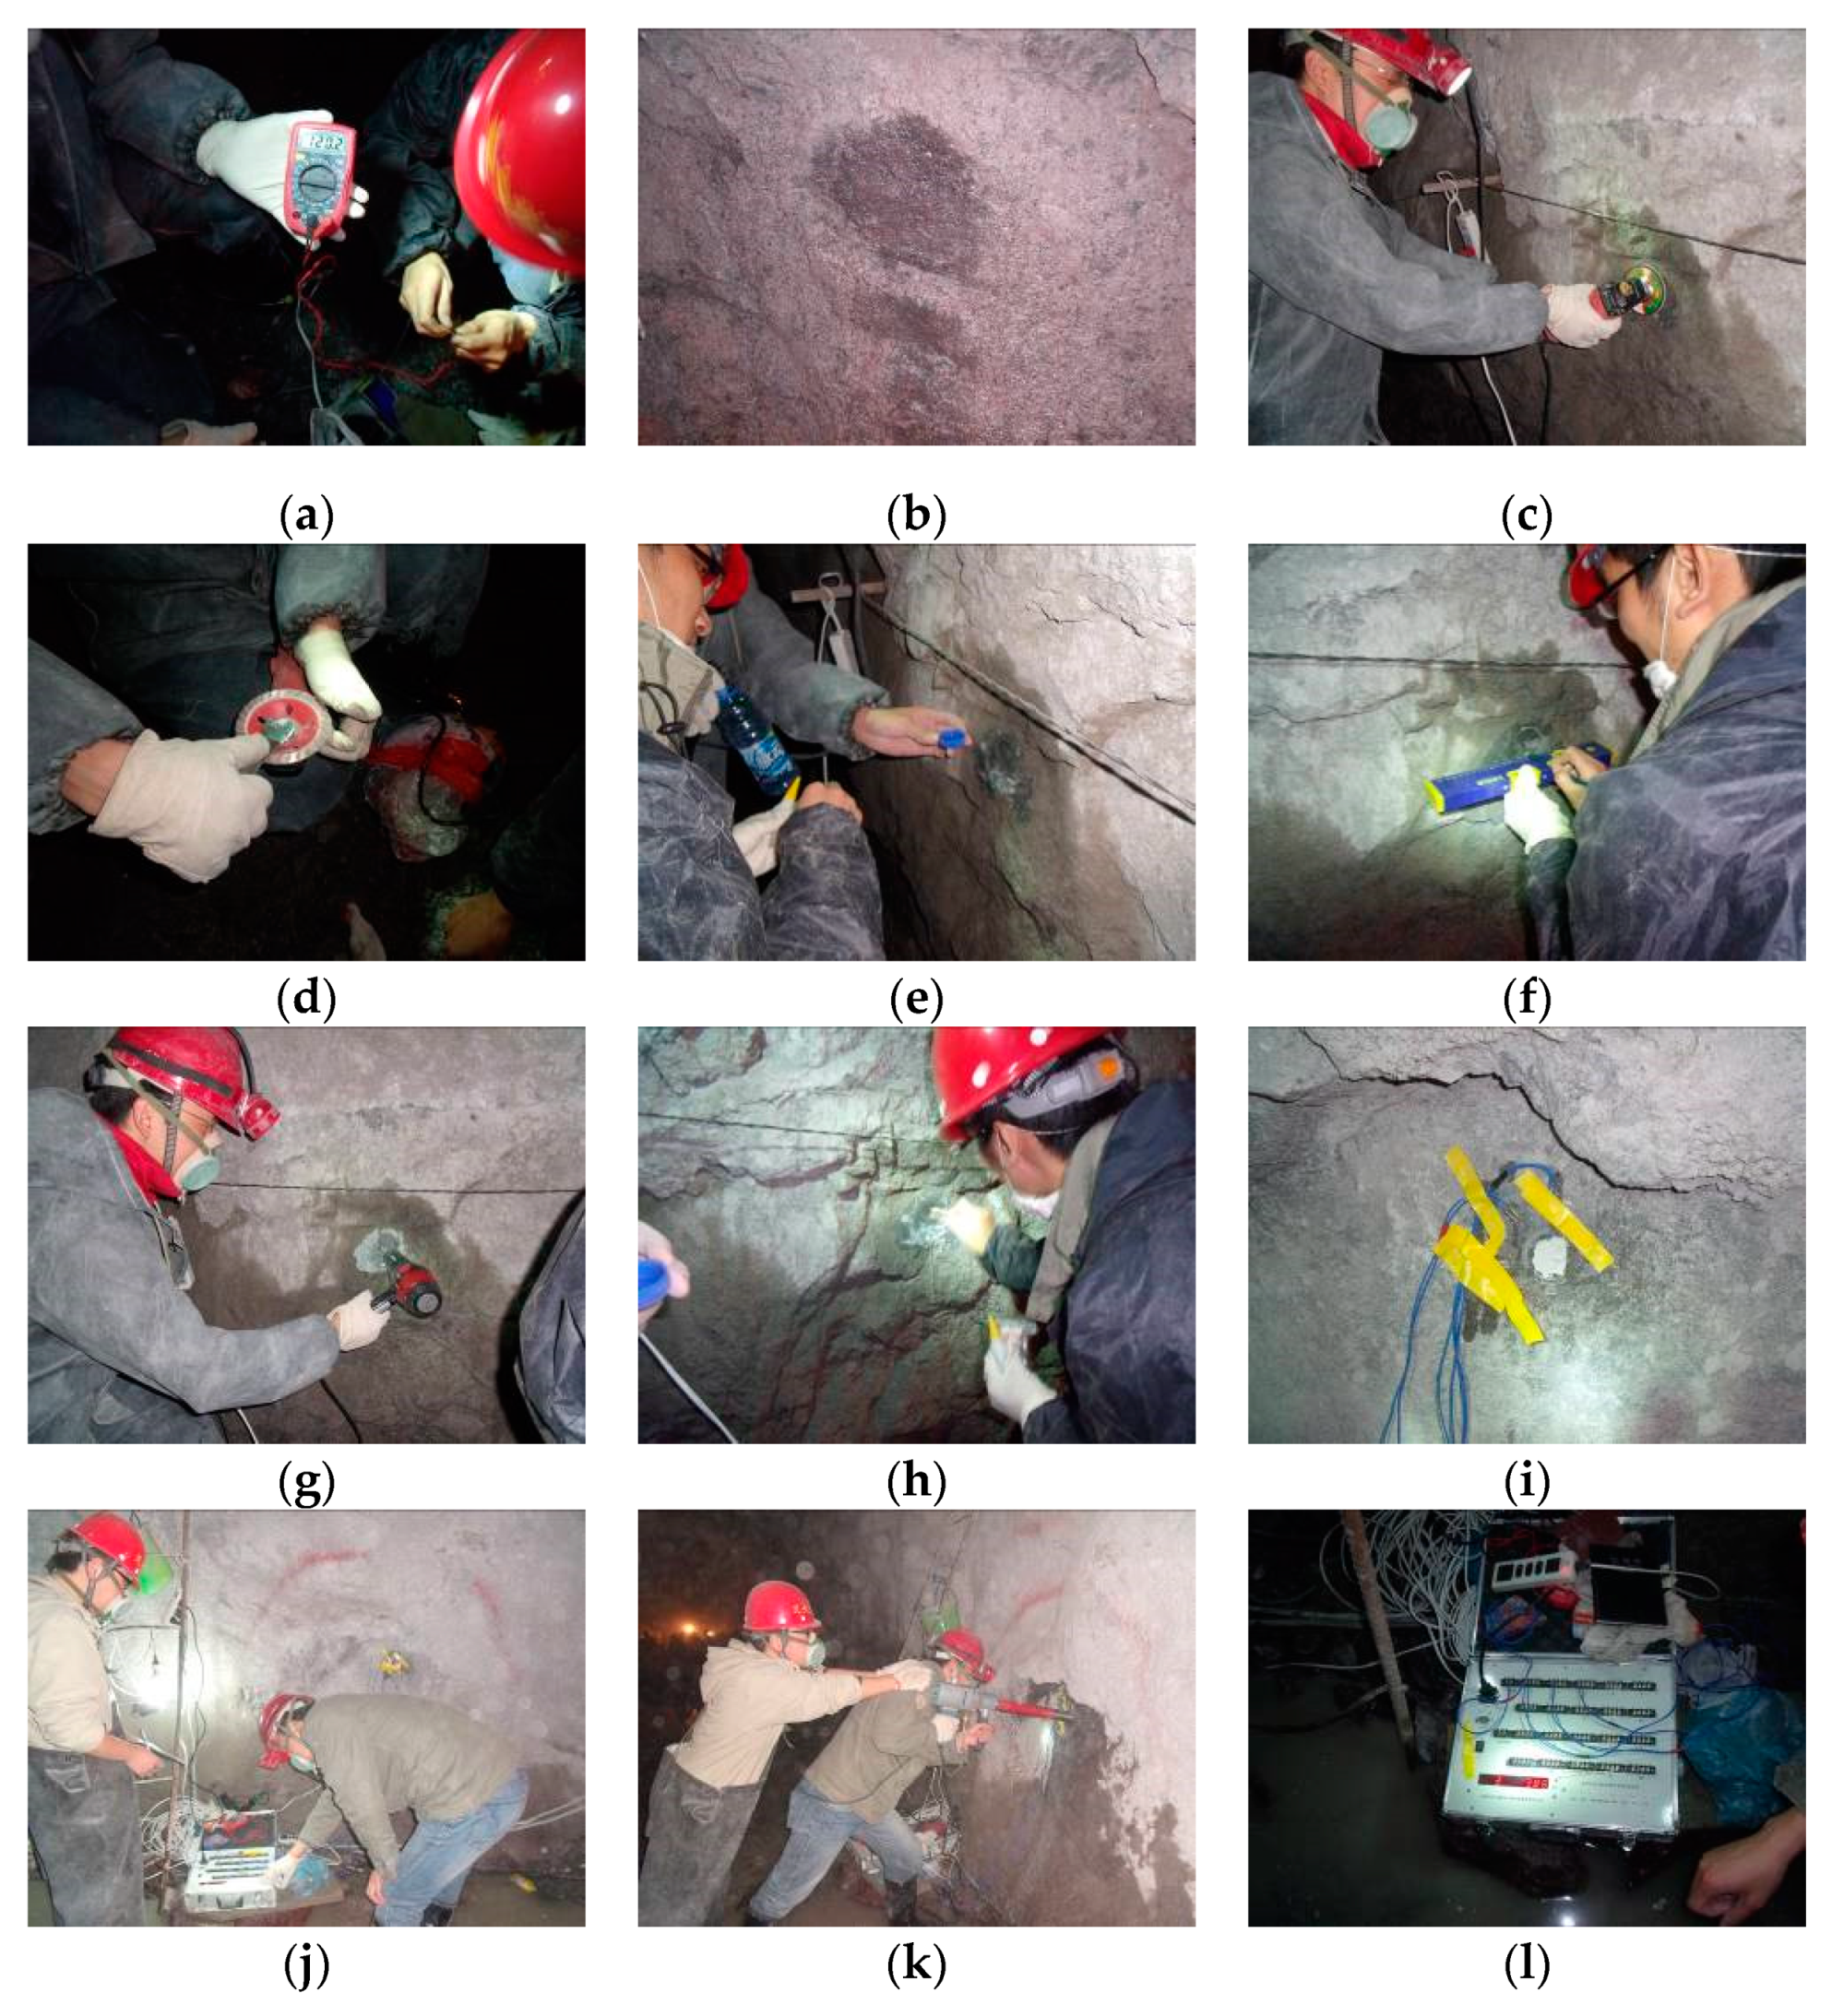
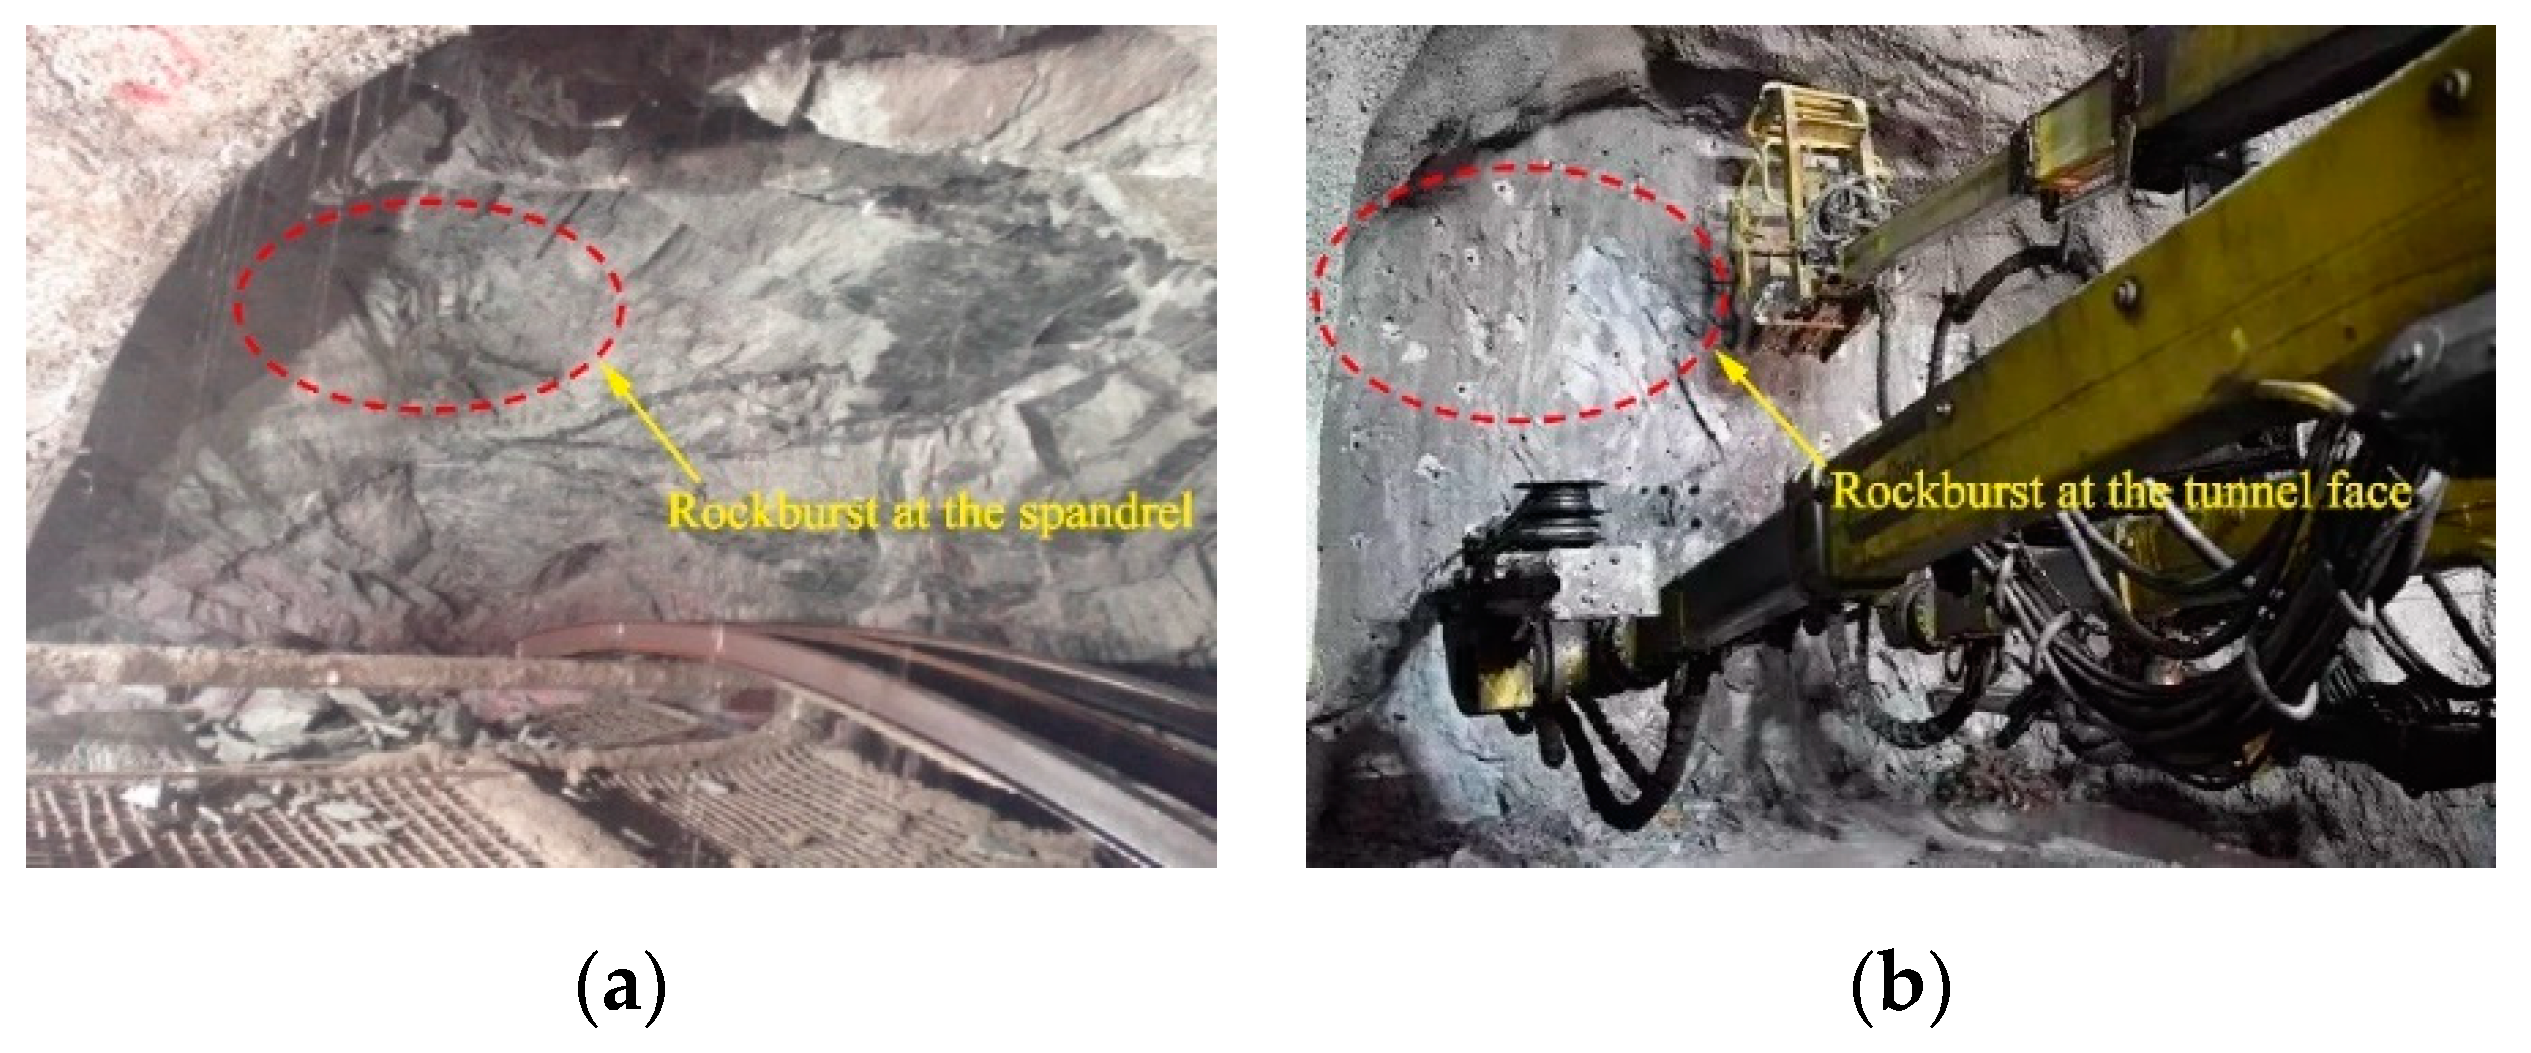
Daxiangling tunnel encountered severe rockburst frequently at a mileage of K57 + 960–K58 + 480. We tracked and analyzed the rockbursts in this frequent rockburst section. A series of medium intensity rockbursts occurred at a mileage of K57 + 965, the specific locations of rockbursts are shown in Figure 16. To study the rockburst characteristics and the relationship between the energy density with rockburst, in-situ tests of tunnel wall stress at a mileage of K57 + 965 were carried out (Figure 10) to get the in-situ strain energy density U0 and the minimum energy storage density limit Umix. The measured results are shown in Table 3.
It can be seen from Table 3 that the criterion of rockburst energy density limit Umix of Daxiangling Tunnel is approximately 40 kJ/m3, which validates the numerical results.
5. Numerical Simulation
5.1. Model Description
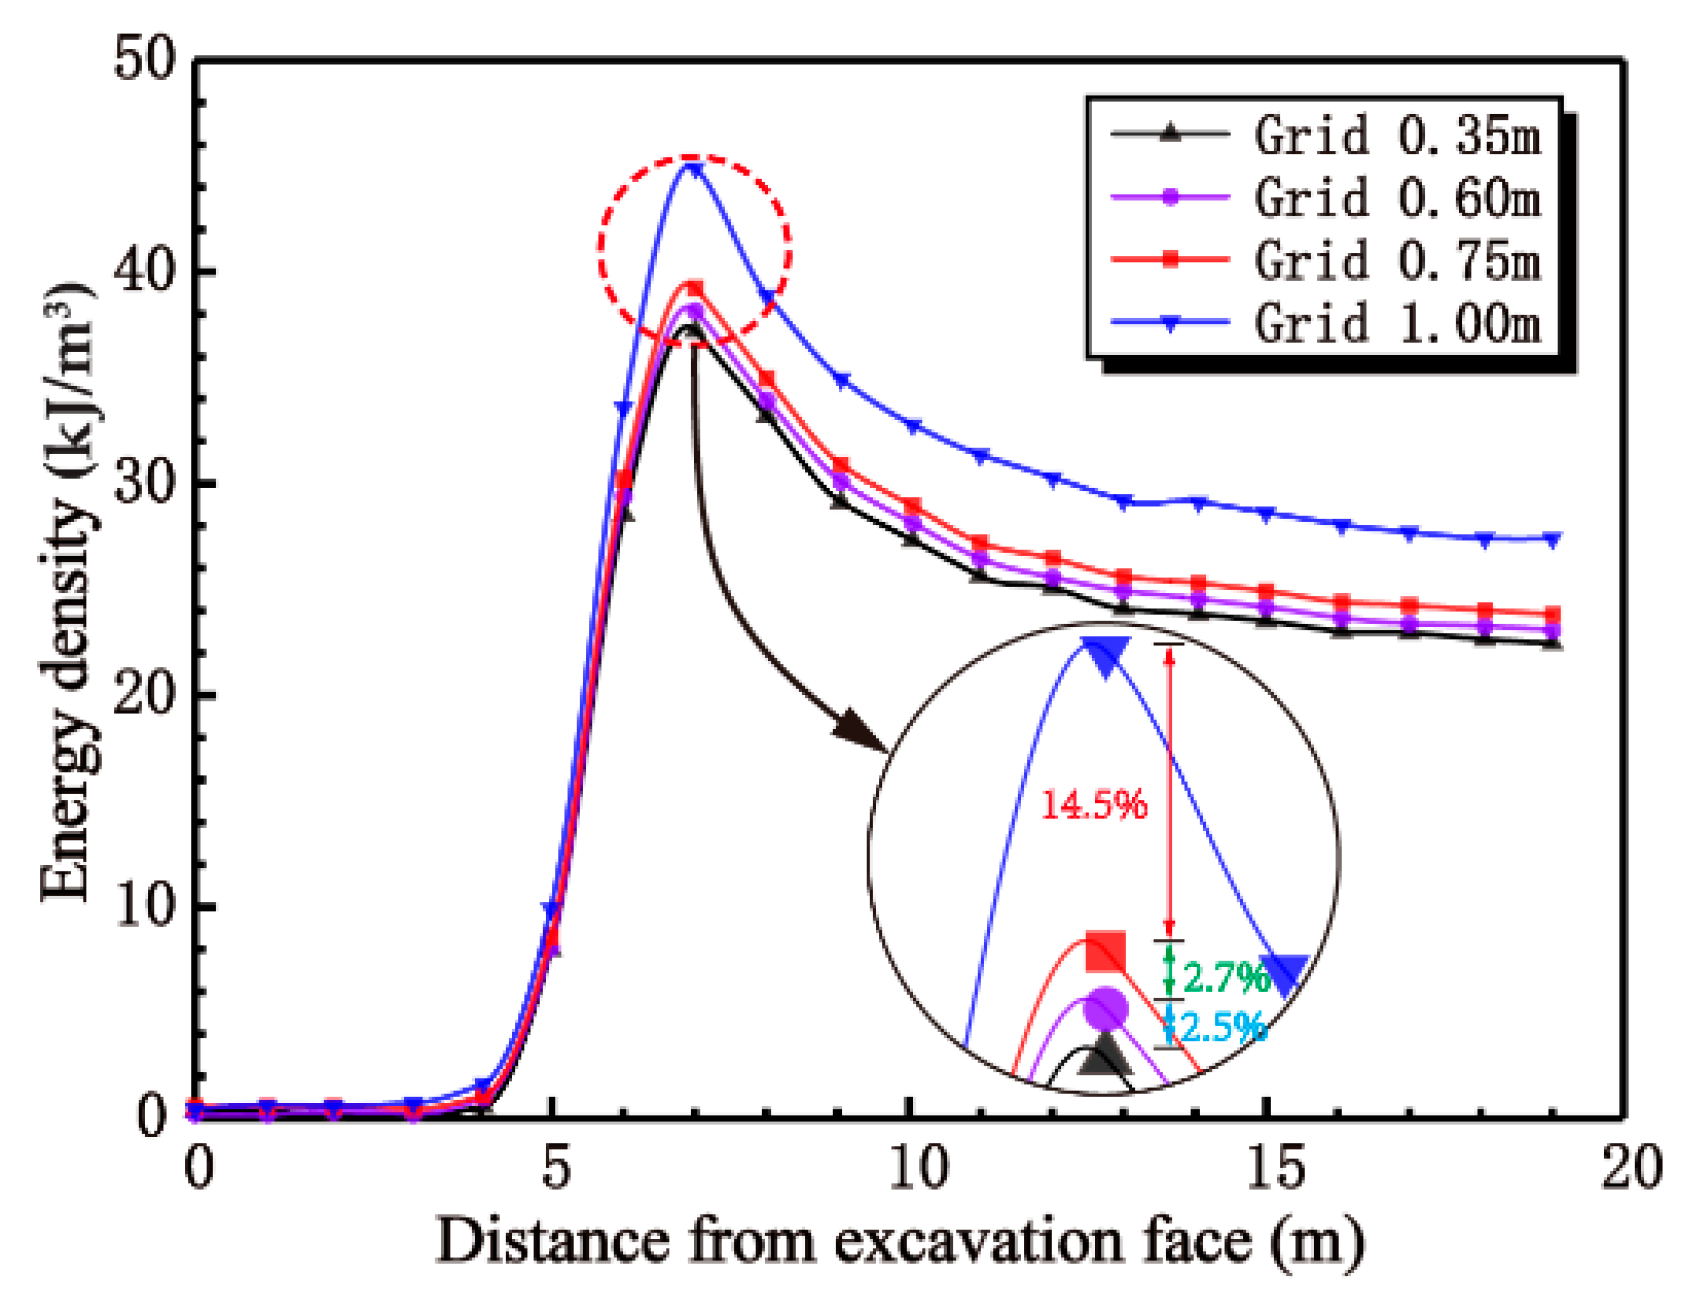
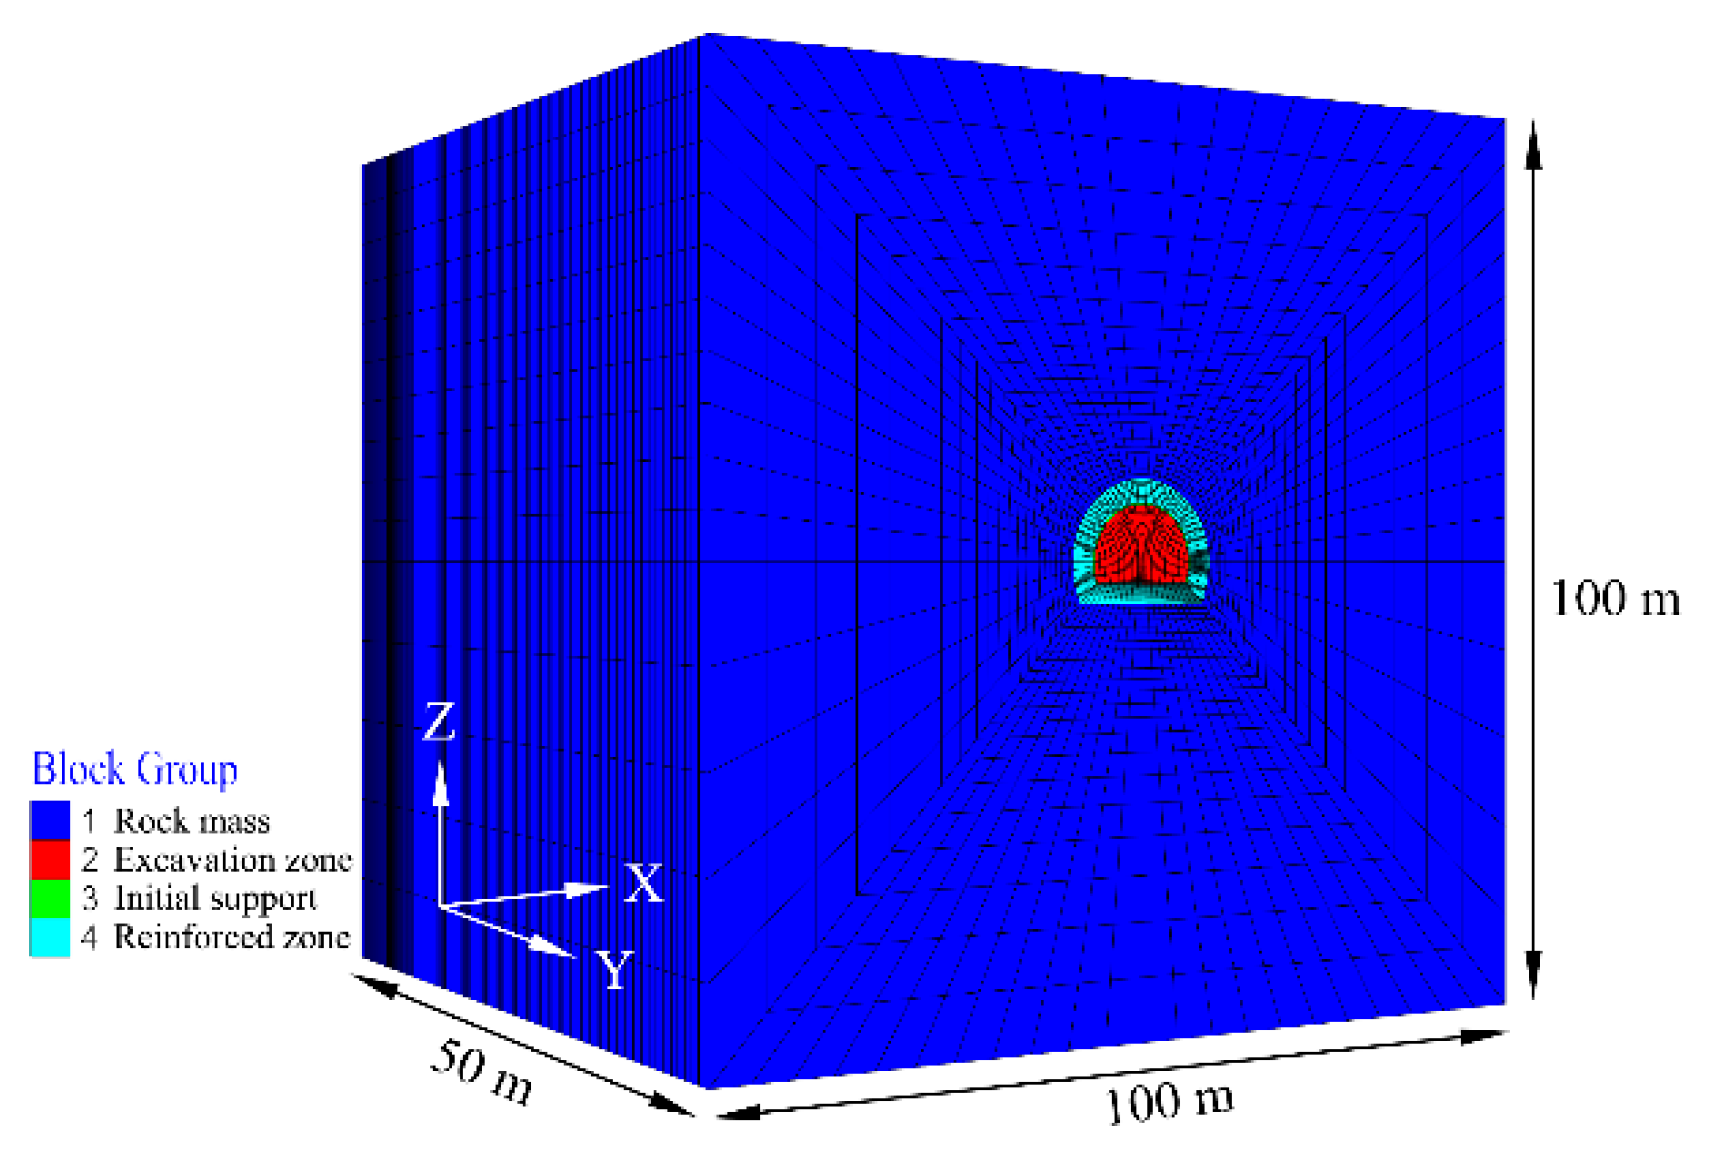
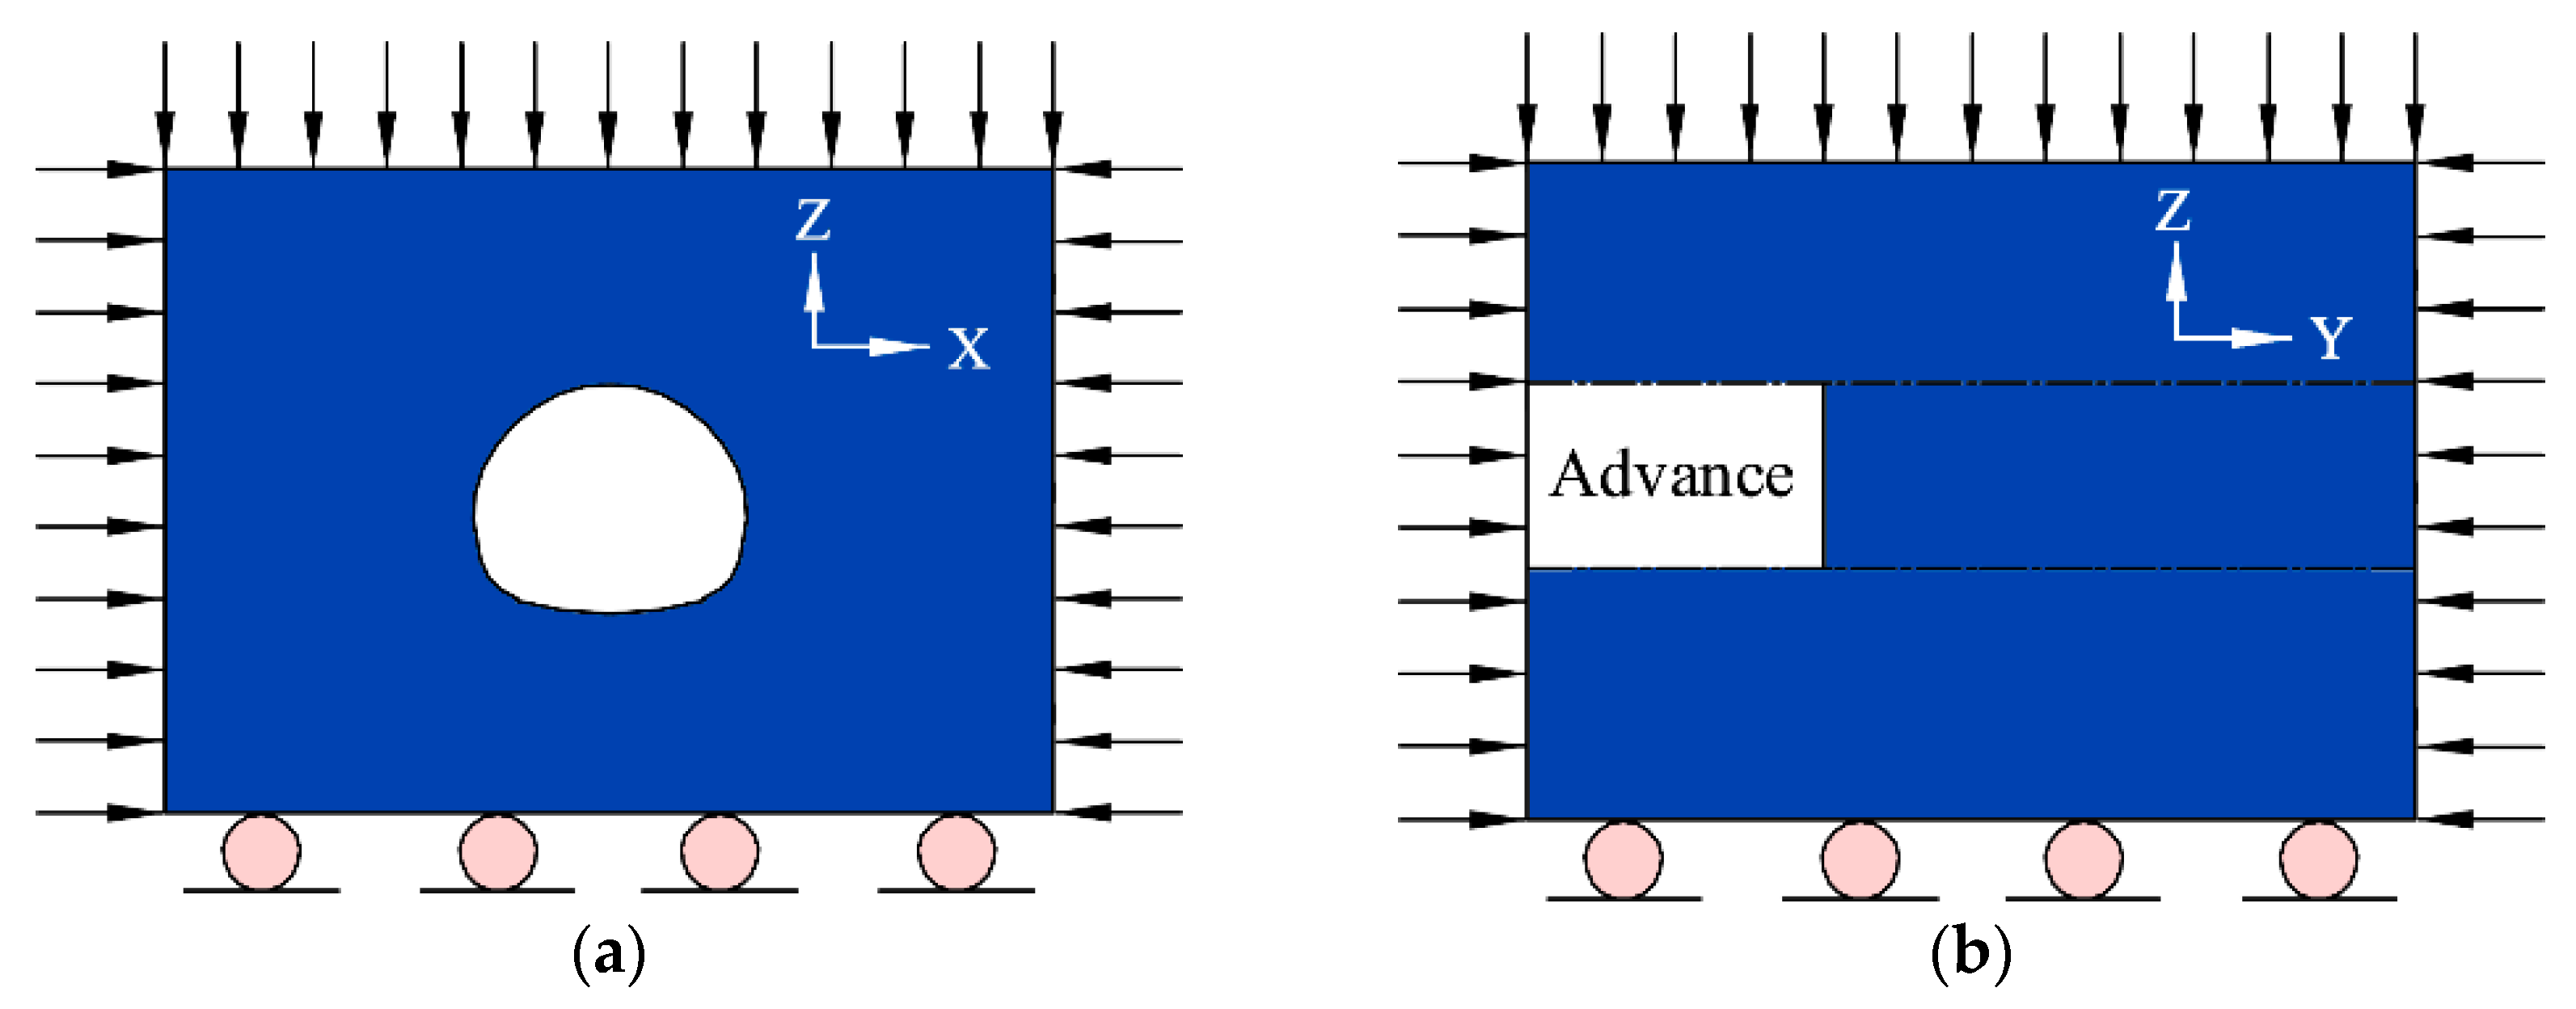
The stress state and energy distribution of the tunnel’s surrounding rock in different geo-stress conditions were analyzed by using the finite difference software, FLAC3D. In view of the impact of the boundary effect, in the model, the distance from each side and the upper and lower parts of the tunnel to the boundary of the model was set equal to quadruple of the tunnel diameter. The dimensions of the three-dimensional calculation model were 100 × 50 × 100 m. The primary support, including the 20 cm thick C20 shotcrete and 2.5 m long full-length cement cohesive rock bolts with a diameter of 22 mm, which were locally placed in the arch and side wall of the tunnel section, were adopted in the full-face excavation. In the model, a reinforced area was adopted to simulate the grouting circle where the performance of the surrounding rock was improved, and the cable element, shell element, and solid element were adopted to simulate the rock bolt, shotcrete, and reinforced area, respectively. Independence mesh tests were also carried out with different mesh sizes: 1 m (67,250 elements), 0.75 m (12,980 elements), 0.6 m (365,750 elements), and 0.35 m (504,680 elements); refer to Figure 11. The bigger the mesh size, the smaller the element number, and the faster the computation. The results show that when the smallest element mesh size is smaller than 0.75 m, the computation results are stable and can be acceptable. Therefore, in our numerical simulation, the smallest hexahedral element grid with a mesh size of 0.75 m was employed to investigate the energy density of surrounding rock, as shown in Figure 12. The boundary conditions were as follows: According to the original geological investigation data of Daxiangling, and in consideration of the complexity of the in-situ geo-stress field, the in-situ geo-stress field was derived from back analysis of in-situ geo-stresses. Then, the in-situ geo-stresses at the corresponding locations were applied to the calculation model, and the model bottom was fully constrained to limit its displacement; refer to Figure 13.
5.2. Calculation Parameters of Surrounding Rock
The strain hardening/softening constitutive model more suitable for describing the rock yield was used as the constitutive model. Its failure envelope is not correlated with the shear flow rule but with the tensile flow rule. The difference compared to the Mohr–Coulomb model is that the cohesion, friction angle, shear dilatancy expansion, and tensile strength may change after the plastic yield begins, while in the Mohr–Coulomb model, such properties always remain constant. This is particularly important for describing the mechanical behavior characteristics of the rock under high geo-stresses.
In the model calculation, each parameter of the surrounding rock was assessed according to the physical and mechanical indicators of the cores taken from the boreholes of Daxiangling Tunnel. In order to facilitate the comparative analysis, a set of lower geo-stress conditions (SZK4D) was assumed. The physical and mechanical parameters of the surrounding rock in such conditions were the same as those of SZK4, and the value of the geo-stress in each direction was one-twentieth of that of SZK4. The selected parameter results are shown in Table 4:
6. Calculation Results
6.1. Analysis of Energy Distribution in Different Geo-Stress Conditions
The energy density and the energy release rate were mainly selected for the evaluation. Both the strain energy density and the ERR can be obtained by the secondary development through post-processing of the FLAC3D. Excavation unloading leads to the accumulation of strain energy near the surrounding rock. When the accumulated energy exceeds the energy storage limit, Umix, of the rock mass at the corresponding point, the strain energy will be abruptly released, resulting in rockburst. When the accumulated energy exceeds the energy storage limit Umix of the rock mass at the corresponding point, the strain energy will be abruptly released, resulting in the occurrence of rockburst. The following parts mainly discuss the energy density distribution of surrounding rock of boreholes SZK2, SZK3, SZK4, and SZK4D.
6.1.1. Energy Density Analysis
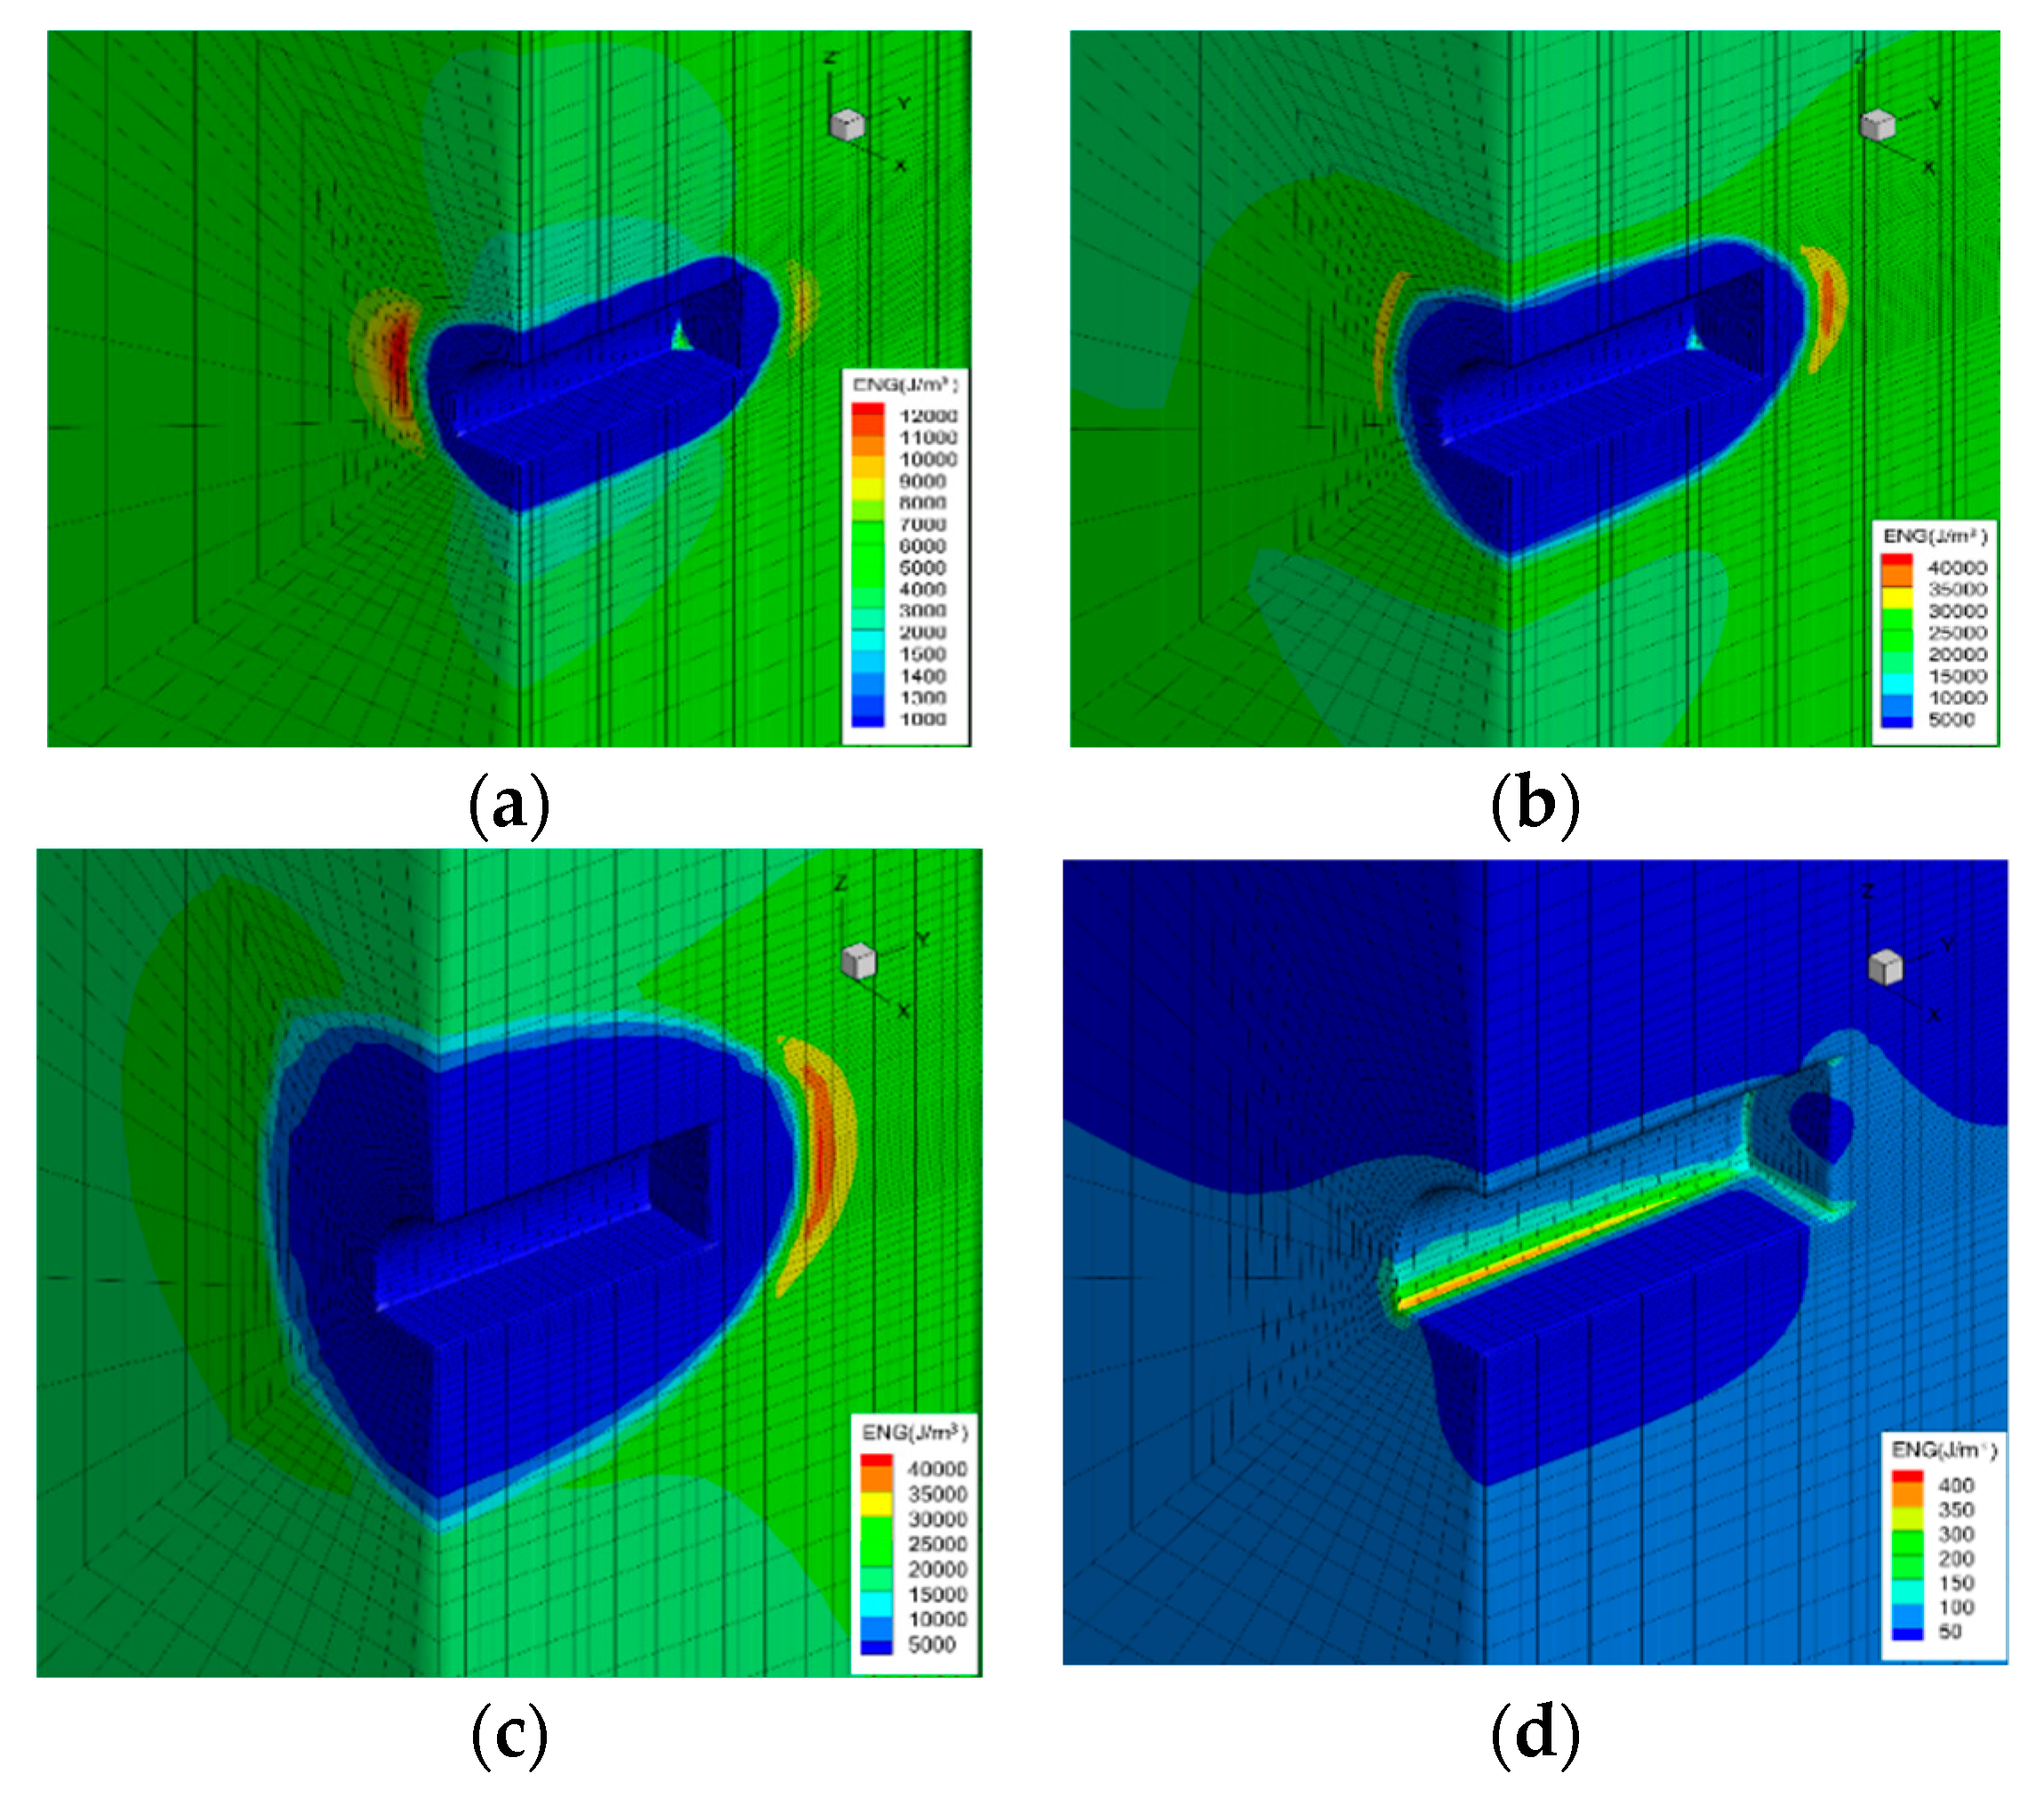
From the energy density distribution graphs in various conditions, as shown in Figure 14, it can be seen that in the case of SZK4D under low geo-stresses, energy accumulation zones appear on the tunnel perimeter, and high energy density zones appear at stress concentration locations, with abrupt geometrical changes, such as sharp corners on the excavation face. Under high geo-stresses, energy decrease zones appear on the tunnel perimeter, and the energy density increases sharply on the outer side of the energy decrease zones.
The high-density areas of SZK2 mainly appear in the outer side of the side wall, and those of SZK3 and SZK4 appear in the outer side of the side wall and in front of the working face. The in-situ geo-stress of SZK2 is governed by the horizontal tectonic stress and is perpendicular to the tunnel axis; that is, the lateral pressure coefficient of the tunnel site area, in this case, is small. Therefore, it is apparent that the magnitude and direction of the in-situ geo-stress of the tunnel have a significant impact on energy accumulation locations. When the maximum principal stress of the horizontal tectonic stress in the in-situ geo-stress is perpendicular to the tunnel axis, the maximum energy accumulation is in the upper and lower parts of the tunnel. The maximum values of the energy density of surrounding rock in each case are given in the following Table 5.
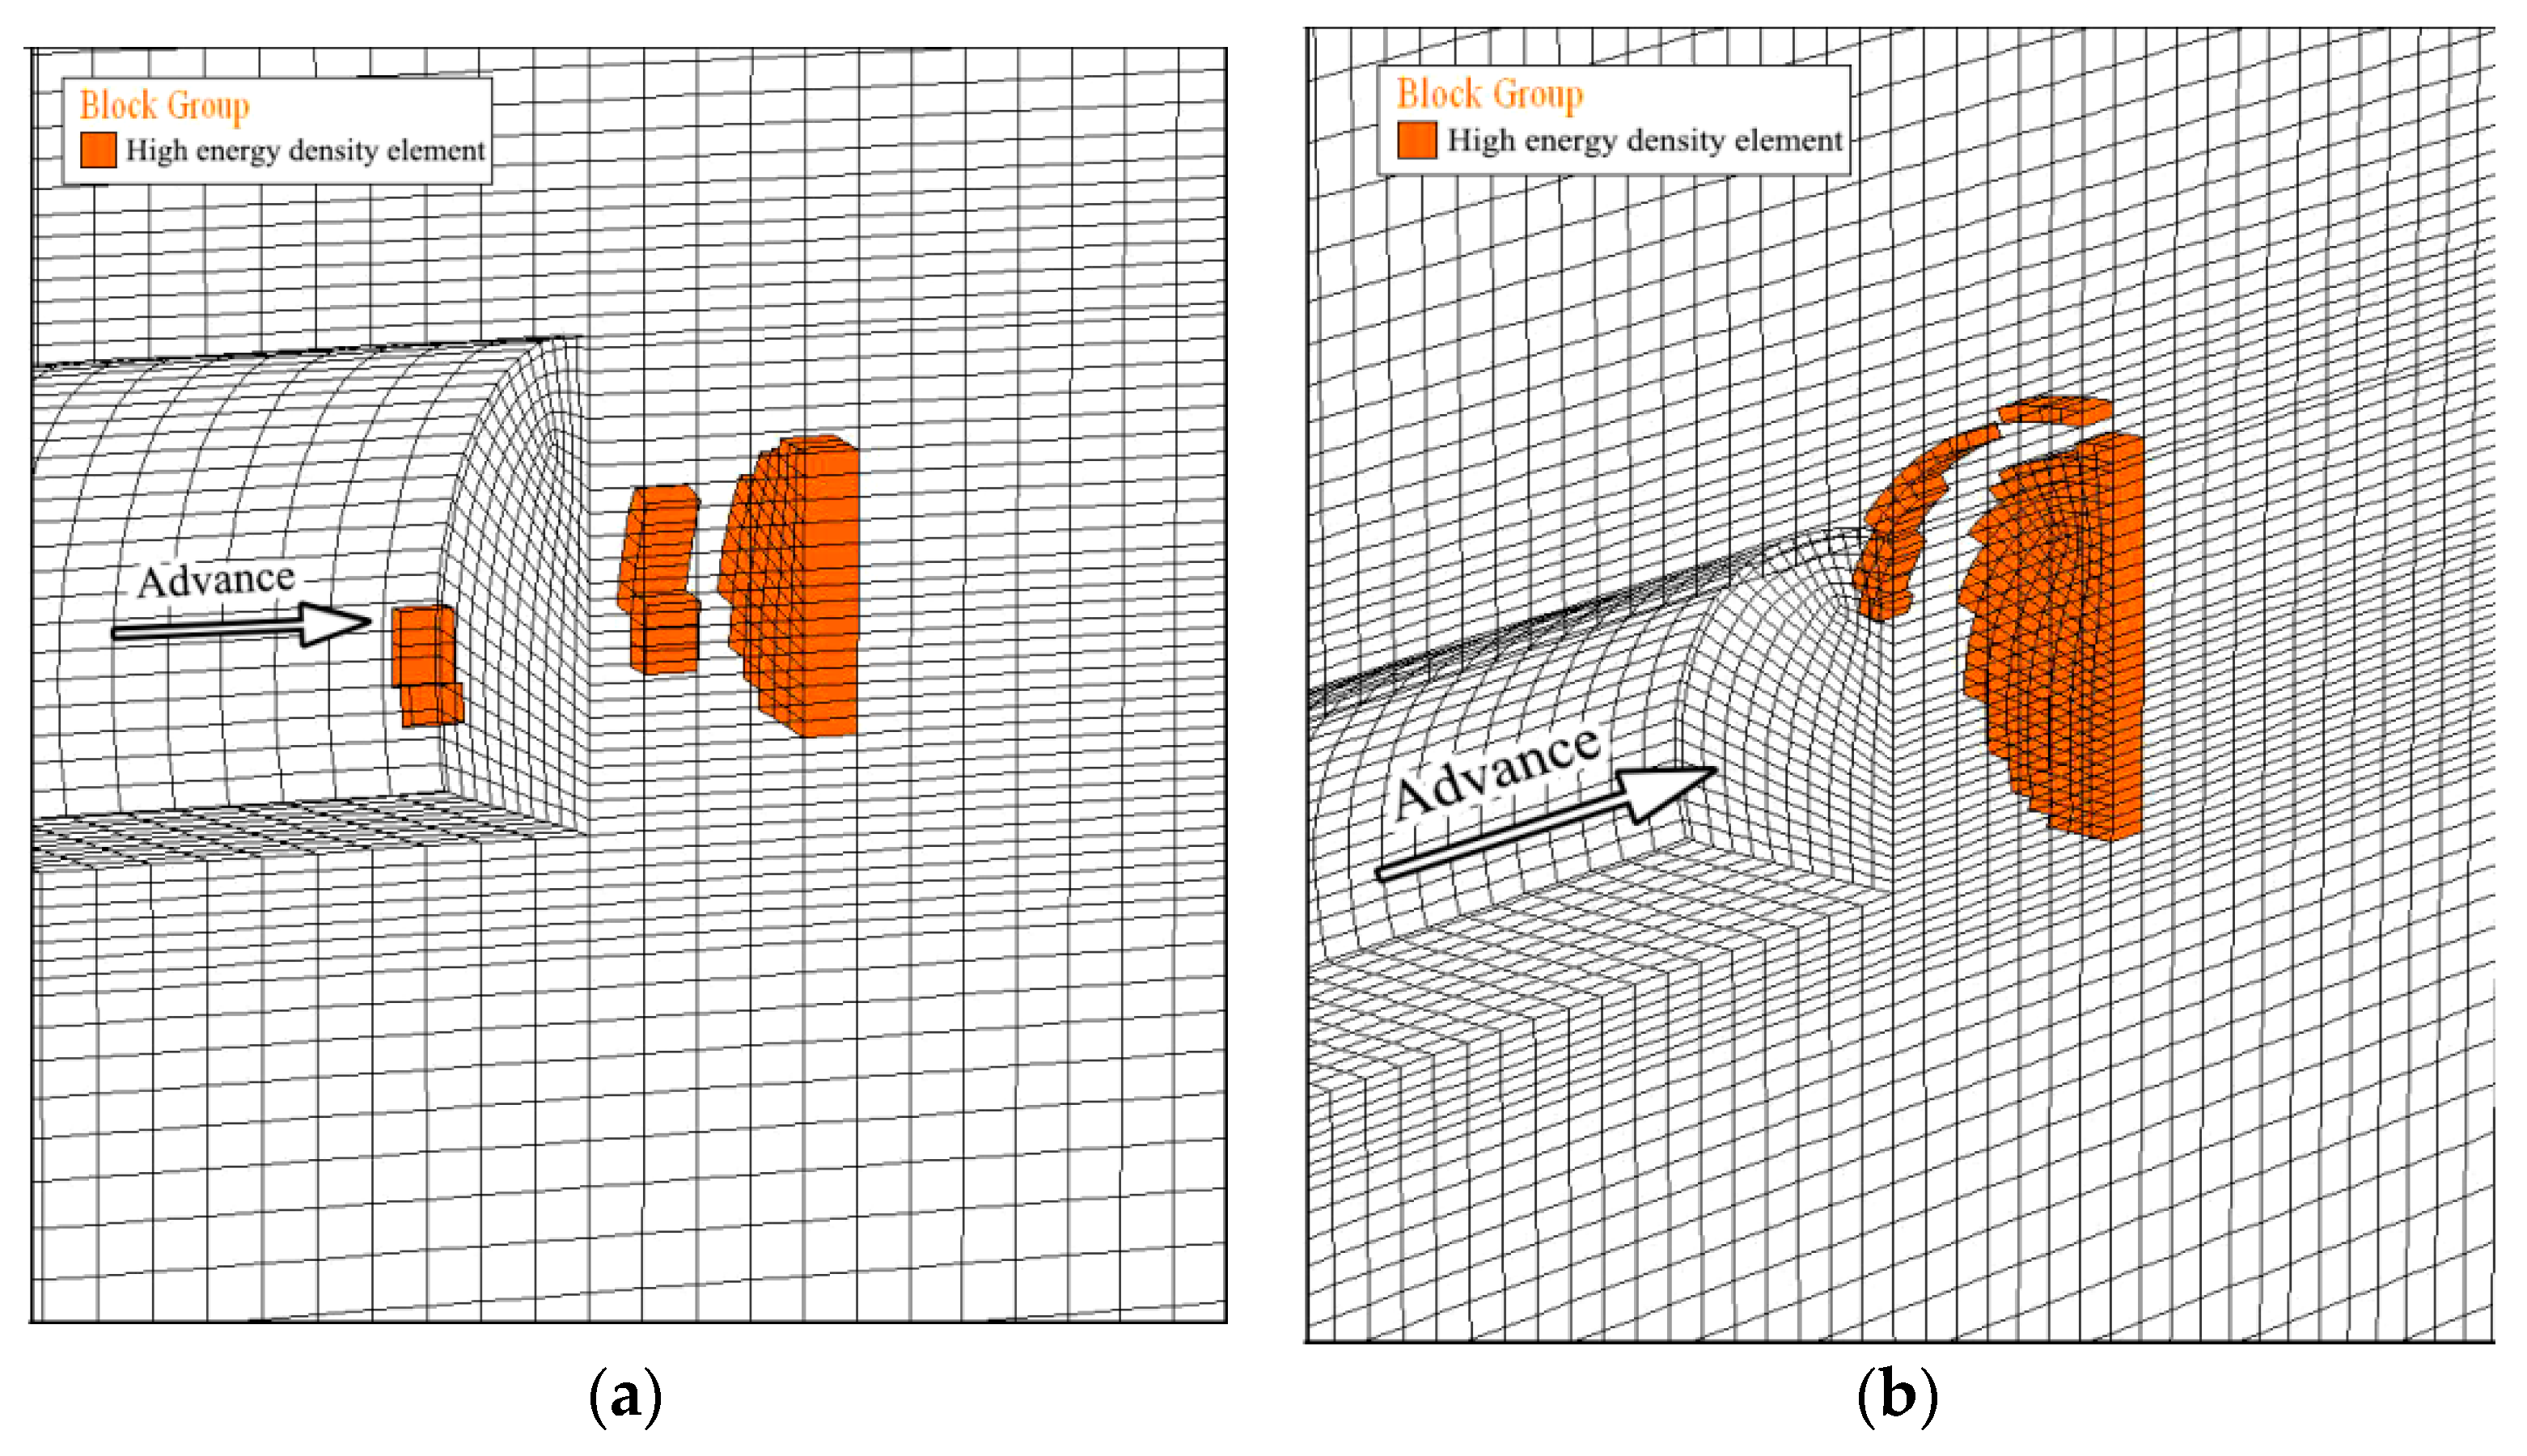
According to the comparison, the increase in the maximum value of energy density after excavation does not have a linear proportional relationship with the increase in the maximum value of in-situ geo-stress. The geo-stresses of SZK4 are 20 times those of SZK4D, and the maximum value of energy density is 100 times that of SZK4D, which indicates that as the in-situ geo-stress increases, the increase in energy density is faster than the increase in geo-stresses, and so the surrounding rock becomes unstable at a faster speed. The maximum values of the energy density of both SZK3 and SZK4 are higher than 44 kJ/m3 and, according to the criterion of rockburst energy density (>40 kJ/m3), they can trigger rockburst. After the processing, zones with an energy density higher than 40 kJ/m3 of SZK3 and SZK4 are shown in Figure 15.
From Figure 15, we can see that the maximum energy density zones appear on the working face and in front of the working face. The high-density zone of SZK3 is about 5 meters (0.42 D, where D is the diameter of the tunnel) from the working face, and that of SZK4 is about 8 meters (0.65 D) from the working face. This indicates that a large amount of energy accumulates around and in front of the working face. The higher the energy, the more unstable the system will be, and it is highly probable that the high energy zone will become the source of energy for the occurrence of rockburst. Moreover, from the figures above, we can see the possibility that rockburst will occur in the side wall near the working face in the case of SZK3 is high. The possibility that rockburst will occur in the arch crown and toe near the working face in the case of SZK4 is also high; there are more units of energy accumulation in front of the working face in the case of SZK4, so the stored energy is larger, and the surrounding rock is more unstable. In addition, there are energy-increasing zones in a large area in front of the working face in both cases.
6.1.2. Energy Conversion and Dissipation
According to Table 6, the energy release rates in different cases vary greatly. The comparison between the degrees of rockburst in boreholes SZK2, SZK3, and SZK4 shows that the rockburst in borehole SZK2 is the weakest and may be prevented if proper control measures are taken. The degrees of rockburst in boreholes SZK3 and SZK4 are equivalent, and the degree of borehole SZK4 is slightly higher. The energy release rate in SZK4 exceeds 300 kJ/m3. According to the criterion of the energy release rate, it is highly probable that such an energy release rate will trigger a rockburst [23,65,66]. The energy dissipated during excavation has two conversion modes. One is to act on the rock, resulting in failure and yield. The other is to generate the kinetic energy for rock ejection and cause rockburst phenomena, such as sound. The increase in the energy release rate indicates that the surrounding rock failure is serious. Therefore, the occurrence of rockburst may be slowed down or even avoided through control of the energy release rate, which can be decreased by improving construction techniques; for example, adopting a small length of a round and determining the reasonable time for support.
6.2. Validation
A series of medium intensity rockburst occurred at a mileage of K57 + 965 of the Daxiangling tunnel; the specific location of rockburst is shown in Figure 16. Numerical simulation was carried out at a mileage of K57 + 965 where rockburst occurred, and we tracked the energy density of the rockburst location, as shown in Figure 17. The calculation results show that the high energy density units, in which energy density more than 40 kJ/m3, are highly concentrated at the location of the rockbursts. Through the rockburst energy criterion method in this paper, we can infer that rockbursts will occur. The location of the calculation results is consistent with the location of rockburst on site. Numerical calculations agree with the field results very well, verifying that this method is valid.
6.3. Optimization of Tunnel Construction
6.3.1. Optimization of Time for Support
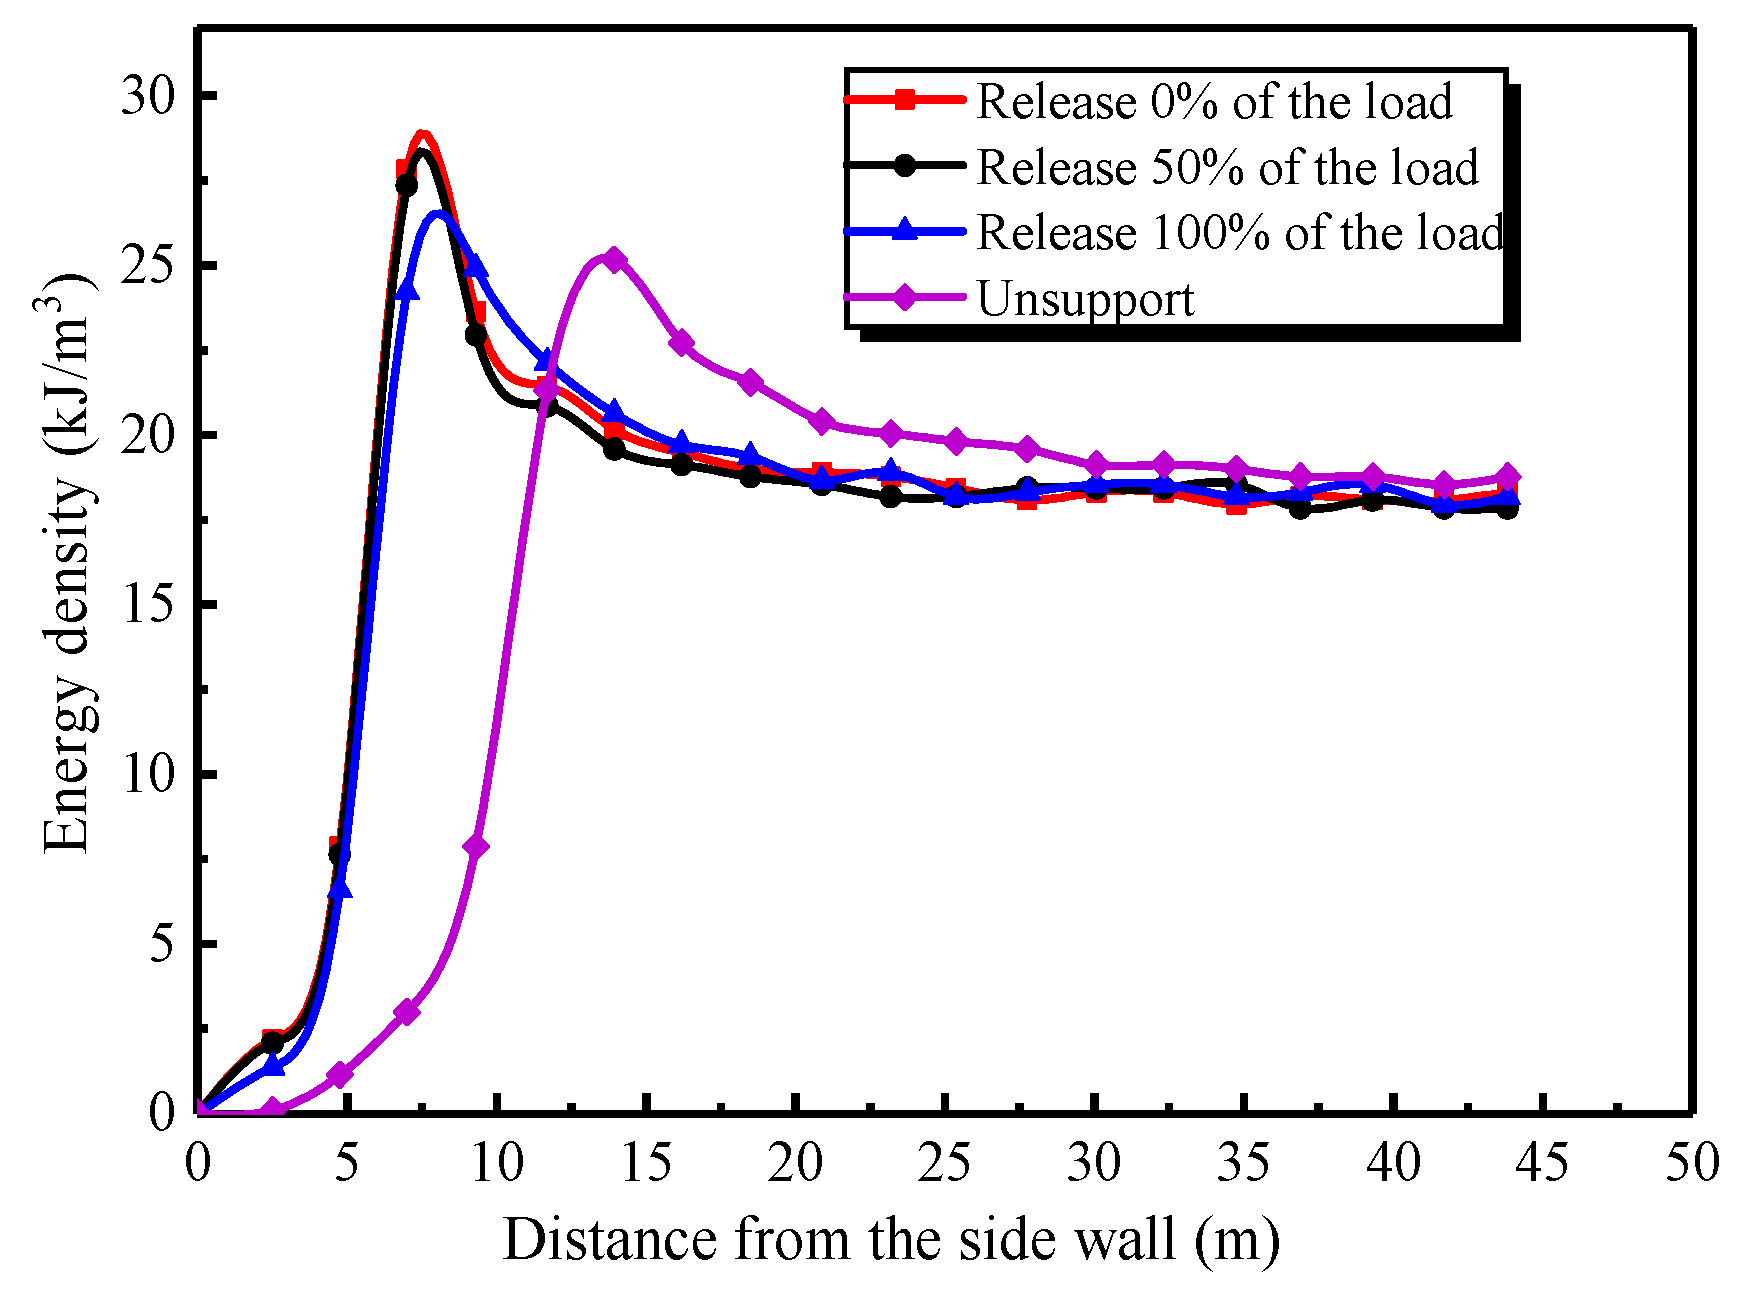
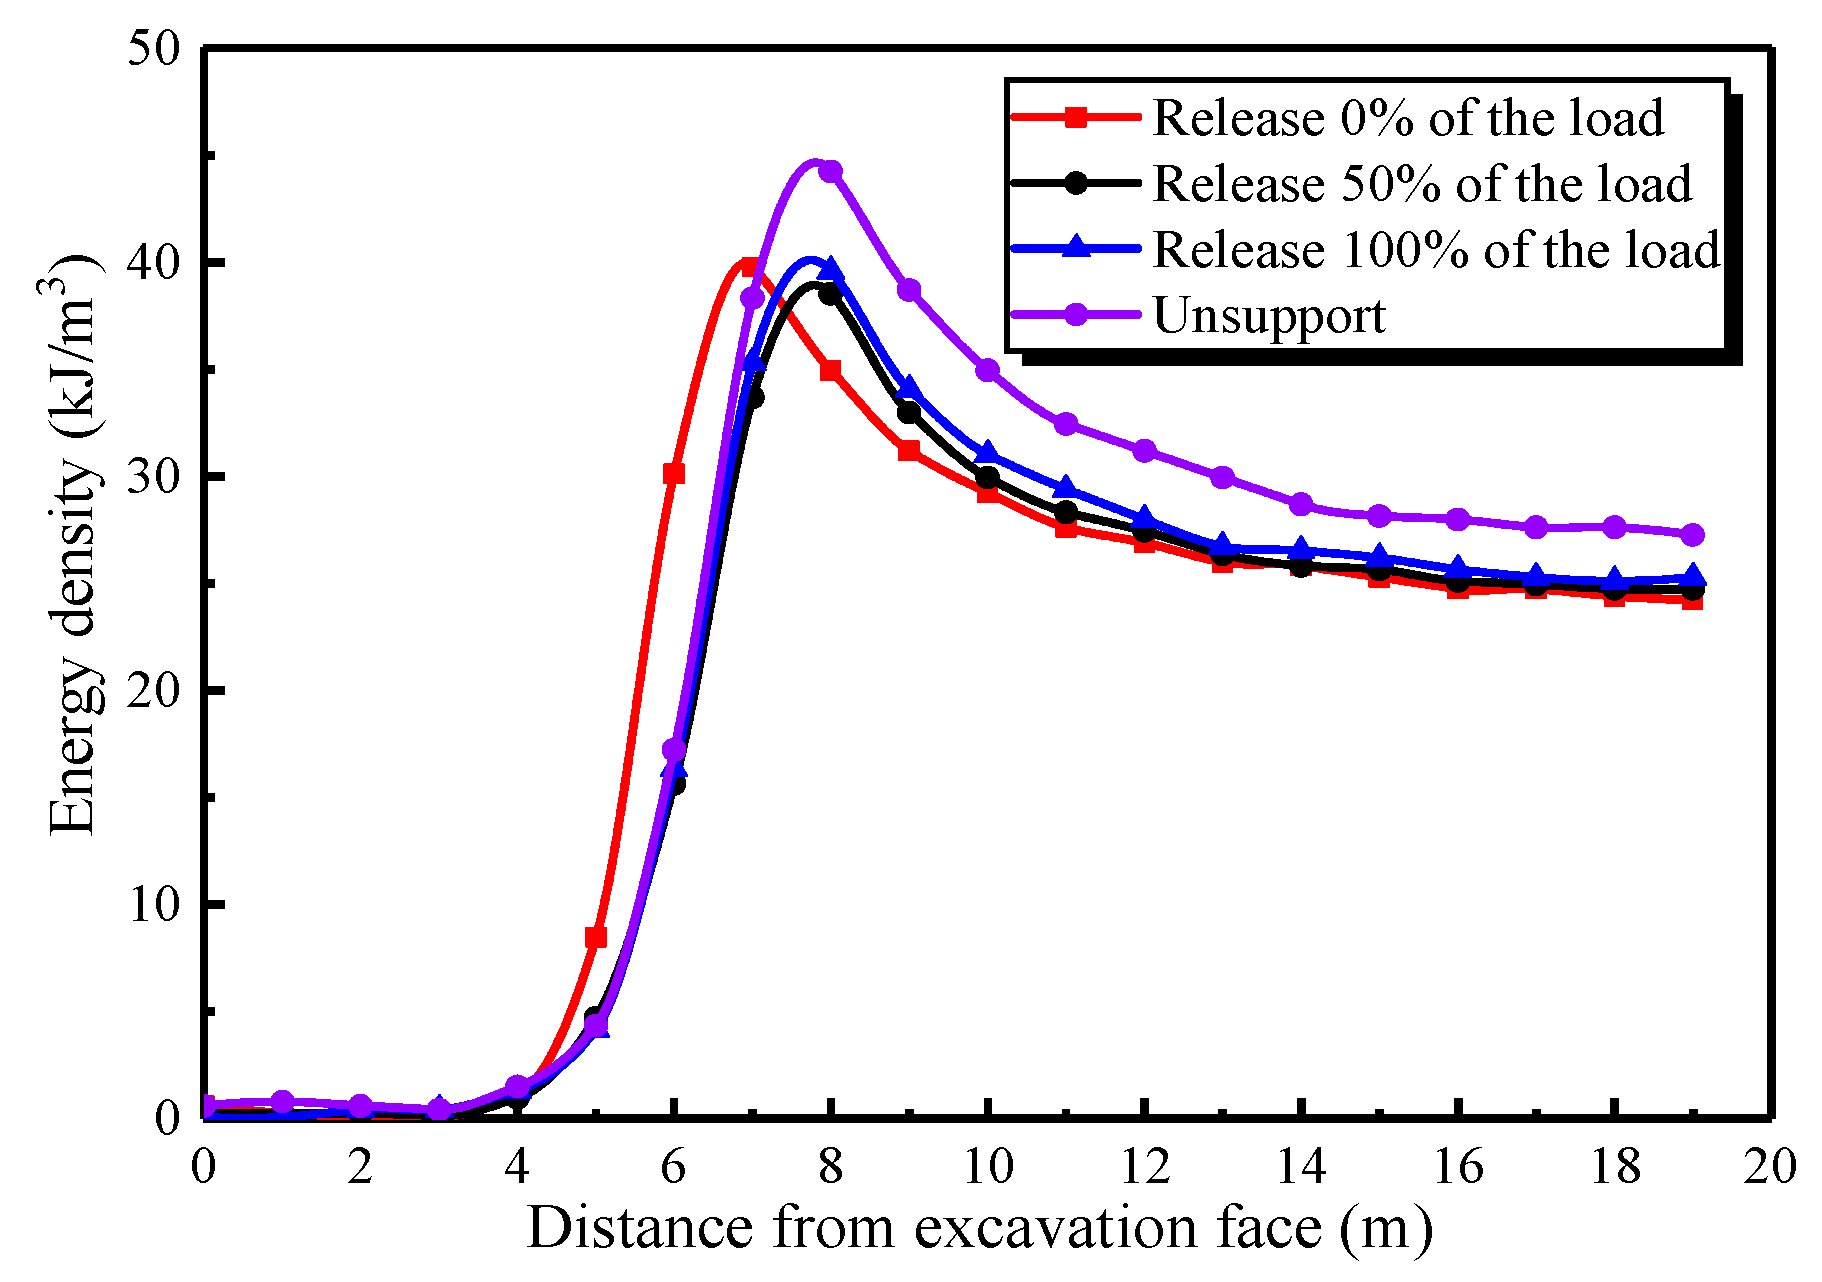
It can be seen from the above that the stress condition of SZK4 is most likely to cause rockburst, so SZK4 is selected as the study object of support optimization. Under high geo-stresses, in order to optimize the tunnel construction, the geo-stress condition at SZK4 was used to simulate different times for support during the tunnel excavation. Calculation was performed for four cases: (1) immediate support during excavation, i.e., release 0% of the load; (2) release 50% of the load in the length of a round of excavation and construct the lining in the length of the next round; (3) release 100% of the load in the length of a round of excavation and construct the lining in the length of the next round; and (4) unsupported tunnel, i.e., no support is erected for the entire section of excavation. The maximum values of energy density in each case are given in Table 7.
According to Table 7, the maximum values of the energy density of surrounding rock in different cases of load release are not greatly different from each other, but they are much smaller (at least 10%) than the maximum value of energy density in the case of no support. This indicates that if the excavated section is provided with support before the length of the next round of excavation is commenced, the energy density can be controlled below the theoretical threshold of the energy density criterion of 40 kJ/m3. The change between each load release case has little impact on the maximum value of energy density, indicating that the support erected too early does not have a significant impact on energy concentration. Therefore, according to the energy density analysis, we should not always emphasize early support or rigid support. Timely support is difficult to achieve in engineering practice and cannot effectively mitigate the energy concentration or suppress the occurrence of rockburst, and so, this is not cost effective. The load should be partially released after excavation, or flexible support should be adopted to deform the surrounding rock and thus partially release the energy of the in-situ surrounding rock.
Figure 18 and Figure 19 show that after the support is erected, the energy concentration area in the surrounding rock of the side wall is closer to the tunnel perimeter. The energy density curve in the case of 0% load release is very similar to that in the case of 50% load release, and after the support is erected, the energy concentration areas are closer to the tunnel perimeter and vary more. For the side wall, the earlier the support is erected, the higher the energy density of the surrounding rock behind the side wall will be; for the working face, on the contrary, the later the support is erected, the higher the energy density will be. The energy release rate in each case is shown in Table 8.
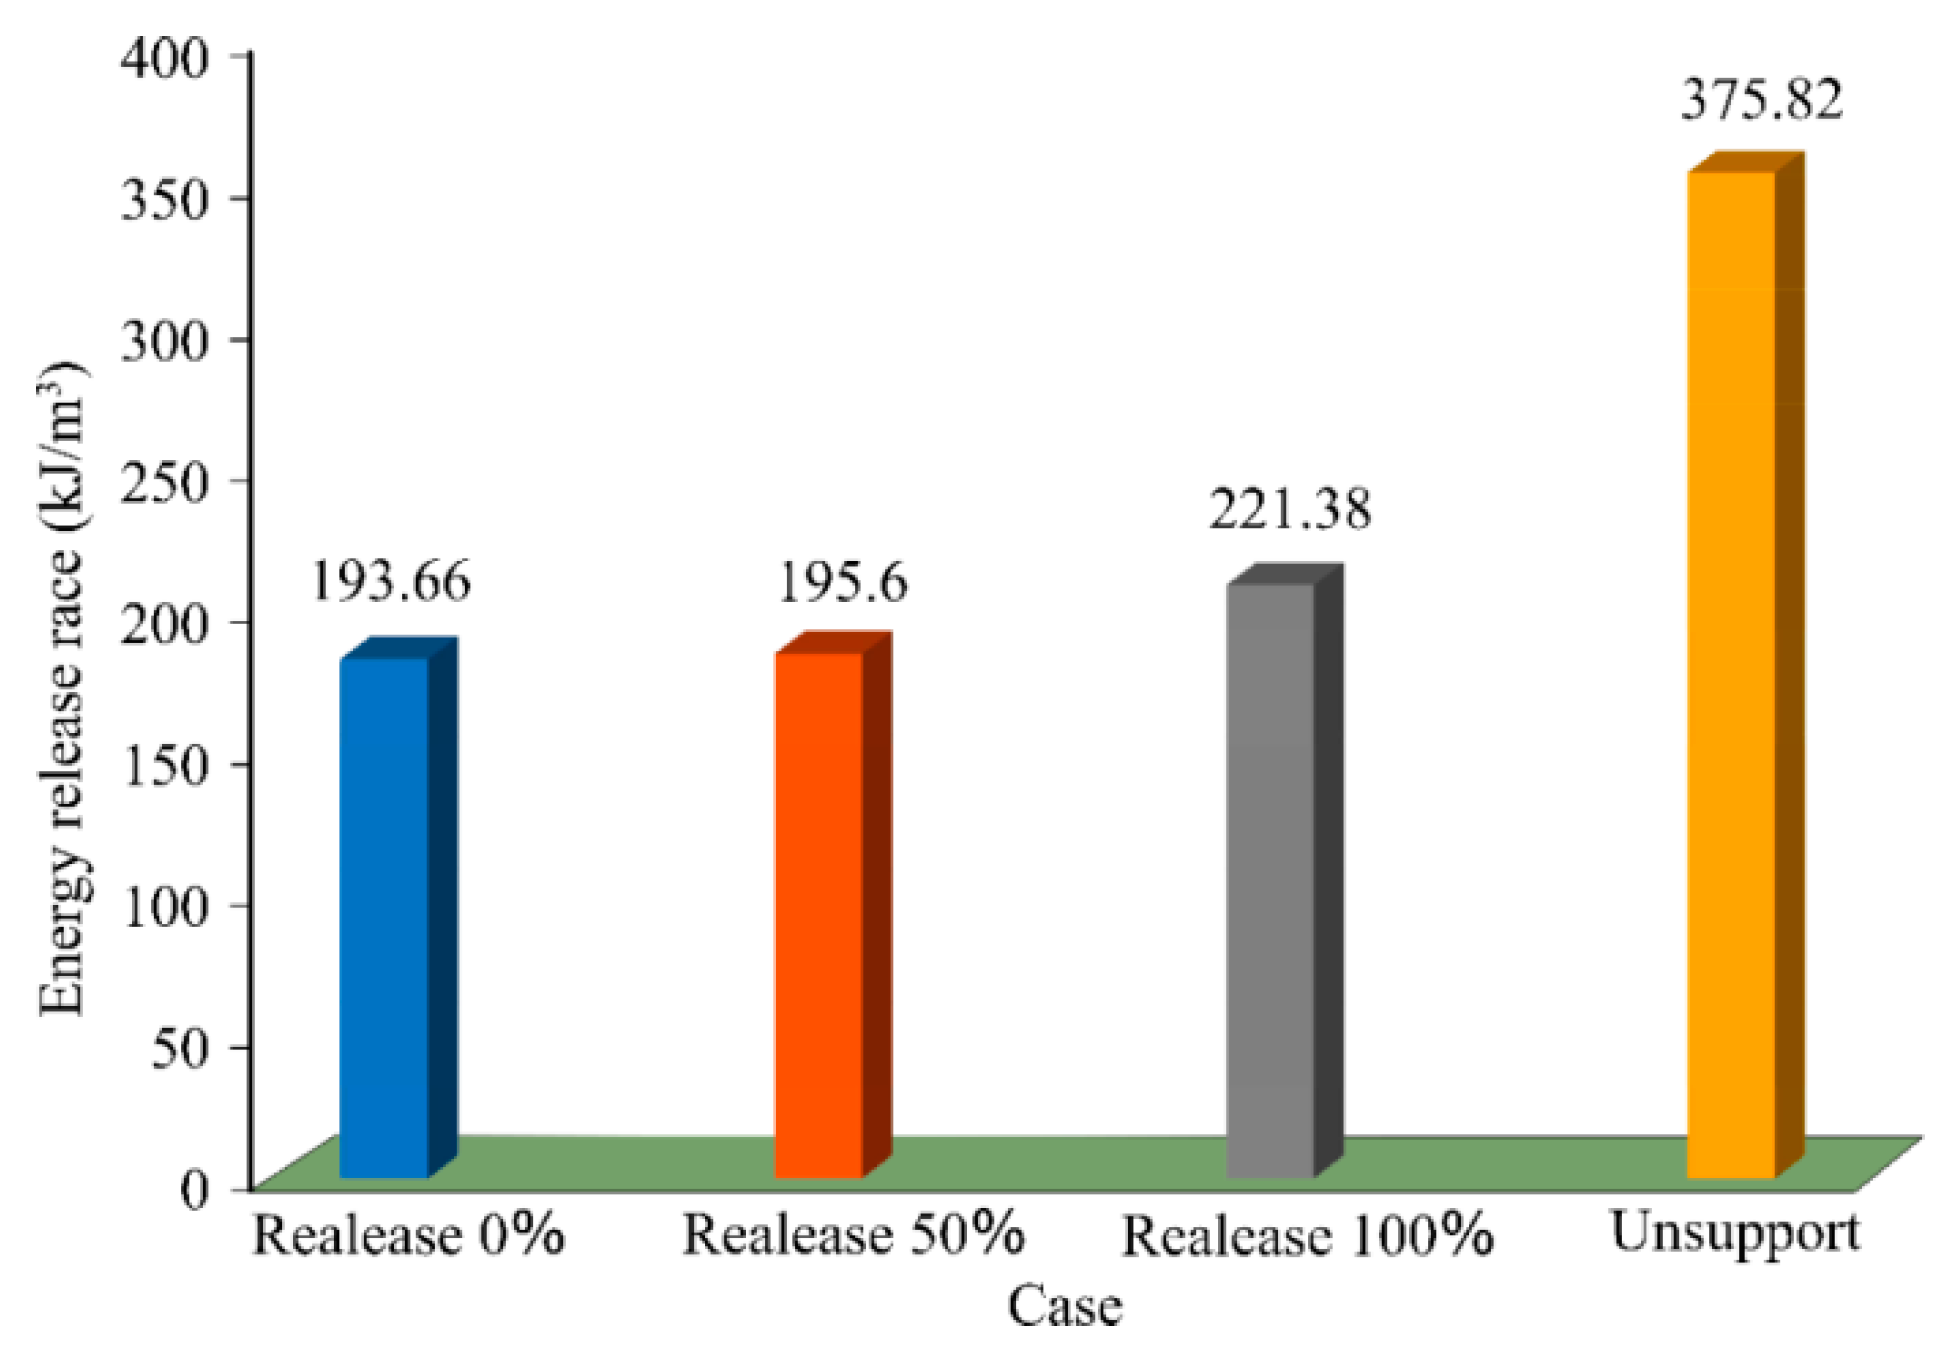
It can be seen from Table 8 that the energy release rate of borehole SZK4 can be effectively controlled below 300 kJ/m3 after support is erected, which is at least 40% lower than that in the case of no support. This indicates that the occurrence of rockburst can be effectively prevented by the timely erection of support after excavation. The difference between the times for support is small, and the difference between the maximum and the minimum in the three cases is just 13%.
Figure 20 shows that the support can effectively reduce the energy release rate, thereby improving the stability of the rock surrounding excavation.
6.3.2. Optimization of Length of a Construction Round
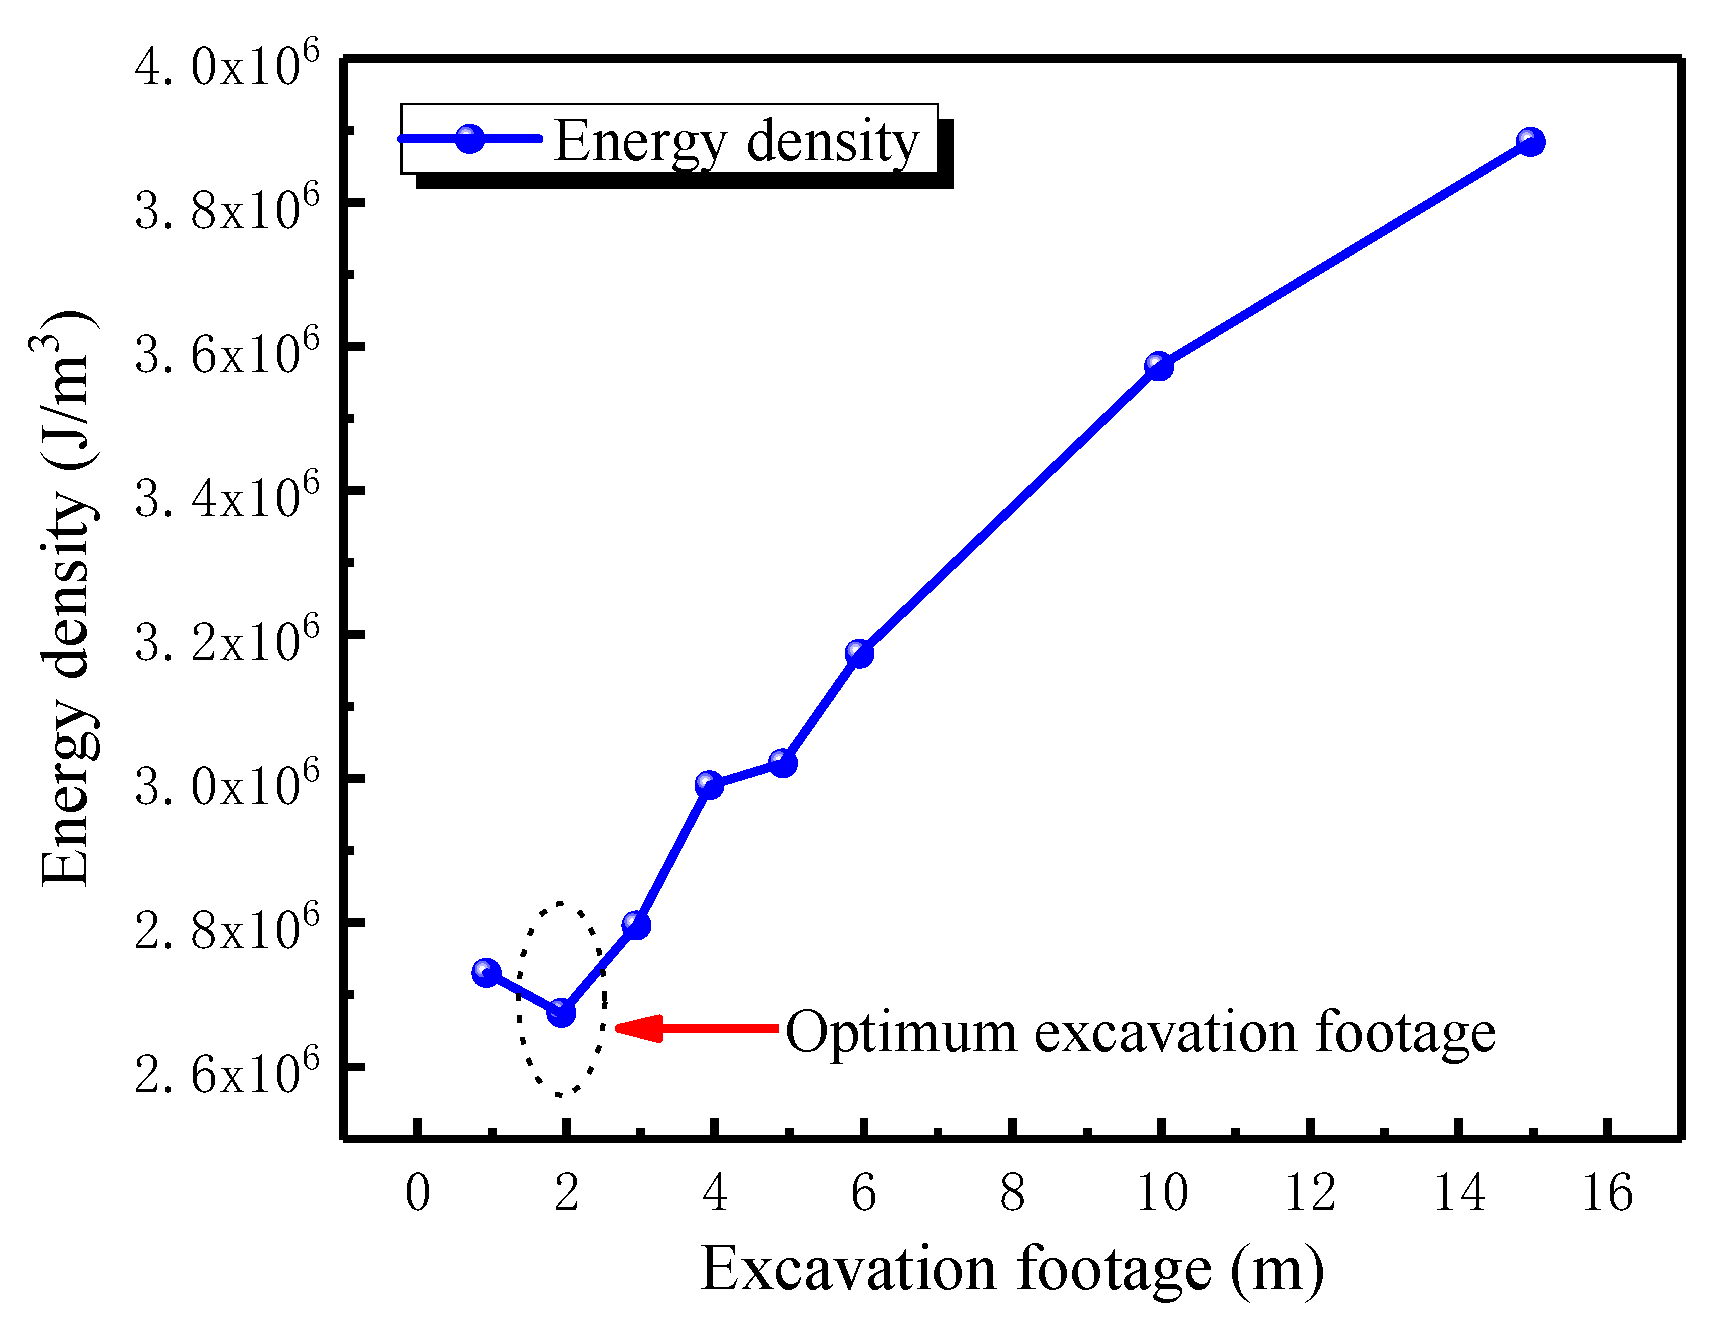
According to Section 5.2, when the energy density of surrounding rock is higher than 40 kJ/m3, a rockburst may occur. Therefore, in the calculation, the units with an energy density higher than 40 kJ/m3 in each case were collected. In different conditions of the length of a round, the high energy units are all distributed in front of the working face or on the tunnel perimeter at the working face. As the length of a round increases, they are distributed in a more concentrated scope. This shows that a greater length of a round leads to a higher energy density level and more concentrated energy. The greater the magnitude of energy, the more concentrated it will be. In this case, the surrounding rock will become more unstable, and the rockburst risk will be higher. The curve of the total energy stored in high energy units varying with the length of a round is given in Figure 21.
As can be seen from Figure 21, with the increase in the length of a round, the energy stored in high energy density units shows a general trend of increase. When the length is greater than 1 m, the total energy stored in high energy units decreases first and then increases. When the length is greater than 2 m, it increases linearly. When the length reaches 15 m, it approaches 40 kJ. The higher energy indicates that the excavation surrounding rock is more unstable in such a length condition and, thus, the rockburst propensity is high. The rockburst caused by a more unstable energy release will be more intense. According to the figure, when the length is 2 m, the energy shows a trend of increase. Since the length less than 1 m was not calculated in detail (it is seldom adopted in construction practice), the energy change trend in the case of the length being less than 1 m remains to be further studied and ascertained. In the present calculation, the analysis was conducted based on energy density. In terms of the stability of surrounding rock, the optimal length of a construction round should range between 1 and 2 m. The different length leads to different energy dissipated in the excavation. Therefore, the impact of different lengths on the stability of surrounding rock can be seen from the perspective of energy release rate, and advantages and disadvantages of each length can be evaluated accordingly. The dissipation of model energy in the excavation of each length is given in Table 9.
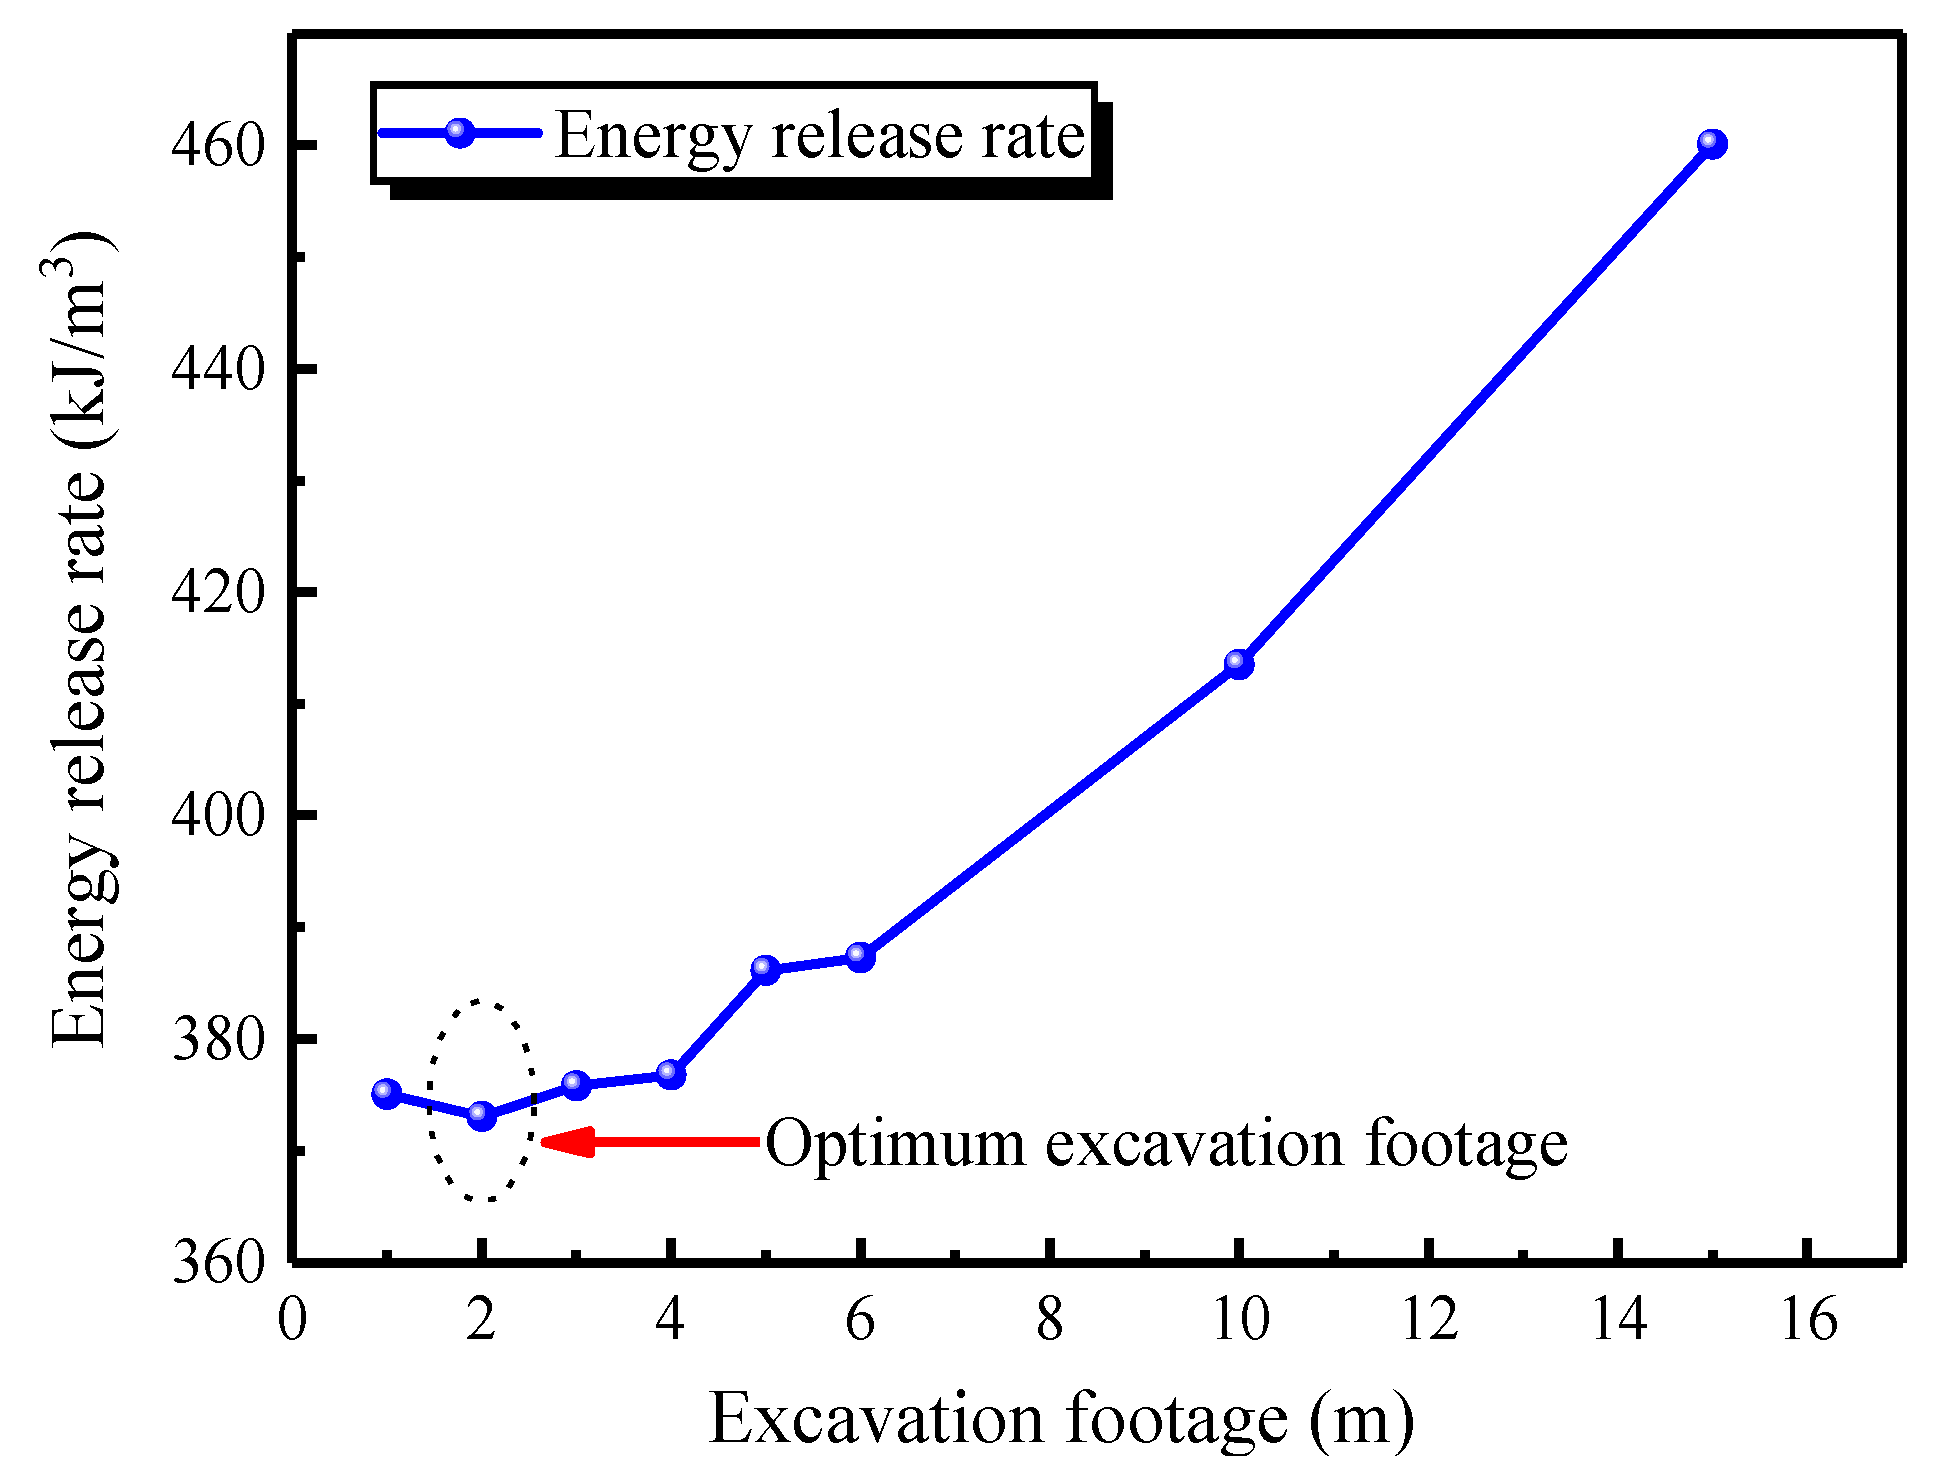
As can be seen from Table 9, the energy release rate continuously increases with the increase in the length of a round. The curve of increase is shown in Figure 22. The energy release rate rises with the increase in the length of a round, indicating that the increase in the length is not conducive to the prevention and control of rockburst during construction. Figure 22 also shows that the energy release rate increases slowly in the case of a small length, increases sharply when the length exceeds 4 m, and reaches the minimum when the length is 2 m. Based on the criterion of the energy release rate of the calculation, it can be considered that the optimal length of a round should range between 1 and 2 m.
7. Conclusions
From the perspective of energy and engineering applications, a new indicator for evaluation of stability and optimization of hard brittle surrounding rock under high geo-stresses, namely, the minimum energy storage limit of surrounding rock induced by transient unloading, is proposed in this paper based on energy theory. By theoretical analysis, the impact of transient unloading during tunnel excavation on the energy storage limit of rock masses is studied. A numerical calculation method is adopted to analyze the locations and potential risks of rockburst occurring under the high geo-stress conditions of a tunnel. In addition, the time for erecting support for tunnel excavation in the rockburst area and the impact of excavation dimensions on rockburst are studied. The conclusions are drawn as follows:
- (1)
- For tunnel excavation under high geo-stresses, at a distance closer to the excavation face, the energy storage limit of surrounding rock will be lower. Because the transient unloading causes the increase in the difference between the primary and the tertiary principal stresses, the energy storage limit of the rock masses decreases accordingly during the excavation, and the minimum value Umix can be used as the energy criterion for the occurrence of rockburst. When the density of strain energy partially accumulated in the surrounding rock exceeds the minimum energy storage limit of the rock mass, Umix, the energy in the rock mass will be abruptly released, resulting in rockburst. This indicator is an approximate representation of the magnitude of energy released during the brittle failure of unit rock masses and can be used as a quantitative indicator for reflecting the occurrence of rockburst.
- (2)
- The magnitude and direction of the in-situ geo-stresses of the tunnel have a significant impact on energy accumulation locations. When the maximum principal stress of the horizontal tectonic stress in the in-situ geo-stress is perpendicular to the tunnel axis, the maximum energy accumulates at the upper and lower parts of the tunnel. If the stored energy is greater, the surrounding rock will become more unstable, and the propensity of rockburst will be higher. During the excavation, rockburst is most likely to occur at 0.42–0.65 D away from the working face. The increasing length of a round adopted in high geo-stress areas will make the surrounding rock unstable and lead to a higher propensity of rockburst. By tracking changes in the elastic energy density of each unit and recording the locations of high energy density units after the tunnel is excavated under high geo-stresses, the location and strength of rockburst can be predicted.
- (3)
- If the excavated section is provided with appropriate support before the length of the next round of excavation is commenced, the energy density can be properly controlled below the energy storage density limit of the rock mass, Umix (40 kJ/m3), indicating that rockburst can be effectively prevented by the timely erection of support after excavation. If appropriate support is erected during the excavation, the energy release rate can be effectively controlled below 300 kJ/m3, which is at least 40% lower than that in the case of no support. This indicates that the energy release rate of surrounding rock can be effectively decreased, and the stability of surrounding rock can be improved by the timely erection of appropriate support.
- (4)
- With the increase in the length of a round, the energy stored in high energy units shows a general trend of increase. When the length is greater than 1 m, the total energy stored in high energy units decreases first and then increases. When the length is greater than 2 m, it increases linearly. When the length reaches 15 m, the energy density of high energy units approaches 40 kJ/m3. This indicates that the large length of a round adopted in high geo-stress areas will make the surrounding rock unstable and lead to a higher propensity of rockburst. The different length leads to different energy dissipated in the excavation. Therefore, the impact of different lengths on the stability of surrounding rock can be seen from the perspective of energy release rate, and advantages and disadvantages of each length can be evaluated accordingly. According to the calculation, the energy release rate reaches the minimum when the length is 2 m. Based on the analysis from the perspective of energy density and energy release rate, the optimal length of a round for tunnel construction in high geo-stress areas should range between 1 and 2 m.
It should be noted that the rock energy storage limit and the judgment of the high energy density element are based on the stress of surrounding rock at the tunnel wall in this paper. However, it is very difficult to accurately obtain the surrounding rock stress in the rockburst area. Therefore, the combination of in-situ measuring with stress inversion is applied in this paper. The proposed method can be applied to obtain the happening tendency of rockburst. However, the boundary of no tendency and small tendency awaits further study. To judge whether rockbursts will happen or not in practical engineering, the in-situ geological condition, ground stress, construction process, and so on should be considered.
Author Contributions
Z.Z. analyzed the calculation results. C.L. carried out the numerical simulation and wrote the article. H.Z. offered useful suggestions for the preparation and writing of the paper. R.G. processed the data. All authors have read and agreed to the published version of the manuscript.
Funding
The study was supported by the Sichuan Science and Technology Program (No. 2019YFG0001), the General Program of the National Natural Science Foundation of China (U1934213), the General Program of the National Natural Science Foundation of China (51878572 and 51678503).
Acknowledgments
We also highly appreciate the contribution of data collection from the Sichuan Communication Surveying and Design Institute. Finally, the authors would like to thank reviewers for useful comments and editors for improving the manuscript.
Conflicts of Interest
The authors declare no conflict of interest.
References
- Zhang, H.; Chen, L.; Zhu, Y.; Zhou, Z.; Chen, S. Stress Field Distribution and Deformation Law of Large Deformation Tunnel Excavation in Soft Rock Mass. Appl. Sci. 2019, 9, 865. [Google Scholar] [CrossRef] [Green Version]
- Zhu, Y.; Chen, L.; Zhang, H.; Zhou, Z.; Chen, S. Physical and Mechanical Characteristics of Soft Rock Tunnel and the Effect of Excavation on Supporting Structure. Appl. Sci. 2019, 9, 1517. [Google Scholar] [CrossRef] [Green Version]
- Zhang, Z.Q.; Zhang, H.; Tan, Y.J.; Yang, H.Y. Natural wind utilization in the vertical shaft of a super—Long highway tunnel and its energy saving effect. Build. Environ. 2018, 145, 140–152. [Google Scholar] [CrossRef]
- Cai, M.F. Prediction and prevention of rockburst in metal mines–A case study of Sanshandao gold mine. J. Rock Mech. Geotech. Eng. 2015, 8, 204–211. [Google Scholar] [CrossRef]
- Feng, X.T.; Liu, J.B.; Chen, B.R.; Xiao, Y.X.; Feng, G.L.; Zhang, F.P. Monitoring, warning, and control of rockburst in deep metal mines. Engineering 2017, 3, 538–545. [Google Scholar] [CrossRef]
- Zhou, H.; Meng, F.Z.; Zhang, C.Q.; Hu, D.W.; Yang, F.J.; Lu, J.J. Analysis of rockburst mechanisms induced by structural planes in deep tunnels. Bull. Eng. Geol. Environ. 2015, 74, 1435–1451. [Google Scholar] [CrossRef]
- Li, S.J.; Feng, X.T.; Li, Z.H.; Chen, B.R.; Zhang, C.Q.; Zhou, H. In situ monitoring of rockburst nucleation and evolution in the deeply buried tunnels of Jinping II hydropower station. Eng. Geol. 2012, 137–138, 85–96. [Google Scholar] [CrossRef]
- Tang, C.A.; Wang, J.M.; Zhang, J.J. Preliminary engineering application of microseismic monitoring technique to rockburst prediction in tunneling of Jinping II project. J. Rock Mech. Geotech. Eng. 2010, 2, 193–208. [Google Scholar] [CrossRef] [Green Version]
- Zhang, H.; Chen, L.; Chen, S.G.; Sun, J.C.; Yang, J.S. The spatiotemporal distribution law of microseismic events and rockburst characteristics of the deeply buried tunnel group. Energies 2018, 11, 3257. [Google Scholar] [CrossRef] [Green Version]
- Zhang, H.; Zhu, Y.; Chen, L.; Hu, W.; Chen, S. The Prevention and Control Mechanism of Rockburst Hazards and Its Application in the Construction of a Deeply Buried Tunnel. Appl. Sci. 2019, 9, 3629. [Google Scholar] [CrossRef] [Green Version]
- Zhang, Z.Q.; Li, H.Y.; Yang, H.Y.; Wang, B. Failure modes and face instability of shallow tunnels under soft grounds. Int. J. Damage Mech. 2019, 28, 566–589. [Google Scholar] [CrossRef]
- Feng, X.T.; Xiao, Y.X.; Feng, Y.L.; Yao, Z.B.; Chen, B.R.; Yang, C.X. Study on the development process of rockbursts. Chin. J. Rock Mech. Eng. 2019, 38, 649–673. [Google Scholar]
- Blake, W. Rockburst mechanics. Colo. Sch. Mines Q. 1972, 67, 1–64. [Google Scholar]
- Liu, F.; Ma, T.H.; Tang, C.A.; Chen, F. Prediction of rockburst in tunnels at the Jinping II hydropower station using microseismic monitoring technique. Tunn. Undergr. Space Technol. 2018, 81, 480–493. [Google Scholar] [CrossRef]
- Zhang, C.Q.; Feng, X.T.; Zhou, H.; Qiu, S.L.; Wu, W.Q. Case histories of four extremely intense rockbursts in deep tunnels. Rock Mech. Rock Eng. 2012, 45, 275–288. [Google Scholar] [CrossRef]
- Xie, H.P.; Gao, F.; Ju, Y. Research and development of rock mechanics in deep ground engineering. Chin. J. Rock Mech. Eng. 2015, 34, 2161–2178. [Google Scholar]
- Ortlepp, W.D. High Ground Displacement Velocity Associated with Rockburst Damage; A A Balkema: Rotterdam, The Netherlands, 1993; pp. 101–106. [Google Scholar]
- Kaiser, P.K.; Ming, C. Design of rock support system under rockburst condition. J. Rock Mech. Geotech. Eng. 2012, 4, 215–227. [Google Scholar] [CrossRef] [Green Version]
- Zhou, J.; Li, X.B.; Mitri, H.S. Evaluation method of rockburst: State–of–the–art literature review. Tunn. Undergr. Space Technol. 2018, 81, 632–659. [Google Scholar] [CrossRef]
- Feng, G.L.; Feng, X.T.; Chen, B.R.; Xiao, Y.X.; Yu, Y. A microseismic method for dynamic warning of rockburst development processes in tunnels. Rock Mech. Rock Eng. 2015, 48, 2061–2076. [Google Scholar] [CrossRef]
- Hudyma, M.; Potvin, Y.H. An Engineering Approach to Seismic Risk Management in Hardrock Mines. Rock Mech. Rock Eng. 2010, 43, 891–906. [Google Scholar] [CrossRef]
- Cook, N.G.W. The application of seismic techniques to problems in rock mechanics. Int. J Rock Mech. Min. 1964, 9, 169–179. [Google Scholar] [CrossRef]
- Cook, N.G.W.; Hoek, E.; Pretorius, J.P. Rock mechanics applied to study of rockbursts. J. S. Afr. Inst. Min. Metall. 1966, 10, 435–441. [Google Scholar]
- Ortlepp, W.D.; Stacey, T.R. Rockburst mechanisms in tunnels and shafts. Tunn. Undergr. Space Technol. 1994, 9, 59–65. [Google Scholar] [CrossRef]
- Ba, Z.P.; Kazemi, M.T. Determination of fracture energy, process zone longth and brittleness number from size effect, with application to rock and conerete. Int. J. Fract. 1990, 44, 111–131. [Google Scholar]
- Bažant, Z.P.; Jirásek, M. R–curve modeling of rate and size effects in quasibrittle fracture. Int. J. Fract. 1993, 62, 355–373. [Google Scholar]
- Wang, J.A.; Park, H.D. Comprehensive prediction of rockburst based on analysis of strain energy in rocks. Tunn. Undergr. Space Technol. 2001, 16, 49–57. [Google Scholar] [CrossRef]
- Xie, H.P.; Pariseau, W.G. Fractal characteristics and mechanism of rock burst. Chin. J. Rock Mech. Eng. 1993, 10, 28–37. [Google Scholar]
- Bagde, M.N.; Petroš, V. Fatigue properties of intact sandstone samples subjected to dynamic uniaxial cyclical loading. Int. J. Rock Mech. Min. 2005, 42, 237–250. [Google Scholar] [CrossRef]
- Xu, N.W.; Tang, C.A.; Li, L.C.; Zhou, Z.; Sha, C.; Liang, Z.Z.; Yang, J.Y. Microseismic monitoring and stability analysis of the left bank slope in Jinping first stage hydropower station in southwestern China. Int. J. Rock Mech. Min. 2011, 48, 950–963. [Google Scholar] [CrossRef]
- Xu, N.W.; Tang, C.A.; Hong, L.I.; Dai, F.; Ke, M.A.; Shao, J.D.; Wu, J.C. Excavation–induced microseismicity: Microseismic monitoring and numerical simulation. J. Zhejiang Univ Sci. A. 2012, 13, 445–460. [Google Scholar] [CrossRef]
- Ma, K.; Tang, C.A.; Xu, L.W.; Liu, F.; Xu, J.W. Failure precursor of surrounding rock mass around cross tunnel in high–steep rock slope. J. Cent. South Univ. 2013, 20, 207–217. [Google Scholar] [CrossRef]
- Ma, T.H.; Tang, C.A.; Tang, L.X.; Zhang, W.D.; Wang, L. Rockburst characteristics and microseismic monitoring of deep–buried tunnels for Jinping II Hydropower Station. Tunn. Undergr. Space Technol. 2015, 49, 345–368. [Google Scholar] [CrossRef]
- Feng, X.T.; Chen, B.R.; Ming, H.J. Evolution law and mechanism of rockbursts in deep tunnels: Immediate rockburst. Chin. J. Rock Mech. Eng. 2012, 31, 433–444. [Google Scholar]
- Chen, B.R.; Feng, X.T.; Zeng, X.H.; Xiao, Y.X.; Zhang, Z.T. Real–time microseismic monitoring and its characteristic analysis during TBM tunneling in deep–buried tunnel. Chin. J. Rock Mech. Eng. 2011, 30, 275–283. [Google Scholar]
- Zhang, C.Q.; Feng, X.T.; Zhou, H.; Qiu, S.L.; Wu, W.Q. A Top Pilot Tunnel Preconditioning Method for the Prevention of Extremely Intense Rockbursts in Deep Tunnels Excavated by TBMs. Rock Mech. Rock Eng. 2012, 45, 289–309. [Google Scholar] [CrossRef]
- Feng, X.T.; Yu, Y.; Feng, G.L.; Xiao, Y.X.; Chen, B.R.; Jiang, Q. Fractal behaviour of the microseismic energy associated with immediate rockbursts in deep, hard rock tunnels. Tunn. Undergr. Space Technol. 2016, 51, 98–107. [Google Scholar] [CrossRef]
- Feng, G.L.; Feng, X.T.; Chen, B.R.; Xiao, Y.X. Performance and feasibility analysis of two microseismic location methods used in tunnel engineering. Tunn. Undergr. Space Technol. 2017, 63, 183–193. [Google Scholar] [CrossRef]
- Zhang, J.J.; Fu, B.J. Rockburst and its criteria and control. Chin. J. Rock Mech. Eng. 2008, 27, 2034–2042. [Google Scholar]
- Gong, F.Q.; Li, X.B. A distance discariminant analysis method for prediction of possibility and classification of rockburst and its application. Chin. J. Rock Mech. Eng. 2007, 26, 1012–1018. [Google Scholar]
- He, M.; Sousa, L.R.E.; Miranda, T.; Zhu, G. Rockburst laboratory tests database—Application of data mining techniques. Eng. Geol. 2015, 185, 116–130. [Google Scholar] [CrossRef]
- Naji, A.M.; Rehman, H.; Emad, M.Z.; Yoo, H. Impact of Shear Zone on Rockburst in the Deep Neelum–Jehlum Hydropower Tunnel: A Numerical Modeling Approach. Energies 2018, 11, 1935. [Google Scholar] [CrossRef] [Green Version]
- Wang, Z.Y.; Dou, L.M.; Wang, G.F. Mechanism Analysis of Roadway Rockbursts Induced by Dynamic Mining Loading and Its Application. Energies 2018, 11, 2313. [Google Scholar] [CrossRef] [Green Version]
- Ma, K.; Tang, C.A.; Wang, L.X.; Tang, D.H.; Zhuang, D.Y.; Zhang, Q.B.; Zhao, J. Stability analysis of underground oil storage caverns by an integrated numerical and microseismic monitoring approach. Tunn. Undergr. Space Technol. 2016, 54, 81–91. [Google Scholar] [CrossRef] [Green Version]
- Milev, A.M.; Spottiswoode, S.M.; Rorke, A.J.; Finnie, G.J. Seismic monitoring of a simulated rockburst on a wall of an underground tunnel. J. S. Afr. Inst. Min. Metall. 2001, 101, 253–260. [Google Scholar]
- Cook, N.G.W. The basic mechanics of rockbursts. J. S. Afr. Inst. Min. Metall. 1963, 64, 71–81. [Google Scholar]
- Bieniawski, Z.T.; Denkhaus, H.G.; Vogler, U.W. Failure of fractured rock. Int. J. Sci. Geomech. 1969, 6, 323–341. [Google Scholar] [CrossRef]
- Kidybinski, A. Bursting liability indices of coal. Int. J. Rock Mech. Min. 1981, 18, 295–304. [Google Scholar] [CrossRef]
- Xie, H.P.; Peng, R.D.; Ju, Y.; Zhou, H.W. On energy analysis of rock failure. Chin. J. Rock Mech. Eng. 2005, 24, 2603–2608. [Google Scholar]
- Xie, H.P.; Peng, R.D.; Ju, Y. Energy dissipation of rock deformation and fracture. Chin. J. Rock Mech. Eng. 2004, 23, 3565–3570. [Google Scholar]
- You, M.Q.; Hua, A.Z. Energy analysis of rock sample failur. Chin. J. Rock Mech. Eng. 2002, 21, 778–781. [Google Scholar]
- Weng, L.; Huang, L.; Taheri, A.; Li, X. Rockburst characteristics and numerical simulation based on a strain energy density index: A case study of a roadway in Linglong gold mine. Tunn. Undergr. Space Technol. 2017, 69, 223–232. [Google Scholar] [CrossRef]
- Zhang, L.M.; Gao, S.; Ren, M.Y.; Wang, Z.Q.; Ma, S.Q. Rock elastic strain energy and dissipation strain energy evolution characteristics under conventional triaxial compression. Chin. J. Coal Soc. 2014, 39, 1238–1242. [Google Scholar]
- Zhu, Z.Q.; Sheng, Q.; Xiao, P.W.; Liu, J.G. Analysis of energy dissipation in process of unloading confining pressure failure of rocks. Chin. J. Rock Mech. Eng. 2011, 30, 2675–2681. [Google Scholar]
- Tang, L.Z.; Wang, W.X. A new rock burst tendency index. Chin. J. Rock Mech. Eng. 2002, 21, 874–878. [Google Scholar]
- Barton, N.; Lien, R.; Lunde, J. Engineering classification of rock masses for the design of tunnel support. Rock Mech. 1974, 6, 189–236. [Google Scholar] [CrossRef]
- Cai, W.; Dou, L.M.; Zhang, M.; Cao, W.Z.; Shi, J.Q.; Feng, L.F. A fuzzy comprehensive evaluation methodology for rock burst forecasting using microseismic monitoring. Tunn. Undergr. Space Technol. 2018, 80, 232–245. [Google Scholar] [CrossRef]
- Xu, J.; Jiang, J.D.; Xu, N.; Liu, Q.S.; Gao, Y.F. A new energy index for evaluating the tendency of rockburst and its engineering application. Eng. Geol. 2017, 230, 46–54. [Google Scholar] [CrossRef]
- Manouchehrian, A.; Cai, M. Numerical modeling of rockburst near fault zones in deep tunnels. Tunn. Undergr. Space Technol. 2018, 80, 164–180. [Google Scholar] [CrossRef]
- Dowding, C.H.; Andersson, C.A. Potential for rock bursting and slabbing in deep caverns. Eng. Geol. 1986, 22, 265–279. [Google Scholar] [CrossRef]
- Chen, W.Z.; Lv, S.P.; Guo, X.H.; Qiao, C.J. Research on unloading confining pressure tests and rockburst criterion based on energy theory. Chin. J. Rock Mech. Eng. 2009, 28, 1530–1540. [Google Scholar]
- Xie, H.P.; Ju, Y.; Li, L.Y. Criteria for strength and structural failure of rocks based on energy dissipation and energy release principles. Chin. J. Rock Mech. Eng. 2005, 24, 3003–3010. [Google Scholar]
- Fan, Y.; Lu, W.B.; Yan, P. Mechanism of strain energy adjustment of surrounding rock during excavation of underground caverns. Rock Soil Mech. 2013, 34, 3580–3586. [Google Scholar]
- Cook, N.G.W. The design of underground excavations. In Proceedings of the Eighth Rock Mechanics Symposium, Minneapolis, MN, USA, 15–17 September 1966; Volume 8, p. 27. [Google Scholar]
- Chen, X.; Sun, J.Z.; Zhang, J.K.; Chen, Q.S. Judgment indexes and classification criteria of rockburst with the extension judgment method. China Civ. Eng. J. 2009, 42, 82–88. [Google Scholar]
- Wang, Y.H.; Li, W.D.; Li, Q.G.; Xu, Y.; Tan, G.H. Fuzzy comprehensive evaluation method for rock burst prediction. Chin. J. Rock Mech. Eng. 1998, 17, 493–501. [Google Scholar]
Figure 1.
Schematic sketch of rockburst.

Figure 2.
Analysis model of tunnel excavation.

Figure 3.
Stress field excited by transient unloading (r = R).

Figure 4.
Process of change in the energy storage density limit at transient unloading on the tunnel wall (r = R).
Figure 4.
Process of change in the energy storage density limit at transient unloading on the tunnel wall (r = R).

Figure 5.
Topographic and geomorphological sketch of the study area.

Figure 6.
Regional structure of Daxiangling Tunnel.

Figure 7.
Three-dimensional geological model figure and in-situ geo-stress test points, SZK2, SZK3, and SZK4.
Figure 7.
Three-dimensional geological model figure and in-situ geo-stress test points, SZK2, SZK3, and SZK4.

Figure 8.
Geo-stress values of SKZ 2, SKZ 3, SKZ 4 varying with depth: (a) SZK2; (b) SZK3; (c) SZK4.
Figure 8.
Geo-stress values of SKZ 2, SKZ 3, SKZ 4 varying with depth: (a) SZK2; (b) SZK3; (c) SZK4.

Figure 9.
Three-dimensional model of back analysis of in-situ geo-stress of Daxiangling Tunnel.

Figure 10.
The in-situ tests of tunnel wall stress at rockburst: (a) resistivity test; (b) the test point; (c) grinding; (d) tool bit changing; (e) cleaning; (f) marking; (g) blow drying; (h) strain gauge pasting; (i) strain gauge connecting; (j)initial strain testing; (k) drilling; (l) strain testing.

Figure 11.
The energy density curves of different grid sizes.

Figure 12.
Three-dimensional model.

Figure 13.
Boundary conditions of three-dimensional meshed model: (a) X and Z boundary conditions; (b) Y and Z boundary conditions.
Figure 13.
Boundary conditions of three-dimensional meshed model: (a) X and Z boundary conditions; (b) Y and Z boundary conditions.

Figure 14.
Energy density distribution of surrounding rock: (a) energy density distribution of SZK2 surrounding rock; (b) energy density distribution of SZK3 surrounding rock; (c) energy density distribution of SZK4 surrounding rock; (d) energy density distribution of SZK4D surrounding rock.
Figure 14.
Energy density distribution of surrounding rock: (a) energy density distribution of SZK2 surrounding rock; (b) energy density distribution of SZK3 surrounding rock; (c) energy density distribution of SZK4 surrounding rock; (d) energy density distribution of SZK4D surrounding rock.

Figure 15.
Distribution location of the element in which energy density is more than 40 kJ/m3: (a) SZK3; (b) SZK4.
Figure 15.
Distribution location of the element in which energy density is more than 40 kJ/m3: (a) SZK3; (b) SZK4.

Figure 16.
Rockburst at a mileage of K57 + 965: (a) rockburst at the spandrel, (b) rockburst at the tunnel face.
Figure 16.
Rockburst at a mileage of K57 + 965: (a) rockburst at the spandrel, (b) rockburst at the tunnel face.

Figure 17.
Distribution location of element: (a) the numerical simulation model, (b) distribution location of the element in which energy density is more than 40 kJ/m3.
Figure 17.
Distribution location of element: (a) the numerical simulation model, (b) distribution location of the element in which energy density is more than 40 kJ/m3.

Figure 18.
Curve of energy density on the outer side of the side wall varying with the distance.

Figure 19.
Curve of energy density in front of the working face varying with the distance.

Figure 20.
Histogram of energy release rates in each case.

Figure 21.
Curve of energy release rate varying with the length of excavation footage.

Figure 22.
Curve of energy release rate varying with the length of excavation footage.


Table 1.
Physical and mechanical properties of rock mass.
| Type of Rock Mass | Deformation Modulus (Pa) | Poisson Ratio | Bulk Density (kN/m3) |
|---|---|---|---|
| Strong structural damage zone (Rhyolite) | 0.5 × 10¹⁰ | 0.32 | 23 |
| Secondary strong structural damage zone (Andesite) | 1.8 × 10¹⁰ | 0.28 | 25 |
| Weak structural damage zone (Rhyolite) | 2 × 10¹⁰ | 0.25 | 25 |
| Strong structural damage zone, (Rhyolite ignimbrite) | 0.6 × 10¹⁰ | 0.3 | 23 |
| FX4 fault | 0.16 × 10¹⁰ | 0.39 | 19 |
| F5 fault | 0.18 × 10¹⁰ | 0.37 | 19.5 |
| FW4 fault | 0.2 × 10¹⁰ | 0.35 | 20 |
| F6-1 fault | 0.19 × 10¹⁰ | 0.36 | 20 |
Table 2.
Stress on tunnel wall derived from back analysis of in-situ geo-stress.
| Borehole No. | SZK2 | SZK3 | SZK4 |
|---|---|---|---|
| Primary principal stress σ1 on tunnel wall (r = R), (MPa) | 50.338 | 50.215 | 60.721 |
| Secondary principal stress σ2 on tunnel wall (r = R), (MPa) | 46.261 | 45.325 | 40.215 |
| Tertiary principal stress σ3 on tunnel wall (r = R), (MPa) | 35.397 | 32.368 | 30.325 |
| Poisson ratio ν | 0.13 | 0.14 | 0.16 |
| Elastic modulus E (GPa) | 57.85 | 53.31 | 61.21 |
| In-situ strain energy density U0 (kJ/m3) | 53.677 | 54.888 | 52.461 |
| Minimum energy storage density limit Umix (kJ/m3) | 40.927 | 41.876 | 40.025 |
Table 3.
Stress on tunnel wall derived from the field measurement.
| Position | K57 + 965 |
|---|---|
| σ1 on tunnel wall, (MPa) | 61.362 |
| σ2 on tunnel wall, (MPa) | 38.526 |
| σ3 on tunnel wall, (MPa) | 32.178 |
| Poisson ratio ν | 0.18 |
| Elastic modulus E (GPa) | 60.56 |
| In-situ strain energy density U0 (kJ/m3) | 53.62 |
| Minimum energy storage density limit Umix (kJ/m3) | 40.88 |
Table 4.
Physical and mechanical indicators of surrounding rock of each borehole.
| Borehole No. | SZK2 | SZK3 | SZK4 | SZK4D |
|---|---|---|---|---|
| Natural density γ (g/cm3) | 2.80 | 2.78 | 2.67 | 2.67 |
| Compressive strength σc (MPa) | 66.87 | 75.19 | 120.46 | 120.46 |
| Tensile strength σt (MPa) | 5.10 | 8.50 | 8.70 | 8.70 |
| Elastic modulus E (GPa) | 57.85 | 53.31 | 61.21 | 61.21 |
| Poisson ratio ν | 0.13 | 0.14 | 0.16 | 0.16 |
| Internal friction angle φ (°) | 47.50 | 46.70 | 43.56 | 43.56 |
| Cohesion ϲ (MPa) | 1.59 | 2.68 | 0.88 | 0.88 |
| Borehole depth H (m) | 450 | 1340 | 1388 | 70 |
Table 5.
Maximum values of energy density in each case.
| Case | SZK2 | SZK3 | SZK4 | SZK4D |
|---|---|---|---|---|
| Maximum value (kJ/m3) | 12.84 | 44.00 | 44.75 | 0.44 |
| Location | Side wall | Side wall and working face | Side wall and working face | Wall corner |
Table 6.
Energy change and energy release rate of the model in each case.
| Item | SZK2 | SZK3 | SZK4 | SZK4D |
|---|---|---|---|---|
| Model energy in the initial state (kJ) | 2.38 × 10⁶ | 9.77 × 10⁶ | 9.11 × 10⁶ | 2.67 × 10⁴ |
| Model energy after excavation (kJ) | 2.32 × 10⁶ | 9.79 × 10⁶ | 9.20 × 10⁶ | 2.66 × 10⁴ |
| Model energy of gravity work (kJ) | 2.57 × 10³ | 1.58 × 10⁴ | 3.61 × 10⁴ | 1.79 × 10² |
| Model energy of boundary work (kJ) | 1.92 × 10⁴ | 4.00 × 10⁵ | 1.00 × 10⁶ | 9.97 × 10 |
| Dissipated energy (kJ) 1 | 8.28 × 10⁴ | 3.91 × 10⁵ | 9.41 × 10⁵ | 3.11 × 10⁴ |
| Excavation volume (m3) | 2.44 × 10⁶ | 2.44 × 10³ | 2.44 × 10⁶ | 2.44 × 10⁶ |
| Energy release rate (kJ/m3) | 31.00 | 161.05 | 386.35 | 0.13 |
1 Note: Dissipated energy = energy in the initial state + gravity work + boundary work—energy after excavation.
Table 7.
Maximum values of the energy density of the model in each case.
| Case | Release 0% of the Load | Release 50% of the Load | Release 100% of the Load | No Support |
|---|---|---|---|---|
| Maximum value of energy density | 40.1 kJ/m3 | 38.6 kJ/m3 | 39.9 kJ/m3 | 44.1 kJ/m3 |
Table 8.
The energy conversion and release in each case.
| Item | Release 0% of the Load | Release 50% of the Load | Release 100% of the Load | No Support |
|---|---|---|---|---|
| Model energy in the initial state (kJ) | 9.11 × 10⁶ | 9.11 × 10⁶ | 9.11 × 10⁶ | 9.11 × 10⁶ |
| Model energy after excavation (kJ) | 9.14 × 10⁶ | 9.14 × 10⁶ | 9.14 × 10⁶ | 9.20 × 10⁶ |
| Model energy of gravity work (kJ) | 1.75 × 10⁴ | 1.76 × 10⁴ | 1.98 × 10⁴ | 3.51 × 10⁴ |
| Model energy of boundary work (kJ) | 4.87 × 10⁵ | 4.90 × 10⁵ | 5.52 × 10⁵ | 9.73 × 10⁵ |
| Dissipated energy (kJ) 1 | 4.72 × 10⁵ | 4.77 × 10⁵ | 5.40 × 10⁵ | 9.16 × 10⁵ |
| Excavation volume (m3) | 2.44 × 10³ | 2.44 × 10³ | 2.44 × 10³ | 2.44 × 10³ |
| Energy release rate (kJ/m3) | 193.66 | 195.60 | 221.38 | 375.82 |
1 Note: Dissipated energy = energy in the initial state + gravity work + boundary work—energy after excavation.
Table 9.
The energy conversion and dissipation in various cases.
| Item | 1 m | 2 m | 3 m | 4 m | 5 m | 6 m | 10 m | 15 m |
|---|---|---|---|---|---|---|---|---|
| Energy in the initial state (kJ) | 9.11 × 10⁶ | 9.11 × 10⁶ | 9.11 × 10⁶ | 9.11 × 10⁶ | 9.11 × 10⁶ | 9.11 × 10⁶ | 9.11 × 10⁶ | 9.11 × 10⁶ |
| Energy after excavation (kJ) | 9.20 × 10⁶ | 9.20 × 10⁶ | 9.20 × 10⁶ | 9.19 × 10⁶ | 9.20 × 10⁶ | 9.19 × 10⁶ | 9.20 × 10⁶ | 9.21 × 10⁶ |
| Energy of gravity work (kJ) | 3.50 × 10⁴ | 3.49 × 10⁴ | 3.51 × 10⁴ | 3.50 × 10⁴ | 3.61 × 10⁴ | 3.58 × 10⁴ | 3.84 × 10⁴ | 4.26 × 10⁴ |
| Energy of boundary work (kJ) | 9.72 × 10⁵ | 9.67 × 10⁵ | 9.73 × 10⁵ | 9.72 × 10⁵ | 1.00 × 10⁶ | 9.95 × 10⁵ | 1.06 × 10⁶ | 1.18 × 10⁶ |
| Dissipated energy (kJ) | 9.14 × 10⁵ | 9.10 × 10⁵ | 9.16 × 10⁵ | 9.19 × 10⁵ | 9.41 × 10⁵ | 9.45 × 10⁵ | 1.01 × 10⁶ | 1.12 × 10⁶ |
| Excavation volume (m3) | 2.44 × 10³ | 2.44 × 10³ | 2.44 × 10³ | 2.44 × 10³ | 2.44 × 10³ | 2.44 × 10³ | 2.44 × 10³ | 2.44 × 10³ |
| Energy release rate (kJ/m3) | 375.07 | 373.07 | 375.82 | 376.78 | 386.15 | 387.29 | 413.53 | 460.09 |
© 2020 by the authors. Licensee MDPI, Basel, Switzerland. This article is an open access article distributed under the terms and conditions of the Creative Commons Attribution (CC BY) license (http://creativecommons.org/licenses/by/4.0/).
Share and Cite
MDPI and ACS Style
Zhang, Z.; Luo, C.; Zhang, H.; Gong, R. Rockburst Identification Method Based on Energy Storage Limit of Surrounding Rock. Energies 2020, 13, 343. https://doi.org/10.3390/en13020343
AMA Style
Zhang Z, Luo C, Zhang H, Gong R. Rockburst Identification Method Based on Energy Storage Limit of Surrounding Rock. Energies. 2020; 13(2):343. https://doi.org/10.3390/en13020343
Chicago/Turabian StyleZhang, Zhiqiang, Chun Luo, Heng Zhang, and Ruikai Gong. 2020. "Rockburst Identification Method Based on Energy Storage Limit of Surrounding Rock" Energies 13, no. 2: 343. https://doi.org/10.3390/en13020343
Note that from the first issue of 2016, this journal uses article numbers instead of page numbers. See further details here.