Evaluation of the Water–Energy–Land Nexus (WELN) Using Exergy-Based Indicators: The Chilean Electricity System Case


1
Faculty of Engineering, University of Concepción, Concepción 4030000, Chile
2
Environmental Engineering Department, Faculty of Environmental Sciences-EULA Center, University of Concepción, Concepción 4030000, Chile
*
Author to whom correspondence should be addressed.
Energies 2020, 13(1), 42; https://doi.org/10.3390/en13010042
Submission received: 25 November 2019
/
Revised: 13 December 2019
/
Accepted: 16 December 2019
/
Published: 19 December 2019
(This article belongs to the Section B: Energy and Environment)
Abstract
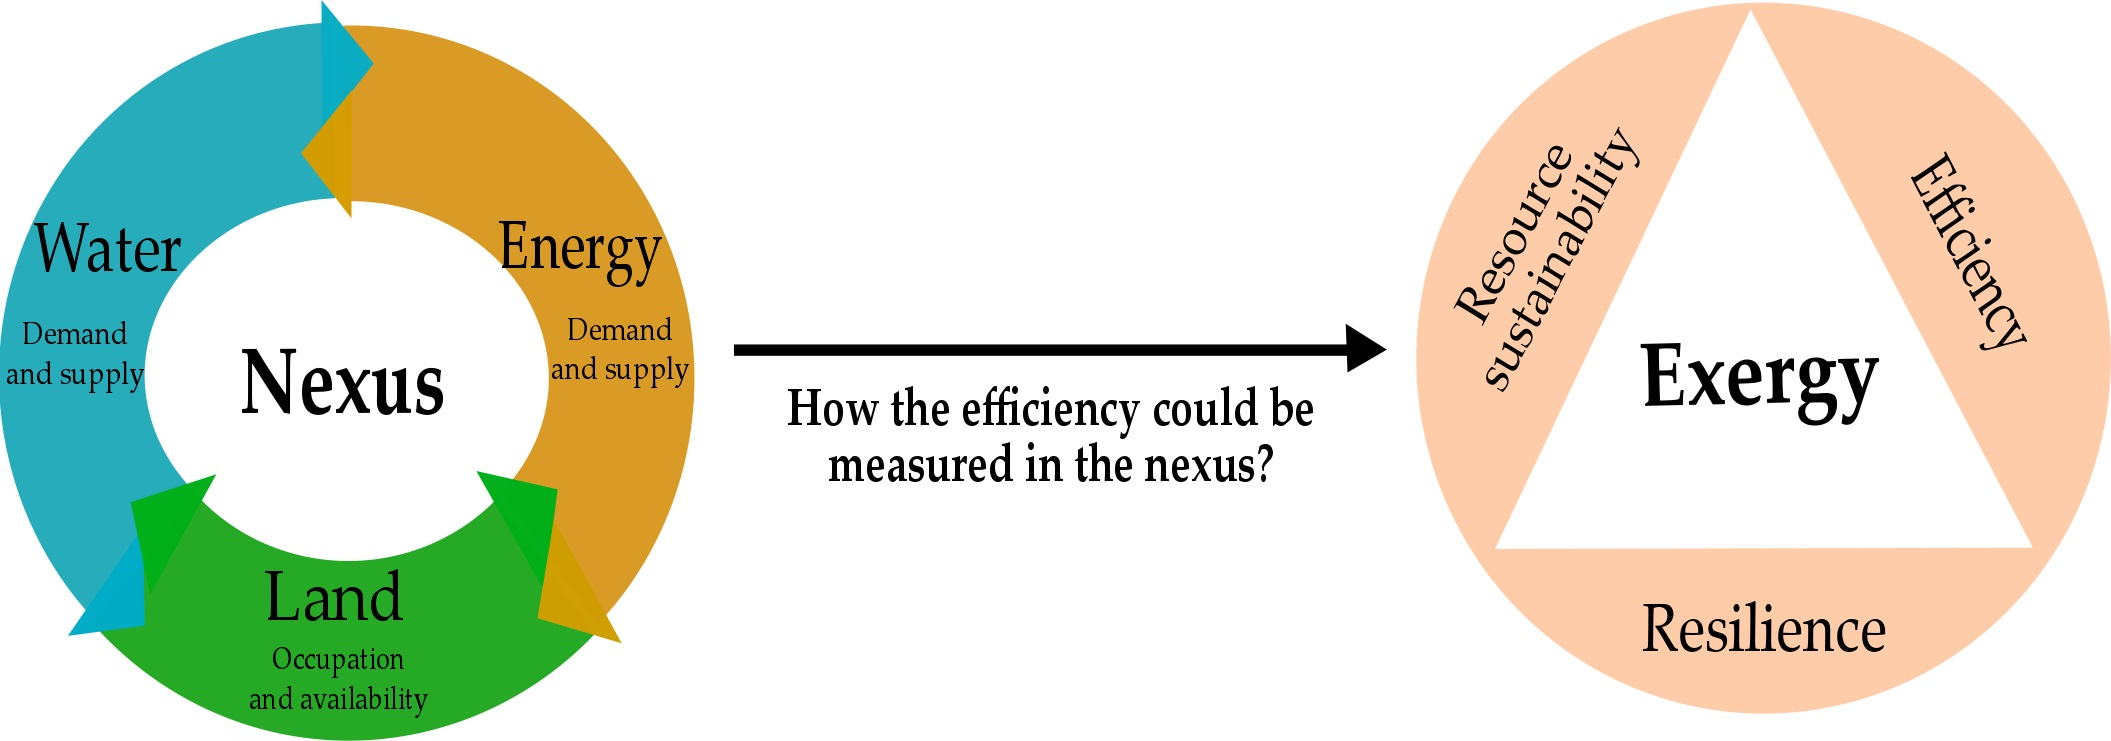
:The competition and interlinkages between energy, water, and land resources are increasing globally and are exacerbated by climate change and a rapid increase in the world population. The nexus concept has emerged for a comprehensive understanding related to the management and efficiency of resource use. This paper assesses water–energy–land nexus (WELN) efficiency through integration of the principles of Life Cycle Assessment (LCA) and exergy analysis, using the Chilean energy sector (CES) as a study case. The cumulative exergy consumption (CExC) and cumulative degree of perfection (CDP) are used as indicators for WELN efficiency. The results show the production of 1 MWh of electricity required 17.3 GJex, with the energy component of WELN (fossil and renewable energy sources) being the main contributor (99%). Furthermore, the renewable energy technologies depicted higher CDP of the water–energy–land nexus due to lower CExC and higher technology efficiency concerning non-renewables. The water and land resources contributed slightly to total exergy flow due to low quality in comparison with the energy component. Nevertheless, water availability and competition for land occupation constitute important issues for reducing environmental pressures and local conflicts. This study demonstrated the feasibility of exergy analysis for the evaluation of WELN efficiency through a single indicator, which could facilitate the comparison and integration with different processes and multi-scales.

1. Introduction
The faster growth of world population, urbanization and anthropogenic activities contributes to increasing the demand and pressure for natural resources, especially on energy, water, and land [1].
Nowadays, the interdependence of energy, water and land demand requires a new methodological framework for a better understanding of interactions between resources [1]. In this context, the nexus thinking has emerged as a holistic and comprehensive framework, allowing an improvement of resource use efficiency [2] and avoiding future pressures on natural resources [3]. The majority of nexus studies have been focused on the water production and treatment systems (wastewater and drinking water treatment processes) [4]. Other studies have been extended the scope of energy-water nexus, including the interactions with agriculture and food security [5].
In recent years, analyzing issues associated with the water–energy–land nexus (WELN) of anthropogenic systems has increasingly gained interest by both scientists and government decision makers [6,7,8]. The inclusion of land on the water and energy nexus is justified by its relevant interactions with other productive sectors, which cannot be ignored [3]. Although the WELN have been analyzed in literature, the land resources interaction with water and energy still needs to be studied further.
The nexus concept is an systematic approach for improvement of resource management, which can reach high degrees of complexity depending on scales and processes [9]. Consequently, different qualitative and quantitative methods for conceptualizing the relationship between natural resources have been proposed. Ringler et al. [10] developed a comprehensive qualitative framework for assessing the water, energy, land and food nexus (WELF), highlighting the relevance of land in the nexus. Nevertheless, the authors did not provide methods for the WELN-nexus evaluation. Siciliano et al. [11] have recently reported on the effect of large scale farm investment in the European Union on the water–energy–land–food (WELF) nexus, using indicators related to resource availability, scarcity and access. Although the authors describe several interlinkages between the resources, the quantitative evaluation of the nexus is not clearly highlighted. Karabulut et al. [12] studied the ecosystem–water–food–land–energy (WFLE) nexus by considering the ecosystem as the main issue within this nexus. The authors highlightsthe relationship between interventions and environmental impacts. In this case, the nexus evaluation is qualitative, and the matrix proposed can be adapted to different scales to investigate the trade-offs, synergies and antagonisms.
Different approaches have been used to quantitatively evaluate the WELN. Silalertruska and Gheewala [13] carried out the evaluation of the WELN of sugarcane production in Thailand, using water scarcity, carbon and ecological footprint. The authors conclude that the combined use of these footprint indicators can give a quantitative and comprehensive picture of the WELN of agriculture. Moreover, Saif and Almansoori [14] presented a discrete optimization model for the Climate, Land, Energy and Water (CLEW) nexus interactions using Mauritius Island as case study. In this study, the mathematical model was applied and used as support in strategic decisions related to energy, water and land systems. Ibrahim et al. [3] evaluated the efficiency of OECD countries in terms of a Water–Energy–Land–Food (WELF) nexus. An input–output analysis was built at a European level, providing a framework for policy making. Similar analysis was reported by Guan et al. [1], who studied the main drivers and relationships of WELN in the all Chinese economy supply chain. Results show that agriculture and light industry are critical sectors for water consumption and land occupation; meanwhile, the heavy industry and construction present the highest energy requirements.
From the sustainability energy system point of view, several authors have highlighted that an improvement of energy technology can reduce the trade-offs across the three WELN dimensions [15,16]. Furthermore, it is recognized that to ensure the sustainable use of natural resources within the nexus, the integration of life cycle thinking for preventing the different environmental pressures and impacts on resources during the whole life cycle should be addressed [12]. In this sense, very few studies have integrated the life cycle thinking within the nexus framework [17,18].
Most of these studies have a relatively limited scope and focus on the water and energy nexus assessing at sector-based scale, specifically the effect on agriculture. In addition, the reported studies cover different scales and include the development of many tools, indicators and metrics.
Recently, Dai et al. [19] reported a comprehensive review related to the diversity of methods, tools and frameworks used to evaluate the interactions between several resources (water, energy, food, land, etc.) in the nexus context. Nevertheless, the diversity of metrics limits the comparative experiences and replicability in different contexts and also does not consider the efficiency of resources uses into the nexus [20,21]. In this sense, the exergy analysis could play an essential role in the evaluation of the nexus, based on their efficiency [22,23,24]. Exergy analysis has emerged as a robust methodology for the assessment of natural resources sustainability [25,26,27,28]. Also, exergy is a measure of transformation quality of virgin resources used in any technology through cumulative exergy consumption (CExC) and cumulative degree of perfection (CDP) in the Life Cycle Assesment (LCA) methodology [26,29]. Therefore, a cumulative exergy approach provides a unified way to assess the consumption of resources with a solid scientific basis and offers a clear vision of the degradation of the natural capital involved through a chain of production. Thus, it could be a useful methodologic approach for a holistic assessment of WELN.
The WELN is strongly dependent on economic structures, technology levels and policy related to resource management. Therefore, the analysis of WELN considering the local circumstances and natural resources efficiency is necessary for supporting the policy-making towards the sustainable use of multiple resources. To the best of our knowledge, the evaluation of nexus lacks a proper method for evaluating WELN efficiency based on exergy principles, allowing a better understanding of how the local resources can be efficiently managed at different scales (process, sector, basin, country).
Therefore, the main objective of this study is to develop a method to assess WELN efficiency, integrating the principles of the Life Cycle Assessment (LCA) and exergy analysis using the Chilean Electric System (CES) as a case study. The exergetic life cycle assessment (ELCA) is used to quantify the indirect exergy inputs associated mainly to water, energy and land resources during the whole fuel life cycle, constituting the basis for the assessment of the efficiency of resources use. The cumulative exergy consumption (CExC) is quantified for evaluating of 1 MWh of electricity during its life cycle. This indicator breaks down into the water, energy and land components. Also, the WELN nexus efficiency is evaluated using the cumulative degree of perfection (CDP), which is heavily dependent on CExC and technology efficiency. The analysis performed constitutes the first approach for quantifying the efficiency of the water–energy–land nexus, which could be an important support for decisio-makers in order to establish policies related to the multiple resources uses sustainability in the territorial planning.
2. Materials and Methods
2.1. System Boundaries and Functional Unit
The Chilean Electric System (CES) was selected as a case study, taking 2017 as the reference year. The CES power plant network covers the Northern and South Central parts of Chile, extending 3100 km from the Arica-Parinacota region to Chiloé archipelago. The CES provides 99.3% of the electricity generation capacity (~25 GW) of the country, supplying nearly 98.5% of the Chilean domestic electricity demand. The remaining electricity demand (0.7%) is fulfilled by two small grids (Aysen system, Magallanes system) located in the extreme south of Chile, which are not considered in the present study. For 2017, the CES generated approximately 74,304 GWh of electricity, of which 57% came from fossil fuels such as coal, LNG, natural gas and oil products. The rest of the electricity generated (43%) came from renewable energies, such as hydro, solar, wind and biomass [30]. The electricity generation at CES (year 2017) is shown in Table 1, as a function of energy sources.
In this study, the water–energy–land nexus is assessed by integrating the principles of the Life Cycle Assessment (LCA) and exergy analysis. In our case, the functional unit and system boundaries were defined based on the framework of LCA. The exergetic life cycle assessment (ELCA) is used to quantify the indirect exergy inputs associated mainly to water, energy and land resources during the whole fuel life cycle.
The water–energy–land nexus for CES was evaluated using the cradle-to-gate system boundary approach. In this case, the extraction, processing and transport of fossil fuels, as well as the electricity generation at the CES system gate, were considered. The stages related to the technologies manufacturing and the electricity transmission system was not considered in the present study. The non-renewable technology manufacturing was excluded due to negligible impacts of resources concerning to operational phase [31,32]. In contrast, the manufacturing of renewable technologies is significant in resource consumptions [33], which heavily relies on the materials origin, energy used for the infrastructure and technological characteristics [31]. However, due to the lack of information for materials origin and technologies, the renewable technologies manufacturing was excluded from the present analysis. Furthermore, there are no data available for the transmission system, specifically for accounting the land resources; thus, the same assumptions as Lechón et al. [16] were considered to exclude this item from the analysis.
The processes were classified into two subsystems, the background and the foreground, respectively. The background system included the freshwater (WI), energy (EI) and land (LI) consumed and used indirectly for the production of fossil fuels life cycle (extraction, processing and transport), which are fed to CES. The foreground system considered the water (WD), energy (ED) and land (LD) consumed and used directly by CES, as well as the indirect inputs coming from the background system. The functional unit (Fu) was chosen as 1 MWh of electricity to the gate of the electricity system. The cradle-to-gate system boundaries for electricity generation provided by CES are shown in Figure 1.
2.2. Material Exergy Fluxes
The freshwater, energy and land demanded and used in the system are accounted for exergy (GJex). Exergy is defined as the maximum work that can be delivered by the component of the system in relation to the reference environment. The reference state is defined by a temperature of To = 298.15 K, pressure P = 1.01 bar, and the atmosphere composition [34].
In this study, the exergy of the material fluxes (freshwater and fuels) are estimated as the sum of physical (Exph), chemical (Exch), kinetic (Exk) and potential (Exp) components, and the balance can be written as [34]:
The electrical exergy is considered equal to its the energy content [34,35]. In the case of thermal power plants, the chemical exergy of direct and indirect inputs of freshwater and fuels (diesel, coal, natural gas, petcoke and fuel oil) are only considered, since the physical, kinetic and potential interactions concerning the reference environment are negligible. The chemical exergy component of fuels and freshwater was estimated following Equation (2) [34].
where Exch represents the chemical exergy content of i material (freshwater and fuels) in terms of GJex. The (GJex/t) and (t/yr) are the standard chemical exergy and the resource consumptions, respectively. The standard chemical exergy of fuels (except coal) and freshwater are gathered from Szagurt [34] and are listed in Table 2.
The standard chemical exergy of coal was calculated by multiplying the lower heating value (LHV) by the exergy factor β. The β-value is the exergy-to-energy ratio and depends on the atomic composition of the fuel [34].
Here, Zi is the mass fraction of each i-th component involved in coal characterization (ultimate analysis), and the LHV corresponds to coal lower heating value. The coal used in CES is characterized by 73.7% of carbón, 8.7% of oxygen, 5% of hydrogen and 1.3% of nitrogen and the LHV of 28,700 MJ/t [36].
For renewable technologies (hydraulic turbines, wind turbines and solar photovoltaic panels), the kinetic, potential and physical exergies are calculated. The primary expression used for each technology is described below.
The kinetic exergy () component was considered for wind turbines, which is estimated according to [37]:
where Exk is the kinetic exergy in terms of GJex. (kg/s) and v (m/s) correspond to mass and speed flows of air. The term t is the time referred to a yearly base. The parameter is determined based on technical parameters that characterized the technology (surface area, density and stream speed).
The potential exergy (GJex) is also quantified for hydraulic turbines, and it is calculated by Equation (6):
where represents the mass flow, g gravitational acceleration (9.8 m/s2), t is operation time of the process, h the difference in levels in hydropower plants. The level differences were based on the operational characteristics of each hydropower plant. For run-of-river hydroelectric, the h was assumed 4–1100 m. In the case of reservoir hydroelectric, values were between 50–545 m. The annual average streamflow was taken for each hydropower plant design, which was obtained as a result of the flow duration curve method [38,39]. Specifically for hydroelectricity, with installed power below 100 MW, the daily streamflow was measured over 30 years; meanwhile, the time resolution of 50 years was considered for installed power above 100 MW. For each specific hydropower plant involved in CES, the hydropower energy potential, net water head and streamflow were taken from primary data available in National Environmental Declaration System [40].
The photovoltaic panels only involved the physical exergy component, which is calculated according to the Equation (7) [41]:
where is the physical exergy (GJex). The (W/m) and (K) are the average annual solar radiation and environmental temperature, respectively. The Rs and Tenv were based on regional climate variables as a function of actual power plant localization, which was taken from Santana et al. [42]. The represents the sun temperature (5778 K), t is operation time in a year, and a is the panel area. For all solar photovoltaic panels, the area was taken as 1.7 m2 [42].
2.3. Exergy Component of Land Resource
The land occupation associated with background and foreground systems in terms of exergy units (GJex) was quantified, as depicted in Equation (8). This method was proposed by Taelman et al. [43] and based on landcover class and the land surface occupied by technologies. The authors provided a spatial differentiation of the characterization factor (net primary productivity (NPP)), expressed in exergy terms (MJex/m2.year) for 40 land use types (e.g., urban land, grasslands-high livestock density, forest-with agriculture activities, agriculture, et al.) at the continent, country and region levels, including Chile.
The indicator proposed by Taelman et al. [43] was based on the integration of potentialities of NPP and exergy analysis as a proxy indicator of the ecosystem functioning. The NPP is commonly used for representing the resilience and functionalities of ecosystems, the buffering capacity and absorption ability of wastes and emissions [43], as well as the supply of products and services to humans [44,45]. Besides, exergy is a thermodynamic models which has emerged as an indicator for accounting the natural resources efficiency. Exergy reflects the physical and chemical potential and usefulness of resources (matter and energy), but also providing a more holistic characterization of any system involving matter transformations such as theecosystems [46,47].
The NPP-based exergy constitutes a measure of intensity and the efficiency at which each hectare of land is used [43,48,49,50]. The exergy component of land resource can be estimated according to Equation (8):
where (GJex/m2.year) represents the characterization factor reported by Taelman et al. [43], who provided the land-based exergy indicators by countries and land use types, and (m2) the land surface occupation. The land occupation factors for each technology are specified in Section 2.3. The characterization factors (GJex/m2.year) values for land occupation associated with the foreground system (direct land input) were chosen as urban/industrial land use (0.003 GJex/m2 year) specified for Chile. Meanwhile, for the indirect land use related to the background system, specifically for non-renewable energy, the land use characterization factor was assumed in a function of origin fuels, considering that oil and natural gas came from the United States (0.011 GJex/m2 year), as well as the coal from Colombia (0.012 GJex/m2 year).
2.4. Exergetic Index
The water–energy–land nexus assessment was carried out using two exergy-based indicators, such as cumulative exergy consumption (CExC) and cumulative degree of perfection (CDP) [35,51]. The CExC and CDP were defined for each type of resource and energetic technology.
The life cycle exergy demand for the production of 1 MWh (Fu) of electricity coming from CES, the CExC (GJex/MWh), is defined as the sum of exergy content of all resources required to provide it, considering the extraction, processing and transport stages. This study is focused on direct and indirect exergy inputs of freshwater, energy and land resources. Equation (9) was taken from Dincer and Cengel [52] and specified in Equation (7):
where (GJex), (GJex), (GJex) are the exergetic contents of energy, freshwater and land. The subscripts i and j refer to indirect and direct inputs (freshwater, energy and land use). The k represents the technology type.
The CDP (%) represents the life cycle exergy efficiency of the whole electricity system (Equation (10)) [34,51]. It is defined as the ratio between the electricity produced (Exel = 1 MWh) and the exergy content CExC (GJex/MWh) of all resources consumed, directly and indirectly, making emphasis on freshwater, energy and land resources.
2.5. Data Sources
Primary data related with the foreground system (CES) was gathered on-site, coming from 527 power plants existing in the country and complemented with bibliographic sources. The primary data corresponds to energy efficiency, fossil fuel consumption and electricity generation for each technology available in CNE [30].
The freshwater consumptions used in thermal power plants for cooling systems were completed using factors reported by OECD-IEA [53]. The thermal power plants that consumed sea water for cooling were not considered in the nexus interactions. For that reason, only 31 combined cycle power plants of the total (225) were included for the accounting of freshwater demand, which represents 16% of total electricity generated by CES. The direct freshwater consumption factors were based on cooling systems (7 m3/MWh for the wet tower and 5 m3/MWh for once-through cooling), independently of fuel types [53].
The land occupation for renewable energy technologies (solar photovoltaic panels, wind turbines and biomass-thermal power plant) was obtained from Santana et al. [42]. In the case of hydro and thermal power plants (coal, diesel, natural gas), the land surface occupation was estimated based on the actual location using satellite imagen provided by google earth. In the present study, the land occupation was differentiated by reservoir and run-of-river hydropower plants. Specifically for run-of-river hydro, the land occupation factor was assumed the same for all hydropower plants due to the lack of information, which was gathered from Santana et al. [42]. The factor value was 257 m2 per installed capacity (MW). In the case of the reservoir, the land occupation factor was considered as an average value estimated for all hydropower plants involved in CES, which varies from 3121 and 4173 m2/MW. The average land occupation factor (3824 m2/MW) was estimated as a relationship of surface area occupied by each reservoir and its respectively installed power. The specific freshwater consumptions and land occupation by each technology are gathered from OECD-IEA [53] and Santana et al. [42].
The secondary data of the background system were taken from the Ecoinvent v2.1 database [54]. This database involves a set of input and output data information on specific processes, and it is typically used for the background data where the information is not available. Furthermore, Ecoinvent is recognized and accepted as leading life cycle inventory database due to its consistency and transparency of the data. The energy and water consumption, as well as land occupation, for the production of fossil fuels (extraction, processing and transport) were estimated using specific consumption and occupation factors available in the mentioned database.
3. Results
3.1. Cumulative Exergy Consumption (CExC) Analysis
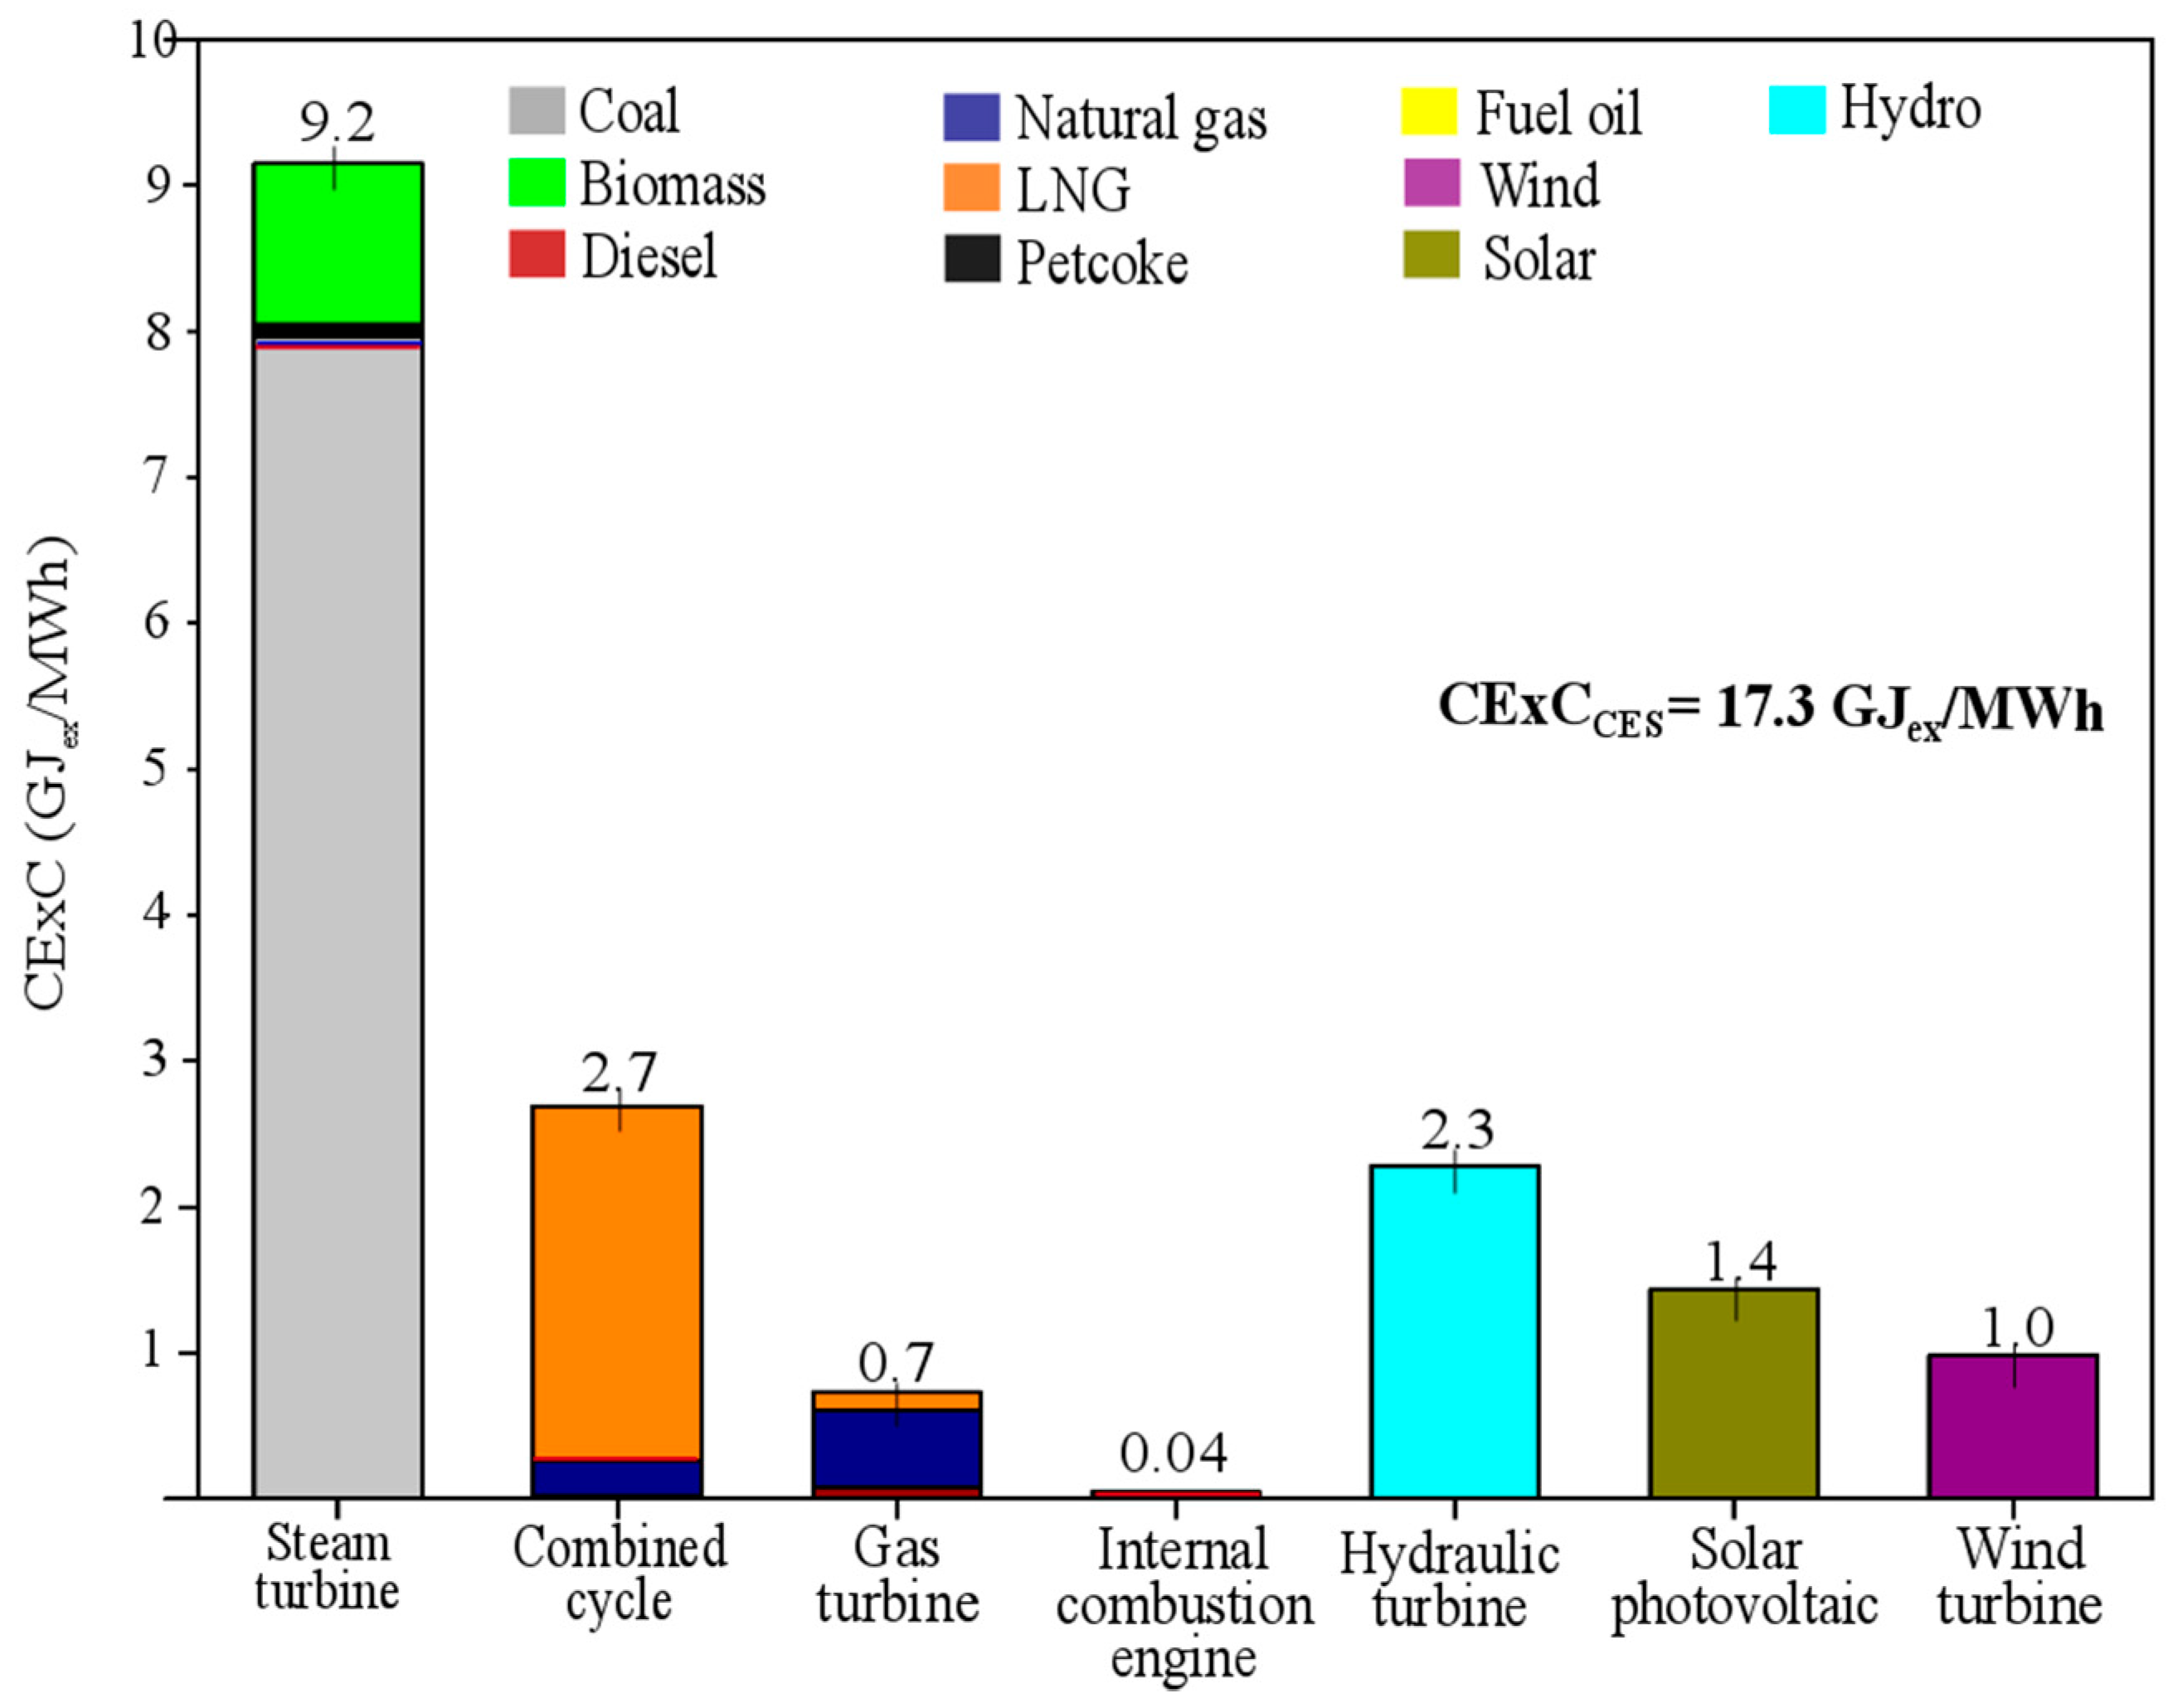
The cumulative exergy consumption demanded (CExC) by type of technology and energy resources for CES is depicted in Figure 2. The result shows that 17.3 GJex (CExC) are required for producing 1 MWh of electricity in the CES. In this context, non-renewable energies represent higher resource consumption (11.5 GJex/MWh) than renewable energy, representing 67% of the total CExC of CES. The steam turbine is the most dominant technology in the CES, demanding 9.2 GJex of resources by each 1 MWh of electricity, with coal and biomass being the main fuels. The coal shows the highest contribution in CExC (7.8 GJex/MWh), as 46% of the total (17.3 GJex/MWh), followed by combined cycles fueled with LNG (14.7%), hydropower plant (13.2%) and solar photovoltaic (8.3%). The biomass steam turbines (1.1 GJex/MWh), wind turbine (1.0 GJex/MWh) and natural gas used in turbines and combined cycle (0.8 GJex/MWh) also play an essential role in the total CExC (16.5%). Meanwhile, the fuel oil N°6, petcoke and diesel have a negligible contribution to total consumed resources, representing only 1.4%.
Figure 3 reports the total embodied energy, water and land used for the generation of 1 MWh of electricity coming from CES. Results are presented on the basis of the exergy-based indicator CExC. As can be seen, the resource distribution exhibit significant disparities, with the energy resources being the most dominant (99.7% of total CExC) in the nexus. Meanwhile, the water (0.2%) and land (0.1%) components are negligible. In addition, the direct and indirect exergy consumptions associated mainly with energy, water and land are also depicted in Figure 3. The indirect component is referred to as all energy, water and land consumed during the whole life cycle (extraction, processing and transport) of fuels (background system). Meanwhile, the direct component involves the energy, water and land consumed directly in the foreground system, which corresponds to the Chilean Electricity System (See Figure 1).
In this sense, the direct exergy consumption for energy and water resources is dominant in comparison with the indirect component, representing 67% and 88 % of total CExC of each resource, respectively. Instead, the indirect exergy consumption (93%) shows a higher contribution than direct components (7%) for land use.
A detailed analysis of direct and indirect components of CExC for the different energy types segregated by energy, water and land resources are shown in Table 3. Non-renewable energy sources included direct and indirect exergetic components. In contrast, renewable energy sources only involve direct exergy consumption. The coal represents the highest contribution in terms of CExC (7.9 GJex/MWh), followed by LNG (2.6 GJex/MWh) and hydro (2.3 GJex/MWh). The solar (1.4 GJex/MWh), biomass (1.1 GJex/MWh) and wind (1.0 GJex/MWh) also depicted essential contributions. Nevertheless, the diesel, petcoke and fuel oil showed the lowest cumulative exergy consumption, reporting values below 0.1 GJex per MWh of electricity.
For non-renewable energy sources, coal is the fuel with the highest share into the nexus (7.9 GJex/MWh), representing 69% of the total for non-renewables. In this case, the direct (4.2 GJex/MWh) exergy demand for the energy resource is higher than indirect (3.6 GJex/MWh). Meanwhile, the indirect inputs related to energy resources for diesel, natural gas and LNG are higher in comparison with the direct component, representing 80%, 50% and 55% of total CExC by each resource, respectively.
3.2. Water–Energy–Land Nexus Efficiency
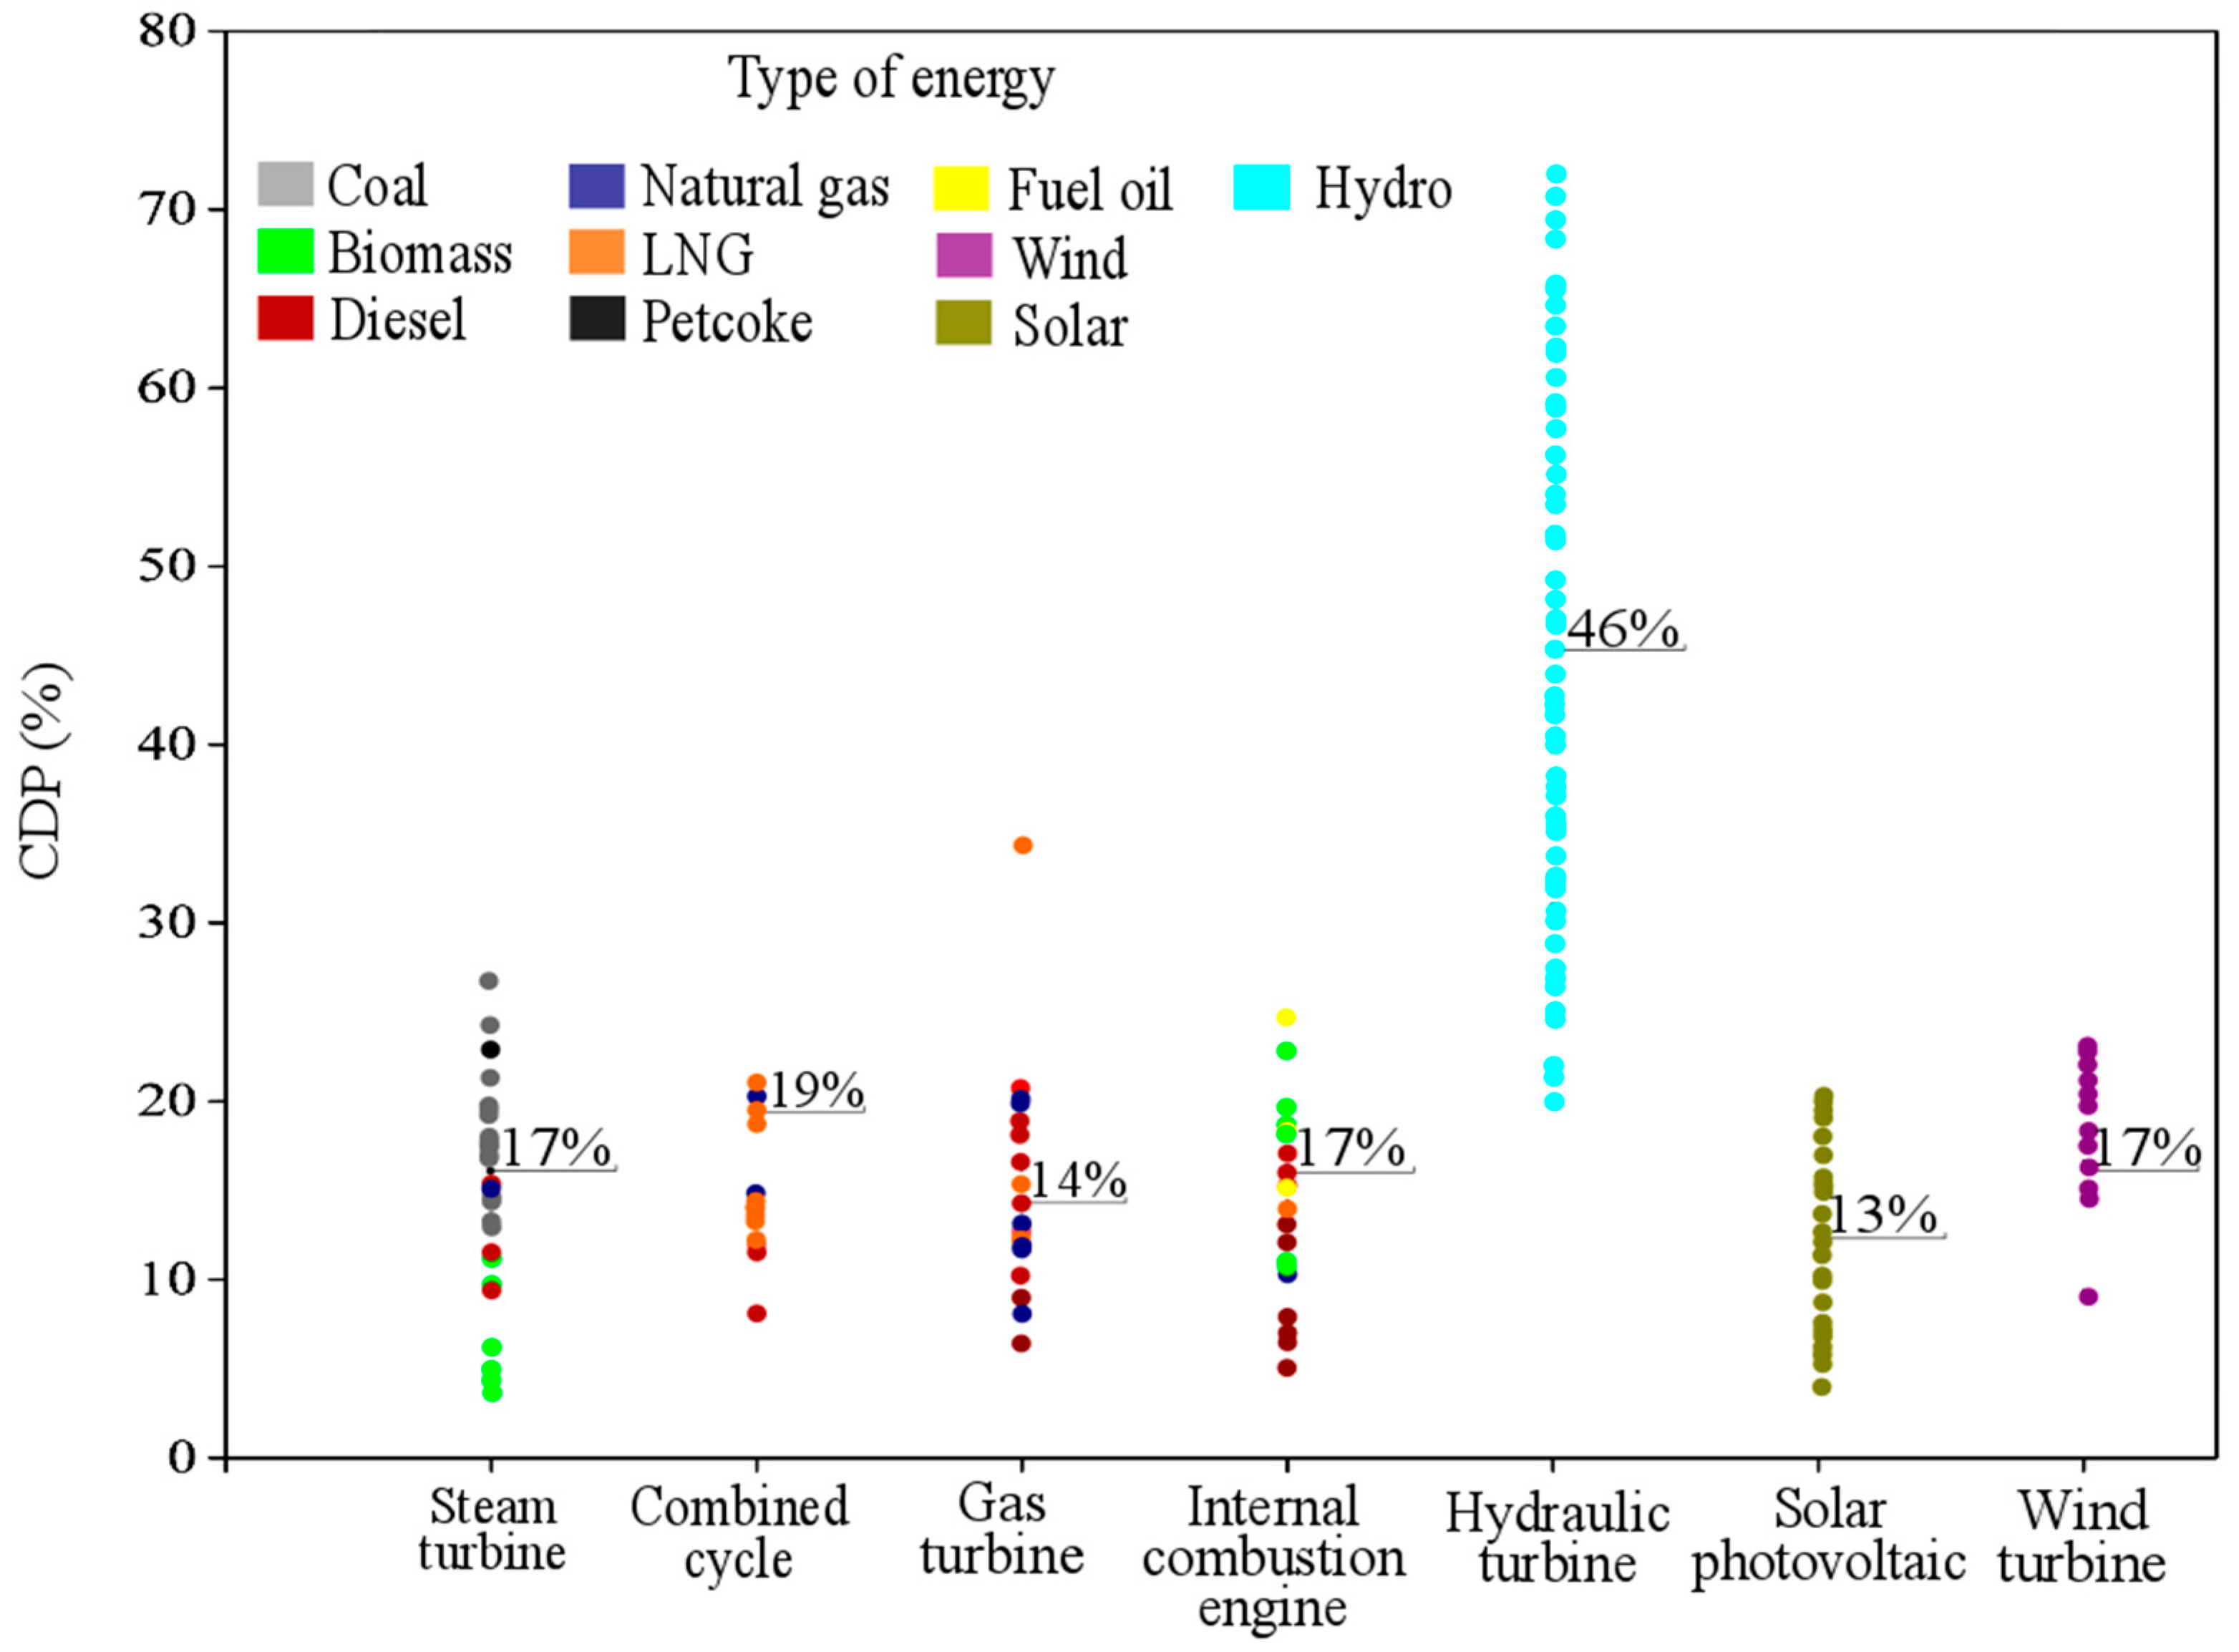
The water–energy–land nexus efficiencies for the type of technologies and energy resources involved in CES, as well as the average CDP by groups of technologies, are reported in Figure 4. The CDP parameter is scaled between zero and one, where zero means low efficiency of resources transformation towards products, while values near 100% mean that all resources are transformed efficiently into products. The CDP accounts how most efficiently are used the resources in the process.
The CDP for hydraulic turbines accounts for an average of 46%, being the highest exergy efficiency in comparison with the rest of the technologies. The average of CDP for the rest of technologies varies between 13% and 19%, with solar photovoltaic (13%) and gas turbines (14%) being the technologies with lower efficiencies. The combined cycle efficiency takes values of 19%; meanwhile, the steam turbines, internal combustion engines and wind turbines depicted similar averages of CDP (17%). For non-renewable technologies (steam and gas turbines, combined cycle and internal combustion engines), the CDP also varies with energy resource types (coal, diesel, biomass, et al.).
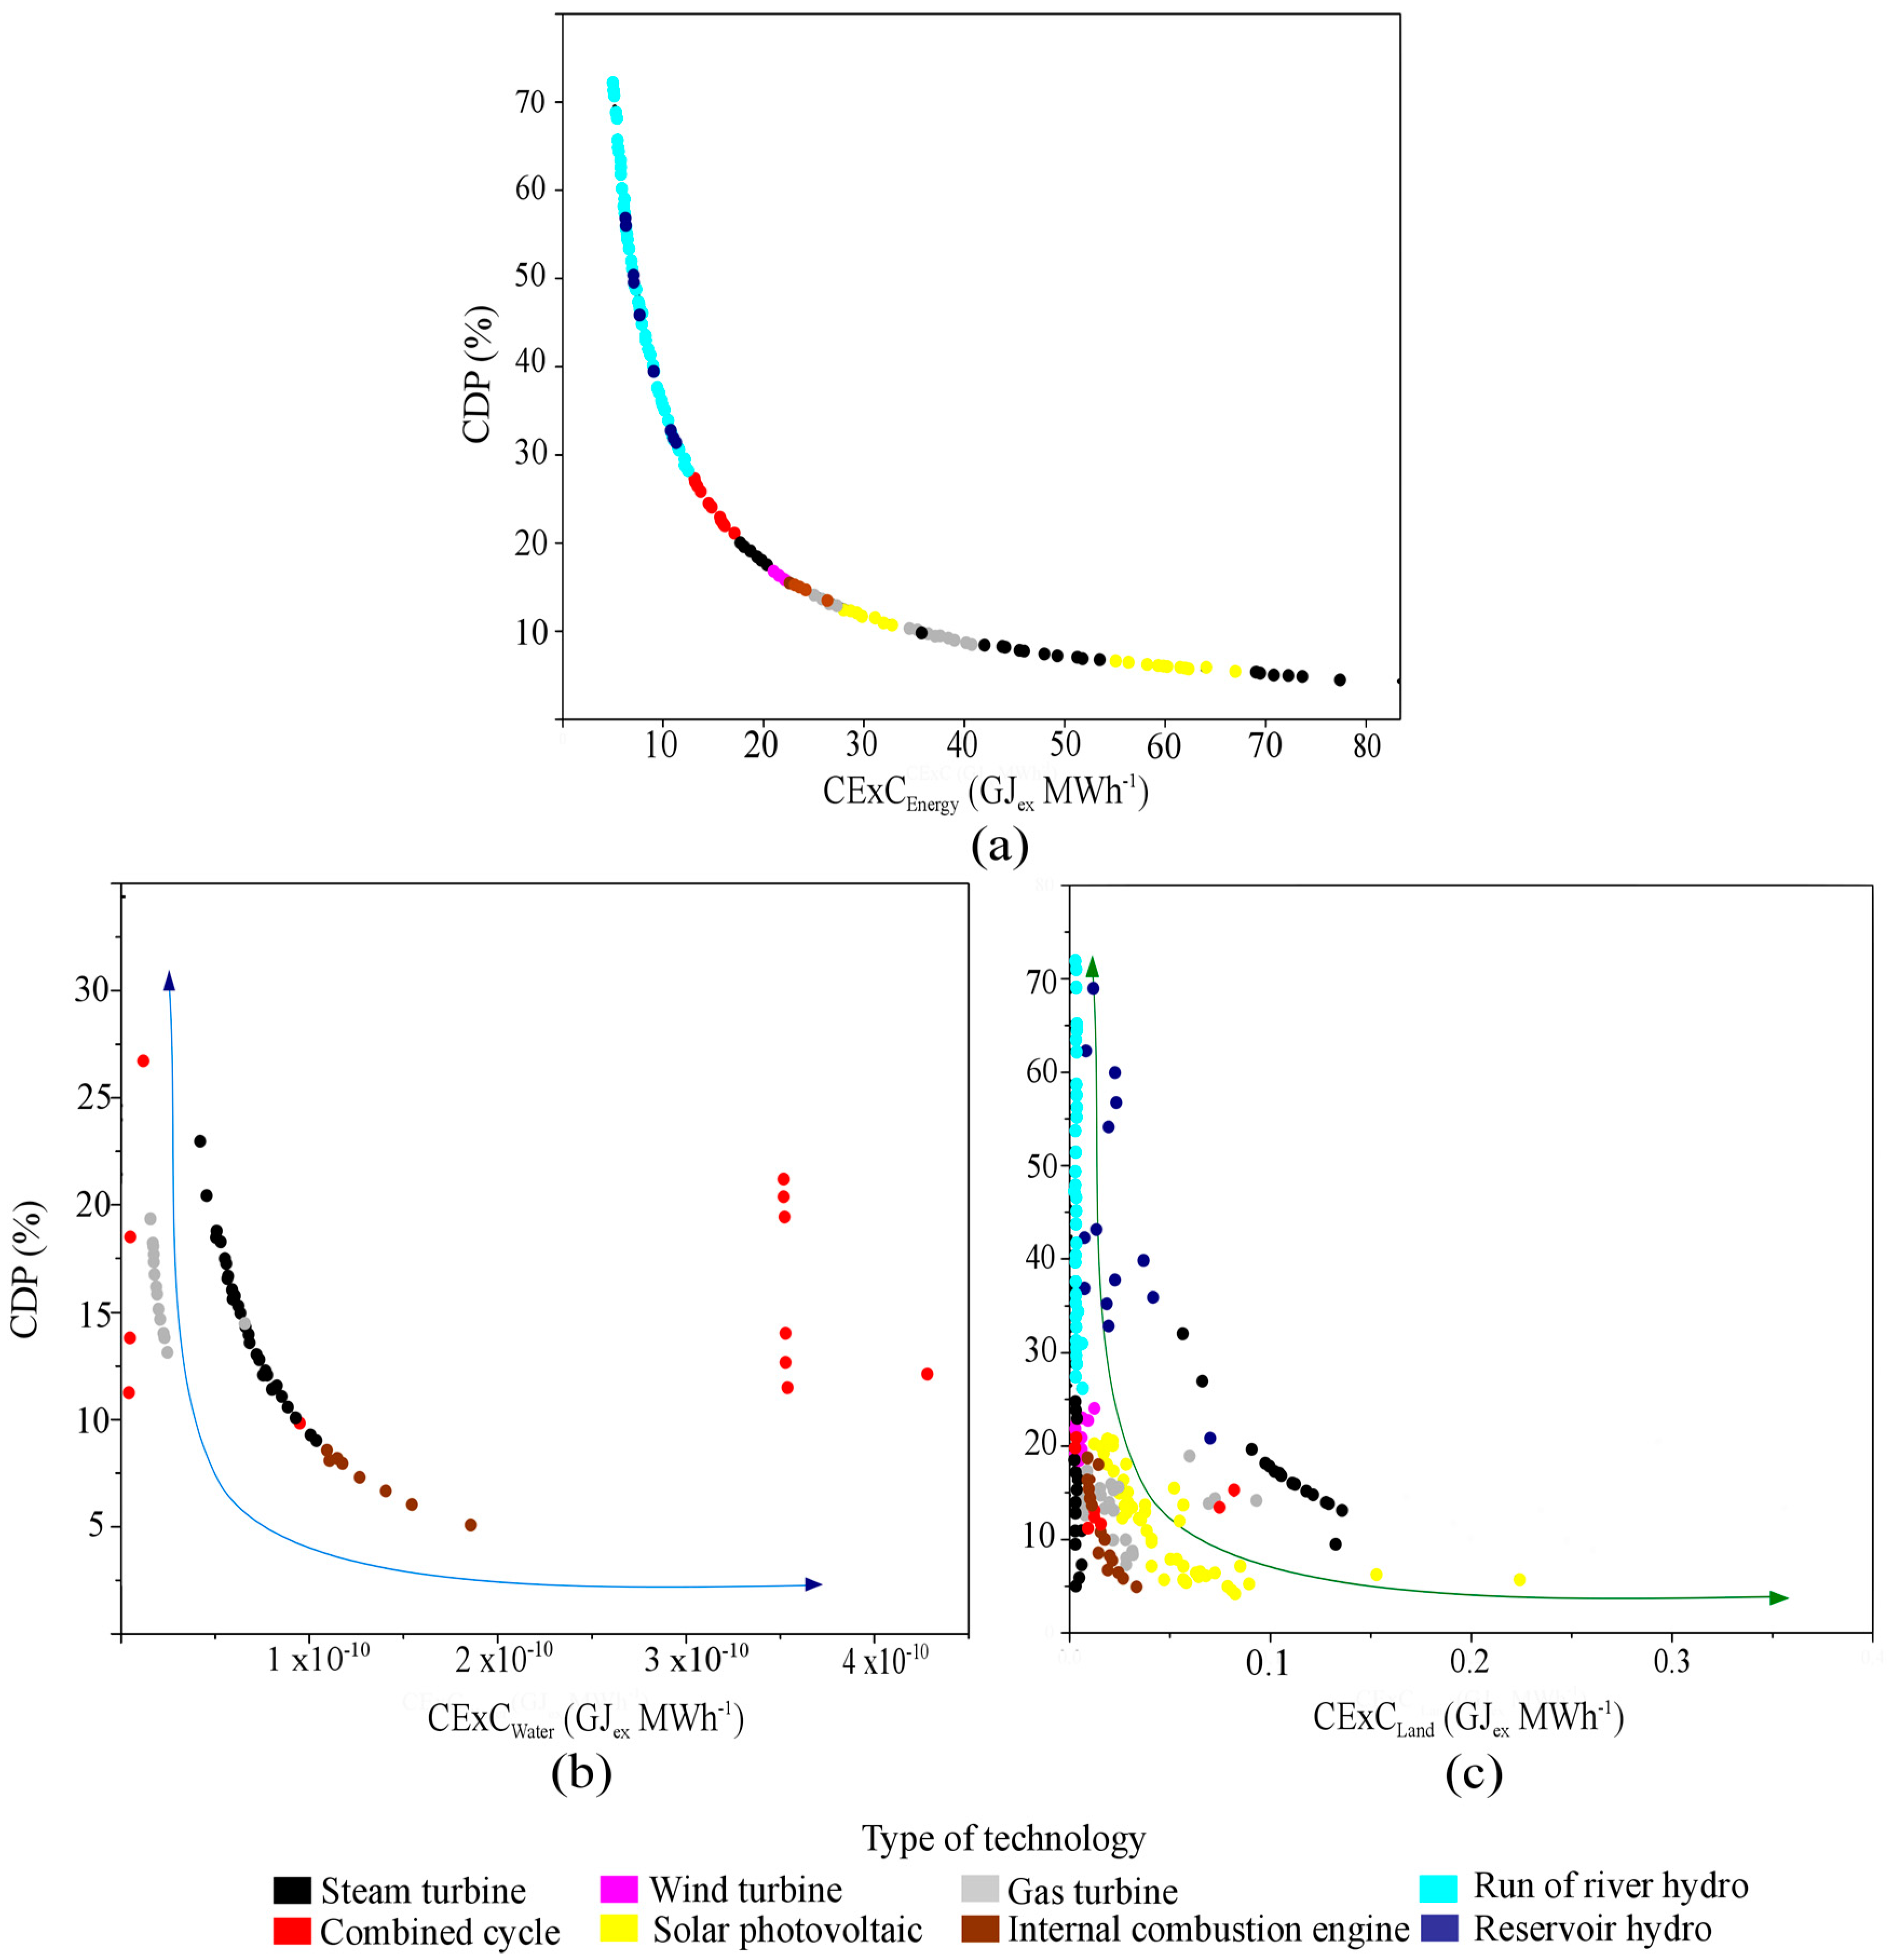
Figure 5a–c illustrates the water–energy–land nexus assessment. It was carried out through a correlation between CDP and CExC by each resource (water, energy and land) and type of technology. The pattern shown for CExC of energy represents a homogenous distribution concerning CDP. The hydropower plants (reservoir and run-of-river hydro) show the highest CDP (28%–72%) and lowest CExCenergy (8–12 GJex/MWh). In contrast, the lower efficiency and higher CExCenergy are depicted for steam turbines and solar photovoltaic, where the CDP and CExC take values below 15% and above 40 GJex/MWh, respectively. Regarding patterns obtained for water (Figure 5b) and land (Figure 5c) resources, significant disparities were obtained. The non-renewable technologies are the most intensive regarding water demand within the CES, depicting CDP in the ranges of 8%–23%. Nevertheless, the total demanded water (CExCwater) varies by technologies. In this case, the majority of combined cycle power plants involved in CES demands higher water accounting for 3.5 × 10⁻¹⁰ GJex/MWh, followed by internal combustion engines (1–1.8 × 10⁻¹⁰ GJex/MWh). According to Figure 5c, all the technologies are dependent on territory uses. In this sense, a significant number of steam turbines power plants present higher use of land in comparison with the rest of energy production technologies, taking values of CExCland 0.1–0.15 GJex/MWh. In general, the non-renewable technologies depicted the lowest CDP and CExCland. Comparable performance in terms of CDP is also shown by solar photovoltaics, accounting for higher CExCland (0.3–0.1 GJex/MWh) concerning non-renewable technologies (<0.3 GJex/MWh). Meanwhile, the hydropower plants (run-of-river and reservoir) show similar CDP (25%–70%), but the CExCland was different by each technology. The run-of-river power plant (0.01 GJex/MWh) shows lower CExCland than reservoir hydropower plants (0.05 GJex/MWh).
4. Discussion
4.1. Cumulative Exergy Consumption (CExC) Analysis
The CES showed high cumulative exergy consumptions per MWh of electricity (17.31 GJex/MWh), which is significantly higher than reported by China (10.8 GJex/MWh) [55] and Brazil (8.6 GJex/MWh) [56]. The significant differences found here are associated with the fuel contributions to the electricity matrix of each country. Accordingly, higher CExC is expected for higher shares of fossil fuel in the energy sector. Specifically for China, the electricity matrix is dominated by thermal power plants fed by coal, representing 79% of total power generation. In contrast, the Brazilian electricity sector is based on hydropower plants (68% of total), where fossil fuels only share 9%. In the Chilean case, 57% of electricity generated comes from fossil fuels (coal and natural gas), which is lower than in China and higher concerning Brazil.
Nevertheless, the present results could be contradictory when they are compared with China, as higher CExC is obtained for lower fossil fuel contribution. This behavior is associated with the higher energy consumption factors per ton of fossil fuel considered in the whole fossil fuel value chain (extraction, processing and transport). For this study case, the energy consumptions factors (34,000 MJex/t coal, 57,130 MJex/t of oil and 1.27 MJex/MJ natural gas) are higher concerning the factors used by Zhang et al. [55] (29,000 MJex/t of coal, 46,731 MJex/t of oil, 0.96 MJex/MJ natural gas). The significant differences are due to that reported in Zhang et al. [55], which only considered the local fossil fuel extraction, excluding the transport stage. Accordingly, the large distances for fossil fuel transportation are the main reason for such a high index of CExC in the CES.
On the other hand, the system boundaries assumed for the accounting of the exergy life cycle could also bring differences in terms of CExC. In this sense, the lower cumulative exergy consumption reported by Brazil concerning China and the present case is because the indirect exergy consumptions related to the extraction, processing and transport stages were not being considered. As shown in Figure 2, the CES is strongly dependent on non-renewable energy sources. This performance is due to the high contributions of coal (39.6%) and natural gas (17.1%) on national electric generation (see Table 1). This consumption pattern makes the CES highly vulnerable to external fluctuations in energy markets. At the same time, the high dependency of fossil fuels could carry out a high carbon intensity for the Chilean energy sector mainly associated with low-efficiency steam power plants fueled with coal, in which efficiencies do not exceed 38% (based on LHV). In this sense, CES is the primary GHG contributor in Chile, representing 77.4% of total GHG emissions in 2013 [30]. These results suggest the need for an electricity matrix less dependent on fossil fuels and low carbon. In correspondence, Chile had proposed the decarbonization plan of the energy sector, which consists in the gradual closure of 28 coal-fired power plants that are still operating in the country for 2040 [57,58]. Studies reported by Lechón et al. [16] corroborate that the decarbonization pathway by means of penetration of renewable technology is a feasible energy policy for reducing resources, such as fossil fuels, water and land, as well as carbon emissions. Therefore, a reduction of nearly 40% of CExC is expected for 2040.
Furthermore, the findings of this study suggest low intensity of water and land in the nexus (Figure 3). This performance is associated with the low quality of water and land in comparison with energy in terms of exergy. However, this does not mean that water and land do not play an essential role in the sustainability of electric systems at the regional and local scale. In this sense, the nexus dynamics are also correlated with climatic factors, environmental impacts, governance and policies, as well as natural resource availability, which, at the same time, are very dependent on local socio-economic conditions.
Another critical issue that implies high CExC for non-renewable energy resources is related to resource consumption during their life cycle, which involves the extraction, processing and transport. The significant contribution of the direct and indirect exergy consumption for coal could be justified by the high contribution of this fuel (39.6%) in the national electricity matrix, as well as the high energy demanded in extraction, processing and transport stages (25.1 GJ/ton of coal).
In addition, coal extraction is also the reason for high indirect land uses, which represents 93% of total indirect land uses. Therefore, it can be concluded that fuel origin is relevant in the indirect exergy and land consumptions for consequences on overall exergy resources consumed during the whole fuel life cycle. These results are consistent with those reported by Lechón et al. [16], who highlighted the relevance of land occupation for non-renewable technologies associated mainly for the fossil fuel extraction stages.
According to that, the natural gas, LNG and diesel also showed higher indirect exergy consumption than the direct exergy component. It means that higher resource volumes have been used to produce the fuel rather than itself exergy content itself. This behavior is related to the high energy consumption during the extraction and processing stages of each fuel, which represents above 94% of the total indirect energy inputs (GJex/MWh) of each one. The remaining indirect energy consumption (< 6%) is related to fuel transportation, which is negligible for all fuels.
The increment of renewable energy sources share (wind, solar, biomass, hydro) could reduce the CExC in CES, due to negligible indirect exergy demand. Nevertheless, the CExC values obtained here could be underestimated due to the exclusion of indirect resource consumption during the technology manufacturing stage, specifically for solar photovoltaic panels and wind turbines. In this sense, several studies highlighted the high primary exergy consumption during PV modules production [59,60,61]. Furthermore, the results reported also demonstrated that the manufacturing stage varies as a function of the material used in PV, implying variation from 22% to 81% of total exergy consumption [59,60]. In addition, the Life Cycle Assessment (LCA) of the battery solar-PV manufacturing also depicted significant impacts on water resources depletion, land use and natural resources (minerals) [61]. The wind turbines are also characterized by high demand of natural resources (energy resources and material resources), as is demonstrated in most of the LCA impact methods [62,63,64]. Haapala and Prempreeda [63] found that the manufacturing stage for two 2 MW onshore wind turbines represented 78% of total environmental impacts during whole energysupply chains in the US. A similar environmental profile was reported by Chipindula et al. [64]. The authors reported that the manufacturing stage contributes an average of 80% to total environmental impact, associated mainly with the material extraction/processing phase (72%). More recently, Lechón et al. [16] highlighted the relevant extraction of raw materials(silicon mining) on land use impacts for wind and solar photovoltaic power. Therefore, higher CExC is expected for these technologies and, as a consequence, lower CDP.
According to the Chilean energy policy, a steep increment in the implementation of energy generation technologies, specifically those based on wind and solar sources, is expected for the near future [65,66]. In consequence, lower CExC for CES could also be expected. Nevertheless, special attention should be paid to biomass because even when it is available in Chile as a promising resource, the value chain for its exploitation as an energy vector is intensively energy demanding. Indeed, the logistics associated with forest management and biomass transportation is one of the critical factors affecting the environmental profile of biomass-based technologies [67,68]. In the present analysis, the biomass value chain was not considered so that the indirect exergy consumption related to the energy component is underestimated. Therefore, the biomass value chain should be taken into account in further studies.
4.2. Water–Energy–Land Nexus Efficiency
The water–energy–land nexus efficiency was evaluated through the cumulative degree of perfection (CDP), which heavily depends on CExC and individual technology efficiency. Lower CExC and higher technology efficiency implies higher efficiency of water–energy–land nexus.
Technology efficiency plays an essential role in CDP. The technologies associated with non-renewable energy sources show a lower CDP (14%–19%) in comparison with renewable sources (13%–46%). The low CDP of non-renewable energy sources is related mainly to low efficiency, especially for coal-fired power plants (28% to 37%). The current power generation in Chile produces an average of 2.8 MWh per ton of coal in low-efficiency subcritical power plants in which efficiencies do not exceed 38% (based on LHV). Approximately 16% of existing coal-fired power plants have been in operation for more than 40 years; meanwhile, 76% have started-up in 2010 [30]. The advanced supercritical and ultra-supercritical coal-fired power systems could be attractive alternatives for the improvement of efficiencies in coal-based power generation systems. These super and ultracritical technologies have efficiencies ranging between 42% and 44%, being higher than traditional subcritical power plants. Consequently, they should also reduce the GHG emissions of the Chilean electricity matrix. Nevertheless, the implementation of these alternatives has limitations because of the actual policy aiming to decarbonize the Chilean energy sector [56,57].
On the other hand, the low exergy efficiencies found for non-renewable technologies (steam turbine, combined cycle, gas natural and internal combustion engines) are also associated with high indirect consumptions of exergy during the whole fossil fuel life cycle. As discussed previously, the indirect exergy inputs for fossil fuels have a significant (40%–80%) share in the total exergy consumption.
Furthermore, renewable sources technologies are dominated by hydropower plants, which represent 68.4% of total renewable electricity generation. The high exergy efficiency of hydroelectricity (46%) is due to the efficient uses of kinetic and potential exergy. These results are in concordance with Novak [69] and Randriambahoaka [70]. In contrast, solar photovoltaic (13%) and wind turbines (17%) are characterized by low CDP due to the low efficiency of wind and solar resource transformation into electricity [71,72,73], which is strongly dependent on the technological parameters (wind speed, photovoltaic panel surface area and materials, direct solar radiation, etc.). One of the main inconveniences of non-conventional renewable energy resources is the intermittency problems [74,75], which could carry out the instability of the energetic supply.
Regarding energy resources (Figure 5a), the high contribution of energy into nexus is related to the high fossil fuel dependency of CES. This energy intensity (fossil fuels) of nexus could bring a threat to energy security due to its strong dependence on coal, oil and natural gas imports [57,76]. Furthermore, the presented results highlight the inverse proportionality between CDP (water, energy and land) and CExC.
In addition, the energy systems are vulnerable to global political, climatic and economic fluctuations. Moreover, climatic factors and environmental impacts associated with greenhouse gas emissions (GHG) also constitute an essential driver on water–energy–land interactions. In response, one of the goals of the Chilean Energy Policy is to achieve 60% renewable energy for electricity generation by 2050 [77]. In this scenario, hydropower can play an important role. However, hydropower is highly vulnerable to climate change. In fact, Chile has registered a drastic reduction in rainfall, extensive drought and, consequently, water scarcity, which affects the plant factor for those technologies based on hydric resources [78]. On the other hand, there is an intense competition between hydroelectricity generation with other water uses (i.e., irrigation, industry, domestic use, etc.). Furthermore, the superficial and underground water quality and availability have been affected by diffuse pollution, anthropogenic interventions and climatic changes [79].
The low CExCwater obtained for thermal power plants (coal) is interesting, but the water used for the cooling system is coming from the sea (approximately 76%), which is not accounted for in the nexus interactions. However, the combined cycles depicted significant differences in terms of water consumption concerning the rest of the technologies. This performance is due to the fuel type used in the combined cycles. In this case, the primary fossil fuel fed in this technology is LNG, representing 90% of the total of fuels. The relevance of LNG into the combined cycle carried out high freshwater demand, due to high specific water consumption per GJ of electricity generated (1.8 m3/GJ for LNG).
From the land resources point of view, the main contribution is associated with land occupation related to renewable energy sources (solar, wind and biomass), except for some steam turbine power plants. The land-use intensity found for steam turbines can be justified by the high indirect land uses (98%) related to coal extraction, representing 91% of the total fuel feedstock to steam turbines.
Solar PV power plants are characterized by intensive land use. However, most of them are located in the northern region in the Atacama Desert, which is not in conflict with other land uses. Similar behavior is depicted for wind power plants, which are located along with the Chilean territory co-existing with other land uses (i.e., agriculture). In contrast, electricity coming from biomass power plants is land-intensive due to biomass extraction, but it was not considered here. In fact, forest management has led to an increase in land erosion [80], causing a reduction of ecosystem services. At the same time, there has been found to be a negative impact on biodiversity [81,82], habitat fragmentation [83], as well as a reduction of rivers basin’s morpho-sedimentary regulation capacity [79]. In general, the results presented here corroborated that nexus dynamics are heavily dependent on climatic factors, environmental impacts, governance and policies, as well as natural resource availability, which at the same time are very dependent on local socio-economic conditions.
According to the previous discussion, the CES is intensive in terms of energy consumption, with an excessive (57%) dependence on fossil fuel importation, which could be a threat to energy security. However, the substitution of non-renewable energy sources by renewable ones could put pressure on water availability and land use at the local scale. The establishment of a common nexus typology in terms of metrics that could be used for evaluation at different scales is still a challenge. In this sense, the WELN evaluation should be focused on the quality of resources using the exergy concept. Specifically, the exergy concept allowed to unify the metrics associated with energy and water consumption, as well as land use. The exergetic indicator (CExC and CDP) used to evaluate the nexus demonstrated the relevance of indirect energy, water and land consumption due to the fossil fuel value chains.
Nevertheless, the nexus efficiency in terms of water and land resources were insignificant concerning energy resource. This performance demonstrated that the exergy concept visualized the energetic resources with the highest quality in comparison to water and land. The results could be confusing, considering that exergy analysis is a non-traditional tool for highlighting the water and land resources nexus. For the present study case, it is expected that energy resources will be more significant than water and land in CES. Nevertheless, the evaluation of WELN in other scales (forestry and agriculture sectors, basin, regions), where the land and water are intensively used, could provide major relevance of these resources with respect to the energy component. Accordingly, Silalertruksa and Gheewala [13] found the relevance of water and land resources in the evaluation of land–water–energy nexus with a focus on sugarcane production in Thailand.
On the other hand, several methods could be used for complementing and highlighting the water and land resources within WELN. In this sense, the water footprint [13] and environmental extended input–output analysis [1] could be used for the accounting of water resource interactions in different productive sectors. The water footprint has been widely used in the energy sector for accounting for the water demand following the life cycle thinking approach [13,84]. Besides, the environmental extended input–output analysis has been applied in the energy sector for the estimation of specific water consumptions associated with different technologies of electricity generation and fuel extractions [1,85]. This method is characterized by its flexibility for evaluating the nexus at different scales (e.g., productive process, economic sectors, basin, etc.), as well as the fact that the accounting is not only of the embodied water demand but also the land resources [1]. From the land resource point of view, the ecological footprint could also be recommended [86]. The ecological footprint has been used to evaluate the impacts of the use of non-renewable energy (fossil fuels) on land impact, focused on soil quality [86,87,88]. Considering the previous discussion, several methods could be used for highlighting the water and land resources. Nevertheless, those analyses are focused on each resource separately, limiting the comparison and integration with different processes and multi-scales. These aspects constitute the main challenges in the WEL nexus evaluation [19]. Nevertheless, the novelty of single exergy-based indicators for the evaluation of the nexus would provide answers to the mentioned challenges.
Furthermore, relevant results were found when the analysis was focused on each resource separately. In this case, the renewable technologies depicted higher CDP, but higher land uses. In contrast, the non-renewable technologies were intensively water-dependent, remarking the indirect water consumption for the production of fossil fuel. Therefore, it can be concluded that the integration of LCA and exergy principles are suitable for evaluating the water–energy–land nexus efficiency through exergy-based indicators.
5. Conclusions
In an attempt to quantify the water–energy–land nexus using exergy-based indicators, this study determined the interaction between these resources in the Chilean Energy System (CES). The study constitutes the first approach for quantifying the water–energy–land nexus efficiency.
The results suggest that the WELN for CES is strongly dependent on energy resources but not of water and land resources. Furthermore, the indirect consumptions of exergy during the whole fossil fuel life cycle are significant for non-renewable technologies, implying the lowest exergy efficiencies (CDP).
In addition, the low water and land intensity of CES does not mean that these resources are irrelevant to the sustainability of the electric system at the regional and local scale. In this sense, several local problems had emerged as a result of unsustainable energy, water and land management.
The comparisons with similar studies are difficult to carry out due to a variety of metrics, conceptual frameworks and a different case of studies. Nevertheless, the integration of LCA and exergy principles could facilitate the comparison and integration with different processes. At the same time, it allows evaluating the water–energy–land nexus efficiency through a common exergy-based indicator, facilitating the decision-making towards the sustainability of using multiple energy carriers into territorial planning, as well as the integration between multi-scales (process, sectors, basin, countries).
On the basis of this paper, there are still unsolved questions regarding the exclusion of technology manufacturing in the system boundary, specifically for renewable energy sources. Therefore, the future work ought to be focused on considered this stage, as well as the electricity transmission in order to avoid the underestimation of exergy indicators.
Author Contributions
Conceptualization, C.U.-T. and Y.C.-L.; methodology, V.R.-M. and Y.C.-L.; validation, V.R.-M., Y.C.-L. and C.U.-T.; investigation, V.R.-M., Y.C.-L. and C.U.-T.; writing—original draft preparation, V.R.-M., Y.C.-L. and C.U.-T.; writing—review and editing, V.R.-M., Y.C.-L. and C.U.-T.; supervision, Y.C.-L. and C.U.-T.; Project administration, Y.C.-L.; funding acquisition, Y.C.-L. All authors have read and agreed to the published version of the manuscript.
Funding
This research was funded by “CONICYT-FONDECYT, grant number 11170302”.
Conflicts of Interest
The authors declare no conflict of interest.
References
- Guan, S.; Han, M.; Wu, X.; Guan, C.; Zhang, B. Exploring energy-water-land nexus in national supply chains: China 2012. Energy 2019, 185, 1225–1234. [Google Scholar] [CrossRef]
- Brouwer, F.; Vamvakeridou-lyroudia, L.; Alexandri, E.; Bremere, I. The Nexus Concept Integrating Energy and Resource Efficiency for Policy Assessments: A Comparative Approach from Three Cases. Sustainability 2018, 10, 4860. [Google Scholar] [CrossRef] [Green Version]
- Ibrahim, M.; Cunha, D.; Daneshvar, S.; Cunha, R. Transnational resource generativity: Efficiency analysis and target setting of water, energy, land, and food nexus for OECD countries. Sci. Total Environ. 2019, 697, 1–13. [Google Scholar] [CrossRef] [PubMed]
- Lee, M.; Keller, A.A.; Chiang, P.; Den, W.; Wang, H. Water-energy nexus for urban water systems: A comparative review on energy intensity and environmental impacts in relation to global water risks. Appl. Energy 2017, 205, 589–601. [Google Scholar] [CrossRef] [Green Version]
- Bazilian, M.; Rogner, H.; Howells, M.; Hermann, S.; Arent, D.; Gielen, D. Considering the energy, water and food nexus: Towards an integrated modelling approach. Energy Policy 2011, 39, 7896–7906. [Google Scholar] [CrossRef]
- Cremades, R.; Sommer, P.S. Computing climate-smart urban land use with the Integrated Urban Complexity model (IUCm1.0). Geosci. Model Dev. 2019, 12, 525–539. [Google Scholar] [CrossRef] [Green Version]
- Cremades, R.; Mitter, H.; Constantin, N.; Sanchez-plaza, A.; Graves, A.; Broekman, A. Ten principles to integrate the water-energy-land nexus with climate services for co-producing local and regional integrated assessments. Sci. Total Environ. 2019, 693, 1336–1362. [Google Scholar] [CrossRef]
- Nie, Y.; Avraamidou, S.; Xiao, X.; Pistikopoulos, E.N. A Food-Energy-Water Nexus approach for land use optimization. Sci. Total Environ. 2019, 659, 7–19. [Google Scholar] [CrossRef] [Green Version]
- Dargin, J.; Daher, B.; Mohtar, R.H. Science of the Total Environment Complexity versus simplicity in water energy food nexus (WEF) assessment tools. Sci. Total Environ. 2019, 650, 1566–1575. [Google Scholar] [CrossRef]
- Ringler, C.; Bhaduri, A.; Lawford, R. The nexus across water, energy, land and food (WELF): Potential for improved resource use efficiency? Curr. Opin. Environ. Sustain. 2013, 5, 617–624. [Google Scholar] [CrossRef]
- Siciliano, G.; Cristina, M.; Odorico, P.D. European large-scale farmland investments and the land-water-energy-food nexus. Adv. Water Resour. 2017, 110, 579–590. [Google Scholar] [CrossRef] [Green Version]
- Karabulut, A.; Crenna, E.; Sala, S.; Udias, A. A proposal for integration of the ecosystem-water-food-land-energy (EWFLE) nexus concept into life cycle assessment: A synthesis matrix system for food security. J. Clean. Prod. 2018, 172, 3874–3889. [Google Scholar] [CrossRef]
- Silalertruksa, T.; Gheewala, S.H. Land-water-energy nexus of sugarcane production in Thailand. J. Clean. Prod. 2018, 182, 521–528. [Google Scholar] [CrossRef]
- Saif, Y.; Almansoori, A. An Optimization framework for the climate, land, energy, and water (CLEWS) nexus by a discrete optimization model. Energy Procedia 2017, 105, 3232–3238. [Google Scholar] [CrossRef]
- Stigson, P.; Roth, S.; Karlsson, A. Re-Evaluating the Sustainability of Energy Systems: The Nexus of Energy, Water, and Land-Use. Handb. Clean Energy Syst. 2015. [Google Scholar] [CrossRef] [Green Version]
- Lechón, Y.; De la Rúa, C.; Cabal, H. Impacts of Decarbonisation on the Water-Energy. Energies 2018, 11, 1203. [Google Scholar] [CrossRef] [Green Version]
- Mekonnen, M.; Hoekstra, A.Y. Future electricity: The challenge of reducing both carbon and water footprint. Sci. Total Environ. 2016, 570, 1282–1288. [Google Scholar] [CrossRef] [PubMed] [Green Version]
- Wang, S.; Chen, B. Energy–water nexus of urban agglomeration based on multiregional input – output tables and ecological network analysis: A case study of the Beijing–Tianjin–Hebei region. Appl. Energy 2016, 178, 773–783. [Google Scholar] [CrossRef]
- Dai, J.; Wu, S.; Han, G.; Weinberg, J.; Xie, X.; Wu, X. A review of methods and tools for macro-assessment. Appl. Energy 2018, 210, 393–408. [Google Scholar] [CrossRef]
- Shannak, S.; Mabrey, D.; Vittorio, M. Moving from theory to practice in the water–energy–food nexus: An evaluation of existing models and frameworks. Water-Energy Nexus 2018, 1, 17–25. [Google Scholar] [CrossRef]
- Morten, A.; Drews, M. Water use in electricity generation for water-energy nexus analyses: The European case. Sci. Total Environ. 2019, 651, 2044–2058. [Google Scholar] [CrossRef]
- Wall, G.; Gong, M. On exergy and sustainable development—Part 1: Conditions and concepts. Exergy Int. J. 2001, 1, 128–145. [Google Scholar] [CrossRef]
- Szargut, J. Optimization of the design parameters aiming at the minimization of the depletion of non-renewable resources. Energy 2004, 29, 2161–2169. [Google Scholar] [CrossRef]
- Ahmadi, P.; Dincer, I. Thermodynamic analysis and thermoeconomic optimization of a dual pressure combined cycle power plant with a supplementary firing unit. Energy Convers. Manag. 2011, 52, 2296–2308. [Google Scholar] [CrossRef]
- Granovskii, M.; Dincer, I.; Rosen, M.A. Exergetic life cycle assessment of hydrogen production from renewable. J. Power Sources 2007, 167, 461–471. [Google Scholar] [CrossRef]
- Dewulf, J.; Van Langenhove, H.; Muys, B.; Bruers, S.; Bakshi, B.R.; Grubb, G.F. Exergy: Its potential and limitations in environmental science and technology. Environ. Sci. Technol. 2008, 42, 2221–2232. [Google Scholar] [CrossRef] [PubMed]
- Sciubba, E. Exergy-based ecological indicators: From Thermo-Economics to cumulative exergy consumption to Thermo-Ecological Cost and Extended Exergy Accounting. Energy 2018, 168, 462–476. [Google Scholar] [CrossRef]
- Sciubba, E. The Exergy Footprint as a Sustainability Indicator: An Application to the Neanderthal—Sapiens Competition in the Late Pleistocene. Sustainability 2019, 11, 4913. [Google Scholar] [CrossRef] [Green Version]
- Dewulf, J.; Van Langenhove, H.; Mulder, J.; Van den Berg, M.M.; Van der Kooi, H.J.; Swaan Arons, J. Illustrations towards quantifying the sustainability of technology. Green Chem. 2000, 2, 108–114. [Google Scholar] [CrossRef]
- CNE:Generación Bruta Mensual SEN 2017. Available online: http://energiaabierta.cl (accessed on 16 June 2018).
- Turconi, R.; Boldrin, A.; Astrup, T. Life cycle assessment (LCA) of electricity generation technologies: Overview, comparability and limitations. Renew. Sustain. Energy Rev. 2013, 28, 555–565. [Google Scholar] [CrossRef] [Green Version]
- Paletto, A.; Bernardi, S.; Pieratti, E.; Teston, F.; Romagnoli, M. Heliyon Assessment of environmental impact of biomass power plants to increase the social acceptance of renewable energy technologies. Heliyon 2019, 5. [Google Scholar] [CrossRef] [PubMed] [Green Version]
- Karlsdottir, M.R.; Heinonen, J.; Palsson, H.; Palsson, O.P. Geothermics Life cycle assessment of a geothermal combined heat and power plant based on high temperature utilization. Geothermics 2020, 84. [Google Scholar] [CrossRef]
- Szargut, J. Exergy Method: Technical and Ecological Applications, 1st ed.; WIT Press: Southampton, UK, 2005. [Google Scholar]
- Dincer, I.; Rosen, M.A. Exergy: Energy, Environment and Sustainable Development, 1st ed.; Elsevier Science: Oxford, UK, 2007. [Google Scholar]
- Cerrejón’s Corporate Affairs and Communications Division Sustainability Report; Cerrejón: Barrancas, Hatonuevo, 2017.
- Aghbashlo, M.; Tabatabaei, M.; Hosseini, S.S.; Dashti, B.; Mojarab, S.M. Performance assessment of a wind power plant using standard exergy and extended exergy accounting (EEA) approaches. J. Clean. Prod. 2018, 171, 127–136. [Google Scholar] [CrossRef]
- Rugumayo, A.; Ojeo, J. Low Flow Analysis in Lake Kyoga Basin-Eastern Uganda; Elsevier Science: Oxford, UK, 2006; pp. 739–755. [Google Scholar]
- Ridolfi, E.; Kumar, H.; Bárdossy, A. A methodology to estimate flow duration curves at partially ungauged basins. Hydrol. Earth Syst. Sci. Discuss. 2018, 1–30. [Google Scholar] [CrossRef]
- SEIA:Declaración de Impacto Ambiental (DIA) 2018. Available online: https://www.sea.gob.cl (accessed on 16 June 2019).
- Zuhur, S.; Ceylan, İ.; Ergün, A. Energy, exergy and environmental impact analysis of concentrated PV/cooling system in Turkey. Sol. Energy 2019, 180, 567–574. [Google Scholar] [CrossRef]
- Santana, C.; Falvey, M.; Ibarra, M.; García, M. Energías Renovables en Chile: El Potencial Eólico, Solar e Hidroeléctrico de Arica a Chiloé, 1st ed.; Ministerio de Energía: Santiago, Chile, 2014. [Google Scholar]
- Taelman, S.E.; Schaubroeck, T.; De Meester, S.; Boone, L.; Dewulf, J. Accounting for land use in life cycle assessment: The value of NPP as a proxy indicator to assess land use impacts on ecosystems. Sci. Total Environ. 2016, 550, 143–156. [Google Scholar] [CrossRef]
- Millennium Ecosystem Assessment Board. Ecosystems and Human Well-being: Synthesis, 1st ed.; Island Press: Washington, DC, USA, 2005. [Google Scholar]
- Erb, K.; Krausmann, F.; Gaube, V.; Gingrich, S.; Bondeau, A.; Fischer-Kowalski, M.; Haberl, H. Analyzing the global human appropriation of net primary production—Processes, trajectories, implications. An introduction. Ecol. Econ. 2009, 69, 250–259. [Google Scholar] [CrossRef]
- Rosen, M.; Dincer, I. Exergy as the confluence of energy, environment and sustainable development. Exergy Int. J. 2001, 1, 3–13. [Google Scholar] [CrossRef]
- Bilgen, S.; Sarıkaya, I. Exergy for environment, ecology and sustainable development. Renew. Sustain. Energy Rev. 2015, 51, 1115–1131. [Google Scholar] [CrossRef]
- Alvarenga, R.; Dewulf, J.; Van Langenhove, H. A new natural resource balance indicator for terrestrial biomass production systems. Ecol. Indic. 2013, 32, 140–146. [Google Scholar] [CrossRef]
- Alvarenga, R.; Dewulf, J.; Van Langenhove, H.; Huijbregts, M. Exergy-based accounting for land as a natural resource in life cycle assessment. Int. J. Life Cycle Assess. 2013, 18, 939–947. [Google Scholar] [CrossRef]
- Martínez, Y.; Goecke, D.; Aguayo, M.; Casas-Ledón, Y. Effects of landcover changes on net primary production (NPP)-based exergy in south-central of Chile. Appl. Geogr. 2019, 113. [Google Scholar] [CrossRef]
- Huysveld, S.; De Meester, S.; Van Linden, V.; Muylle, H.; Peiren, N.; Lauwers, L. Cumulative Overall Resource Efficiency Assessment (COREA) for comparing bio-based products with their fossil-derived counterparts. Resour. Conserv. Recycl. 2015, 102, 113–127. [Google Scholar] [CrossRef]
- Dincer, I.; Cengel, Y. Energy, entropy and exergy concepts and their roles in thermal engineering. Entropy 2001, 3, 116–149. [Google Scholar] [CrossRef]
- WEO Energy Outlook Team; Kęsicki, F.; Walton, M.A. Water Energy Nexus: Except from the World Energy Outlook; Clean Energy Solutions Center: Washington, DC, USA, 2016. [Google Scholar]
- Ecoinvent. Ecoinvent Data Version 3.3; Ecoinvent: Zurich, Switzerland, 2016. [Google Scholar]
- Zhang, B.; Meng, Z.; Zhang, L.; Sun, X.; Hayat, T.; Ahmad, B. Resources, Conservation & Recycling Exergy-based systems account of national resource utilization: China 2012. Resour. Conserv. Recycl. 2018, 132, 324–338. [Google Scholar] [CrossRef]
- Mosquim, R.; Junior, S.; Eduardo, C.; Mady, K. Modeling the exergy behavior of São Paulo State in Brazil. J. Clean. Prod. 2018, 1, 643–655. [Google Scholar] [CrossRef]
- The Committee of Ministers for Sustainability and Climate Change, Government of Chile. Intended Nationally Determined Contribution of Chile Towards the Climate Limate Agreement of Paris; Government of Chile: Santiago, Chile, 2015.
- Simsek, Y.; Lorca, Á.; Urmee, T.; Bahri, P.A.; Escobar, R. Review and assessment of energy policy developments in Chile. Energy Policy 2019, 127, 87–101. [Google Scholar] [CrossRef]
- Kannan, R.; Leong, K.; Osman, R.; Ho, H.; Tso, C. Life cycle assessment study of solar PV systems: An example of a 2.7 kWp distributed solar PV system in Singapore. Sol. Energy 2006, 80, 555–563. [Google Scholar] [CrossRef]
- Gong, M.; Wall, G. Fundamentals of Renewable Energy and Applications Life Cycle Exergy Analysis of Solar Energy Systems. J. Fundam. Renew. Energy Appl. 2014, 5, 1–8. [Google Scholar] [CrossRef]
- Mahmud, M.; Huda, N.; Farjana, S.; Lang, C. Environmental impacts of solar-photovoltaic and solar-thermal systems with life-cycle assessment. Energies 2018, 11, 2346. [Google Scholar] [CrossRef] [Green Version]
- Davidsson, S.; Höök, M.; Wall, G. A review of life cycle assessments on wind energy systems. Int. J. Life Cycle Assess. 2012, 17, 729–742. [Google Scholar] [CrossRef]
- Haapala, K.; Prempreeda, P. Comparative life cycle assessment of 2.0 MW wind turbines. Int. J. Sustain. Manuf. 2014, 3, 170–185. [Google Scholar] [CrossRef]
- Chipindula, J.; Botlaguduru, V.; Du, H.; Kommalapati, R.; Huque, Z. Life cycle environmental impact of onshore and offshore wind farms in Texas. Sustainability 2018, 10, 2022. [Google Scholar] [CrossRef] [Green Version]
- Doyle, B. Chile’s roadmap to a renewable future. Reinf. Plast. 2016, 17, 184–186. [Google Scholar] [CrossRef]
- Munguia, M. Renewable energy investment in Chile: Make hay while the sun shines. Reinf. Plast. 2016, 17, 234–236. [Google Scholar] [CrossRef]
- Morales, M.; Aroca, G.; Rubilar, R.; Acuña, E.; Mola-Yudego, B.; González-García, S. Cradle-to-gate life cycle assessment of Eucalyptus globulus short rotation plantations in Chile. J. Clean. Prod. 2015, 99, 239–249. [Google Scholar] [CrossRef]
- Casas-ledón, Y.; Flores, M.; Jiménez, R.; Ronsse, F.; Dewulf, J.; Arteaga-pérez, L.E. On the environmental and economic issues associated with the forestry residues-to-heat and electricity route in Chile: Sawdust gasification as a case study. Energy 2019, 170, 763–776. [Google Scholar] [CrossRef]
- Novak, P. Exergy as Measure of Sustainability of Energy System. Int. J. Earth Environ. Sci. 2017, 2, 2–11. [Google Scholar] [CrossRef]
- Randriambahoaka, N. Investigation of a pico-hydropower plant performance by combining exergy analysis and global sensitivity analysis: A case study of Andriantseboka Analamanga Madagascar. J. Multidiscip. Eng. Sci. Stud. 2017, 3, 1296–1302. [Google Scholar]
- Bayrak, F.; Ertürk, G.; Oztop, H.F. Effects of partial shading on energy and exergy efficiencies for photovoltaic panels. J. Clean. Prod. 2017, 164, 58–69. [Google Scholar] [CrossRef]
- Yazdanifard, F.; Ameri, M. Exergetic advancement of photovoltaic/thermal systems (PV/T): A review. Renew. Sustain. Energy Rev. 2018, 97, 529–553. [Google Scholar] [CrossRef]
- Ehyaei, M.A.; Ahmadi, A.; Rosen, M.A. Energy, exergy, economic and advanced and extended exergy analyses of a wind turbine. Energy Convers. Manag. 2019, 183, 369–381. [Google Scholar] [CrossRef]
- Dhakouani, A.; Znouda, E.; Bouden, C. Impacts of energy efficiency policies on the integration of renewable energy. Energy Policy 2019, 133. [Google Scholar] [CrossRef]
- Trainer, T. Some problems in storing renewable energy. Energy Policy 2017, 110, 386–393. [Google Scholar] [CrossRef]
- Vega-Coloma, M.; Zaror, C.A. Environmental impact profile of electricity generation in Chile: A baseline study over two decades. Renew. Sustain. Energy Rev. 2018, 94, 154–167. [Google Scholar] [CrossRef]
- Ministerio de Energia. Energía 2050: Política Energética De Chile 2015. Available online: www.energia.gob.cl/sites/default/files/energia_2050_politica_energetica_de_chile.pdf (accessed on 2 September 2019).
- Arriagada, P.; Dieppois, B.; Sidibe, M.; Link, O. Impacts of Climate Change and Climate Variability on Hydropower Potential in Data-Scarce Regions Subjected to Multi-Decadal Variability. Energies 2019, 12, 2747. [Google Scholar] [CrossRef] [Green Version]
- Díaz, M.E.; Figueroa, R.; Alonso, M.L.; Vidal-Abarca, M.R. Exploring the complex relations between water resources and social indicators: The Biobío Basin (Chile). Ecosyst. Serv. 2018, 31, 84–92. [Google Scholar] [CrossRef]
- Banfield, C.C.; Braun, A.C.; Barra, R.; Castillo, A.; Vogt, J. Erosion proxies in an exotic tree plantation question the appropriate land use in Central Chile. Catena 2018, 161, 77–84. [Google Scholar] [CrossRef]
- Heilmayr, R.; Echeverría, C.; Fuentes, R.; Lambin, E.F. A plantation-dominated forest transition in Chile. Appl. Geogr. 2016, 75, 71–82. [Google Scholar] [CrossRef] [Green Version]
- Nahuelhual, L.; Carmona, A.; Lara, A.; Echeverría, C.; González, M.E. Land-cover change to forest plantations: Proximate causes and implications for the landscape in south-central Chile. Landsc. Urban Plan. 2012, 107, 12–20. [Google Scholar] [CrossRef] [Green Version]
- Echeverria, C.; Coomes, D.; Salas, J.; Rey-Benayas, J.M.; Lara, A.; Newton, A. Rapid deforestation and fragmentation of Chilean Temperate Forests. Biol. Conserv. 2006, 130, 481–494. [Google Scholar] [CrossRef]
- Zhu, Y.; Liang, J.; Yang, Q.; Zhou, H.; Peng, K. Water use of a biomass direct-combustion power generation system in China: A combination of life cycle assessment and water footprint analysis. Renew. Sustain. Energy Rev. 2019, 115, 109396. [Google Scholar] [CrossRef]
- Kharak, Y.K.; Thordsen, J.J.; Conaway, C.H.; Thomas, R.B. The Energy-Water Nexus: Potential Groundwater-Quality Degradation Associated with Production of Shale Gas. Procedia Earth Planet. Sci. 2013, 7, 417–422. [Google Scholar] [CrossRef] [Green Version]
- Charfeddine, L. The impact of energy consumption and economic development on Ecological Footprint and CO2 emissions: Evidence from a Markov Switching Equilibrium Correction Model. Energy Econ. 2017, 65, 355–374. [Google Scholar] [CrossRef]
- Adewale, A.; Victor, F.; Asumadu, S. Science of the Total Environment Dynamic impact of trade policy, economic growth, fertility rate, renewable and non-renewable energy consumption on ecological footprint in Europe. Sci. Total Environ. 2019, 685, 702–709. [Google Scholar] [CrossRef]
- Akif, M.; Sinha, A. Renewable, non-renewable energy consumption, economic growth, trade openness and ecological footprint: Evidence from organisation for economic Co-operation and development countries. J. Clean. Prod. 2020, 242, 118537. [Google Scholar] [CrossRef]
Figure 1.
System boundaries for the CES.

Figure 2.
Total demanded resources (CExC) of CES distributed by energy sources and technologies.

Figure 3.
Contribution of energy, water and land resources in CExC of CES.

Figure 4.
Cumulative degree of perfection (CDP) for each energy technology as a function of energy types.
Figure 4.
Cumulative degree of perfection (CDP) for each energy technology as a function of energy types.

Figure 5.
Correlation between CDP and CExC each resources and by type of technology. The specifically CExC for energy resource is depicted in (a); The CExC for water and land resources are shown in (b,c), respectively.
Figure 5.
Correlation between CDP and CExC each resources and by type of technology. The specifically CExC for energy resource is depicted in (a); The CExC for water and land resources are shown in (b,c), respectively.


Table 1.
The Chilean Electric System (CES) electricity generation. Year 2017 [30].
Table 1.
The Chilean Electric System (CES) electricity generation. Year 2017 [30].
| Type of Energy | Number of Plants | Electricity Generation (GWh) | Contribution (%) | |
|---|---|---|---|---|
| Non-Renewable Energy | Coal | 27 | 28,970 | 39 |
| LNG | 15 | 10,233 | 15 | |
| Natural gas | 15 | 2460 | 2 | |
| Diesel | 122 | 400.8 | 0.5 | |
| Fuel oil | 9 | 47 | 0.06 | |
| Petcoke | 1 | 436 | 0.6 | |
| Renewable Energy | Hydro | 172 | 21,728 | 29 |
| Solar | 97 | 3869 | 5 | |
| Wind | 28 | 3389 | 5 | |
| Biomass | 36 | 2770 | 4 | |
| Total | 522 | 74,304 | 100 | |
Table 2.
Standard chemical exergy of water and energy resources.
| Resources | Standard Chemical Exergy | Unit | Reference | |
|---|---|---|---|---|
| Energy | Coal | 30.5 | GJex/t | - |
| Diesel | 44.7 | GJex/t | [34] | |
| Natural gas | 0.10 | GJex/MJ | [34] | |
| Petcoke | 29.9 | GJex/t | [34] | |
| Fuel oil | 47.1 | GJex/t | [34] | |
| Water | Freshwater | 5 × 10⁻¹¹ | GJex/m3 | [34] |
Table 3.
Direct and indirect exergetic consumption for different energy types and resources (water, energy and land).
Table 3.
Direct and indirect exergetic consumption for different energy types and resources (water, energy and land).
| Type of Energy | CExC (GJex/MWh) | Direct Input (GJex /MWh) | Indirect Input (GJex/MWh) | |||||
|---|---|---|---|---|---|---|---|---|
| Energy | Water | Land | Energy | Water | Land | |||
| Non-Renewable Energy | Diesel | 0.1 | 0.06 | 1.2 × 10⁻¹⁵ | 1.1 × 10⁻⁴ | 0.07 | 3.5 × 10⁻¹³ | 6.2 × 10⁻⁵ |
| Natural gas | 0.8 | 0.3 | 0 | 9.8 × 10⁻⁵ | 0.4 | 1.2 × 10⁻¹³ | 1.9 × 10⁻⁴ | |
| LNG | 2.6 | 1.1 | 4.5 × 10⁻¹¹ | 1.0 × 10⁻⁴ | 1.44 | 4 × 10⁻¹³ | 6.2 × 10⁻⁴ | |
| Fuel oil N°6 | 0.01 | 0.01 | 0 | 0 | 0.01 | 3.3 × 10⁻¹⁴ | 6.1 × 10⁻⁶ | |
| Coal | 7.9 | 4.2 | 0 | 6.1 × 10⁻⁴ | 3.6 | 6.9 × 10⁻¹² | 3.8 × 10⁻² | |
| Petcoke | 0.1 | 0.07 | 1.1 × 10⁻¹¹ | 8.9 × 10⁻⁶ | 0.02 | 9.5 × 10⁻¹⁴ | 1.9 × 10⁻⁵ | |
| Total | 11.5 | 5.8 | 5.7 × 10⁻¹¹ | 9.4 × 10⁻⁴ | 5.6 | 7.9 × 10⁻¹² | 3.9 × 10⁻² | |
| Contribution (%) | 67 | 34 | 3.3 × 10⁻¹⁰ | 5.4 × 10⁻³ | 33 | 4.5 × 10⁻¹¹ | 0.2 | |
| Renewable Energy | Solar | 1.4 | 1.4 | 0 | 1.3 × 10⁻³ | 0 | 0 | 0 |
| Wind | 1 | 0.9 | 0 | 1.1 × 10⁻⁴ | 0 | 0 | 0 | |
| Hydro | 2.2 | 2.2 | 0 | 3.1 × 10⁻³ | 0 | 0 | 0 | |
| Biomass | 1.1 | 1.1 | 0 | 4.7 × 10⁻⁵ | 0 | 0 | 0 | |
| Total | 5.8 | 5.8 | 0 | 4.6 × 10⁻³ | 0 | 0 | 0 | |
| Contribution (%) | 33 | 32.7 | 0 | 2.6 × 10⁻² | 0 | 0 | 0 | |
© 2019 by the authors. Licensee MDPI, Basel, Switzerland. This article is an open access article distributed under the terms and conditions of the Creative Commons Attribution (CC BY) license (http://creativecommons.org/licenses/by/4.0/).
Share and Cite
MDPI and ACS Style
Rodríguez-Merchan, V.; Ulloa-Tesser, C.; Casas-Ledón, Y. Evaluation of the Water–Energy–Land Nexus (WELN) Using Exergy-Based Indicators: The Chilean Electricity System Case. Energies 2020, 13, 42. https://doi.org/10.3390/en13010042
AMA Style
Rodríguez-Merchan V, Ulloa-Tesser C, Casas-Ledón Y. Evaluation of the Water–Energy–Land Nexus (WELN) Using Exergy-Based Indicators: The Chilean Electricity System Case. Energies. 2020; 13(1):42. https://doi.org/10.3390/en13010042
Chicago/Turabian StyleRodríguez-Merchan, Vanesa, Claudia Ulloa-Tesser, and Yannay Casas-Ledón. 2020. "Evaluation of the Water–Energy–Land Nexus (WELN) Using Exergy-Based Indicators: The Chilean Electricity System Case" Energies 13, no. 1: 42. https://doi.org/10.3390/en13010042
Note that from the first issue of 2016, this journal uses article numbers instead of page numbers. See further details here.