Variable Renewable Energy and Market Design: New Products and a Real-World Study


1
LNEG–National Laboratory of Energy and Geology, Est. Paço Lumiar 22, 1649-038 Lisbon, Portugal
2
Instituto Superior Técnico, 1049-001 Lisbon, Portugal
*
Author to whom correspondence should be addressed.
Energies 2019, 12(23), 4576; https://doi.org/10.3390/en12234576
Submission received: 14 October 2019
/
Revised: 22 November 2019
/
Accepted: 27 November 2019
/
Published: 30 November 2019
(This article belongs to the Special Issue Multi-Agent Energy Systems Simulation)
Abstract
:Most existing energy markets (EMs) were not designed to take into account an active participation of variable renewable energy (VRE). This situation results typically in imbalances and substantial costs in balancing markets. Such costs are reflected both in the energy and the VRE parts of the consumer tariffs. Both appropriate market products and new elements of market design may largely facilitate the large-scale integration of VRE in EMs. Accordingly, this article presents a new bilateral energy contract and introduces two new marketplaces that can contribute to reduce the imbalances resulting from VRE producers. It also presents a study conducted with the help of an agent-based tool, called MATREM. The results indicate a significant decrease in the imbalances and the associated costs.
1. Introduction
Energy markets (EMs) are a complex and continuously evolving reality, meaning that new players are emerging—chief among these are the producers of variable renewable energy (VRE)—and new challenges need to be managed—such as the ones associated with the participation of VRE producers in competitive markets [1,2]. Indeed, recent years have witnessed a substantial increase of non-controllable or variable renewable energy, notably wind power and solar photovoltaic. VRE has several unique characteristics compared to those of conventional generation, including significant fixed capital costs but near-zero or zero production costs. VRE is also normally the marginal resource, since it is operated at maximum capacity (taking into account the weather conditions). These characteristics have a strong influence on the outcomes of EMs, reducing market-clearing prices [3]. Accordingly, the research community has paid attention to the effectiveness of current market designs to determine if they are still efficient to deal with the increasing levels of VRE (see, e.g., [4,5]).
VRE typically involves significant forecast errors, which may result in large imbalances. The day-ahead market (DAM) closes normally at 12:00 p.m. (CET), and thus the bids of wind power producers need to be calculated by taking into account power forecasts computed 12 to 36 h ahead. As a result, an adjustment of the gate closure to a time closer to real-time operation seems to be important to enable a fair participation of VRE producers. The differences between the quantities of energy produced and the commitments resulting from the DAM need to be balanced in the intra-day market and/or the balancing market. At present, the participation of VRE producers in balancing markets (BMs) is still very limited, despite the technical feasibility and the (potential) motivation to operationalize such participation.
To address the issues associated with the participation of VRE producers in markets, adaptations to the current market structure as well as new elements of market design have been proposed by theorists and practitioners working on the area of competitive energy markets. For instance, the International Energy Agency points out that the physical transactions of electrical energy in power systems with high shares of VRE need to be made by considering auctions and centralized pools, and should not take into account feed-in-tariffs or other supporting schemes. The process of trading energy also needs to be improved by defining the terms of the transactions up to 30 min before real-time operation with an interval up to 10 min [6]. This near real-time negotiation is also supported by the Clean Energy Package (Article 7), published by the European Commission [7]. In this package, a new proposal for regulating the Internal Market for Electricity is presented, with the main goals of stimulating the global leadership of Europe in renewables, harmonizing markets rules, supporting the integration of VRE, and increasing the general welfare of consumers (see [8] for a complete overview). Article 6 of the new proposal indicates that market operators should develop new products to accommodate the increasing levels of VRE and support demand-response programs.
Now, generally speaking, European markets typically allow bidding up to 5 to 30 min before real-time operation, contributing to reduce the imbalances resulting from VRE producers. The markets of North-America and Australia present some additional flexibility by including 5-min real-time (sub-)markets. Despite this, most real-world markets operate by considering power (MW) and not energy (MWh), thus allowing to some extent substantial deviations of VRE producers.
Against this background, this article presents a new bilateral energy contract, called short-term energy (STE) contract, and introduces two new marketplaces that may allow to reduce the imbalances resulting from VRE producers (we note that throughout the article the terms “new marketplace” and “new market product” will be used interchangeably). The main aim is to enable an active and competitive participation of VRE producers in energy markets, decreasing imbalances and the associated costs, and to some extent avoiding the waste of energy. The new contract and the design of the new marketplaces take into account the following aspects: legal basis, market time unit, minimum bid quantity, transaction time horizon, type of market participant, and the role of participants in the process of trading energy. The authors are aware of no similar market products in place in the real-world.
Furthermore, the article presents a simulation-based study to analyze the behavior (and test) the new contract and the design of the new market places in a real-world setting. The study involves the participation of both wind power producers (WPPs) and retailers in markets, who prepare bids according to different strategies. The simulations are performed with the help of the agent-based tool called MATREM (see [9,10]). Six key performance indicators (KPIs) are considered, namely the value of wind energy to the market, the global imbalances of the system, the imbalances and costs of WPPs and retailers, and the total cost of the system.
The work presented here builds on our previous work in the areas of trading wind power in markets [11,12] and portfolio optimization of retailers [13]. Specifically, in [11], we investigated the benefits of the participation of WPPs in BMs at both economic and technical levels. In [12], we analyzed the impact of the wind power forecast uncertainty and the change of the day-ahead market gate closure on market outcomes. In [13], we introduced a model for optimizing the portfolios of retailers using the Markowitz theory. In this paper, as noted, we present and test a contract and two marketplaces related to the participation of VRE producers in energy markets.
The remainder of the paper is structured as follows. Section 2 presents the main features of existing energy markets. Section 3 discusses the participation of VRE producers in balancing markets. Section 4 presents the new energy contract and Section 5 the new marketplaces. Section 6 summarizes the features of the MATREM system. Section 7 illustrates the trading behavior of WPPs by taking into account the new contract and marketplaces. Section 8 presents the simulation-based study and discusses the experimental results. Finally, Section 9 presents some concluding remarks.
2. Energy Markets and VRE Producers
Day-ahead markets close typically at 12:00 p.m., 12 to 36 h before physical delivery. Market participants trade energy on exchanges or pools using programs based on the system marginal pricing theory. Prices and quantities are calculated in a specific day D for every hour of day . Intra-day markets are essentially markets involving scheduling and pricing procedures a few hours ahead to facilitate balancing in advance of real-time. Such markets may involve various sessions based on auctions or may operate continuously (see, e.g., [14]). Most American markets also include a short term market, generally referred to a real-time market, to set prices and schedules for 5-min periods (but see [3]).
Derivatives are financial instruments that include forwards, futures, options and swaps [15]. These instruments are essentially contracts to buy or sell a specific amount of electricity at a certain future time for a specific price. They may span from days to several years and allow market participants to hedge against the financial risk inherent to day-ahead and intra-day prices [16]. Also, they may be financial (involving a purely financial settlement) or physical (involving a financial settlement and the physical delivery of energy), and are typically traded in derivatives exchanges. In short, market participants submit orders to sell or buy electricity in an electronic trading platform. Orders include the quantity and the price as well as several other parameters that are deemed appropriate. The trading platform automatically and continuously matches the orders that are likely to interfere with each other (typically, for a particular type of contract and a specific energy price). Also, apart from derivatives exchanges, bilateral contracts—such as forwards and swaps—may be negotiated privately between two parties. The terms of such contracts are very flexible and can be defined to meet the objectives and needs of both parties (but see [17] for a more in-depth discussion).
Balancing markets are imposed by the European Network of transmission system operators and allow to compensate the deviations from the schedules defined in day-ahead and intra-day markets, as well as in bilateral contracts. The players that deviate typically need to pay penalties. The system operators have access to reserve capacity for the provision of system services, namely primary reserve (or frequency control reserve), secondary reserve (or fast active disturbance reserve), and tertiary reserve (or slow active disturbance reserve). Primary reserve is the first to be activated, after grid disturbances or imbalances between production and consumption. It must be activated up to 15 s and the disturbances need to be controlled in 30 s. Secondary reserve should be fully activated in 30 s and can continue active for a maximum of 15 min. Tertiary reserve is activated manually, up to 15 min, and can continue active for hours (see, e.g., [8]).
Secondary and tertiary reserve are traded by system operators in day-ahead tenders. In short, these agents define the needs of the power system for up and down-regulation, receive the proposals of the authorized participants, and determine schedules and prices by using an algorithm based on the system marginal pricing theory. Typically, different simulations are performed for computing the price for up and down-regulation. Now, apart from bilateral contracts and derivatives exchanges, balancing markets are most important for the work described here, and the next section is devoted to the participation of VRE producers in such markets.
3. Participation of VRE Producers in Balancing Markets
3.1. Status of some European Countries and Product Analysis
Considering the technical feasibility of the participation of wind power producers in balancing markets, several authors acknowledge this possibility, in case the current market rules and product specifications are adapted (see, e.g., [18,19,20]). In this way, and although with some restrictions, notably the fact that WPPs need to prepare bids aggregated with conventional generation, Spain [18], Germany [19] and Denmark [20] have already allowed the participation of WPPs in BMs (although for downward regulation only).
Great Britain allowed WPPs to participate in two curtailment products, namely “manage constraint” and “rebalance system”, receiving 40% more money to curtail energy than to produce it, which is often not considered an efficient way to use VRE (but see [21]). In Belgium, some researchers studied the participation of WPPs in BMs, considering the downward automatic-activated frequency restoration reserve (aFRR), obtaining a reliability higher than 90% (see [22]). And for the case of EU-28, a study considering the participation of WPPs, solar producers and other renewable energy producers in BMs, indicated a reduction of 6% in the costs associated with such markets [23].
Now, considering existing and emerging market products associated with VRE producers and BMs, the provision of reactive power may be considered an important product [24]. Also, primary reserve is a potential product for VRE producers, contributing to compensate the disadvantage of a reduced inertia in power systems with high levels of VRE [25]. Photovoltaic systems do not have mass inertia and can adjust their output within milliseconds. Wind turbines can deliver primary reserve faster than is currently required. Also, wind turbines can deliver synthetic inertia, which can solve the problem of the reduced inertia of the grid due to high shares of VRE [26]. In this way, the well-known ramping products [27] and the P2X solutions [28] are important aspects to explore. We note, however, that fast ramping schedules in frequency control ancillary services (FCAS) can avoid the curtailment of VRE, although some limitations prevent an adequate participation of VRE producers (e.g., fixed sloping schedules). Also, the prices associated with power to X solutions (P2X), such as power-to-hydrogen, are currently very low.
All of the mentioned “products”share a common shortcoming: they contribute to an increase of the waste of energy or curtailment of VRE, by making VRE producers participating in non-optimal schedules. Furthermore, all of them consider the technical capabilities of VRE, instead of the optimal use of VRE without curtailments, wasting energy and allowing a large (short-term) interaction between market participants, notably VRE producers, retailers and transmission system operators (TSOs).
3.2. Bid Preparation and Energy Deviations
The participation of VRE producers in balancing markets involves the preparation and submission of bids, typically for a period of one hour, creating large difficulties for producers to keep a stable and efficient operation without curtailments or deviations. Specifically, WPPs need to bid their expected active power, , in day-ahead and intra-day markets, based on forecasts that use time horizons between 18 h and 42 h (for DAMs), and between 2 h and 7 h (for intra-day markets), ahead of real-time operation. At real-time, considering the data obtained from wind parks, there is the possibility to compute the average production, , for a particular period of time T.
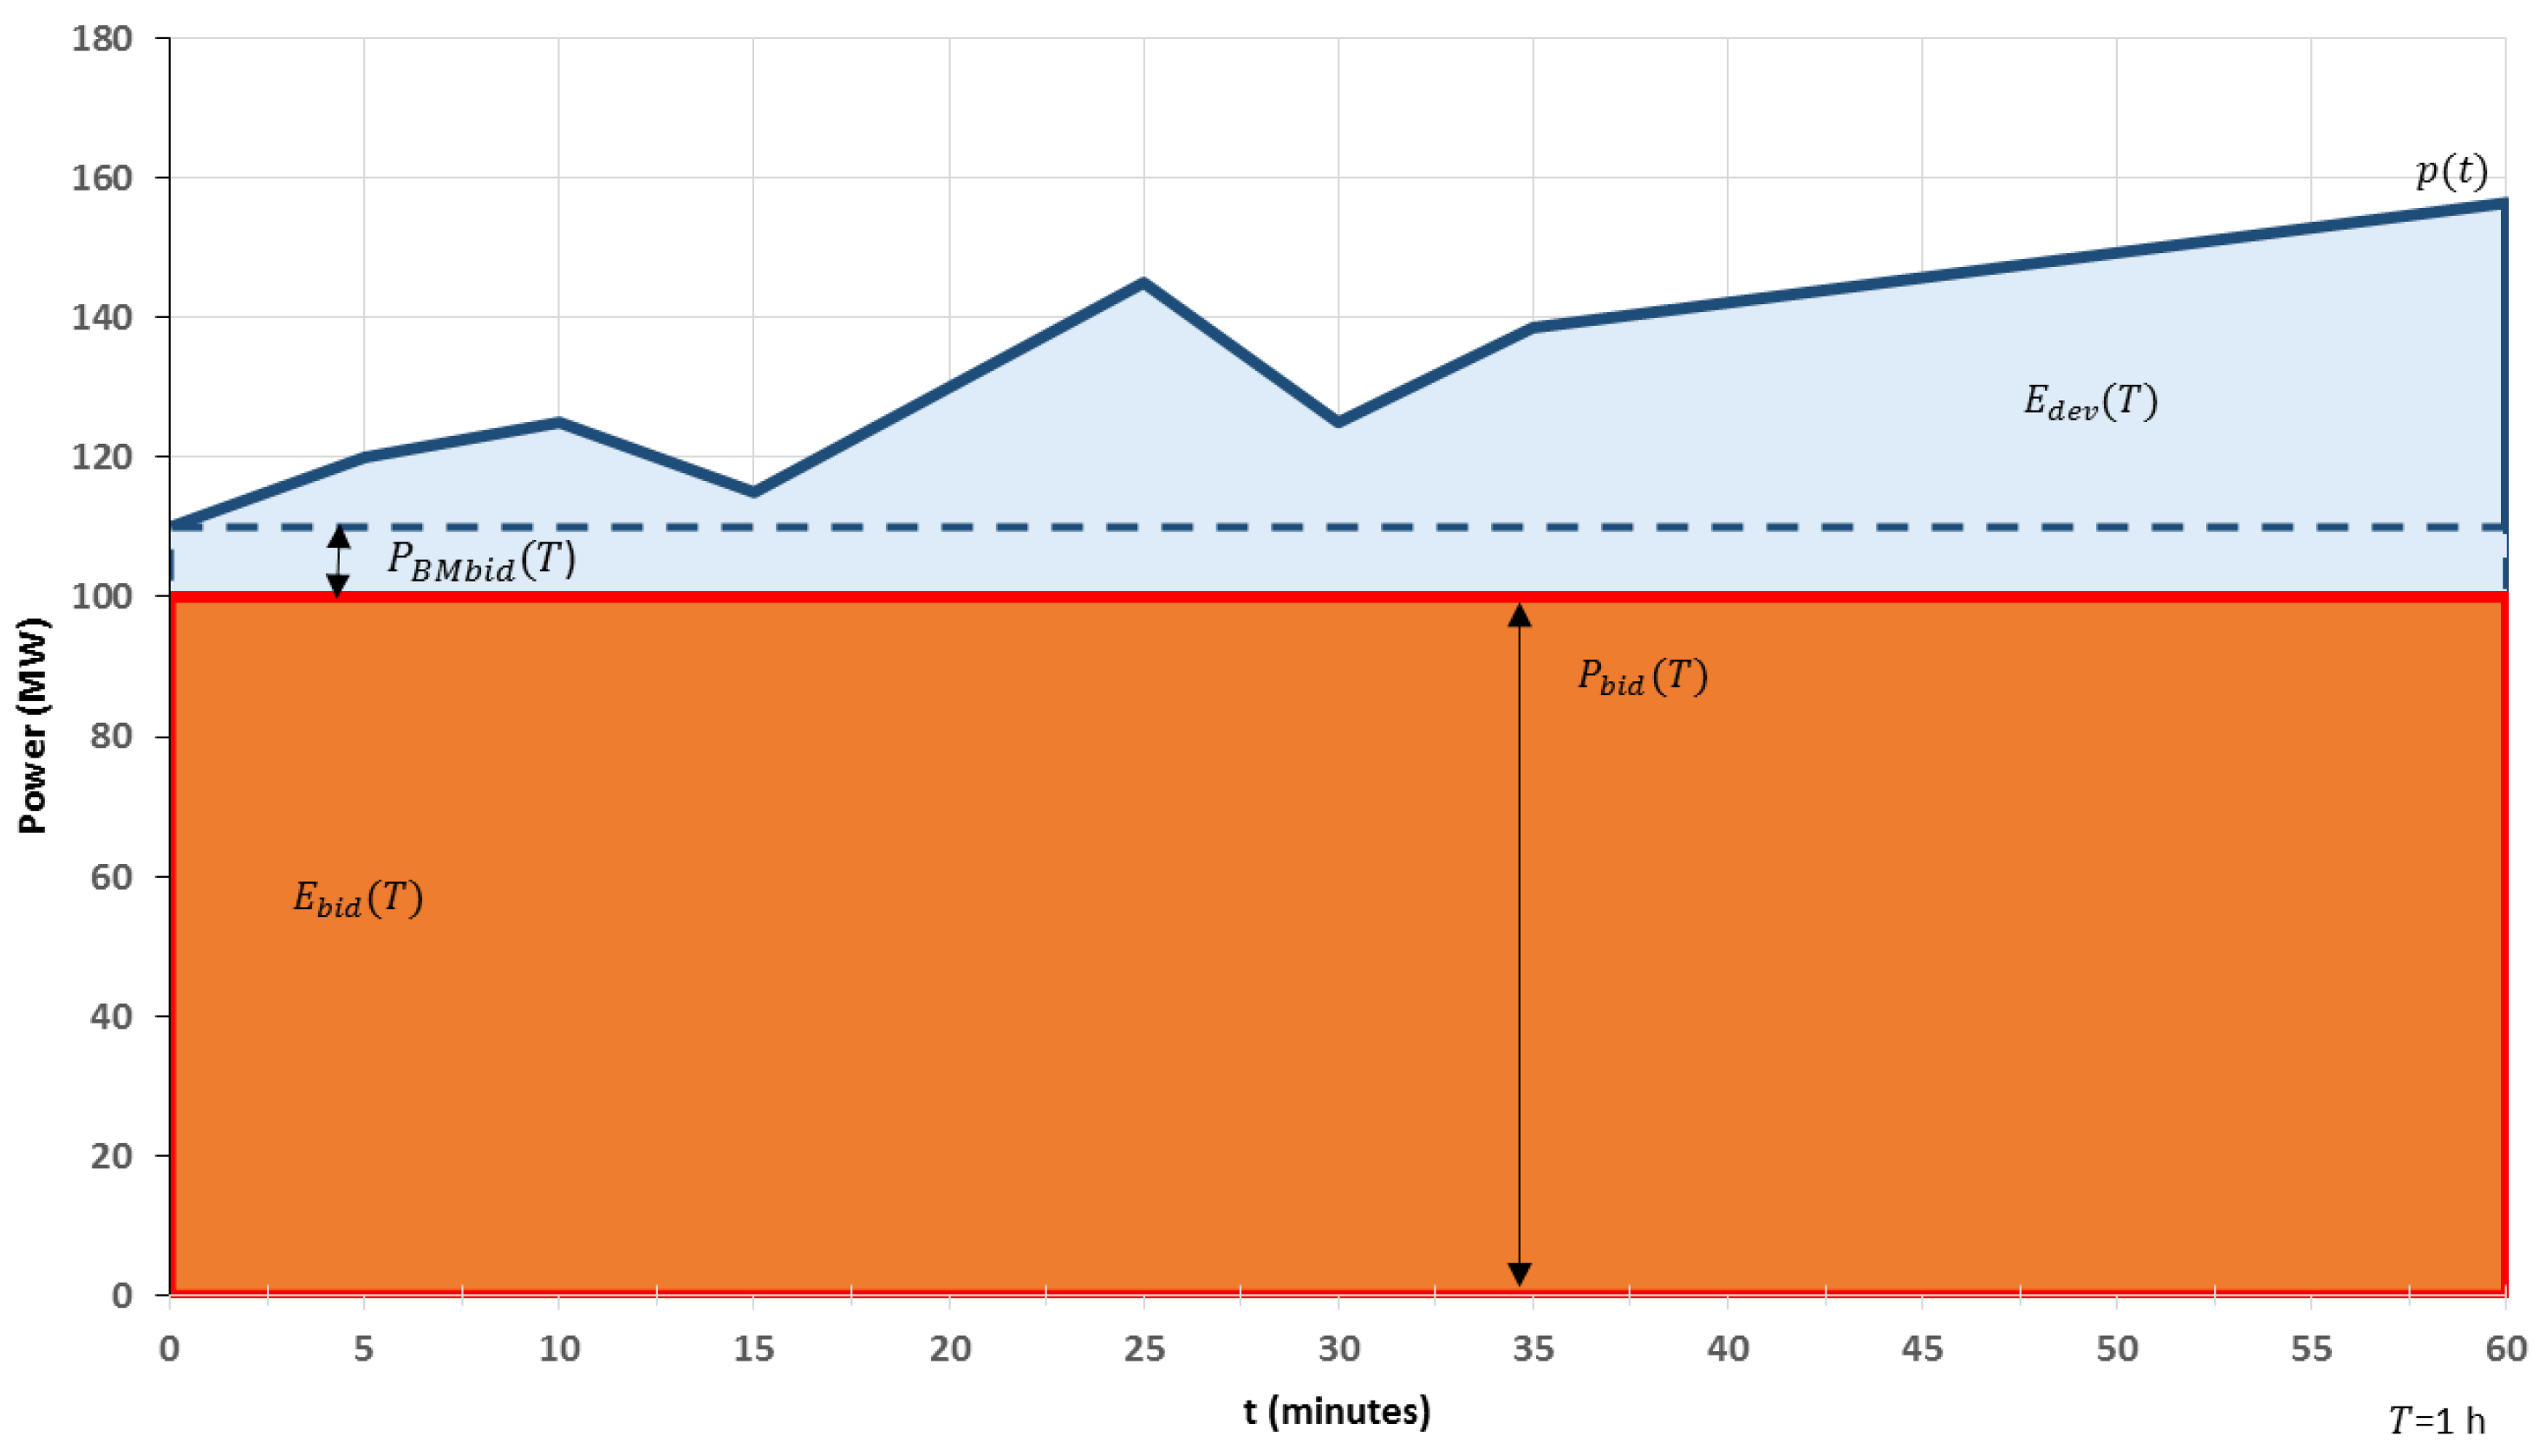
From the point of view of the grid, WPPs produce instantaneous power, , based on the wind speed, the characteristics and power of wind turbines and the configuration of wind parks. The energy, , produced during a period of time T, is computed as follows:
The deviation, , in period T is given by the following formula:
Figure 1 illustrates the relation between these variables for a particular hour of operation (). It shows the traded/scheduled power, , of a particular wind power producer in the day-ahead market (red curve). The corresponding energy, , is represented by the orange area. The real production of the wind power producer is given by (solid blue curve). The difference between the instantaneous power and the scheduled power gives the energy deviation, , which is represented by the light blue area.
Considering now that wind power producers are allowed to make only single bids in the balancing market (i.e., bids without considering aggregation of WPPs), the maximum expected power that they can submit, , is defined by the difference between the minimum instantaneous deviation and the traded power:
where , and the bid is of the type upward regulation, i.e., (for a downward regulation bid, consider the maximum instead of the minimum, and ).
Figure 1 shows that the submission of to the balancing market, and its subsequent acceptance by the system operator, results in a waste of energy (the difference between the dashed and solid blue curves). For the particular case of the secondary reserve market, the waste of energy may be even larger than that. Accordingly, existing products associated with the balancing market may not be considered adequate to deal with the variability and uncertainty of VRE. A possible solution to overcome the problem is to consider aggregated bids involving VRE producers and conventional generation. However, not all power systems allow aggregated bids, specially for the case of BMs.
4. The Short-Term Energy Contract
The short-term energy (STE) contract is a new type of bilateral contract—and to some extent a new market product—that presents some similarities with the aforementioned bilateral contracts, although there are obvious differences. The specifications of the contract are shown in Table 1. It has the goal of allowing agents to reduce/avoid imbalances and consequently the potential payment of penalties—that is, it is not a profit-seeking product. Accordingly, the energy price is pre-defined as the market-clearing price (DAM price) for the period under consideration. The minimal energy quantity is 0.1 MWh. Agents submit to a trading platform bids involving specific energy quantities for periods of 15 min (and not one hour). Bids may be new or associated with energy deviations and should be submitted up to one hour prior to real-time operation. Buy and sell bids likely to interfere with each other generate transactions and new contracts. To this end, the trading platform takes into account energy quantities only (quantities may be either fully or partially matched). Bids associated with deviations have priority over new bids and are matched according to a principle of equity. Physical delivery is done in strict accordance with transmission system operators, who are informed about the terms and conditions of new contracts (energy price, energy quantity, etc.).
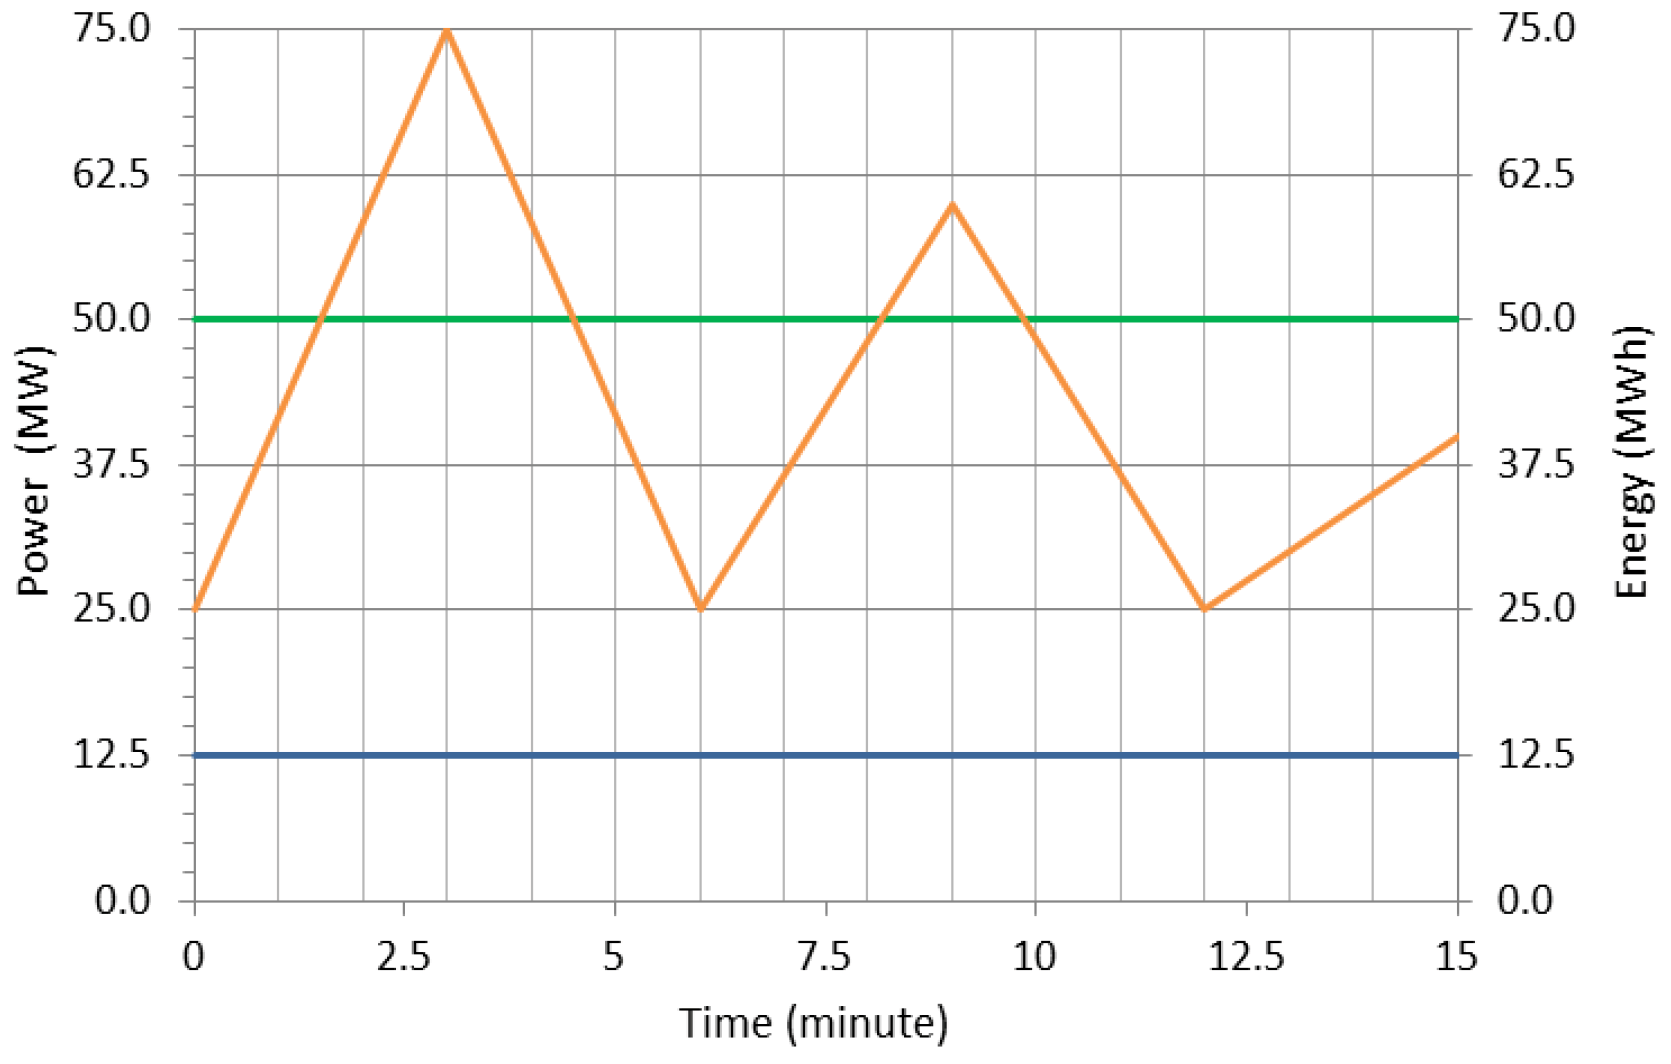
Now, an important feature—and to the best of our knowledge—a novel feature of the STE contract is the inherent aspect of considering energy and not power. Figure 2 illustrates this aspect by depicting bids involving either power (green line) or energy (blue line). Bids are assumed to be simple and consist of quantities and other parameters that are deemed appropriate (e.g., match type). The settlement period has the duration of 15 min. Existing bilateral contracts consider typically a quantity based on power, meaning that power plants should follow a constant production schedule during the settlement period (green line of Figure 2, corresponding to a quantity of 50 MW). This may not be adequate for wind power producers and other VRE producers due to the uncertainty and variability of renewable generation. Accordingly, the SET contract considers a quantity based on energy—that is, power plants do not necessarily need to follow a constant production schedule during the settlement period (orange line of Figure 2, corresponding to an average quantity of 12.5 MWh). This typically leads to a decrease of the imbalances and the associated costs (but see the real-world study presented in Section 8). Overall, despite the existence of a number of contracts traded in energy markets worldwide, such as daily future contracts or even 15-min base and peak contracts (see, e.g., [29,30]), it is especially noteworthy that we are aware of no contracts similar to the short-term energy contract. At this stage, we note that an appealing alternative to the short-term energy contract involves the submission of both energy price and energy quantity (instead of energy quantity only). However, energy would be traded at different prices and, to some extent, some transactions would not be considered due to the mismatch of price.
5. Trading Reserve Capacity
5.1. Renewable Power Band Marketplace
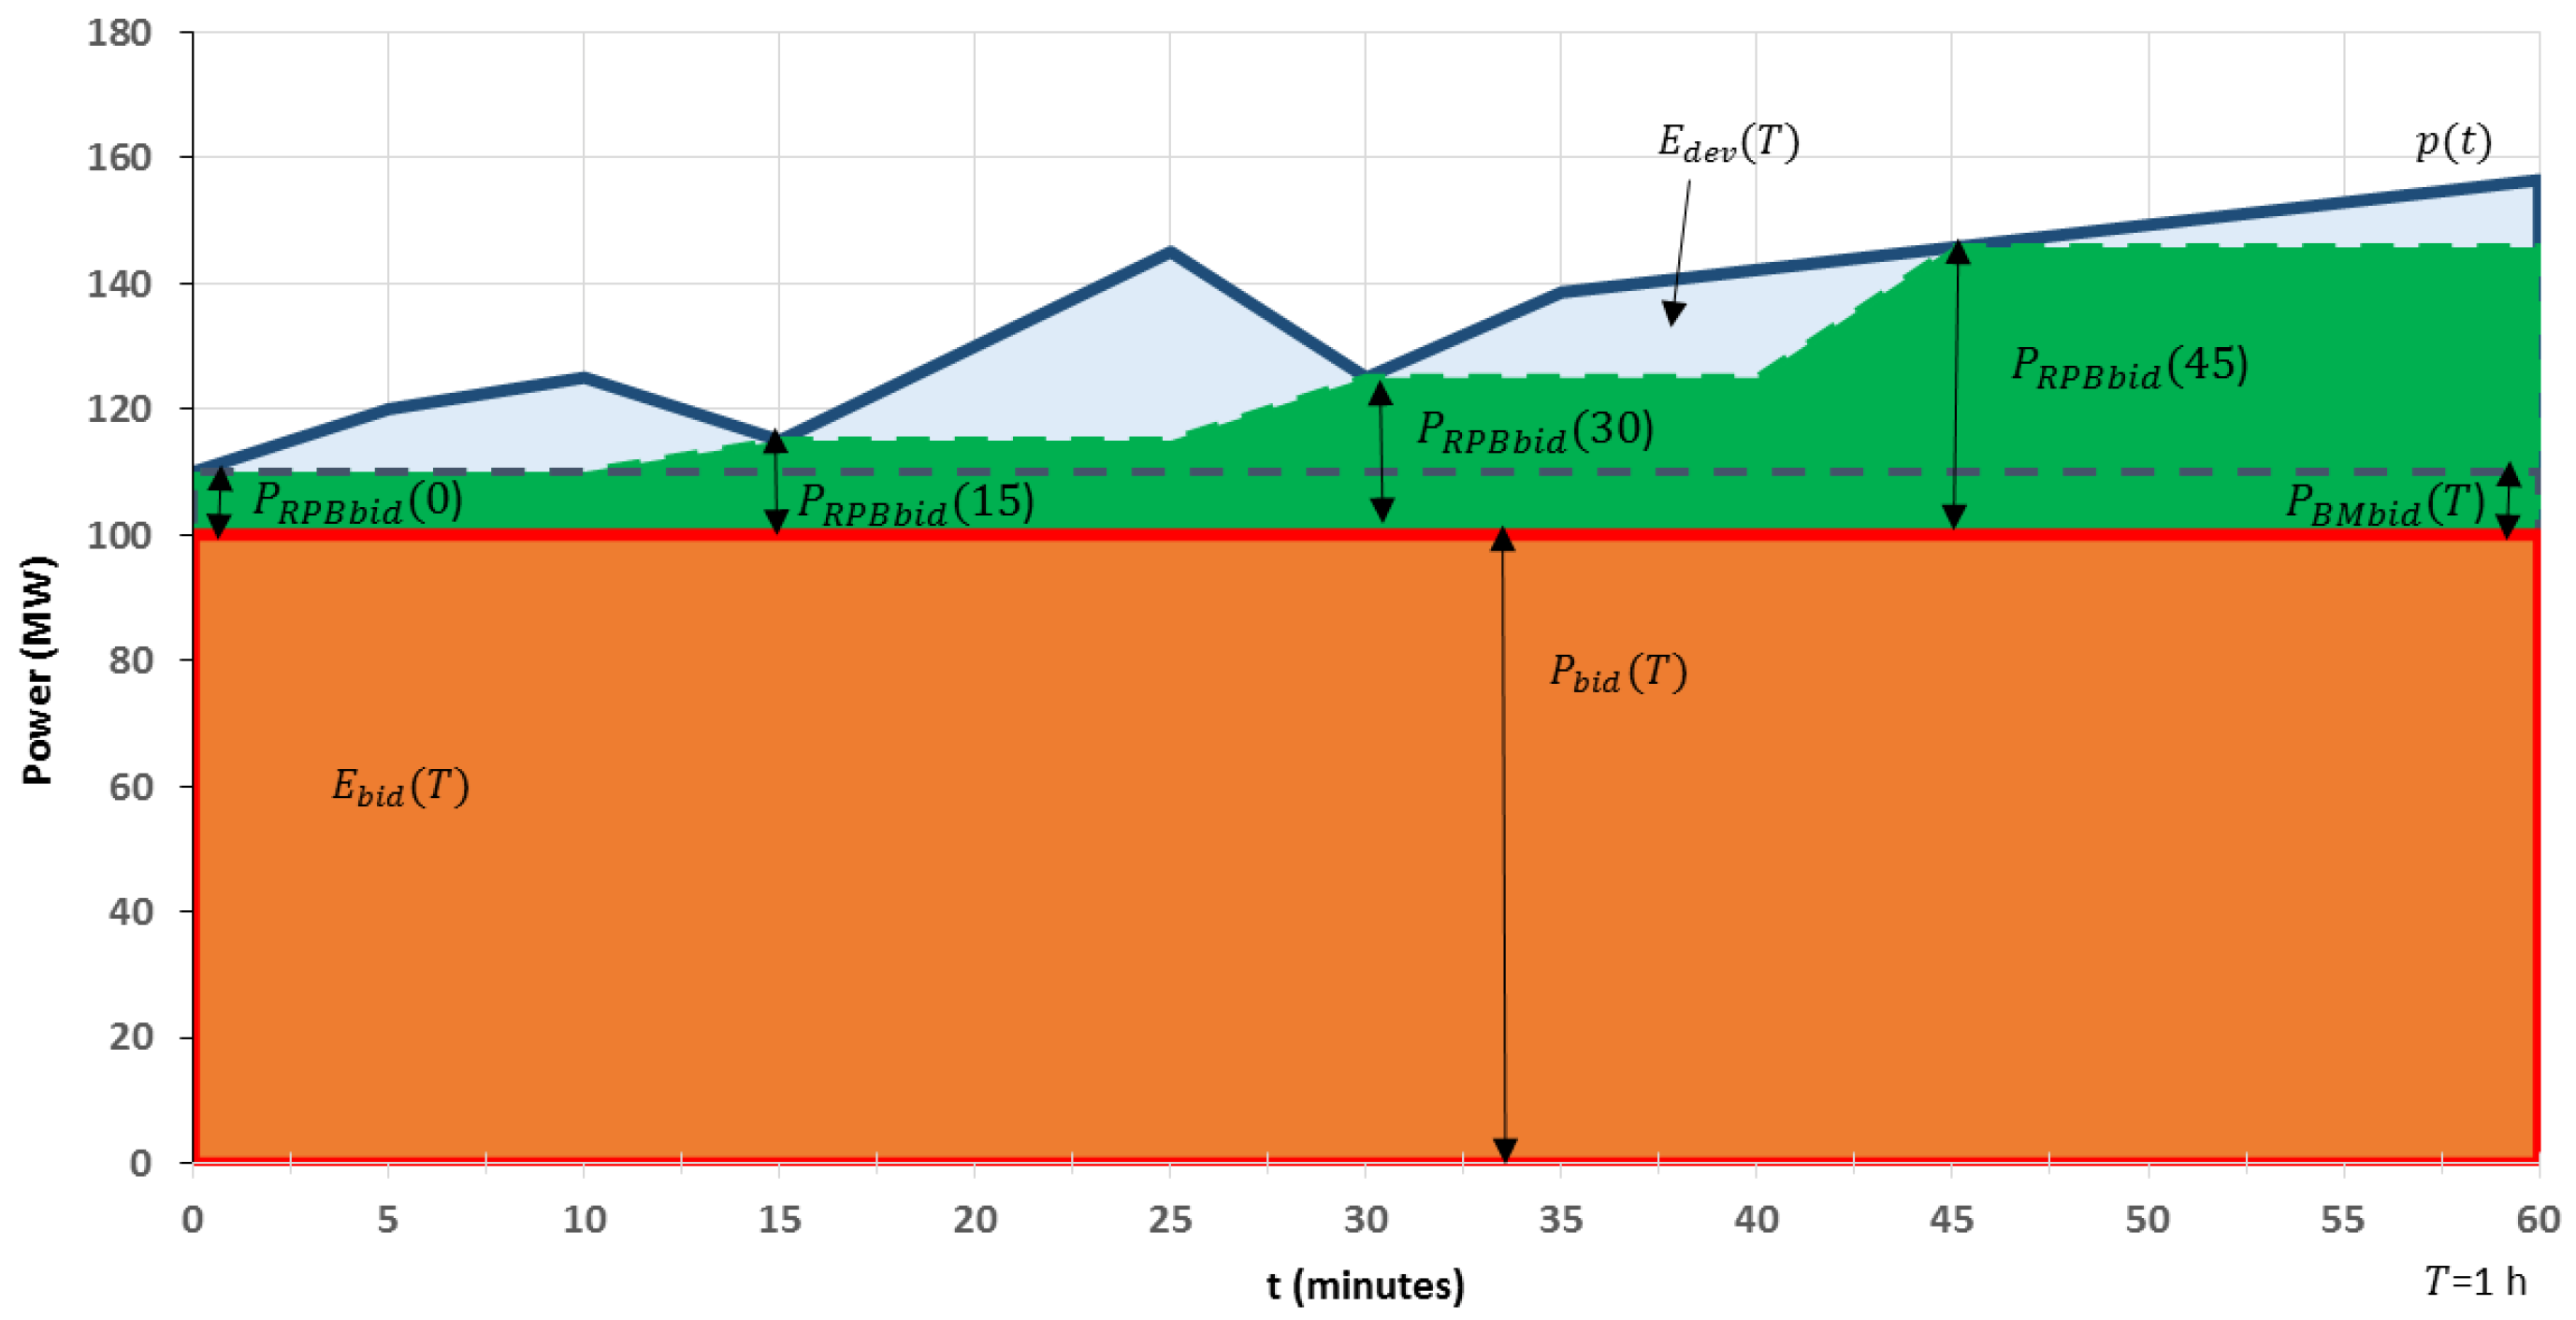
As noted earlier, the work published in [11] analysed the benefits of the participation of wind power producers in balancing markets at both economic and technical levels. We found that a reduction of the market time unit from 1 h to 15 min is beneficial to WPPs. Accordingly, this section considers a market time unit of 15 min—that is, WPPs submit bids for periods of 15 min, and not for periods of 1 h. In other words, capacity reserve is traded for 15-min periods. To this end, we also consider that VRE producers participate in this marketplace by using the frequency control capacity, offering a power band for each 15-min period, and thus participating with scarce real-time instantaneous power. The upper limit should be lower than the expected optimal power, and the lower limit should be higher than the technical capacity of VRE producers to reduce generation from an optimal (or intermediary) level to a lower one. Also, bids may involve either positive or negative power intervals and not necessarily intervals ranging from negative to positive values, as typically happens in existing secondary reserve markets. Market participants are allowed to submit bids till 15 min prior to real-time operation. They are remunerated by the secondary reserve price. Table 2 presents some important features of this marketplace. Figure 3 illustrates the trading behavior of VRE producers, by showing the different bids and the associated deviations, for a period of one hour.
Figure 3 is, to some extent, similar to Figure 1, which shows the traded/scheduled power, , the corresponding energy, , the real production of a wind power producer, , and the energy deviation, . In addition, Figure 3 also shows the lack of deviations resulting from the participation in this marketplace—that is, the deviations that are avoided by WPPs—represented by the green area (see also Section 8).
VRE producers should guarantee that they are able to comply with their bids (in order to avoid the payment of penalties). Accordingly, for each 15-min period, the maximum power that they can bid, , is given by the difference between the minimum deviation and the traded bid (see Equation (3)). The wasted energy associated with the accepted bids is equal to the area between the solid blue curve and the dashed green curve (see Figure 3).
5.2. Energy Reserve Marketplace
Again, as indicated in the previous subsection, the market time unit is assumed to be 15 min—that is, VRE producers submit bids for periods of 15 min. Specifically, WPPs offer their energy (MWh) at a near-zero price—that is, bids involve energy, instead of power—and the other market participants typically submit bids at higher prices. All bids are ranked with increasing price (merit-order). The transmission system operator, a non-commercial organization, independent of commercial players, constitutes the demand side. In case this agent is procuring up regulation, the up-regulation bids with lowest prices are activated until the procured quantity is reached. The price of the last up-regulated quantity sets the up-regulation price. The bids with prices below the up-regulation price have a profit, equal to the difference between the final regulation price and the offered price. A similar procedure is used to find the down-regulation price. Players are allowed to submit bids till 15 min prior to real-time operation. They are remunerated by the market-clearing price (tertiary reserve price). Table 3 presents some important features of this marketplace.
Overall, VRE producers submit their deviations (MWh) to this marketplace and inform TSOs of the magnitude of the errors, thus avoiding to some extent the payment of large penalties (but see Section 8). It is worth noting that to increase competition in the market VRE producers may submit bids including a higher price (i.e., a price higher than a near-zero price). Specifically, for up-regulation, the price may be equal to the price of the first ranked offer (minimal price). For down-regulation, the price could be defined in a similar way (i.e., the price of the first ranked offer, or maximal price).
6. Main Features of the MATREM System
MATREM (for Multi-Agent TRading in Electricity Markets) is an agent-based tool for simulating the behavior of competitive energy markets. In [9], we present a detailed description of the system, and in [10] we classify the system according to a number of dimensions associated with both electricity markets and intelligent agents. The remainder of this section gives an overview of MATREM.
The system supports a day-ahead market (DAM), an intra-day market (IDM), a futures market, and a balancing market (BM). The DAM is a central market where generation and demand are traded on an hourly basis [31]. The IDM is a short-term market that involves several auction sessions. Both markets operate according to the marginal pricing theory and are controlled by a market operator agent. Two pricing mechanisms are supported: system marginal pricing (SMP) and locational marginal pricing (LMP). The futures market is a market to hedge against the financial risk (i.e., the price volatility) associated with the DAM and the IDM. It is an organized market for both financial and physical products, which may span from days to years. The balancing market is a market for the provision of system services. MATREM considers three types of reserve, namely primary reserve, secondary reserve and tertiary reserve. The stability of the power system is a task associated with a system operator agent, who is responsible for the operation of this market.
The system also supports a marketplace for negotiating tailored (or customized) bilateral contracts, notably contracts defined to cover the delivery of large amounts of electrical energy over long periods of time. Two types of contracts are considered: forward contracts and contracts for difference [32]. The negotiating parties are equipped with a model that handles two-party and multi-issue negotiation. The negotiation process is an iterative process involving an exchange of offers and counter-offers [33,34,35].
Market participants are modeled as software agents and include generating companies, retailers, aggregators, traditional consumers, coalitions of consumers, market operators and system operators. VRE aggregators allow the participation of WPPs and other VRE producers in the aforementioned markets. Coalitions of consumers are essentially alliances of end-use customers with the main goal of increasing their bargaining power. The system platform is a 32/64-bit computer running the JAVA programming language and the JADE platform [36].
7. Trading Behavior of Wind Power Producers
As noted earlier, most existing energy markets, including the Iberian electricity market [37], were not designed to deal with large levels of non-dispatchable generation. MIBEL includes a day-ahead market and an intra-day market, managed by the Spanish electricity market operator (OMIE [38]), as well as a derivatives market, managed by the Portuguese electricity market operator (OMIP [39]). Market participants submit hourly bids to trade energy in the day-ahead market. The IDM involves six auction sessions, with gate-closures between 1 and 5 h ahead of real-time operation. The derivatives market allows private parties to trade standardized bilateral contracts.
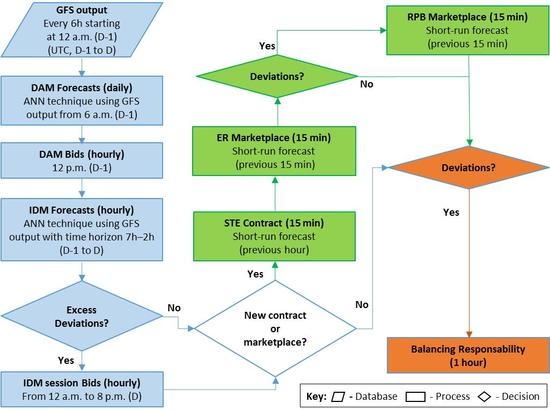
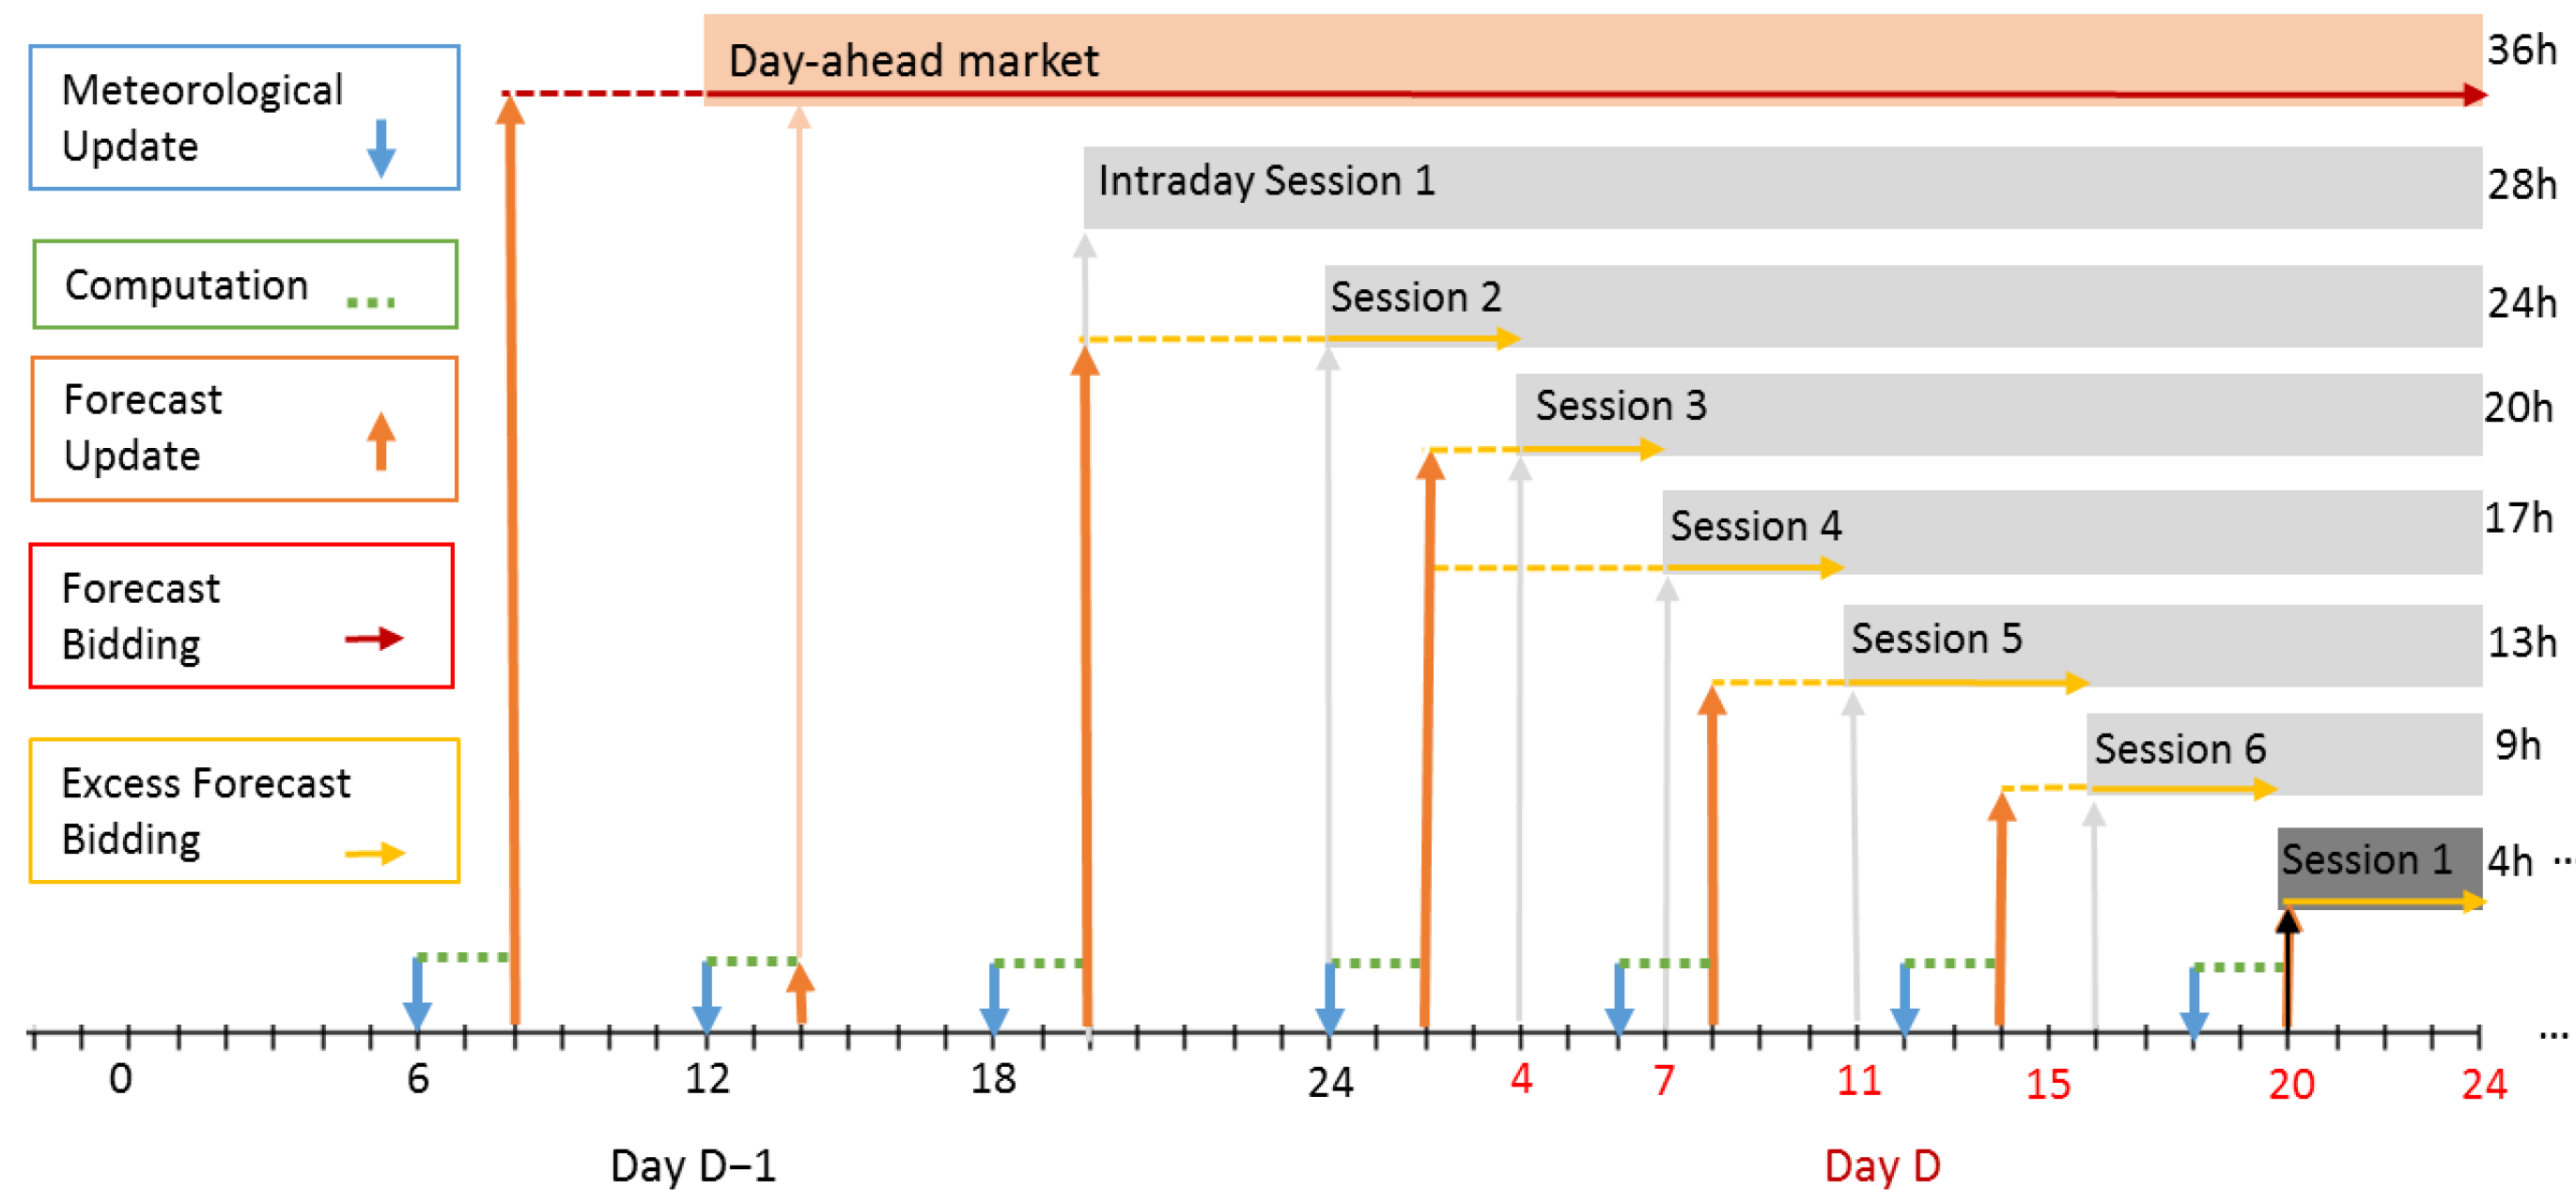
Figure 4 shows the typical trading behavior of WPPs in the DAM and the IDM, which takes into consideration the most reliable meteorological data, in order to minimize deviations. WPPs submit wind power forecasts in the day-ahead market during day , and make commitments to produce specific quantities of energy for day D. The bids to submit to the intra-day market are essentially deviations—that is, they are computed by taking into consideration the actual commitments and the current updates of the wind power forecasts.
In this work, the forecasts are obtained by considering the Neural Network Toolbox and the artificial neuronal networks (ANN) approach [40]. ANN is typically organized in layers, namely the input, hidden, and output layers. Each layer covers one or more nodes that represent the basic unit of information process (also known as the neuron). The main advantage of the ANN is the capability to deal with nonlinear relationships by learning the association between the predictors and predictions.
Numerical weather prediction (NWP) models present systematic errors, which are mainly associated with the following: (i) initial and boundary meteorological conditions (ICs), (ii) a poor representation of the physics of the models, and (iii) a failure to solve sub-grid scale phenomena, such as the sea-land interaction. The data to feed the NWP model to enable wind power producers to participate in the day-ahead market are based on ICs from 06:00 UTC, representing a time horizon for the meteorological forecast ranging between 18 to 42 h ahead. For the case of the intra-day market, the time horizon for the forecast ranges from 2 to 7 h (depending on the auction session).
The meteorological data (ICs) are updated every six hours, namely at 6:00, 12:00, 18:00 and 24:00 (see the small light-blue arrows of Figure 4). This data needs to be processed to get the wind power forecasts, involving a computation time of nearly 2 h (see the dotted green lines of Figure 4). The updated forecasts are represented by the vertical orange arrows, meaning that the bids of WPPs to intra-day sessions 1, 3, 5 and 6 are based on updated data, and the bids to the other sessions take into account the available data only. Also, the bids of WPPs for a particular intra-day session involve the first hours of that session only—that is, the hours until the beginning of the next session (see the horizontal dark yellow arrows of Figure 4). Such bids include a quantity and a price. The quantity refers to the excess of energy. The price is 0 €/MWh.
Overall, WPPs submit bids to the day-ahead market, make commitments to produce energy during day D, and submit their deviations to the various sessions of the intra-day market. After that, in case WPPs still expect deviations, they can make use of the new bilateral energy contract to eventually reduce the imbalances. Following this, WPPs can participate in the aforementioned marketplaces. At the end, in case WPPs still expect deviations, they need to assume their balance responsibility and (eventually) pay penalties for their imbalances.
8. Simulation-Based Study
This section presents a simulation-based study carried out by using the MATREM system. It involves the simulation of the day-ahead and intra-day markets, as well as the use of the new contract and the simulation of the new marketplaces.
8.1. Data, Agents and Scenarios
The following sources of data are considered: (i) hourly prices and quantities of the day-ahead and intra-day Iberian markets (data published by the Spanish electricity market operator, OMIE [38]), (ii) hourly prices and quantities submitted to the Portuguese balancing market (data reported by the Portuguese system operator, REN [41]), and (iii) hourly deviations and prices of the imbalances for producers and retailers (data reported by REN [41]). Also, the study makes use of real wind power data from a set of wind parks located in the central region of Portugal, which is available from 1 January 2009 to 31 December 2010.
The (software) agents are 12 producers (with several production units), representing the supply-side of Portugal, five retailers, representing the demand-side of Portugal and Spain, and one aggregated wind power producer, with 249 MW of installed capacity (representing 10% of the Portuguese installed capacity in 2010). To get expressive results, the data was upscaled to 2490 MW of installed capacity, by multiplying all values by a constant factor.
Table 4 presents several key features of the producer agents. As noted earlier, the forecasts for the day-ahead and intra-day markets (time horizon ranging from 18 h to 42 h, in case of the day-ahead market, and from 2 to 7 h, for the intra-day market), were obtained by considering a numerical weather prediction model coupled with an artificial neuronal networks approach. Both the numerical prediction model and the artificial neuronal approach were calibrated for the region under consideration. The normalized root mean square error of the day-ahead forecast is around 13.5%. For the new products, the wind power forecasts were obtained using the historical time series and the ANN approach.
The study involves the following seven scenarios:
- S1: Wind power producers participate in the day-ahead market only (baseline scenario);
- S2: WPPs participate in both the day-ahead and the intra-day markets;
- S3: WPPs participate in the DAM and the IDM, and make use of the STE contract; also, retailers and conventional generation participate in the DAM and the IDM, and make use of the STE contract;
- S4: WPPs participate in the day-ahead and intra-day markets, as well in the energy reserve marketplace;
- S5: WPPs participate in the DAM and the IDM, as well in the renewable power band marketplace;
- S6: WPPs participate in the DAM, the IDM, and the renewable power band and energy reserve marketplaces;
- S7: WPPs participate in the DAM, the IDM, use the STE contract, and participate in the renewable power band and energy reserve marketplaces; also, retailers and conventional generation participate in the DAM and the IDM, and use the STE contract.
For all scenarios, we consider that the agents assume their balance responsibility, including the wind power producers, meaning that all agents pay penalties for their imbalances. To quantify the relevance of both the new contract and the new marketplaces, several important parameters are simulated, notably:
- Deviations of wind power producers and retailers;
- Deviation costs of wind power producers and retailers;
- Wind energy value to the market.
8.2. Results and Discussion
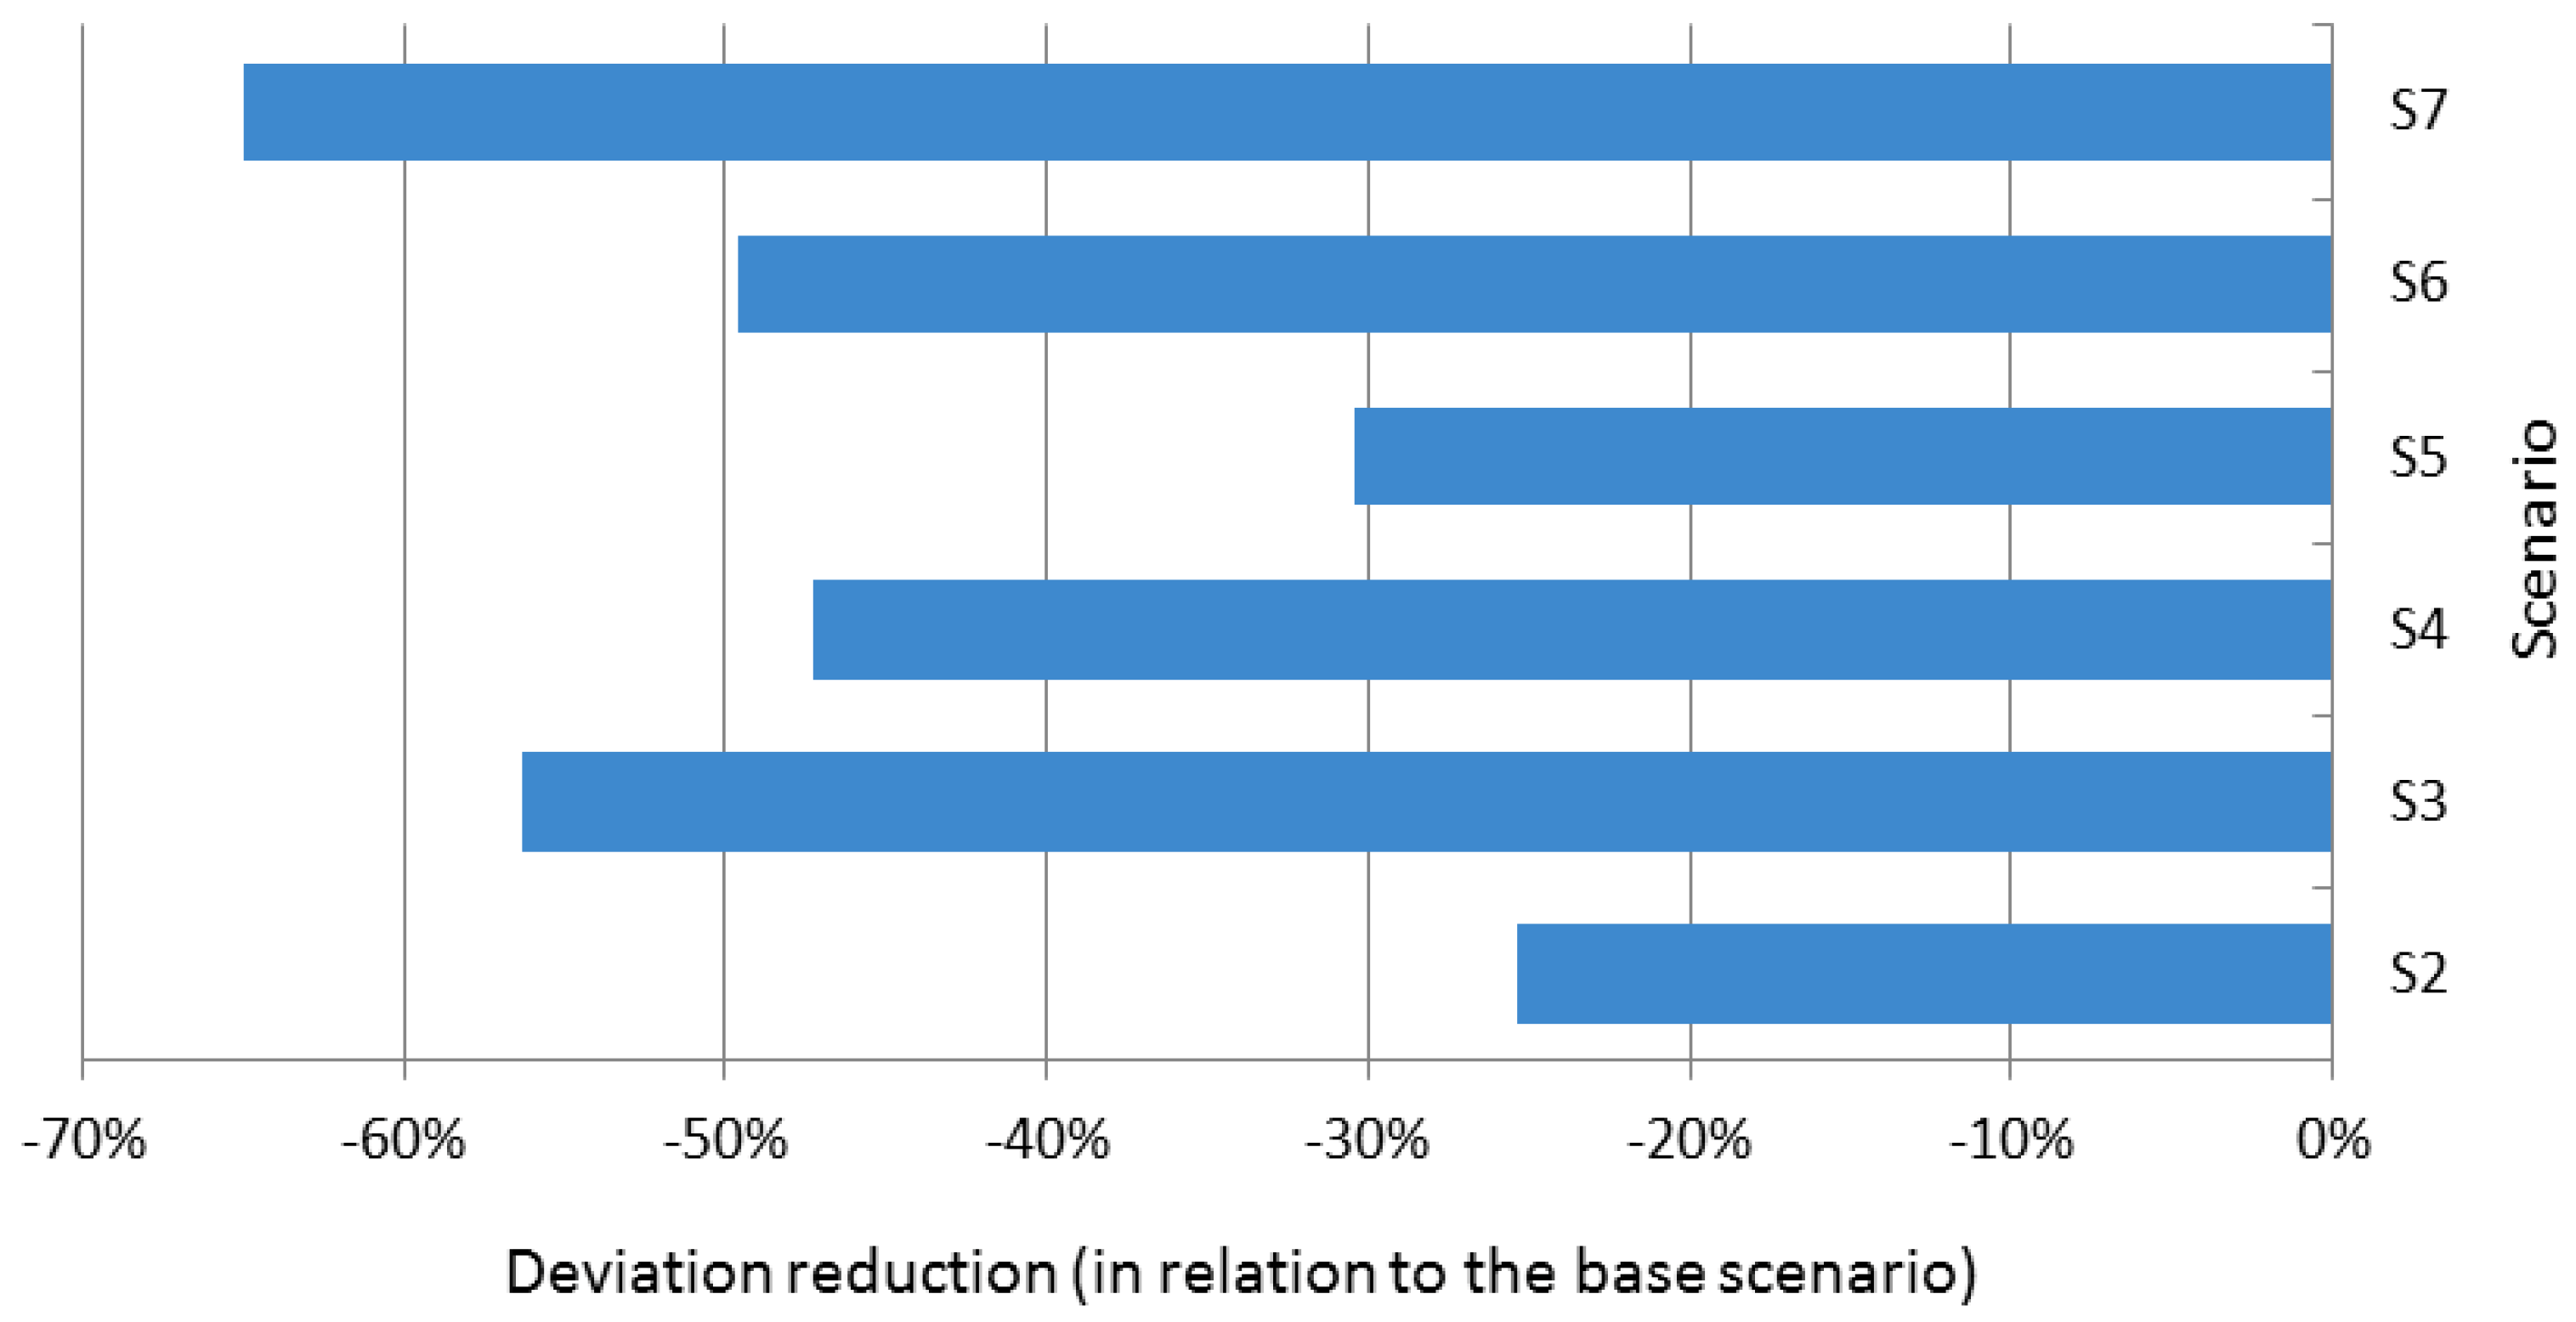
Table 5 and Table 6, and Figure 5 and Figure 6 summarize the results obtained by simulating the behavior of the day-ahead and intra-day markets with the help of the MATREM system, as well as considering the new contract and the new marketplaces. In particular, Table 5 shows the main results for the wind power producers, namely the energy value, the deviations and the remunerations. The table indicates that the STE contract (scenario S3) substantially reduced the deviations of the wind power producers, namely 56% in relation to the base scenario (see also Figure 5). In this way, the use of this contract decreased the cost of the deviations of WPPs by nearly 59% (see also Figure 6). However, WPPs were remunerated by the day-ahead clearing price, which was normally less attractive than the price of the tertiary reserve market (mFRR market). The participation of WPPs in the energy reserve marketplace (scenario S4) also increased the wind energy value (16% in relation to the base scenario S1). This result is explained by the high remuneration received by WPPs in the mFRR market, for their excess of energy (according to the actual operation of the Iberian market). In relation to the participation of WPPs in the renewable power band marketplace (scenario S5), they obtained a high levelized remuneration from energy. However, in comparison with the other scenarios, WPPs trade a lower quantity of energy, which results in a lower remuneration, and a higher cost with deviations.
Table 5 indicates that the use of the STE contract and the participation of WPPs in the energy reserve marketplace (scenarios S3 and S4) are particularly important, compensating their real-time lack of energy (i.e., wind power forecast underestimations). An analysis of the fifth column of the table shows that WPPs need to buy energy to fulfill their commitments with the DAM and the IDM. For the case of scenario S5, involving the participation of WPPs in the renewable power band marketplace, the benefits are not substantial for situations involving wind power forecast underestimations. In such situations, WPPs receive money for their excess of energy, instead of paying for their lack of energy.
The sixth column of the table reflects to some extent the price of the secondary reserve market (aFRR market). WPPs receive a higher remuneration for power (scenario S5, corresponding to 29.06 €/MW), in comparison with the remuneration resulting from scenario S7 (28.83 €/MW), involving the new contract and the participation in the new marketplaces. This result is associated with a reduction in deviations that is not attractive, leading to a reduced power band (and bid).
Overall, the results of Table 5 show that the use of the new market products are beneficial to wind power producers. Accordingly, both market operators and independent system operators should take them into consideration, possibly with particular adaptations and/or extensions, in order to allow an effective participation of VRE producers in liberalized markets—that is, to provide the flexibility needed to integrate the increasing levels of renewable generation, maintaining the security of the power systems.
Table 6 shows the simulation results for the particular case of retailers. These agents use the STE contract only. The results indicate that the retailer agents reduce the deviations in 39% and the costs with deviations in 38%. Also, the results for scenario S7 show that the use of the STE contract and the participation in the new marketplaces by WPPs, as well as the use of the new contract by retailers, result in a significant decrease in the global imbalances () and the associated costs ().
9. Conclusions
This article presented a new bilateral energy contract (STE contract) and new marketplaces designed to allow wind power producers to (eventually) reduce their deviations. The contract and the marketplaces were to some extent tested in a real-world study conducted with the help of the multi-agent system MATREM.
The software agents were 12 producers, representing the supply-side of Portugal, five retailers, representing the demand-side of Portugal and Spain, and one aggregated wind power producer. The data involved hourly prices and quantities of the day-ahead and intra-day Iberian markets, hourly prices and quantities submitted to the Portuguese balancing market, and hourly deviations and prices of the imbalances for producers and retailers. Seven scenarios were considered, involving the participation of wind power producers in the new marketplaces, and also using the new contract.
The simulation results indicated that the new contract and the new marketplaces are beneficial to WPPs at both technical and economical levels, reducing the imbalances and increasing the wind energy value to the market. Also, the STE contract led to a reduction in the imbalances of retailers, resulting in a reduction of their costs with imbalances. Accordingly, market operators and system operators should take into consideration the new products presented here, possibly with particular adaptations and/or extensions, to allow an effective participation of VRE producers in liberalized markets, thus contributing to a new paradigm involving no feed-in tariffs nor other supporting schemes—that is, the paradigm expected in the near future, involving near 100% renewables.
Author Contributions
H.A. and A.C. defined the new contract and the new marketplaces, performed the simulation-based study, and wrote a preliminary version of the article. In particular, A.C. developed the forecast models and computed the wind power forecasts. H.A. designed and conducted the simulations with the help of the MATREM system. F.L. performed a deep revision of the initial version of the article, regarding both language and scientific content. F.L. also performed a deep revision of the subsequent versions of the article, taking into account the comments of the reviewers. In addition, F.L. developed the MATREM system (thus enabling to perform the simulation-based study). A.C. and A.E. contributed with expertise in wind power. J.S. and F.L. contributed with expertise in energy markets.
Funding
This work was supported by FCT (Fundação para a Ciência e Tecnologia) under grant agreement PD/BD/105863/2014 (H. Algarvio).
Conflicts of Interest
The authors declare no conflict of interest.
Abbreviations
| aFRR | Automatic-activated frequency restoration reserve |
| ANN | Artificial neural networks |
| BM | Balancing market |
| CG | Conventional generation |
| CET | Central European time |
| DAM | Day-ahead market |
| EM | Electricity market |
| EU-28 | The European Union before Brexit |
| GFS | Global Forecast System |
| IC | Initial and boundary conditions |
| IDM | Intra-day market |
| KPI | Key performance indicator |
| LMP | Locational marginal pricing |
| mFRR | Manually-activated frequency restoration reserve |
| MATREM | Multi-Agent TRading in Electricity Markets |
| MIBEL | Iberian electricity market |
| NWP | Numerical weather prediction |
| OMIE | Spanish electricity market operator |
| OMIP | Portuguese electricity market operator |
| REN | Portuguese TSO |
| STE | Short-term energy contract |
| SMP | System marginal pricing |
| UTC | Coordinated universal time |
| VRE | Variable renewable energy |
| TSO | Transmission system operator |
| WPP | Wind power producer |
| Indices | |
| t | Time (minutes) |
| T | Time period (hour) |
| Parameters | |
| Nominal capacity | |
| Variables | |
| c | Parameter of Equation (3) |
| D | Day |
| Energy | |
| Energy bid | |
| Deviation | |
| Instantaneous power | |
| Average power | |
| Power bid | |
| Balancing market bid |
References
- Jones, E.L. Renewable Energy Integration: Practical Management of Variability, Uncertainty, and Flexibility in Power Grids; Academic Press: London, UK, 2014. [Google Scholar]
- Lopes, F.; Coelho, H. Electricity Markets with Increasing Levels of Renewable Generation: Structure, Operation, Agent-Based Simulation and Emerging Designs; Springer International Publishing: Cham, Switzerland, 2018. [Google Scholar] [CrossRef]
- Ela, E.; Milligan, M.; Bloom, A.; Cochran, J.; Botterud, A.; Townsend, A.; Levin, T. Overview of Wholesale Electricity Markets. In Electricity Markets with Increasing Levels of Renewable Generation: Structure, Operation, Agent-Based Simulation and Emerging Designs; Springer International Publishing: Cham, Switzerland, 2018; pp. 3–21. [Google Scholar] [CrossRef]
- Moiseeva, E.; Wogrin, S.; Hesamzadeh, M.R. Generation flexibility in ramp rates: Strategic behavior and lessons for electricity market design. Eur. J. Oper. Res. 2017, 261, 755–771. [Google Scholar] [CrossRef]
- Ela, E.; Milligan, M.; Bloom, A.; Botterud, A.; Townsend, A.; Levin, T. Incentivizing Flexibility in System Operations. In Electricity Markets with Increasing Levels of Renewable Generation: Structure, Operation, Agent-Based Simulation, and Emerging Designs; Springer International Publishing: Cham, Switzerland, 2018; pp. 95–127. [Google Scholar] [CrossRef]
- International Energy Agency. The Power of Transformation: Wind, Sun and the Economics of Flexible Power Systems; International Energy Agency: Paris, France, 2014. [Google Scholar]
- European Commission. Proposal for a Regulation of the European Parliament and of the Council on the Internal Market for Electricity. February 2017. Available online: http://ec.europa.eu/energy/sites/ener/files/documents/1_en_act_part1_v9.pdf (accessed on 4 October 2019).
- Algarvio, H.; Lopes, F.; Couto, A.; Santana, J.; Estanqueiro, A. Effects of Regulating the European Internal Market on the integration of Variable Renewable Energy. WIREs Energy Environ. 2019, e346. [Google Scholar] [CrossRef]
- Lopes, F. MATREM: An Agent-based Simulation Tool for Electricity Markets. In Electricity Markets with Increasing Levels of Renewable Generation: Structure, Operation, Agent-Based Simulation and Emerging Designs; Springer: Cham, Switzerland, 2018; pp. 189–225. [Google Scholar] [CrossRef]
- Lopes, F.; Coelho, H. Electricity Markets and Intelligent Agents. Part II: Agent Architectures and Capabilities. In Electricity Markets with Increasing Levels of Renewable Generation: Structure, Operation, Agent-Based Simulation and Emerging Designs; Springer: Cham, Switzerland, 2018; pp. 49–77. [Google Scholar] [CrossRef]
- Algarvio, H.; Lopes, F.; Couto, A.; Estanqueiro, A. Participation of Wind Power Producers in Day-ahead and Balancing Markets: An Overview and a Simulation-based Study. WIREs Energy Environ. 2019, e343. [Google Scholar] [CrossRef]
- Algarvio, H.; Couto, A.; Lopes, F.; Estanqueiro, A. Changing the Day-Ahead Gate Closure to Wind Power Integration: A Simulation-Based Study. Energies 2019, 12, 2765. [Google Scholar] [CrossRef]
- Algarvio, H.; Lopes, F.; Sousa, J.; Lagarto, J. Multi-agent electricity markets Retailer portfolio optimization using Markowitz theory. Electr. Power Syst. Res. 2017, 148C, 282–294. [Google Scholar] [CrossRef]
- Kirschen, D.; Strbac, G. Fundamentals of Power System Economics; Wiley: Chichester, UK, 2004. [Google Scholar]
- Hull, J. Options, Futures, and Other Derivatives; Pearson Education: New York, NY, USA, 2015. [Google Scholar]
- Clewlow, L.; Strickland, C. Energy Derivatives: Pricing and Risk Management; Lacima Publications: London, UK, 1998. [Google Scholar]
- Lopes, F. Electricity Markets and Intelligent Agents. Part I: Market Architecture and Structure. In Electricity Markets with Increasing Levels of Renewable Generation: Structure, Operation, Agent-Based Simulation and Emerging Designs; Springer: Cham, Switzerland, 2018; pp. 23–48. [Google Scholar] [CrossRef]
- Fernandes, C.; Frías, P.; Reneses, J. Participation of intermittent renewable generators in balancing mechanisms: A closer look into the Spanish market design. Renew. Energy 2016, 89, 305–316. [Google Scholar] [CrossRef]
- Ocker, F.; Ehrhart, K. The “German Paradox” in the balancing power markets. Renew. Sustain. Energy Rev. 2017, 67, 892–898. [Google Scholar] [CrossRef]
- Sorknaes, P.; Andersen, A.; Tang, J.; Strøm, S. Market integration of wind power in electricity system balancing. Energy Strategy Rev. 2013, 1, 174–180. [Google Scholar] [CrossRef]
- National Grid. Monthly Balancing Services Summary 2017/18, Electricity System Operator (ESO) in Great Britain. Technical Report. 2 February 2018. Available online: https://www.nationalgrideso.com/document/109401/download (accessed on 4 October 2019).
- WindVision; Elia; Eneco; ENERCON. Delivery of Downward aFRR by Wind Farms. Technical Report; Belgium 2015. Available online: https://www.elia.be/ (accessed on 10 November 2019).
- Fournié, L.; Andrey, C.; Hentschel, J.; Wilkinson, G. Integration of Electricity Balancing Markets and Regional Procurement of Balancing Reserves; Final Report; European Commission: Brussels, Belgium, 2016. [Google Scholar]
- European Commission. Regulation (EU) 2016/631 establishing a network code on requirements for grid connection of generators. Off. J. Eur. Union 2016. Available online: https://eur-lex.europa.eu/legal-content/EN/TXT/?uri=CELEX%3A32016R0631 (accessed on 1 October 2019).
- Ren, H.; Zhang, X.; Kang, S.; Liang, S. Actuator Disc Approach of Wind Turbine Wake Simulation Considering Balance of Turbulence Kinetic Energy. Energies 2019, 12, 16. [Google Scholar] [CrossRef]
- Altin, M.; Kuhlmann, J.; Das, K.; Hansen, A. Optimization of Synthetic Inertial Response from Wind Power Plants. Energies 2018, 11, 1051. [Google Scholar] [CrossRef]
- Hu, J.; Wen, F.; Wang, K.; Huang, Y.; Salam, M. Simultaneous provision of flexible ramping product and demand relief by interruptible loads considering economic incentives. Energies 2018, 11, 46. [Google Scholar] [CrossRef]
- Wang, F.C.; Hsiao, Y.S.; Yang, Y.Z. The Optimization of Hybrid Power Systems with Renewable Energy and Hydrogen Generation. Energies 2018, 11, 1948. [Google Scholar] [CrossRef]
- OMIP. Trading RuleBook; MIBEL Derivatives Market: Lisbon, Portugal, 2016. [Google Scholar]
- EPEX Spot. Trading on EPEX SPOT; EPEX SPOT SE: Paris, France, 2018. [Google Scholar]
- Algarvio, H.; Couto, A.; Lopes, F.; Estanqueiro, A.; Santana, J. Multi-Agent Energy Markets with High Levels of Renewable Generation: A Case-Study on Forecast Uncertainty and Market Closing Time. In Proceedings of the 13th International Conference Distributed Computing and Artificial Intelligence, Sevilla, Spain, 1–3 June 2016; pp. 339–347. [Google Scholar]
- Sousa, F.; Lopes, F.; Santana, J. Contracts for Difference and Risk Management in Multi-agent Energy Markets. In Advances in Practical Applications of Agents, Multi-Agent Systems, and Sustainability: The PAAMS Collection (PAAMS 2015); Springer International Publishing: New York, NY, USA, 2015; pp. 339–347. [Google Scholar] [CrossRef]
- Lopes, F.; Mamede, N.; Novais, A.Q.; Coelho, H. Negotiation Tactics for Autonomous Agents. In Proceedings of the 12th International Workshop on Database and Expert Systems Applications (DEXA), Munich, Germany, 3–7 September 2001; pp. 1–5. [Google Scholar]
- Lopes, F.; Mamede, N.; Novais, A.Q.; Coelho, H. Negotiation in a multi-agent supply chain system. In Third Int. Workshop of the IFIP WG 5.7 Special Interest Group on “Advanced Techniques in Production Planning & Control”; Firenze University Press: Firenze, Italy, 2002; pp. 153–168. [Google Scholar]
- Lope, F.; Coelho, H. Concession Behaviour in Automated Negotiation. In E-Commerce and Web Technologies; Springer: Berlin/Heidelberg, Germany, 2010; pp. 184–194. [Google Scholar]
- Bellifemine, F.; Caire, G.; Greenwood, D. Developing Multi-agent Systems with JADE; John Wiley & Sons: Chichester, UK, 2007. [Google Scholar]
- MIBEL. Iberian Electricity Market. Available online: https://www.mibel.com/en/home_en/ (accessed on 10 November 2019).
- OMIE. Day-Ahead and Intraday Electricity Market Operating Rules; Spanish Electricity Market Operator: Spain, 2018; pp. 1–186. [Google Scholar]
- OMIP. Trading RuleBook, MIBEL Derivatives Market; Portuguese Electricity Market Operator: Lisbon, Portugal, 2016; pp. 1–47. [Google Scholar]
- MathWorks. MATLAB and Neural Network Toolbox Release; The MathWorks, Inc.: Natick, MA, USA, 2017. [Google Scholar]
- REN. Redes Elétricas Nacionais, Daily Summary. Available online: http//www.mercado.ren.pt/EN/Electr/MarketInfo/MarketResults/Pages/default.aspx (accessed on 10 November 2019).
Figure 1.
Bids of wind power producers and the associated deviations.

Figure 2.
Real production of a hypothetical variable renewable energy (VRE) producer (orange line) and bids of power (green line) and energy (blue line) for a settlement period of 15 min.
Figure 2.
Real production of a hypothetical variable renewable energy (VRE) producer (orange line) and bids of power (green line) and energy (blue line) for a settlement period of 15 min.

Figure 3.
Bids associated with an hypothetical VRE producer for a period of one hour (four periods of 15 min).
Figure 3.
Bids associated with an hypothetical VRE producer for a period of one hour (four periods of 15 min).

Figure 4.
Trading behavior of wind power producers in the day-ahead and intra-day markets.

Figure 5.
Simulation results (reduction of deviations of the wind power producers).

Figure 6.
Simulation results (reduction of deviation cost of wind power producers).


Table 1.
Main specifications of the short-term energy contract.
| Characteristic | Details |
|---|---|
| Trading procedure/period | Auction/year-round |
| Time unit | 15 min (of each day) |
| Description | Electronic trading managed by exchanges; agents offer their energy deviations in exchanges, informing TSOs of deals |
| Match type | Full or partial |
| Key feature | Different contracts for positive and negative energy |
| Bid submission | Till 1 h prior to the balancing period |
| Key bid elements | Energy quantity, match type, etc. |
| Energy quantity | Minimum of 0.1 MWh; traded quantity based on an equity principle |
| Type of bid | Bid associated with an energy deviation or a new bid; deviations have priority over new bids |
| Payment scheme | Day-ahead price |
| Participants | VRE producers, conventional generation producers, retailers |
Table 2.
Important features of the renewable power band marketplace.
| Characteristic | Details |
|---|---|
| Trading procedure/period | Auction/year-round |
| Market time unit | 15 min (of each day) |
| Description | VRE producers use their frequency control capacity at balancing markets by offering a power band that can help system operators solving demand-supply imbalances |
| Key feature | Power interval |
| Bid submission | Till 15 min prior to the balancing period |
| Key bid elements | Positive and negative power |
| Bid quantity | Minimum of 0.1 MW; Power interval |
| Payment scheme | Selected producers receive the secondary reserve price |
| Participants | VRE producers |
Table 3.
Important features of the energy reserve marketplace.
| Characteristic | Details |
|---|---|
| Trading procedure/period | Auction/year-round |
| Market time unit | 15 min (of each day) |
| Description | VRE producers submit their deviations to balancing markets and inform the system operators of the magnitude of errors |
| Key feature | Different products for positive and negative reserve |
| Bid submission | Till 15 min prior to the balancing period |
| Key bid element | Energy |
| Energy quantity | Minimum of 0.1 MWh |
| Energy price | Near-zero price |
| Payment scheme | Selected producers receive the tertiary reserve price |
| Participants | VRE producers |
Table 4.
Key features of the producer agents.
| Agent Identifier | Iberian Country | Generation Technology | Maximum Capacity (MW) | Marginal Cost (€/MWh) |
|---|---|---|---|---|
| P1 | Portugal | Wind | 2500 | 0 |
| P2 | Portugal | Renewable mix | 2000 | 0 |
| P3 | Portugal | Hydro | 4500 | |
| P4 | Portugal | Coal | 1800 | ≈30 |
| P5 | Portugal | Gas Combined Cycle | 3000 | ≈55 |
| P6 | Portugal | Fuel oil | 2000 | ≈70 |
| P7 | Spain | Renewable mix | 30,000 | 0 |
| P8 | Spain | Hydro | 16,500 | |
| P9 | Spain | Coal | 10,000 | ≈30 |
| P10 | Spain | Nuclear | 7500 | ≈30 |
| P11 | Spain | Gas Combined Cycle | 22,000 | ≈55 |
| P12 | Spain | Fuel oil | 4000 | ≈70 |
Table 5.
Simulation results for the wind power producers (energy value, deviations and remunerations).
Table 5.
Simulation results for the wind power producers (energy value, deviations and remunerations).
| Scenario | Energy Value (€/MWh) | Deviation (MW/h) | Deviation Cost (k€/h) | Remuneration (Energy) (€/MWh) | Remuneration (Power) (€/MW) | Liquid Profit (€/MWh) |
|---|---|---|---|---|---|---|
| S1 | 28.05 | 281.53 | 4.54 | — | — | — |
| S2 | 29.51 | 210.05 | 3.13 | — | — | — |
| S3 | 31.29 | 123.10 | 1.83 | — | 14.99 | |
| S4 | 32.58 | 148.61 | 2.00 | — | 36.48 | |
| S5 | 31.57 | 195.83 | 2.89 | 64.26 | 29.06 | 25.07 |
| S6 | 34.31 | 142.00 | 1.88 | 29.06 | 34.61 | |
| S7 | 33.25 | 98.66 | 1.40 | 28.83 | 18.74 |
Table 6.
Simulation results for the retailer agents.
| Scenario | Deviation (MW/h) | Deviation Cost (k€/h) | Remuneration (Energy) (€/MWh) | Liquid Profit (€/MWh) |
|---|---|---|---|---|
| S1 | — | — | — | — |
| S2 | 431.91 | 6.07 | — | — |
| S3 | 262.67 | 3.75 | 18.14 | 5.24 |
| S4 | — | — | — | — |
| S5 | — | — | — | — |
| S6 | — | — | — | — |
| S7 | 262.67 | 3.75 | 18.14 | 5.24 |
© 2019 by the authors. Licensee MDPI, Basel, Switzerland. This article is an open access article distributed under the terms and conditions of the Creative Commons Attribution (CC BY) license (http://creativecommons.org/licenses/by/4.0/).
Share and Cite
MDPI and ACS Style
Algarvio, H.; Lopes, F.; Couto, A.; Estanqueiro, A.; Santana, J. Variable Renewable Energy and Market Design: New Products and a Real-World Study. Energies 2019, 12, 4576. https://doi.org/10.3390/en12234576
AMA Style
Algarvio H, Lopes F, Couto A, Estanqueiro A, Santana J. Variable Renewable Energy and Market Design: New Products and a Real-World Study. Energies. 2019; 12(23):4576. https://doi.org/10.3390/en12234576
Chicago/Turabian StyleAlgarvio, Hugo, Fernando Lopes, António Couto, Ana Estanqueiro, and João Santana. 2019. "Variable Renewable Energy and Market Design: New Products and a Real-World Study" Energies 12, no. 23: 4576. https://doi.org/10.3390/en12234576
Note that from the first issue of 2016, this journal uses article numbers instead of page numbers. See further details here.