Experimental and Modeling Analysis of Brewers´ Spent Grains Gasification in a Downdraft Reactor
by
 , , , and
Sérgio Ferreira
1, 
Eliseu Monteiro
2,3,*,
Luís Calado
2,
Valter Silva
2,
Paulo Brito
2 and
Cândida Vilarinho
1 1
CT2M—Centre for Mechanical and Materials Technologies, Mechanical Engineering Department of Minho University, 4804-533 Guimarães, Portugal
2
VALORIZA—Research Center for Endogenous Resource Valorisation, Polytechnic Institute of Portalegre, 7300-555 Portalegre, Portugal
3
CIENER-LAETA/Faculty of Engineering, University of Porto, 4200-465 Porto, Portugal
*
Author to whom correspondence should be addressed.
Energies 2019, 12(23), 4413; https://doi.org/10.3390/en12234413
Submission received: 12 October 2019
/
Revised: 12 November 2019
/
Accepted: 16 November 2019
/
Published: 20 November 2019
(This article belongs to the Special Issue Biomass Wastes for Energy Production)
Abstract
:The first part of the current reported work presents experimental results of brewers’ spent grains gasification in a pilot-scale downdraft gasifier. The gasification procedure is assessed through various process characteristics such as gas yield, lower heating value, carbon conversion efficiency, and cold gas efficiency. Power production was varied from 3.0 to 5.0 kWh during the gasification experiments. The produced gas was supplied to an internal combustion engine coupled to a synchronous generator to produce electricity. Here, 1.0 kWh of electricity was obtained for about 1.3 kg of brewers’ spent grains pellets gasified, with an average electrical efficiency of 16.5%. The second part of the current reported work is dedicated to the development of a modified thermodynamic equilibrium model of the downdraft gasification to assess the potential applications of the main Portuguese biomasses through produced gas quality indices. The Portuguese biomasses selected are the main representative forest residues (pine, eucalyptus, and cork) and agricultural residues (vine prunings and olive bagasse). A conclusion can be drawn that, using air as a gasifying agent, the biomass gasification provides a produced gas with enough quality to be used for energy production in boilers or turbines.
1. Introduction
Population and incomes rising will continue to push up the global energy demand, according to the International Energy Agency (IEA) [1]. Additionally, the limited availability of energy resources calls for new advantageous and creative solutions for safe energy supply. Bioenergy is considered one of the key options of the renewable energy field to mitigate greenhouse gas emissions, replace fossil fuels, and ensuring a more secure and sustainable energy system [2].
Biomass conversion via gasification is an established technique in modern bioenergy systems [3]. It is an important process to convert biomass into a combustible gas that can be used in boilers, turbines, engines, and even fuel cells. This combustible gas can also be used as a raw material in the production of synthetic fuels or chemicals [4,5].
Lignocellulosic biomass represents the most available renewable resource on the planet [6]. The interest in using lignocellulosic biomass as a renewable resource for bioproducts production is rising, especially due to their abundance, low cost, and their production does not compete with the food chain [7]. Among the lignocellulosic biomasses, spent grain [8] has received increased interest in the last few years [9,10,11,12,13,14].
Spent gain is the major byproduct of the brewing process that includes spent yeast and spent hops [14]. Basically, beer is a yeast fermenting product of the brewer wort obtained from malted barley, sometimes combined with other cereals called adjuncts (maize, rice, oats, wheat, etc.), with the addition of hops [15].
Spent grain is generated in the beer-brewing process, which begins with the production of the wort. The wort comprises crushed barley malt mixed with water in a mash tun. The temperature is gradually increased to about 78 °C in order to transform the malt starch into fermentable and non-fermentable sugars. The insoluble undegraded part of the barley malt grain obtained in the mixture with the wort at the end of this process is known as spent grain. Spent grain is the most abundant brewing byproduct, corresponding to around 85% of total byproducts generated [9].
During the brewing process, the wort should be submitted to the boiling stage, with the purpose of hop addition and the extraction of its aroma and bitterness compounds [16]. In this step, the wort loses part of its high nitrogen content due to the formation of a precipitate called hot trub or spent hop. Spent hop is the second solid residue generated in the brewing process, which results principally from insoluble coagulation of high molecular weight proteins. Comprising around 2% of the total byproducts generated during brewing, spent hop is the lowest byproduct of the brewing process. The main use of spent yeast is as animal feed as a source of protein and water-soluble vitamins [17].
The fermentation stage is triggered by the addition of yeast to the filtered wort, converting sugar to alcohol and carbon dioxide. Before full maturation of the beer, the excess yeast is collected and can be re-used in the brewing process as many as six times. After this, it becomes brewer’s spent yeast. Comprising around 13% of the total byproducts generated during brewing, spent yeast is the second biggest byproduct of the brewing process. Spent yeast is an interesting byproduct since it contains a high level of nutrients, and several technologies exist that can transform this byproduct into a valuable resource. However, to date, its industrial utilization is very limited because of the fast contamination and spoilage of spent yeast as a result of the activity of microorganisms. The bitterness of spent hops does not make it a good candidate for use as an animal feed [17]. The main methods of disposal are to reuse them as fertilizer or compost [18].
From this brief overview of the brewing process, it is possible to verify that the brewer’s spent grains (BSG) are the most representative byproduct of the brewing process. The brewing sector in Portugal generates around 135,000 tonnes of BSG per year [13], which are mainly used as animal feed. Nevertheless, recent developments exposed other possible applications such as the production of various value-added bio-products [9,10,11] and energy generation for the brewing process [11,12,13].
There are numerous methods of exploiting biomass to produce energy and fuels. Among them, gasification processes seem to be a good option for small- to large-scale applications since the sub-stoichiometric conditions in the reactor allows for much lower pollutant emissions than combustion processes [19,20].
Literature is very scarce on the subject of the thermochemical conversion of BSG through pyrolysis and gasification processes. Mahmood et al. [21] used a batch pyrolysis reactor to pyrolyze small samples of BSG. A reforming nickel catalyst was added downstream of the reactor for cracking and reforming of the pyrolysis products with and without the addition of steam. The obtained results indicated that catalytic reforming promotes an increase in CO and H2 contents. The process also showed an increase in heating value for the produced gas as the reforming temperature increased. Borel et al. [22] performed thermogravimetric studies on the pyrolysis of BSG to evaluate its potential for bio-oil production. The results suggest a good potential of BSG for bio-oil production due to their high heating value and high volatile matter content. Ulbricha et al. [11] studied the influence of temperature and residence time on the hydrothermal carbonization and carbon dioxide gasification of brewers’ spent grains. The results suggest that prolonged residence times and higher temperature decreases energy and mass yields and increases heating values and fixed carbon formation in the coal. Carbon dioxide reaction rates of chars after pyrolysis are decreased due to the formation of fixed carbon during the hydrothermal carbonization. Activation energies of the carbon dioxide reaction also decrease with higher hydrothermal carbonization reaction rates. Ferreira et al. [13] performed a very complete characterization of brewers’ spent grains and subject it to steam gasification in an allothermal batch reactor. BSG was characterized through proximate, ultimate, and thermogravimetric analysis and a van Krevelen diagram. The results suggest that BSG has similar characteristics to common lignocellulosic biomasses. BSG steam gasification was carried out to determine the influence of temperature and the steam-to-biomass ratio on the produced gas composition. They found that CO and CH4 contents decrease with the steam-to-biomass ratio, while H2 and CO2 contents increase. The temperature increase leads to increased CO and H2 contents and decreased CH4 and CO2 contents.
Another possible route of valorization for BSG is downdraft gasification, which is a proven technology and a low-cost process with the additional advantage of generating very low tar levels [19]. The produced gas can be subjected to cogeneration, for which BSG gasification behavior is still unknown. Therefore, the first part of this paper is dedicated to the study of the influence of some process conditions on the BSG downdraft gasification using a power pallet downdraft gasifier from All Power Labs (Berkeley, CA, USA).
The second part of this paper is dedicated to the development and implementation of a mathematical model to understand and predict the BSG downdraft gasification process performance and to assess the influence of diverse variables on the process performance for other biomass substrates. The main reason for that is to take advantage of the possibility provided by numerical models in order to circumvent time-consuming and costly experimental trials [23,24].
Gasification modeling and simulation may be achieved through different approaches, such as equilibrium models, kinetic models, computational fluid dynamics, and artificial neural networks [24,25]. Equilibrium models have the capacity to predict the maximum possible yield of a product; hence, they are not so accurate. However, thermodynamic models may be more suitable for some applications, given that they are independent of the gasifier’s design and do not include any information about conversion mechanisms [26]. Therefore, they are the best choice for preliminary studies and parametric studies [25,27].
There are many modeling studies on equilibrium modeling of lignocellulosic biomass such as wood [28,29], agriculture residues [29,30], or pine [31]. However, to the best of our knowledge, there are no modeling studies on BSG downdraft gasification. Therefore, the second part of this work is dedicated to the development of a modified thermodynamic equilibrium model of the downdraft gasification to assess the potential application of the main Portuguese biomasses through produced gas quality indices.
2. Materials and Methods
2.1. Brewer’s Spent Grain Characterization
2.2. Pilot-Scale Downdraft Reactor
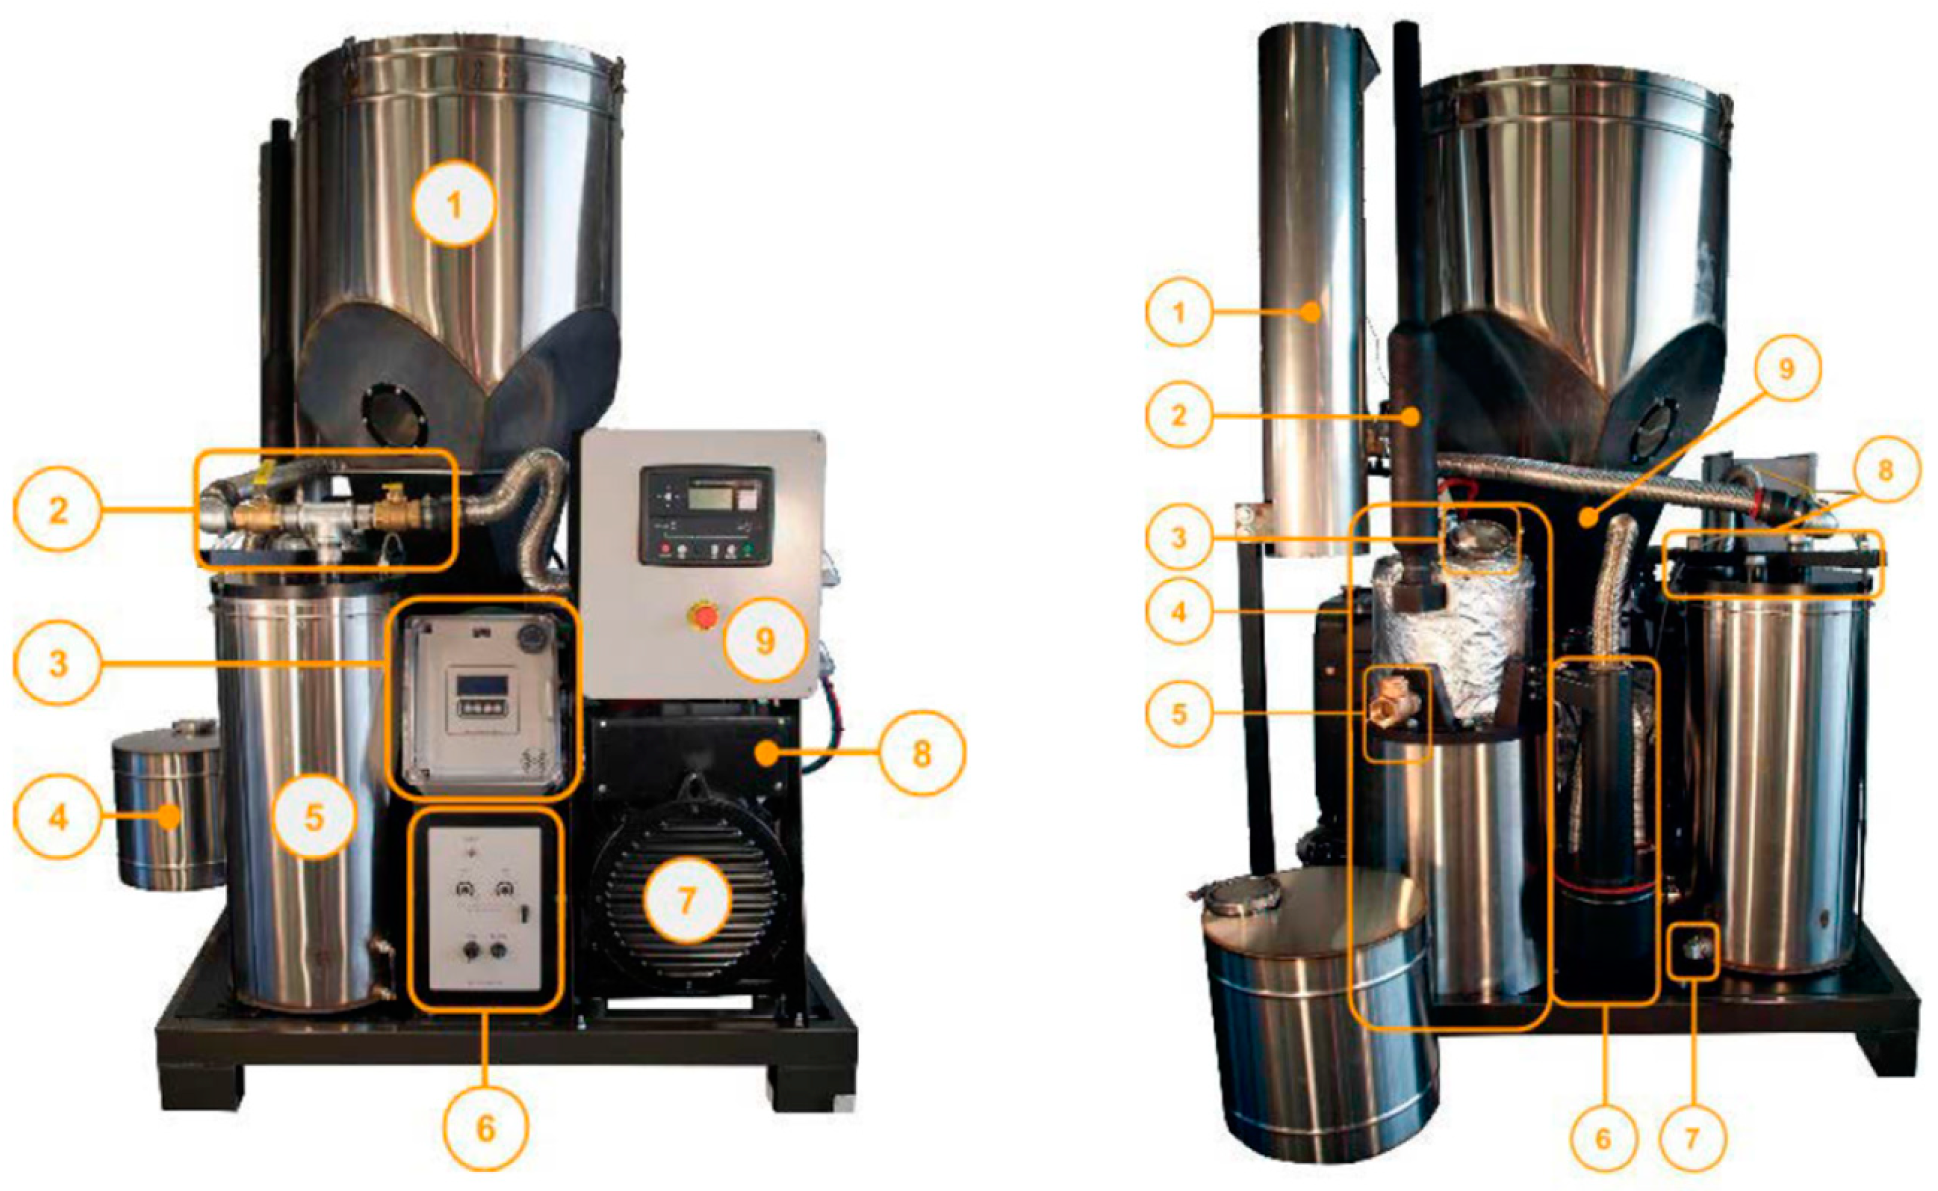
A pilot-scale integrated gasification power system—a 20 kW Power Pallet (PP20) supplied by All Power Labs, Berkeley, CA, USA—was used. This system is mainly comprised of a downdraft reactor, an internal combustion engine, an electrical synchronous generator, and a process control unit. The external appearance of the gasifier and the main specifications are given in Figure 1 and Table 2, respectively.
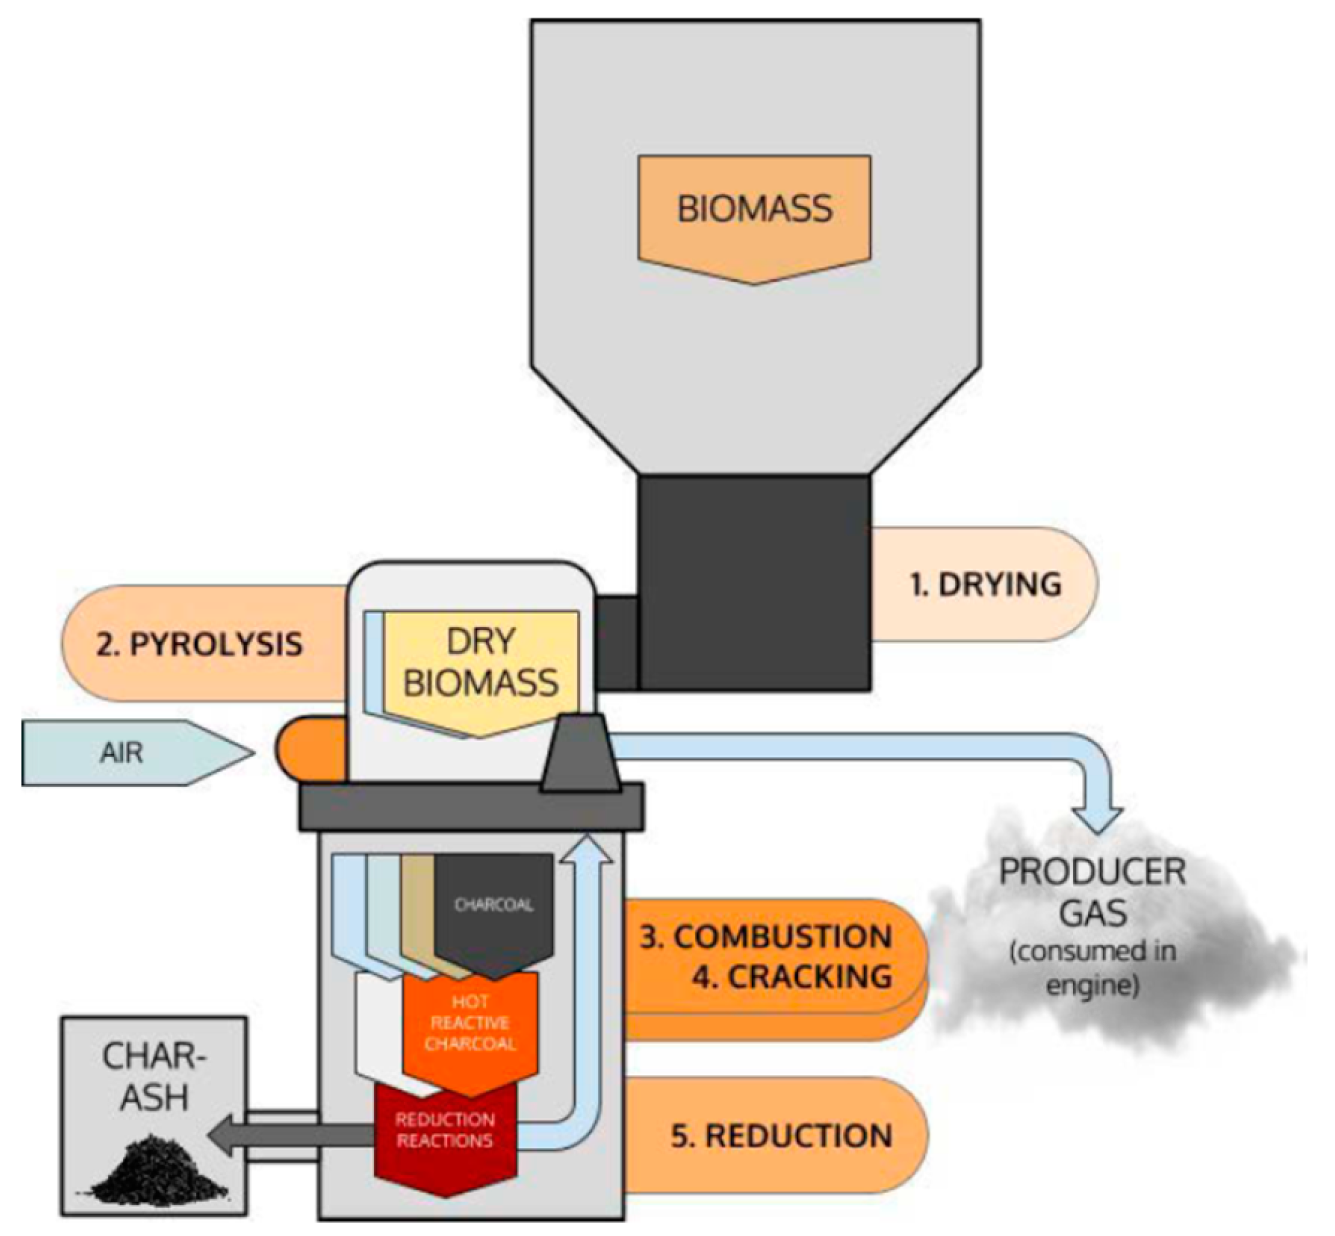
The downdraft gasifier is made of stainless steel, and its kernel is made of coated ceramic. It is comprised of four sections corresponding to the different gasification phases (drying, pyrolysis, combustion and cracking, and reduction), as depicted in Figure 2. The power pallet system operates at a negative pressure to avoid gas leaks. Therefore, the hopper is sealed to maintain the negative pressure. In the drying zone, a heat exchanger with the hot departing gas reduces the moisture content of the biomass. A worm screw carries the dried biomass for the downdraft reactor. Drying and pyrolysis are both endothermic phases of gasification. Therefore, the power pallet includes a physical separation between these gasification phases to avoid competition for the heat required to each phase and reduce the amount of water in the gasifier, which would tend to agglomerate the tars and the soot into droplets and hamper their elimination by thermal cracking.
The heat required for the pyrolysis that occurs at the top of the gasifier comes from combustion reactions that take place in the middle of the gasifier and from a heat exchanger with the engine’s exhaust gases. The air intake flow to the combustion zone also experiences a heat exchange with the departing gas. In the reduction zone at the bottom of the gasifier, a grate allows ash and char granules to pass. This grate is shaken by the system to smooth the passage of small granules and ash to the bottom of the gasifier, which, in turn, facilitates the flow of the produced gas.
The produced gas leaves the gasifier and enters into a cyclone that precipitates larger particles and condensates present in the produced gas stream. After that, the produced gas can follow two different routes, depending on the operating conditions. During start-up, the produced gas follows the flare route, as is the low temperature in the gasifier does not permit it to crack the produced tars; that would damage the internal combustion engine. When the temperature in the reactor stabilizes, the produced gas follows the internal combustion engine route. Meanwhile, the produced gas goes through a packed bed filter, which ultimately removes moisture and other contaminants.
The internal combustion engine is a spark-ignition engine (GM Vortec type) (General Motors, Detroit, MI, USA) properly modified to use low calorific combustible gases. The air-fuel ratio is tuned through a control unit and an oxygen (lambda) sensor. The equivalence ratio is seen on the control unit display, which allows the user to verify that the air-fuel mixture is generally stoichiometric [33].
The Power Pallet has a direct connection between the engine’s drive shaft and the generator. For the generator to output electricity with a constant frequency of 50 Hz, it also has an engine governor to ensure that the engine turns at 1500 rpm (synchronous generator with four poles) while varying the power output to match the load on the generator. Further details about the pilot-scale integrated gasification power production system and its equipment can be found elsewhere [32,34,35].
2.3. Experimental Procedure
Prior to the gasification experiments, the reactor was fully emptied and then filled with BSG pellets. For the BSG gasification trials, the hopper was filled with 50 kg of BSG pellets working in a batch mode. The system was initially tested to avoid gas leaking from the gasifier during operation. The start-up of the gasifier was done by a propane burner. When the temperature rises above 700 °C, the produced gas is supplied to the internal combustion engine instead of the flare. At the end of each gasification trial, the reactor, gas filter, grate basket, and ash container were cleaned.
The produced gas was sampled at the exit of the gas filter using Tedlar bags (CEL Scientific Corp., Cerritos, CA, USA) in intervals of 15 min during the one-hour test for each operational condition. Therefore, four produced gas samples were taken for each operational condition and analyzed in a Varian 450-GC (Scion, Austin, TX, USA) gas chromatograph with two thermal conductivity detectors, enabling the recognition of CO, CO2, CH4, C2H2, C2H4, C2H6, H2, O2, and N2 using nitrogen and helium as carrier gases. The experimental results presented in this paper are the average of these four samples.
2.4. Mathematical Model
The modified stoichiometric equilibrium model presented herein is based on the carbon boundary point (CBP) concept. The CBP is attained when enough gasifying agent is supplied to achieve complete gasification [36,37]. Therefore, it is generally considered to define the optimal conditions of a gasification process [36,38]. It is also considered a two-stage model. In the first stage, below the carbon boundary point, only heterogeneous reactions take place. In the second stage, above the carbon boundary point, only homogeneous reactions occur [31,36].
The modified stoichiometric equilibrium model presented herein is based on the following typical assumptions [27,36]:
- -
- The gasifier is considered zero-dimensional and adiabatic;
- -
- Residence time is long enough for the equilibrium state to be achieved;
- -
- Hydrodynamic behavior is considered as homogeneous mixing with uniform pressure and temperature;
- -
- Tars and ashes contents are considered negligible.
The stoichiometric equilibrium model is developed as a two-stage model considering a sub-model for gasification at and below the CBP, where a heterogeneous equilibrium is present, and another sub-model for gasification above the CBP, where homogeneous equilibrium is present, i.e., all the components are in the gaseous state, as in references [31,38].
2.4.1. Model at and below the CBP
• Mass Balance
The global gasification reaction of a mole of biomass in m moles of air can be expressed as follows:
where the subscripts ni denotes the stoichiometric coefficients. CHxOyNz denotes the biomass material, and x, y, and z denote the numbers of atoms of hydrogen, oxygen, and nitrogen per number of atoms of carbon present in the biomass. w and m denote the quantity of moisture and oxygen per mole of biomass, respectively. The subscripts x, y, z, and w are obtained from the ultimate analysis of the biomass.
The atomic balance for the chemical elements C, H, O, and N are defined as follows:
• Thermodynamic Heterogeneous Equilibrium
Three independent equilibrium chemical reactions are enough for the heterogeneous equilibrium. The relevant gasification reactions in this regard are the Boudouard reaction (Equation (6)), the water–gas (Equation (7)), and methane formation (Equation (8)) [31,39].
The equilibrium constants for those reactions are [31]
where nt denotes the total number of moles of produced gas, PRef denotes the standard pressure (1 atm), P denotes the pressure at the operating condition, and ki(T) denotes the equilibrium constant that can also be obtained using the standard Gibbs function [39],
where R denotes the universal gas constant and the standard Gibbs function of formation of the gas species i, which can be determined as follows [39]:
The coefficients a’–g’ and the enthalpy of formation of the gases are given in Table 3.
• Energy Balance
The gasification temperature can be obtained by the following global energy balance equation for 1 kg of biomass considering that the process is adiabatic [39].
Taking into account the global gasification reaction of Equation (1), the global energy balance can be expressed as
, , and denote the biomass enthalpy of formation, the enthalpy of vaporization of water, and the specific heat, respectively. refers to the temperature difference at any given T and at 298 K. The enthalpy of formation of the biomass can be computed by the following relationship [41]:
where denotes the enthalpy of formation of product i under complete combustion of the biomass and LHV denotes the lower heating value of the biomass. The LHV of the biomass is computed by subtracting the higher heating value (HHV) of the biomass by the enthalpy of vaporization of water as follows [26]:
where H and M denote the hydrogen and moisture fractions on an as-received basis. The value 2260 is the latent heat of the water in kJ/kg. The HHV of the biomass is computed accordingly to the correlation of Channiwala and Parikh [42],
where the mass percentages of the compounds are those obtained by ultimate analysis on a dry basis.
2.4.2. Model Above the CBP
• Mass Balance
The balance for, C, H2, O2, and N2 can be given by [31]
where , ,, , and denotes the molar amount of produced gas, carbon monoxide, carbon dioxide, methane, hydrogen, and water, respectively. , , and denotes the molar amount of air, oxygen in the air, and nitrogen in the air. The subscript CBP stands for a species molar amount at the CBP.
• Thermodynamic Homogeneous Equilibrium
The pertinent chemical reactions are the water–gas shift reaction (Equation (24)) and methanation reaction (Equation (25)) [36].
The equilibrium constants for those reactions are [31]
These equilibrium constants are obtained using Equation (12).
• Energy Balance
The global energy balance equation for the homogenous stage of the model is defined as follows [31,38]:
where denotes the product between the air enthalpy difference by the molar amount of air, denotes the product between the water enthalpy difference by the molar amount of water vapor, denotes the produced gas enthalpy difference, and LHVgas denotes the lower heating value of the produced gas. The unknowns in Equation (28) are computed thanks to Equations (16)–(19).
2.4.3. Calculation Procedure
It is known that equilibrium models at relatively low gasification temperatures overestimate carbon monoxide and hydrogen yields and underestimates carbon dioxide and methane yields [25,43]. Therefore, to improve the predictive capabilities of the developed equilibrium model, the multiplicative factors of Jarungthammachote and Dutta [39] were used. According to their methodology, the equilibrium constants of the water-gas reaction (Equation (10)) and methanation reaction (Equation (11)) were multiplied by 0.91 and 11.28, respectively. The values of , , , , , nt, and TCBP are computed in the first stage of the model, i.e., below and at the CBP, assuming an initial temperature. In the second stage of the model, i.e., above the CBP, the same methodology was followed to solve the homogeneous equilibrium. The values of , , , , and . obtained in the first stage of the model are used as input parameters for the second stage of the model.
The described stoichiometric modified equilibrium model was implemented and solved in Matlab (MathWorks Inc., Natick, MA, USA) software using the Newton–Raphson method.
3. Results and Discussion
3.1. Experimental Results
The operating conditions of the downdraft gasifier were characterized by the biomass feed rate, air feed rate, equivalence ratio (ER), and produced gas composition. Table 5 shows the operating conditions, averaged produced gas fractions, and efficiencies to understand the behavior of the whole power production system. The equivalence ratio was computed as the ratio between the actual oxygen added to the gasifier and the stoichiometric oxygen needed for the complete combustion of the biomass. The gasifier airflow intake was estimated by the following empirical expression [44]:
The resulting equivalence ratios were between 0.20 and 0.23. The lower heating value (LHV) of the dry gas was computed based on the molar fractions of fuel gases (Y) and the corresponding LHV at reference conditions [45],
The LHV of the dry gas was found to be between 5.8 and 6.6 MJ/Nm3, with the higher values obtained for equivalence ratios of 0.20. The gas yield was estimated based on the mass balance of N2 in the reactor. It was assumed that all the nitrogen in the fuel exits in the produced gas as N2 and the N2 behaves as an inert gas. The gas yields values obtained for the gasification experiments were between 2.05 and 2.20 Nm3gas/kg BSG.
Carbon conversion efficiency (CCE) defines the fraction of solid carbon converted to gas carbon in the produced gas stream. It is clearly a measure of the amount of unconverted carbon and furnishes an indication of the chemical efficiency of the process. Values of CCE between 85.9 and 87.8% were obtained for the experimental conditions used.
Cold gas efficiency (CGE) was computed as the ratio of the chemical energy in the produced gas and the chemical energy in the biomass. Values of CGE between 74.6 and 82.5% were obtained for the experimental conditions used.
The total efficiency is calculated based on the ratio between the power produced (Pel) and the chemical energy in the biomass as follows:
Values of total efficiency between 15.8% and 17.7% were obtained for the experimental conditions used, which are consistent with other published works [44].
3.2. Model Validation
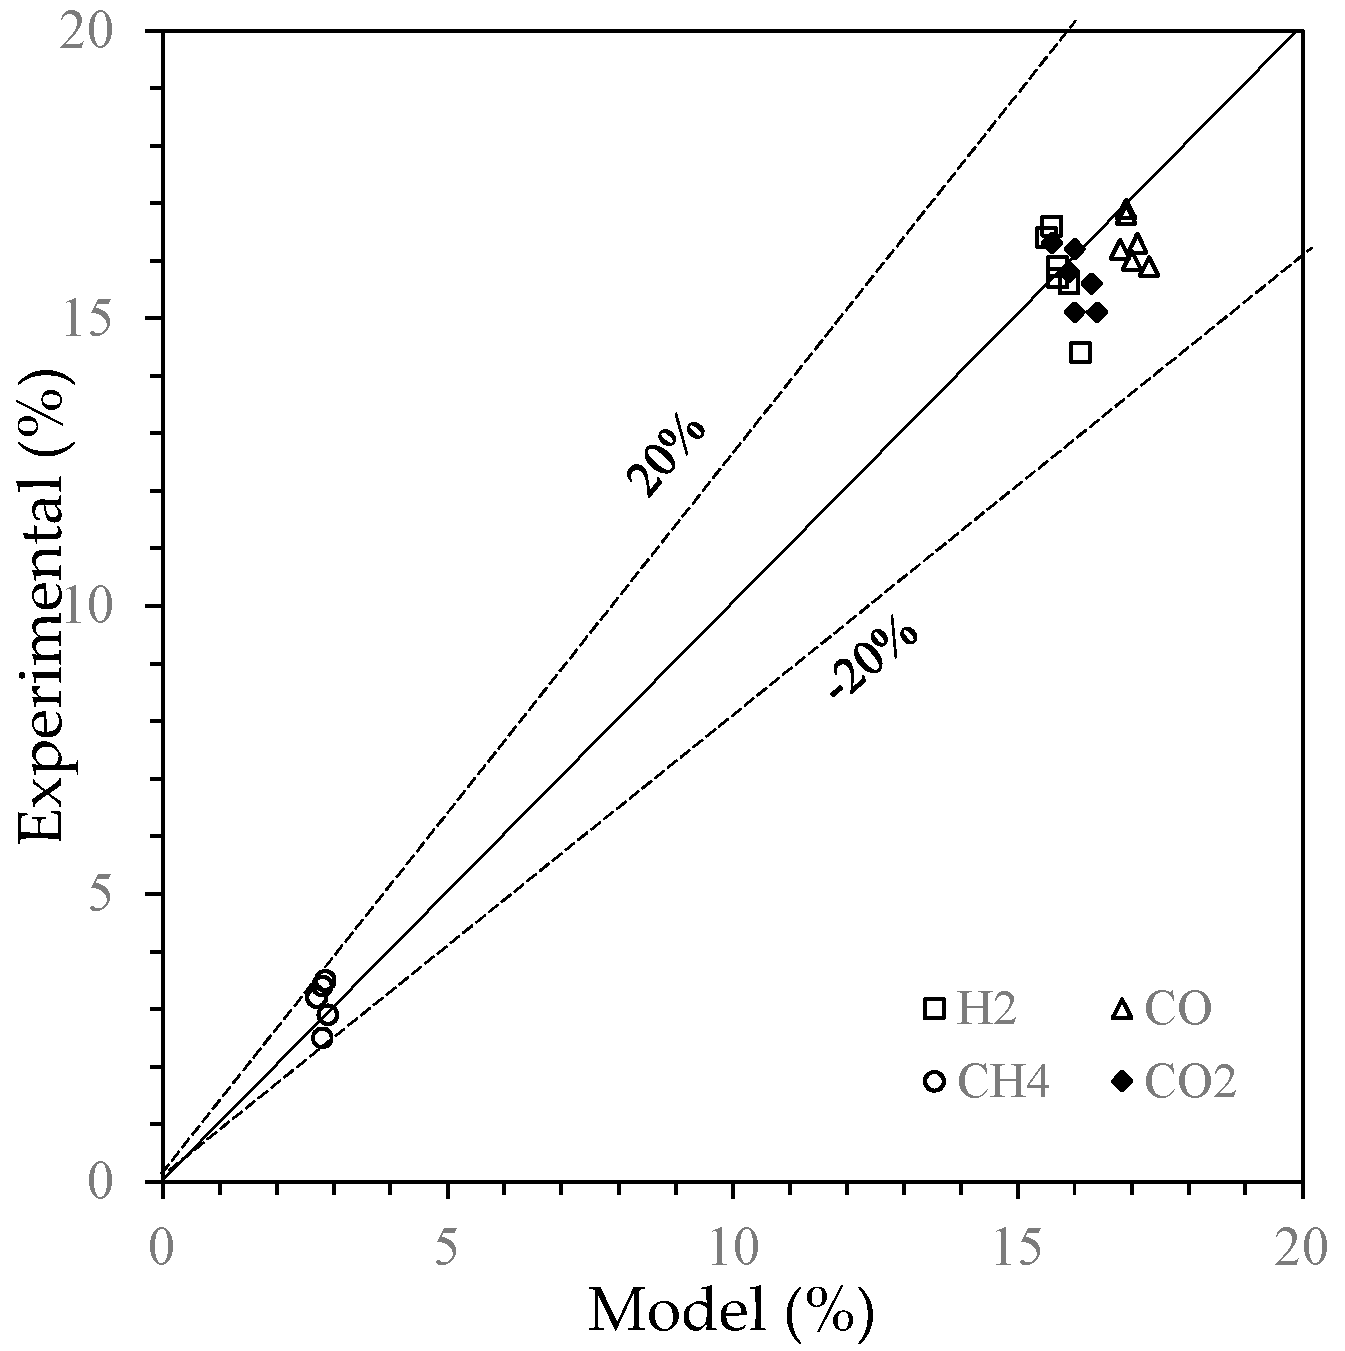
To validate the developed modified stoichiometric equilibrium model, the numerical results were compared with the experimental results obtained in this work. Figure 3 shows a comparison between the numerical results predicted by the developed model (shown in the horizontal axis) and the experimental data (shown in the vertical axis).
From Figure 3, we can see that the developed modified stoichiometric equilibrium model is capable of predicting the produced gas composition within a margin of error of less than 20%. This is a very satisfactory performance for a complex process such as biomass gasification. Greater divergences were detected for methane since reduced molar fractions tend to yield greater relative errors. Moreover, all light hydrocarbons and tars not considered in the model can be lumped into CH4, which can further explain the higher deviation [46]. Moreover, some degree of divergence should be attributed to the model’s nature and assumptions.
3.3. Syngas Quality Assessment for Various Biomass Substrates
Forest and agriculture residues are the most common biomass resources available in Portugal [2,20,47]. Pine, eucalyptus, and cork are the species representative of the forest residues that are most abundant in Portugal [20,47]. Regarding agricultural residues, the most common are the ones deriving from the agricultural activities of the olive oil and wine industries [20]. These biomass resources can be utilized on a larger scale for energy production and were characterized to evaluate their potential using the developed modified stoichiometric equilibrium model. The characterization of selected biomasses is presented in Table 6.
The produced gas quality depends on the ER, which should be substantially lower than stoichiometry to guarantee that the biomass is gasified instead of burned [48]. An excessively low ER results in frequent problems, such as incomplete gasification and minor LHV of the produced gas. A high ER results in excessive formation of combustion products at the expense of fuel gases [48]. According to Narvaez et al. [49], the ER optimum range for biomass gasification lies between 0.2 and 0.4, and this ER interval was therefore used in our analysis. Regarding the gasifying agent, only air is used in our assessment. The reason lies in the fact of air being the most commonly used gasifying agent, as it is obviously economical [50], and it generates a produced gas of low calorific value, due mainly to its high nitrogen content [51]. Steam as a gasifying agent generates a produced gas with a moderate heating value, and its costs are between air and oxygen. Oxygen is the most expensive gasifying agent and, therefore, used only for more advanced applications [4]. Other operating parameters such as pressure or catalysts use can have a great influence on the produced gas quality [19,26]. However, these are beyond the scope of the present assessment.
The results obtained using the developed modified stoichiometric equilibrium model of the downdraft gasification using air as the gasifying agent are presented in Table 7 as a function of ER for the various Portuguese biomasses.
Applications for produced gas can be divided into two main groups—power or heat and fuels or chemical products. Table 8 recapitulates required produced gas characteristics for various end-use options.
Typically, produced gas characteristics are more important for chemicals and fuel synthesis applications than for hydrogen and fuel gas applications. Some process equipment such as scrubbers and coolers can be utilized to correct the characteristics of the produced gas to match those ideals for the chosen end-use. However, this supporting equipment increases the complexity and final cost of the process [52].
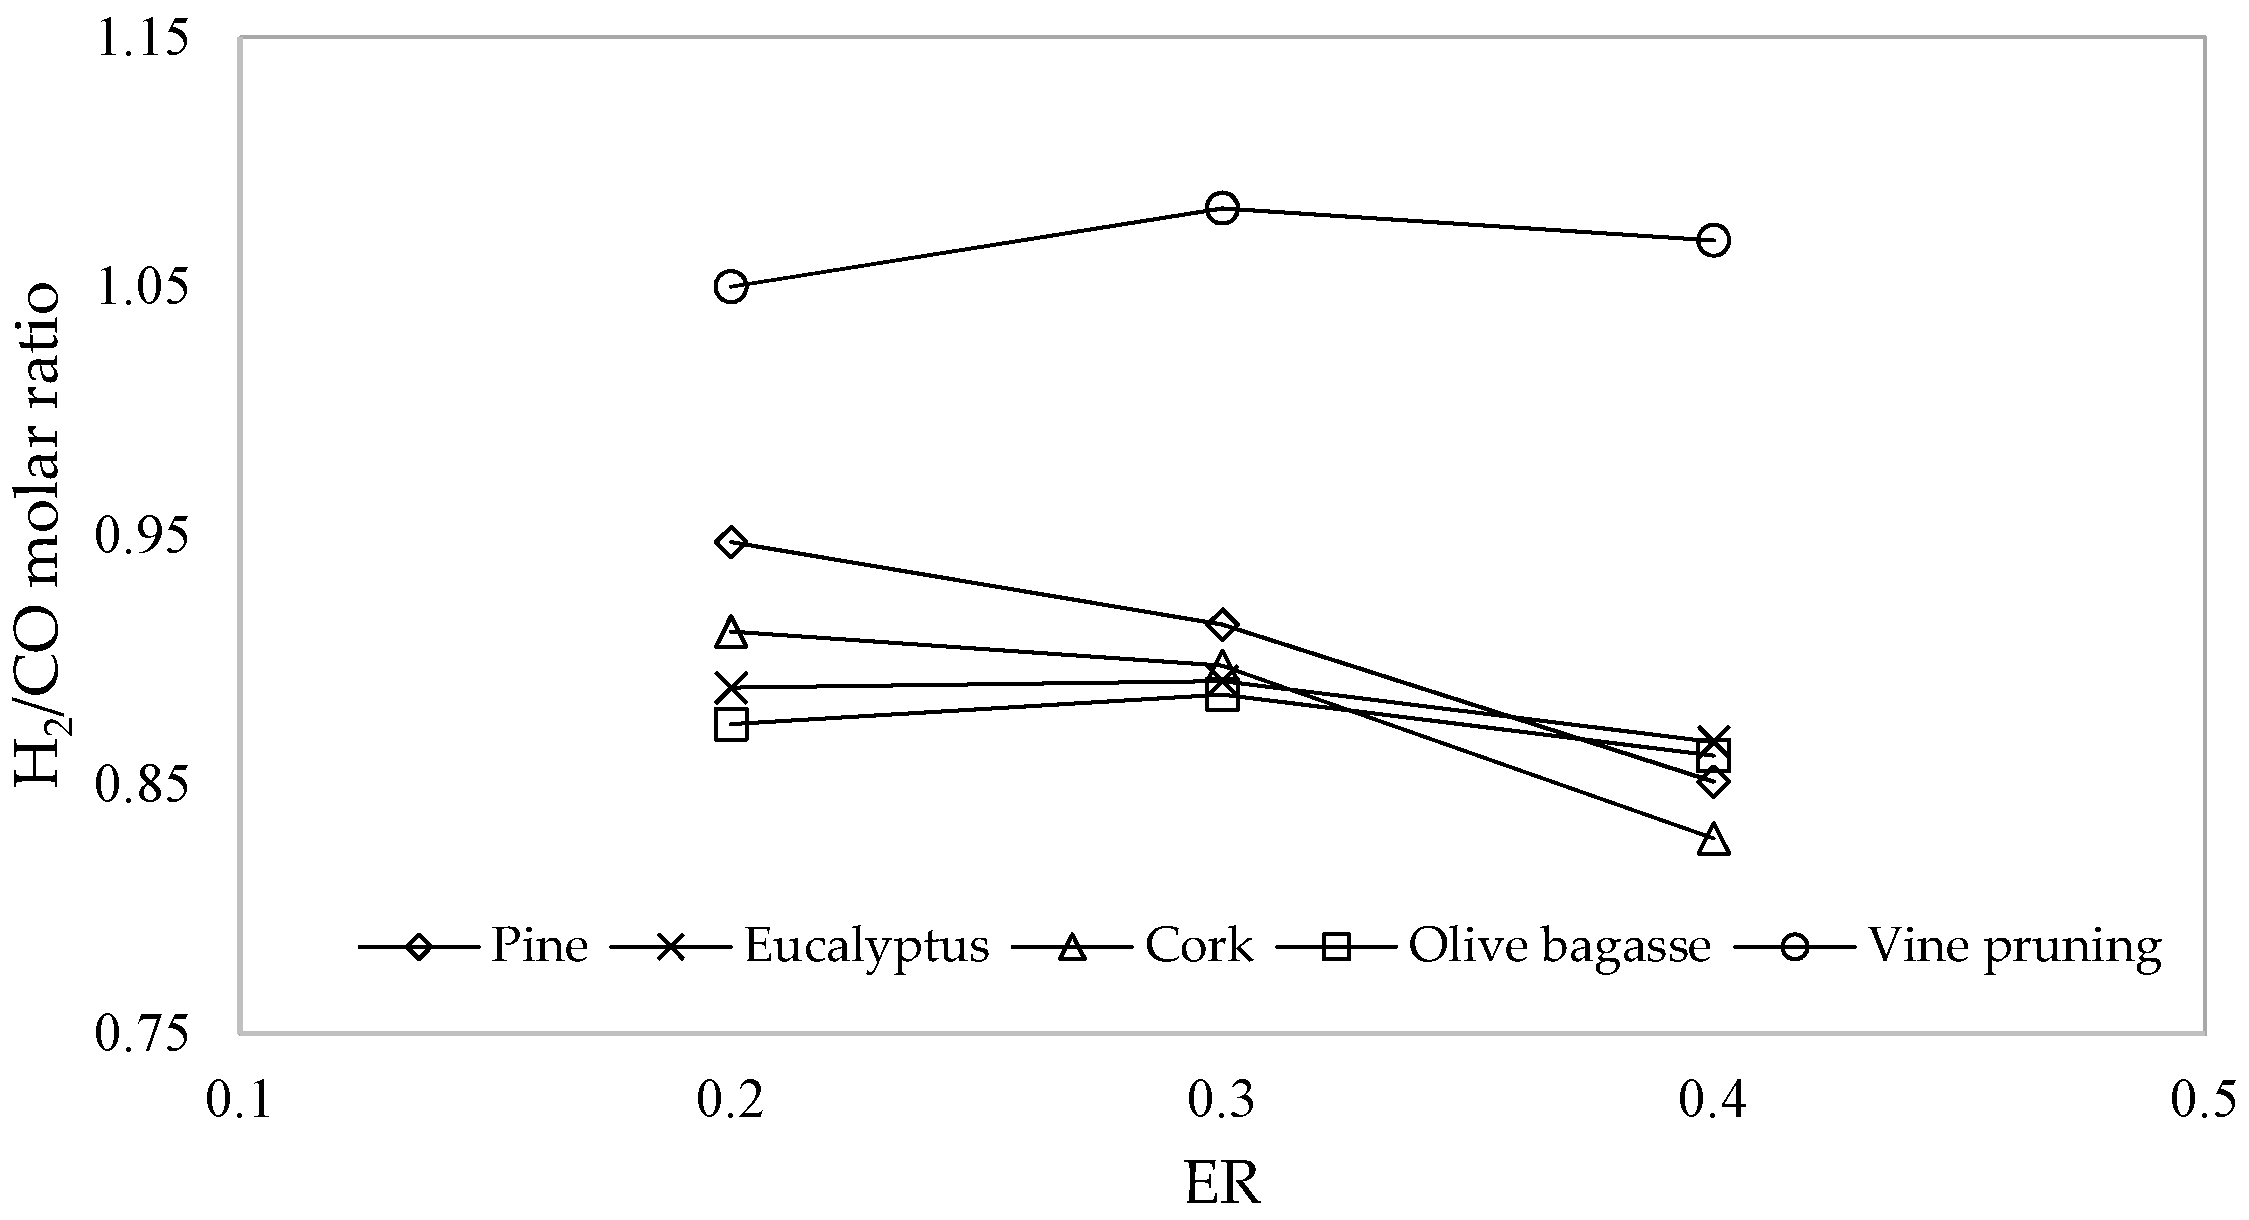
Figure 4 shows the influence of ER on the produced gas H2/CO molar ratio for the various biomasses of Table 6.
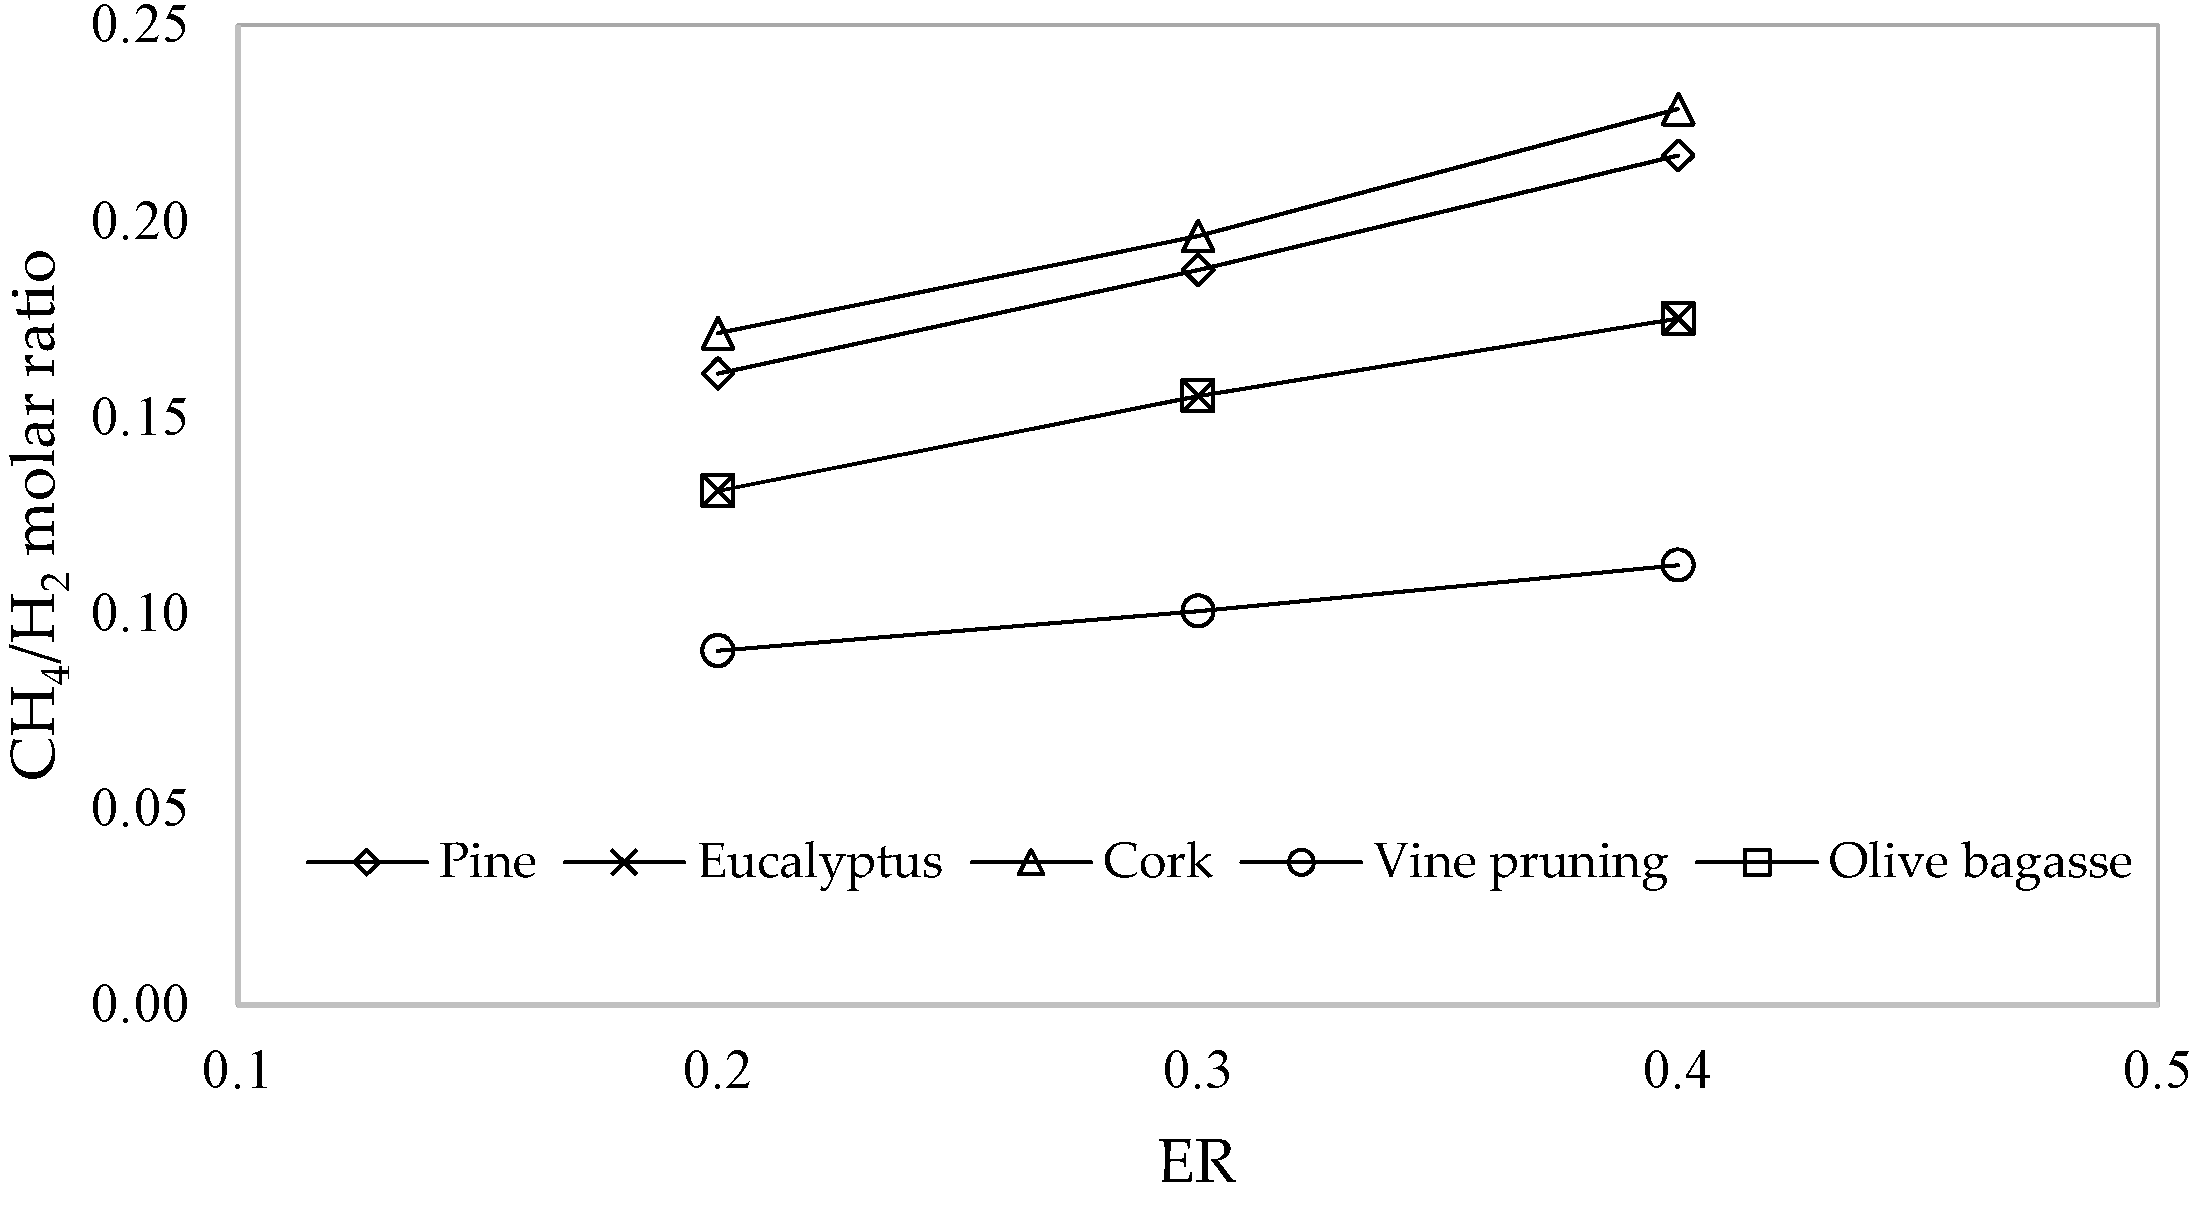
From analyses of Figure 4, it can be seen similar behavior of the H2/CO molar ratio for most of the biomasses under study. The exception is verified for vine pruning, which presents greater H2/CO molar ratios. The explanation is linked to biomasses composition provided by proximate and ultimate analyses of Table 6. From Table 6, it is possible to verify the similar composition of the various biomasses being the distinctive aspect of the greater percentage of volatiles of vine pruning. The volatiles are released in the pyrolysis phase, generating CO, H2, and hydrocarbons as pyrolytic gas products [53]. On the other hand, the increase of ER implies the supply of greater amount of air to the reactor, which favors the oxidation reactions [54]. A low ER ensures high produced gas quality due to higher values of the combustible gases. However, the ER should not be too low because the oxygen supply will not be enough to convert the char. Figure 5 shows the effect of ER on the produced gas CH4/H2 molar ratio for the various biomasses of Table 6.
From Figure 5, it is clear that the CH4/H2 molar ratio increases with ER for the various biomasses. This behavior is explained by the reducing amounts of H2 and the approximately constant amounts of CH4 when increasing ER. It is also seen the similar CH4/H2 molar ratios for eucalyptus and olive bagasse. The reason is the similar ultimate composition of those biomasses, as seen in Table 6. The effect of ER on CH4/H2 molar ratio is very small since it decreases the H2 molar fraction that is much greater than the CH4 molar fraction. In turn, CH4 molar fraction remains almost constant with the increase of ER from 0.2 to 0.4. From the molar fractions obtained in Table 7 and H2/CO molar ratio expressed by Figure 4, and according to Table 8, it is possible to conclude that, using air as a gasifying agent, the biomass gasification only provides a syngas with enough quality to be used for energy production in boilers or turbines. The CH4/H2 molar ratio expressed in Figure 5, and not directly included in Table 8, is important for domestic purposes [55]. However, the low molar ratios obtained do not identify those produced gases as good candidates for replacing natural gas in domestic applications.
4. Conclusions
In this work, experimental and modeling analysis of brewers’ spent grains gasification in a pilot-scale downdraft reactor were performed.
For the experimental part of the work, a pilot-scale integrated gasification power production system called the Power Pallet of 20 kW was used. The gasification process performance was assessed through the produced gas yield and composition, lower heating value, carbon conversion efficiency, and cold gas efficiency. Encouraging results were obtained for all the gasification parameters. The produced gas yields between 2.05 and 2.20 m3/kg, with composition in between 42.7–46.8 % of N2, 15.9–16.9% of CO, 15.1–16.3% of CO2, 14.4–16.6% of H2, 2.5–3.5% of CH4, 1.5–2.5% of C2H4, and 0.3% of C2H6. The heating value of the produced gas was found between 5.8 and 6.6 MJ/m3, carbon conversion efficiency between 85.9 and 87.8%, and cold gas efficiency between 74.6 and 82.5%. It was also found that the Power Pallet works at low equivalence ratios between 0.20 to 0.23 for the power outputs of 3–5 kWh. Moreover, about 1 kWh electrical power was achieved for approximately 1.3 kg of brewers’ spent grains pellets gasified, with an average electrical efficiency of 16.5%. These results are closely in agreement with the power pallet supplier indicative performances.
For the numerical part of the work, a modified stoichiometric equilibrium model of the downdraft gasification was developed to assess the potential applications of the main Portuguese biomasses through produced gas quality indices. The model was validated against the experimental results obtained in the first part of the paper. The sensitivity analysis of the variation of equivalence ratio showed an opposite behavior of the H2/CO and CH4/H2 molar ratios for the biomasses under study. The H2/CO molar ratio decreases with ER, and the CH4/H2 molar ratio decreases with ER. The reason is the similar ultimate composition of the biomasses under study. The exception is verified for vine prunings, which present greater H2/CO molar ratios when ER increases. The explanation is on the distinctive aspect of the vine pruning proximate composition, which shows a greater percentage of volatiles that is released in the pyrolysis stage generating H2 and CO.
A final conclusion could be drawn that using air as a gasifying agent in the biomass gasification only provides a produced gas with enough quality to be used for energy production in boilers or turbines. Even for domestic purposes, it is not a good candidate for replacing natural gas.
Author Contributions
Conceptualization, S.F. and E.M.; methodology, S.F., P.B. and C.V.; software, V.S. and S.F.; validation, S.F., E.M. and P.B.; investigation, S.F., L.C. and V.S.; resources, L.C. and V.S.; data curation, S.F. and E.M.; writing—original draft preparation, S.F.; writing—review and editing, E.M., P.B. and C.V.; supervision, E.M., P.B. and C.V.
Funding
This research was funded by the FOUNDATION FOR SCIENCE AND TECHNOLOGY (FCT), grant number SFRH/BD/91894/2012.
Conflicts of Interest
The authors declare no conflict of interest.
References
- IEA. World Energy Outlook 2018; IEA: Paris, France, 2018. [Google Scholar] [CrossRef]
- Ferreira, S.; Moreira, N.A.; Monteiro, E. Bioenergy overview for Portugal. Biomass Bioenergy 2009, 33, 1567–1576. [Google Scholar] [CrossRef]
- Faaij, A.P.C. Bio-energy in Europe: Changing technology choices. Energy Policy 2006, 34, 322–342. [Google Scholar] [CrossRef]
- Kirkels, A.; Verbong, G. Biomass Gasification: Still promising? A 30-year global overview. Renew. Sust. Energy Rev. 2011, 15, 471–481. [Google Scholar] [CrossRef]
- Ahmad, A.A.; Zawawi, N.A.; Kasim, F.H.; Inayat, A.; Khasri, A. Assessing the gasification performance of biomass: A review on biomass gasification process conditions, optimization and economic evaluation. Renew. Sust. Energy Rev. 2016, 53, 1333–1347. [Google Scholar] [CrossRef]
- Prasad, S.; Singh, A.; Joshi, H.C. Ethanol as an alternative fuel from agricultural, industrial and urban residues. Resour. Conserv. Recycl. 2007, 50, 1–39. [Google Scholar] [CrossRef]
- Liguori, R.; Amore, A.; Faraco, V. Waste valorization by biotechnological conversion into added value products. Appl. Microbiol. Biotechnol. 2013, 97, 6129–6147. [Google Scholar] [CrossRef]
- Lynch, K.M.; Steffen, E.J.; Arendt, E.K. Brewers’ spent grain: A review with an emphasis on food and health. J. Inst. Brew. 2016, 122, 553–568. [Google Scholar] [CrossRef]
- Mussatto, S.I. Brewer’s spent grain: A valuable feedstock for industrial applications. Sci. Food Agric. 2014, 94, 1264–1275. [Google Scholar] [CrossRef]
- Mussatto, S.I.; Dragone, G.; Roberto, I.C. Brewers’ spent grain: Generation, characteristics and potential applications. J. Cereal Sci. 2006, 43, 1–14. [Google Scholar] [CrossRef]
- Ulbricha, M.; Preßla, D.; Fendta, S.; Gadererc, M.; Spliethoff, H. Impact of HTC reaction conditions on the hydrochar properties and CO2 gasification properties of spent grains. Fuel Proc. Technol. 2017, 167, 663–669. [Google Scholar] [CrossRef]
- Aliyu, S.; Bala, M. Brewer’s spent grain: A review of its potentials and applications. Afr. J. Biotechnol. 2011, 10, 324–331. [Google Scholar] [CrossRef]
- Ferreira, S.; Monteiro, E.; Brito, P.; Costa, C.; Calado, L.; Vilarinho, C. Experimental analysis of beer spent grains steam gasification in an allothermal batch reactor. Energies 2019, 12, 912. [Google Scholar] [CrossRef]
- Mathias, T.R.S.; Mello, P.P.M.; Servulo, E.F.C. Solid wastes in brewing process: A review. J. Brew. Distill. 2014, 5, 1–9. [Google Scholar] [CrossRef]
- Stewart, G.G.; Russel, I.; Anstruther, A. Handbook of Brewing, 3rd ed.; CRC Press: Boca Raton, IL, USA, 2017; pp. 83–538. [Google Scholar] [CrossRef]
- Briggs, D.E.; Boulton, C.A.; Brookes, P.A.; Stevens, R. Brewing Science and Practice, 1st ed.; Woodhead Publishing Limited: Cambridge, UK, 2004. [Google Scholar] [CrossRef]
- Kerby, C.; Vriesekoop, F. An Overview of the Utilisation of Brewery By-Products as Generated by British Craft Breweries. Beverages 2017, 3, 24. [Google Scholar] [CrossRef]
- O’Rourke, T. Making the most of your hops. New Brewer. 1994, 11, 20–33. [Google Scholar]
- Couto, N.; Rouboa, A.; Silva, V.; Monteiro, E.; Bouziane, K. Influence of the biomass gasification processes on the final composition of syngas. Energy Procedia 2013, 36, 596–606. [Google Scholar] [CrossRef]
- Ferreira, S.; Monteiro, E.; Brito, P.; Vilarinho, C. Biomass resources in Portugal: Current status and prospects. Renew. Sust. Energy Rev. 2017, 78, 1221–1235. [Google Scholar] [CrossRef]
- Mahmood, A.S.N.; Brammer, J.G.; Hornung, A.; Steele, A.; Poulston, S. The intermediate pyrolysis and catalytic steam reforming of Brewers spent grain. J. Anal. Appl. Pyrolysis 2013, 103, 328–342. [Google Scholar] [CrossRef]
- Borel, L.D.M.S.; Lira, T.S.; Ribeiro, J.A.; Ataíde, C.H.; Barrozo, M.A.S. Pyrolysis of brewer’s spent grain: Kinetic study and products identification. Ind. Crop. Prod. 2018, 21, 388–395. [Google Scholar] [CrossRef]
- Couto, N.; Silva, V.; Monteiro, E.; Brito, P.; Rouboa, A. Modeling of fluidized bed gasification: Assessment of zero-dimensional and CFD approaches. J. Sci. 2015, 24, 378–385. [Google Scholar] [CrossRef]
- Ramos, A.; Monteiro, E.; Rouboa, A. Numerical approaches and comprehensive models for gasification process: A review. Renew. Sust. Energy Rev. 2019, 110, 188–206. [Google Scholar] [CrossRef]
- Ferreira, S.; Monteiro, E.; Brito, P.; Vilarinho, C. A holistic review on biomass gasification modified equilibrium models. Energies 2019, 12, 160. [Google Scholar] [CrossRef]
- Basu, P. Biomass Gasification and Pyrolysis: Practical Design and Theory, 2nd ed.; Elsevier: Oxford, UK, 2013; ISBN 978-0-12-374988-8. [Google Scholar]
- La Villetta, M.; Costa, M.; Massarotti, N. Modelling approaches to biomass gasification: A review with emphasis on the stoichiometric method. Renew. Sust. Energy Rev. 2017, 74, 71–88. [Google Scholar] [CrossRef]
- Altafini, C.R.; Wander, P.R.; Barreto, R.M. Prediction of the working parameters of a wood waste gasifier through an equilibrium model. Energy Convers. Manag. 2003, 44, 2763–2777. [Google Scholar] [CrossRef]
- Zainal, Z.A.; Ali, R.; Lean, C.H.; Seetharamu, K.N. Prediction of performance of a downdraft gasifier using equilibrium modeling for different biomass materials. Energy Convers. Manag. 2001, 42, 1499–1515. [Google Scholar] [CrossRef]
- Azzone, E.; Morini, M.; Pinelli, M. Development of an equilibrium model for the simulation of thermochemical gasification and application to agricultural residues. Renew. Energy 2012, 46, 248–254. [Google Scholar] [CrossRef]
- Silva, V.; Rouboa, A. Using a two-stage equilibrium model to simulate oxygen air enriched gasification of pine biomass residues. Fuel Process. Technol. 2013, 109, 111–117. [Google Scholar] [CrossRef]
- ALL Power Labs. “GEK Gasifier”. 2013. Available online: http://www.gekgasifier.com/ (accessed on 9 February 2019).
- Monteiro, E.; Sotton, J.; Bellenoue, M.; Moreira, N.A.; Malheiro, S. Experimental study of syngas combustion at engine-like conditions in a rapid compression machine. Exp. Fluid Sci. 2011, 35, 1473–1479. [Google Scholar] [CrossRef]
- Allesina, G.; Pedrazzi, S.; Allegretti, F.; Morselli, N.; Puglia, M.; Santunione, G.; Tartarini, P. Gasification of cotton crop residues for combined power and biochar production in Mozambique. Appl. Eng. 2018, 139, 387–394. [Google Scholar] [CrossRef]
- Ayol, A.; Yurdakos, O.T.; Gurgen, A. Investigation of municipal sludge gasification potential: Gasification characteristics of dried sludge in a pilot-scale downdraft fixed bed gasifier. Int. J. Hydrog. Energy 2019, 44, 17397–17410. [Google Scholar] [CrossRef]
- Prins, M.J.; Ptasinski, K.J.; Janssen, F.J.J.G. Thermodynamics of gas-char reactions first and second law analysis. Chem. Eng. Sci. 2003, 58, 1003–1011. [Google Scholar] [CrossRef]
- Ptasinski, K.J.; Prins, M.J.; Pierik, A. Exergetic evaluation of biomass gasification. Energy 2007, 32, 568–574. [Google Scholar] [CrossRef]
- Karamarkovic, R.; Karamarkovic, V. Energy and exergy analysis of biomass gasification at different temperatures. Energy 2010, 35, 537–549. [Google Scholar] [CrossRef]
- Jarungthammachote, S.; Dutta, A. Thermodynamic equilibrium model and second law analysis of a downdraft waste gasifier. Energy 2007, 32, 1660–1669. [Google Scholar] [CrossRef]
- Probstein, R.F.; Hicks, R.E. Synthetic Fuel; McGraw-Hill: New York, NY, USA, 1982. [Google Scholar]
- De Souza-Santos, M.L. Solid Fuels Combustion and Gasification: Modeling, Simulation, and Equipment Operation; Marcel Dekker: New York, NY, USA, 2004. [Google Scholar]
- Channiwala, S.A.; Parikh, P.P. A unified correlation for estimating HHV of solid, liquid and gaseous fuels. Fuel 2002, 81, 1051–1063. [Google Scholar] [CrossRef]
- Puig-Arnavat, M.; Bruno, J.C.; Coronas, A. Review and analysis of biomass gasification models. Renew. Sust. Energy Rev. 2010, 14, 2841–2851. [Google Scholar] [CrossRef]
- Dion, L.-M.; Lefsrud, M.; Orsat, V.; Cimon, C. Biomass gasification and syngas combustion for greenhouse CO2 enrichment. Bioresources 2013, 8, 1520–1538. [Google Scholar] [CrossRef]
- Kaewluan, S.; Pipatmanomai, S. Potential of synthesis gas production from rubber wood chip gasification in a bubbling fluidised bed gasifier. Energy Convers. Manag. 2011, 52, 75–84. [Google Scholar] [CrossRef]
- Couto, N.; Silva, V.; Monteiro, E.; Rouboa, A. Exergy analysis of Portuguese municipal solid waste treatment via steam gasification. Energy Convers. Manag. 2017, 134, 235–246. [Google Scholar] [CrossRef]
- Monteiro, E.; Mantha, V.; Rouboa, A. The Feasibility of Biomass Pellets Production in Portugal. Energy Source. Part B 2013, 8, 28–34. [Google Scholar] [CrossRef]
- Monteiro, E.; Ismail, T.M.; Ramos, A.; Abd El-Salam, M.; Brito, P.; Rouboa, A. Assessment of the miscanthus gasification in a semi-industrial gasifier using a CFD model. Appl. Eng. 2017, 123, 448–457. [Google Scholar] [CrossRef]
- Narvaez, I.; Orío, A.; Aznar, M.P.; Corella, J. Biomass gasification with air in an atmospheric bubbling fluidized bed. Effect of six operational variables on the quality of the produced raw gas. Ind. Eng. Chem. Res. 1996, 35, 2110–2120. [Google Scholar] [CrossRef]
- Ruiz, J.A.; Juárez, M.C.; Morales, M.P.; Muñoz, P.; Mendívil, M.A. Biomass gasification for electricity generation: Review of current technology barriers. Renew. Sust. Energy Rev. 2013, 18, 174–183. [Google Scholar] [CrossRef]
- Wang, L.; Weller, C.L.; Jones, D.D.; Hanna, M.A. Contemporary issues in thermal gasification of biomass and its application to electricity and fuel production. Biomass Bioenergy 2008, 32, 573–581. [Google Scholar] [CrossRef]
- Ciferno, J.P.; Marano, J.J. Benchmarking Biomass Gasification Technologies for Fuels, Chemicals and Hydrogen Production; U.S. Department of Energy, National Energy Technology Laboratory: Pittsburgh, PA, USA, 2002. [Google Scholar]
- Hua, X.; Gholizadeh, M. Biomass pyrolysis: A review of the process development and challenges from initial researches up to the commercialisation stage. J. Energy Chem. 2019, 39, 109–143. [Google Scholar] [CrossRef] [Green Version]
- Silva, V.; Couto, N.; Monteiro, E.; Rouboa, A. Assessment of municipal solid wastes gasification in a semi-industrial gasifier using syngas quality indices. Energy 2015, 93, 864–873. [Google Scholar] [CrossRef]
- Silva, V.; Monteiro, E.; Couto, N.; Brito, P.; Rouboa, A. Analysis of syngas quality from Portuguese biomasses: An experimental and numerical study. Energy Fuels 2014, 28, 5766–5777. [Google Scholar] [CrossRef]
Figure 1.
Pilot-scale downdraft reactor. Left: (1) Hopper, (2) Valves to flare and engine, (3) Control unit, (4) Ash vessel, (5) Gas filter, (6) Operational panel, (7) Generator, (8) Wiring box, (9) Grid-tie. Right: (1) Flare, (2) Exhaust stack, (3) Reactor access port, (4) Gasifier, (5) Air inlet check valve, (6) Cyclone, (7) Filter condensate drain bung, (8) Filter lid-locking lever, (9) drying bucket.

Figure 2.
Schematic view of the gasifier system.

Figure 3.
Comparison between modeled and measured produced gas composition for BSG gasification.

Figure 4.
Produced gas H2/CO molar ratio as a function of equivalence ratio (ER) for various biomasses.
Figure 4.
Produced gas H2/CO molar ratio as a function of equivalence ratio (ER) for various biomasses.

Figure 5.
Produced gas CH4/H2 molar ratio as a function of ER for various biomasses.


Table 1.
Characterization of brewers’ spent grain pellets [13].
Table 1.
Characterization of brewers’ spent grain pellets [13].
| Parameter | Value | Parameter | Value |
|---|---|---|---|
| Moisture (%) | 12.7 | Density (kg/m3) | 517 |
| HHV (MJ/kg) | 17.8 | LHV (MJ/kg) | 16.5 |
| Proximate analysis (%, db) | Ultimate analysis (%, daf) | ||
| Ash | 3.8 | C | 48.3 |
| Volatile | 86.8 | H | 5.6 |
| Fixed carbon | 9.4 | N | 5.5 |
Table 2.
Power Pallet specifications [32].
Table 2.
Power Pallet specifications [32].
| Property | Value |
|---|---|
| Power output | 3–15 kW at 50 Hz |
| Biomass consumption | 18 kg/h at 15 kW |
| Moisture tolerance | <30% |
| Dimensions | 1.4 × 1.4 × 2.2 m |
| Weight | 1065 kg |
| Feedstock hopper capacity | 0.33 m3 |
Table 3.
Enthalpy of formation (kJ/mol) and coefficients of the Gibbs equation (kJ/mol) [40].
Table 3.
Enthalpy of formation (kJ/mol) and coefficients of the Gibbs equation (kJ/mol) [40].
| Substance | h0f | a’ | b’ | c’ | d’ | e’ | f’ | g’ |
|---|---|---|---|---|---|---|---|---|
| CO | −110.5 | 5.619 × 10⁻³ | −1.190 × 10⁻⁵ | 6.383 × 10⁻⁹ | −1.846 × 10⁻¹² | −4.891 × 10² | 8.684 × 10⁻¹ | −6.131 × 10⁻² |
| CO2 | −393.5 | −1.949 × 10⁻² | 3.122 × 10⁻⁵ | −2.448 × 10⁻⁸ | 6.946 × 10⁻¹² | −4.891 × 10² | 5.270 | −1.207 × 10⁻¹ |
| CH4 | −74.8 | −4.620 × 10⁻² | 1.130 × 10⁻⁵ | 1.319 × 10⁻⁸ | −6.647 × 10⁻¹² | −4.891 × 10² | 1.411 × 101 | −2.234 × 10⁻¹ |
| H2O | −241.8 | −8.950 × 10⁻³ | −3.672 × 10⁻⁶ | 5.209 × 10⁻⁹ | −1.478 × 10⁻¹² | 0.000 | 2.868 | −1.722 × 10⁻² |
Table 4.
Coefficients for the specific heat calculation [41].
Table 4.
Coefficients for the specific heat calculation [41].
| Species | a1 | a2 | a3 | a4 |
|---|---|---|---|---|
| C | 16.336 | 0.60972 × 10⁻² | −0.64762 × 10⁻⁶ | −836,340 |
| CO | 28.448 | 0.23633 × 10⁻² | −0.24877 × 10⁻⁶ | 4291.9 |
| CO2 | 36.299 | 0.20352 × 10⁻¹ | −0.21455 × 10⁻⁵ | −449,100 |
| CH4 | 23.607 | 0.49622 × 10⁻¹ | −0.52248 × 10⁻⁵ | −212,800 |
| H2O | 28.166 | 0.14667 × 10⁻¹ | −0.15433 × 10⁻⁵ | 100,230 |
| H2 | 25.310 | 0.82575 × 10⁻² | −0.86850 × 10⁻⁶ | 106,010 |
| N2 | 27.883 | 0.29838 × 10⁻² | −0.31384 × 10⁻⁶ | 38,452 |
Table 5.
Experimental operating conditions and producer gas analysis for brewer’s spent grains (BSG).
Table 5.
Experimental operating conditions and producer gas analysis for brewer’s spent grains (BSG).
| Experimental Conditions | Run 1 | Run 2 | Run 3 | Run 4 | Run 5 | Run 6 |
|---|---|---|---|---|---|---|
| Biomass feed rate (kg/h) | 4.0 | 3.9 | 3.7 | 6.9 | 6.8 | 6.5 |
| Air feed rate (Nm3/h) | 4.9 | 4.3 | 4.0 | 8.1 | 7.7 | 7.0 |
| Equivalence ratio | 0.23 | 0.21 | 0.20 | 0.22 | 0.21 | 0.20 |
| Produced gas fraction (%vol. db) | ||||||
| H2 | 14.4 ± 1.7 | 15.9 ± 0.5 | 16.4 ± 0.4 | 15.6 ± 0.9 | 15.7 ± 0.4 | 16.6 ± 0.2 |
| CO | 15.9 ± 1.5 | 16.0 ± 0.4 | 16.2 ± 0.2 | 16.3 ± 0.2 | 16.8 ± 0.5 | 16.9 ± 0.5 |
| CH4 | 3.2 ± 1.4 | 3.4 ± 0.9 | 3.5 ± 0.9 | 2.5 ± 0.7 | 2.5 ± 0.6 | 2.9 ± 0.4 |
| CO2 | 16.3 ± 1.8 | 16.2 ± 0.7 | 15.6 ± 0.3 | 15.8 ± 0.3 | 15.1 ± 0.6 | 15.1 ± 0.7 |
| N2 | 46.2 ± 2.1 | 43.8 ± 2.6 | 42.7 ± 3.4 | 46.8 ± 1.8 | 44.9 ± 2.0 | 43.2 ± 2.9 |
| O2 | 2.2 ± 0.3 | 2.4 ± 0.6 | 3.2 ± 0.6 | 2.1 ± 0.4 | 2.2 ± 0.5 | 2.5 ± 0.9 |
| C2H2 | 0.0 ± 0.0 | 0.0 ± 0.0 | 0.1 ± 0.0 | 0.0 ± 0.0 | 0.0 ± 0.0 | 0.0 ± 0.0 |
| C2H4 | es1.5 ± 0.6 | 2.0 ± 0.1 | 2.0 ± 0.1 | 2.1 ± 0.1 | 2.4 ± 0.3 | 2.5 ± 0.3 |
| C2H6 | 0.3 ± 0.0 | 0.3 ± 0.0 | 0.3 ± 0.0 | 0.3 ± 0.0 | 0.3 ± 0.0 | 0.3 ± 0.0 |
| Gasification process characteristics | ||||||
| Gas LHV (MJ/Nm3) | 5.8 | 6.3 | 6.5 | 5.9 | 6.4 | 6.6 |
| Gas yield (Nm3) | 8.5 | 8.0 | 7.9 | 15.2 | 14.2 | 13.4 |
| Cold gas efficiency (%) | 74.6 | 78.7 | 82.4 | 79.5 | 80.6 | 82.5 |
| Carbon conversion efficiency (%) | 87.8 | 86.3 | 87.6 | 86.3 | 86.1 | 85.9 |
| Power output characteristics | ||||||
| Power output (kWh) | 3.0 | 3.0 | 3.0 | 5.0 | 5.0 | 5.0 |
| Total efficiency (%) | 16.4 | 16.8 | 17.7 | 15.8 | 16.0 | 16.8 |
Table 6.
Characterization of selected biomasses.
| Biomass Properties | Pine | Eucalyptus | Cork | Olive Bagasse | Vine Pruning |
|---|---|---|---|---|---|
| Proximate analysis (%, ar) | |||||
| Ash | 2.6 | 7.5 | 9.4 | 13.1 | 2.7 |
| Volatile | 53.6 | 41.7 | 62.1 | 57.8 | 72.5 |
| Fixed carbon | 36.4 | 44.0 | 13.4 | 19.7 | 11.5 |
| Moisture | 7.4 | 6.8 | 15.1 | 9.4 | 13.3 |
| Ultimate analysis (%, daf) | |||||
| C | 42.7 | 43.7 | 45.2 | 43.2 | 41.3 |
| H | 5.8 | 5.6 | 5.3 | 5.6 | 5.5 |
| N | 2.1 | 0.5 | 0.6 | 1.9 | 2.6 |
| S | 0.0 | 0.0 | 0.0 | 0.0 | 0.0 |
| O | 49.4 | 50.2 | 48.9 | 49.3 | 50.6 |
| HHV (MJ/kg) | 18.4 | 17.8 | 16.4 | 17.5 | 15.1 |
Table 7.
Model results for various Portuguese biomasses.
| Biomass | Pine | ||
| Simulation conditions (ER) | 0.20 | 0.30 | 0.40 |
| Produced gas fraction (%vol. db) | |||
| H2 | 18.0 | 16.0 | 14.3 |
| CO | 19.0 | 17.5 | 16.8 |
| CH4 | 2.9 | 3.0 | 3.1 |
| CO2 | 12.0 | 13.5 | 14.7 |
| Biomass | Eucalyptus | ||
| Simulation conditions (ER) | 0.20 | 0.30 | 0.40 |
| Produced gas fraction (%vol. db): | |||
| H2 | 16.0 | 14.8 | 13.7 |
| CO | 18.0 | 16.6 | 15.8 |
| CH4 | 2.1 | 2.3 | 2.4 |
| CO2 | 14.0 | 15.0 | 15.9 |
| Biomass | Cork | ||
| Simulation conditions (ER) | 0.20 | 0.30 | 0.40 |
| Produced gas fraction (%vol. db) | |||
| H2 | 17.5 | 15.8 | 14.0 |
| CO | 19.2 | 17.6 | 16.9 |
| CH4 | 3.0 | 3.1 | 3.2 |
| CO2 | 11.8 | 13.3 | 14.5 |
| Biomass | Olive Bagasse | ||
| Simulation conditions (ER) | 0.20 | 0.30 | 0.40 |
| Produced gas fraction (%vol. db) | |||
| H2 | 16.0 | 14.8 | 13.7 |
| CO | 18.3 | 16.7 | 15.9 |
| CH4 | 2.1 | 2.3 | 2.4 |
| CO2 | 14.5 | 15.4 | 16.1 |
| Biomass | Vine Prunings | ||
| Simulation conditions (ER) | 0.20 | 0.30 | 0.40 |
| Produced gas fraction (%vol. db) | |||
| H2 | 21.0 | 19.9 | 18.7 |
| CO | 20.0 | 18.4 | 17.5 |
| CH4 | 1.9 | 2.0 | 2.1 |
| CO2 | 11.0 | 11.7 | 12.5 |
Table 8.
Produced gas characteristic guidelines for different applications [52].
Table 8.
Produced gas characteristic guidelines for different applications [52].
| Application | H2/CO | Hydrocarbons | N2 | CO2 | Heating Value |
|---|---|---|---|---|---|
| Synthetic fuels | 0.6 | Low | Low | Low | Irrelevant |
| Methanol | 2.0 | Low | Low | Low | Irrelevant |
| Hydrogen | High | Low | Low | Not critical | Irrelevant |
| Boiler | Irrelevant | High | Irrelevant | Not critical | High |
| Turbine | Irrelevant | High | Irrelevant | Not critical | High |
© 2019 by the authors. Licensee MDPI, Basel, Switzerland. This article is an open access article distributed under the terms and conditions of the Creative Commons Attribution (CC BY) license (http://creativecommons.org/licenses/by/4.0/).
Share and Cite
MDPI and ACS Style
Ferreira, S.; Monteiro, E.; Calado, L.; Silva, V.; Brito, P.; Vilarinho, C. Experimental and Modeling Analysis of Brewers´ Spent Grains Gasification in a Downdraft Reactor. Energies 2019, 12, 4413. https://doi.org/10.3390/en12234413
AMA Style
Ferreira S, Monteiro E, Calado L, Silva V, Brito P, Vilarinho C. Experimental and Modeling Analysis of Brewers´ Spent Grains Gasification in a Downdraft Reactor. Energies. 2019; 12(23):4413. https://doi.org/10.3390/en12234413
Chicago/Turabian StyleFerreira, Sérgio, Eliseu Monteiro, Luís Calado, Valter Silva, Paulo Brito, and Cândida Vilarinho. 2019. "Experimental and Modeling Analysis of Brewers´ Spent Grains Gasification in a Downdraft Reactor" Energies 12, no. 23: 4413. https://doi.org/10.3390/en12234413
Note that from the first issue of 2016, this journal uses article numbers instead of page numbers. See further details here.