Article

Permeability Evolution at Various Pressure Gradients in Natural Gas Hydrate Reservoir at the Shenhu Area in the South China Sea

1
Guangzhou Marine Geological Survey, China Geological Survey, Guangzhou 510075, China
2
Center of Oil & Natural Gas Resource Exploration, China Geological Survey, Beijing 100083, China
3
School of Energy Resources, China University of Geosciences, Beijing 100083, China
4
Institute of Geophysics and Geomatics, China University of Geosciences, Wuhan 430074, China
*
Authors to whom correspondence should be addressed.
Energies 2019, 12(19), 3688; https://doi.org/10.3390/en12193688
Submission received: 11 August 2019 / Revised: 7 September 2019 / Accepted: 12 September 2019 / Published: 26 September 2019
(This article belongs to the Section H: Geo-Energy)

Abstract

:
The sediment of the hydrate reservoir in the Shenhu Area is mainly clayey silt. Its characteristic small particles and poor cementation challenge the quantification of the reservoir permeability during gas production. An accurate description of the seepage mechanism of the clayey-silt reservoir is the basis, and also a difficulty, of effective development of gas in the South China Sea. In this study, four sets of water seepage experiments under different pressure gradients are carried out using the clayey-silt reservoir sediments, in which the fourth sample was subjected to computed tomographic (CT) scans. The experimental results shows that the clayey-silt reservoir has a compression of the pore structure and decreasing permeability with the increasing pressure gradient. CT images are used to show the reduction of pore spaces for fluid flow. When the pressure gradient is less than 3 MPa per meter, the pore structure of the reservoir has minor changes. When the pressure gradient is greater than this value, the pore structure of the reservoir will be quickly compressed. This leads to a rapid decrease in permeability, and the process of permeability reduction is irreversible. The decrease of permeability can be predicted directly by establishing a power law model with the change of porosity. Our experimental results preliminarily reveal the dynamic evolution law of pore structure and permeability of clayey-silt reservoir in the process of gas hydrate exploitation via depressurization. The permeability evolution law at various pressure gradients provides a scientific and reasonable basis of a productivity control system for clayey-silt gas hydrate in depressurized gas production.

1. Introduction

With the tightening of conventional oil and gas resources, vigorously developing unconventional oil and gas reservoirs becomes an important way to alleviate current resource shortages, adjust energy utilization structures, and ensure national energy security [1,2]. In 2017, the China Geological Survey conducted the test production of natural gas hydrate reservoir via depressurization [3,4] at the Shenhu Area in the South China Sea. The test production created a world record for the longest sustained gas production and the largest total gas production [5]. The success of the test production not only provided an important foundation for the commercial exploitation of natural gas hydrate, but also brought many challenges and urgent problems to be solved [6,7,8,9,10,11,12,13].
The natural gas hydrate reservoir at the Shenhu Area in the South China Sea is different from sandstone reservoirs found in other regions and countries [5]. The main lithology of the hydrate reservoir in the Shenhu Area is clayey silt, which has the characteristics of non-diagenesis, poor cementation, high clay mineral content, and low median grain size. When the bottom flow pressure of the hydrate reservoir production well starts to reduce, the hydrate phase equilibrium condition will be broken, and the decomposed methane gas and water will discharge from the decomposition front edge to the production wellbore through the clayey-silt porous media. Moreover, as the decomposition front edge extends to the reservoir, the seepage property of the hydrate-free clayey-silt sediments near the production well will determine the well production. If the control of the depressurization amplitude is unreasonable, the pore-throat structure of the clayey-silt porous media will be deformed, which will affect seepage capacity around the production well and reduce single-well production [14,15,16]. Therefore, in this study, we select the clayey-silt sediment after hydrate decomposition as the research object, to grasp the critical pressure gradient in these kinds of reservoirs and avoid the decrease of permeability in well production.
Since the pore size of clayey-silt sediments is small, the structure changing property of the reservoir needs to be analyzed from the microscopic view. Now the digital core technology based on computed tomographic (CT) scan is widely used as a three-dimensional (3D) microscopic analysis tool, which extracts the microstructure of the reservoir through core imaging and pore network, and obtains relevant physical parameters [17,18,19,20]. However, there are few studies on the seepage characteristics of the natural gas hydrate reservoir sediments in the South China Sea and the structure image of the sediments under different seepage pressures. In this study, we adopt digital core technology and combine it with seepage experiments to study the structure changing of clayey-silt samples and their effects on reservoir permeability under different pressure gradients. The main works are as follows: Firstly, the experimental instrument group capable of simultaneous seepage and CT scan is designed according to the lithology characteristics of clayey-silt reservoirs. Then, four groups of reservoir samples are subjected to single-phase water seepage experiments, and the fourth sample is simultaneously scanned by CT during the experiment. Finally, the results of seepage experiment and CT scan image data are utilized to analyze the evolution of reservoir permeability under different pressure gradients.

2. Geological Setting

The tested samples come from the natural gas hydrate reservoir in the Shenhu Area (Figure 1). The pore space of the hydrate reservoir consists of solid hydrate, free gas, and pore water. The average effective porosity is 33.0%, the hydrate (gas) saturation is 31%, and average permeability is about 1.5 mD in situ. The lithology of the hydrate reservoir is mainly clayey silt and the median particle size of the sediment is 12 μm. The reservoir minerals are mainly composed of feldspar (53%), carbonate (16%), and clay minerals (26%–30%). The clay minerals are mainly montmorillonite and illite. Detailed geological, ore body, seismic, and logging information can be further found in literature [5].

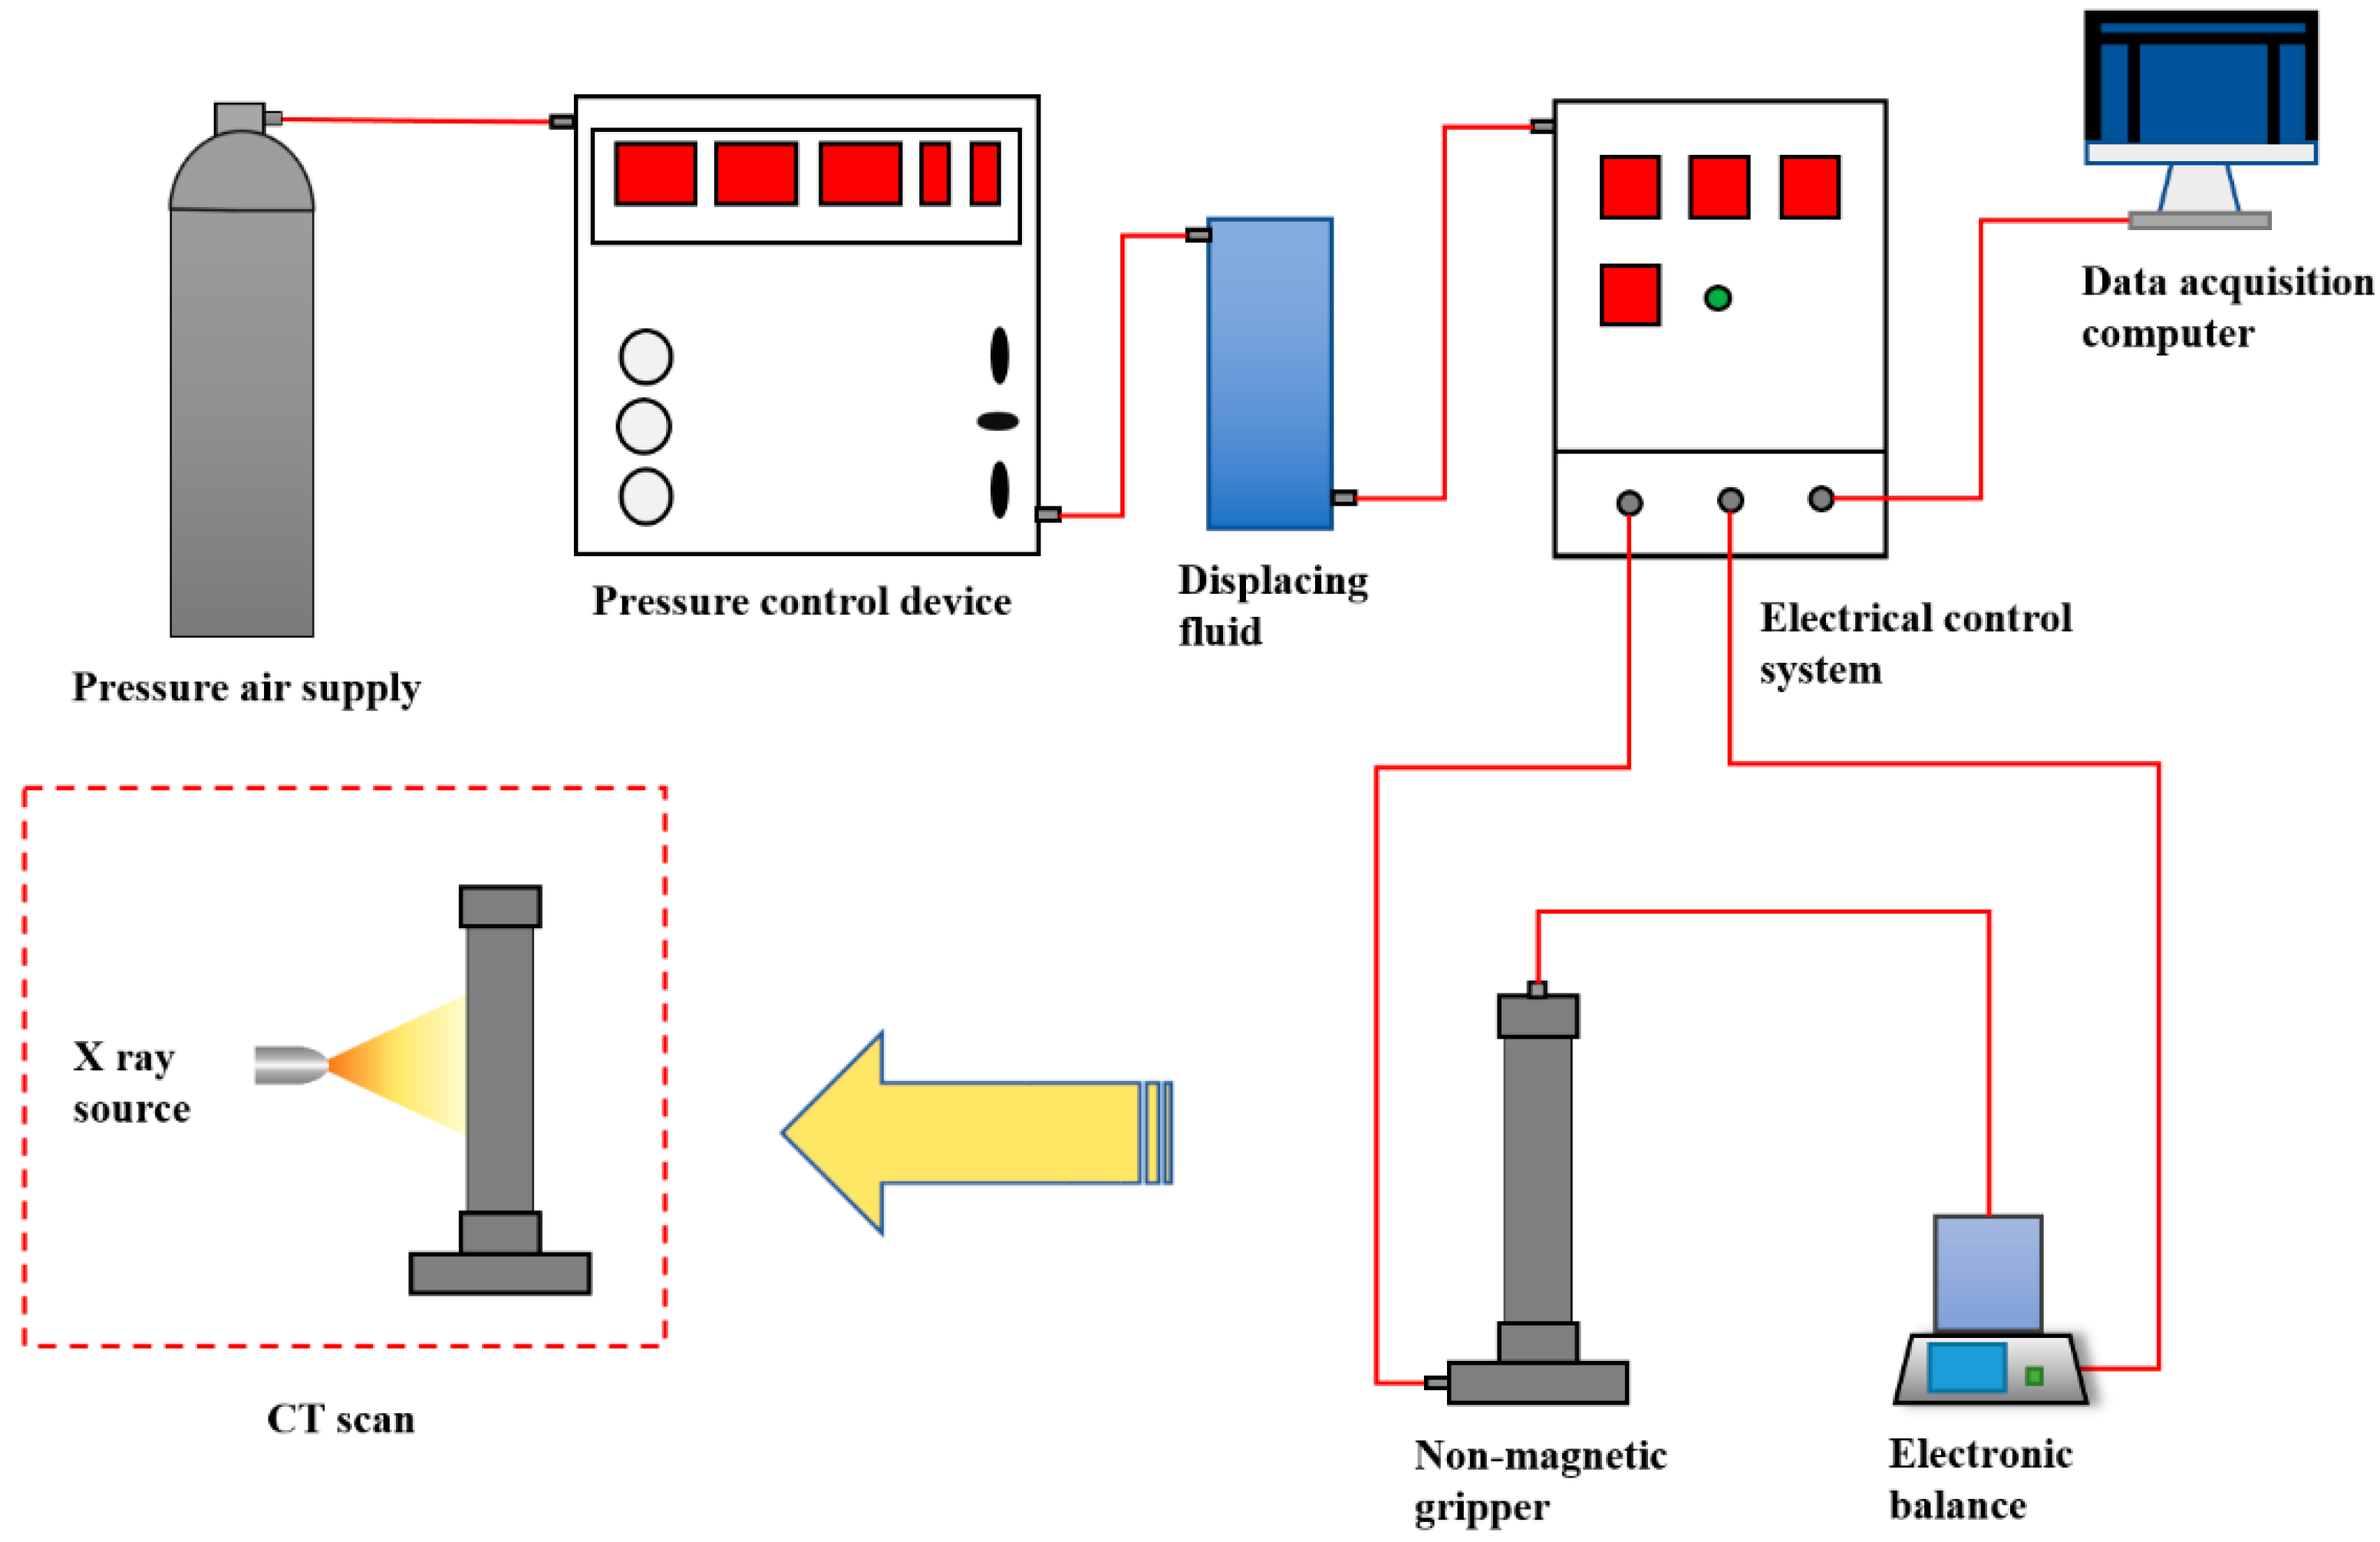
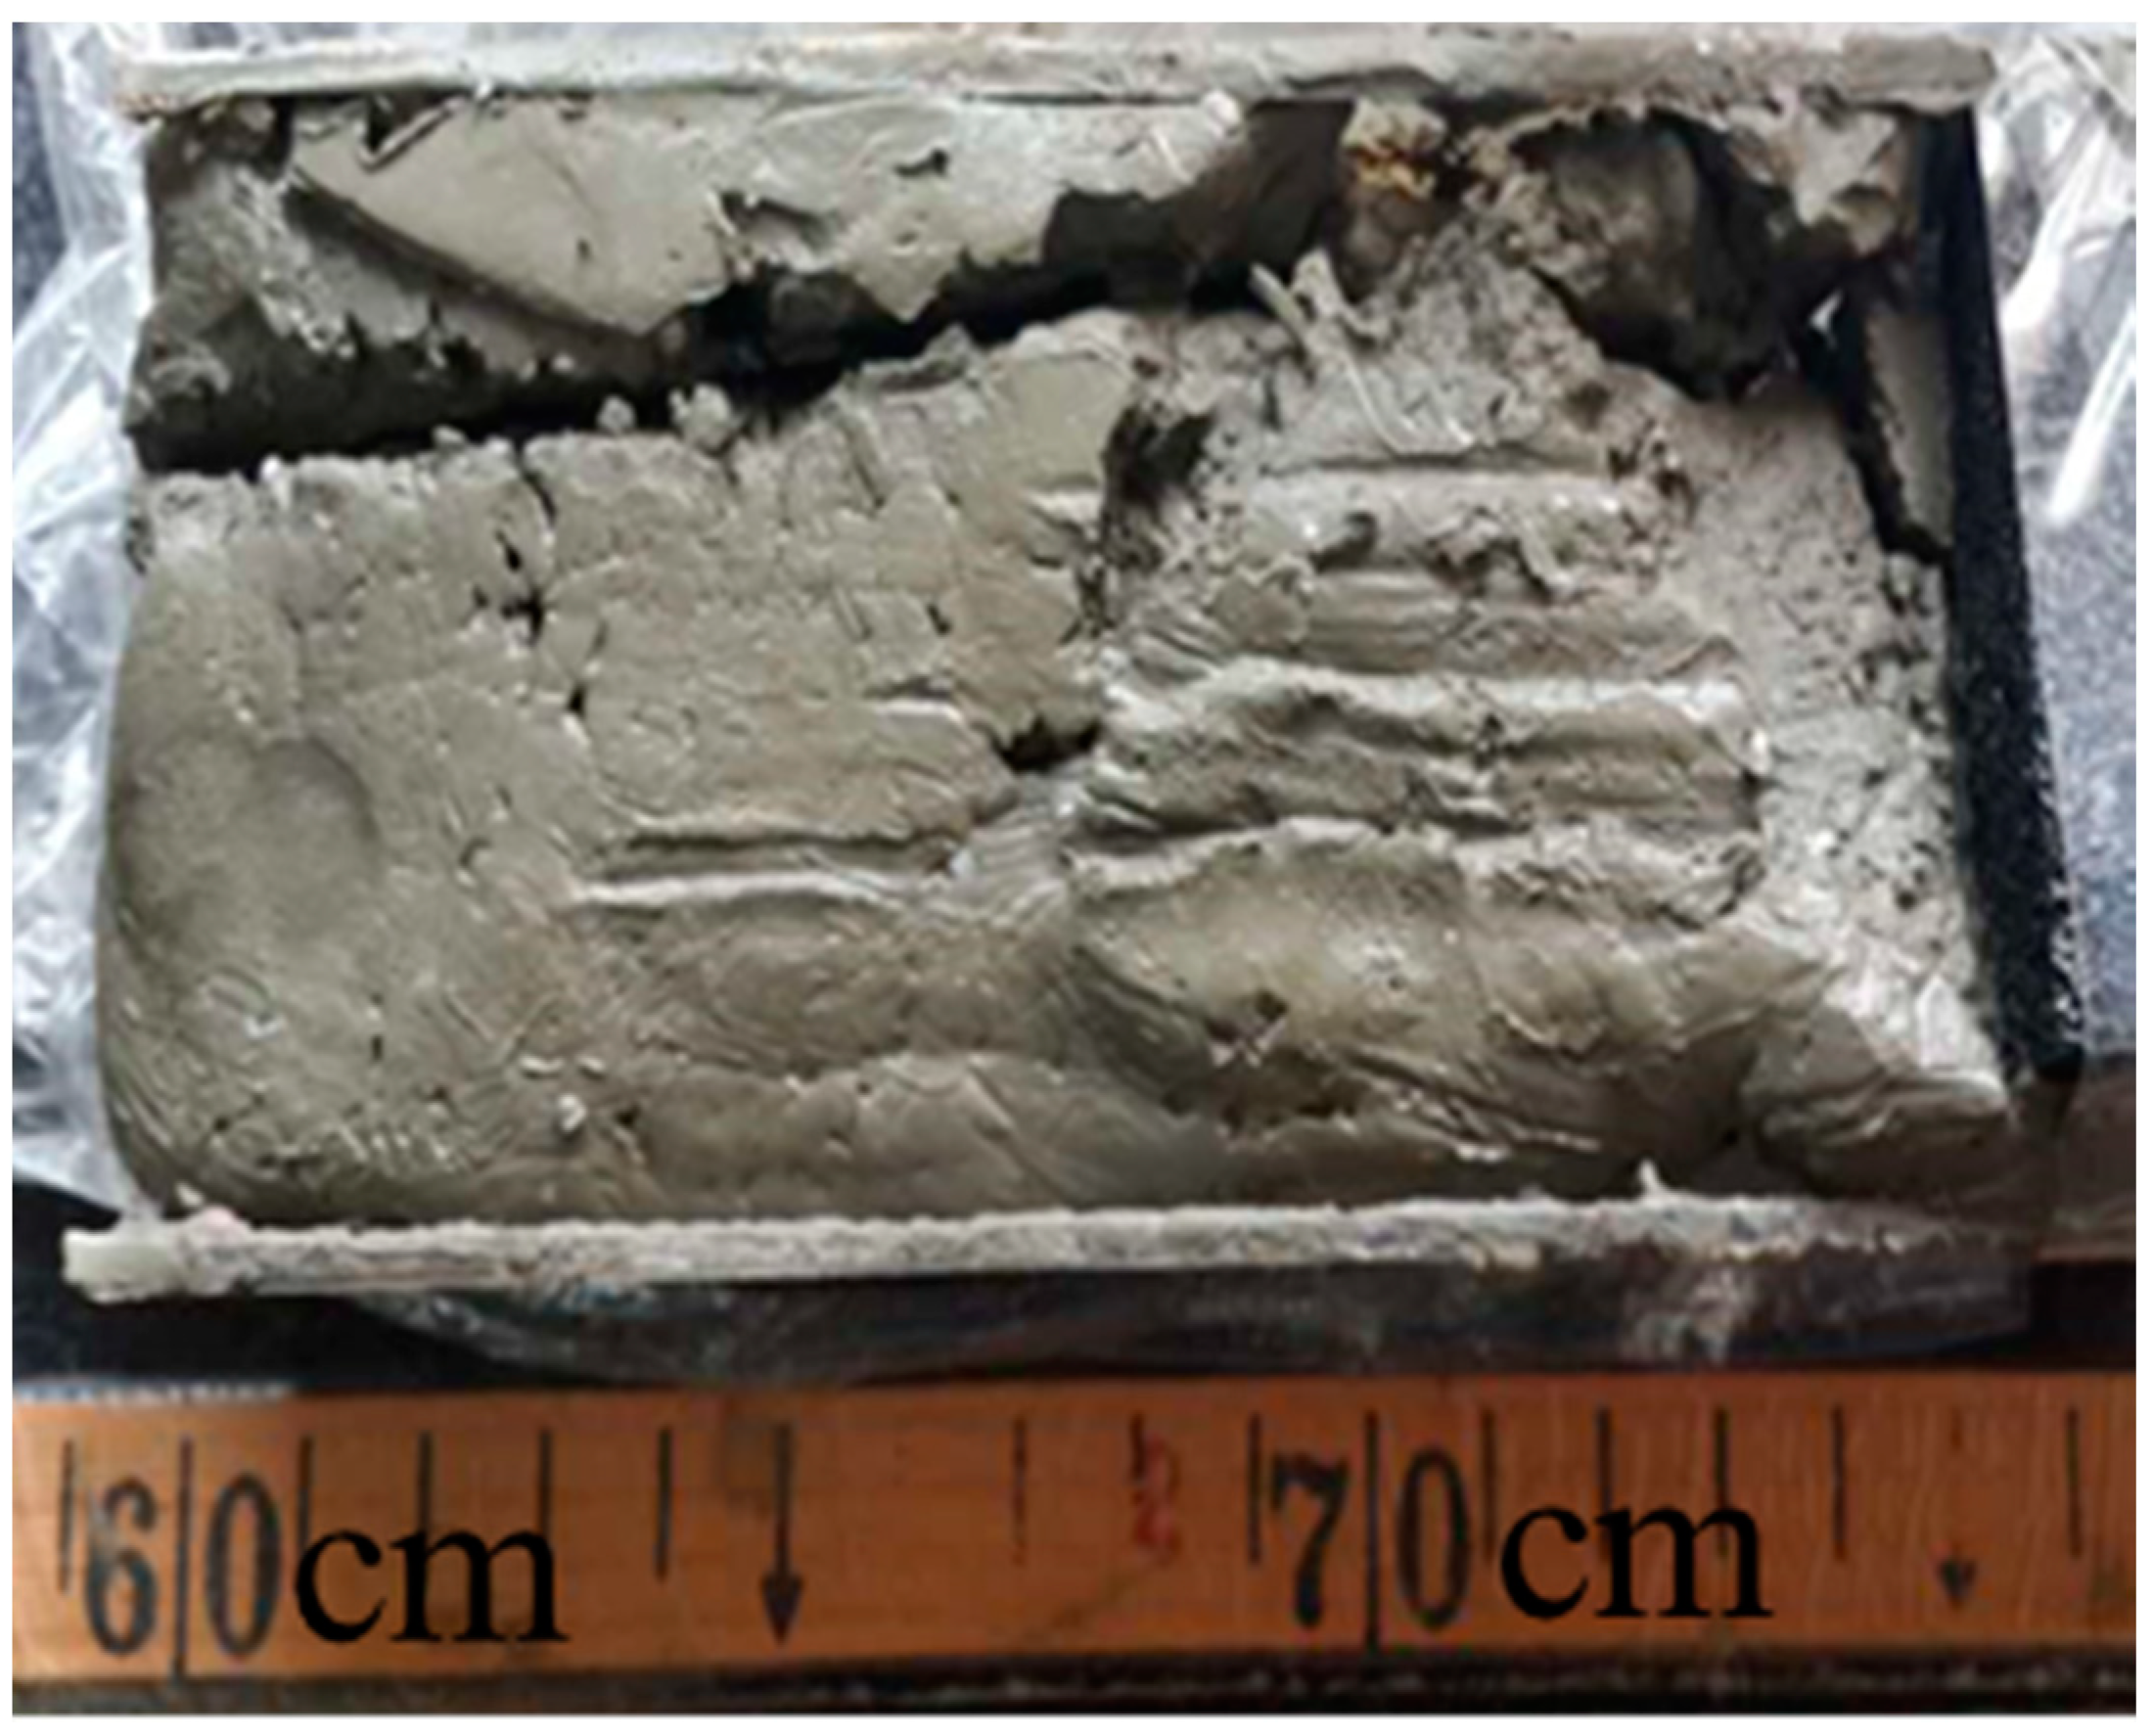
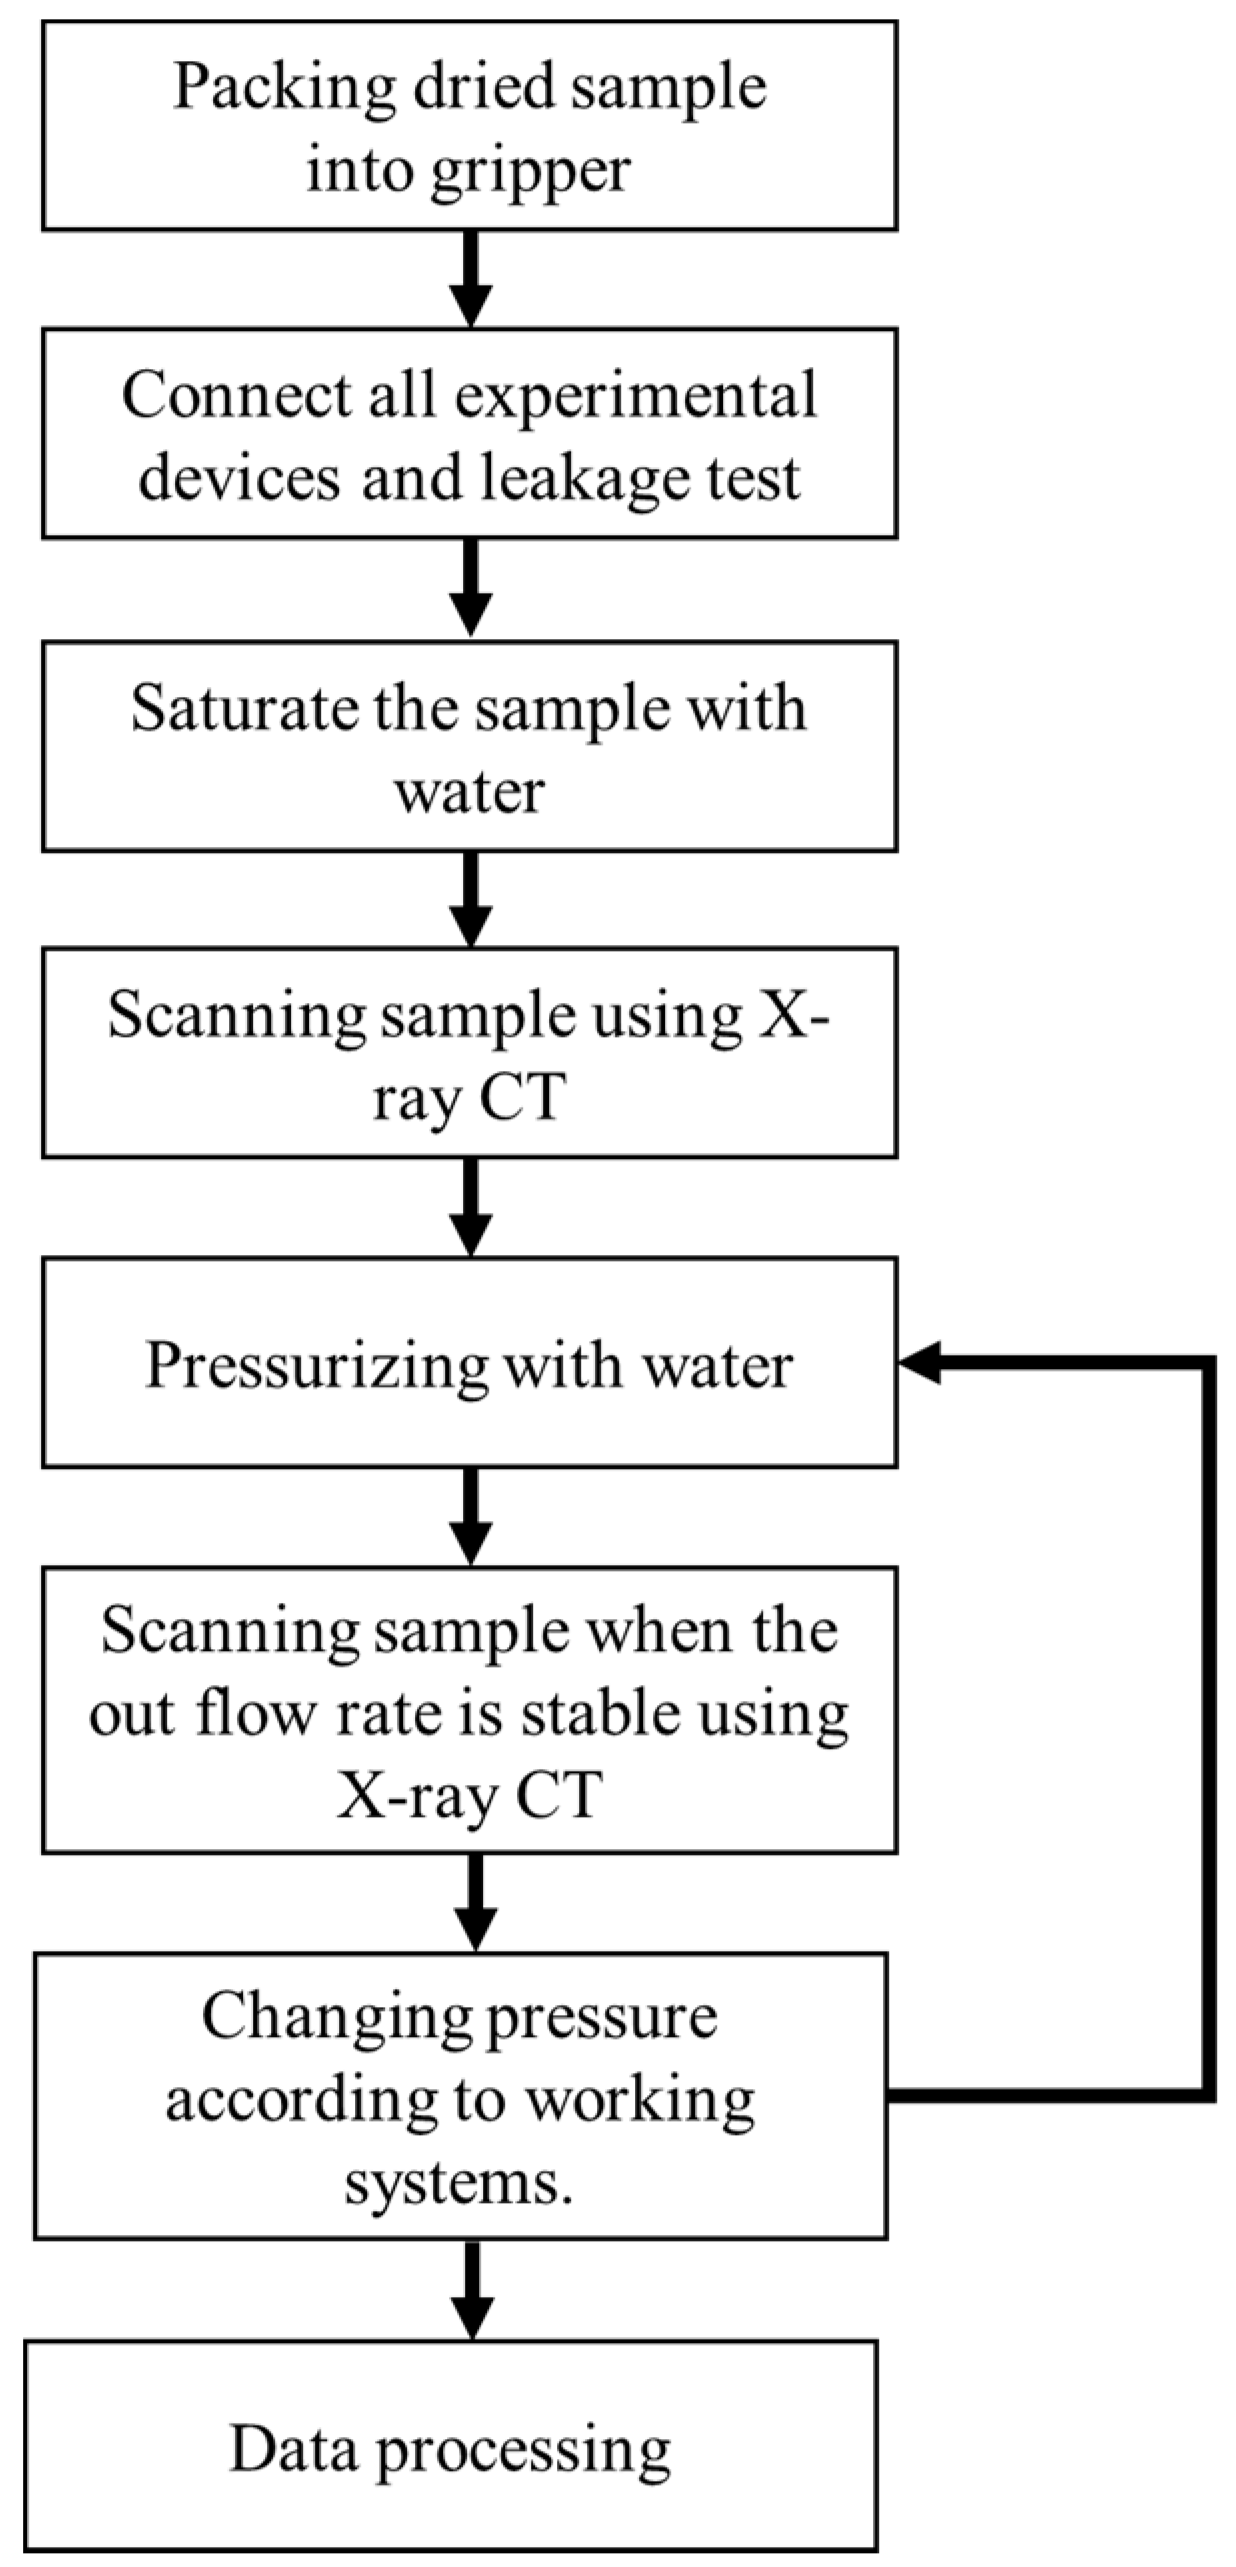
3. Apparatus Preparation and Experiments

Considering the properties of the small and non-diagenetic particles of the clayey-silt reservoir, equipment was developed to simultaneously perform sample seepage and CT scan experiments. The equipment group mainly consisted of a pressure air supply, a pressure control device, an electrical control system, a non-magnetic gripper, an electronic balance, a data acquisition computer, and a micro-CT scan system (Figure 2). The non-magnetic gripper was made of polyimide so that the sample seepage experiments could be carried out with a large pressure while ensuring the resolution of the CT scan. The pressure air supply and the pressure control device were responsible for adjusting the fluid pressure. The electrical control system was used to record the inlet-outlet pressure of the non-magnetic gripper and the electronic balance reading, and automatically store data in the data acquisition computer. The electronic balance was used to record fluid mass at the outlet of non-magnetic gripper in real time and obtain the fluid flow rate. Hence the sample permeability at each time point in the experiment could be calculated by Darcy’s law. The Sanying Micro-CT scan system includes an X-ray CT scanner and a data processing reconstruction system, which can obtain 3D micro-structure of the samples with the best pixel resolution of 650 nm.
During the experiments, we designed two sets of working systems to study the physical properties of reservoir samples (Figure 3) under different pressure gradients according to the real working system and logging data of the test production. The first was a stepwise pressurization method, which simulates the change of reservoir structure and permeability when the bottom well pressure increases continuously during production test. The second was a pulse pressurization method, which simulates the change of reservoir structure and permeability when the bottom well pressure fluctuates in a certain range during production test. Figure 4 shows the detailed experimental steps of these two methods.
According to the experimental steps above, we conducted four sets of seepage experiments using four collocated clayey-silt samples from the reservoir. Detailed experimental parameters are shown in Table 1. The pressure gradient value was obtained by dividing pressure difference at both ends of the sample by the sample length. Therefore, the pressure gradient can be used to compare with the effective production pressure during the test production.

4. Results and Discussion

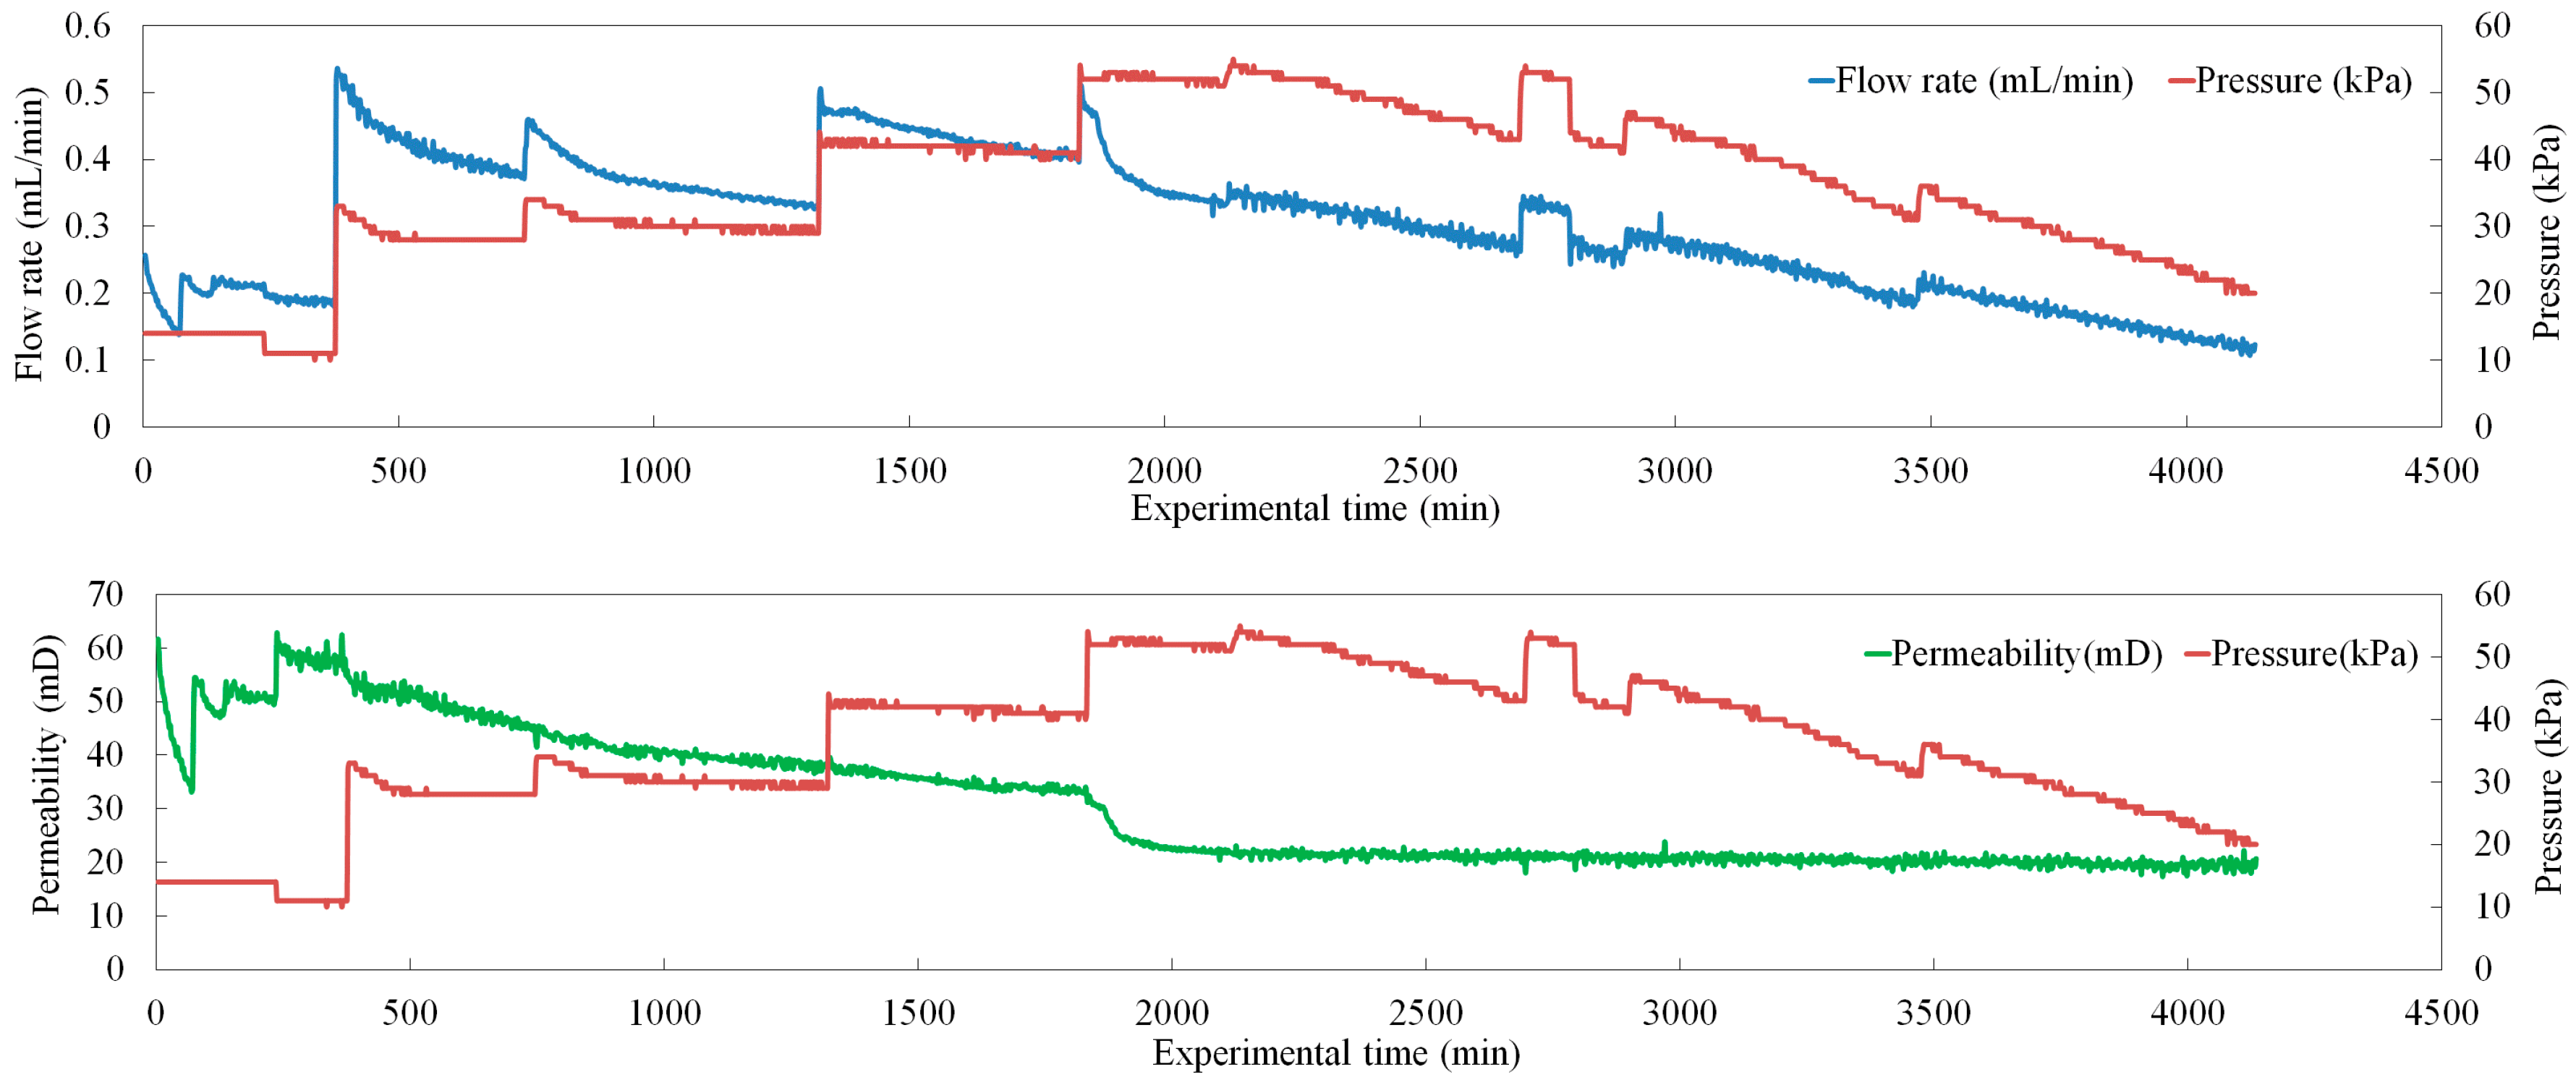
4.1. The First Three Seepage Experimental Data

Seepage experiments were first performed for the first, second, and third sample sets without CT scan. Figure 5 shows the flow rate and permeability versus pressure change of the first set of seepage experiments under a stepwise pressurization working system. The length and the dry weight of the filled plunger sample were 20 mm and 1.2 g, respectively. From Figure 5, the permeability of the first sample was basically kept in a low range (10–50 mD), and with the increasing pressure difference, the permeability decreased to an ultra-low range (close to 10 mD). In addition, when the pressure difference was less than or equal to 60 kPa, the permeability increased and stabilized at a larger value. When the pressure difference was higher than 60 kPa, the permeability decreased as the pressure difference increased. The results may indicate that during the exploitation of the natural gas hydrate reservoir in the Shenhu Area, the pressure gradient between the bottom of the well and the reservoir should preferably not exceed 3 MPa per meter to ensure that the permeability does not decrease rapidly with the exploitation time.
The flow rate and permeability versus pressure change of the second set seepage experiment under a pulse pressurization working system are shown in Figure 6. The length and the dry weight of filled plunger sample were 20 mm and 1.2 g, respectively. From Figure 6, the permeability of the second sample showed good consistency with that of the first sample (shown in Figure 5.), basically fluctuated at low permeability range (10-100mD).While the pressure difference increased to 100 kPa, the permeability decreased to an ultra-low range (approaching to 10 mD). During this process, when the pressure difference was less than or equal to 60 kPa, the permeability of the second sample increased and stabilized at a larger value (about 40 mD). When the pressure difference reached 80 kPa, the permeability dropped significantly, and then gradually decreased as the pressure difference increased to 100 kPa. Thereafter, no matter how the pressure difference was reduced, the permeability basically stabilized at a small value and did not recover. This result indicates that permeability reduction of the clayey-silt reservoir due to relatively high pressure gradient is an irreversible process. It also shows that during production process, the pressure gradient of 3 MPa per meter is a key point for reservoir permeability decrease.
The third set of seepage experiment were performed under a pulse pressurization working system with the length of filled plunger sample changing from 20mm to 10mm. Figure 7 shows how flow rate and permeability changed with pressure.. It was verified that there is a uniform law of permeability change under different pressure gradients in different length scales. In order to maintain the consistency of sample density, the dry weight of sample was reduced from 1.2 g to 0.6 g. The permeability of the third sample showed good consistency with that of the first and the second samples, the value of which basically remained in a low range (10–100 mD) and when the pressure difference increases, the permeability decreased to an ultra-low range (close to 10 mD). Furthermore, when the pressure difference is less than 30 kPa, the permeability of the third sample increased and stabilized at a larger value, when the pressure difference reached and more than 30 kPa, the permeability decreased with the increase of pressure difference. After that, the permeability stabilized at a smaller value and could not be recovered. The results of the third experiment point out that the law of permeability changing with a pressure gradient of 10 mm sample is basically the same as that with a 20 mm sample. Moreover, it is further proved that the pressure gradient of 3 MPa per meter is a key point for reservoir permeability decrease.

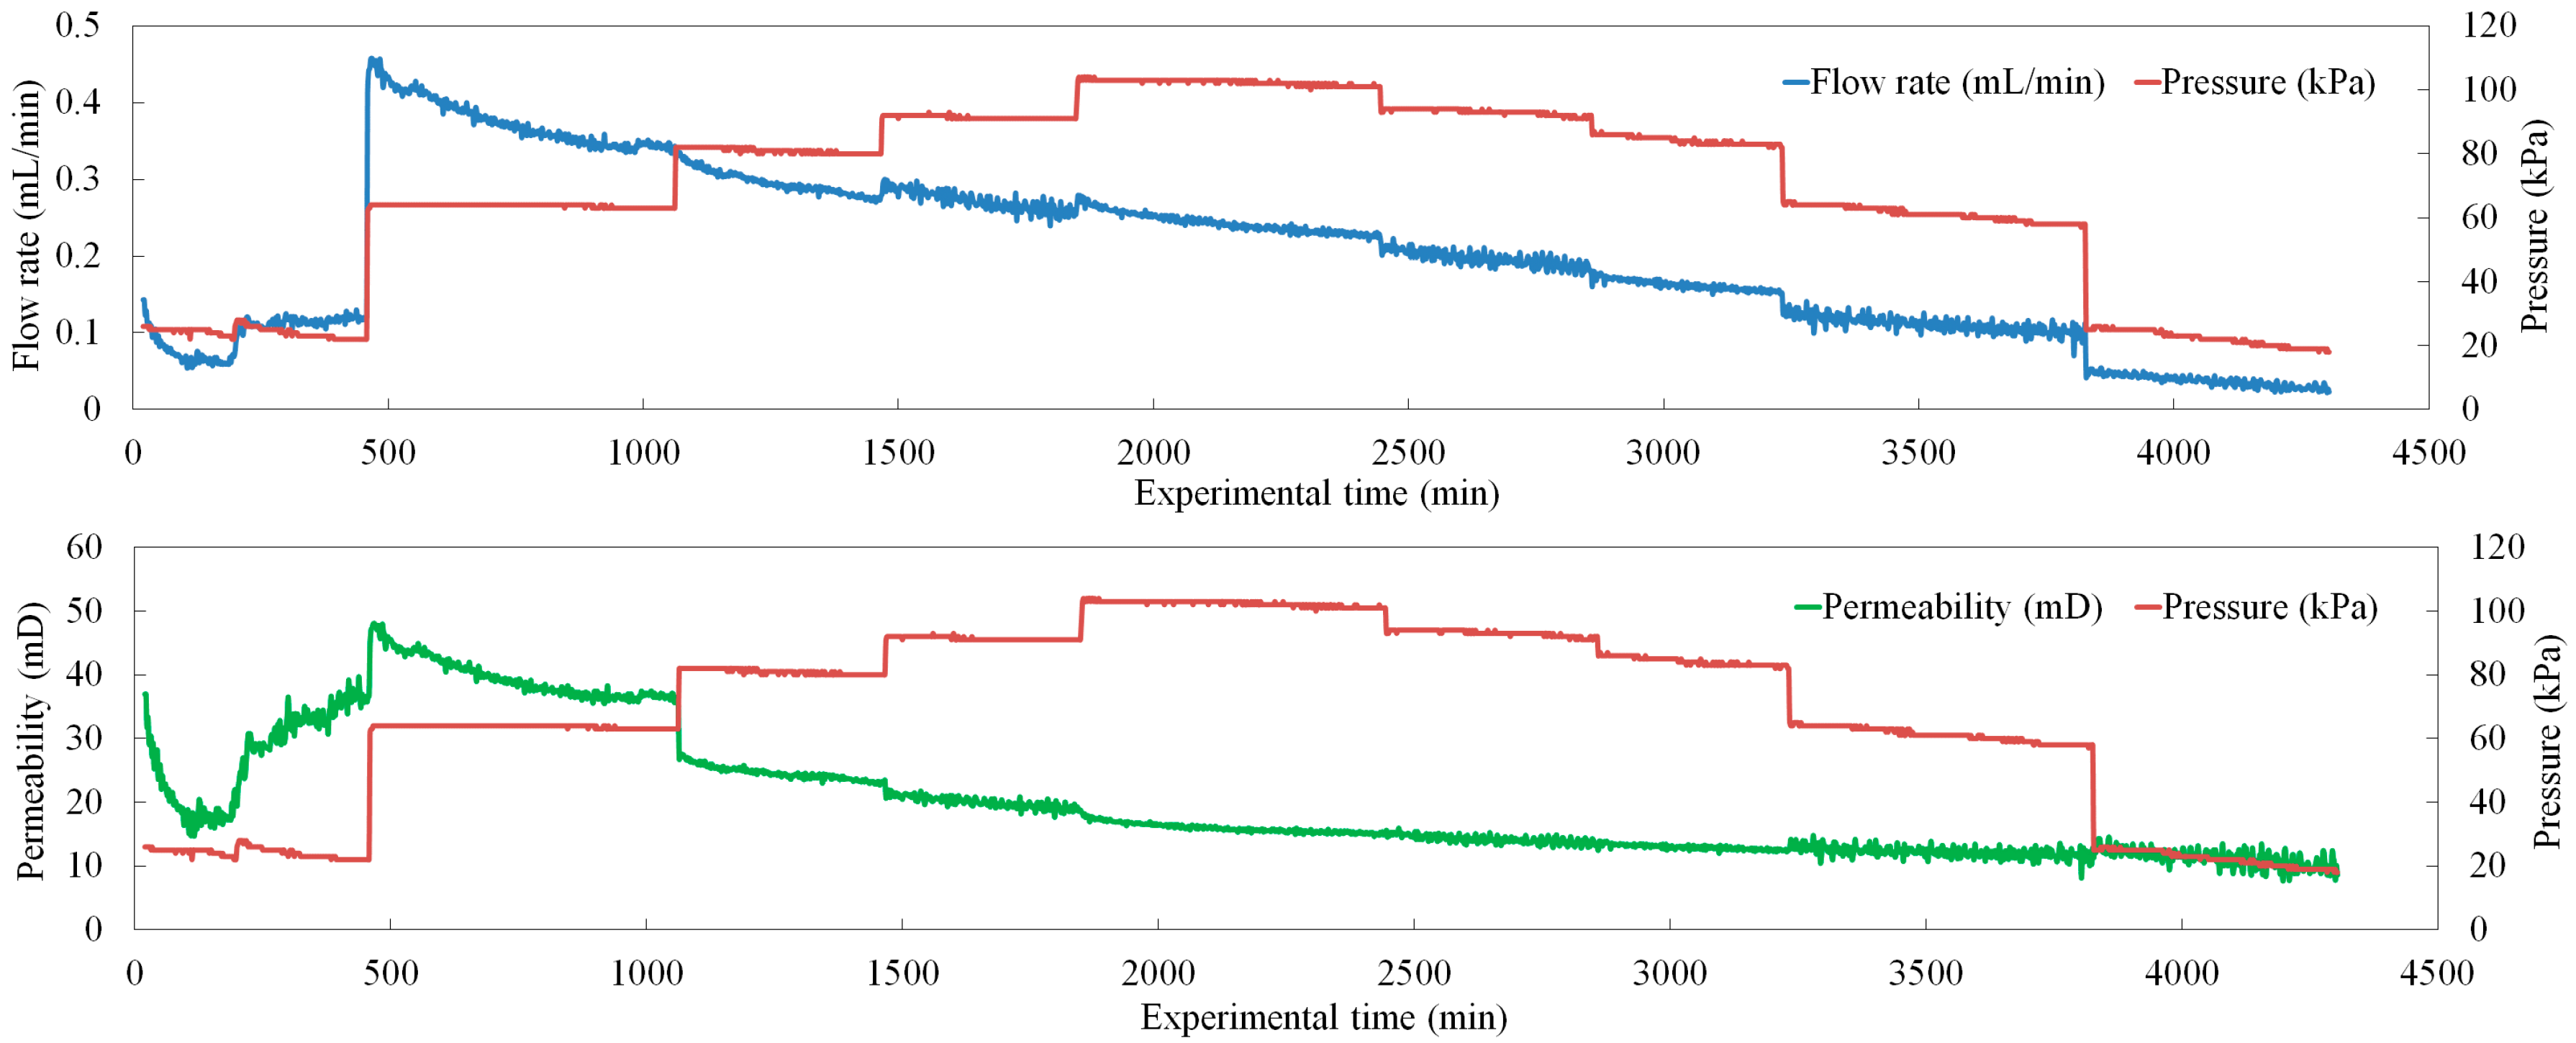
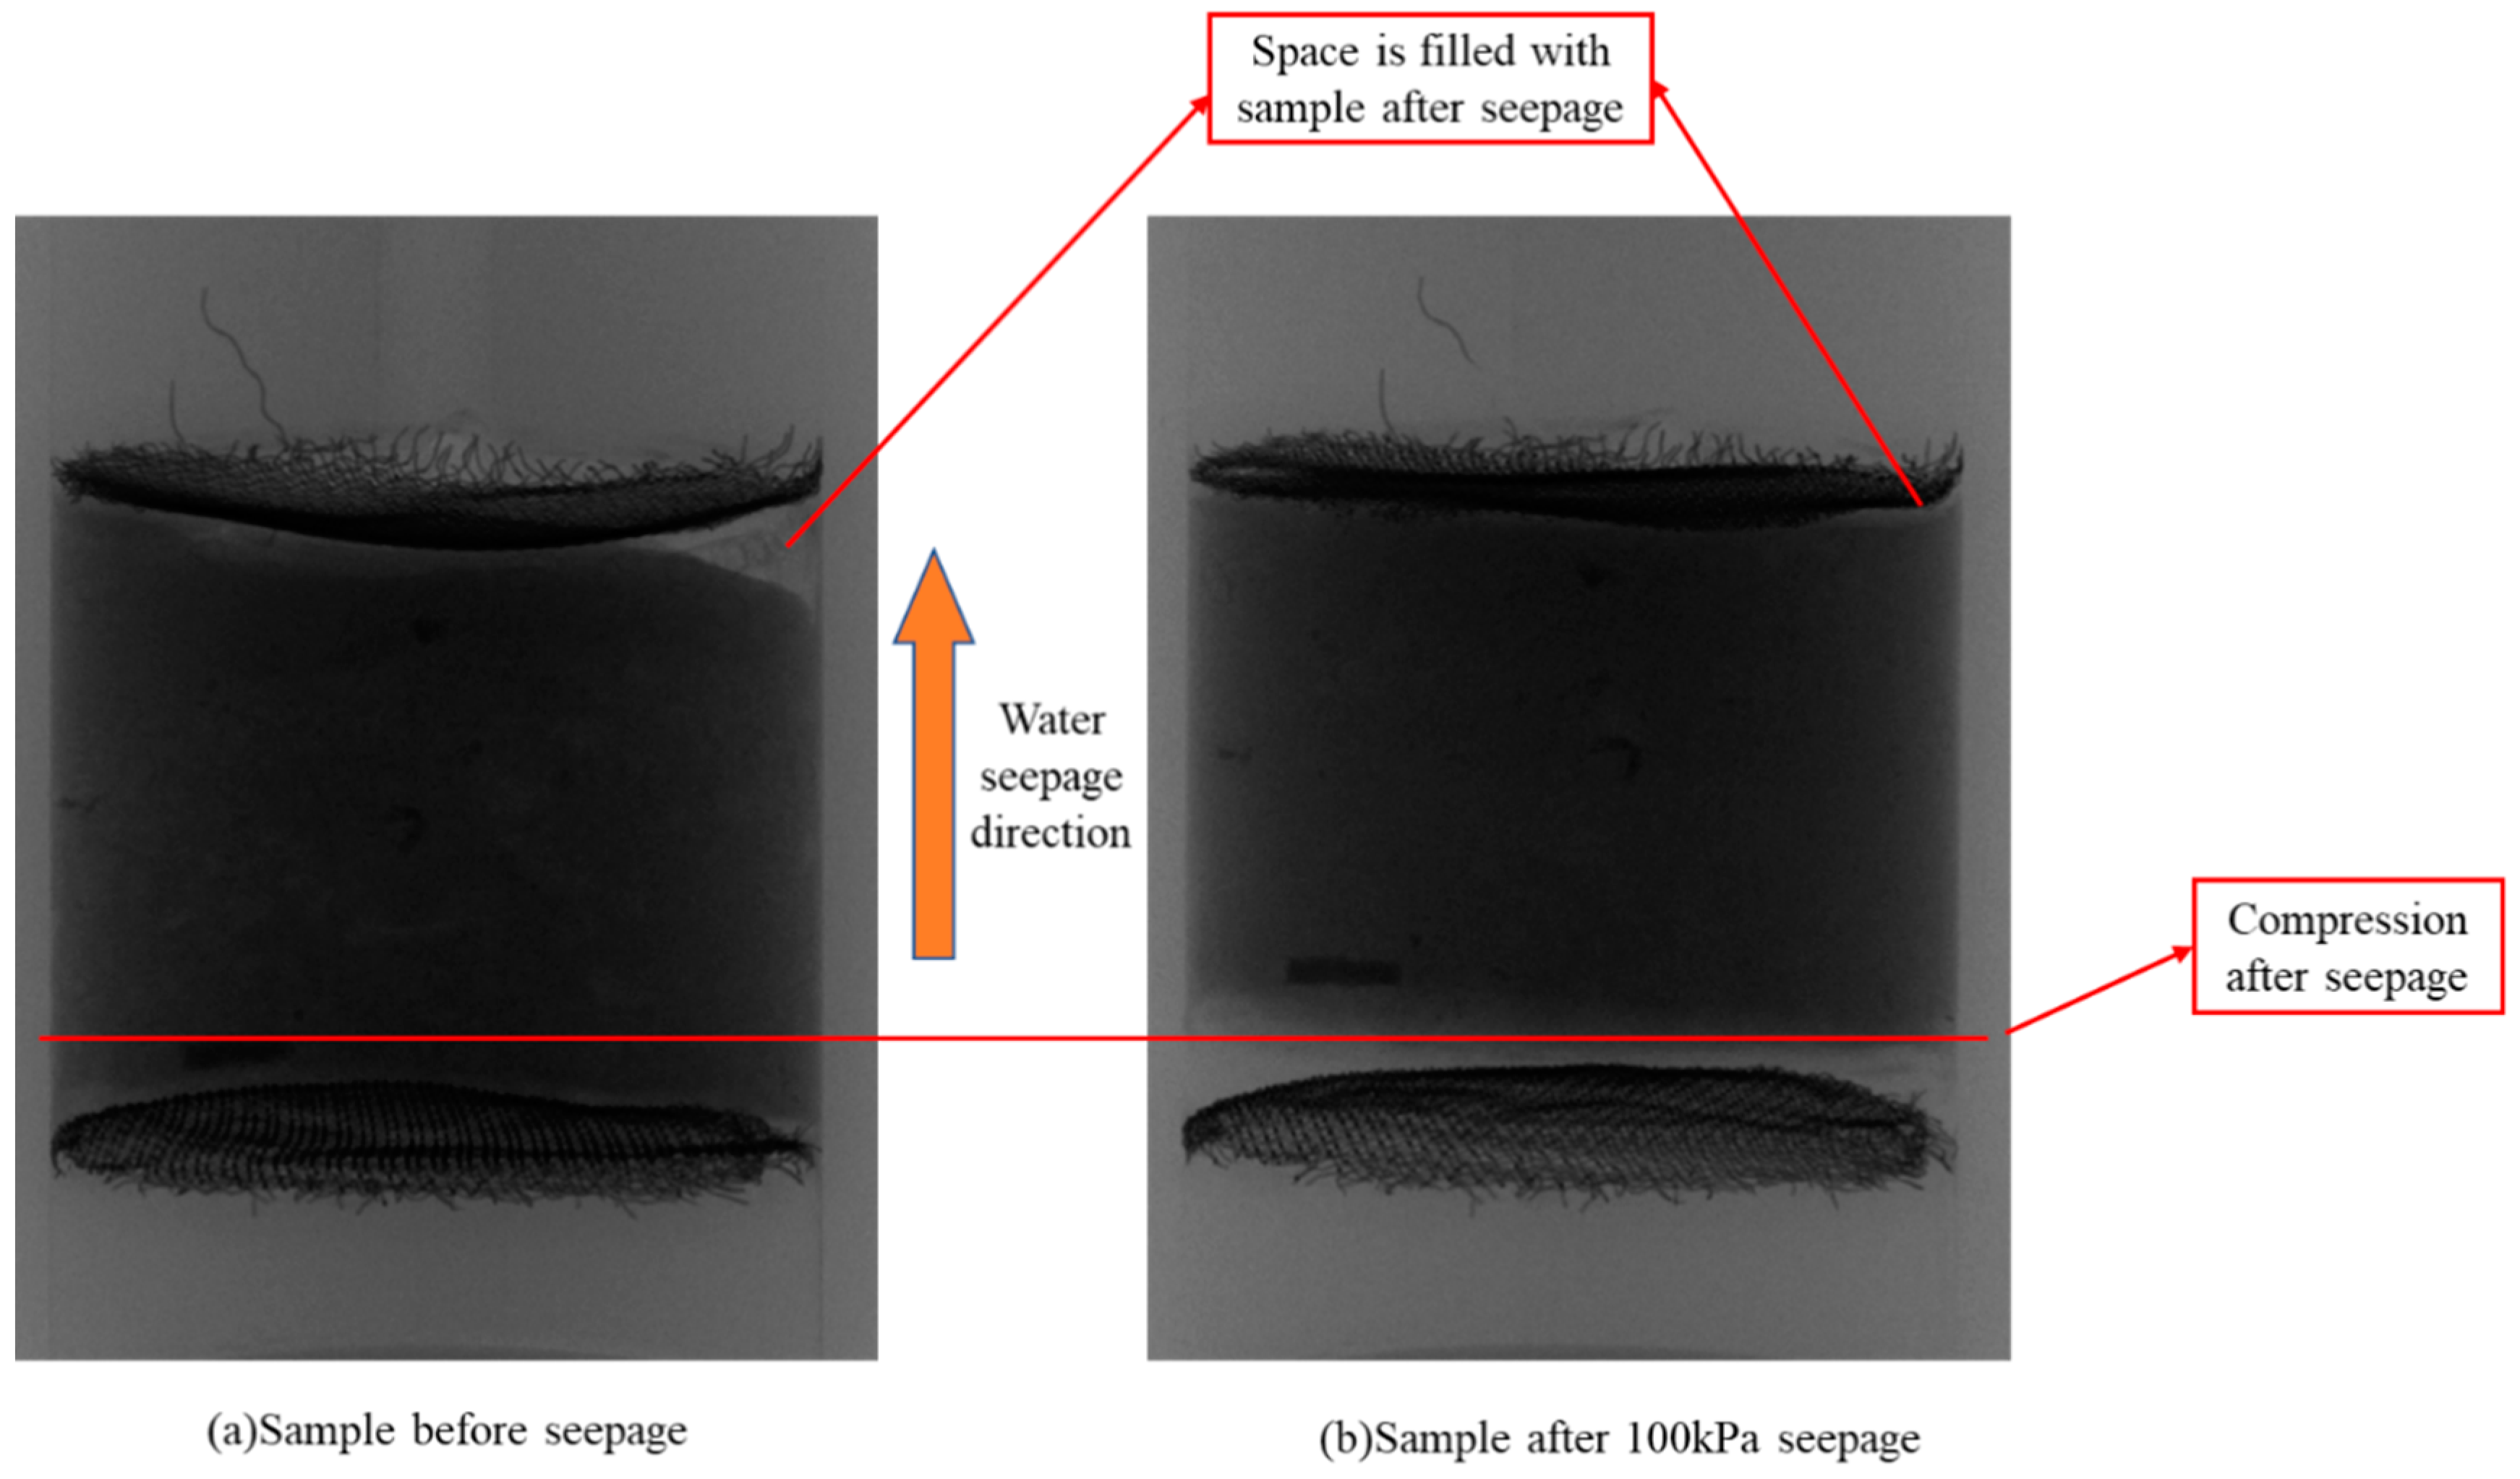
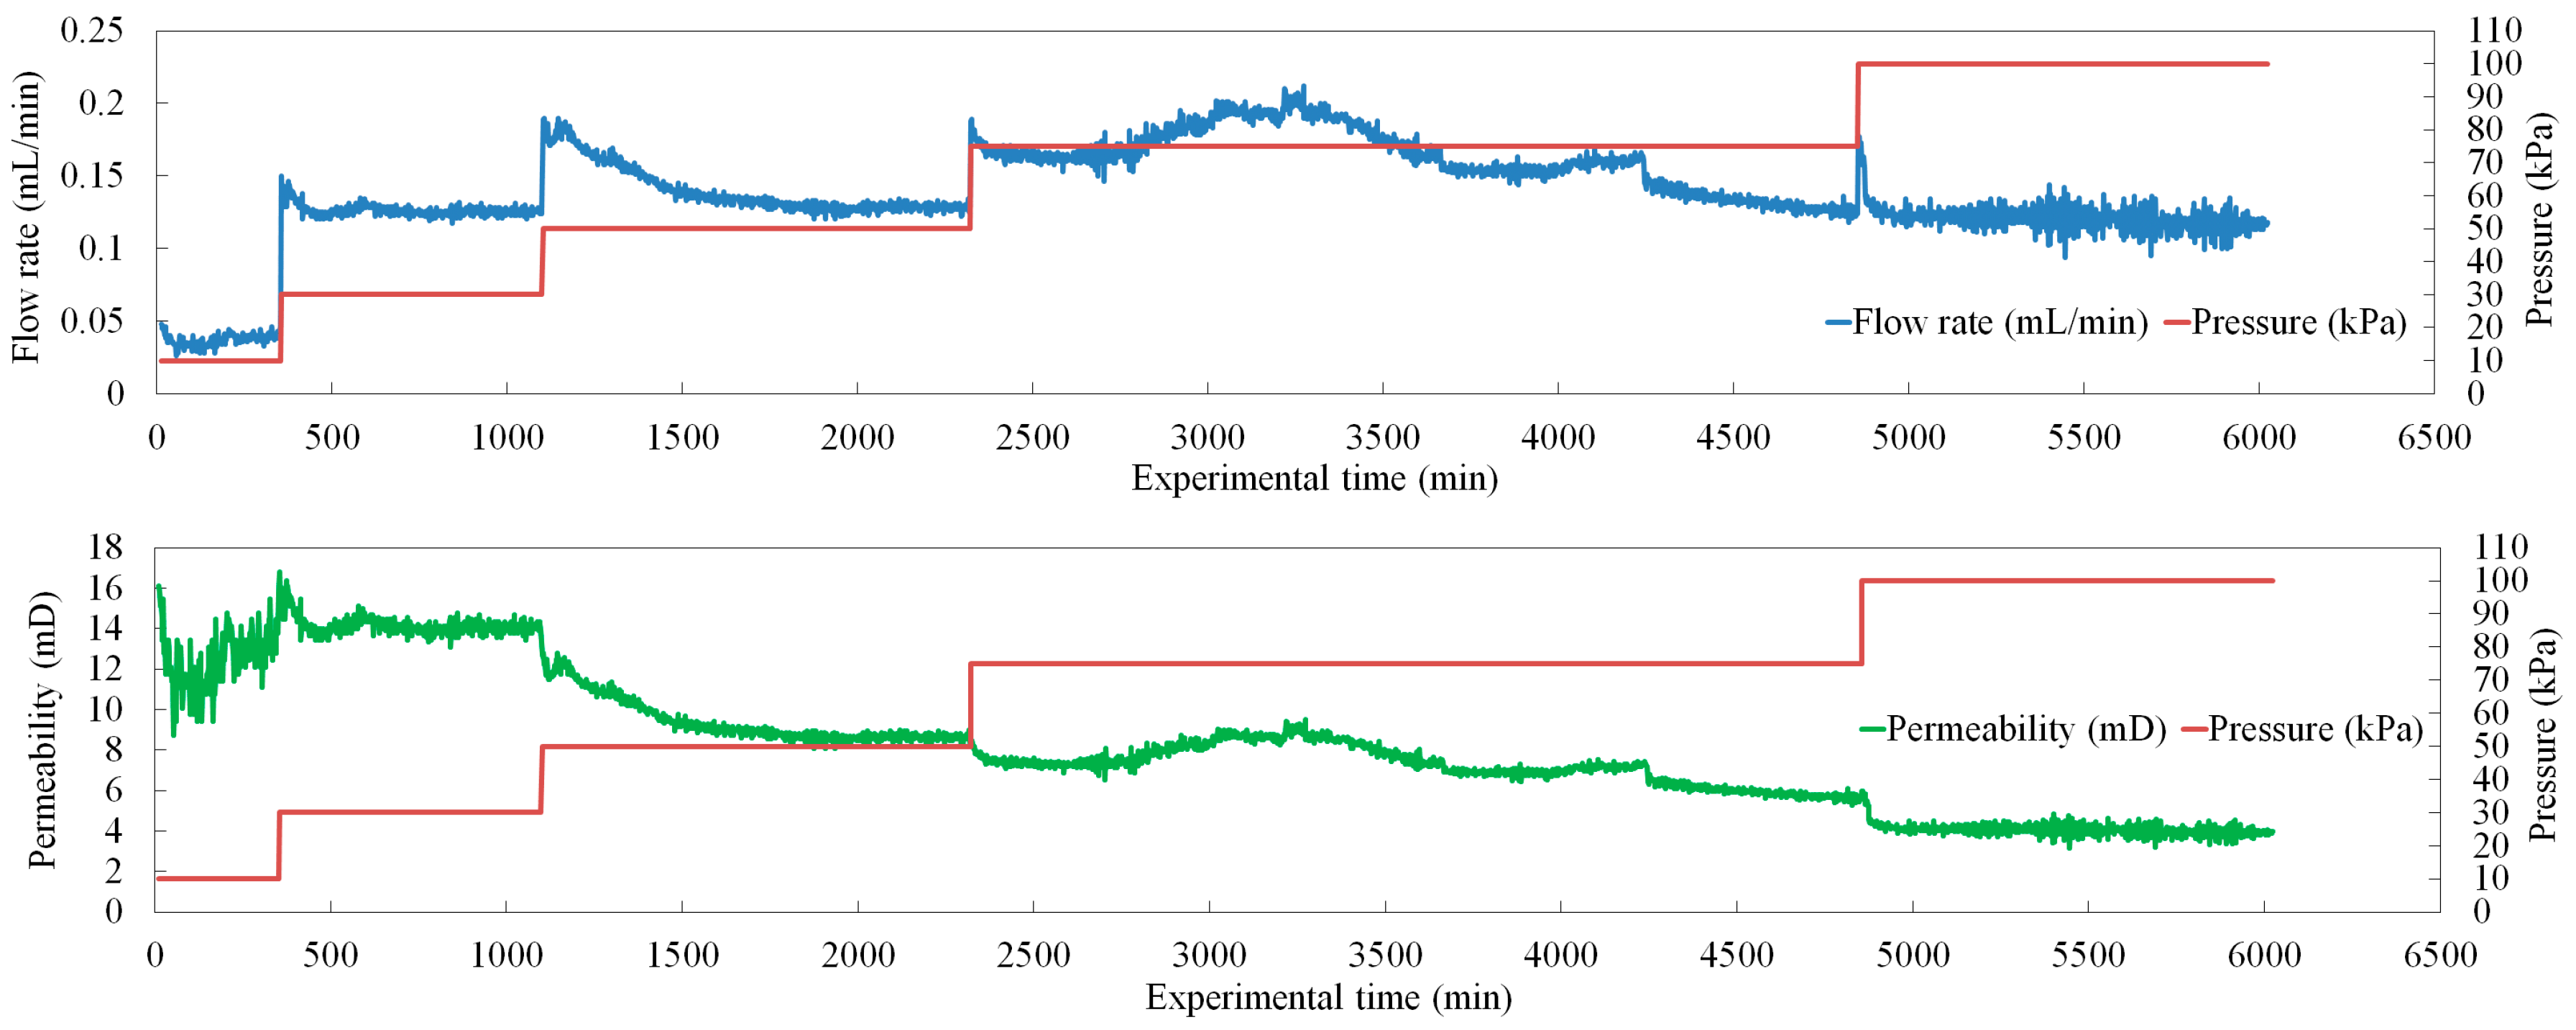
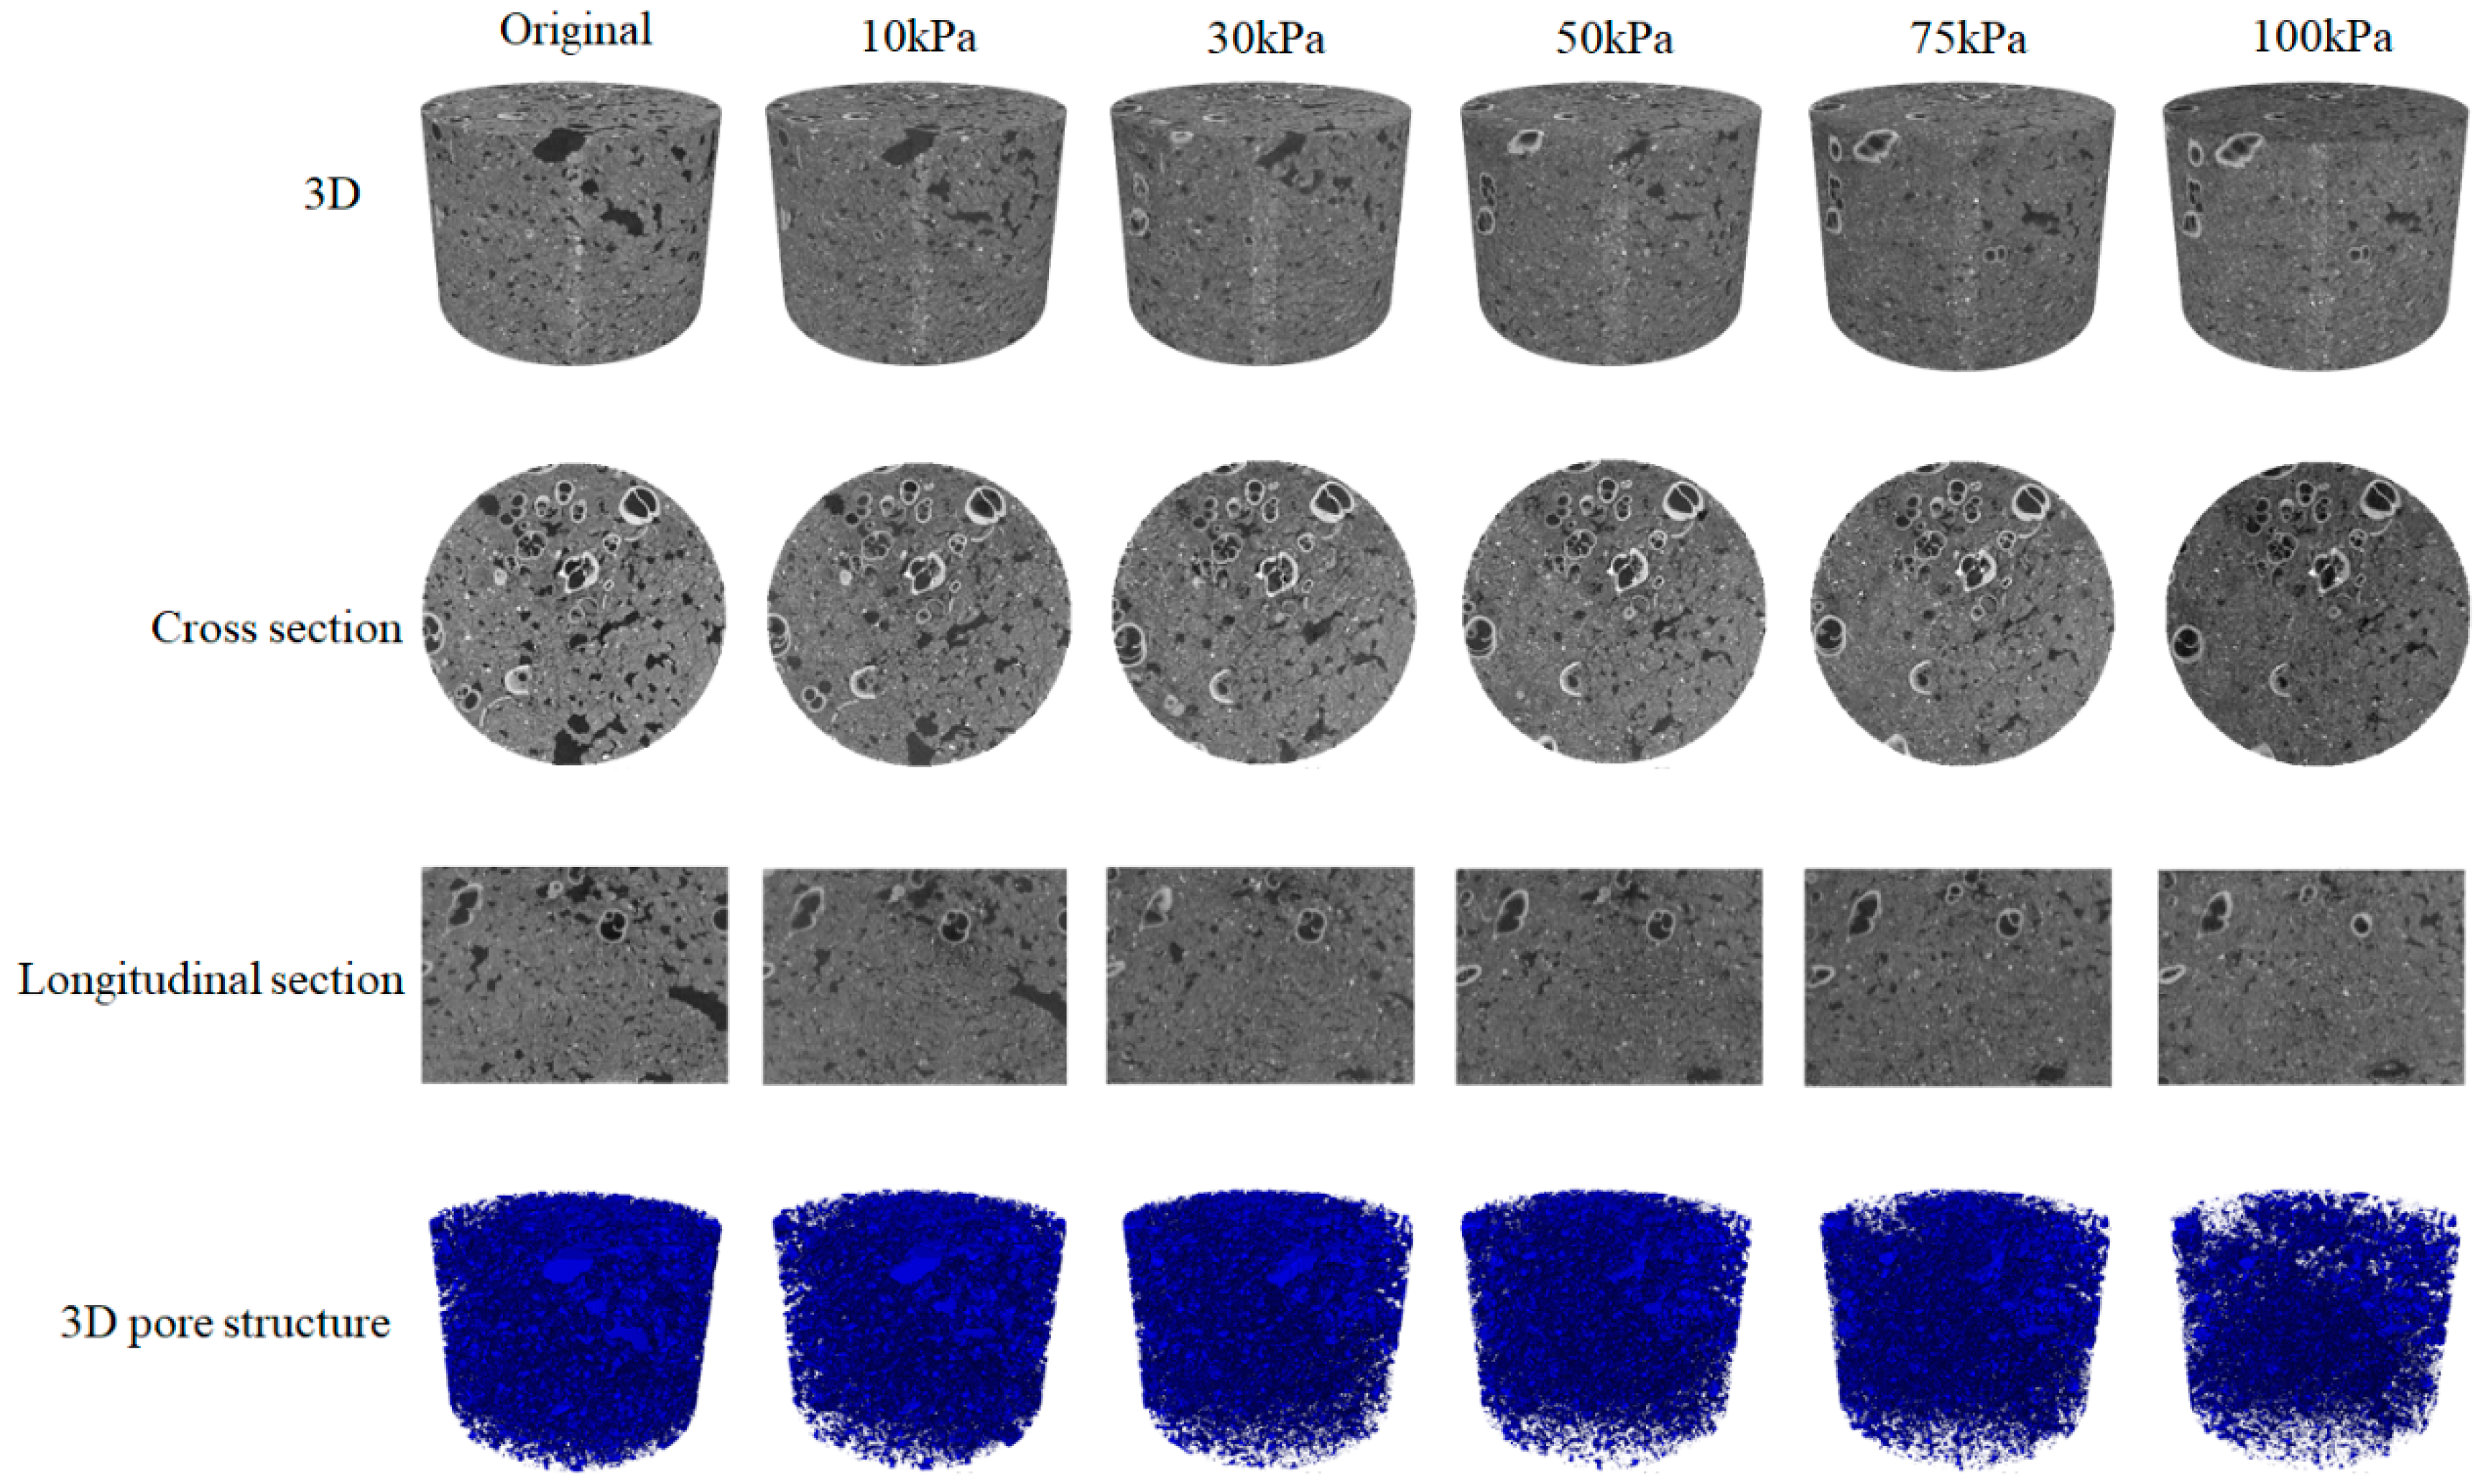
4.2. The Fourth Seepage Experiment with CT Analysis

Seepage experiments on the fourth sample set (plunger length 10 mm) were performed with CT scan. According to the experimental procedure illustrated in Figure 4, six CT scans were performed during the fourth seepage experiment. Figure 8a,b show CT projections of the sample before seepage and after 100 kPa seepage, respectively. After a series of variable pressure seepage experiments, the overall structure of the reservoir sample was compressed, and the part not filled by sample before the experiment was also filled after the experiment, indicating that the clayey-silt reservoir has structure compression under a large pressure difference.
Figure 9 shows the flow rate and permeability versus pressure change of the fourth set of seepage experiments under a stepwise pressurization working system. The permeability started at about 16 mD and decreased to reach a range of extremely low value (<10 mD) with the increased pressure difference. However, the law of permeability change under different pressure gradient of the fourth sample did not change. When the pressure difference was less than or equal to 30 kPa, the permeability increased and stabilized at a large value. When the pressure difference was more than 30 kPa, the permeability decreased continuously as the pressure difference increased. This result also further proves that the permeability of the clayey-silt reservoir may remain relatively stable when the pressure gradient does not exceed 3 MPa per meter; when the pressure gradient is greater than 3 MPa per meter, the permeability will rapidly decrease.
Then the structure of the fourth sample obtained by CT scan was used to further analyze the influence of structure change on the seepage process in the reservoir. The upper three rows of images in Figure 10 are two- and three-dimensional CT gray-scale images of the sample flooded under a series of pressure differences. The gray-scale images illustrate that as the pressure difference increases, the pores of the sample are continuously compressed, and the pore volume is gradually reduced. Besides, there are some small pores that are completely closed. The last row of images in Figure 10 are three-dimensional pore space images obtained by a series of processing (interception, filtering, and binarization) [21] on three-dimensional CT gray-scale images. Combined with porosity and permeability data in Table 2, they indicate that porosity (18.62–10.6%) will gradually decrease with the increase of pressure difference during experiment. The reduction of about half of the porosity can further explain the significant decrease of permeability (13.4–3.92 mD). All these analyses prove that the pore structure change is the primary cause for the decrease of permeability with the increase of pressure difference.
The relationship between the porosity and permeability of the fourth sample is presented in Figure 11. It is clear that the permeability K increases with the power of porosity ϕ . The following power law equation provided a very good fit (R2 = 0.8803) to this relationship:
K = 0.0053 ϕ 2.7501 .
The better fitting results demonstrate that the porosity of clayey-silt reservoir can be utilized to establish a power law model to predict permeability decrease. Furthermore, it is evident that the reason for the decrease in permeability is the compression and reduction of pore space during the production of clayey-silt hydrate reservoir. Therefore, this relationship between porosity and permeability can also play an important role in the production prediction of clayey-silt hydrate reservoirs.
In summary, the structure changing effect of the natural gas hydrate reservoir was proved and analyzed, which can lead to remarkable reservoir destruction and permeability reduction. Therefore, the down-hole engineering development and exploitation of hydrate reservoirs are different from that of conventional oil and gas reservoirs. When there is a significant drop of bottom hole pressure, the pressure gradient at the well wall will increase sharply leading to an increase of the fluid flow rate in the clayey-silt reservoir in a short time. The increasing flow rate will compress, reduce, and even disappear the original pore space, destroy the pore-throat structure, consequently leading to a decreased permeability and seriously affecting the yield of a single well. Once the reservoir structure is destroyed, it cannot be restored to the original state. In addition, reservoir secondary reformation has little effect on the improvement of permeability. In conclusion, it is necessary to control the pressure between bottom hole and the reservoir during production; it is also important to find a balance point that constantly changing structure does not affect the permeability of the reservoir with increasing pressure.

5. Conclusions and Future Works

In this study, four sets of single-phase water flooding experiments under different seepage pressures were carried out on natural gas hydrate reservoir sediment samples in the Shenhu Area of the South China Sea. The changes in the permeability of the samples were analyzed. CT scan was applied to analyze the pore structure changes in the fourth set of experiments under different pressure conditions. The following conclusions can be derived:
(1)
The permeability of experimental samples are basically kept in a low permeability range, and when the pressure difference increases, the permeability will decrease to an ultra-low permeability range.
(2)
The key point of reservoir structure change caused by the pressure gradient is 3 MPa per meter. When the pressure gradient is not more than 3 MPa per meter, the pore structure will be relatively stable, and permeability will increase and stabilize at a larger value. When pressure gradient is more than 3 MPa per meter, reservoir structure will rapidly break down, meanwhile, permeability will decrease rapidly.
(3)
The process of reservoir damage and permeability reduction is irreversible. Once the pressure gradient is greater than 3 MPa per meter, the permeability will decrease rapidly and cannot be restored even if the pressure gradient is reduced back to 3 MPa per meter.
(4)
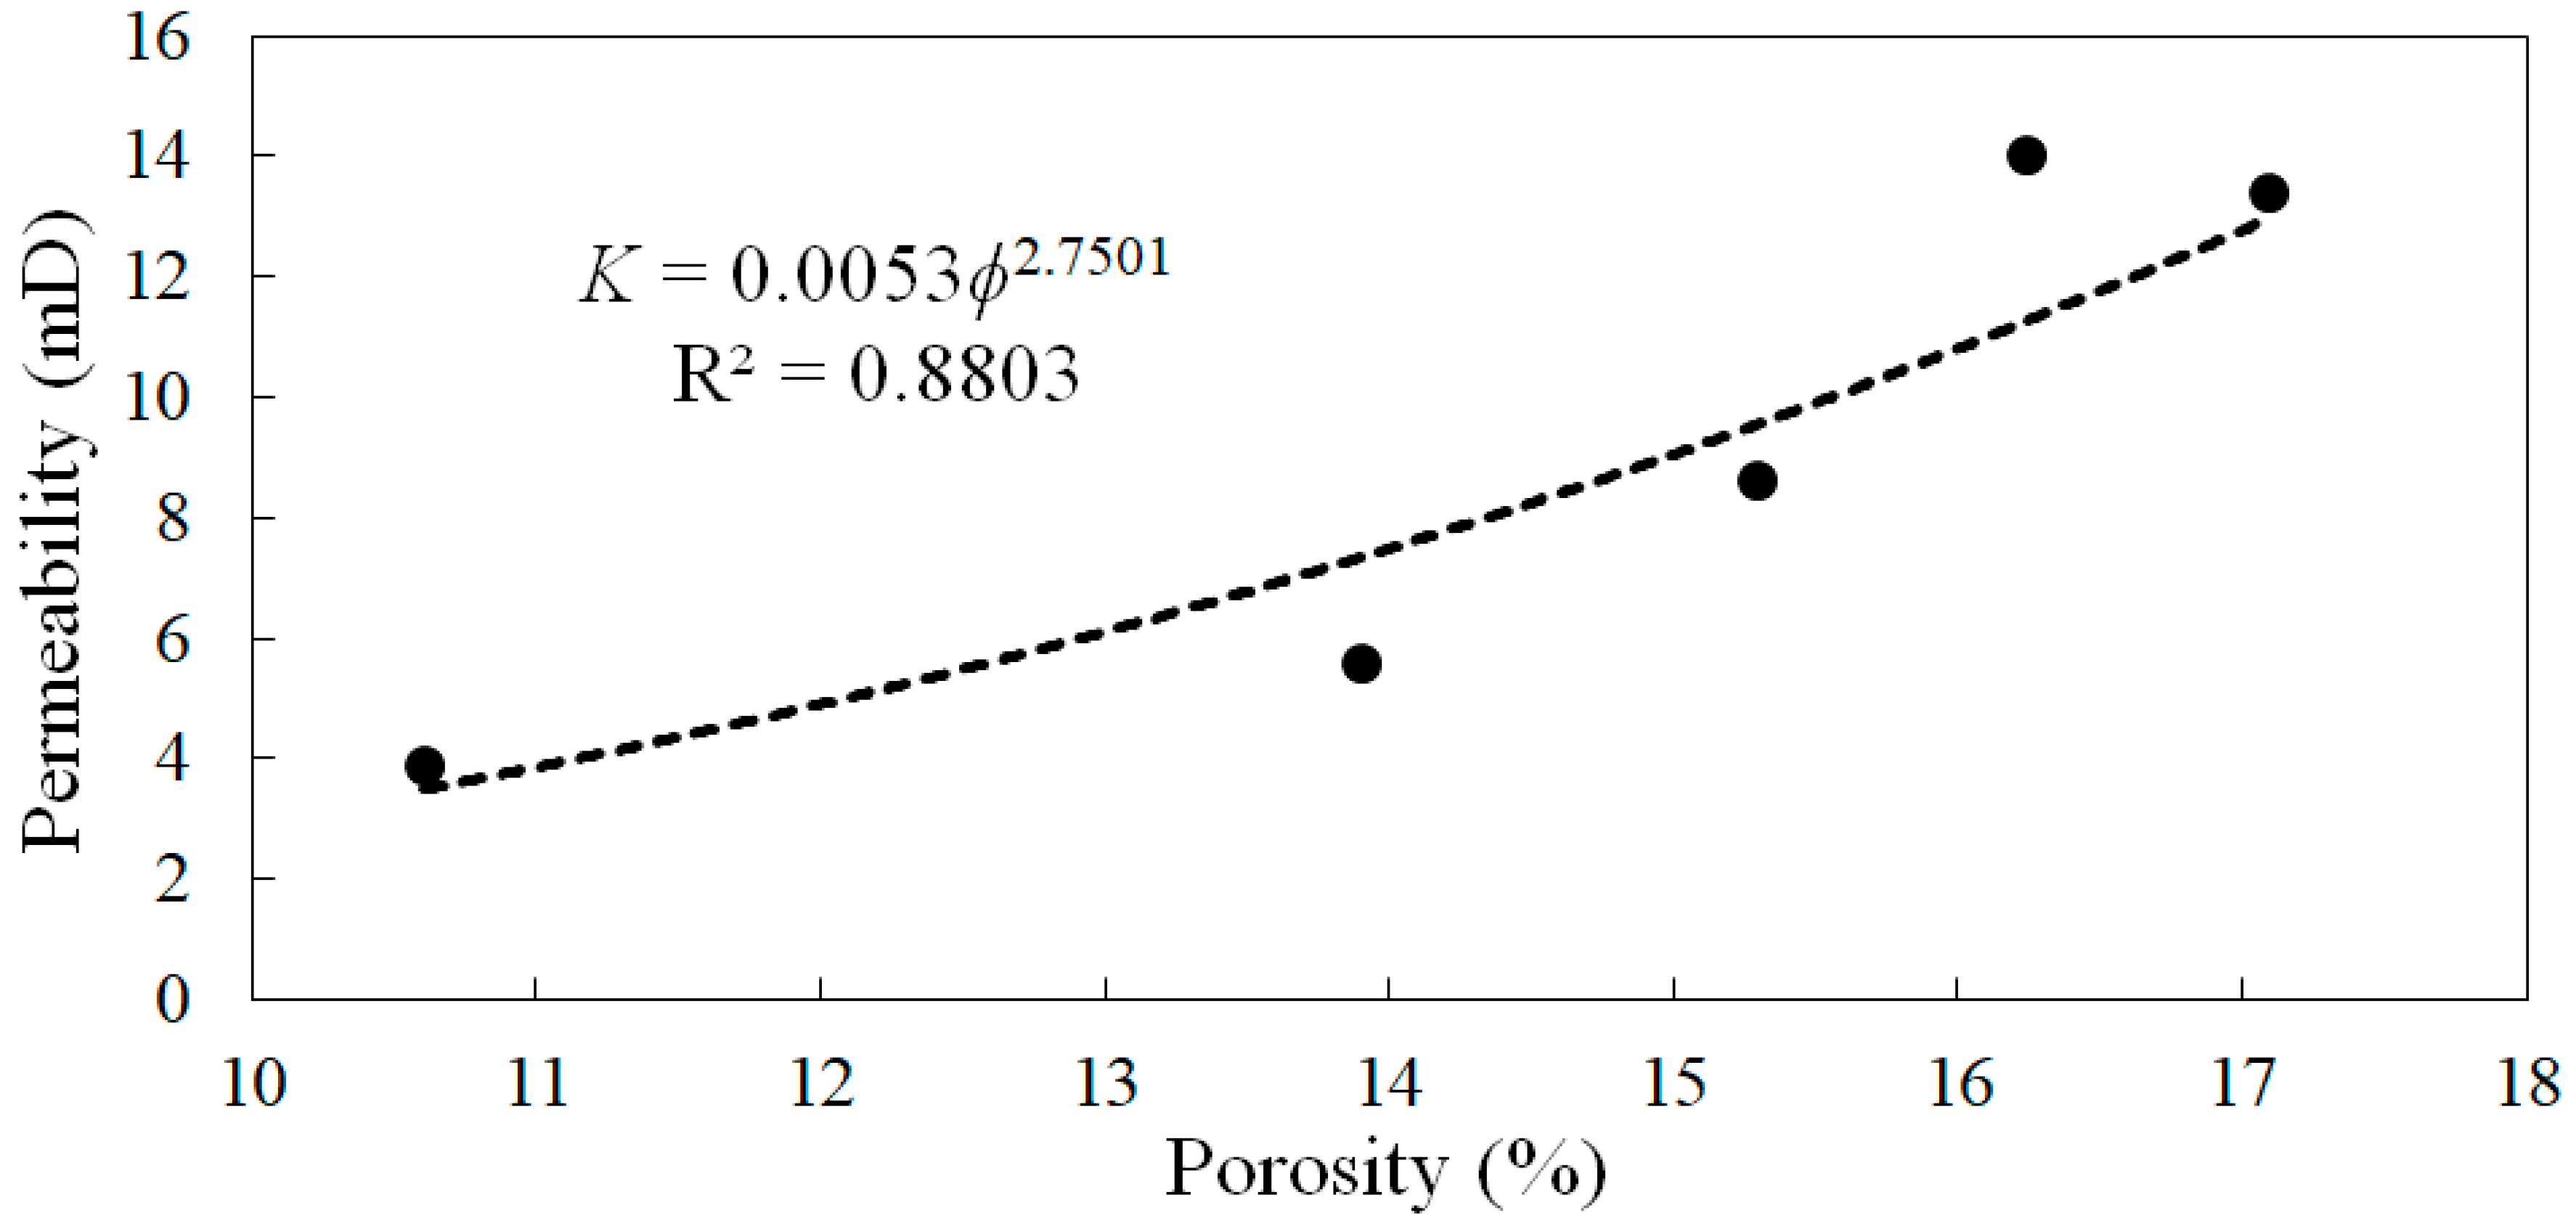
The essential reason for the decrease in reservoir permeability is the deformation of pore space. Besides, the change of porosity can be directly used to establish a power law model to predict the decrease of permeability.
On the basis of the presented work, we will further analyze the experimental data and analyze the influence of the structure change of natural gas hydrate reservoirs on their permeability from a microscopic perspective. We will also proceed to carry out gas–water two-phase flow experiments of reservoir samples combined with a CT scan to investigate the influence of gas on reservoir structure changing characteristic and the change law of reservoir gas–water two-phase relative permeability. At the same time, the seepage experiment will be conducted on centimeter-scale reservoir samples to augment the experiment scale, which makes it possible to analyze the seepage characteristics of the reservoir from a multi-scale perspective.

Author Contributions

The research is initially designed and proposed by C.L., H.Q. and J.C.; The experiments and data collection are conducted by Y.X., X.S. and H.B.; The manuscript is further improved by J.C., H.L. and W.L.

Funding

This research was funded by the China Geological Survey Project (no. DD20190232).

Acknowledgments

Thanks to Jianliang Ye, Xuwen Qin for giving guidance during the experiments.

Conflicts of Interest

The authors declare no conflict of interest.

References

  1. Sloan, E.D., Jr. Fundamental principles and applications of natural gas hydrates. Nature 2003, 426, 353. [Google Scholar] [CrossRef] [PubMed]
  2. Makogon, Y.; Holditch, S.; Makogon, T. Natural gas-hydrates—A potential energy source for the 21st Century. J. Pet. Sci. Eng. 2007, 56, 14–31. [Google Scholar] [CrossRef]
  3. Kvenvolden, K.A. Gas hydrates-geological perspective and global change. Rev. Geophys. 1993, 31, 173–187. [Google Scholar] [CrossRef]
  4. Aregbe, A.G. Gas Hydrate—Properties, Formation and Benefits. Open J. Yangtze Oil Gas 2017, 2, 27–44. [Google Scholar] [CrossRef]
  5. Li, J.F.; Ye, J.L.; Qin, X.W.; Qiu, H.J.; Wu, N.Y.; Lu, H.L.; Xie, W.W.; Lu, J.A.; Peng, F.; Xu, Z.Q.; et al. The first offshore natural gas hydrate production test in South China Sea. China Geol. 2018, 1, 5–16. [Google Scholar] [CrossRef]
  6. Islam, M. A new recovery technique for gas production from Alaskan gas hydrates. J. Pet. Sci. Eng. 1994, 11, 267–281. [Google Scholar] [CrossRef]
  7. Kvenvolden, K.A. A review of the geochemistry of methane in natural gas hydrate. Org. Geochem. 1995, 23, 997–1008. [Google Scholar] [CrossRef]
  8. Milkov, A.V.; Sassen, R. Economic geology of offshore gas hydrate accumulations and provinces. Mar. Pet. Geol. 2002, 19, 1–11. [Google Scholar] [CrossRef]
  9. Zhang, X.; Lu, X.; Liu, L. Advances in natural gas hydrate recovery methods. Prog. Geophys. 2014, 29, 858–869. [Google Scholar]
  10. Song, Y.; Cheng, C.; Zhao, J.; Zhu, Z.; Liu, W.; Yang, M.; Xue, K. Evaluation of gas production from methane hydrates using depressurization, thermal stimulation and combined methods. Appl. Energy 2015, 145, 265–277. [Google Scholar] [CrossRef]
  11. Dai, S.; Cha, J.-H.; Rosenbaum, E.J.; Zhang, W.; Seol, Y. Thermal conductivity measurements in unsaturated hydrate-bearing sediments. Geophys. Res. Lett. 2015, 42, 6295–6305. [Google Scholar] [CrossRef]
  12. Ge, X.; Liu, J.; Fan, Y.; Xing, D.; Deng, S.; Cai, J. Laboratory Investigation into the Formation and Dissociation Process of Gas Hydrate by Low-Field NMR Technique. J. Geophys. Res. Solid Earth 2018, 123, 3339–3346. [Google Scholar] [CrossRef]
  13. Dai, S.; Kim, J.; Xu, Y.; Waite, W.F.; Jang, J.; Yoneda, J.; Collett, T.S.; Kumar, P. Permeability anisotropy and relative permeability in sediments from the National Gas Hydrate Program Expedition 02, offshore India. Mar. Pet. Geol. 2018, 123, 3339–3346. [Google Scholar] [CrossRef]
  14. Winters, W.; Mason, D. Methane hydrate formation in partially water-saturated Ottawa sand. Am. Miner. 2004, 89, 1202–1207. [Google Scholar]
  15. Hyodo, M.; Nakata, Y.; Yoshimoto, N.; Ebinuma, T. Basic Research on the mechanical behavior of methane hydrate-sediments mixture. Soils Found. 2005, 45, 75–85. [Google Scholar]
  16. Boswell, R.; Yoneda, J.; Waite, W.F. India National Gas Hydrate Program Expedition 02 summary of scientific results: Evaluation of natural gas-hydrate-bearing pressure cores. Mar. Pet. Geol. 2018, in press. [Google Scholar] [CrossRef]
  17. Zou, C.; Dong, D.; Wang, S.; Li, J.; Li, X.; Wang, Y.; Li, D.; Cheng, K. Geological characteristics and resource potential of shale gas in China. Pet. Explor. Dev. 2010, 37, 641–653. [Google Scholar] [CrossRef]
  18. Zhao, X.; Blunt, M.J.; Yao, J. Pore-scale modeling: Effects of wettability on waterflood oil recovery. J. Pet. Sci. Eng. 2010, 71, 169–178. [Google Scholar] [CrossRef]
  19. Mostaghimi, P.; Blunt, M.J.; Bijeljic, B. Computations of absolute permeability on Micro-CT images. Math. Geosci. 2013, 45, 103–125. [Google Scholar] [CrossRef]
  20. Zeng, J.; Feng, X.; Feng, S.; Zhang, Y.; Qiao, J.; Yang, Z. Influence of tight sandstone micro-nano pore-throat structures on petroleum accumulation: Evidence from experimental simulation combining X-ray tomography. J. Nanosci. Nanotechnol. 2017, 17, 6459–6469. [Google Scholar] [CrossRef]
  21. Dong, H. Micro-CT Imaging and Pore Network Extraction. Ph.D. Thesis, Department of Earth Science and Engineering, Imperial College London, London, UK, 2008. [Google Scholar]
Figure 1. Structural units in the northern South China Sea and location of the SHCS-4 gas hydrate production test well [5].
Energies 12 03688 g001
Figure 2. Schematic diagram of seepage and computed tomographic (CT) scan experimental instruments for clayey-silt reservoir samples.
Energies 12 03688 g002
Figure 3. Clayey-silt sample from natural gas hydrate reservoirs of the Shenhu Area.
Energies 12 03688 g003
Figure 4. The experimental steps of stepwise pressurization and pulse pressurization methods.
Energies 12 03688 g004
Figure 5. Flow rate and permeability change under different pressure differences in the first group experiment.
Energies 12 03688 g005
Figure 6. Flow rate and permeability change under different pressure differences in the second group experiment.
Energies 12 03688 g006
Figure 7. Flow rate and permeability change under different pressure differences in the third group experiment.
Energies 12 03688 g007
Figure 8. CT projections of clayey-silt sample (a) before and (b) after the seepage experiment.
Energies 12 03688 g008
Figure 9. Flow rate and permeability change under different pressure differences in the fourth group experiment.
Energies 12 03688 g009
Figure 10. The three-dimensional, cross-sectional, longitudinal section, and pore reconstruction CT images of the fourth experimental sample under different pressure differences. The pores which have ring-like boundaries are derived from microorganisms such as diatoms. The pixel number and pixel resolution of the sample are 2000 × 2000 × 1500 and ~3 μm, respectively.
Energies 12 03688 g010
Figure 11. Porosity versus permeability for the fourth set of experiments.
Energies 12 03688 g011
Table 1. Detailed experimental parameters of four sets of the seepage experiment.
NumberDiameter (mm)Length (mm)Dry Weight (g)Pressure Difference (kPa)Pressure Gradient (MPa/m)Working System
18201.220, 60, 80, 90, 100, 150, 2001, 3, 4, 4.5, 5, 7.5, 10Stepwise
28201.220, 60, 80, 90, 100, 90, 80, 60, 201, 3, 4, 4.5, 5, 4.5, 4, 3, 1Pulse
38100.610, 30, 40, 50, 40, 30, 101, 3, 4, 5, 4, 3, 1Pulse
4 *8100.6610, 30, 50, 75, 1001, 3, 5, 7.5, 10Stepwsie
* Represents this set of experiment was simultaneously subjected to the seepage experiment and CT scan.
Table 2. Pore porosity (from three-dimensional pore space CT images) and permeability (stable value after each pressure experiments) of the fourth sample under different experimental pressure differences.
Pressure Difference (kPa)None10305075100
Porosity (%)18.6217.0916.2415.2913.9010.60
Permeability (mD)-13.4014.038.635.603.92

