Experimental Investigation and Benchmark Study of Oxidation of Methane–Propane–n-Heptane Mixtures at Pressures up to 100 bar

 ,
, 
Abstract
:1. Introduction
2. Materials and Methods
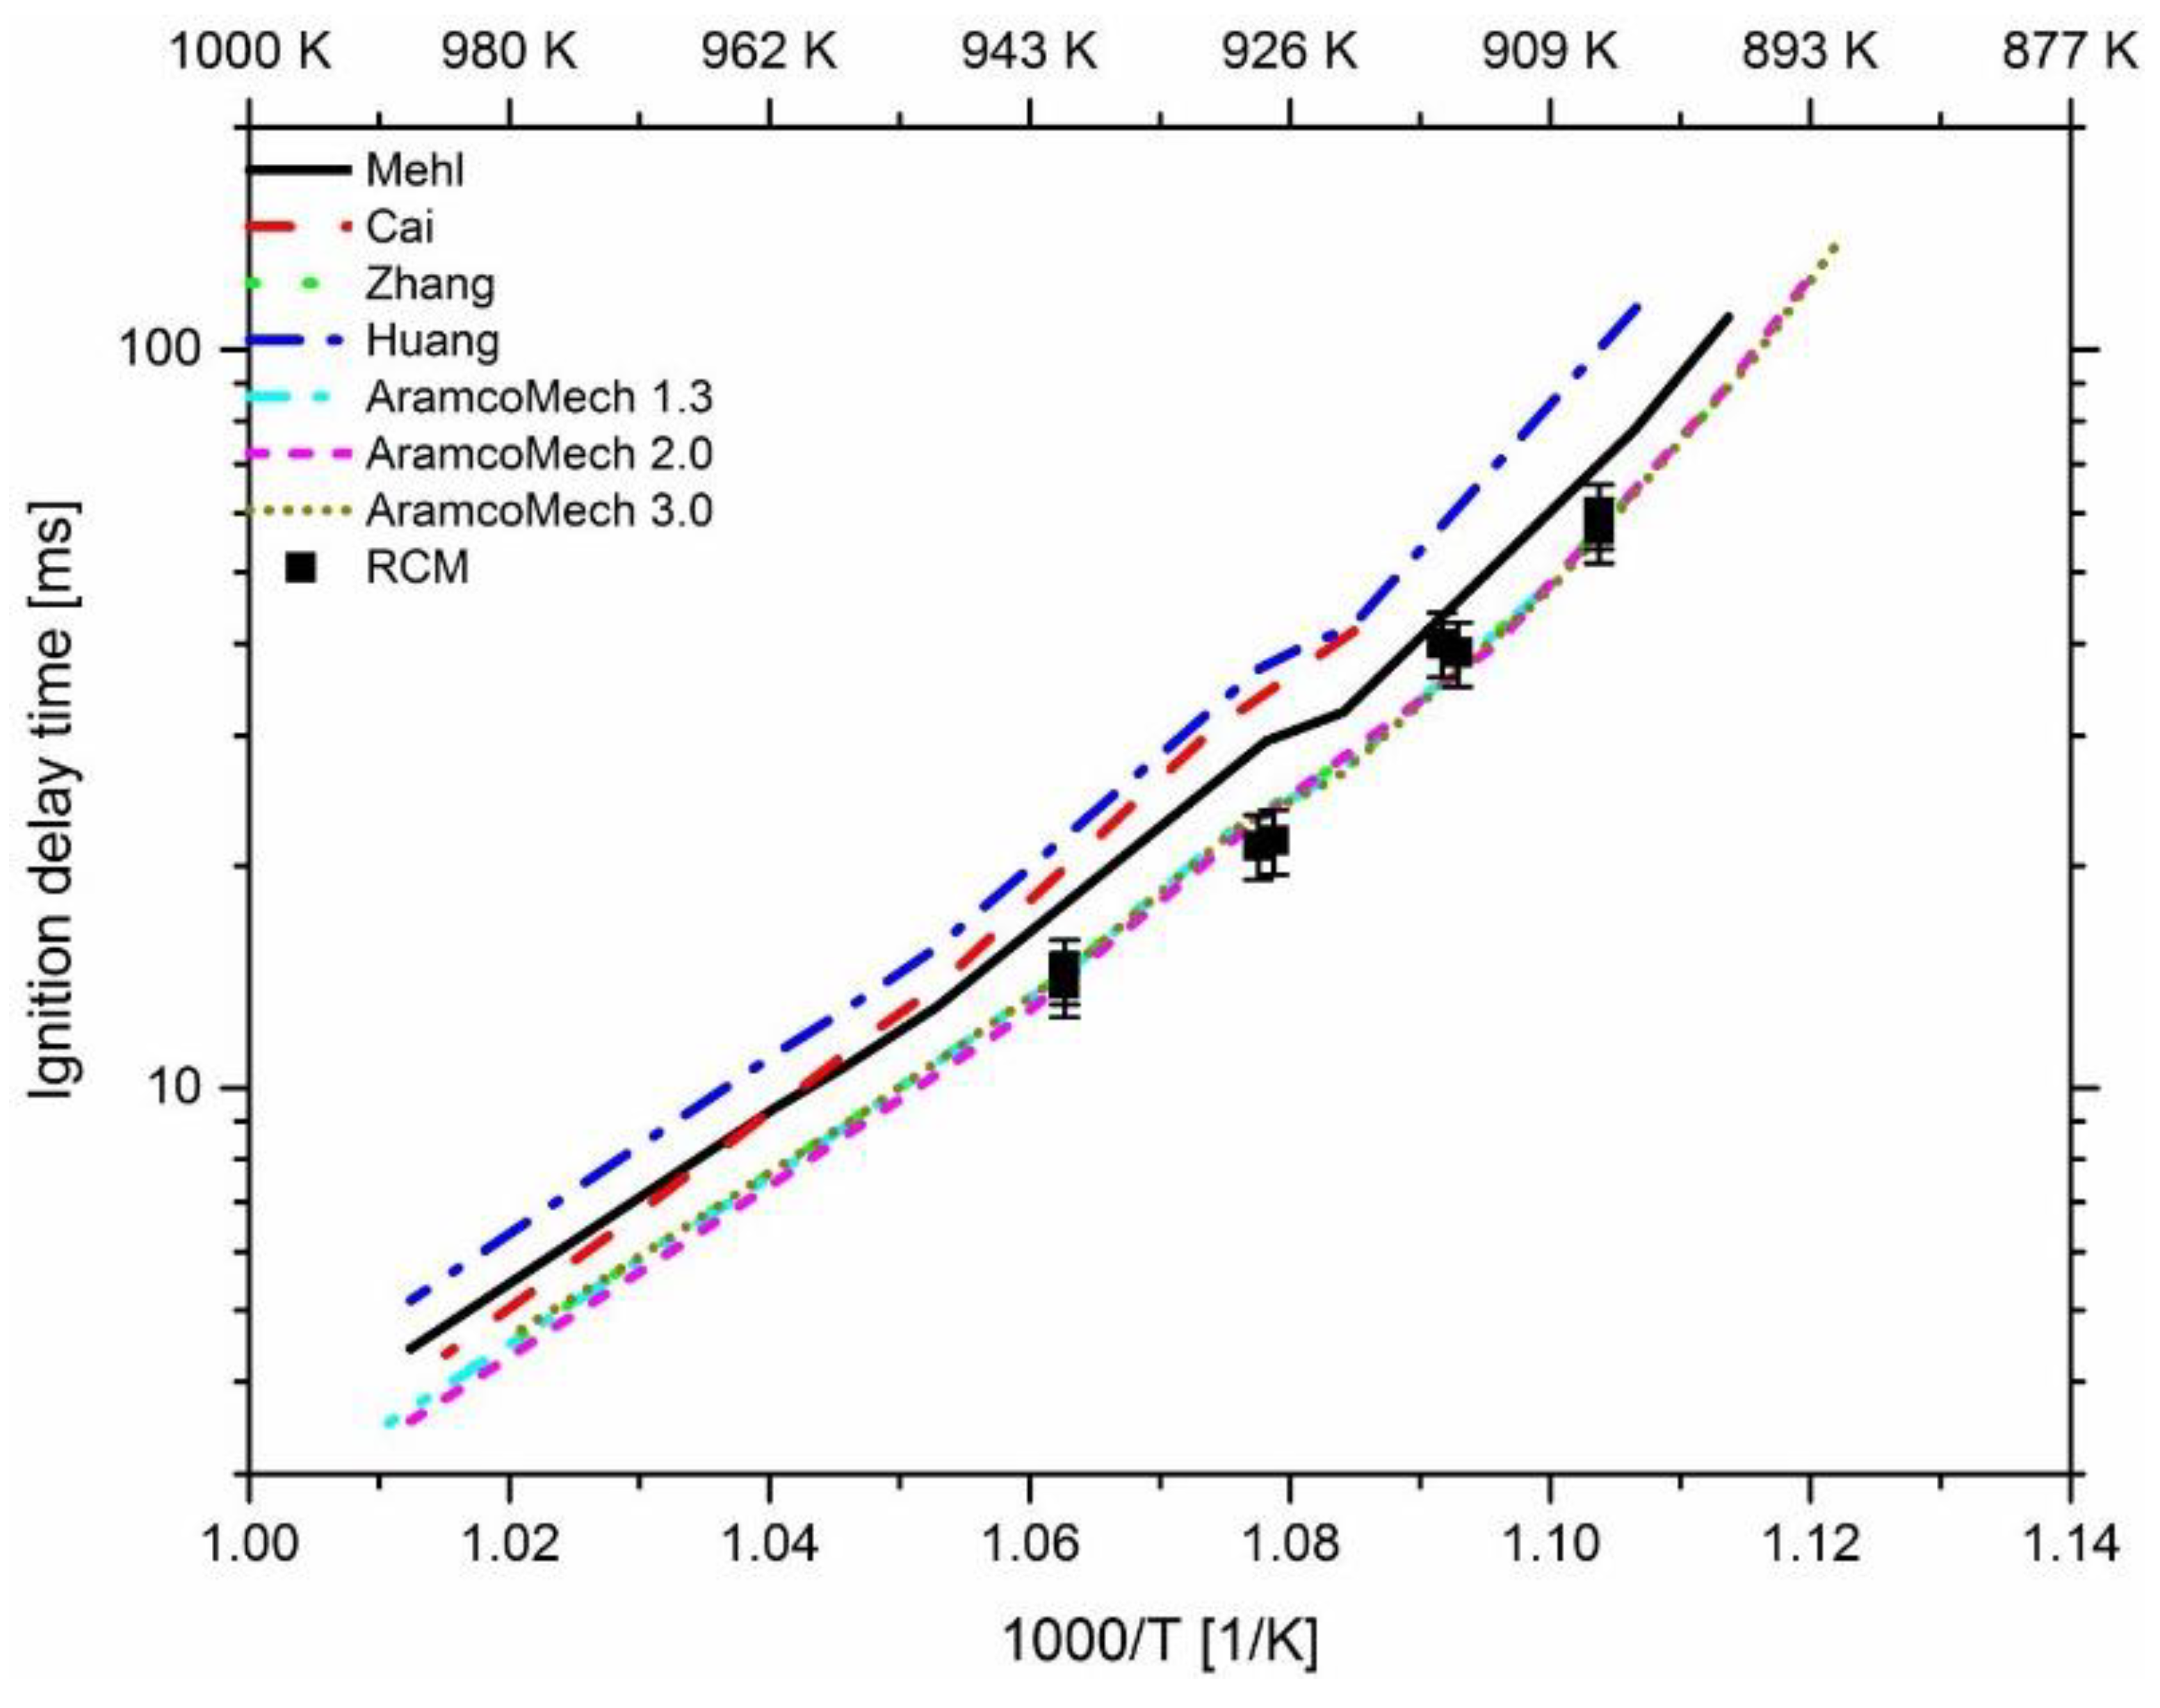
2.1. Investigated Reaction Mechanisms
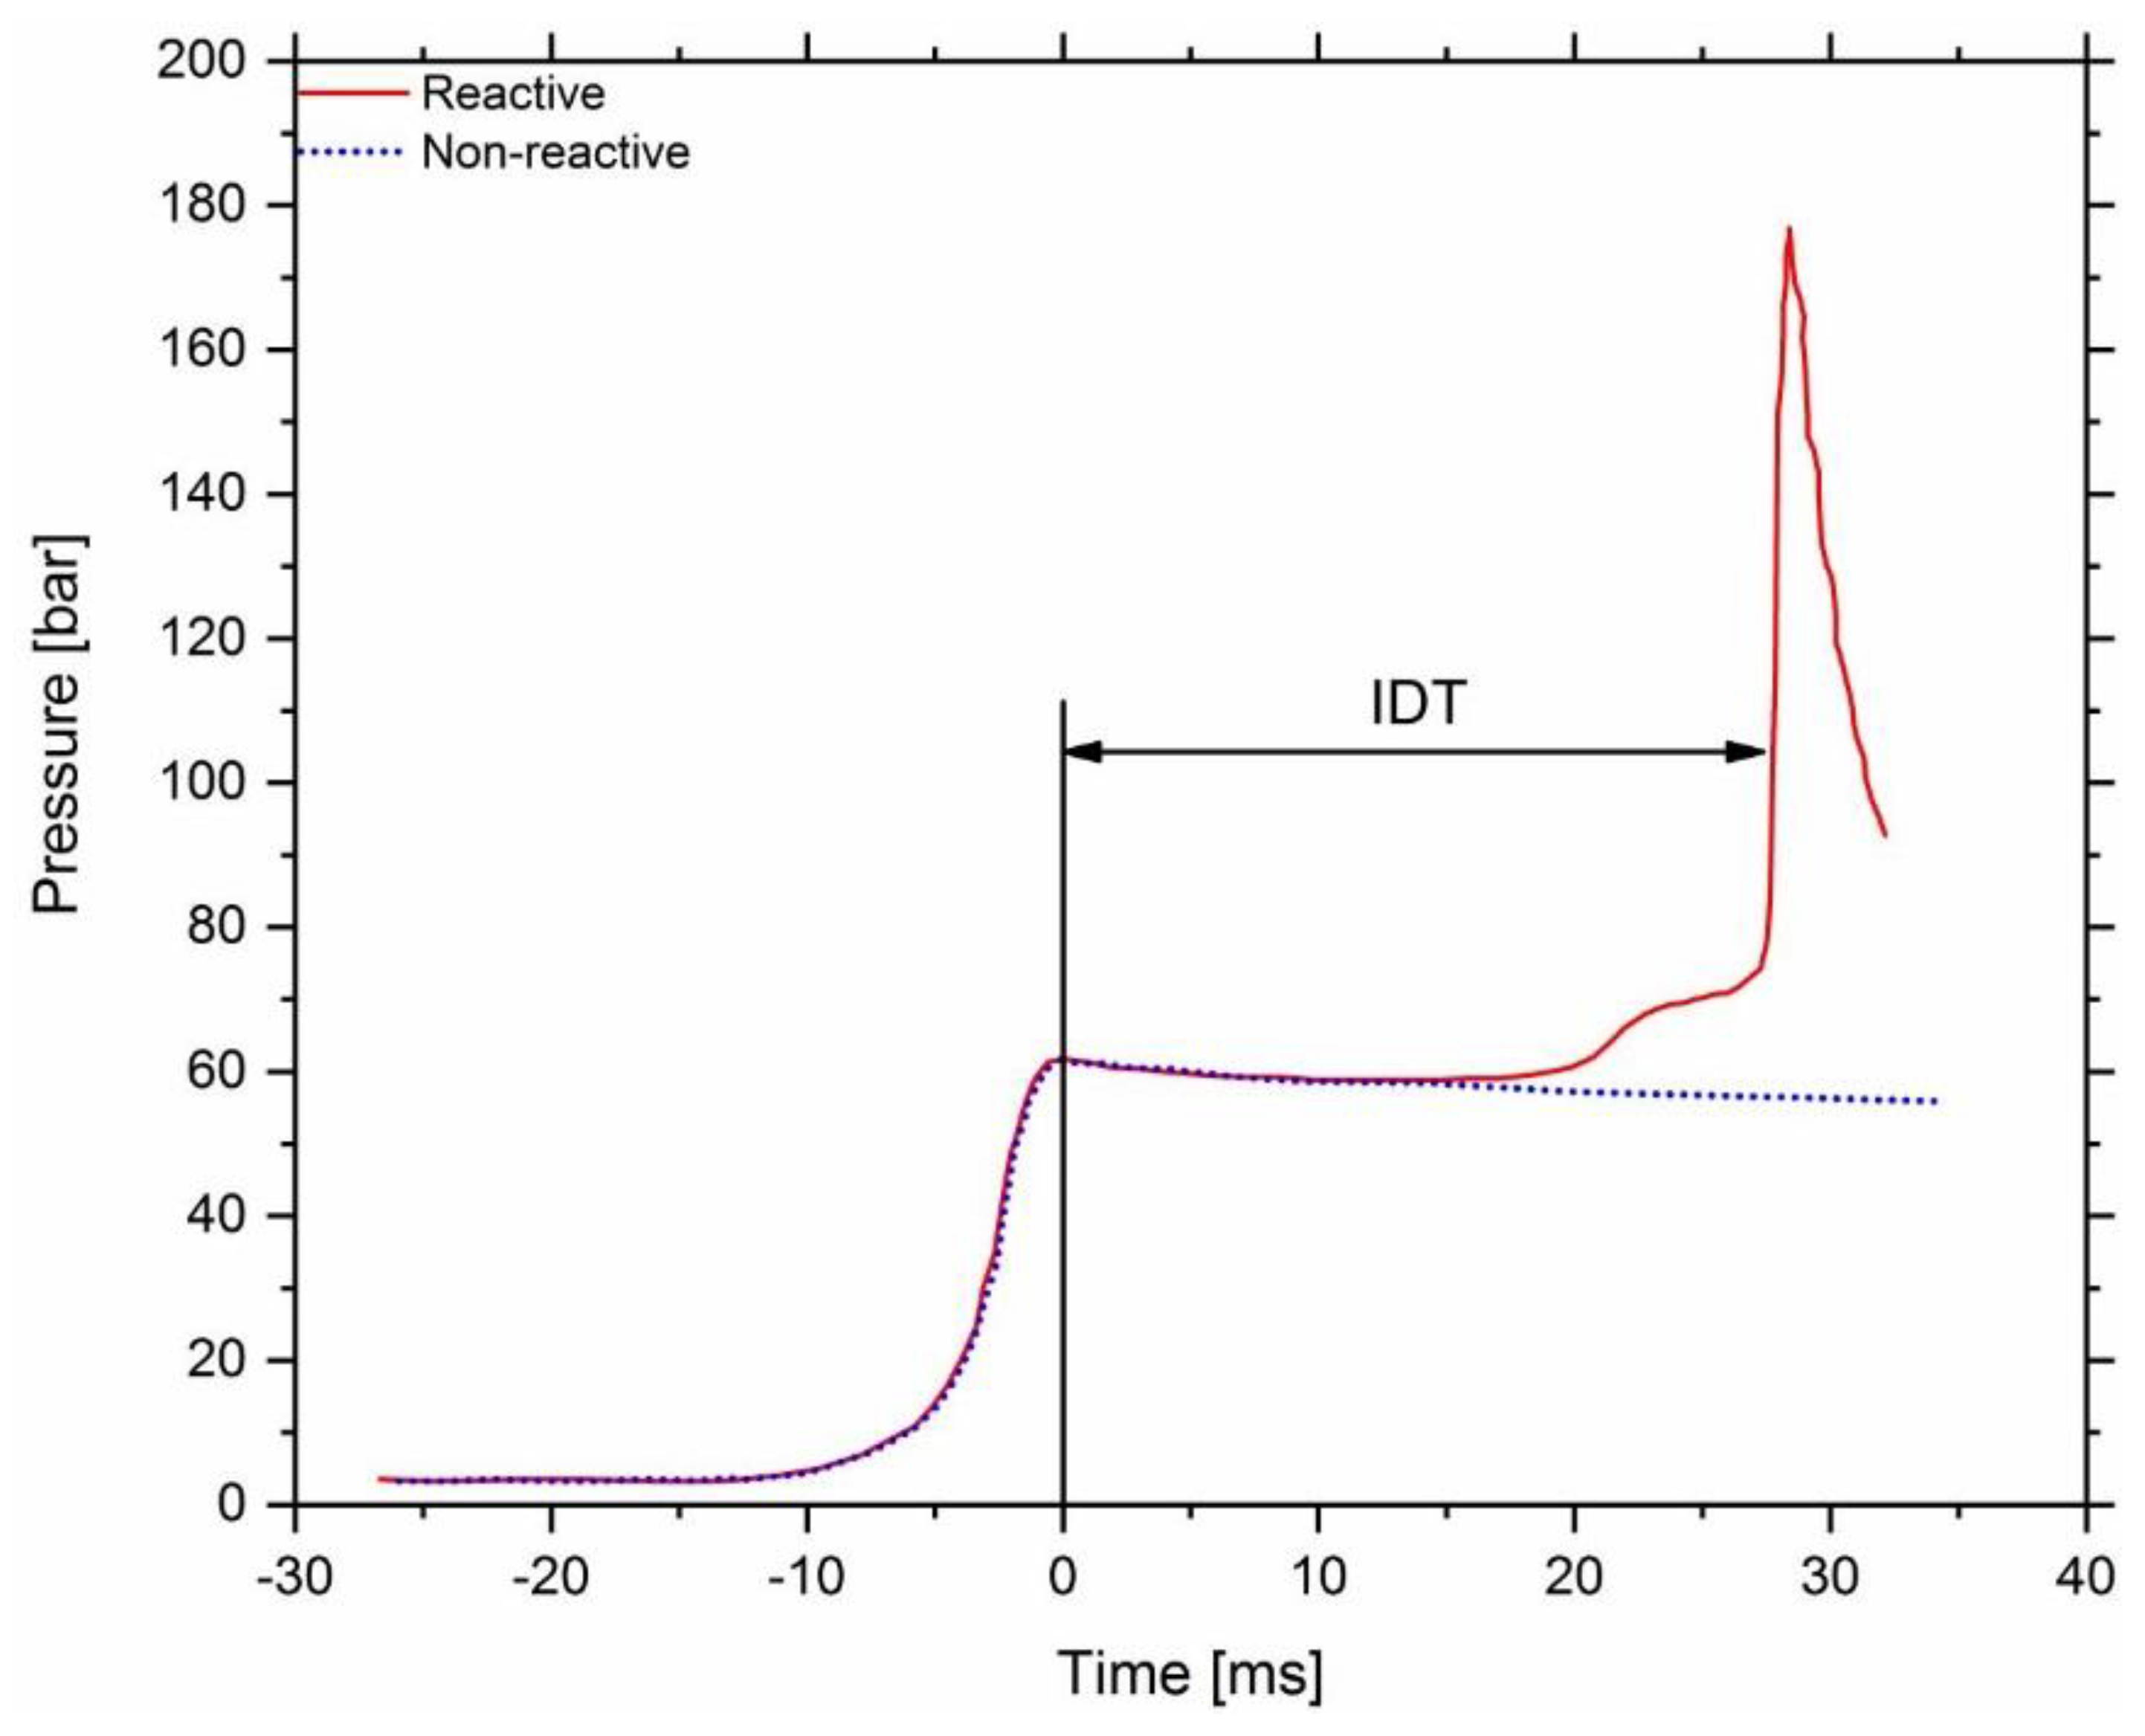
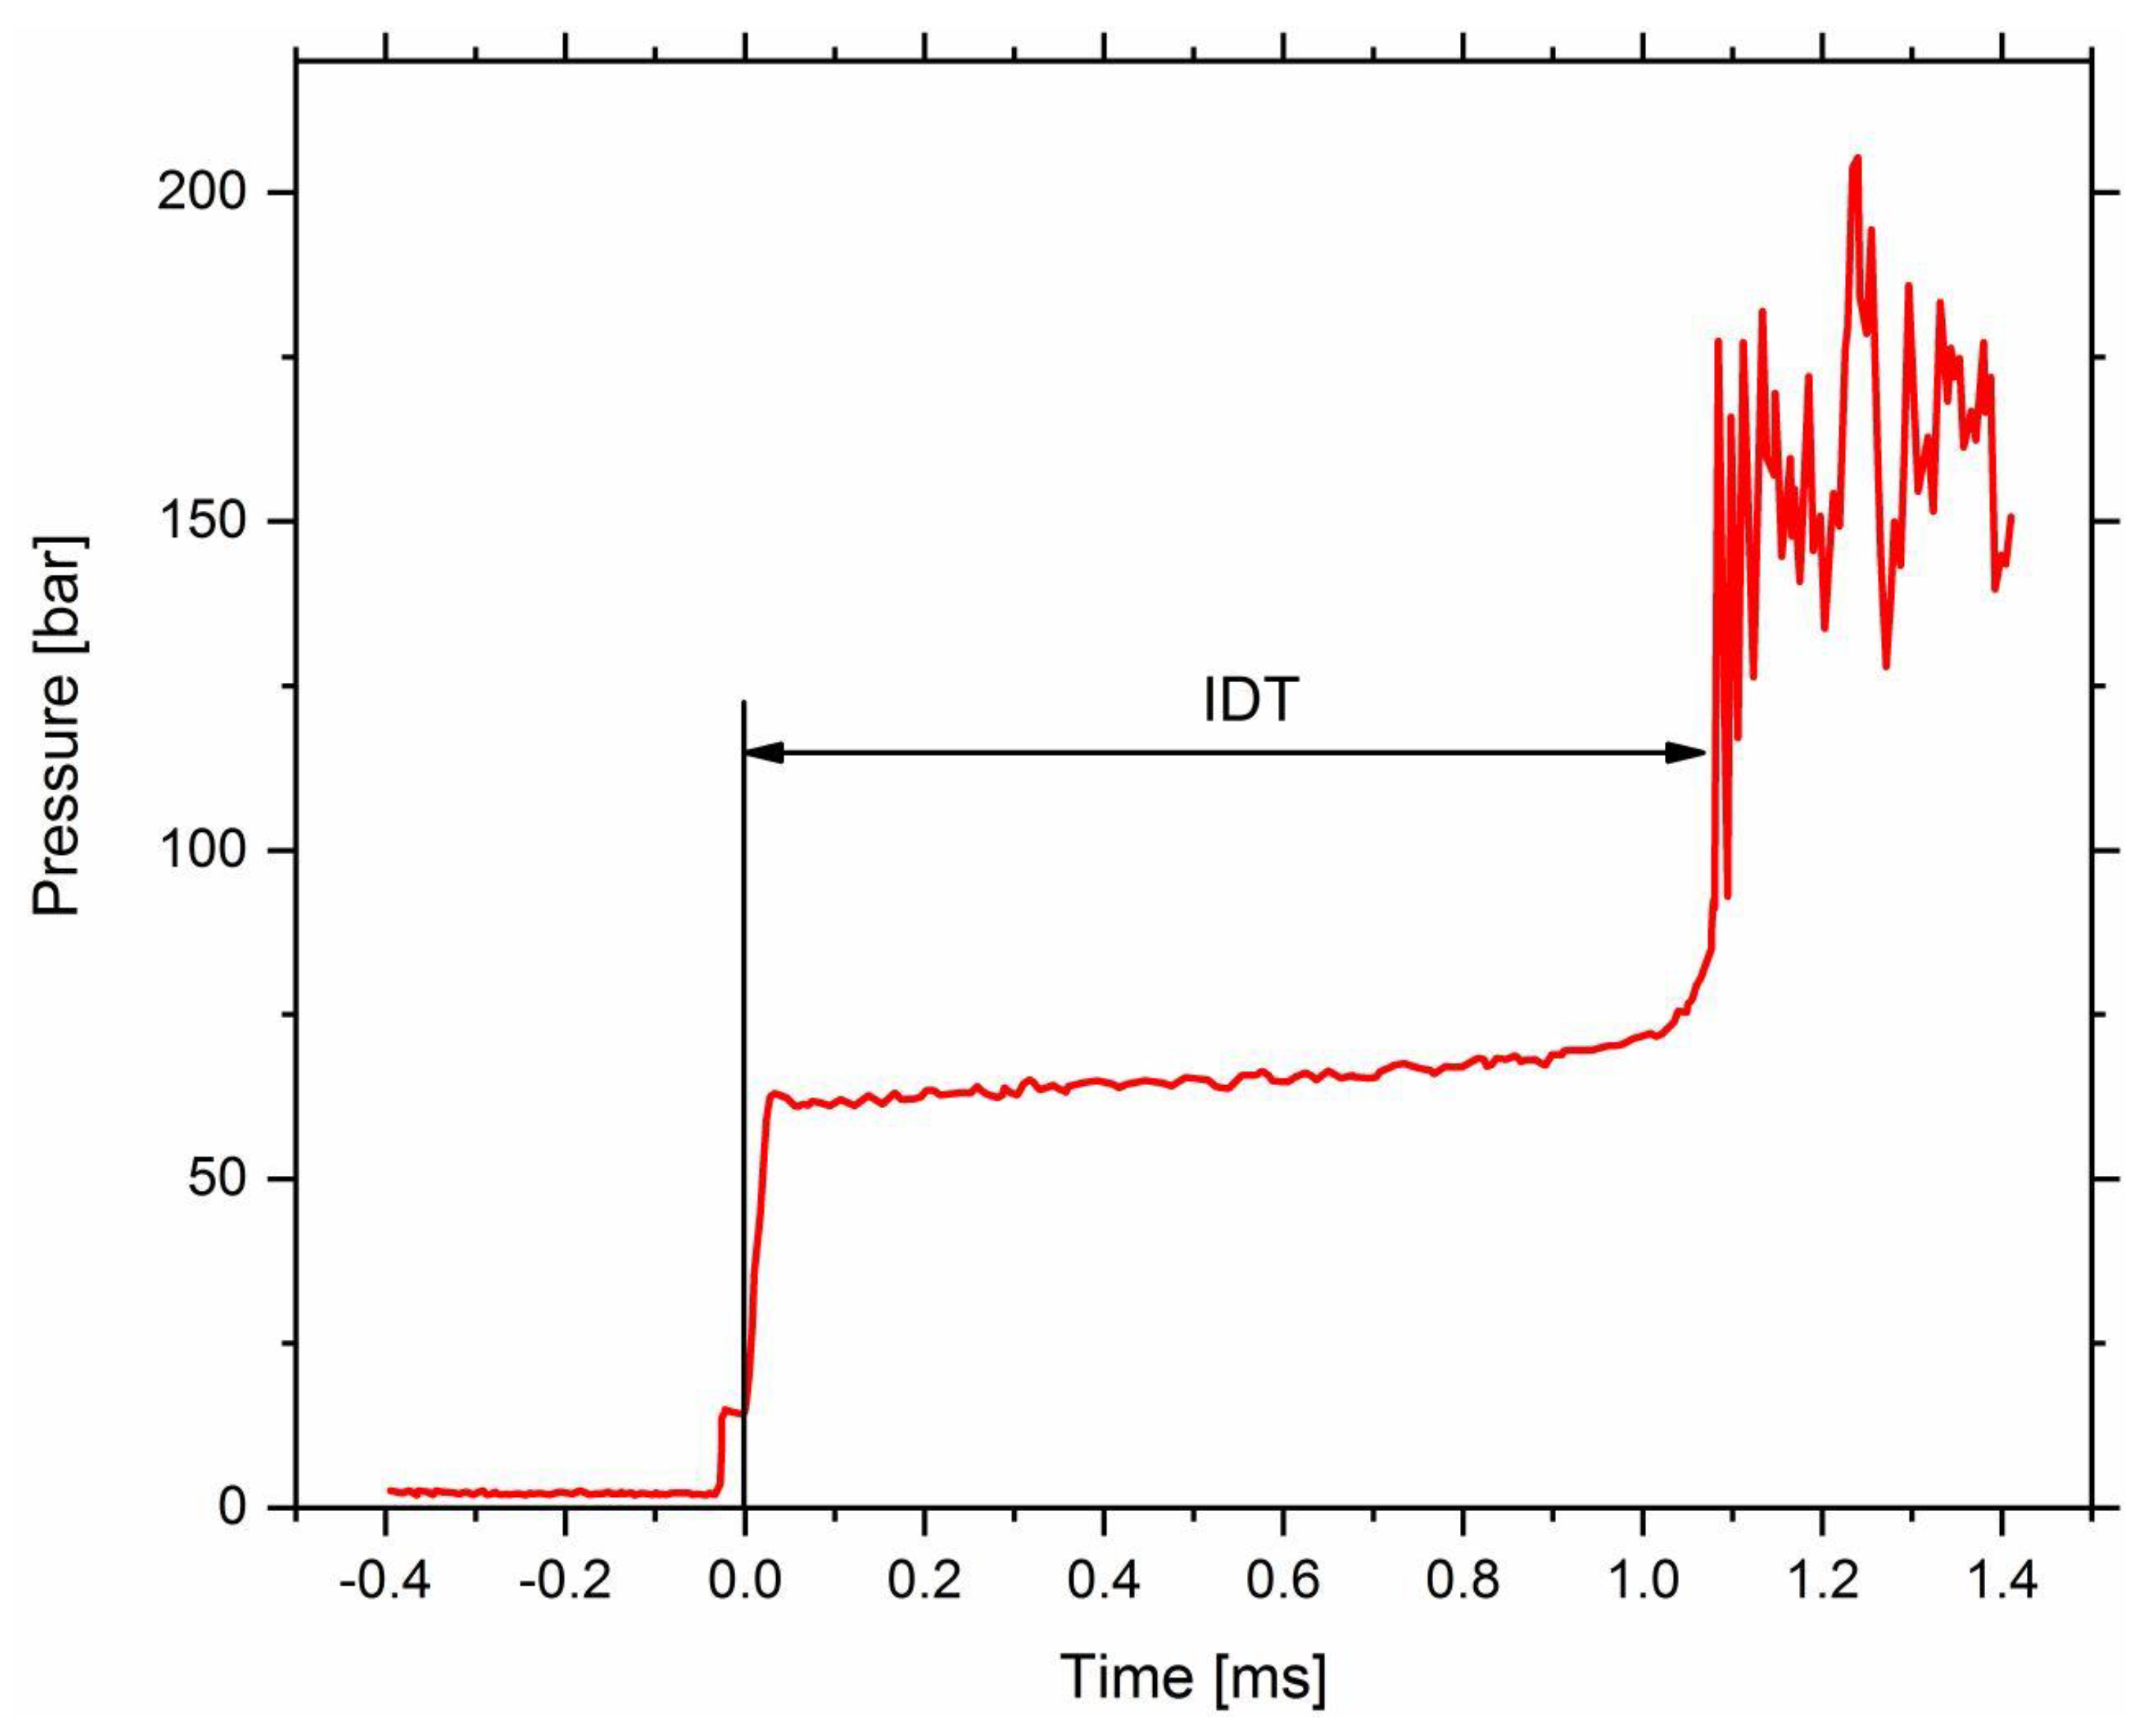
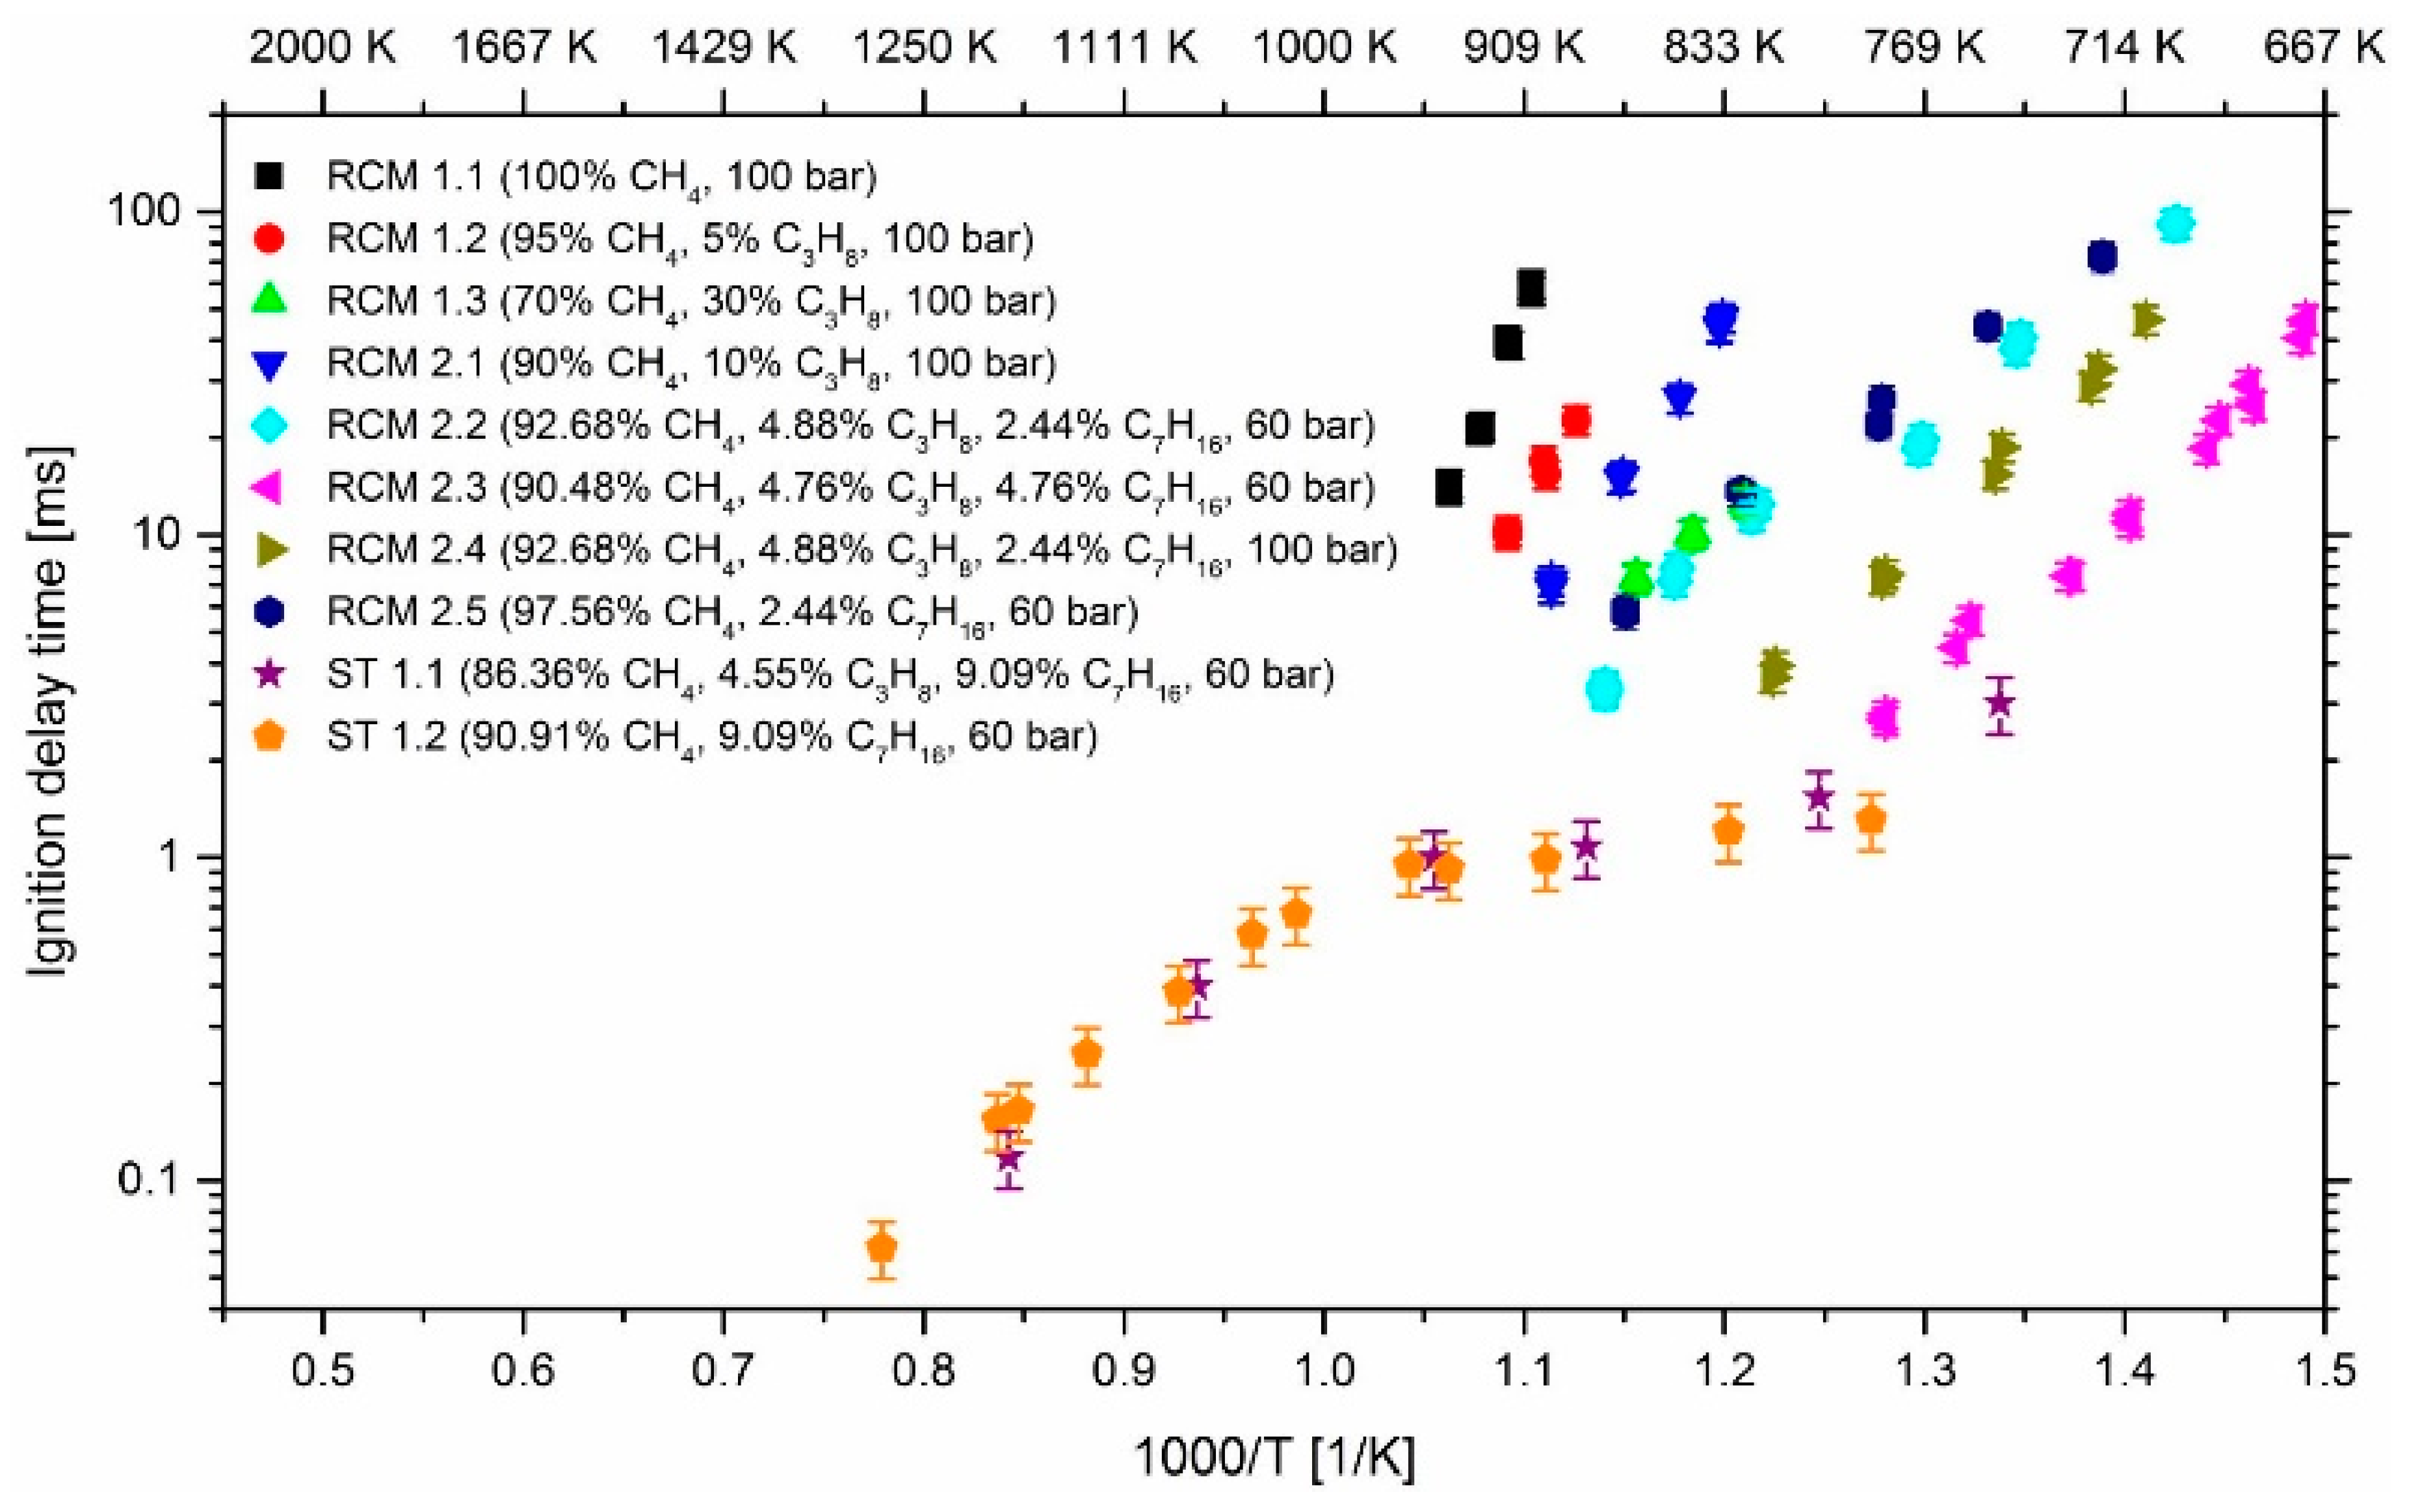
2.2. Experiments
3. Results and Discussion
3.1. Effect of Propane
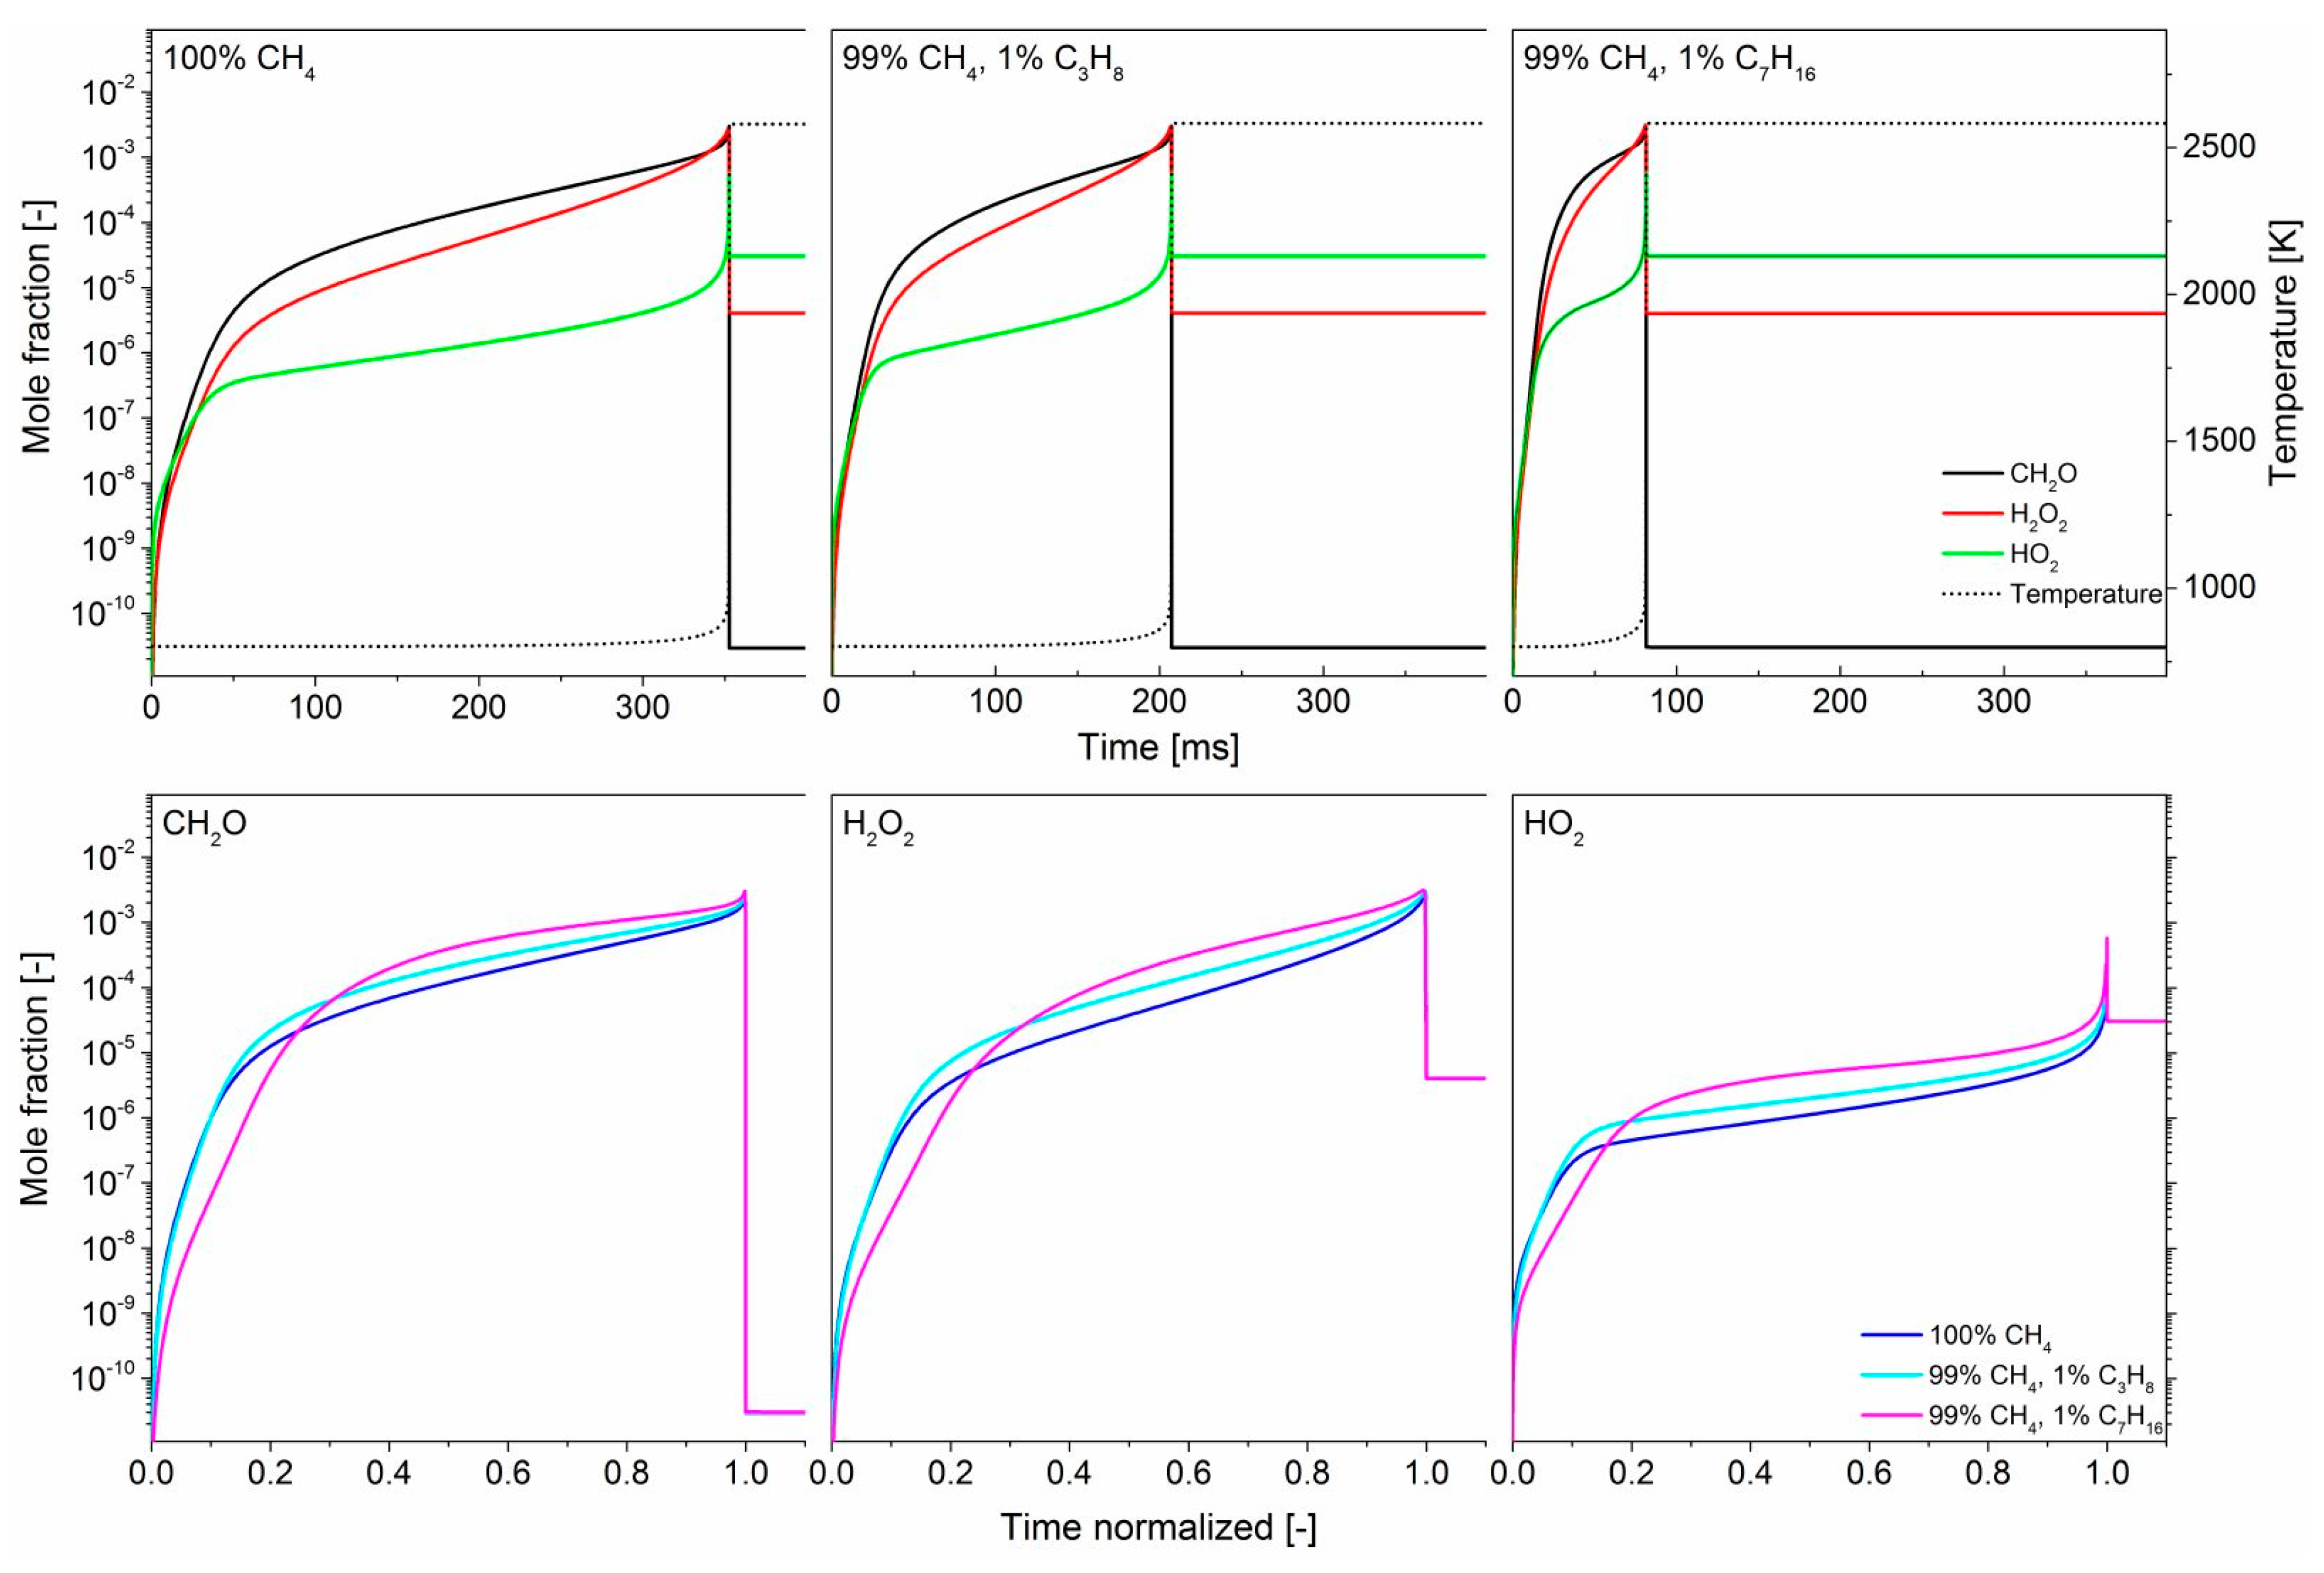
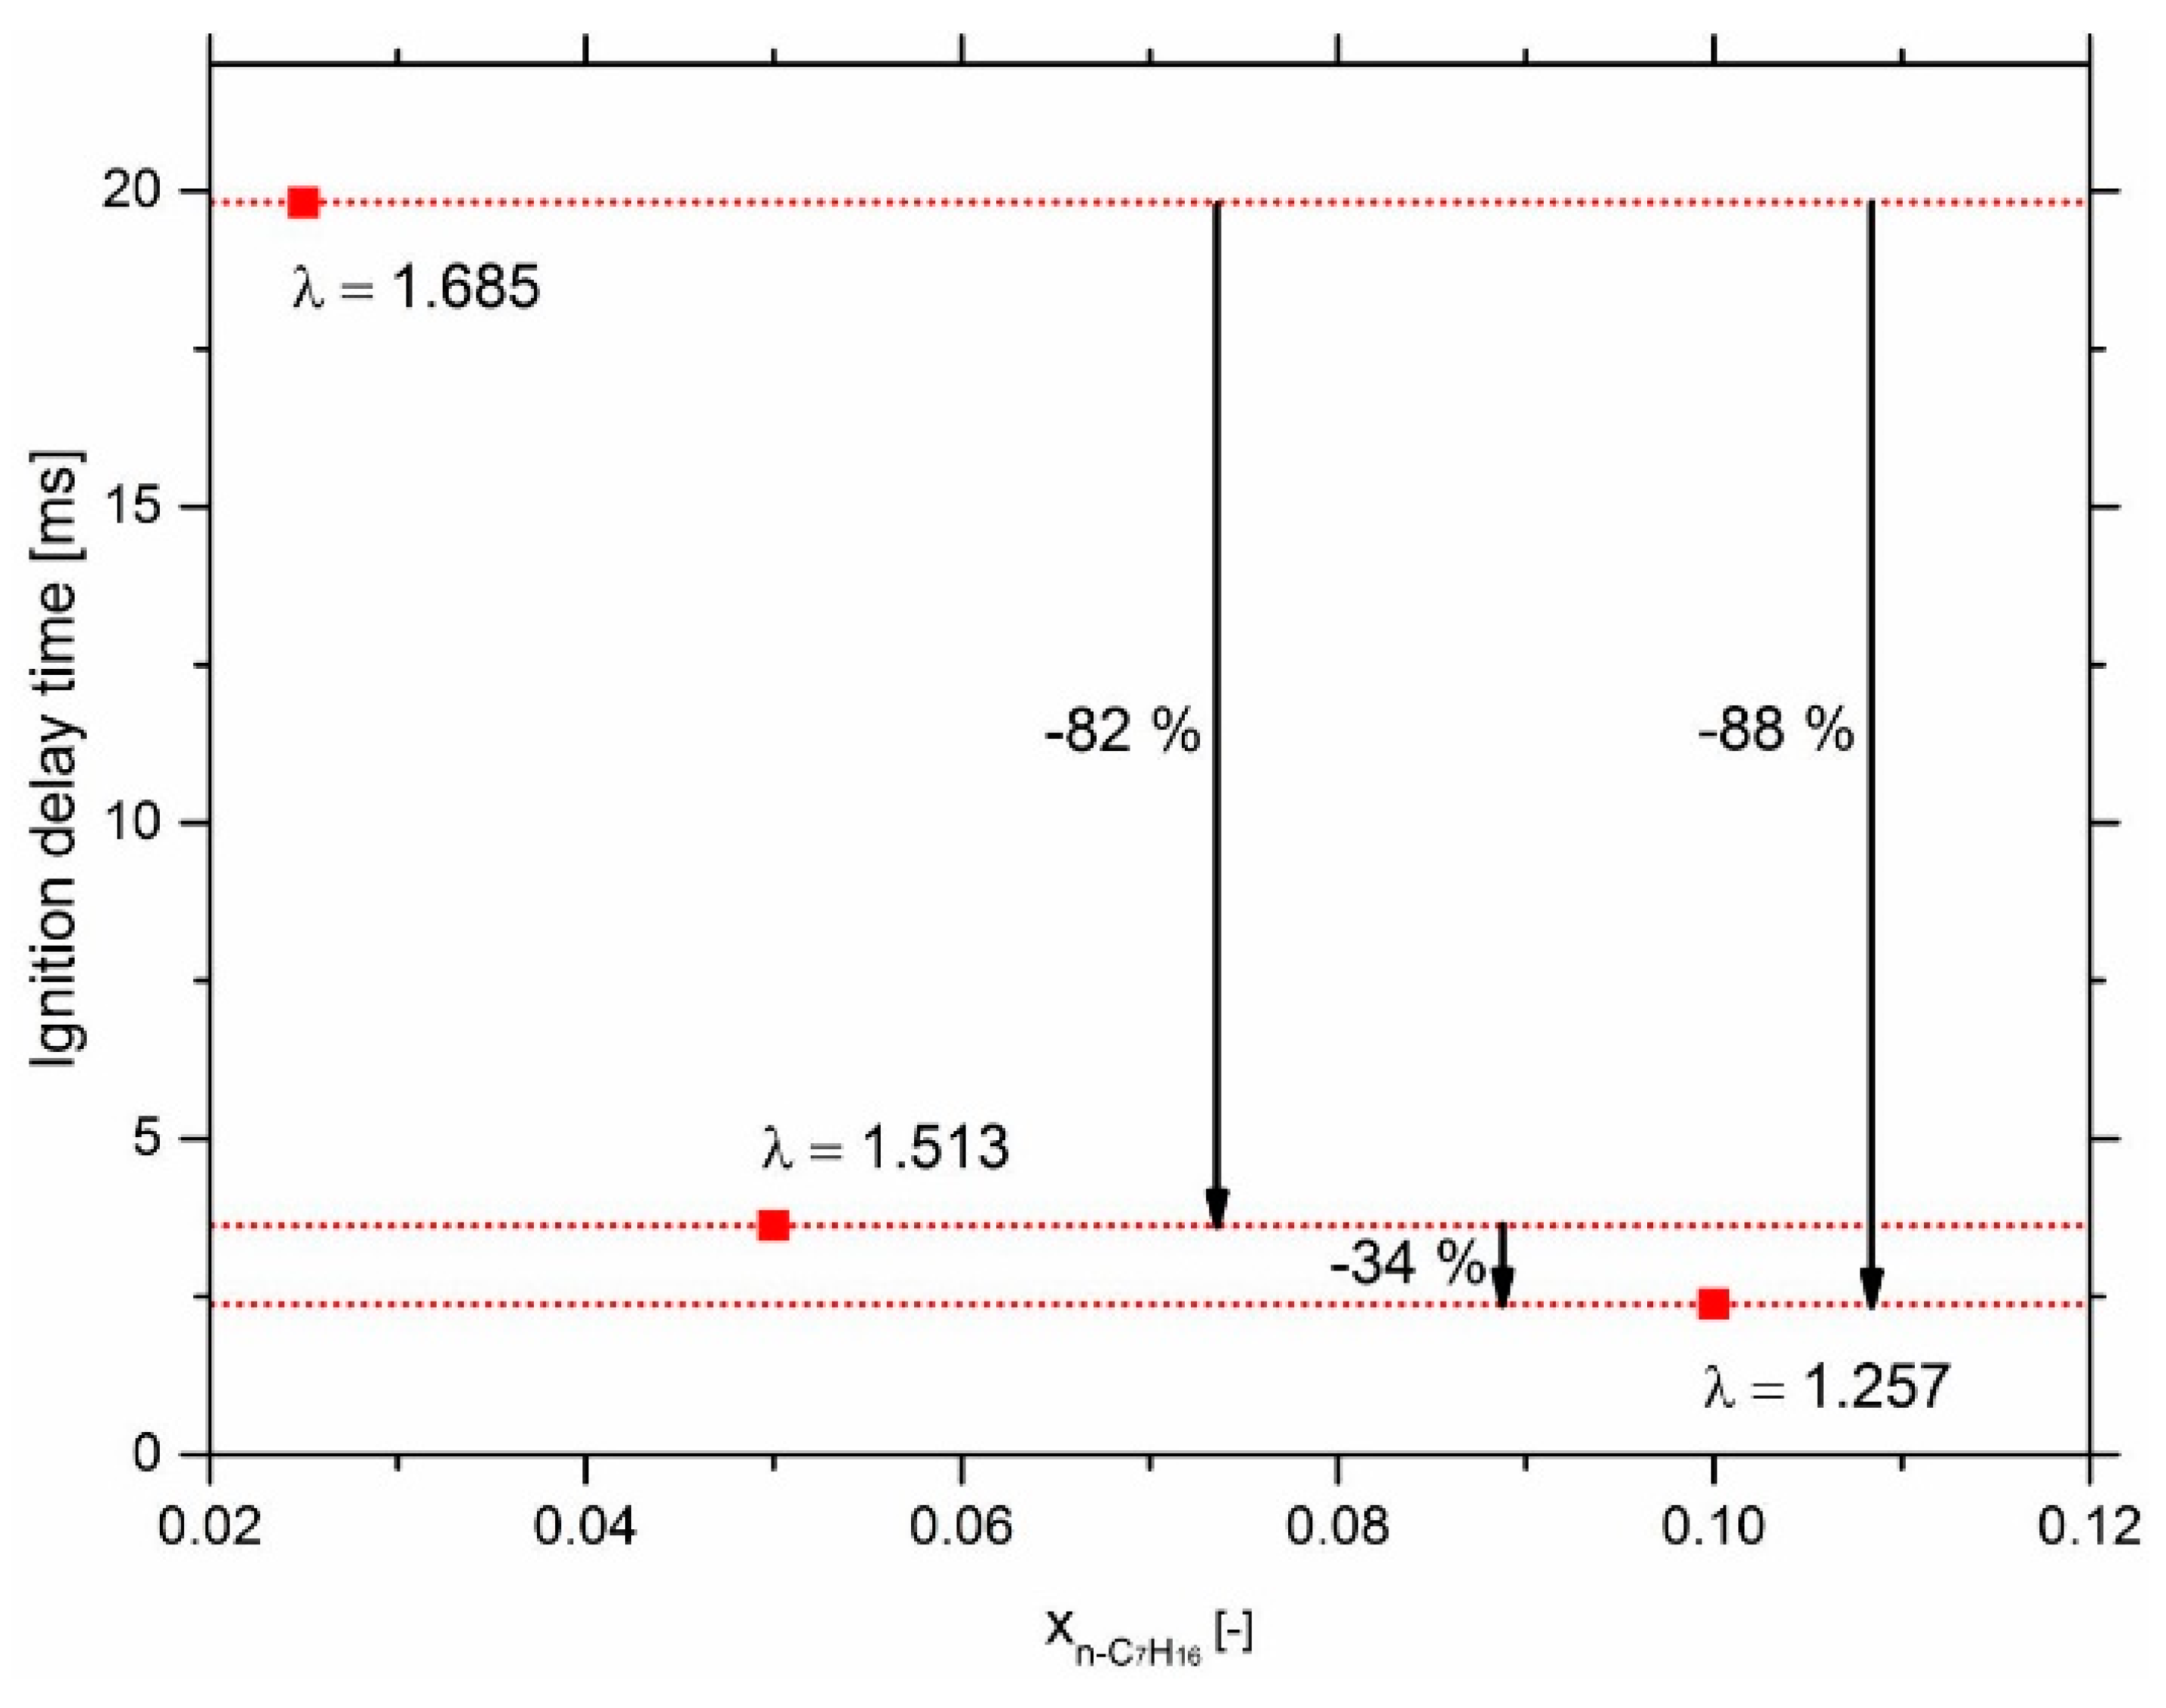
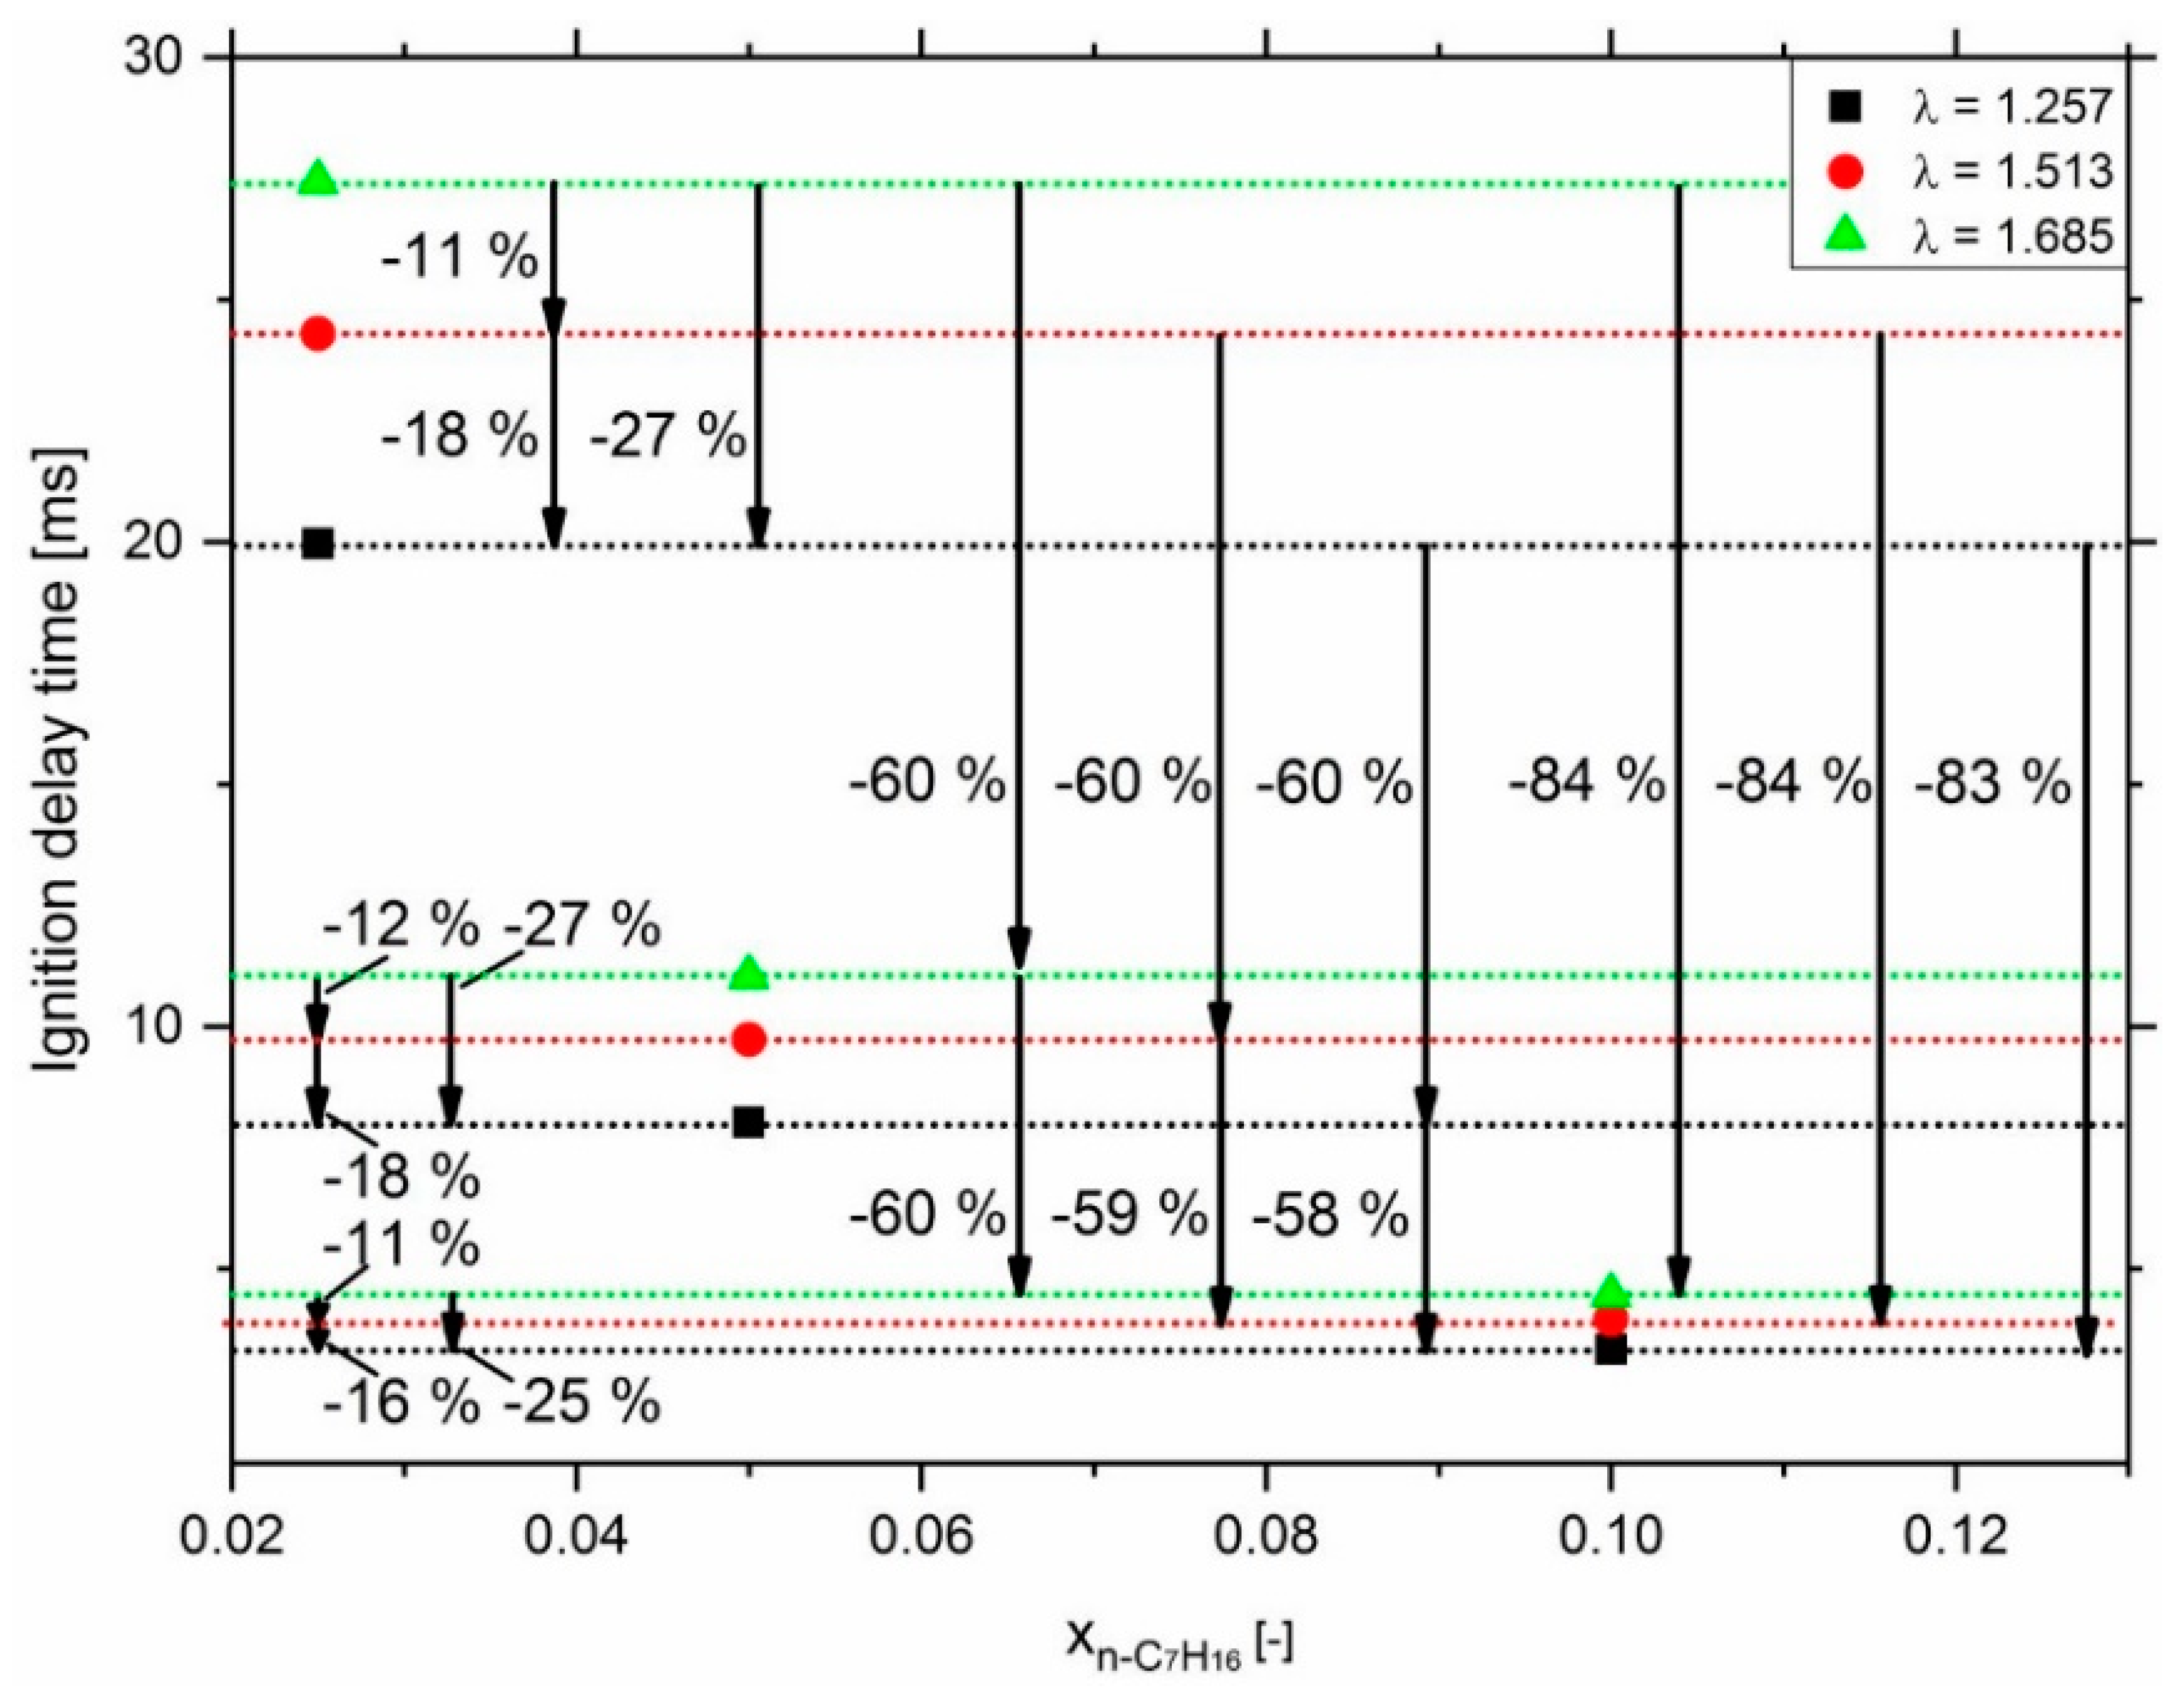
3.2. Effect of n-Heptane
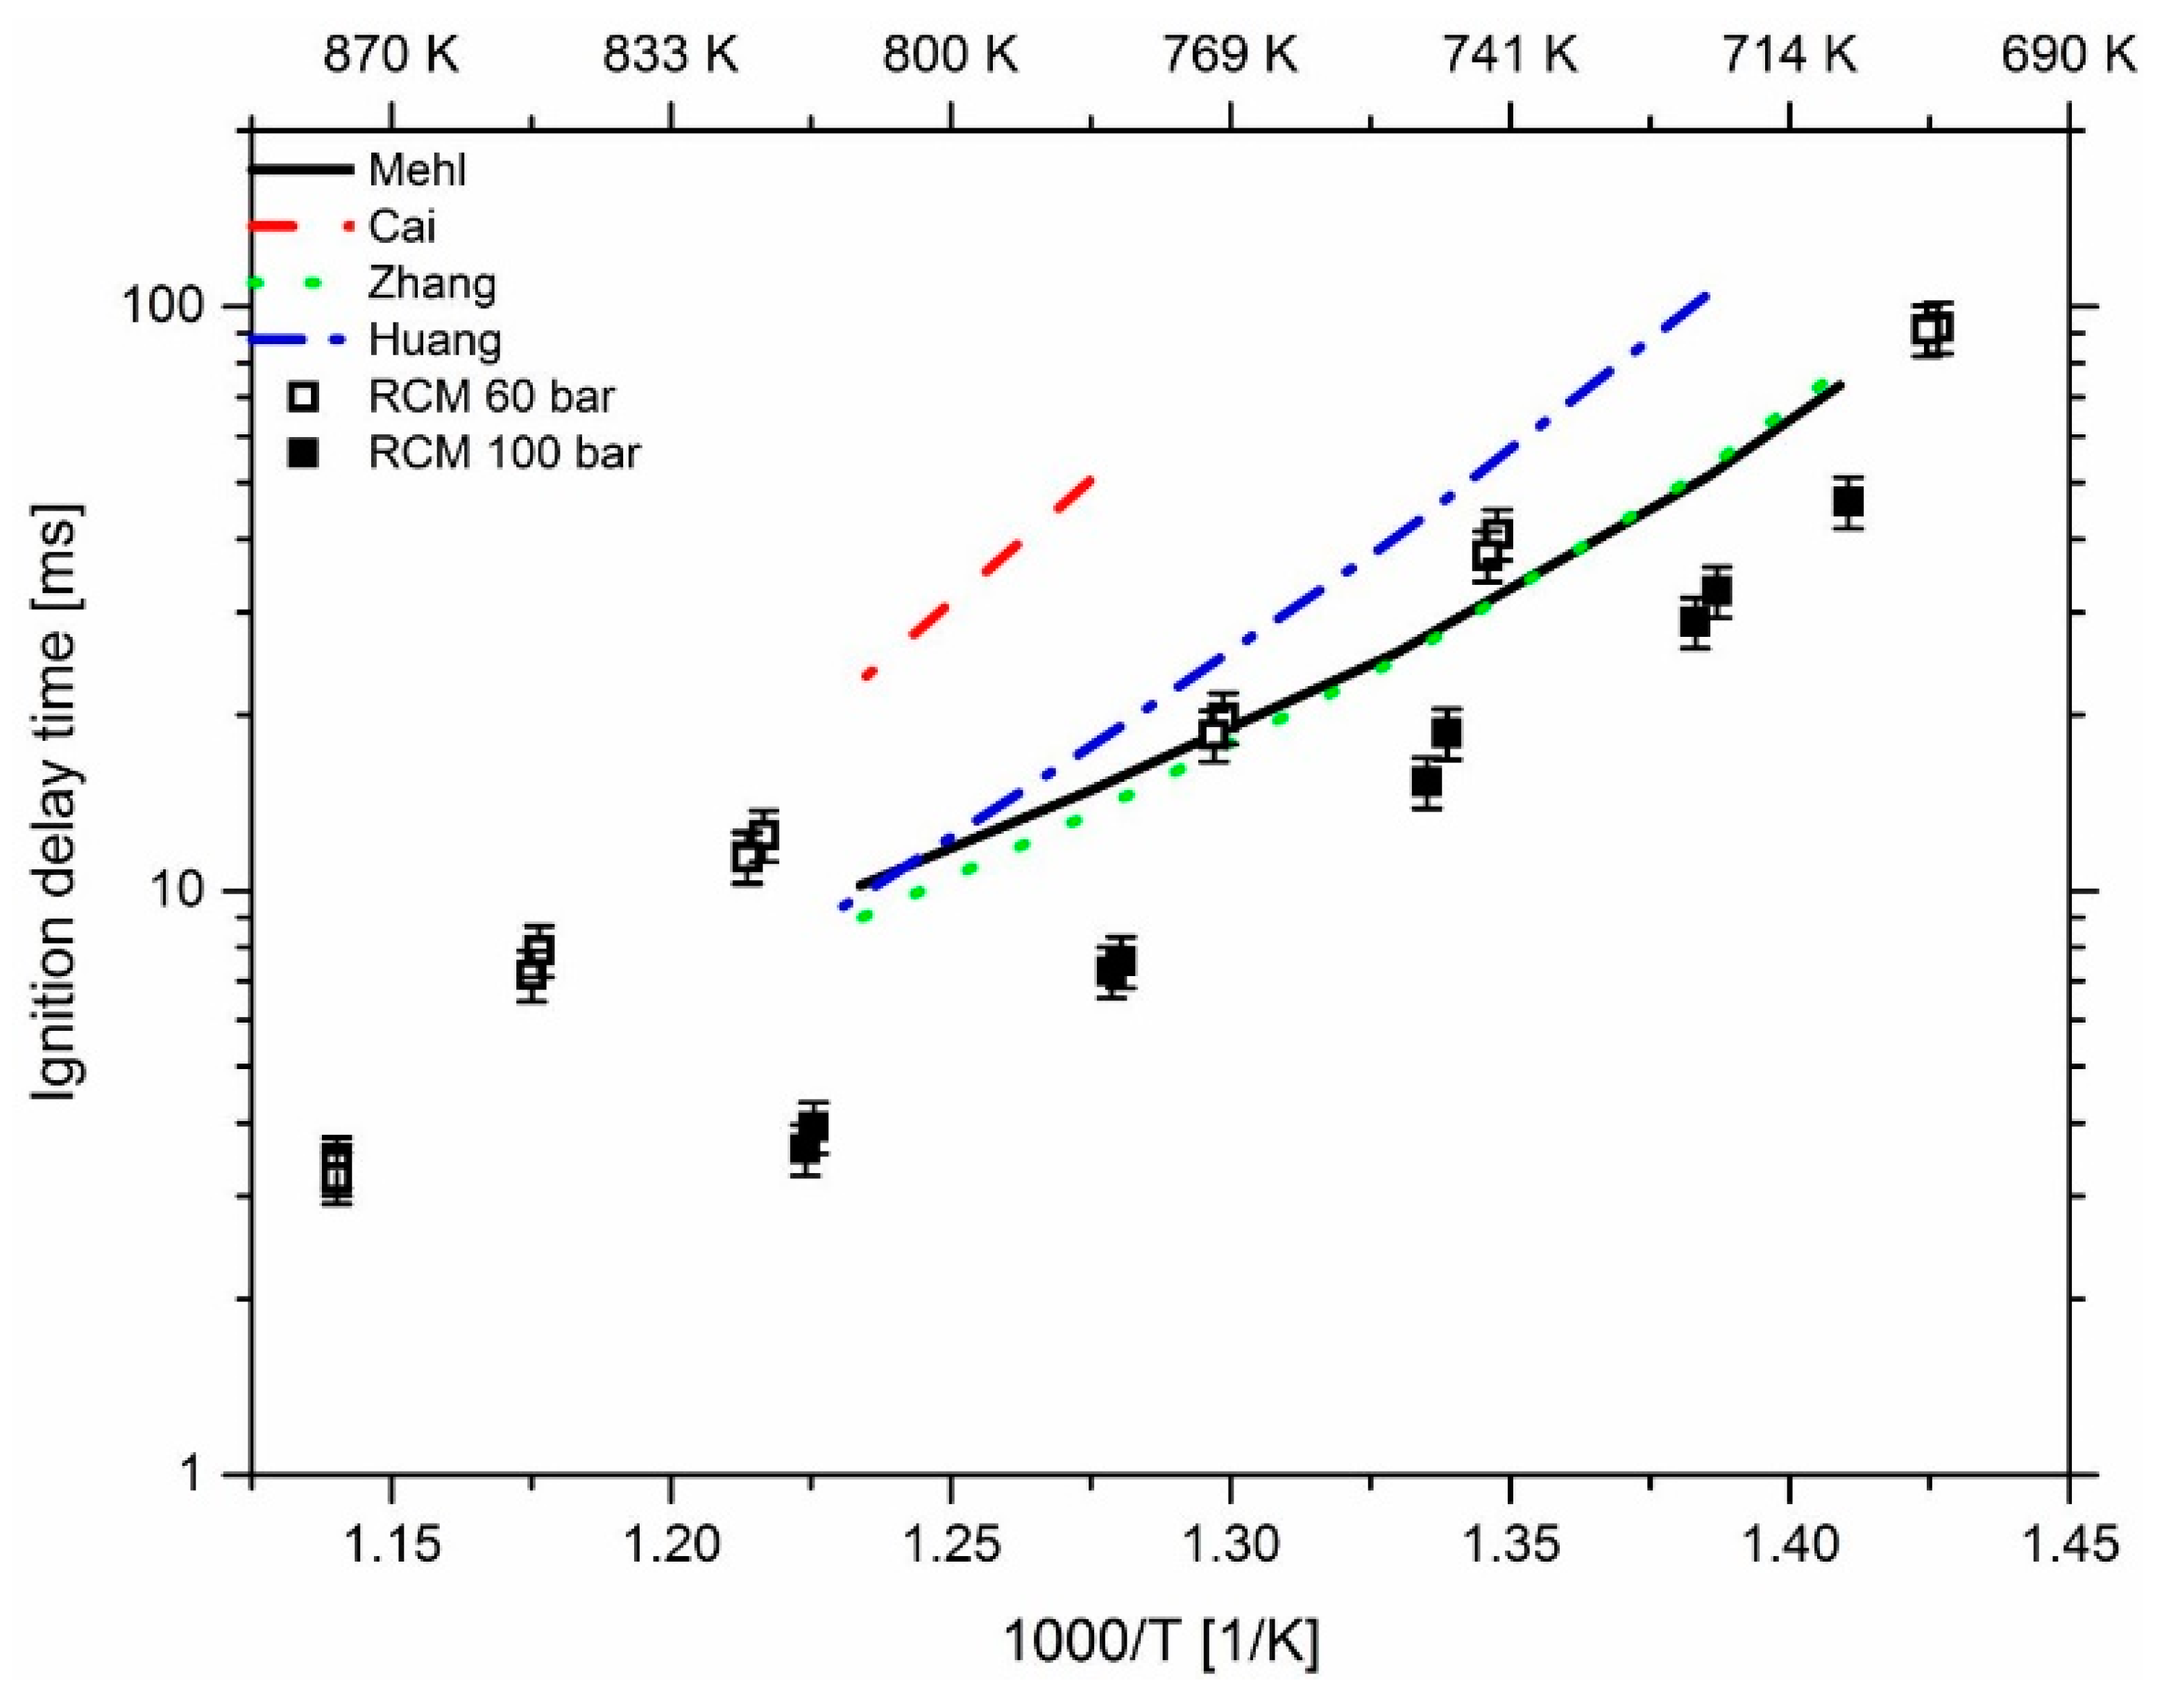
3.3. Effect of Pressure
4. Conclusions
Supplementary Materials
Author Contributions
Funding
Acknowledgments
Conflicts of Interest
References
- Wright, G. Fundamentals of Medium/Heavy Duty Diesel Engines; Jones & Bartlett Learning: Burlington, MA, USA, 2015. [Google Scholar]
- Dietsche, K.-H.; Reif, K. Kraftfahrtechnisches Taschenbuch; 28., überarb. u. erw. Aufl. 2014 ed.; Springer Vieweg: Wiesbaden, Germany, 2014. [Google Scholar]
- Schlick, H. Potentials and challenges of gas and dual-fuel engines for marine application. In Proceedings of the 5th Cimac Cascades, Busan, Korea, 23 October 2014. [Google Scholar]
- Fischer, M. Modellierung der Multikomponenten-Verdampfung im Homogenisierten Dieselmotorischen Brennverfahren; Cuvillier Verlag Göttingen: Göttingen, Germany, 2006; Volume 1. [Google Scholar]
- Jing, B.; Wandel, A.P. Numerical investigation into natural gas–diesel dual-fuel engine configuration. In Proceedings of the 11th Asia-Pacific Conference on Combustion, ASPACC 2017, Sydney, Australia, 10–14 December 2017. [Google Scholar]
- Li, Y.; Li, H.; Guo, H.; Li, Y.; Yao, M. A numerical investigation on methane combustion and emissions from a natural gas-diesel dual fuel engine using CFD model. Appl. Energy 2017, 205, 153–162. [Google Scholar] [CrossRef]
- Zhao, W.; Yang, W.; Fan, L.; Zhou, D.; Ma, X. Development of a skeletal mechanism for heavy-duty engines fuelled by diesel and natural gas. Appl. Therm. Eng. 2017, 123, 1060–1071. [Google Scholar] [CrossRef]
- Ra, Y.; Chuahy, F.; Kokjohn, S. Development and validation of a reduced reaction mechanism with a focus on diesel fuel/syngas co-oxidation. Fuel 2016, 185, 663–683. [Google Scholar] [CrossRef] [Green Version]
- Eder, L.; Ban, M.; Pirker, G.; Vujanovic, M.; Priesching, P.; Wimmer, A. Development and Validation of 3D-CFD Injection and Combustion Models for Dual Fuel Combustion in Diesel Ignited Large Gas Engines. Energies 2018, 11, 643. [Google Scholar] [CrossRef]
- Mansor, W.N.W.; Olsen, D.B. Computational modeling of diesel and dual fuel combustion using CONVERGE CFD software. ARPN J. Eng. Appl. Sci. 2016, 11, 13697–13707. [Google Scholar]
- Hockett, A.G.; Hampson, G.; Marchese, A.J. Natural gas-diesel RCCI CFD simulations using multi-component fuel surrogates. Int. J. Powertrains 2017, 6, 76–108. [Google Scholar] [CrossRef]
- Ritzke, J.; Andree, S.; Theile, M.; Henke, B.; Schleef, K.; Nocke, J.; Hassel, E. Simulation of a Dual-Fuel Large Marine Engines using combined 0/1-D and 3-D Approaches. In Proceedings of the CIMAC Congress, Helsinki, Finland, 6–10 June 2016. [Google Scholar]
- Hockett, A.; Hampson, G.; Marchese, A.J. Development and Validation of a Reduced Chemical Kinetic Mechanism for Computational Fluid Dynamics Simulations of Natural Gas/Diesel Dual-Fuel Engines. Energy Fuels 2016, 30, 2414–2427. [Google Scholar] [CrossRef]
- Huang, H.; Lv, D.; Zhu, J.; Zhu, Z.; Chen, Y.; Pan, Y.; Pan, M. Development of a new reduced diesel/natural gas mechanism for dual-fuel engine combustion and emission prediction. Fuel 2019, 236, 30–42. [Google Scholar] [CrossRef]
- Bierschenk, D.M.; Pillai, M.R.; Lin, Y.; Barnett, S.A. Effect of Ethane and Propane in Simulated Natural Gas on the Operation of Ni-YSZ Anode Supported Solid Oxide Fuel Cells. Fuel Cells 2010, 10, 1129–1134. [Google Scholar] [CrossRef]
- Healy, D.; Curran, H.J.; Simmie, J.M.; Kalitan, D.M.; Zinner, C.M.; Barrett, A.B.; Petersen, E.L.; Bourque, G. Methane/ethane/propane mixture oxidation at high pressures and at high, intermediate and low temperatures. Combust. Flame 2008, 155, 441–448. [Google Scholar] [CrossRef]
- Mehl, M.; Pitz, W.J.; Westbrook, C.K.; Curran, H.J. Kinetic modeling of gasoline surrogate components and mixtures under engine conditions. Proc. Combust. Inst. 2011, 33, 193–200. [Google Scholar] [CrossRef] [Green Version]
- Cai, L.; Pitsch, H. Optimized chemical mechanism for combustion of gasoline surrogate fuels. Combust. Flame 2015, 162, 1623–1637. [Google Scholar] [CrossRef] [Green Version]
- Curran, H.J.; Gaffuri, P.; Pitz, W.J.; Westbrook, C.K. A comprehensive modeling study of iso-octane oxidation. Combust. Flame 2002, 129, 253–280. [Google Scholar] [CrossRef]
- Narayanaswamy, K.; Blanquart, G.; Pitsch, H. A consistent chemical mechanism for oxidation of substituted aromatic species. Combust. Flame 2010, 157, 1879–1898. [Google Scholar] [CrossRef]
- Li, J.; Kazakov, A.; Dryer, F.L. Experimental and numerical studies of ethanol decomposition reactions. J. Phys. Chem. A 2004, 108, 7671–7680. [Google Scholar] [CrossRef]
- Lamoureux, N.; Desgroux, P.; El Bakali, A.; Pauwels, J.F. Experimental and numerical study of the role of NCN in prompt-NO formation in low-pressure CH4-O2-N2 and C2H2-O2-N2 flames. Combust. Flame 2010, 157, 1929–1941. [Google Scholar] [CrossRef]
- Zhang, K.; Banyon, C.; Bugler, J.; Curran, H.J.; Rodriguez, A.; Herbinet, O.; Battin-Leclerc, F.; B’Chir, C.; Heufer, K.A. An updated experimental and kinetic modeling study of n-heptane oxidation. Combust. Flame 2016, 172, 116–135. [Google Scholar] [CrossRef] [Green Version]
- Li, Y.; Zhou, C.-W.; Somers, K.P.; Zhang, K.; Curran, H.J. The oxidation of 2-butene: A high pressure ignition delay, kinetic modeling study and reactivity comparison with isobutene and 1-butene. Proc. Combust. Inst. 2017, 36, 403–411. [Google Scholar] [CrossRef] [Green Version]
- Bugler, J.; Somers, K.P.; Silke, E.J.; Curran, H.J. Revisiting the Kinetics and Thermodynamics of the Low-Temperature Oxidation Pathways of Alkanes: A Case Study of the Three Pentane Isomers. J. Phys. Chem. A 2015, 119, 7510–7527. [Google Scholar] [CrossRef] [Green Version]
- Zhang, K.; Banyon, C.; Togbé, C.; Dagaut, P.; Bugler, J.; Curran, H.J. An experimental and kinetic modeling study of n-hexane oxidation. Combust. Flame 2015, 162, 4194–4207. [Google Scholar] [CrossRef]
- Bugler, J.; Marks, B.; Mathieu, O.; Archuleta, R.; Camou, A.; Grégoire, C.; Heufer, K.A.; Petersen, E.L.; Curran, H.J. An ignition delay time and chemical kinetic modeling study of the pentane isomers. Combust. Flame 2016, 163, 138–156. [Google Scholar] [CrossRef] [Green Version]
- Wang, H.; Yao, M.; Reitz, R.D. Development of a Reduced Primary Reference Fuel Mechanism for Internal Combustion Engine Combustion Simulations. Energy Fuels 2013, 27, 7843–7853. [Google Scholar] [CrossRef]
- Darcy, D.; Mehl, M.; Simmie, J.M.; Würmel, J.; Metcalfe, W.K.; Westbrook, C.K.; Pitz, W.J.; Curran, H.J. An experimental and modeling study of the shock tube ignition of a mixture of n-heptane and n-propylbenzene as a surrogate for a large alkyl benzene. Proc. Combust. Inst. 2013, 34, 411–418. [Google Scholar] [CrossRef]
- Metcalfe, W.K.; Burke, S.M.; Ahmed, S.S.; Curran, H.J. A Hierarchical and Comparative Kinetic Modeling Study of C1−C2 Hydrocarbon and Oxygenated Fuels. Int. J. Chem. Kinet. 2013, 45, 638–675. [Google Scholar] [CrossRef]
- Healy, D.; Kalitan, D.M.; Aul, C.J.; Petersen, E.L.; Bourque, G.; Curran, H.J. Oxidation of C1−C5 Alkane Quinternary Natural Gas Mixtures at High Pressures. Energy Fuels 2010, 24, 1521–1528. [Google Scholar] [CrossRef]
- Wang, H.; Yao, M.; Yue, Z.; Jia, M.; Reitz, R.D. A reduced toluene reference fuel chemical kinetic mechanism for combustion and polycyclic-aromatic hydrocarbon predictions. Combust. Flame 2015, 162, 2390–2404. [Google Scholar] [CrossRef]
- Sun, Y.; Reitz, R.D. Modeling Diesel Engine NOx and Soot Reduction with Optimized Two-Stage Combustion; SAE International in United States: Warrendale, PA, USA, 2006. [Google Scholar] [CrossRef]
- Zhou, C.-W.; Li, Y.; Burke, U.; Banyon, C.; Somers, K.P.; Ding, S.; Khan, S.; Hargis, J.W.; Sikes, T.; Mathieu, O.; et al. An experimental and chemical kinetic modeling study of 1,3-butadiene combustion: Ignition delay time and laminar flame speed measurements. Combust. Flame 2018, 197, 423–438. [Google Scholar] [CrossRef]
- LOGEsoft. Available online: http://www.logesoft.com (accessed on 16 May 2019).
- Tänzler, A.G. Experimentelle Untersuchung eines Dual-Fuel-Brennverfahrens für schwere Nutzfahrzeugmotoren; Springer Fachmedien: Wiesbaden, Germany, 2017. [Google Scholar] [CrossRef]
- Pachler, R.F.; Ramalingam, A.K.; Heufer, K.A.; Winter, F. Reduction and validation of a chemical kinetic mechanism including necessity analysis and investigation of CH4/C3H8 oxidation at pressures up to 120 bar using a rapid compression machine. Fuel 2016, 172, 139–145. [Google Scholar] [CrossRef]
- Burke, U.; Beeckmann, J.; Kopp, W.A.; Uygun, Y.; Olivier, H.; Leonhard, K.; Pitsch, H.; Heufer, K.A. A comprehensive experimental and kinetic modeling study of butanone. Combust. Flame 2016, 168, 296–309. [Google Scholar] [CrossRef]
- Lee, C.; Vranckx, S.; Heufer, K.A.; Khomik, S.V.; Uygun, Y.; Olivier, H.; Fernandez, R.X. On the Chemical Kinetics of Ethanol Oxidation: Shock Tube, Rapid Compression Machine and Detailed Modeling Study. Z. Für Phys. Chem. 2012, 226, 1–28. [Google Scholar] [CrossRef]
- Ramalingam, A.; Zhang, K.; Dhongde, A.; Virnich, L.; Sankhla, H.; Curran, H.; Heufer, K.A. An RCM experimental and modeling study on CH4 and CH4/C2H6 oxidation at pressures up to 160 bar. Fuel 2017, 206, 325–333. [Google Scholar] [CrossRef] [Green Version]
- Morley, C. Gaseq—A Chemical Equilibrium Program for Windows. Available online: http://www.gaseq.co.uk/ (accessed on 29 September 2017).
- Shock & Detonation Toolbox—Cantera 2.1. Available online: http://shepherd.caltech.edu/EDL/public/cantera/html/SD_Toolbox/ (accessed on 29 September 2017).
- Goodwin, D.G.; Moffat, H.K.; Speth, R.L. Cantera: An Object-Oriented Software Toolkit for Chemical Kinetics, Thermodynamics, and Transport Processes; Version 2.2. 1; Cantera Developers: Warrenville, IL, USA, 2016. [Google Scholar]
- Minwegen, H.; Burke, U.; Heufer, K.A. An experimental and theoretical comparison of C3–C5 linear ketones. Proc. Combust. Inst. 2017, 36, 561–568. [Google Scholar] [CrossRef]
- Burke, S.M.; Burke, U.; Mc Donagh, R.; Mathieu, O.; Osorio, I.; Keesee, C.; Morones, A.; Petersen, E.L.; Wang, W.; DeVerter, T.A.; et al. An experimental and modeling study of propene oxidation. Part 2: Ignition delay time and flame speed measurements. Combust. Flame 2015, 162, 296–314. [Google Scholar] [CrossRef] [Green Version]
- Sung, C.-J.; Curran, H.J. Using rapid compression machines for chemical kinetics studies. Prog. Energy Combust. Sci. 2014, 44, 1–18. [Google Scholar] [CrossRef]
- Petersen, E.L.; Hanson, R.K. Nonideal effects behind reflected shock waves in a high-pressure shock tube. Shock Waves 2001, 10, 405–420. [Google Scholar] [CrossRef] [Green Version]
- Heufer, K.A.; Olivier, H. Determination of ignition delay times of different hydrocarbons in a new high pressure shock tube. Shock Waves 2010, 20, 307–316. [Google Scholar] [CrossRef]
- Schuh, S.; Winter, F. Comparing the Influence of Propane and n-Heptane Addition on Methane Ignition. In Proceedings of the 8th European Combustion Meeting, Dubrovnik, Croatia, 18–21 April 2017. [Google Scholar]
- Cord, M.; Husson, B.; Lizardo Huerta, J.C.; Herbinet, O.; Glaude, P.A.; Fournet, R.; Sirjean, B.; Battin-Leclerc, F.; Ruiz-Lopez, M.; Wang, Z.; et al. Study of the low temperature oxidation of propane. J. Phys. Chem. A 2012, 116, 12214–12228. [Google Scholar] [CrossRef]
- Petersen, E.L.; Kalitan, D.M.; Simmons, S.; Bourque, G.; Curran, H.J.; Simmie, J.M. Methane/propane oxidation at high pressures: Experimental and detailed chemical kinetic modeling. Proc. Combust. Inst. 2007, 31, 447–454. [Google Scholar] [CrossRef]
- Cai, L.; Ramalingam, A.; Minwegen, H.; Heufer, K.A.; Pitsch, H. Impact of exhaust gas recirculation on ignition delay times of gasoline fuel: An experimental and modeling study. Proc. Combust. Inst. 2019, 37, 639–647. [Google Scholar] [CrossRef]
- Schiffner, M.; Jud, M.; Sattelmayer, T. Reaction Kinetics Analysis of Dual Fuel Internal Combustion Engines Based on Ignition Delay Times Using n-Heptane/Methane Fuel Blends. In Proceedings of the 8th European Combustion Meeting, Dubrovnik, Croatia, 18–21 April 2017. [Google Scholar]
- Steen, H. Handbuch des Explosionsschutzes; Wiley-VCH: Weinheim, Germany, 2000. [Google Scholar]


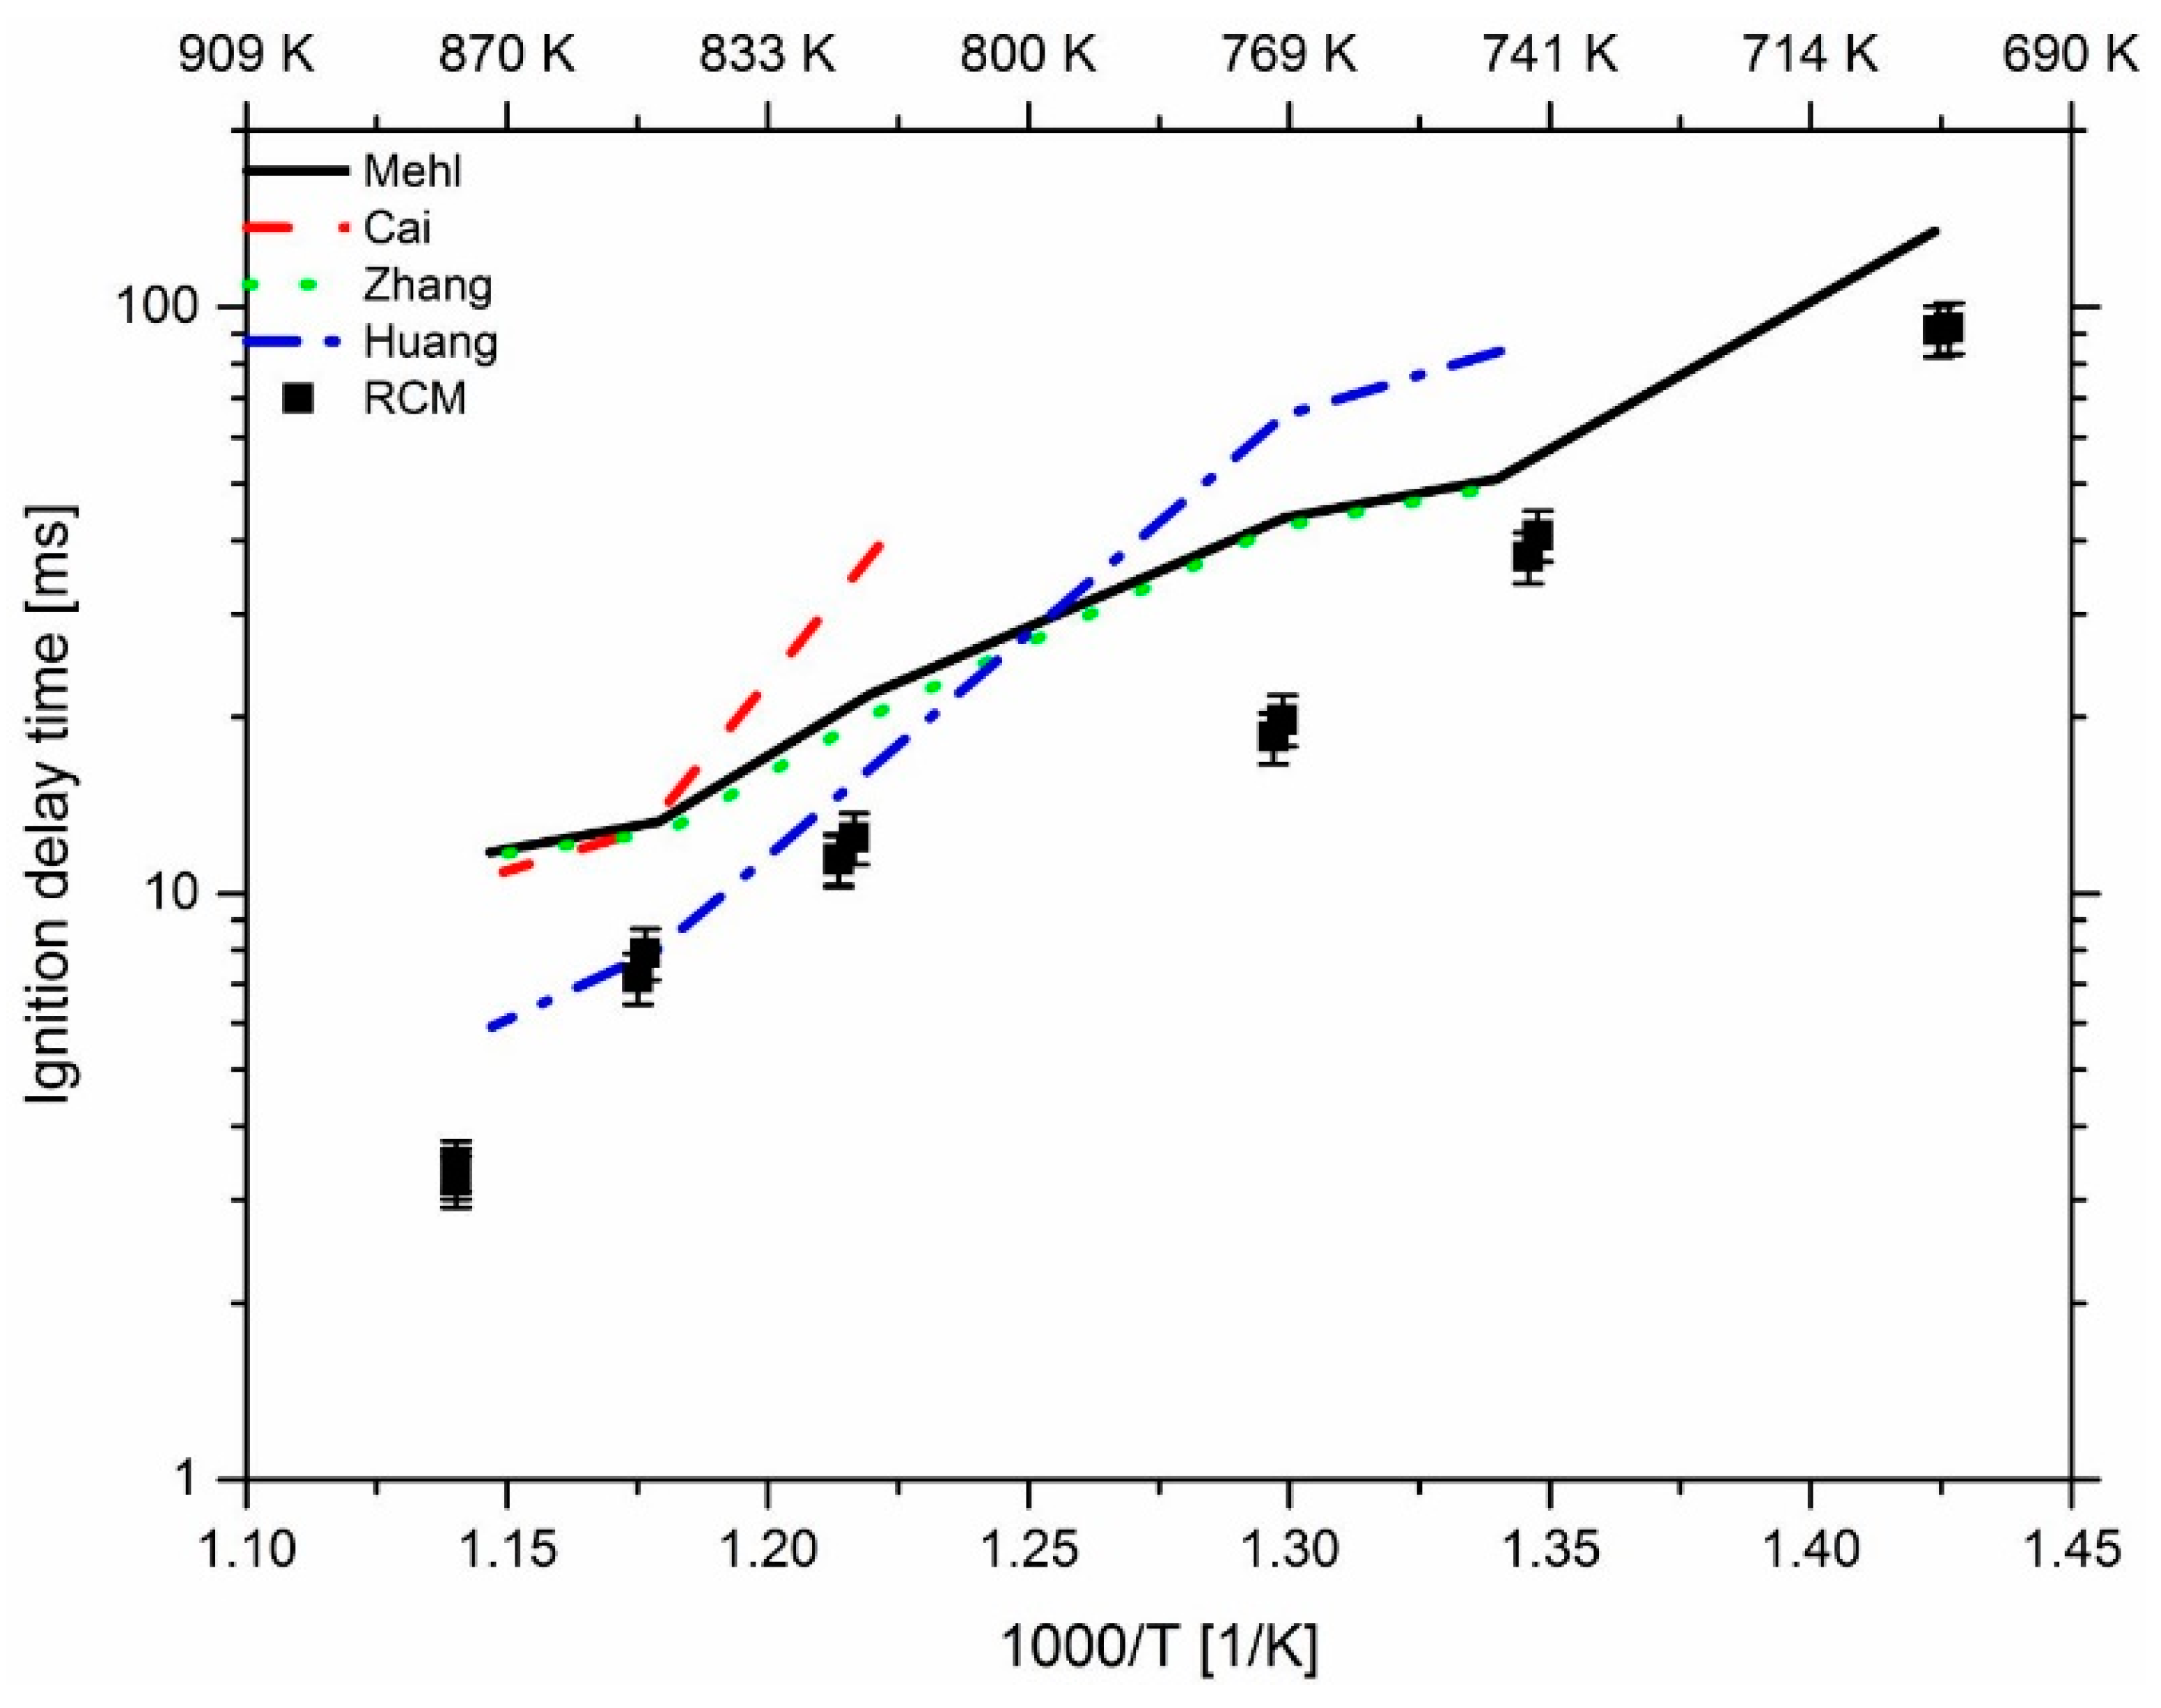
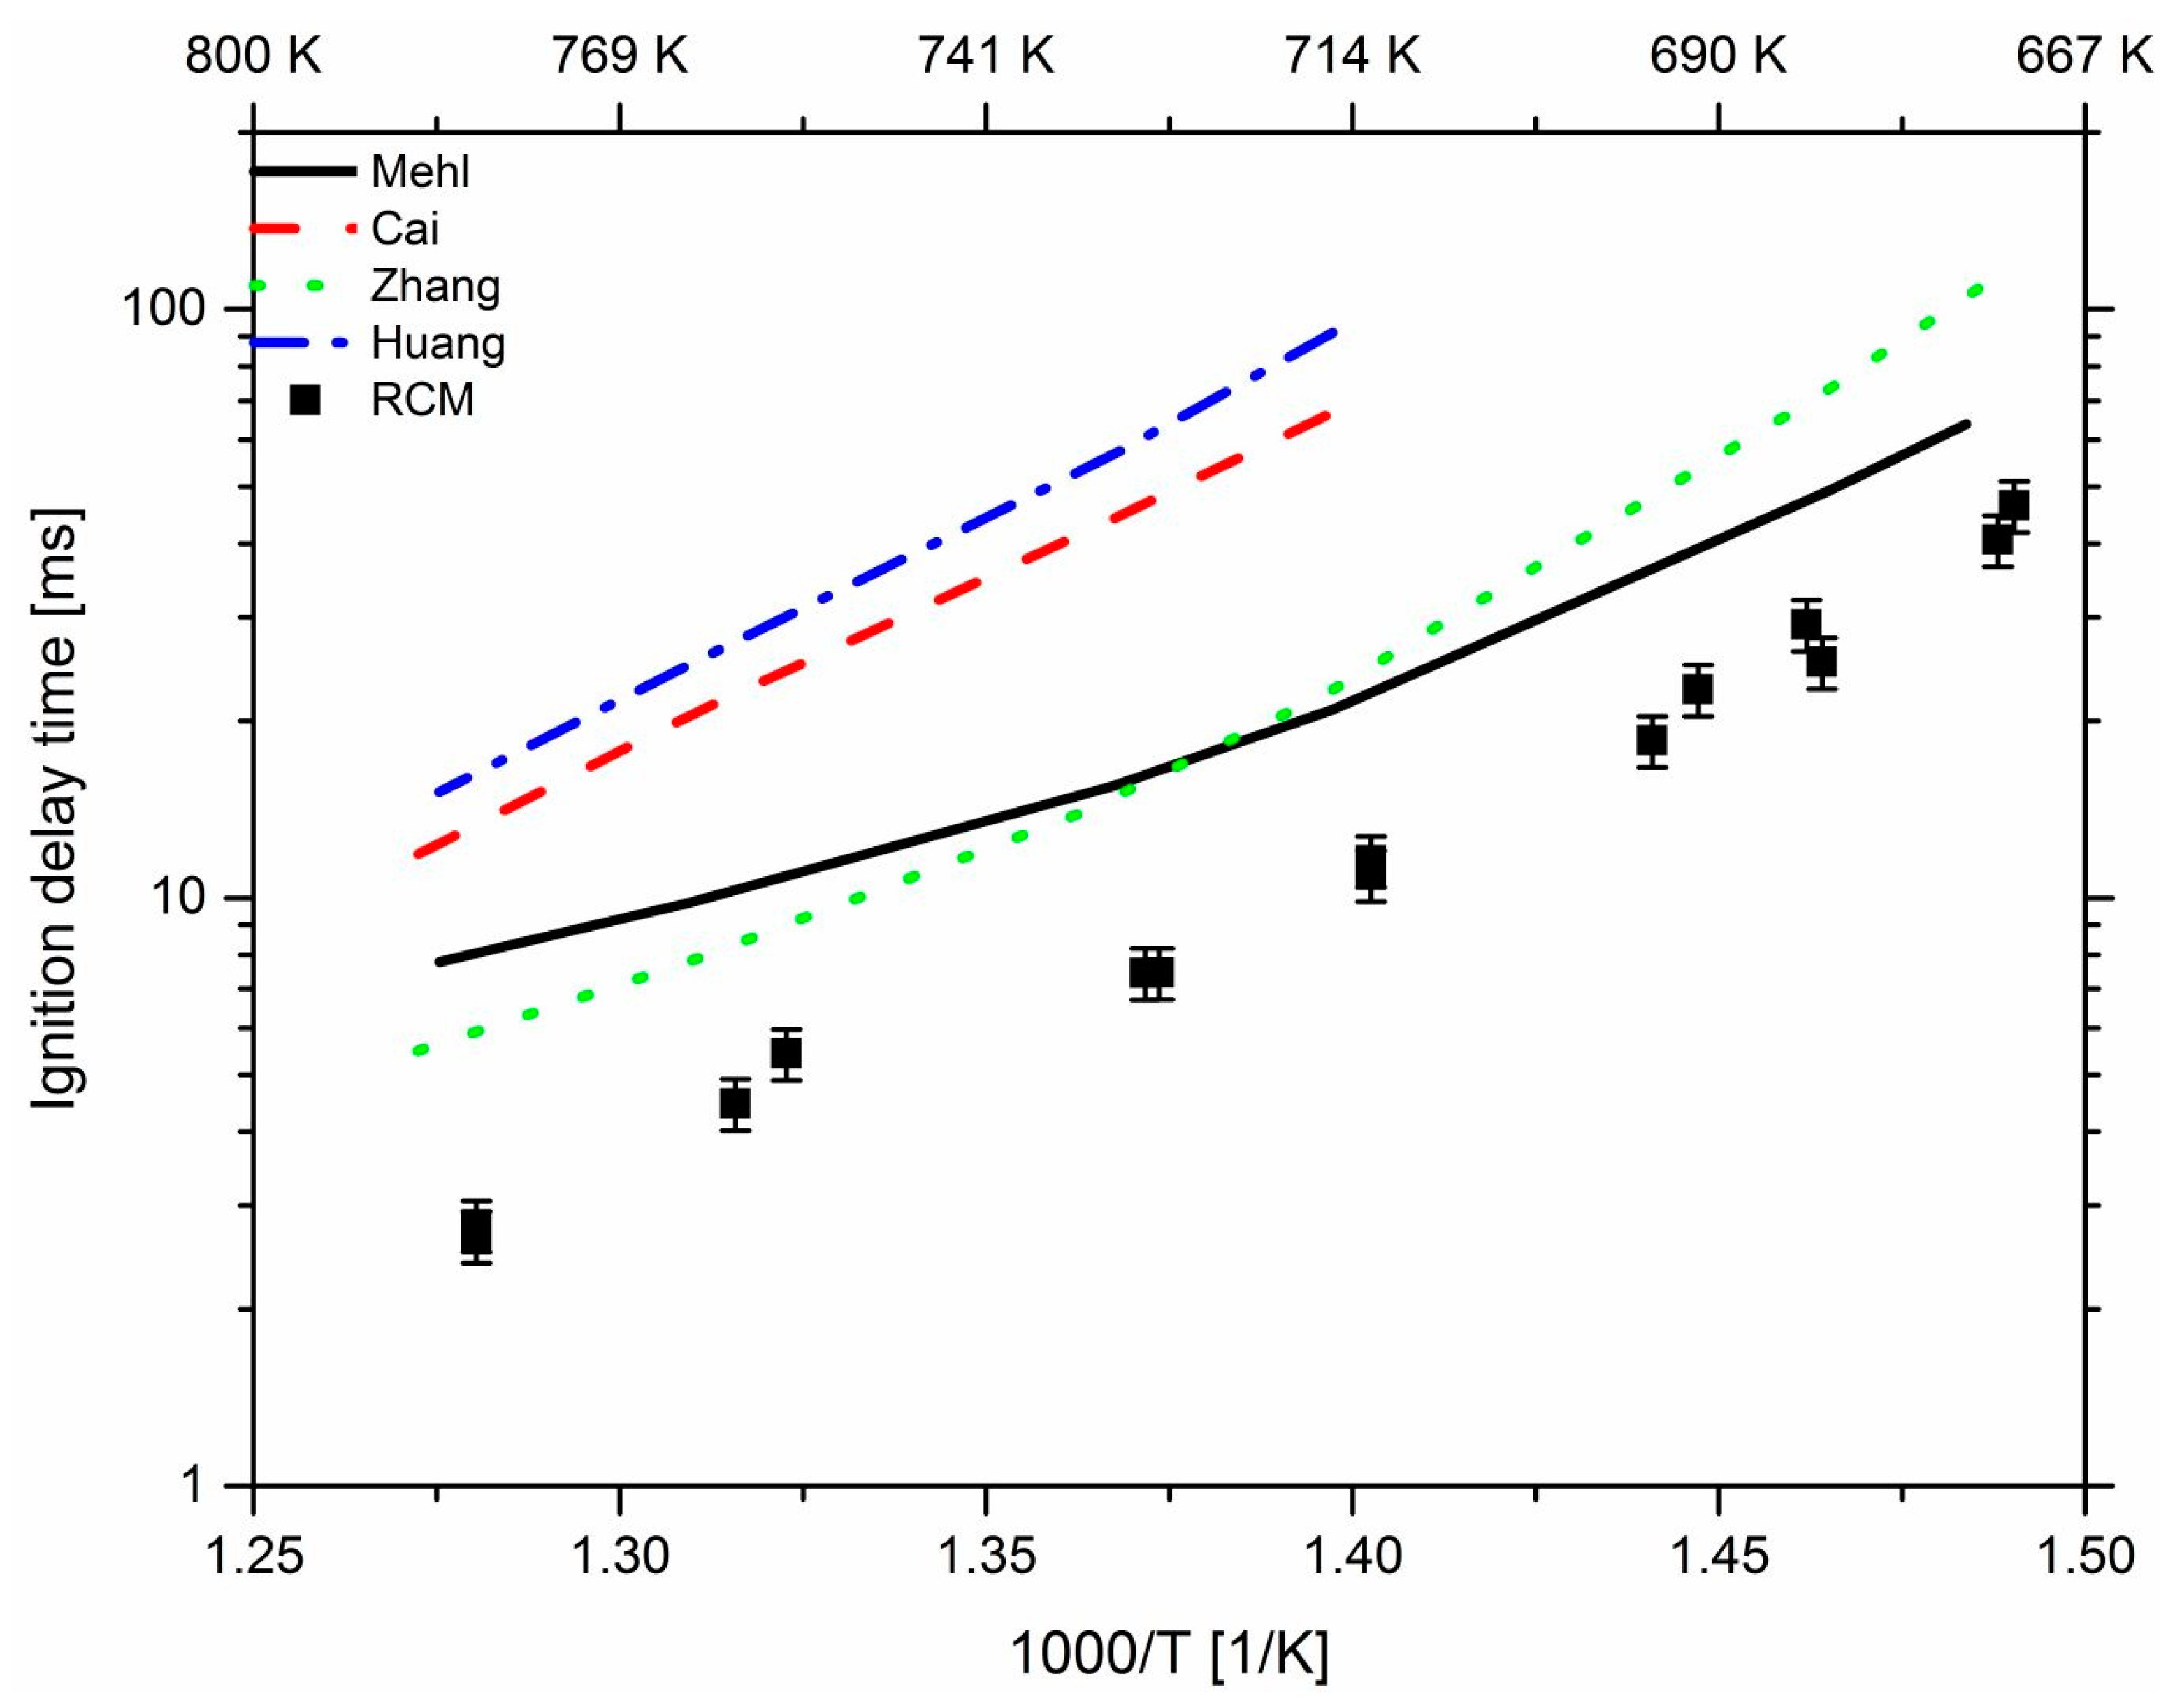
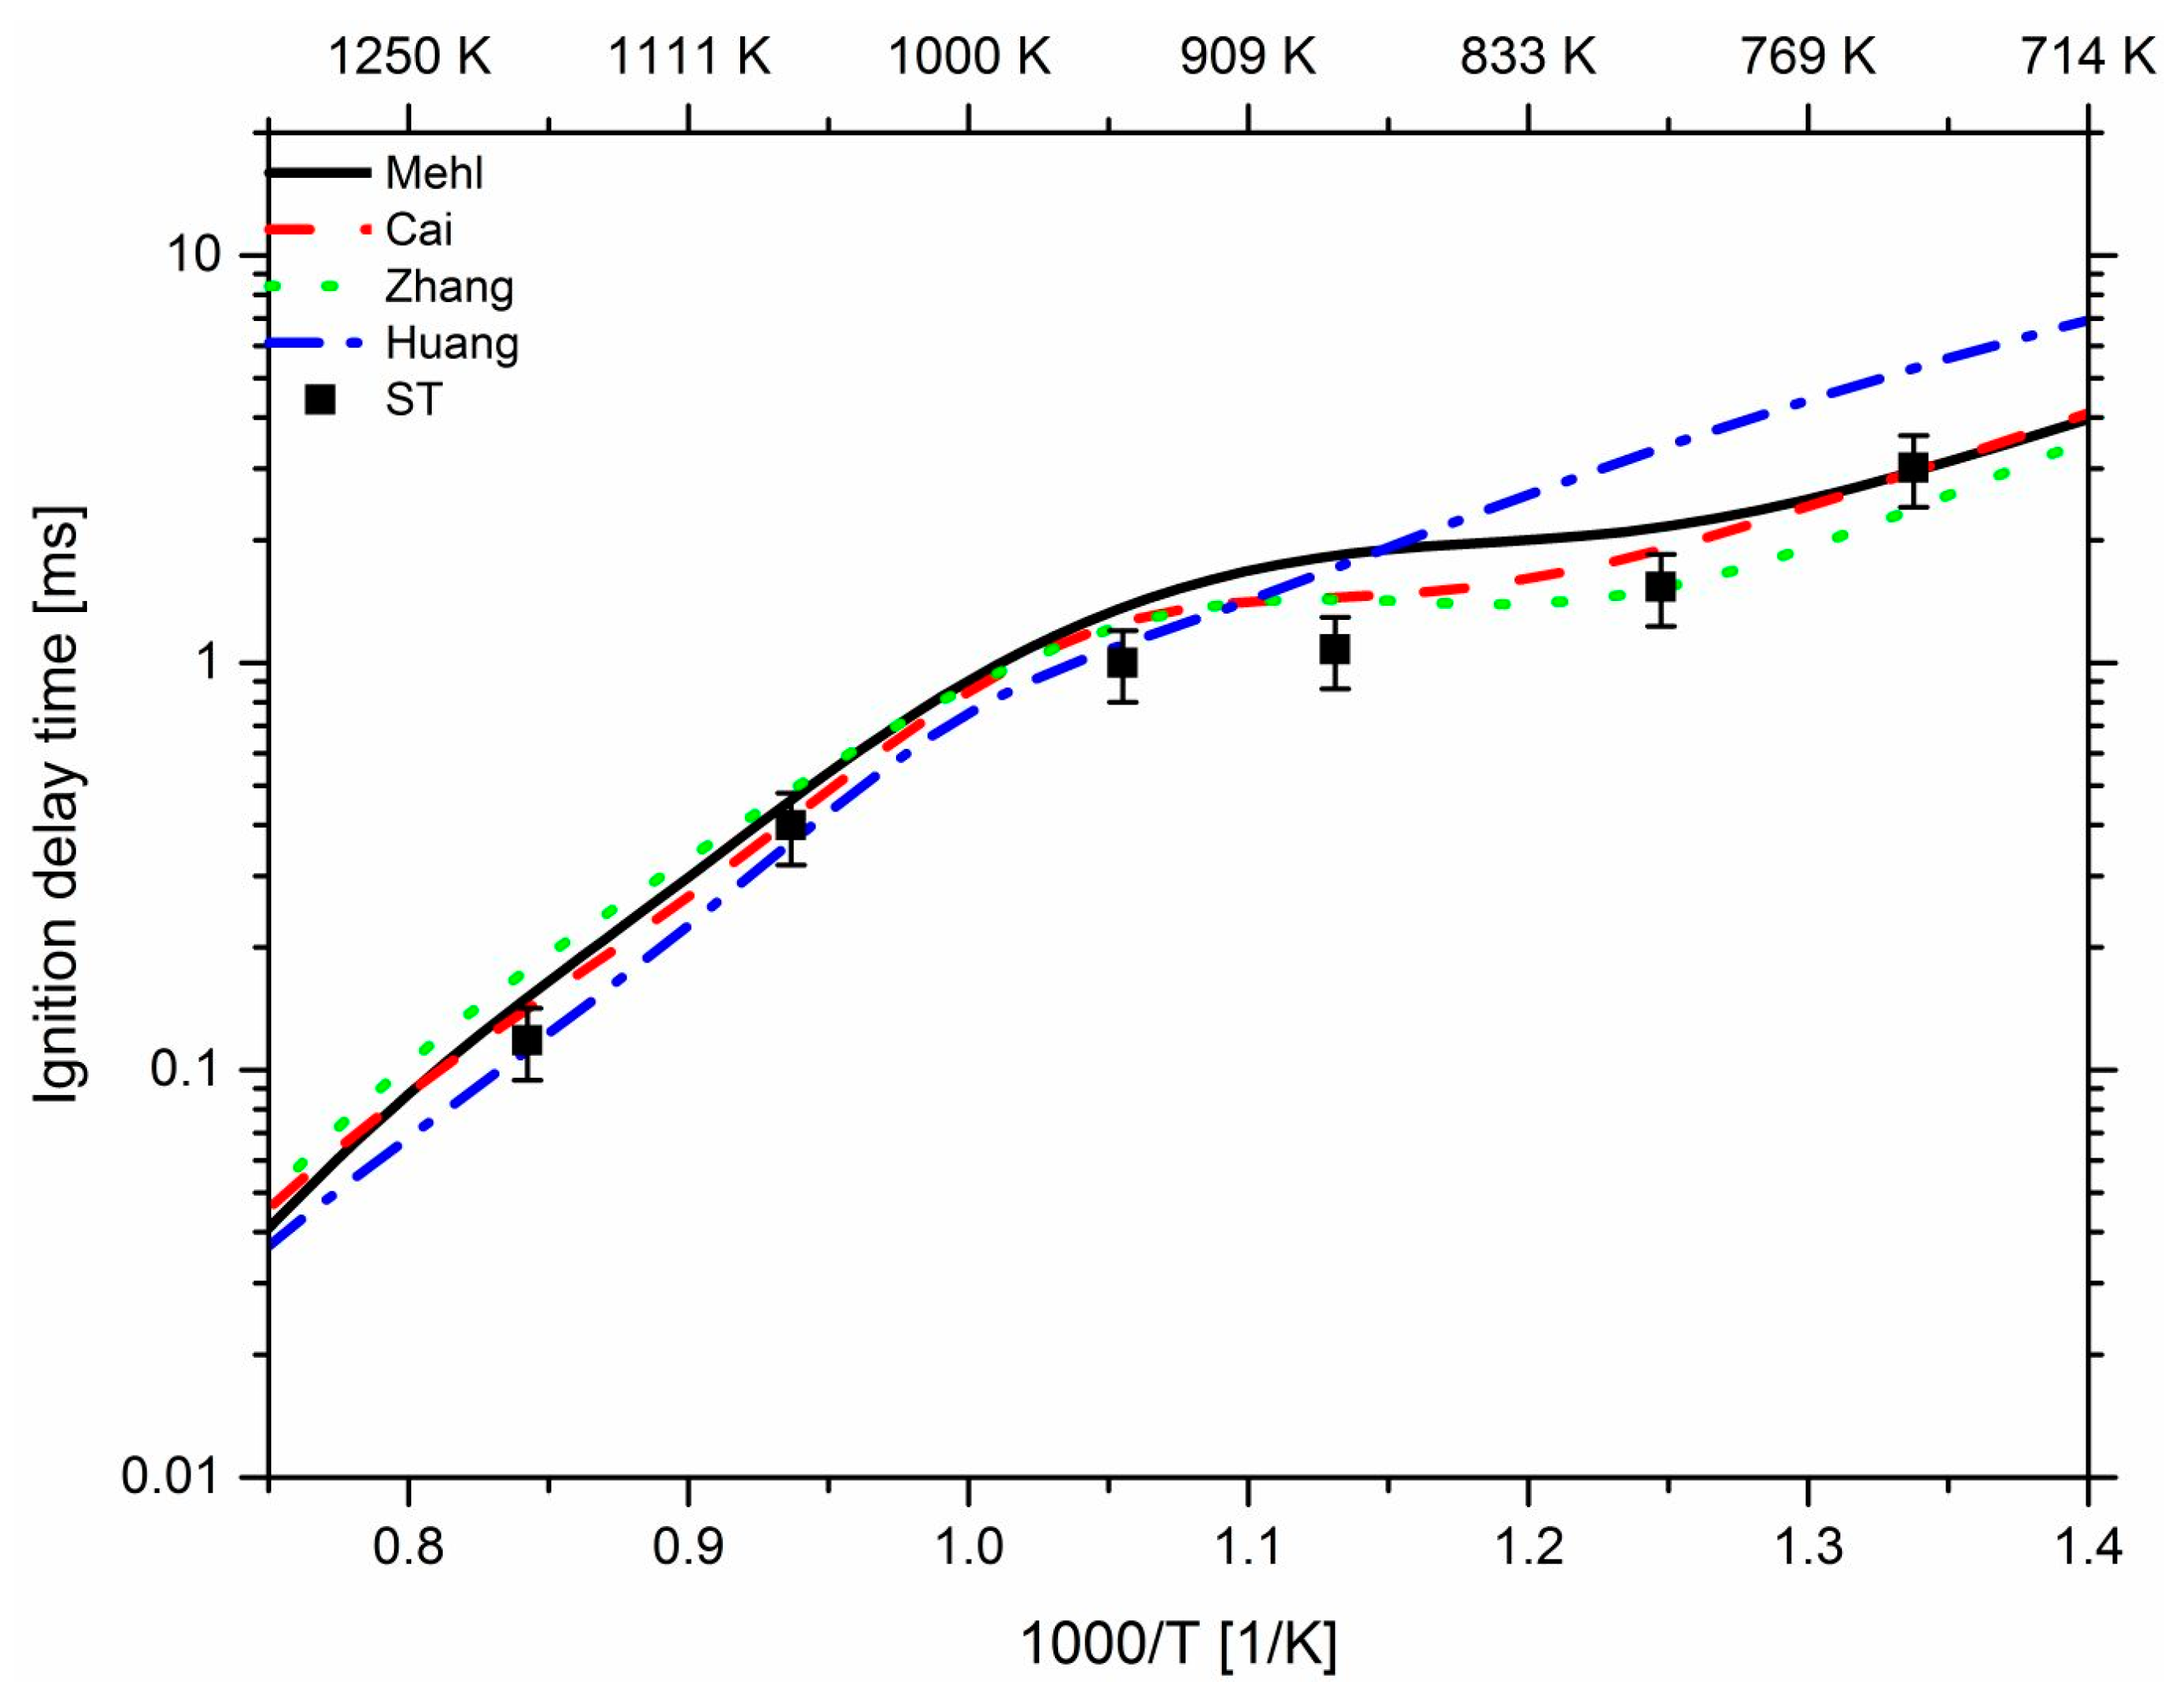
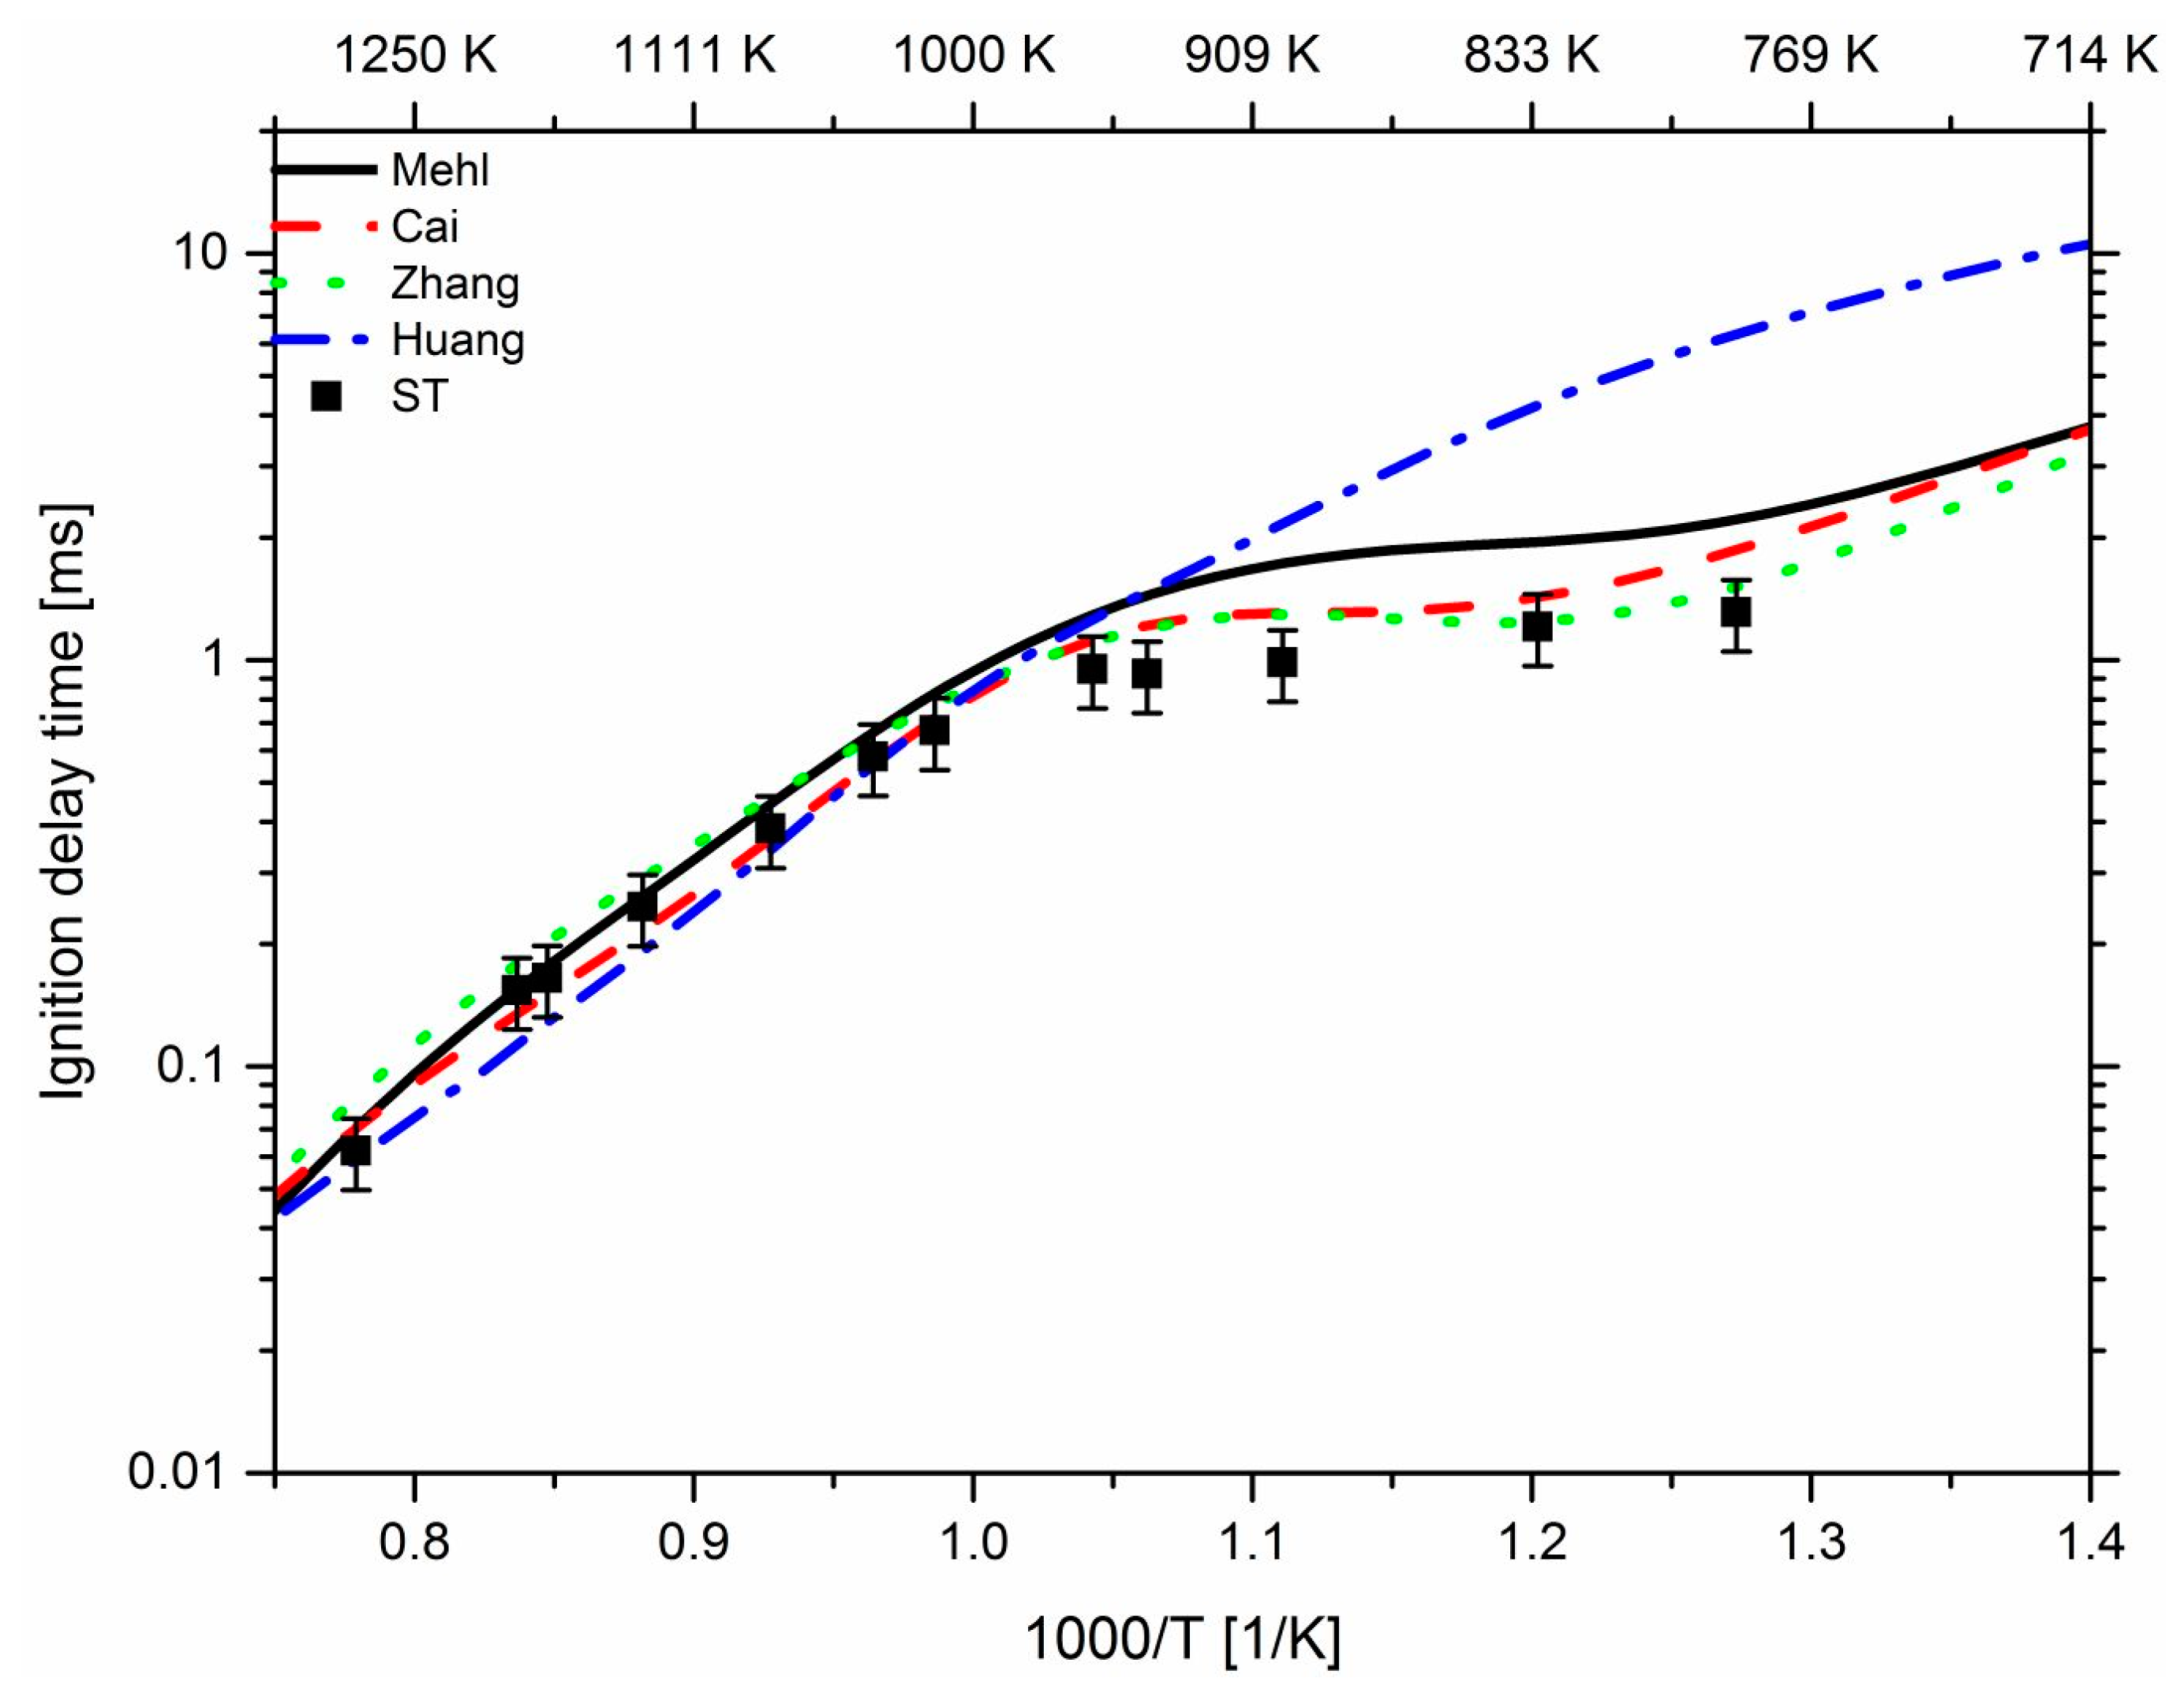
| Test Facility | Test Series | Fuel Composition | Pressure | Temperature | Reference | ||
|---|---|---|---|---|---|---|---|
| CH4 (mol %) | C3H8 (mol %) | xn-C7H16 Defined by (1) | (bar) | (K) | |||
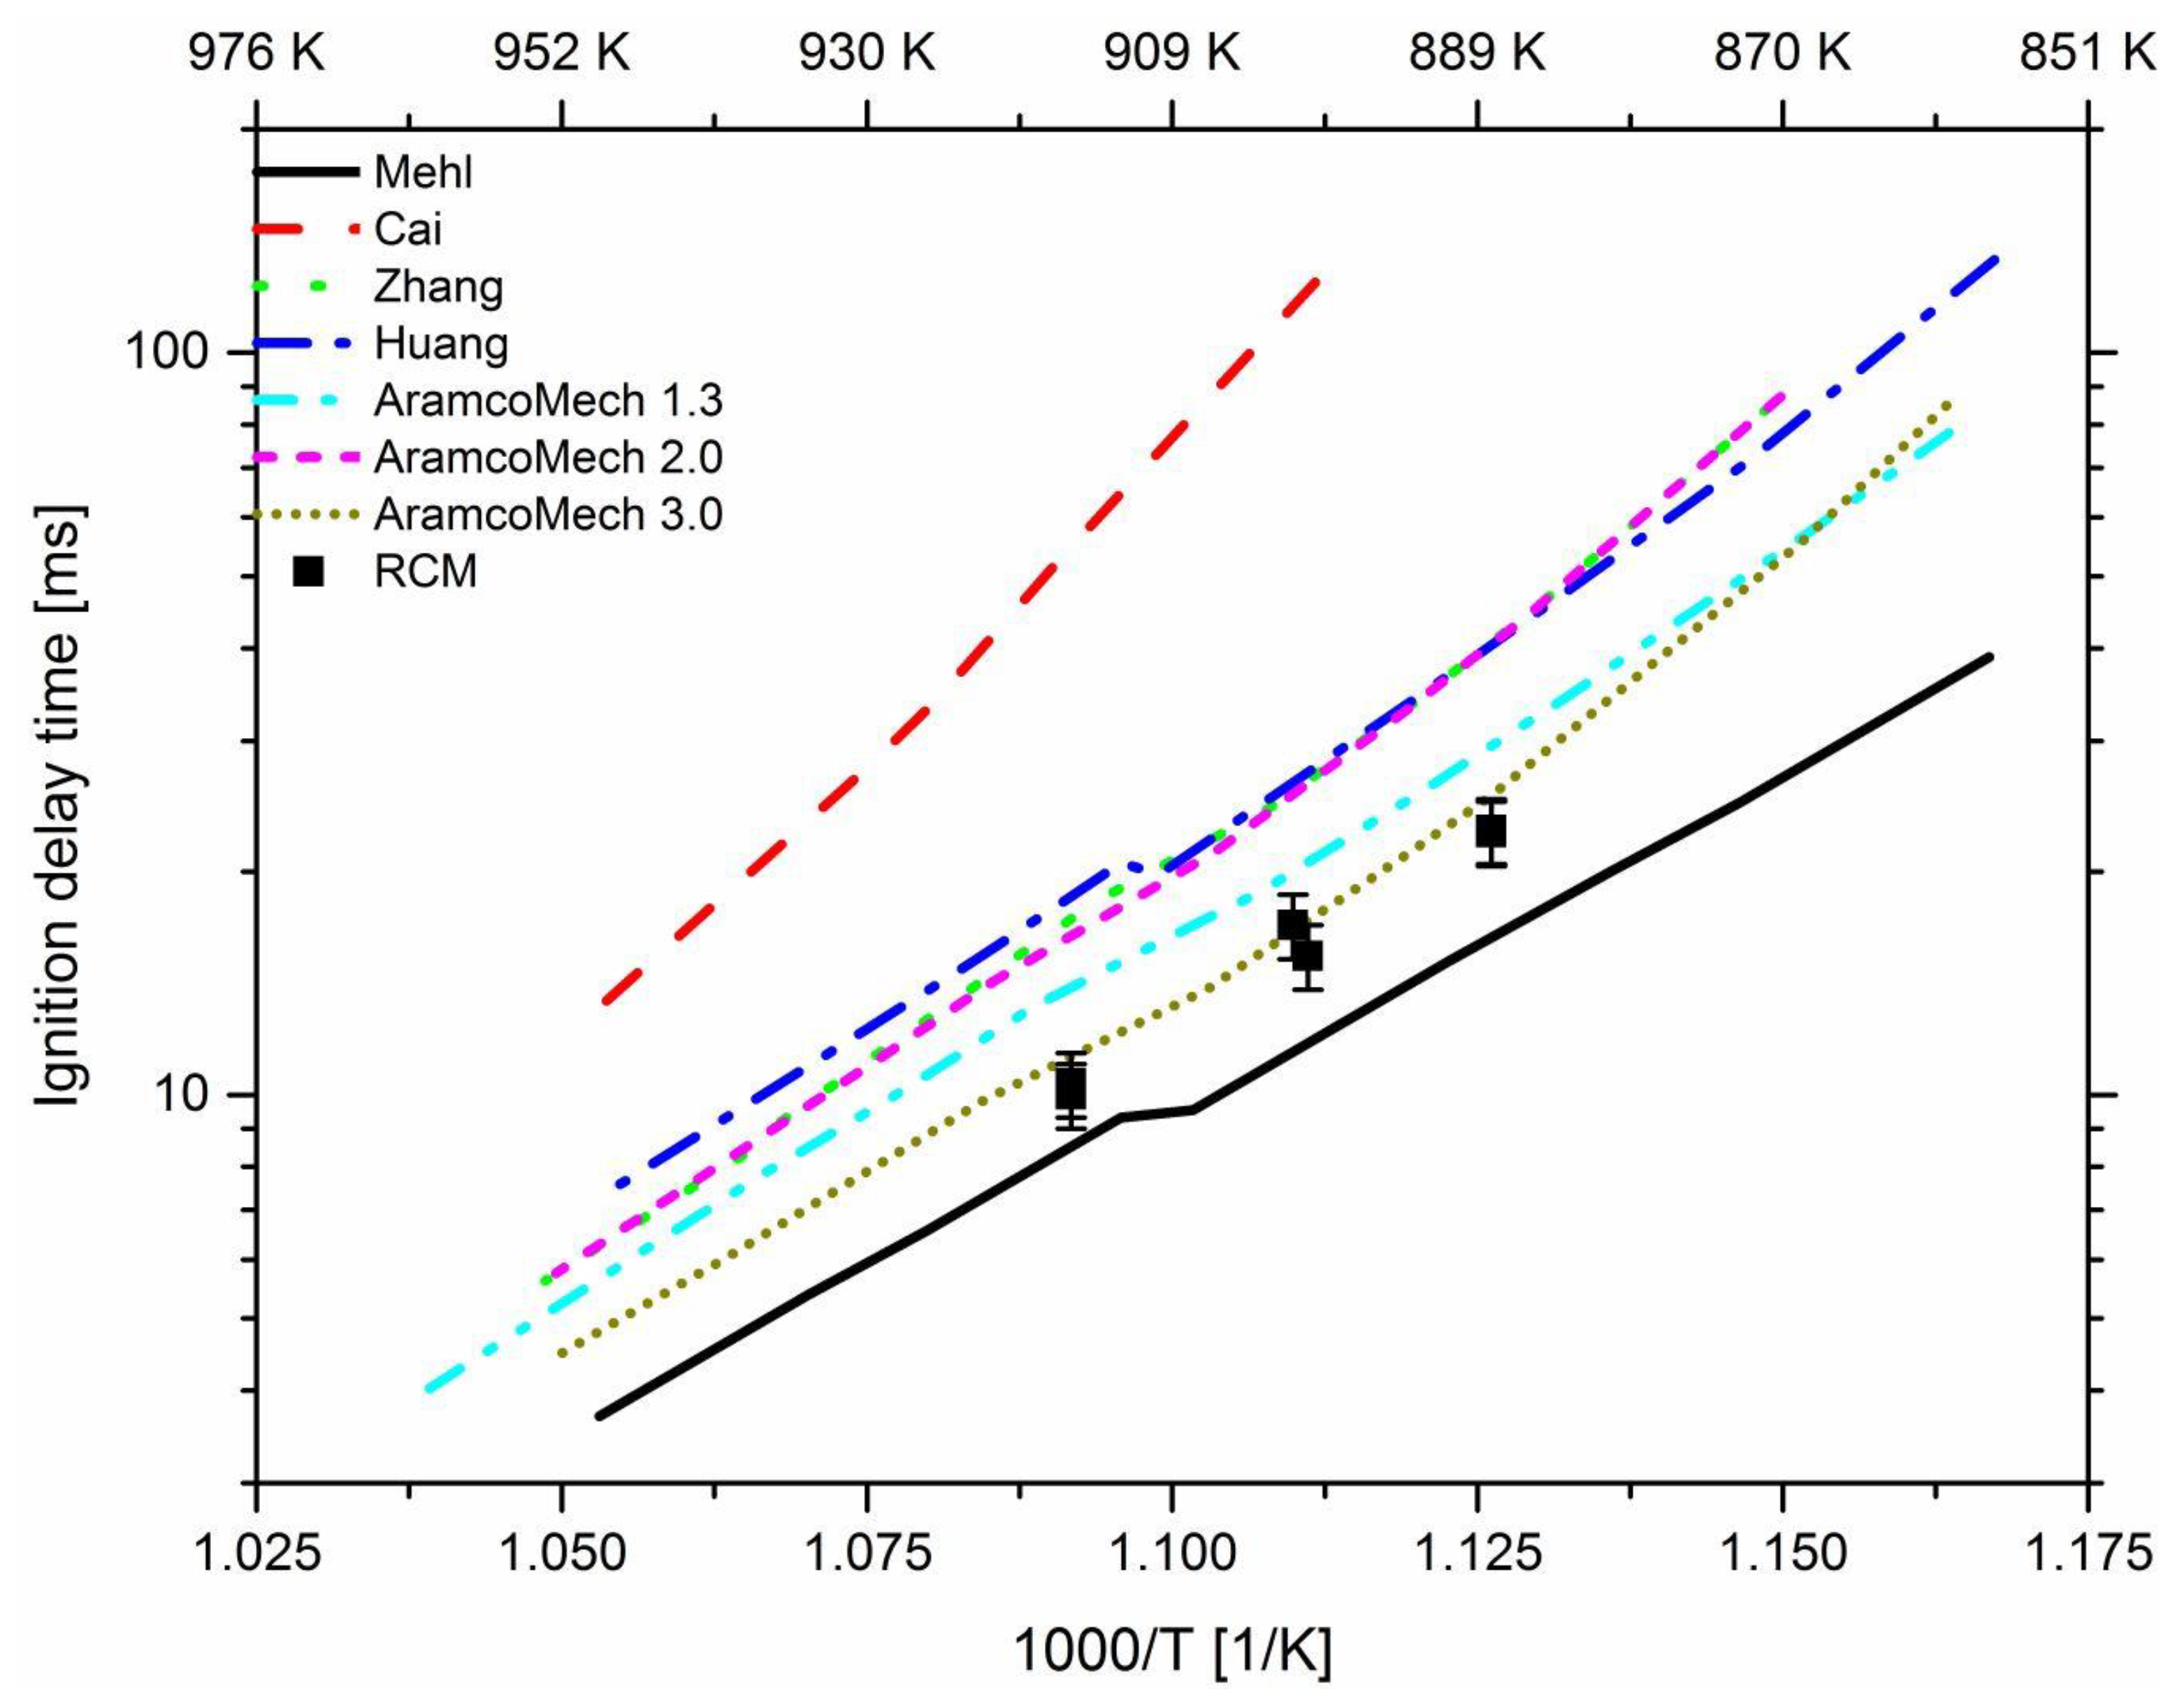
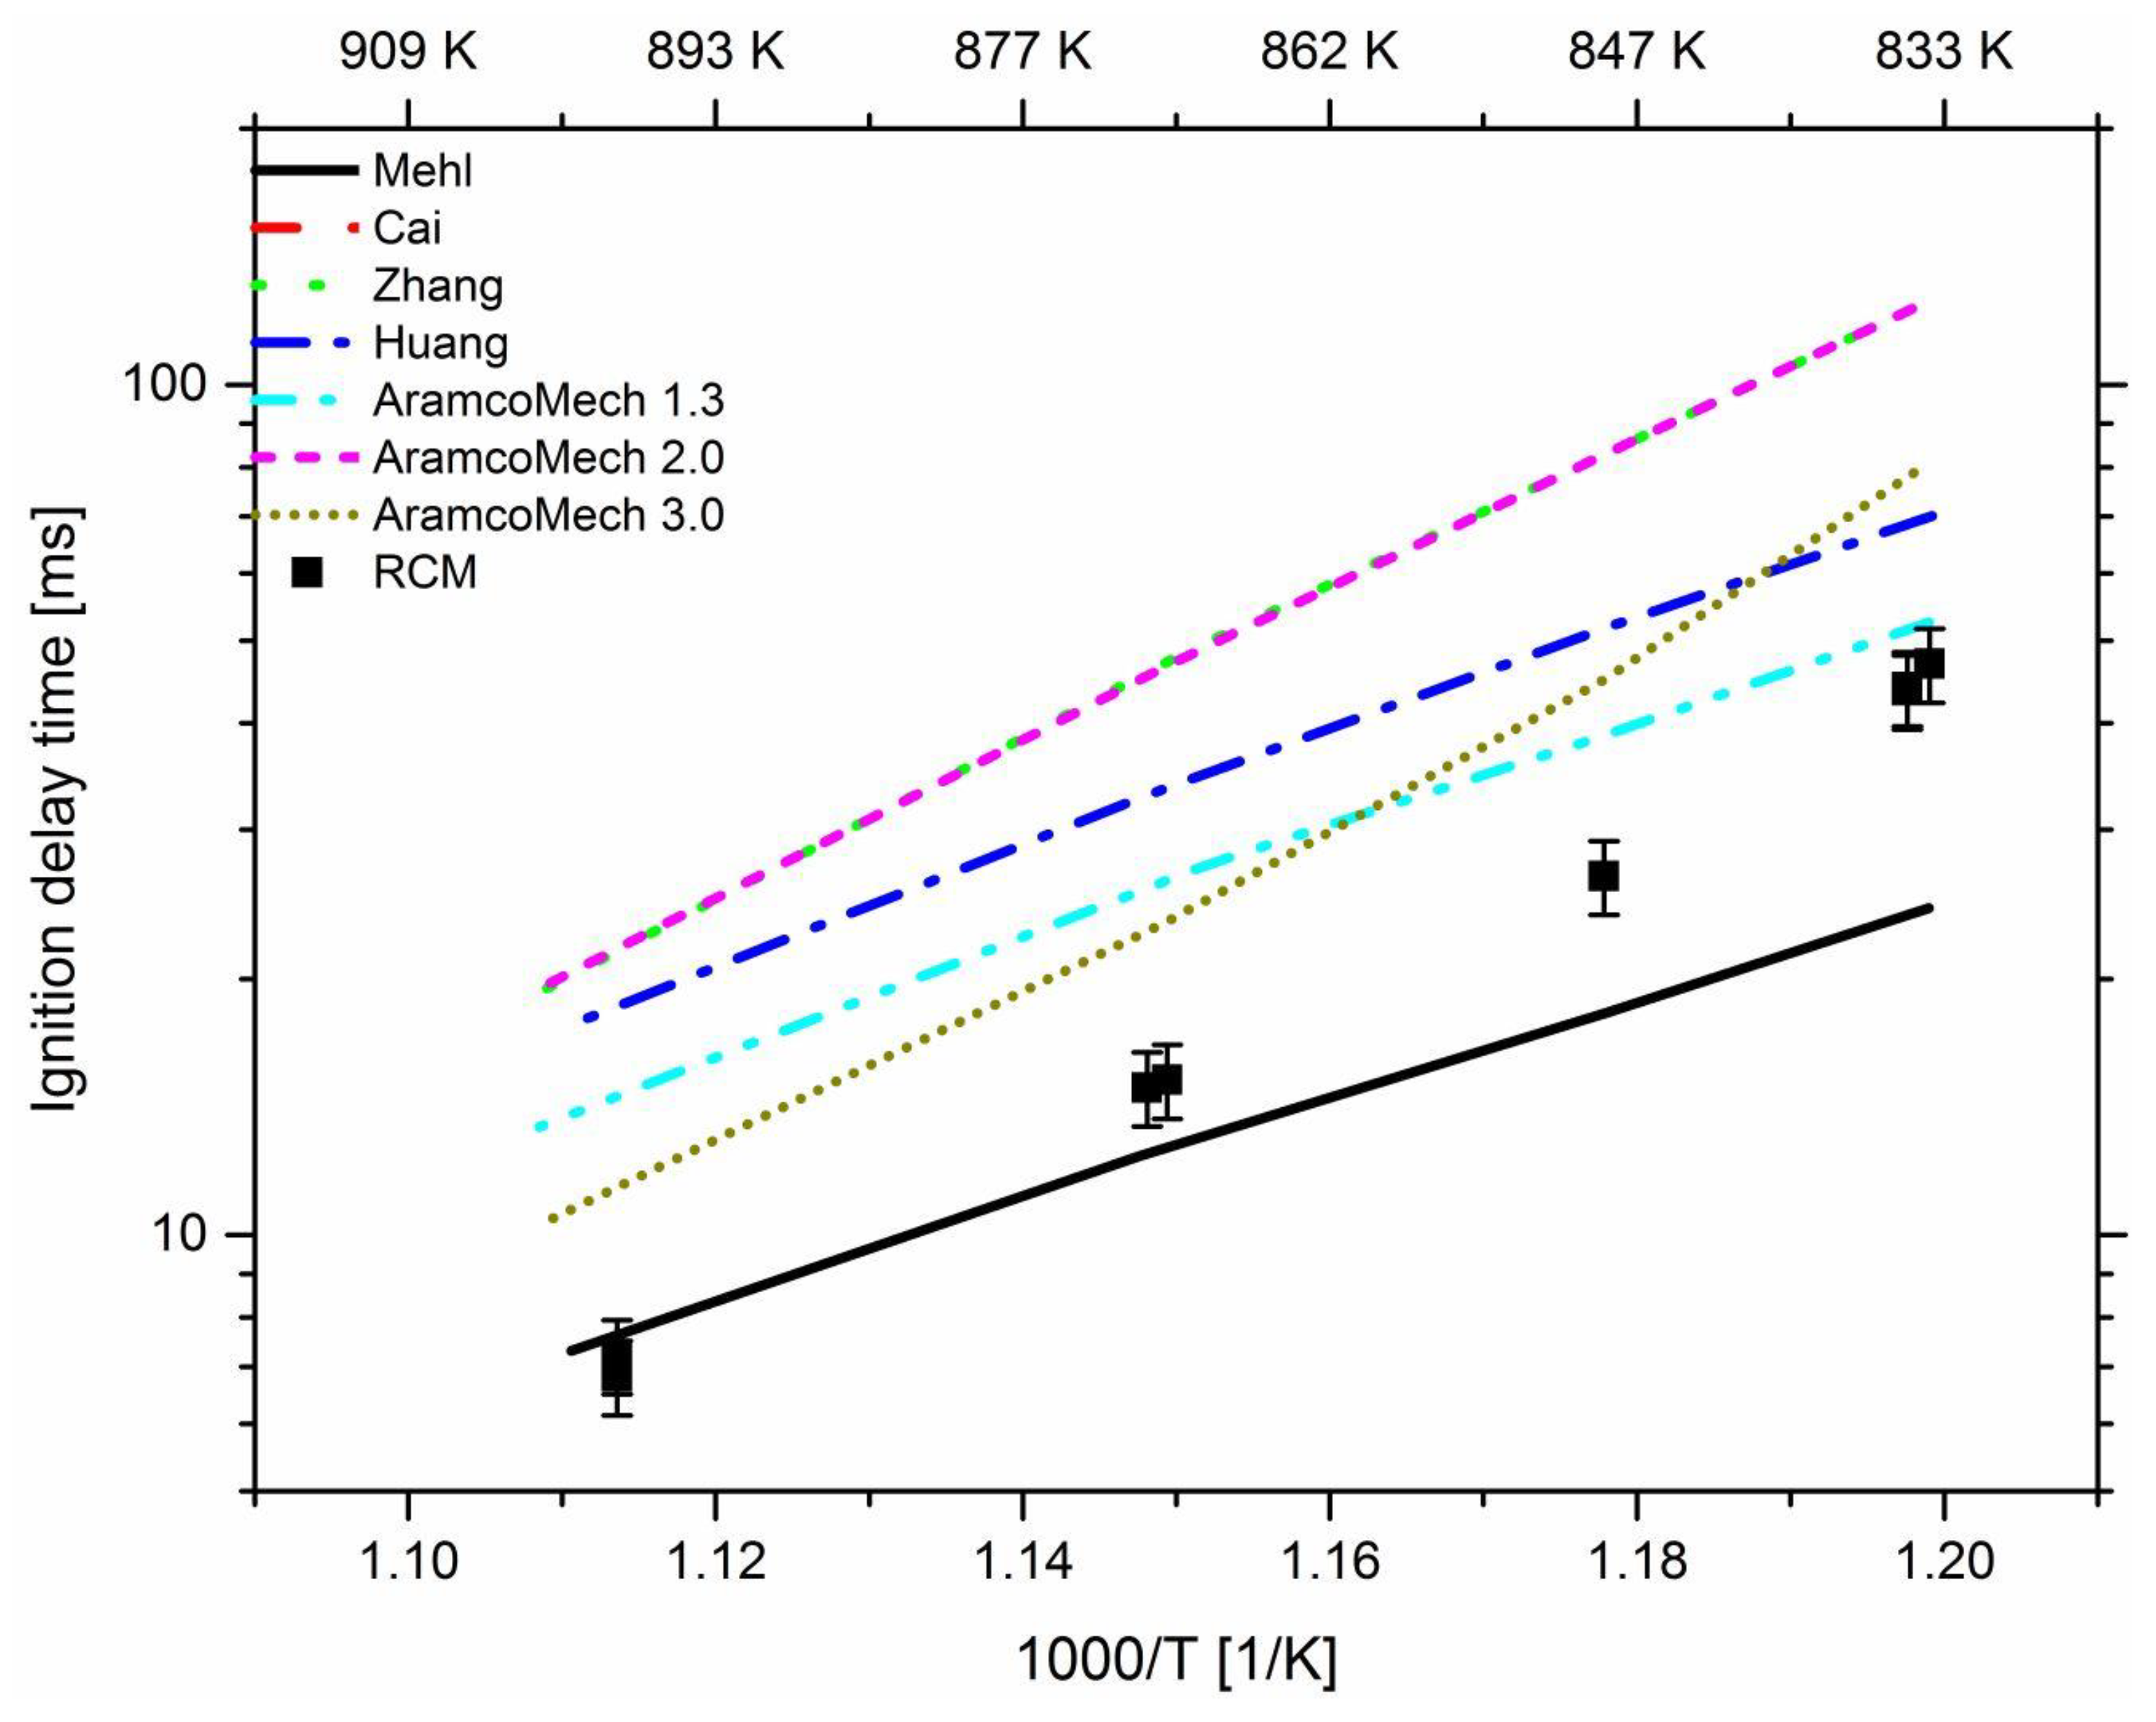
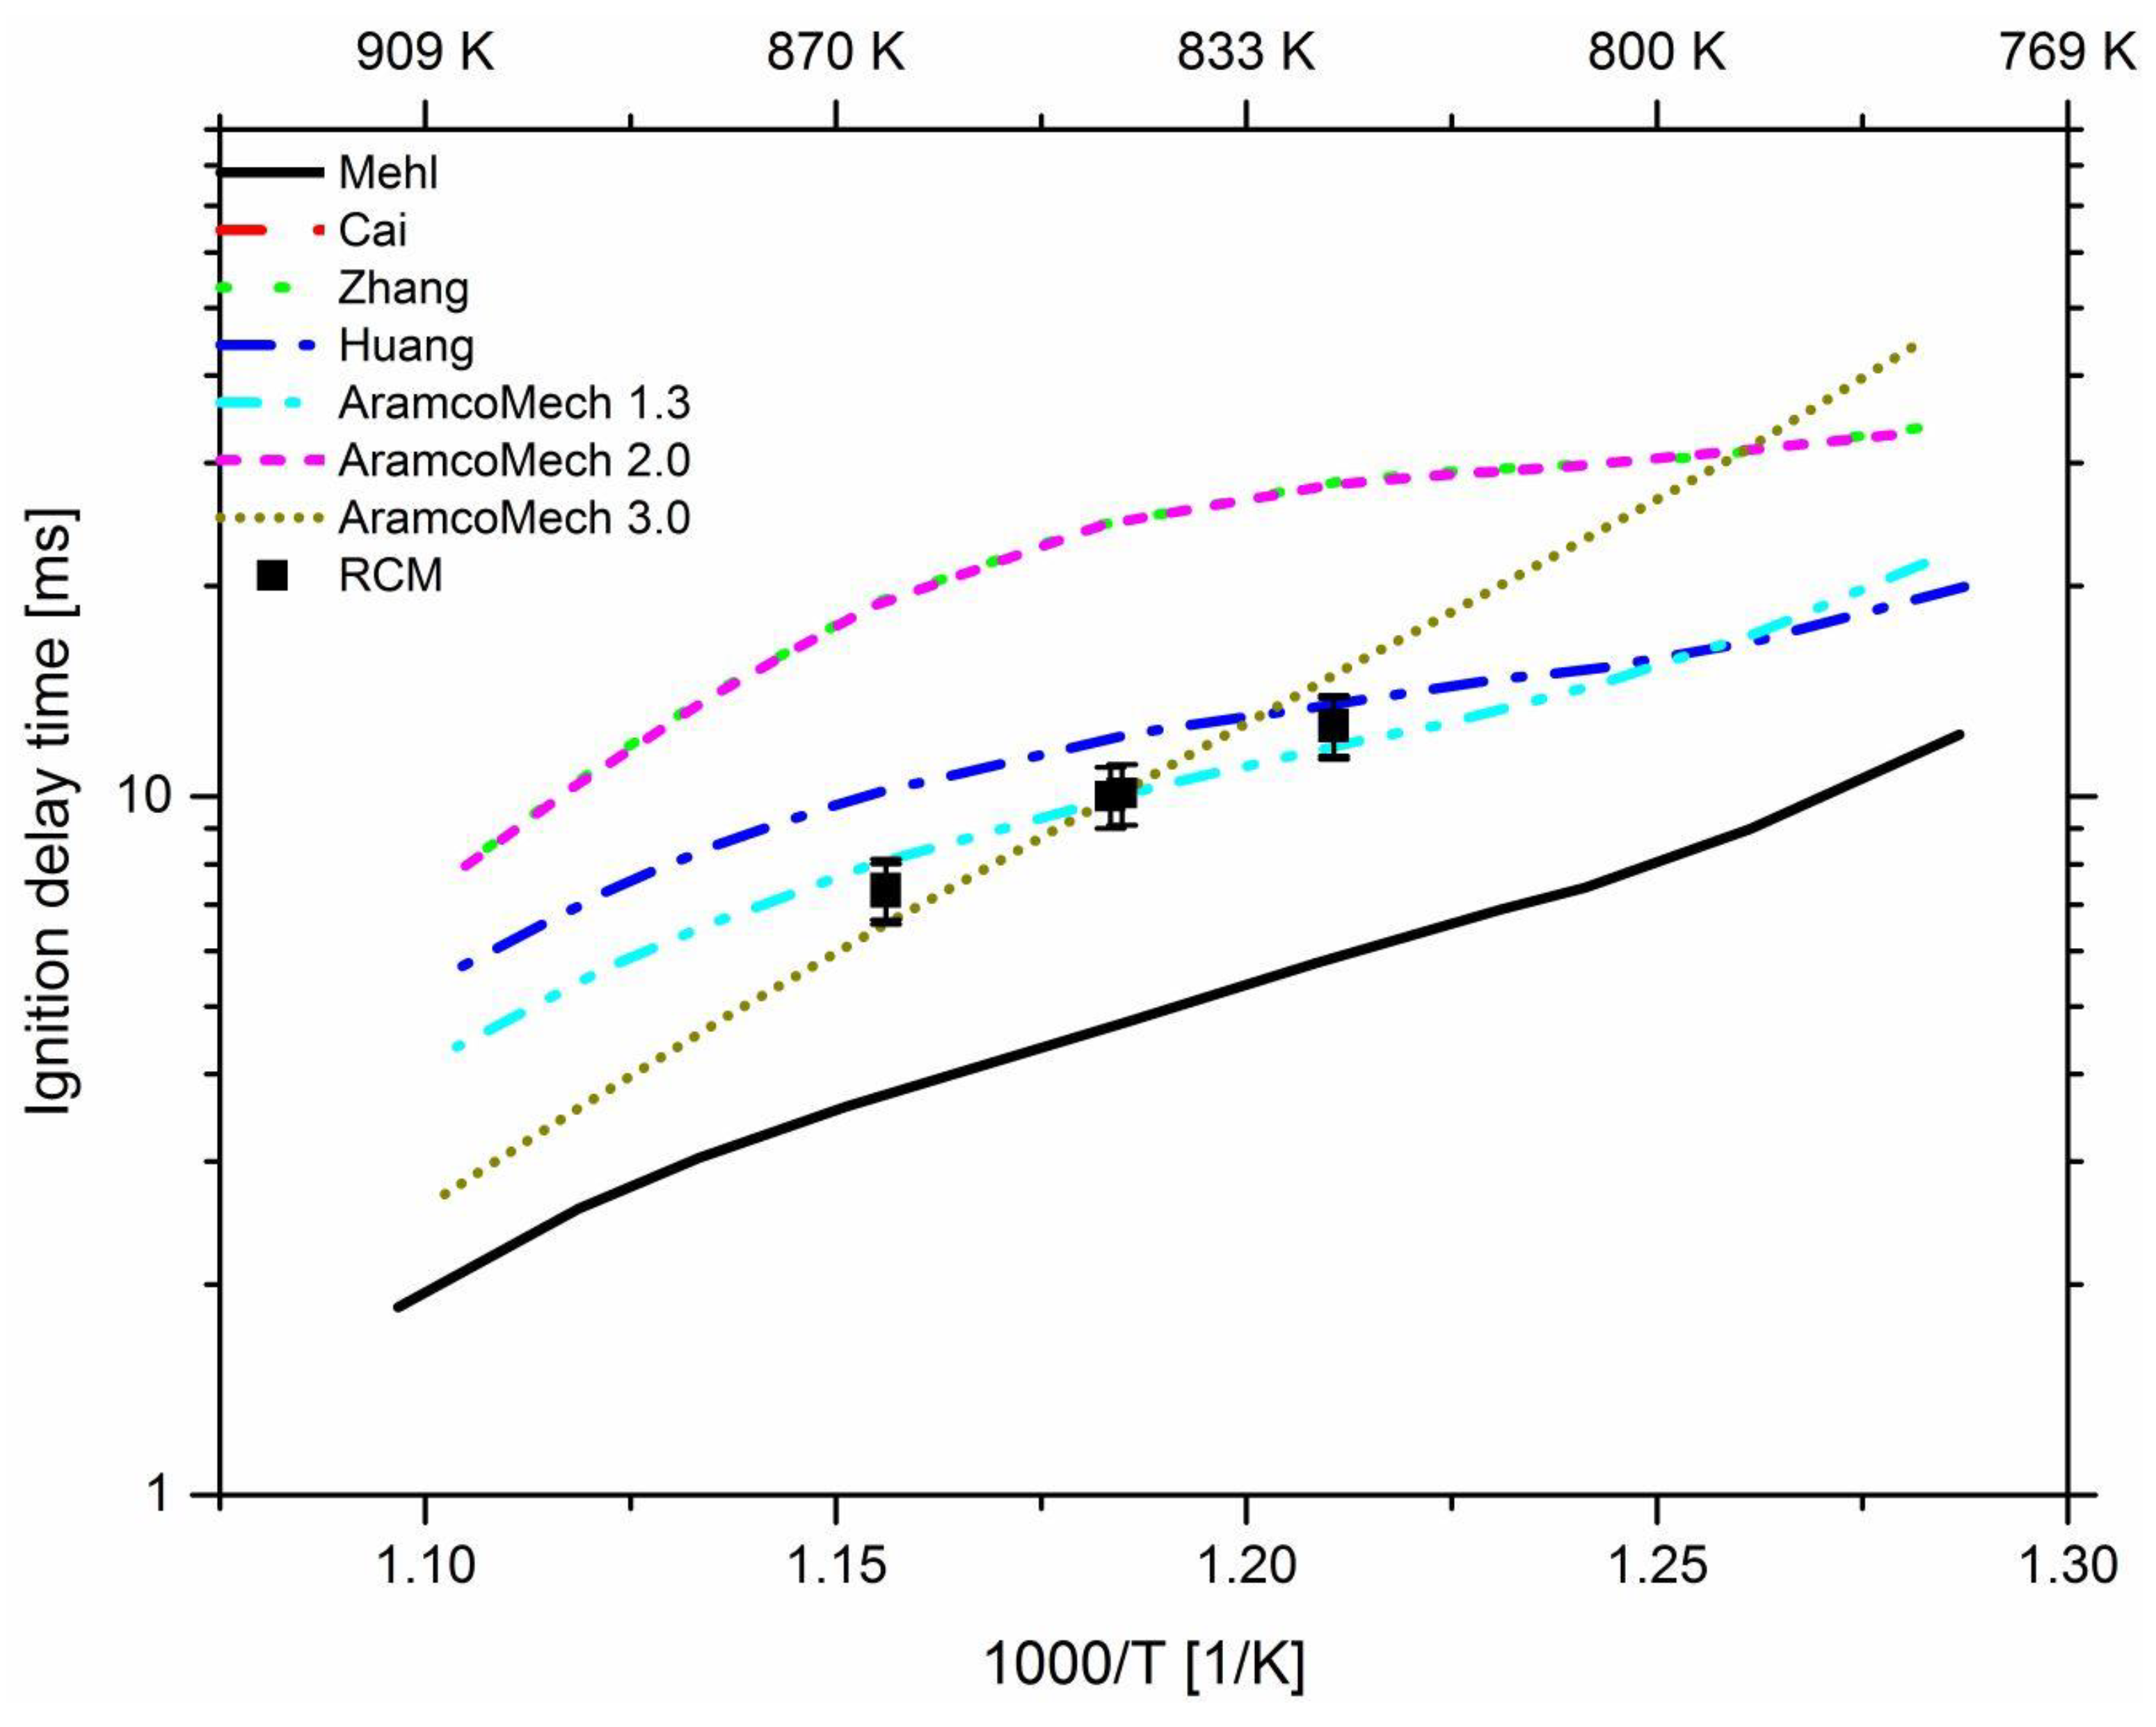
| Rapid compression machine | RCM1.1 | 100 | 0 | - | 100 | 906–941 | [37] |
| RCM1.2 | 95 | 5 | - | 100 | 888–916 | [37] | |
| RCM1.3 | 70 | 30 | - | 100 | 826–865 | [37] | |
| RCM2.1 | 90 | 10 | - | 100 | 803–898 | this study | |
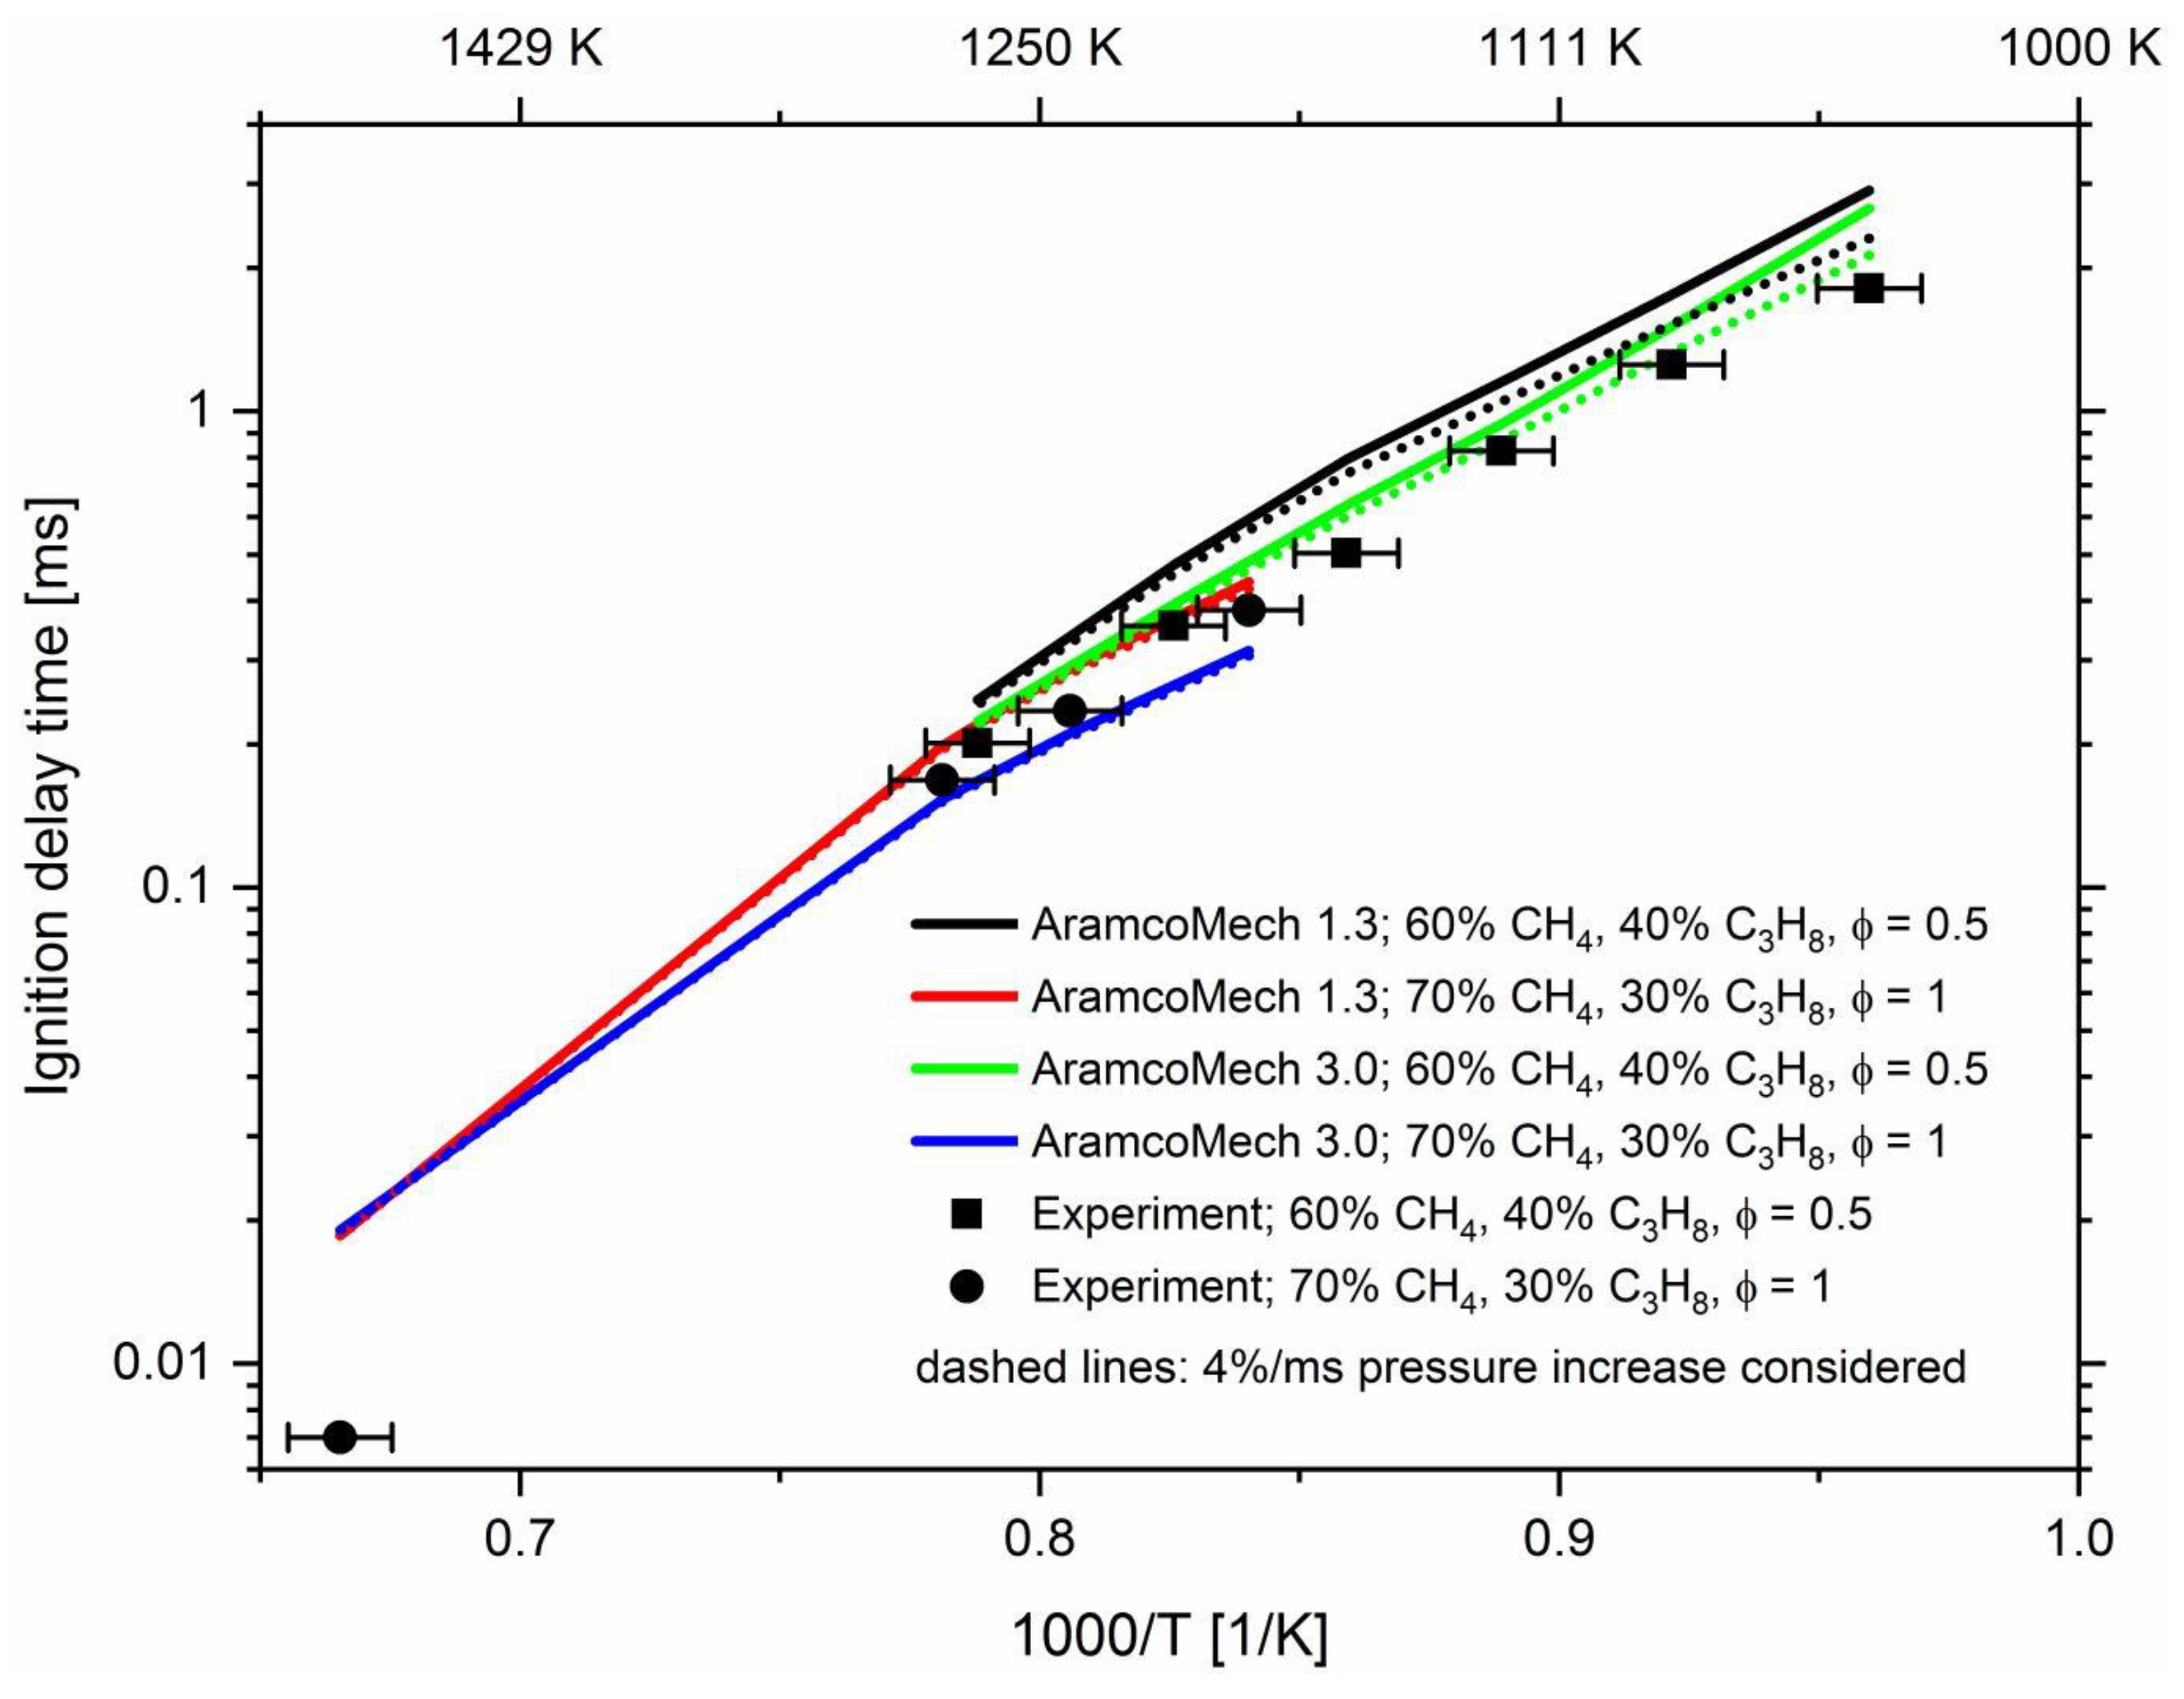
| RCM2.2 | 95 | 5 | 0.025 | 60 | 701–877 | this study | |
| RCM2.3 | 95 | 5 | 0.05 | 60 | 671–781 | this study | |
| RCM2.4 | 95 | 5 | 0.025 | 100 | 709–817 | this study | |
| RCM2.5 | 100 | 0 | 0.025 | 60 | 720–869 | this study | |
| Shock tube | ST1.1 | 95 | 5 | 0.1 | 60 | 748–1187 | this study |
| ST1.2 | 100 | 0 | 0.1 | 60 | 785–1284 | this study | |
© 2019 by the authors. Licensee MDPI, Basel, Switzerland. This article is an open access article distributed under the terms and conditions of the Creative Commons Attribution (CC BY) license (http://creativecommons.org/licenses/by/4.0/).
Share and Cite
Schuh, S.; Ramalingam, A.K.; Minwegen, H.; Heufer, K.A.; Winter, F. Experimental Investigation and Benchmark Study of Oxidation of Methane–Propane–n-Heptane Mixtures at Pressures up to 100 bar. Energies 2019, 12, 3410. https://doi.org/10.3390/en12183410
Schuh S, Ramalingam AK, Minwegen H, Heufer KA, Winter F. Experimental Investigation and Benchmark Study of Oxidation of Methane–Propane–n-Heptane Mixtures at Pressures up to 100 bar. Energies. 2019; 12(18):3410. https://doi.org/10.3390/en12183410
Chicago/Turabian StyleSchuh, Sebastian, Ajoy Kumar Ramalingam, Heiko Minwegen, Karl Alexander Heufer, and Franz Winter. 2019. "Experimental Investigation and Benchmark Study of Oxidation of Methane–Propane–n-Heptane Mixtures at Pressures up to 100 bar" Energies 12, no. 18: 3410. https://doi.org/10.3390/en12183410