Experimental Implementation of a Flexible PV Power Control Mechanism in a DC Microgrid


Sorbonne University, Université de Technologie de Compiègne, EA 7284 AVENUES, 60203 Compiègne, France
*
Author to whom correspondence should be addressed.
Energies 2019, 12(7), 1233; https://doi.org/10.3390/en12071233
Submission received: 28 February 2019
/
Revised: 20 March 2019
/
Accepted: 26 March 2019
/
Published: 31 March 2019
(This article belongs to the Special Issue Solar Energy Harvesting, Storage and Application)
Abstract
:The intermittent and highly variable nature of photovoltaic (PV) sources is always the major obstacle to the growth of their deployment. Research work is increasingly demonstrating that PV generation should not only be maximized but also flexible based on the system requirements. This article presents a simple and flexible PV control mechanism, which can seamlessly switch between maximum power point tracking mode and power limiting mode. It can be integrated into a DC microgrid for efficient energy management. The proposed mechanism has two configurations that respectively converge to a lower and a higher PV panel voltage to perform PV shedding. The experimental validation carried out in this study shows that this control can effectively adjust the PV generation despite some physical constraints. The limitations of the control mechanism and the energy efficiency are also analyzed. It can be concluded that each configuration can be particularly useful depending on the different application scenarios.
1. Introduction
Photovoltaic (PV) power generation has been proven to be a potential alternative to traditional fossil fuel power sources [1]. It is renewable and free of greenhouse gas emission and, importantly, it can be installed in urban areas which can lead to less power transmission investment and lower energy losses [2,3]. The PV panels are generally connected to the maximum power point tracking (MPPT) controller, which maximizes the energy yield and injects all the power into the utility grid. Many algorithms have been proposed for this purpose [4,5,6]; out of all MPPT algorithms, the perturbation and observation (P&O) method is particularly favored by the market since it is easy to realize and highly efficient [7]. However, there are technical issues with integrating the conventional electric grid with decentralized energy generation [8,9]. Therefore, the intermittent nature of PV generators creates the need for a large amount of ancillary services, which are relatively expensive [10]. Hence, the annually installed PV capacity has decreased recently [11].
In order to overcome this constraint and increase the use of renewable energy, microgrid technology has been proposed and becomes popular, especially urban PV implementation [12,13]. A microgrid is an aggregation of energy sources (both traditional and/or renewable), the energy storage system and the electrical loads, which can be seen as a single unit in the public grid. The PV power generation can be smoothed by means of energy storage and is ready for self-consumption by local loads. Hence, the impact of PV power intermittency on the utility grid is greatly reduced and the economic benefits that could result from this are evident [14,15,16]. Depending on the nature of the common bus, the microgrids can be categorized into AC microgrids, DC microgrids, and hybrid AC-DC microgrids. Recently, researchers have increasingly found that the DC microgrid has potential because of its compatibility with DC devices such as PV generators, battery storage and electronic loads [17,18,19]. Thus, this work focuses on DC microgrids.
Grid-injected PV generators are often cut off entirely when the grid encounters a stability issue [20]. In the microgrid context, partial PV shedding may be needed for different reasons, such as power balancing [21], dealing with the partial shading condition [22], supporting grid voltage by supplying reactive power [23] or the sudden increase of solar irradiance [24]. This type of shedding operation can be achieved by manipulating the PV output voltage and current. However, the main challenge is still the nonlinear characteristics of a PV generator. Previous research has been carried out on this subject, such as the work of Reddy and Sarkar [24] and Wang et al. [25]. The partial shedding is generally achieved by increasing the PV voltage, since it leads to a fast response and weak line losses. However, the physical constraints of the PV converter have not yet been taken into account. Moreover, there is a lack of analysis on the energy efficiency during the PV shedding procedure.
This study proposes a flexible PV power control mechanism based on the previous work presented in Wang et al. [25]. Thanks to a classical P&O MPPT algorithm and a proportional-integral (PI) power controller, it is supported in both the MPPT mode and the power limiting mode. In addition, the seamless switch between the two modes is feasible. The PI power controller allows for a faster dynamic response than the perturbation methods. It was also chosen because of its flexibility; with an easy reconfiguration, PV shedding can be achieved by reducing or raising the PV voltage. This choice is usually linked to the converter constraints. Nevertheless, it has an impact on the efficiency of the system.
In light of the statements above, the paper is organized as follows: The principle of PV power limit control is presented in Section 2, the proposed PV control mechanism is presented in Section 3, the experimental tests are demonstrated and discussed in Section 4 and the concluding remarks are given in Section 5.
2. PV Limit Control Principles and State of the Art
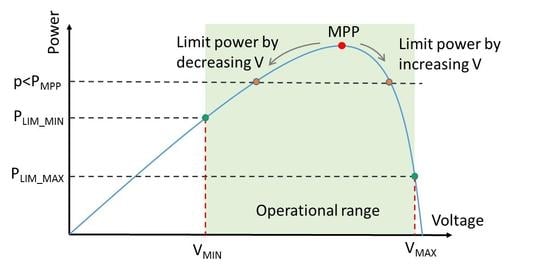
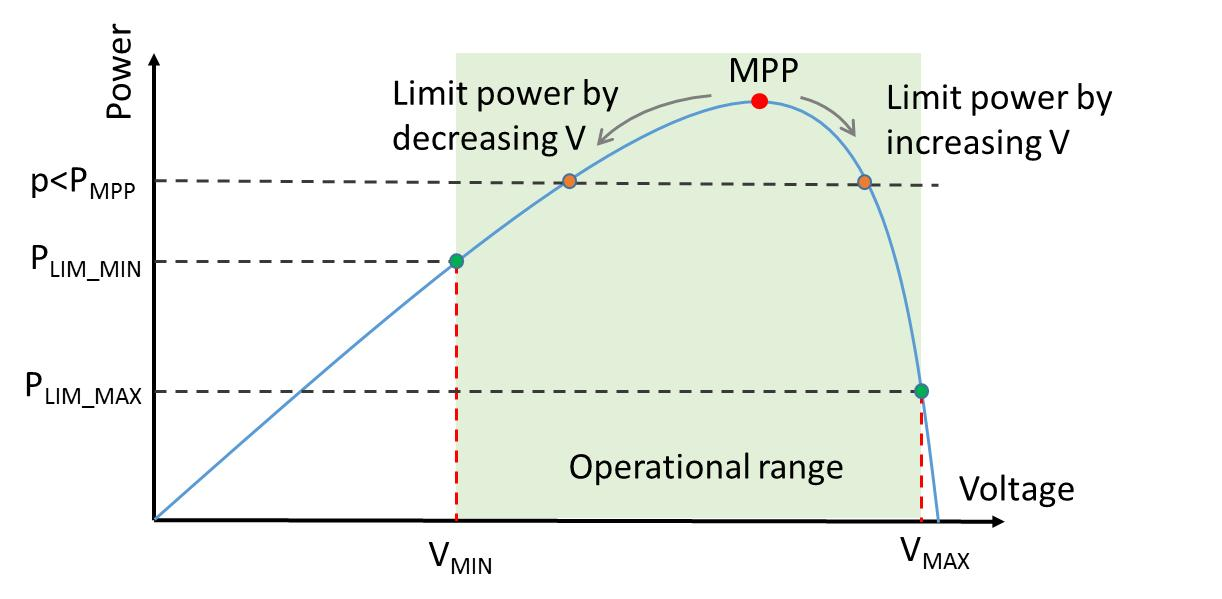
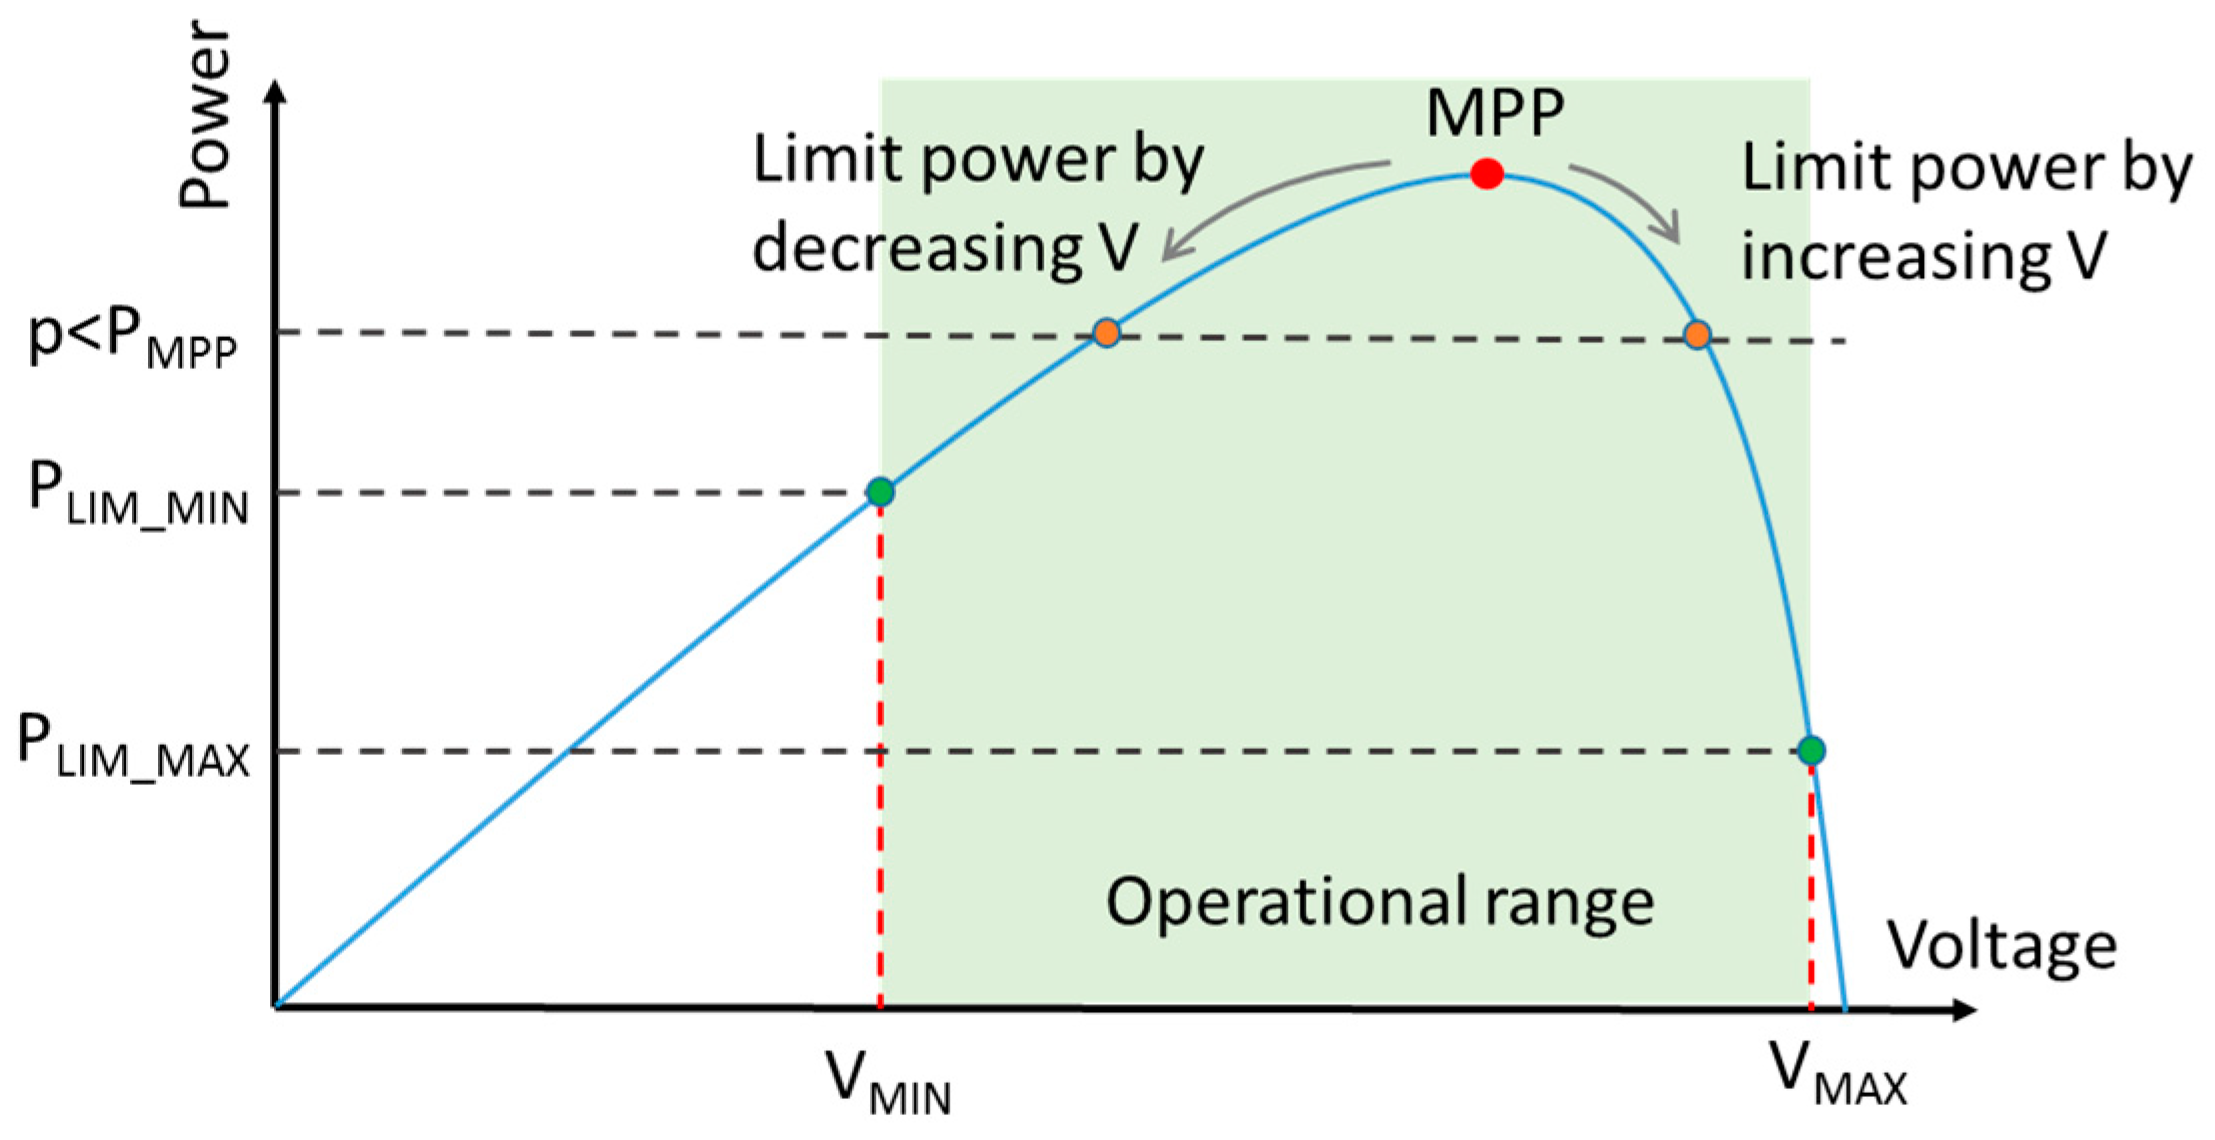
Figure 1 shows the typical power-versus-voltage (P-V) characteristic of PV panels. The MPPT algorithms focus on finding the unique maximum power point (MPP), which is indeed floating due to the variable operating conditions. In the microgrid context, the storage and the grid connection can absorb the excessive PV generation to some extent. However, in a microgrid where the PV generation is designed to be the major power supply, the storage and grid connection sizing is limited due to economic constrains. Thus, their capability is also limited and PV shedding capability is often required in order to adapt to the load demand [26,27]. Therefore, sometimes the PV control algorithm should be switched from MPPT mode to PV limiting mode immediately, reducing the PV generation to keep the power balance in the microgrid.
Like the MPPT methods, the instant PV power can be reduced by adjusting the output voltage and current. Some effective methods for PV limit control have been presented in previous research work. In [24], the authors described a method to control a storage-free PV system with a given power reference. It is based on the voltage P&O algorithm and the system tends to converge towards a higher voltage step by step when the power reference is less than the maximum power. Ahmed et al. [28] presented a PV control method based on a variable-step-size incremental conductance algorithm, which supports the MPPT operating mode and the reduced power operating mode. When passing to the reduced power mode, the PV voltage increases following the perturbation step. A decentralized power management system was designed by Mahmood et al. [29] for a hybrid PV-battery system. It includes a conventional MPPT algorithm and a control loop that can pause MPPT and move the PV operating point to a higher voltage when the battery is fully charged or the battery charging power is too large. In research by Sangwongwanich et al. [30], four different constant PV generation strategies were tested in experimental tests, including the power control method, the current limit method and two P&O algorithms converging to the left and right side of the MPP. Their dynamic and static performance, complexity and stability were compared.
It should be noted that in these articles, as well as in most literature, PV power limiting is realized by increasing the PV voltage. This is partially because the slope on the right side of the MPP in Figure 1 is steeper, thus it can be expected to have better dynamic performance. Moreover, high voltage would lead to less current and thus fewer ohmic losses. However, in the aforementioned work, the operation voltage range of the converter was not considered. As each converter has an acceptable input voltage range, defined as the operational range in Figure 1, the lower and upper voltage bounds correspond to different sheddable power. Therefore, it is essential to consider these impacts in real applications. Moreover, the effect on the converter efficiency has not been thoroughly explored. Even though the ohmic losses are reduced, a high input voltage can lead to high switching losses; thus, the total power losses can increase in some cases. This can also impact the economic benefits of the installed PV system. Hence, research work that considers all the above points is warranted.
3. Proposed PV Control Mechanism
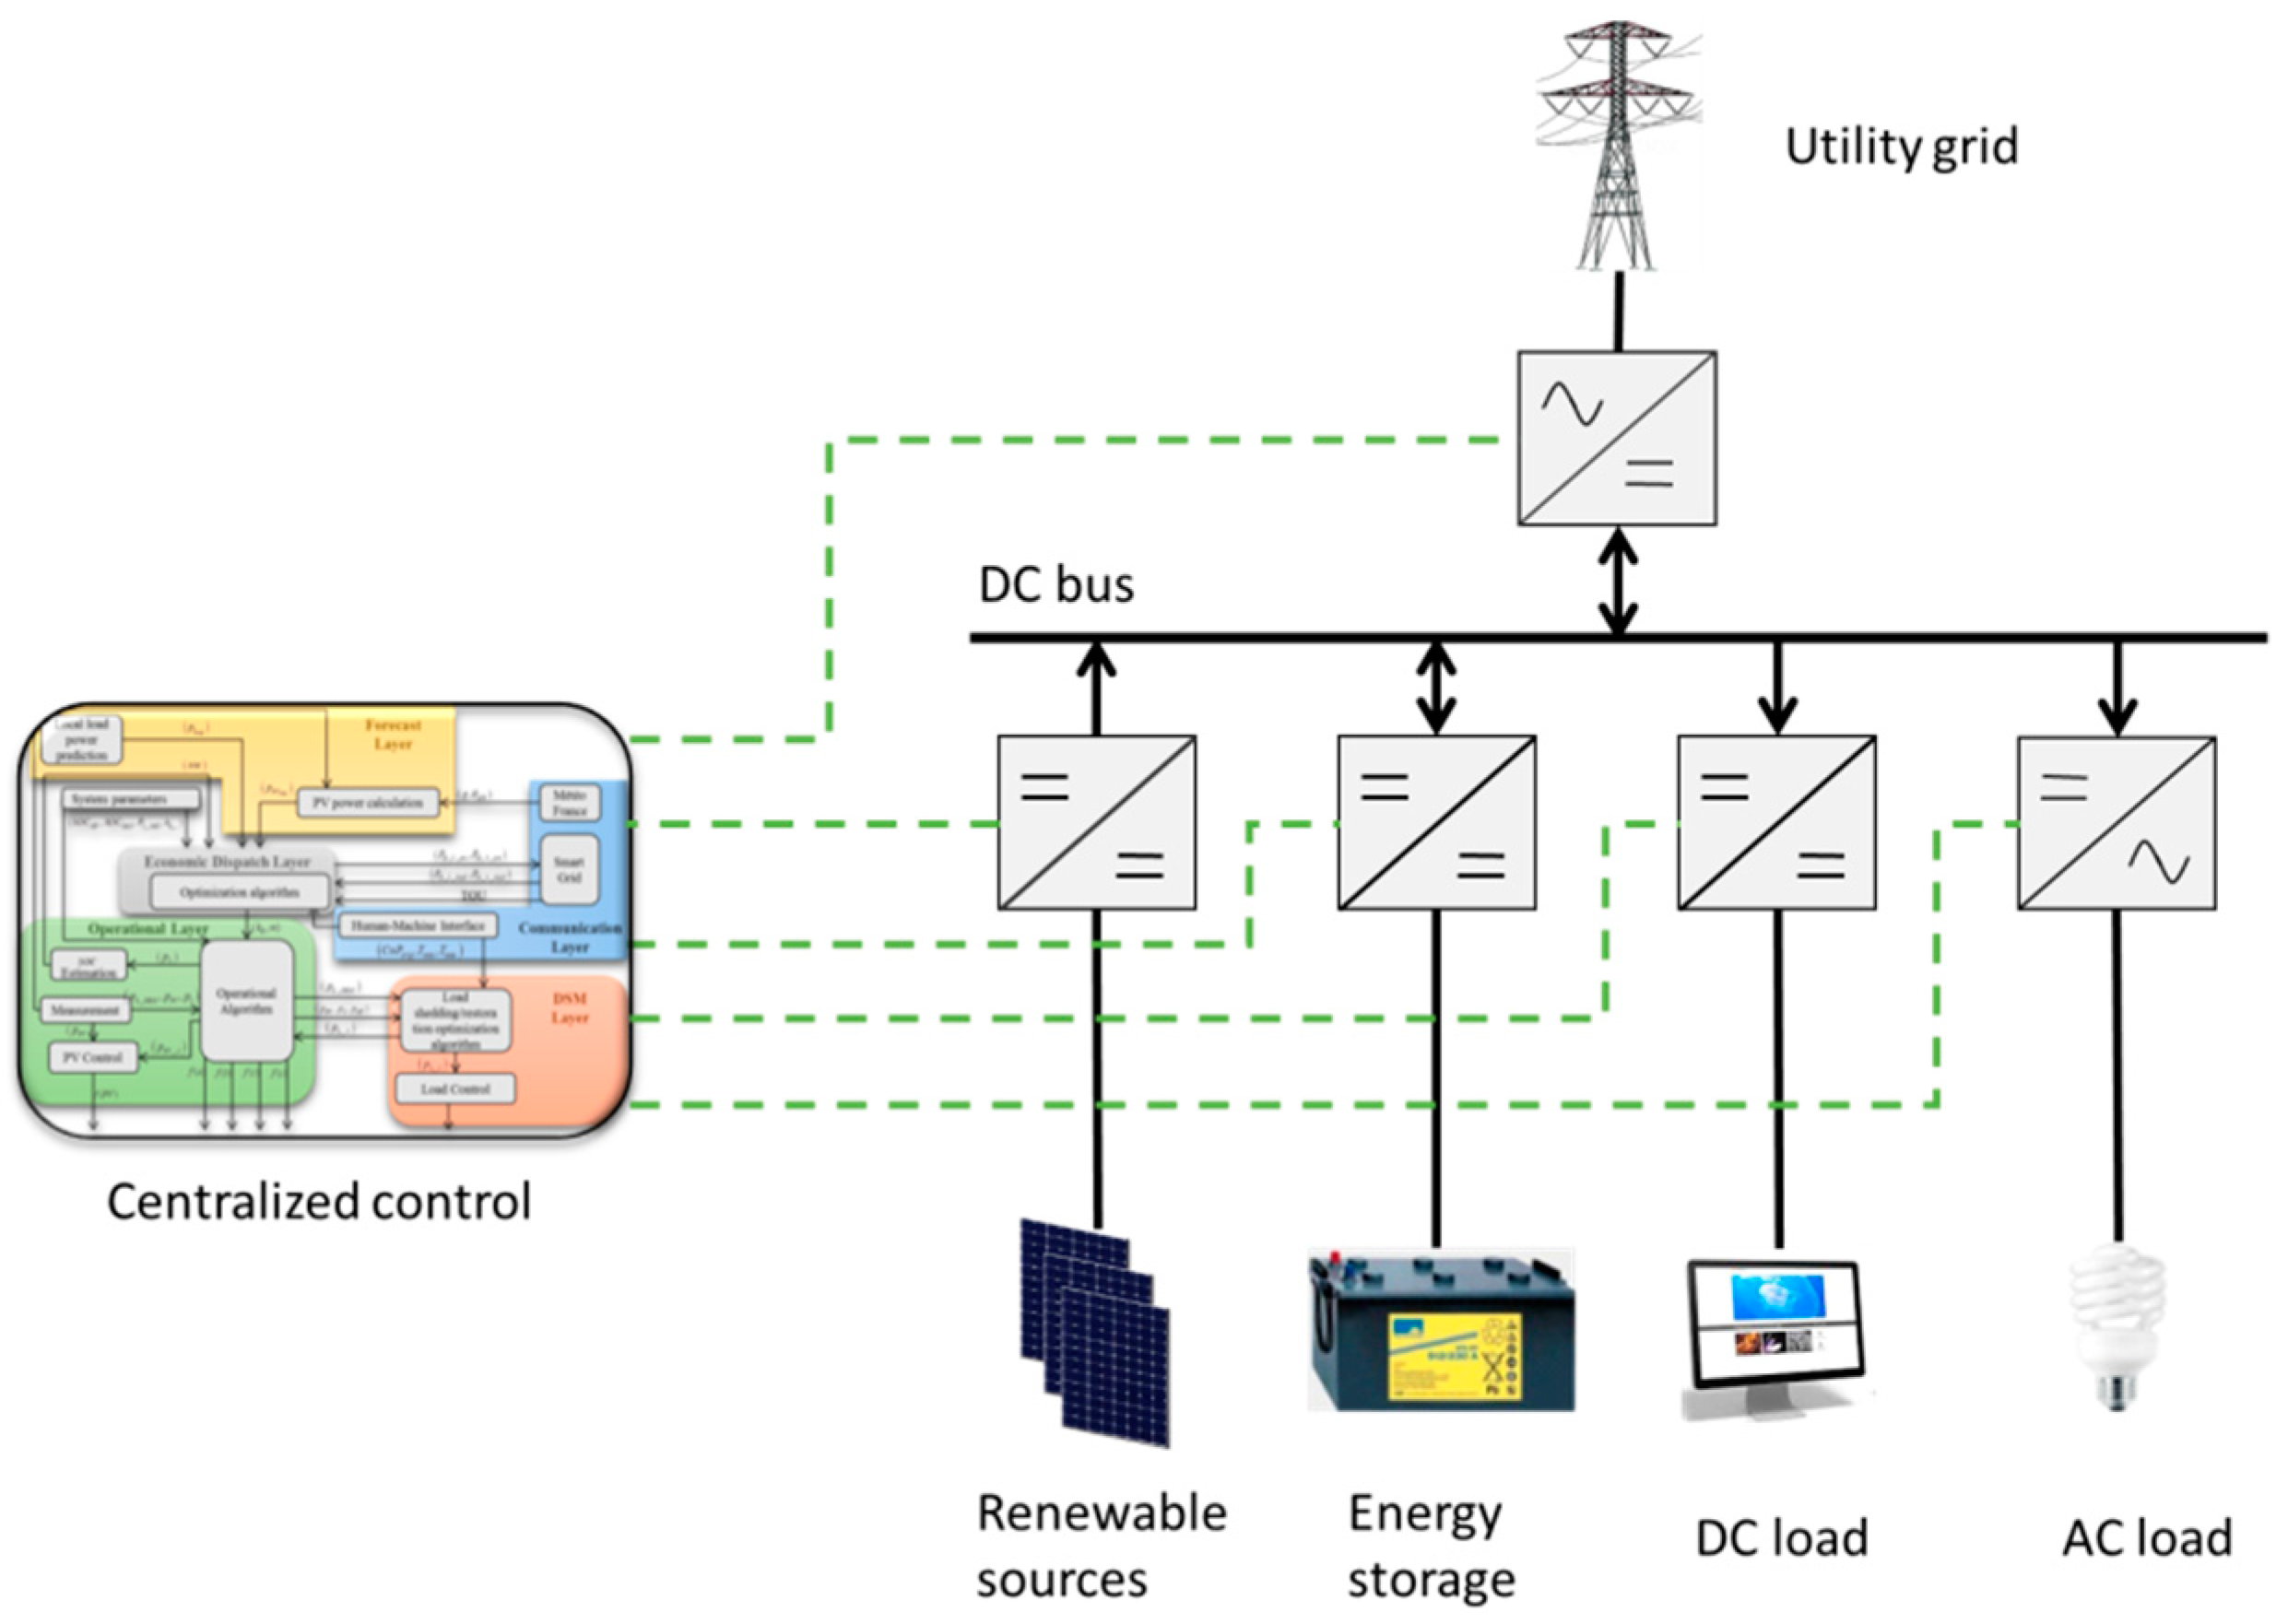
The purpose of this work is to conceive a flexible PV control method for a DC microgrid, as shown in Figure 2. It should be able to operate in both MPPT and power limiting modes, and can switch from one to another to respond to the dynamic power demand of the system.
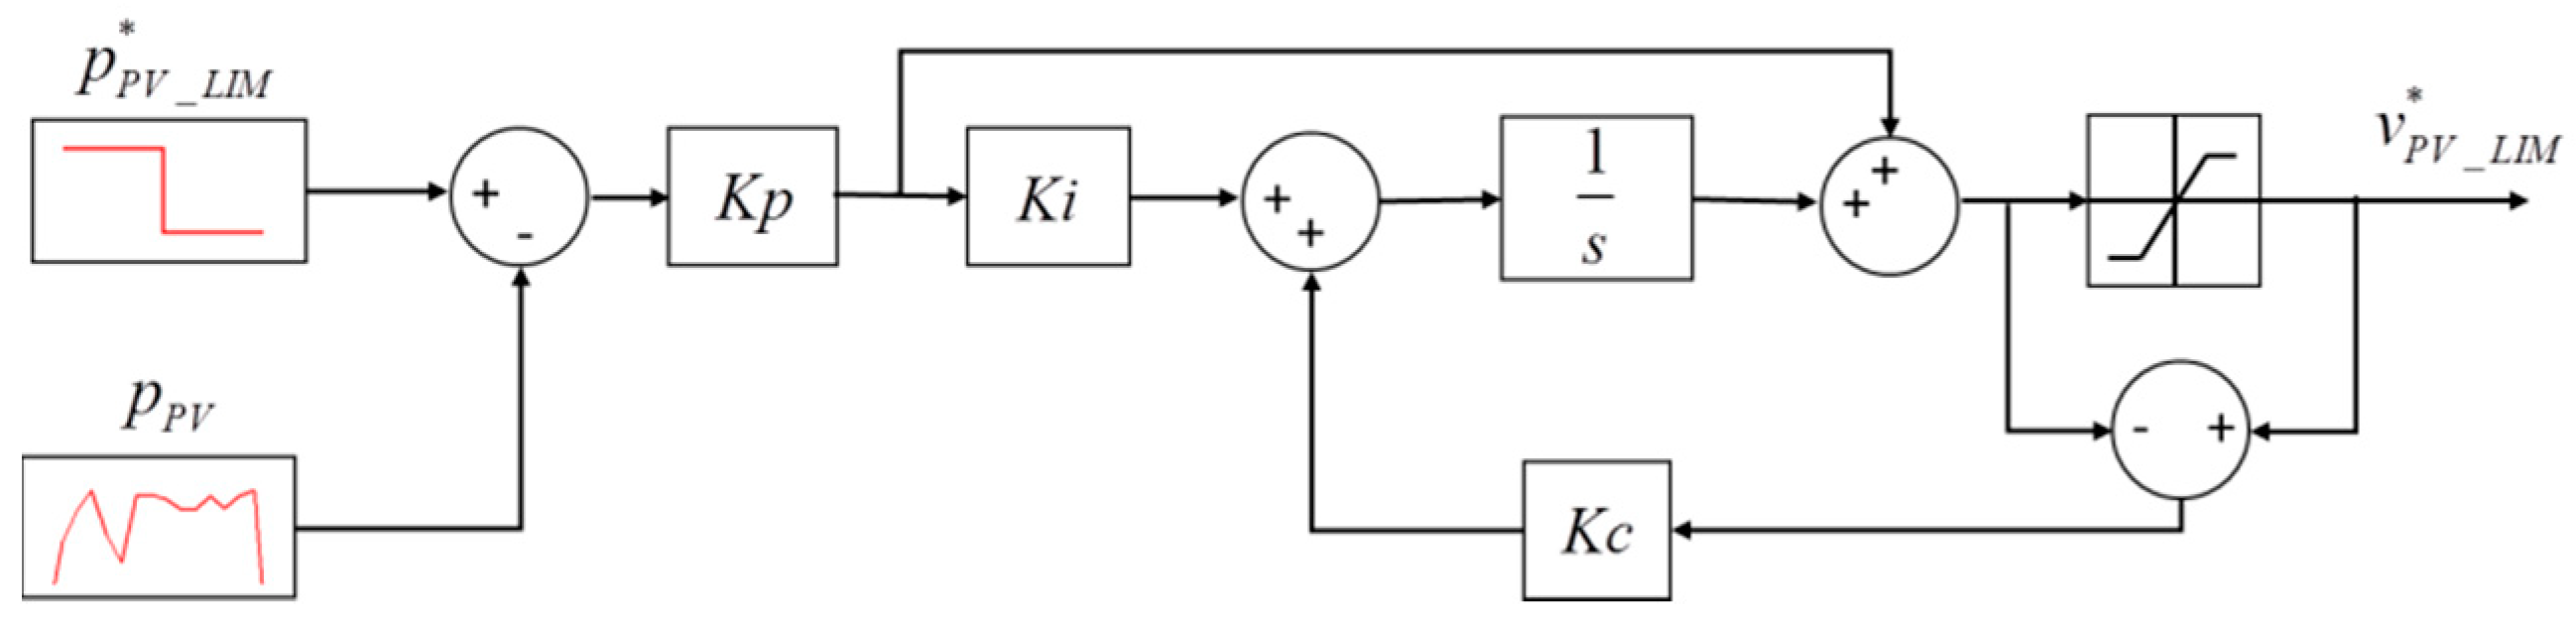
In order to realize simple and robust power control, the proposed PV power limiting control is realized by a PI controller which receives the error between the power reference and the actual PV power . The limited PV voltage reference can be expressed as in Equation (1). The proportional gain (Kp) and the integral gain (Ki) determine the dynamic of limited power control and their values can be tuned in a classical way.
However, this voltage reference is only valid in PV power limiting mode. During the MPPT mode, the maximum allowed PV power is greater than actual PV power and the difference between them accumulates in the PI controller. As a result, this calls for an anti-windup to prevent the saturation of the integrator. The saturation block makes sure that this voltage reference is within the functional range of the system, and the windup is canceled by the gain (Kc). The entire power limiting control is depicted in Figure 3.
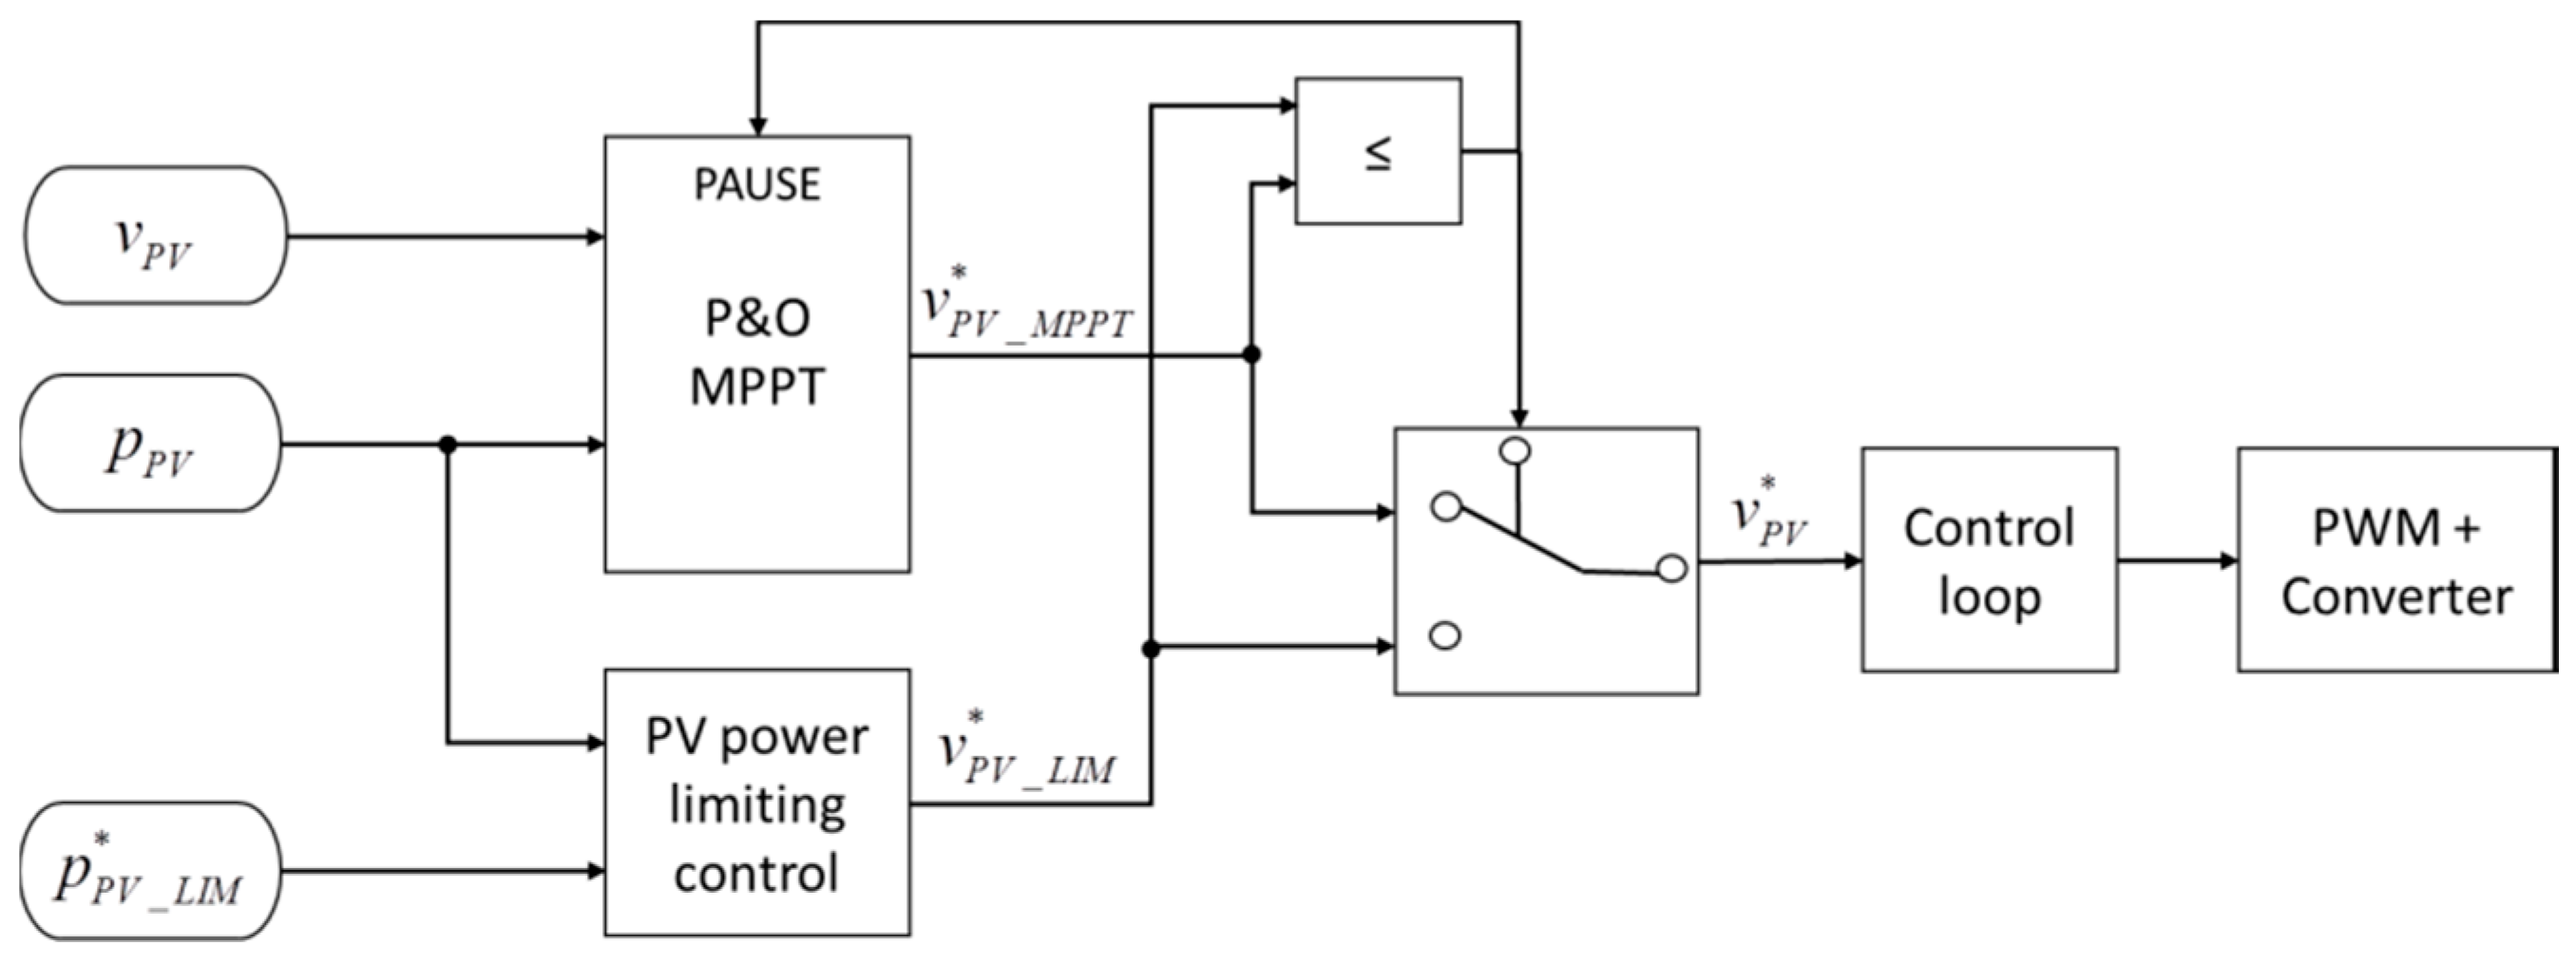
The PV power limit is imposed by the microgrid central controller and it can vary at any time. Hence, it demands seamless switching between the MPPT control and the PV limited control. The global PV control mechanism is presented in Figure 4. It is worth noting that the P&O MPPT algorithm is chosen in this work for its simplicity, but it can be replaced by any other algorithm based on discrete steps, such as the incremental conductance algorithm.
While performing the MPPT operation, i.e., , the input of the PI controller is positive. By selecting a negative value of , the value of the generated is always less than . Consequently, is sent as the final to the associated PV control loop to command the PV converter. Conversely, if the power limiting mode is active and , will consequently be greater than ; thus, will be sent to the control loop. Moreover, in order to prevent the P&O algorithm from being disturbed, the MPPT algorithm should be paused in power limiting mode. In conclusion, the final PV voltage reference can be expressed as shown in Equation (2). This configuration is called the “max” configuration.
The proposed mechanism can be easily reconfigured to obtain the minimal value between and . By altering the sign of , one can force to be less than . Moreover, the direction of the relational operator needs to be changed from “greater than” to “less than” as well. A configuration such as this is depicted in Figure 5 and is called the “min” configuration.
Both configurations can achieve seamless switching between the MPPT and power limiting modes. However, the maximum sheddable PV power can be different, as stated in the preceding section. The experimental validation and comparisons are conducted in the next section.
4. Experimental Validation
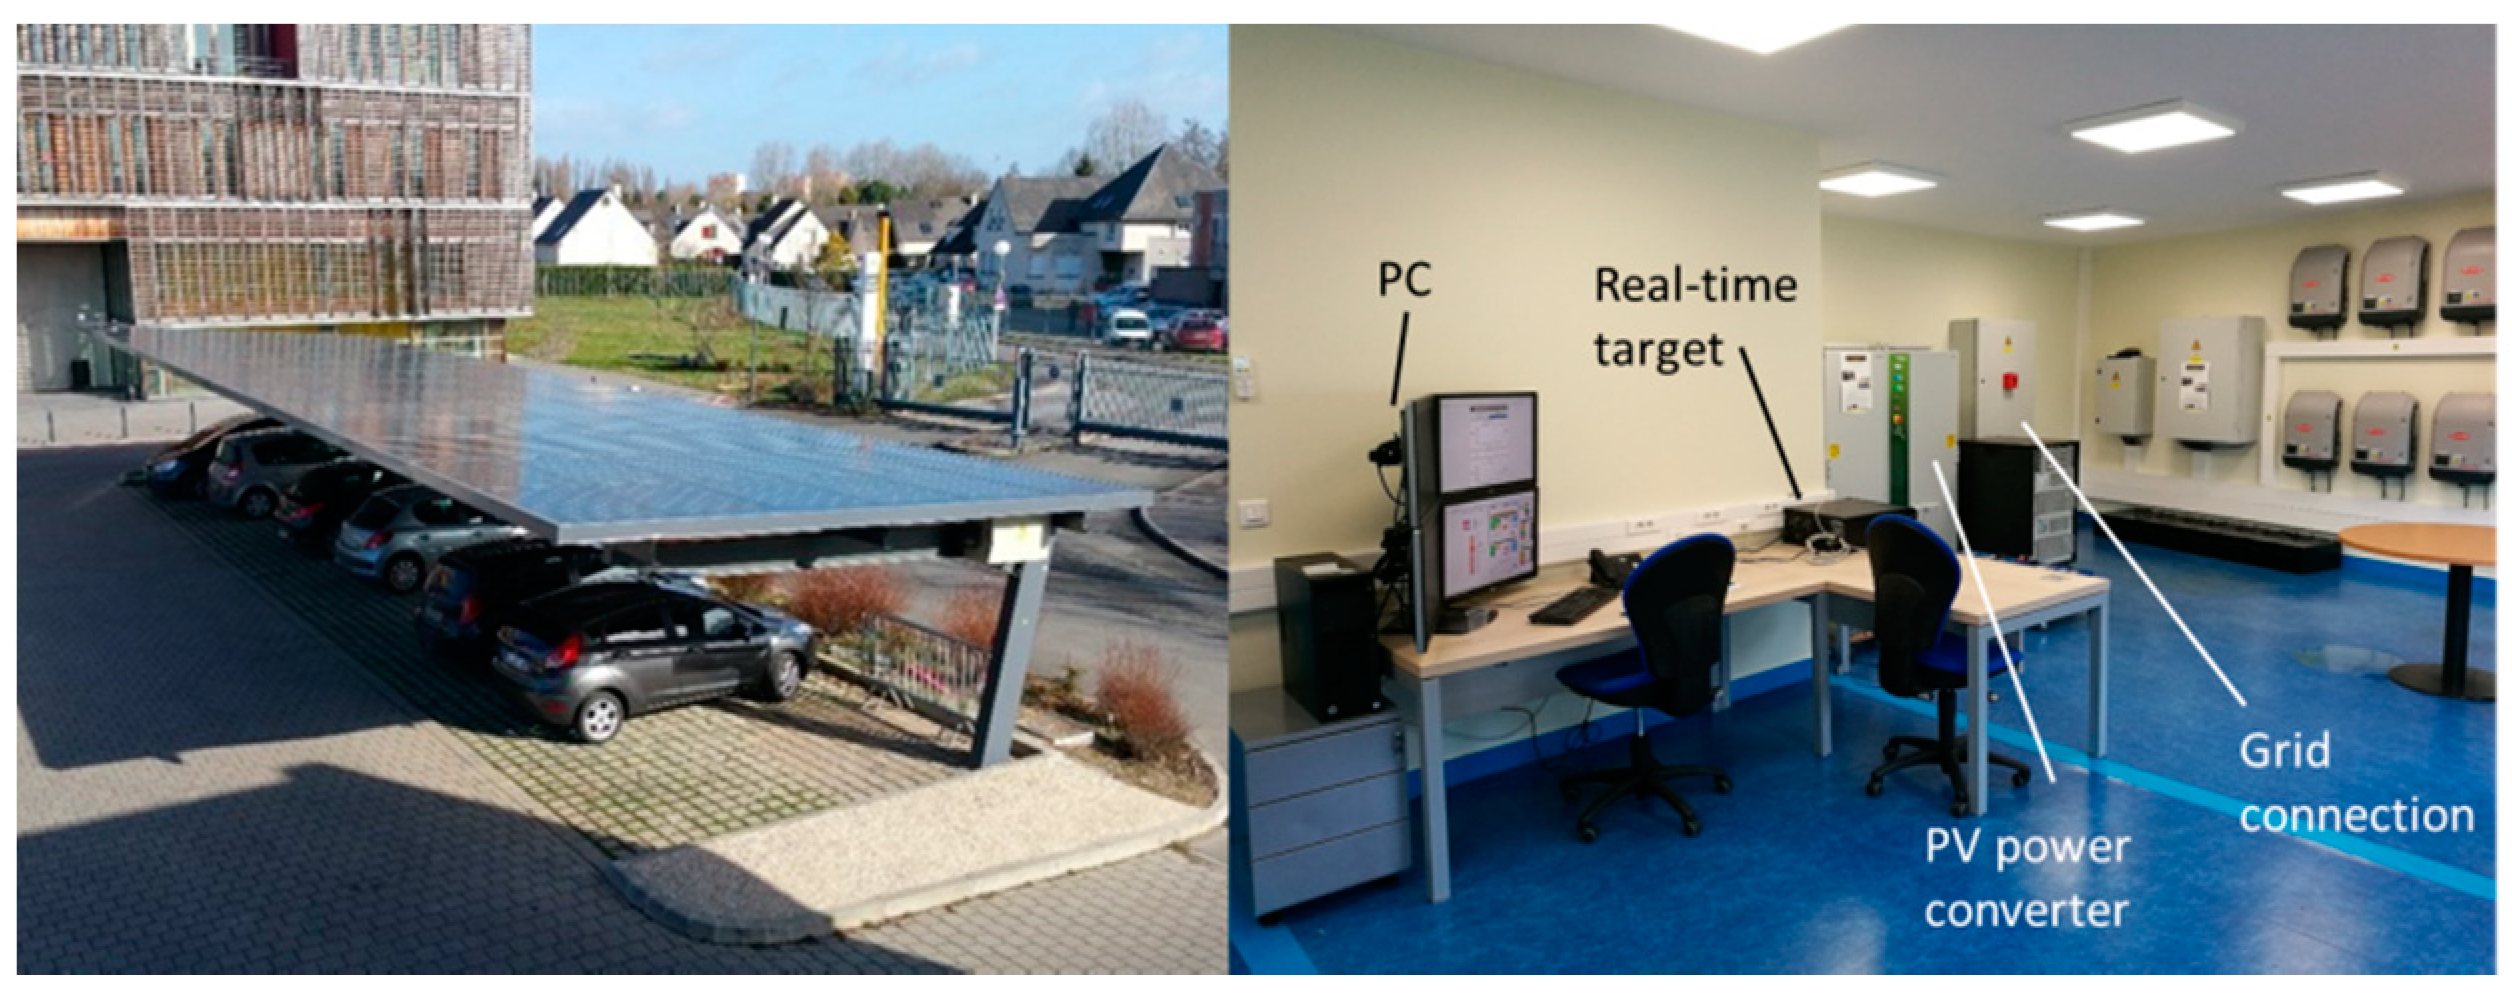
The experimental validation was carried out on the technological platform, which is located on the campus of Université de Technologie de Compiègne in Compiègne, France, as shown in Figure 6.
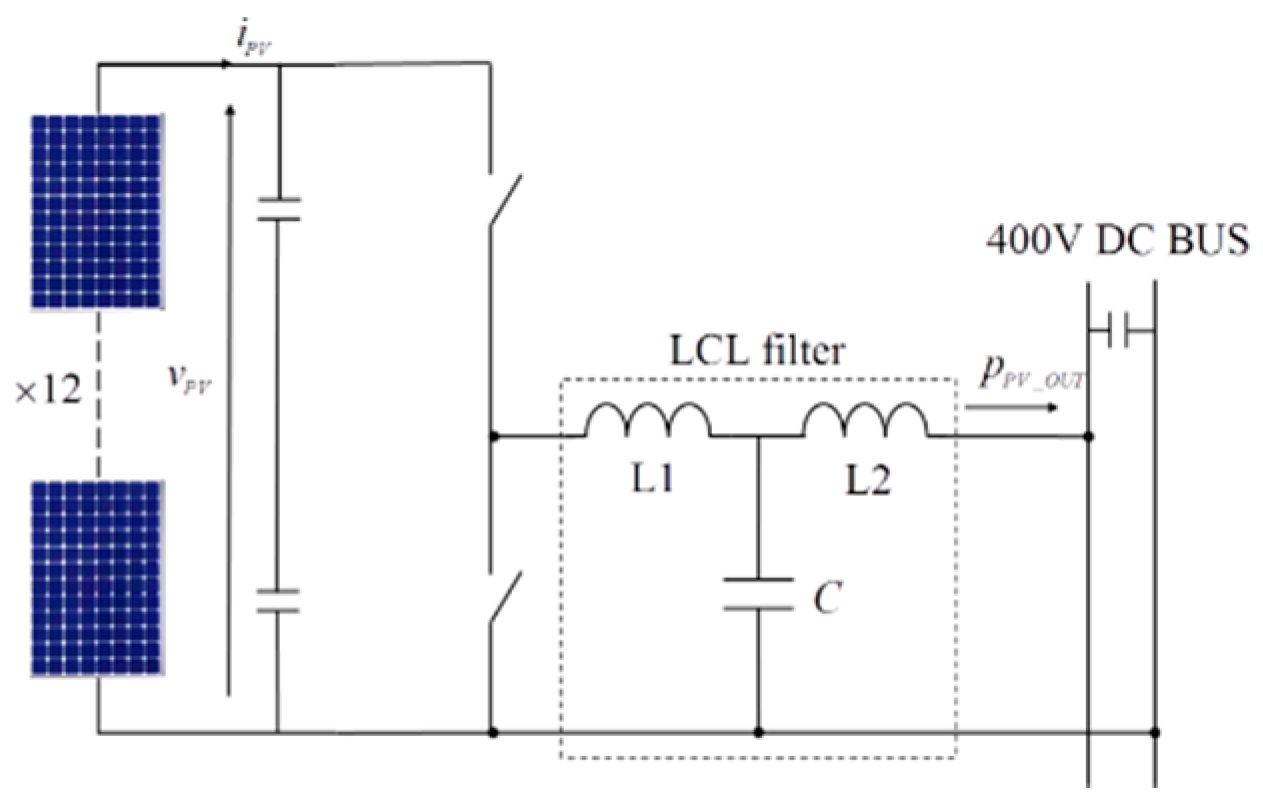
The electric scheme of the PV subsystem, i.e., the PV generator and its power converter, is presented in Figure 7 and some of the parameter values are given in Table 1.
The PV generator is composed of 12 PV panels connected in series, which make up to 4.14 kW under Standard Test Conditions (STC, solar irradiance of 1000 W/m2 and panel temperature of 25 °C). Since its MPP voltage is 687.6 V under STC, there is a three-phase interleaved buck converter (Triphase PM15F03P02 15kW) that interfaces the PV generator and the DC bus. The bus voltage is set to 400 V because of the low line losses and the compatibility with the existent infrastructure [31]. The power is equally allocated to each phase, and all the phases are equipped with a dedicated LCL filter, which consists of two inductors and one capacitor. This LCL filter has better filtering performance than the classical LC filter which consists of a single inductor and a capacitor, and the size of the two inductors is usually much smaller than that of a single bulk filter, although it calls for a special control algorithm as described in Vanassche [32]. The control algorithm is programmed in MATLAB/Simulink and then implemented in the real-time target, which commands all of the physical converter components.
Due to the characteristics of the buck converter, the PV output voltage cannot be less than the DC bus voltage. In addition, the maximum input voltage of this converter is fixed at 760 V with the aim of being compatible with the aforementioned PV generator. Evidently, this voltage range of 400 V to 760 V is satisfactory for MPPT control.
4.1. Static Characteristic of the PV Panels
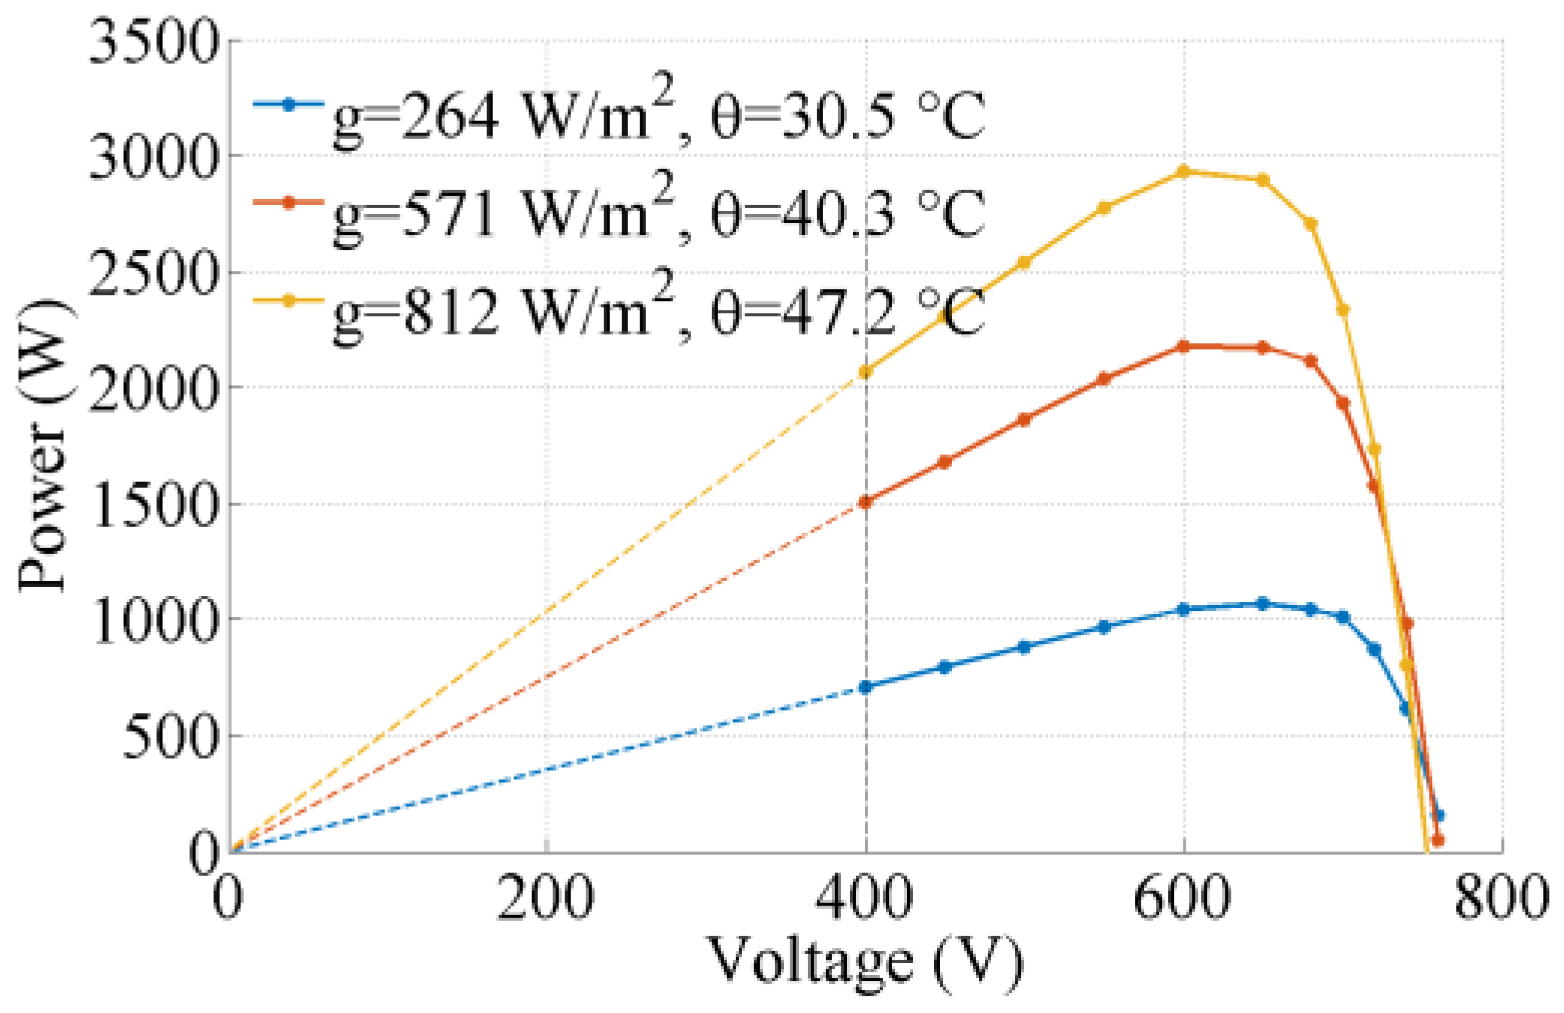
First, the static characteristic of the PV generator is tested. Figure 8 shows the P-V characteristic under certain typical function points, where indicates the solar irradiance and represents the PV cell temperature.
Due to the aforementioned voltage constraint, the tested PV voltage varied from 400 V to 760 V. The dotted lines in the left part of the graph are just linear extrapolations between the original point and the respective measured values at 400 V. It can be seen that all of the curves have the same form that was presented in Figure 1. The curves imply that the MPP voltage is generally less than 700 V, which justifies the choice of the converter input voltage range.
The static performance of PV power limiting control can also be observed in this figure. PV shedding can be realized by both decreasing and increasing the MPP voltage. From the difference between the minimal powers on the left and right sides, one can note the different shedding capacities of the two configurations. On the one hand, the power values at 760 V are all close to zero, meaning that the “max” configuration can shed almost 100% of the PV power. On the other hand, the power values at 400 V are at least about 70% of the maximum power, meaning that the “min” configuration can only shed 30% of PV power.
4.2. Dynamic Performance of the Flexible PV Power Control Mechanism
The dynamic performance of the proposed flexible PV control mechanism was validated under real conditions. Its parameters are shown in Table 2. It should be noted that the P&O MPPT algorithm works with a frequency of 1 kHz, which is a good tradeoff between the convergence speed and stability. Meanwhile, the PV power limiting controller works synchronously with the main real-time system, i.e., 14 kHz, because as a continuous PI controller the high frequency allows for good dynamic performance. The values of Kp, Ki, and Kc in Table 2 are steady examples obtained by experimental tests rather than optimal values. The fine-tuning of these parameters can improve the dynamic performance, but that is not the subject of this work.
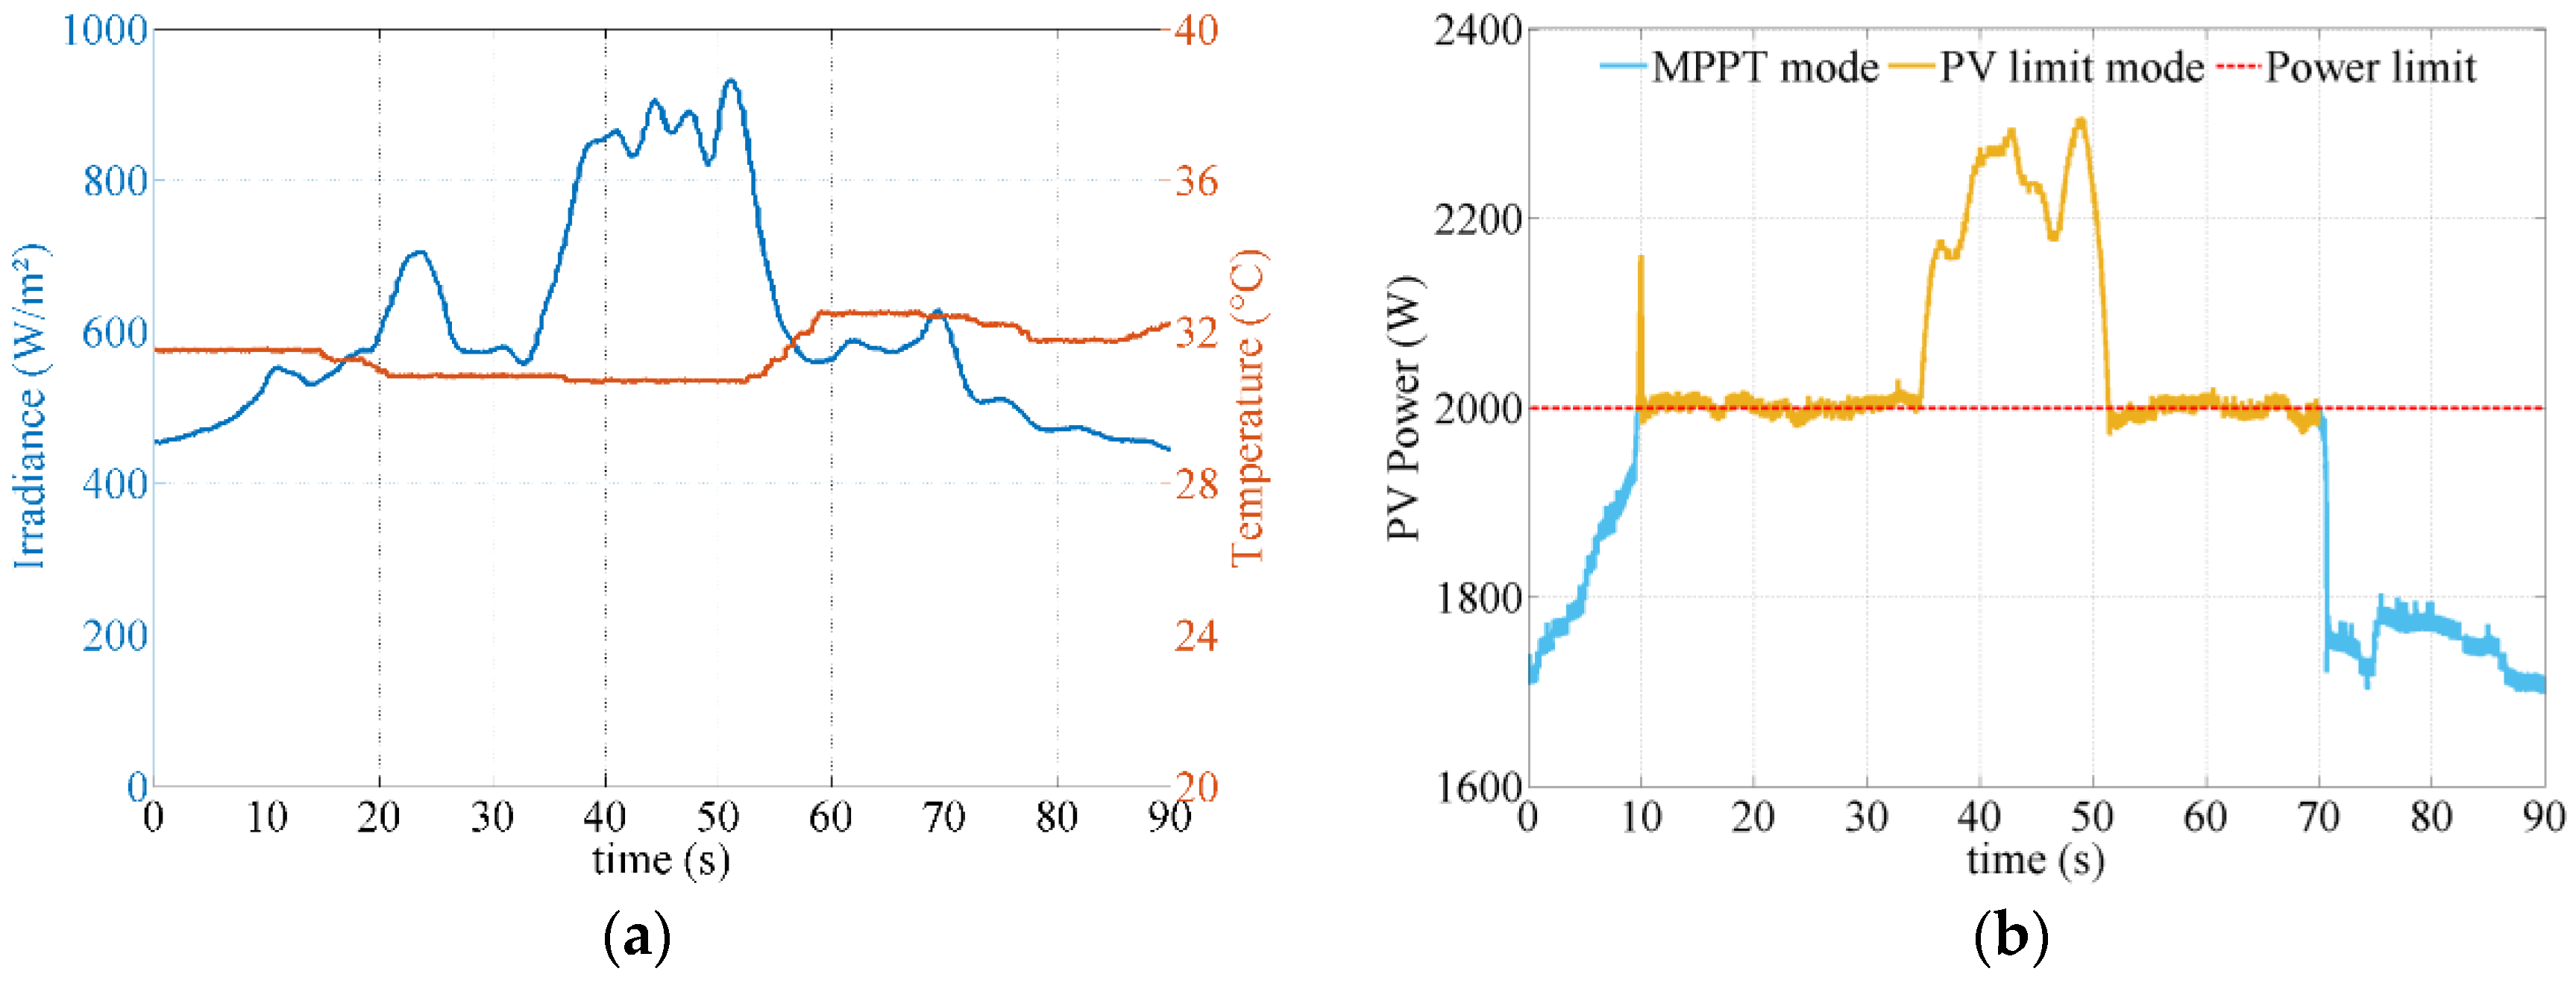
Figure 9 shows the results of a 90 second test of the “min” configuration, carried out on 25 July 2018, where is arbitrarily set to be constant at 2000 W. In Figure 9a, the continuous variance of the solar irradiance and PV cell temperature can be seen. Figure 9b shows that the MPPT algorithm is in control before the imposed PV power limit is reached. The PV generation increases as the irradiance goes up. As soon as and meet, the PV power limiting controller takes control. In Figure 9c, a sudden drop of voltage can be noted. At the beginning of this process, a sharp overshooting image can be observed in Figure 9b, which is caused by switching between the MPPT algorithm and the PI limited power controller. Also, the PV power is well constrained at 2000 W most of the time, despite some oscillations. On the other hand, exceeds the limitation for a while between the 34th second and 51st second. During this period, the PV voltage evolution (Figure 9c) proves that the voltage drops, and the system is saturated at the lower limit of 400 V. In this case, the “min” configuration can shed no more power. In this validation test, the excessive power is absorbed by the other components in the microgrid; thus, in Figure 9c the bus voltage is kept at 400 V. However, in a situation where the other components can absorb no more excessive power, this can cause severe accidents.
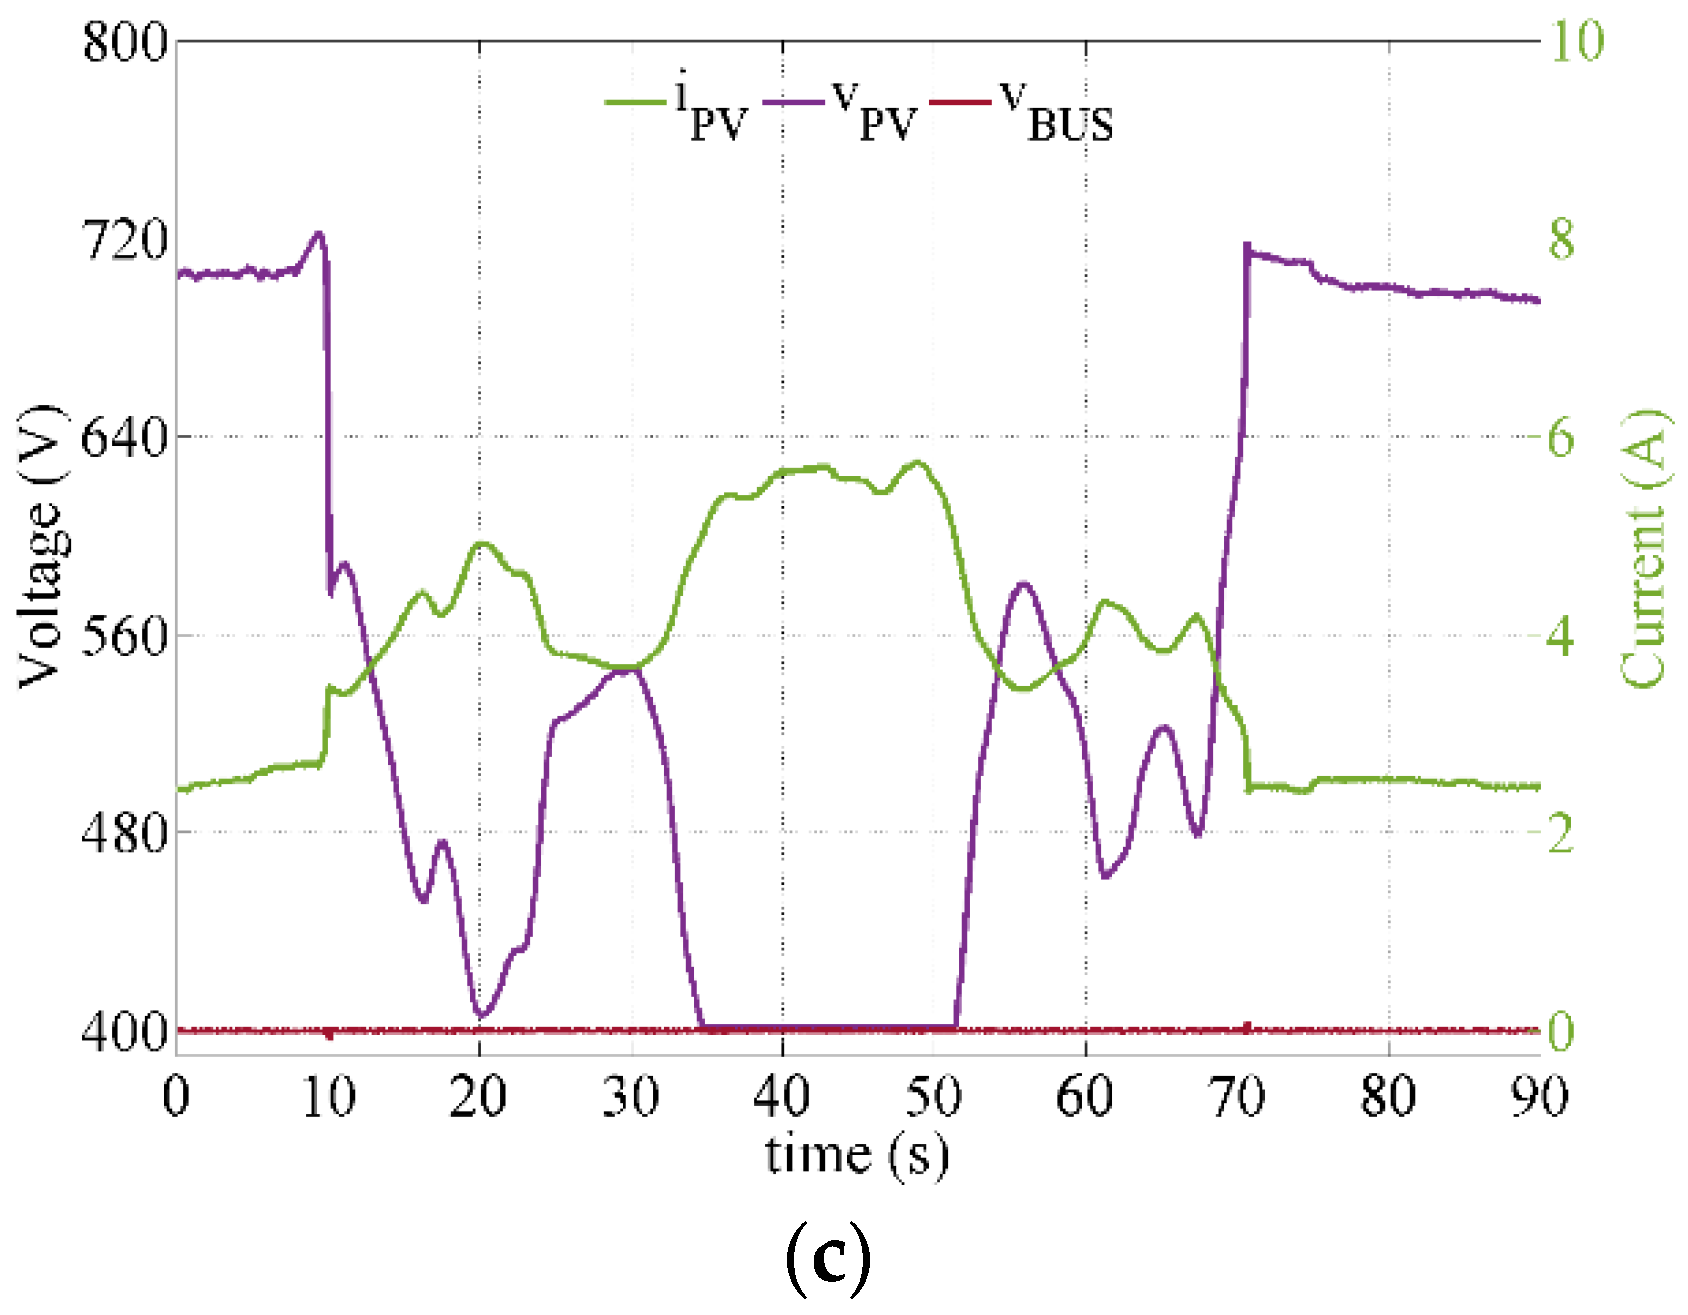
A second experimental test was carried out on 24 July 2018 for the “max” configuration where the PV power limit was also set to 2000 W. By comparing Figure 10a,b, one can observe the PV generation following the solar irradiance evolution during the MPPT operating mode. The power limiting mode is activated when the solar irradiance exceeds approximately 500 W/m2. Accordingly, in Figure 10c, the sudden increase of can be observed at the moment of the activation of the PV limiting mode. Moreover, reaches 730 V when the solar irradiance goes up to about 900 W/m2, meaning that the “max” configuration can still increase the voltage to shed even more PV power if needed. There were some oscillations within ±20 W, which can mostly be observed in power limiting mode. These oscillations are relatively small (about 1%) compared to the actual power, and therefore can be considered acceptable.
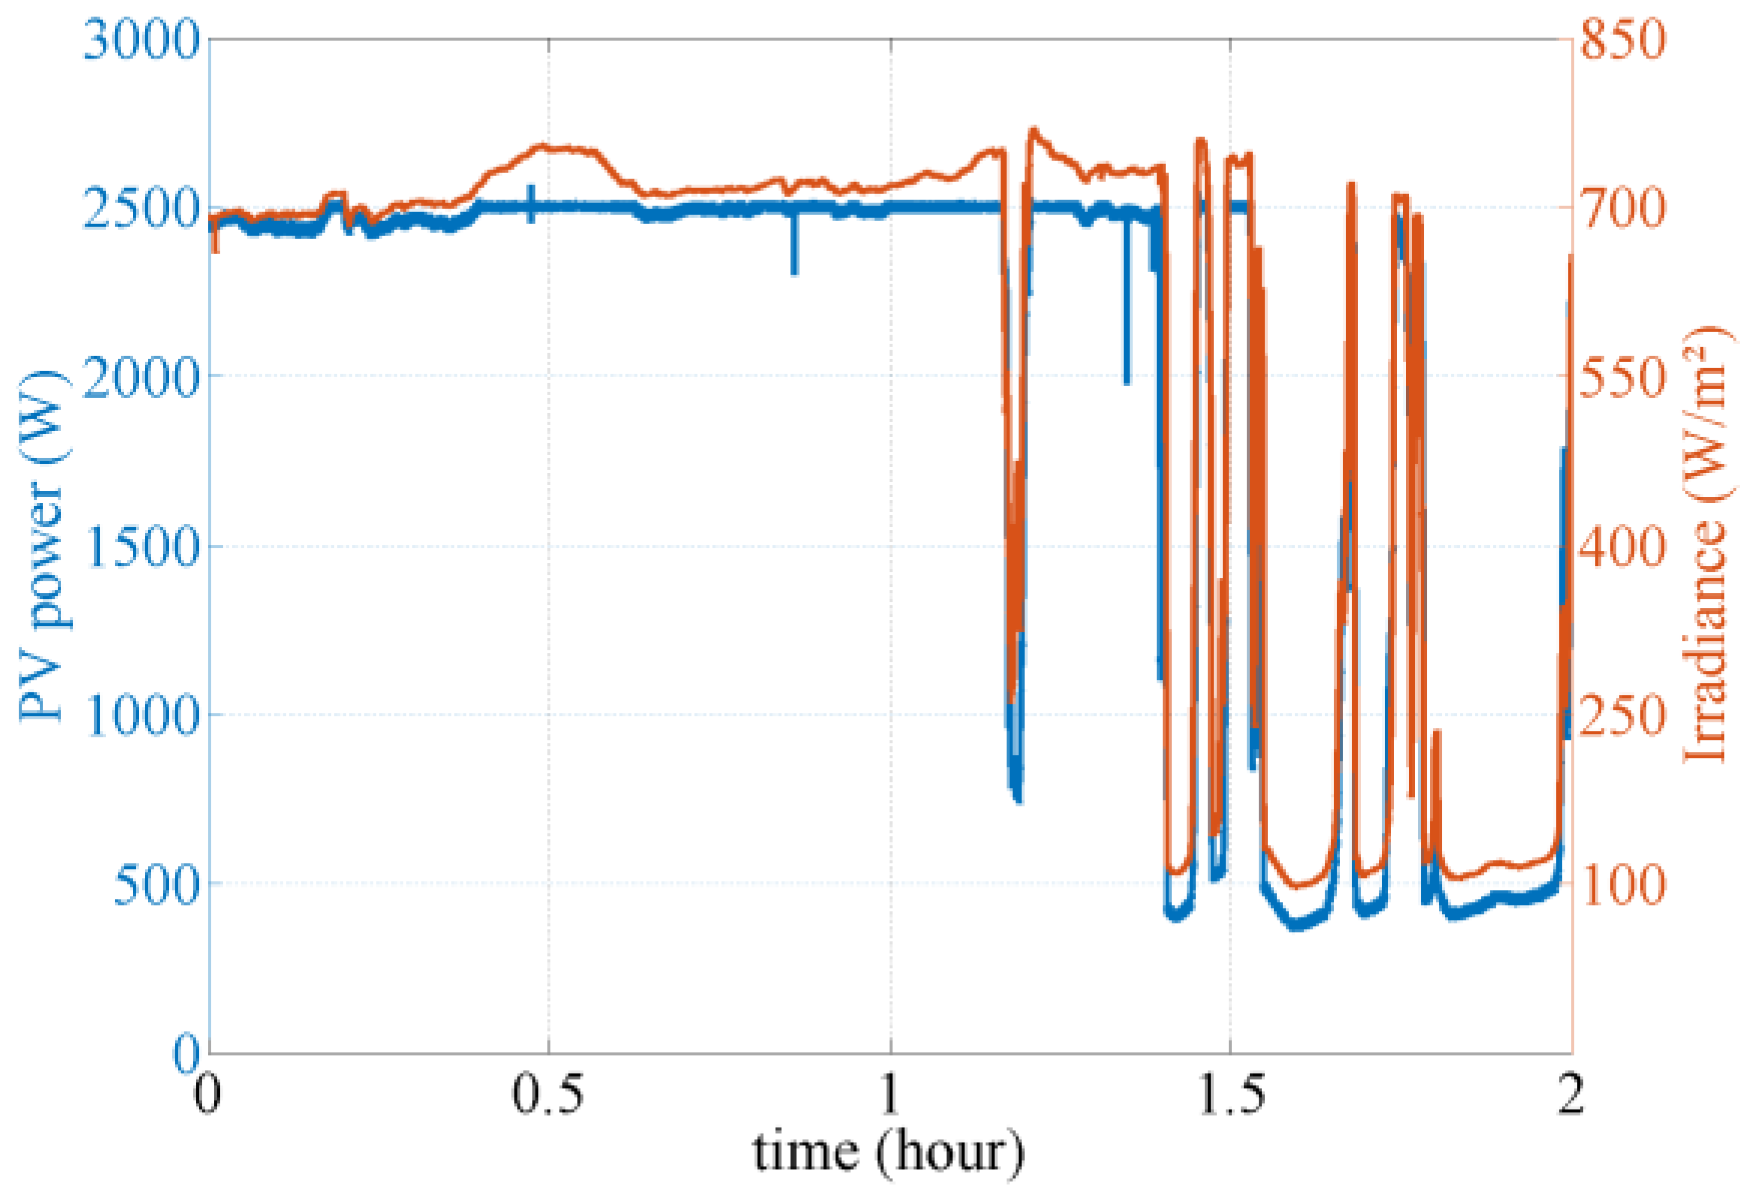
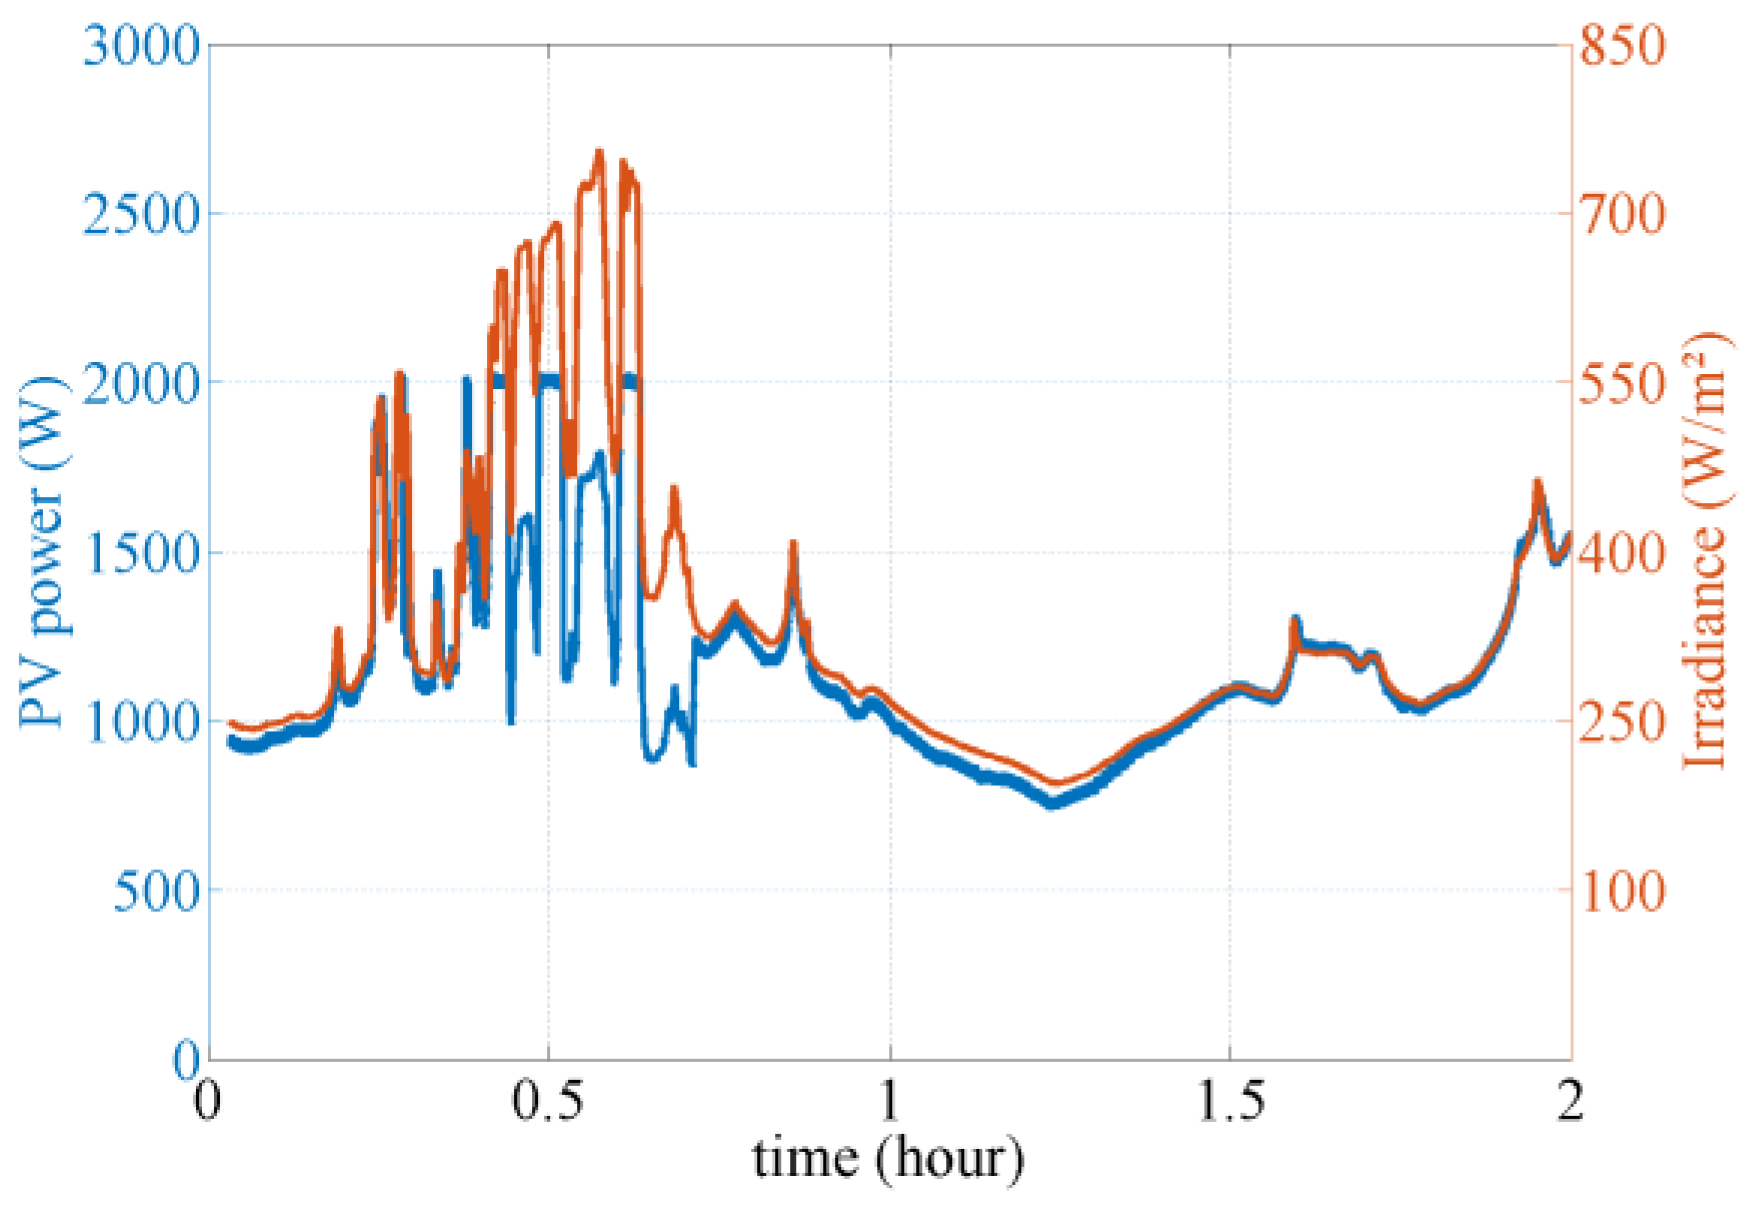
Two other tests were carried out on 19 and 20 March 2019 for 2 h, as shown in Figure 11 and Figure 12. The PV power limits were respectively 2500 W and 2000 W. By comparing PV power and solar irradiance, it can be seen that the effectiveness of both configurations was proved for daily operation. Moreover, the seamless switching between the MPPT and power limiting modes worked well without stability issues, even when the irradiance changed suddenly.
In the above tests, the dynamic performance of both configurations were validated under real circumstances. Both are able to switch between the MPPT mode and the power limiting mode, according to the given power limit. However, the “min” configuration has limited shedding capacity as stated in the previous section. In the microgrid context, failure to reach the given PV generation limit may break the power balance of the microgrid and the PV systems should generally be cut off entirely from the microgrid to prevent serious safety issues. Obviously this is a last resort and not the best option as it is not only a waste of available solar energy, but may also cause stability issues since the other sources in the microgrid may not have enough power to supply the loads without the PV sources. A simple solution is to make the capacity of the energy storage and public grid injection oversized, but that calls for greater investment in equipment. A better solution is to conceive an intelligent microgrid control, which is able to limit the PV shedding power according to the PV generation forecast and load power prediction. In this way, the excessive power can be absorbed by the energy storage and public grid connection without having to make any of the components oversized.
4.3. Energy Efficiency Analyses
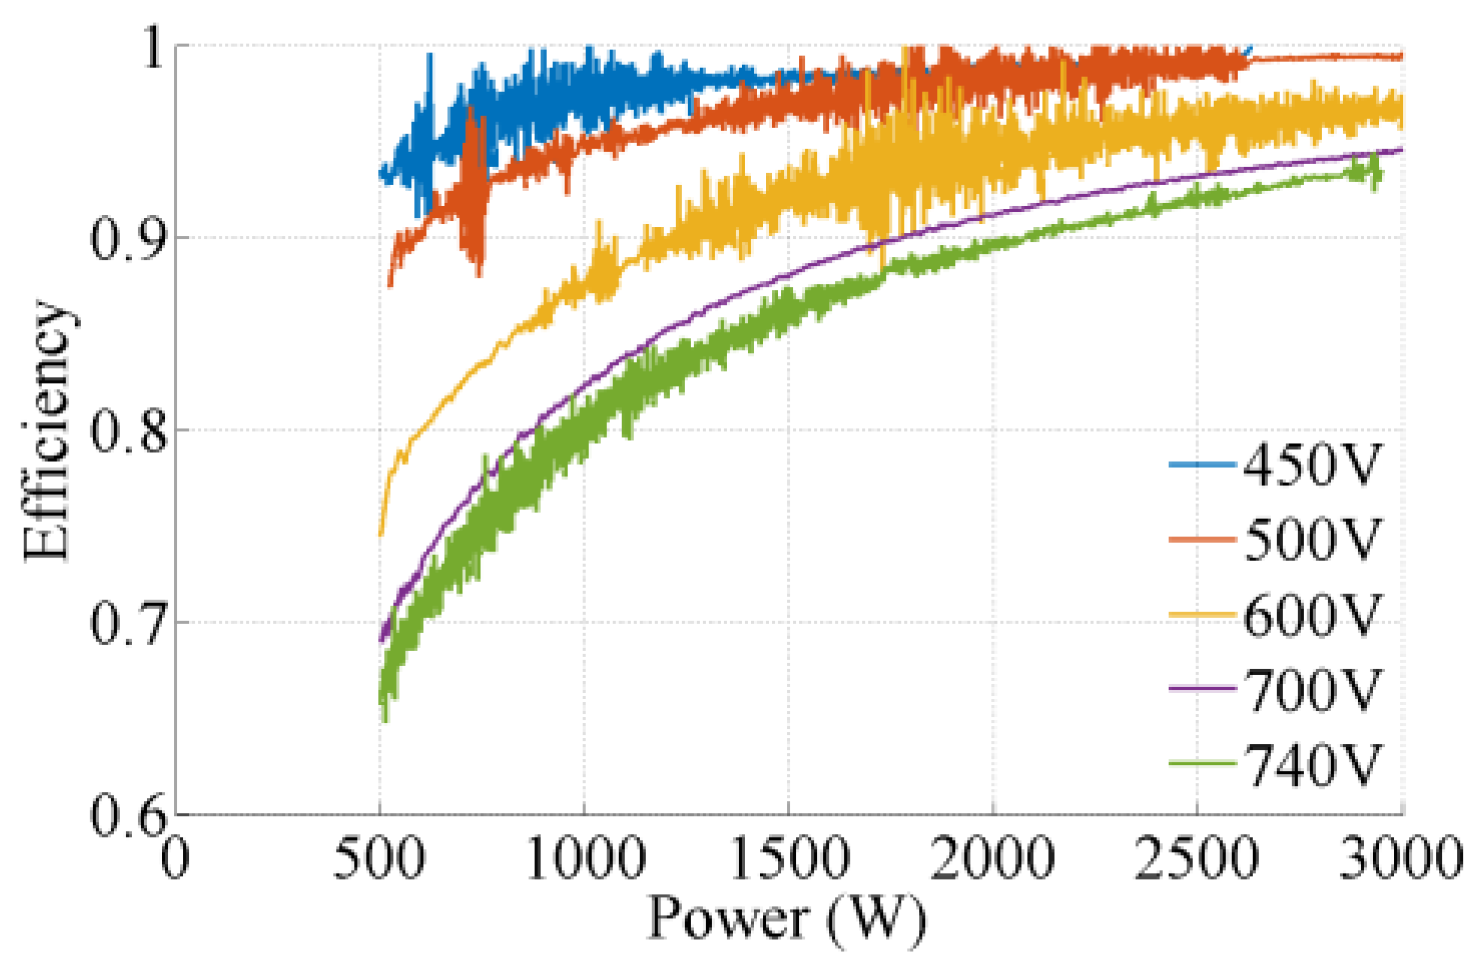
In the previous experimental results, it was proved that the “min” configuration causes the current to rise and the “max” configuration causes the voltage to rise in power limiting mode. A high current leads to high ohmic losses and a high voltage leads to high switching losses [33]. Hence, experimental tests were carried out to measure the integral energy efficiency of the PV converter at different voltages.
For this investigation the PV generator was set to work with some specific voltages. The input power of the PV converter is and the output power is the product of the DC bus voltage and the output current of the converter . Thus, the converter efficiency can be defined as . From the efficiency curves shown in Figure 13, it can be noted that all of the efficiencies increase when increases, and most importantly that the converter at the same power is more efficient when the voltage is lower. At medium power (2000 W), the efficiency at 450 V is 7% higher than that at 740 V, and this difference becomes more significant when the power is lower. This means that in regard to the buck converter, the “min” configuration, which converges at the low voltage, is favorable in the view of energy efficiency.
From the above experimental results, it can be seen that PV power shedding is feasible both by increasing and decreasing the PV voltage. Both configurations of the proposed PV control mechanism can switch seamlessly between the MPPT and the power limiting mode, but they have different power shedding capacities and thus result in different levels of efficiency.
5. Conclusions
With the aim of sustaining PV source integration in a microgrid, this work presents a simple and flexible PV power control mechanism which supports both classical MPPT and PV generation shedding. The research includes the physical constraints and energy efficiency of the power converter, in terms of PV operation in a DC microgrid. Two configurations, which increase or decrease the PV voltage while limiting the PV generation, were proposed. Experimental tests were carried out on a PV system with a buck converter and both configurations were validated. Results show that the “min” configuration can shed only 30% of PV power while the “max” configuration can shed nearly 100%. However, the former has better energy efficiency than the latter.
This fact suggests that the choice between the two configurations should be well considered. The “max” configuration can be applied in cases where the power balance capacity of the microgrid is relatively weak. The “min” configuration is more suitable when economic costs are more sensitive but an appropriate microgrid control is needed to coordinate the load consumption and PV generation in order to maintain PV shedding in a feasible range.
In conclusion, an intelligent microgrid control can be developed which integrates the proposed PV control mechanism and optimal power dispatching. In this way, PV power shedding can be planned within a feasible range and the economic benefits can be maximized.
Author Contributions
All the authors contributed equally to this research work.
Funding
This research was funded within the national research project MOBEL_CITY, selected by ADEME, in the context of the call for projects APRED 2017 (convention number #1766C0006).
Conflicts of Interest
The authors declare no conflict of interest. The funders had no role in the design of the study; in the collection, analyses, or interpretation of data; in the writing of the manuscript, or in the decision to publish the results.
References
- Comello, S.; Reichelstein, S.; Sahoo, A. The road ahead for solar PV power. Renew. Sustain. Energy Rev. 2018, 92, 744–756. [Google Scholar] [CrossRef]
- Sechilariu, M.; Locment, F.; Wang, B. Photovoltaic Electricity for Sustainable Building. Efficiency and Energy Cost Reduction for Isolated DC Microgrid. Energies 2015, 8, 7945–7967. [Google Scholar] [CrossRef] [Green Version]
- El-Baz, W.; Tzscheutschler, P.; Wagner, U. Day-ahead probabilistic PV generation forecast for buildings energy management systems. Sol. Energy 2018, 171, 478–490. [Google Scholar] [CrossRef]
- Subudhi, B.; Pradhan, R. A Comparative Study on Maximum Power Point Tracking Techniques for Photovoltaic Power Systems. IEEE Trans. Sustain. Energy 2013, 4, 89–98. [Google Scholar] [CrossRef]
- El Khateb, A.; Rahim, N.A.; Selvaraj, J.; Uddin, M.N. Fuzzy-Logic-Controller-Based SEPIC Converter for Maximum Power Point Tracking. IEEE Trans. Ind. Appl. 2014, 50, 2349–2358. [Google Scholar] [CrossRef]
- Shadmand, M.B.; Balog, R.S.; Abu-Rub, H. Model Predictive Control of PV Sources in a Smart DC Distribution System: Maximum Power Point Tracking and Droop Control. IEEE Trans. Energy Convers. 2014, 29, 913–921. [Google Scholar] [CrossRef]
- Houssamo, I.; Locment, F.; Sechilariu, M. Maximum power tracking for photovoltaic power system: Development and experimental comparison of two algorithms. Renew. Energy 2010, 35, 2381–2387. [Google Scholar] [CrossRef]
- Anzalchi, A.; Sarwat, A. Overview of technical specifications for grid-connected photovoltaic systems. Energy Convers. Manag. 2017, 152, 312–327. [Google Scholar] [CrossRef]
- Jo, J.H.; Aldeman, M.R.; Loomis, D.G. Optimum penetration of regional utility-scale renewable energy systems. Renew. Energy 2018, 118, 328–334. [Google Scholar] [CrossRef]
- Baranes, E.; Jacqmin, J.; Poudou, J.-C. Non-renewable and intermittent renewable energy sources: Friends and foes? Energy Policy 2017, 111, 58–67. [Google Scholar] [CrossRef] [Green Version]
- Honrubia-Escribano, A.; Ramirez, F.J.; Gómez-Lázaro, E.; Garcia-Villaverde, P.M.; Ruiz-Ortega, M.J.; Parra-Requena, G. Influence of solar technology in the economic performance of PV power plants in Europe. A comprehensive analysis. Renew. Sustain. Energy Rev. 2018, 82, 488–501. [Google Scholar] [CrossRef]
- Rodriguez-Diaz, E.; Vasquez, J.C.; Guerrero, J.M. Intelligent DC Homes in Future Sustainable Energy Systems: When efficiency and intelligence work together. IEEE Consum. Electron. Mag. 2016, 5, 74–80. [Google Scholar] [CrossRef]
- Sechilariu, M.; Wang, B.; Locment, F. Building-integrated microgrid: Advanced local energy management for forthcoming smart power grid communication. Energy Build. 2013, 59, 236–243. [Google Scholar] [CrossRef]
- Sechilariu, M.; Wang, B.C.; Locment, F. Supervision control for optimal energy cost management in DC microgrid: Design and simulation. Int. J. Electr. Power Energy Syst. 2014, 58, 140–149. [Google Scholar] [CrossRef]
- Castillo-Cagigal, M.; Caamaño-Martín, E.; Matallanas, E.; Masa-Bote, D.; Gutiérrez, A.; Monasterio-Huelin, F.; Jiménez-Leube, J. PV self-consumption optimization with storage and Active DSM for the residential sector. Sol. Energy 2011, 85, 2338–2348. [Google Scholar] [CrossRef] [Green Version]
- Yu, H.J.J. A prospective economic assessment of residential PV self-consumption with batteries and its systemic effects: The French case in 2030. Energy Policy 2018, 113, 673–687. [Google Scholar] [CrossRef]
- Lotfi, H.; Khodaei, A. AC Versus DC Microgrid Planning. IEEE Trans. Smart Grid 2017, 8, 296–304. [Google Scholar] [CrossRef]
- Boscaino, V.; Guerrero, J.M.; Ciornei, I.; Meng, L.; Riva Sanseverino, E.; Zizzo, G. Online optimization of a multi-conversion-level DC home microgrid for system efficiency enhancement. Sustain. Cities Soc. 2017, 35, 417–429. [Google Scholar] [CrossRef]
- Wu, H.; Sechilariu, M.; Locment, F. Influence of Dynamic Efficiency in the DC Microgrid Power Balance. Energies 2017, 10, 1563. [Google Scholar] [CrossRef]
- Yan, R.; Saha, T.K.; Modi, N.; Masood, N.-A.; Mosadeghy, M. The combined effects of high penetration of wind and PV on power system frequency response. Appl. Energy 2015, 145, 320–330. [Google Scholar] [CrossRef]
- Sechilariu, M.; Wang, B.; Locment, F. Building Integrated Photovoltaic System With Energy Storage and Smart Grid Communication. IEEE Trans. Ind. Electron. 2013, 60, 1607–1618. [Google Scholar] [CrossRef]
- Guichi, A.; Talha, A.; Berkouk, E.M.; Mekhilef, S.; Gassab, S. A new method for intermediate power point tracking for PV generator under partially shaded conditions in hybrid system. Sol. Energy 2018, 170, 974–987. [Google Scholar] [CrossRef]
- Franco, F.D.; Vu, T.V.; Gonsulin, D.; Vahedi, H.; Edrington, C.S. Enhanced performance of PV power control using model predictive control. Sol. Energy 2017, 158, 679–686. [Google Scholar] [CrossRef]
- Reddy, M.K.K.; Sarkar, V. LPPT control of a photovoltaic system against sudden drop of irradiance. In Proceedings of the 6th International Conference on Computer Applications in Electrical Engineering-Recent Advances (CERA), Roorkee, India, 5–7 October 2017; pp. 562–567. [Google Scholar]
- Wang, B.; Houssamo, I.; Sechilariu, M.; Locment, F. A simple PV constrained production control strategy. In Proceedings of the 21st IEEE International Symposium on Industrial Electronics, Hangzhou, China, 28–31 May 2012; pp. 969–974. [Google Scholar]
- Li, Y.; Xu, Z.; Xiong, L.; Song, G.; Zhang, J.; Qi, D.; Yang, H. A cascading power sharing control for microgrid embedded with wind and solar generation. Renew. Energy 2019, 132, 846–860. [Google Scholar] [CrossRef]
- Choudar, A.; Boukhetala, D.; Barkat, S.; Brucker, J.-M. A local energy management of a hybrid PV-storage based distributed generation for microgrids. Energy Convers. Manag. 2015, 90, 21–33. [Google Scholar] [CrossRef]
- Ahmed, A.; Ran, L.; Moon, S.; Park, J.-H. A Fast PV Power Tracking Control Algorithm with Reduced Power Mode. IEEE Trans. Energy Convers. 2013, 28, 565–575. [Google Scholar] [CrossRef]
- Mahmood, H.; Michaelson, D.; Jiang, J. Decentralized Power Management of a PV/Battery Hybrid Unit in a Droop-Controlled Islanded Microgrid. IEEE Trans. Power Electron. 2015, 30, 7215–7229. [Google Scholar] [CrossRef]
- Sangwongwanich, A.; Yang, Y.; Blaabjerg, F.; Wang, H. Benchmarking of Constant Power Generation Strategies for Single-Phase Grid-Connected Photovoltaic Systems. IEEE Trans. Ind. Appl. 2018, 54, 447–457. [Google Scholar] [CrossRef] [Green Version]
- Wu, H.; Sechilariu, M.; Locment, F. Impact of power converters’ efficiency on building-integrated microgrid. In Proceedings of the 17th European Conference on Power Electronics and Applications (EPE’15 ECCE-Europe), Geneva, Switzerland, 8–10 September 2015; pp. 1–10. [Google Scholar]
- Vanassche, P.; Triphase, N.V. Shaping Dynamic Response Using Virtual Circuit Control. Available online: https://triphase.com/img/support/37/TriphaseHPC-VirtualCircuitControl.pdf (accessed on 17 March 2019).
- Lana, A.; Mattsson, A.; Nuutinen, P.; Peltoniemi, P.; Kaipia, T.; Kosonen, A.; Aarniovuori, L.; Partanen, J. On Low-Voltage DC Network Customer-End Inverter Energy Efficiency. IEEE Trans. Smart Grid 2014, 5, 2709–2717. [Google Scholar] [CrossRef]
Figure 1.
Power-versus-voltage (P-V) characteristic of a photovoltaic (PV) panel.

Figure 2.
Simplified presentation of a DC microgrid.

Figure 3.
The PV power limiting controller.

Figure 4.
Seamless switching PV control topology in “max” configuration.

Figure 5.
Seamless switching PV control topology of the “min” configuration.

Figure 6.
PV generator and control room of the technological platform.

Figure 7.
PV subsystem scheme.

Figure 8.
Static power-versus-voltage characteristic of the PV generator.

Figure 9.
Experimental validation of the “min” configuration: (a) solar irradiance and PV panel temperature evolution; (b) real PV power generation and PV power limitation; (c) PV output voltage and current with bus voltage.
Figure 9.
Experimental validation of the “min” configuration: (a) solar irradiance and PV panel temperature evolution; (b) real PV power generation and PV power limitation; (c) PV output voltage and current with bus voltage.


Figure 10.
Experimental validation of the “max” configuration: (a) solar irradiance and PV panel temperature evolution; (b) real PV power generation and PV power limitation; (c) PV output voltage and current with bus voltage.
Figure 10.
Experimental validation of the “max” configuration: (a) solar irradiance and PV panel temperature evolution; (b) real PV power generation and PV power limitation; (c) PV output voltage and current with bus voltage.

Figure 11.
Two-hour experimental test of the “min” configuration.

Figure 12.
Two-hour experimental test of the “max” configuration.

Figure 13.
Energy efficiency comparison of the power converter under different values of .


Table 1.
PV subsystem parameter values.
| Parameter | Value |
|---|---|
| Number of PV panels SunPower SPR-X21-345 | 12 |
| Maximum power point (MPP) voltage for each panel | 57.3 V |
| MPP current for each panel | 6.02 A |
| Open circuit voltage for each panel | 68.2 V |
| Short circuit current for each panel | 6.39 A |
| LCL filter sizing | L1 = 930 μH, C = 10 μF, L2 = 850 μH |
| Switching frequency | 14 kHz |
Table 2.
Parameters for the flexible PV controller.
| Parameter | Value |
|---|---|
| MPPT perturbation step size | 25 mV |
| MPPT perturbation frequency | 1 kHz |
| PV limited power control parameters | Kp = −0.01 in case of “max” configuration Kp = +0.01 in case of “min” configuration |
| Ki = 500 | |
| Kc = 100 | |
| Data log sample frequency | 100 Hz |
© 2019 by the authors. Licensee MDPI, Basel, Switzerland. This article is an open access article distributed under the terms and conditions of the Creative Commons Attribution (CC BY) license (http://creativecommons.org/licenses/by/4.0/).
Share and Cite
MDPI and ACS Style
Wu, H.; Locment, F.; Sechilariu, M. Experimental Implementation of a Flexible PV Power Control Mechanism in a DC Microgrid. Energies 2019, 12, 1233. https://doi.org/10.3390/en12071233
AMA Style
Wu H, Locment F, Sechilariu M. Experimental Implementation of a Flexible PV Power Control Mechanism in a DC Microgrid. Energies. 2019; 12(7):1233. https://doi.org/10.3390/en12071233
Chicago/Turabian StyleWu, Hongwei, Fabrice Locment, and Manuela Sechilariu. 2019. "Experimental Implementation of a Flexible PV Power Control Mechanism in a DC Microgrid" Energies 12, no. 7: 1233. https://doi.org/10.3390/en12071233
Note that from the first issue of 2016, this journal uses article numbers instead of page numbers. See further details here.