Improving the Thermal Efficiency of the Homogeneous Charge Compression Ignition Engine by Using Various Combustion Patterns

1
Department of Vehicle Engineering, National Taipei University of Technology, Taipei 10608, Taiwan
2
Department of Mechanical Engineering, Thapar University, Patiala 147001, India
*
Author to whom correspondence should be addressed.
Energies 2018, 11(11), 3002; https://doi.org/10.3390/en11113002
Submission received: 17 October 2018
/
Revised: 24 October 2018
/
Accepted: 30 October 2018
/
Published: 1 November 2018
(This article belongs to the Special Issue Internal Combustion Engines 2018)
Abstract
:The efficiency of an internal combustion engine (ICE) is essential for automobiles and motorcycles. Several studies have demonstrated that the homogeneous charge compression ignition (HCCI) is a promising technology for realizing engines with high efficiency and low emissions. This study investigated the combustion characteristics of the HCCI using a 125 cc motorcycle engine with n-heptane fuel. The engine performance, combustion characteristics, and thermal efficiency were analyzed from experimental data. The results revealed that a leaner air–fuel mixture led to higher engine efficiency and output. The improvement of engine output is contradictory to the general trend. Energy balance analysis revealed that lower heat loss, due to the low cylinder gas temperature of lean combustion, contributed to higher efficiency. A double-Wiebe function provided excellent simulation of the mass fraction burned (MFB) of the HCCI. Air cycle simulation with the MFB, provided by the double-Wiebe function, was executed to investigate this phenomenon. The results indicated that a better combustion pattern led to higher thermal efficiency, and thus the engine output and thermal efficiency do not require a fast combustion rate in an HCCI engine. A better combustion pattern can be achieved by adjusting air–fuel ratio (AFR) and the rates of dual fuel and exhaust gas recirculation (EGR).
1. Introduction
Global warming, urban pollution, and the energy crisis are environmental concerns. Internal combustion engines (ICEs) are the mainstream power source of automobiles and motorcycles, but they consume a considerable amount of fuel and produce pollutants. Therefore, energy saving and emission reduction have become critical research topics. Carbon dioxide (CO2), a major greenhouse gas, is directly related to vehicular fuel consumption. Thus, the improvement of ICE efficiency can not only reduce energy consumption but also decrease the impact of CO2 emissions on global warming.
In a recent trend, vehicle electrification technologies are being developed for energy saving and emission reduction. They include hybrid electric vehicles (HEVs), plug-in HEVs, range-extended electric vehicles, and battery electric vehicles. However, ICE remains prevalent because the charging infrastructure is yet to be widely implemented and the battery costs remain prohibitively high. In future, the presence of ICE is expected in most powertrain configurations, albeit with varying degrees of electrification [1].
Many technologies have been developed for improving the efficiency of engines, such as engine downsizing [2,3,4], the Atkinson or Miller cycle [4,5,6], gasoline direct injection (GDI) [7,8,9], the homogeneous charge compression ignition (HCCI) [10,11,12,13,14], reduction of exhaust energy loss [15,16] or heat loss [17,18,19,20], electrical or precisely controlled cooling systems [20,21,22], and combustion phase control [23]. Cesare et al. [1] reported that engine downsizing concepts, such as turbocharging combined with GDI, have contributed to the recent improvements of ICEs. Zhao and Xu [5] proposed a coupled MATLAB genetic algorithm and 1-D GT-Power simulation model for the Atkinson cycle engine, which resulted in an improved fuel economy of up to 7.67%. Spicher et al. [9] reported that the GDI engine provides efficiency similar to that of compression ignition engines, at part-load and wide-open throttle operations with a stratified lean mixture. An HCCI engine has a combination of conventional spark-ignition (SI) engine and diesel engine characteristics. Its fuel-air mixture is premixed, whereas its combustion is initiated by autoignition. Such combustion characteristics produce high efficiency and very low emissions of NOx and soot. Therefore, HCCI is an advanced combustion concept for ICEs that has attracted global attention in recent years [10]. Legros et al. [16] compared various waste heat treatment technologies, such as Rankine cycles, thermoelectric generators, and turbo compounding, and achieved a fuel reduction of up to 6%. Zhang et al. [20] proposed a dynamic control of cooling systems and achieved low heat loss. Gao et al. [23] used the in-cylinder pressure sensor to calculate the combustion phase and indicated mean effective pressure (IMEP) for maximum fuel efficiency.
To investigate the thermal efficiency of the ICE, the fuel energy can be considered to be constituted of roughly three equal parts: useful work, heat transfer loss, and exhaust energy loss. Several methods have been proposed for the reduction of heat losses and the recovery of the exhaust energy [15,16,17,18,19,20]. However, most of the proposed methods have drawbacks. For instance, the use of ceramic surfaces decreases heat loss to the coolant, but reduces the volumetric efficiency [19] and increases the exhaust energy [24]. The exhaust energy recovery requires several additional devices [15,16], which increase the cost and complexity of the engine and cannot be used in a motorcycle.
Studies have indicated that HCCI engines can reduce heat loss due to a low combustion temperature and short combustion duration [11,12,13], resulting in a low exhaust temperature and hence more power [11]. Therefore, the use of HCCI engines has the potential to reduce both heat transfer losses and exhaust energy losses.
HCCI engines have been widely investigated in recent years. Some literature reviews [25,26] have mentioned that a Mazda-developed engine with the spark plug control compression ignition (SPCCI) achieves a high brake thermal efficiency (approximately 44%). SPCCI is an HCCI system that uses high pressure injection with a high compression ratio coupled with spark, which ensures precise combustion. Nevertheless, HCCI poses some unresolved challenges, including combustion phase control, narrow operating range, cold start, high noise, and homogeneous charge preparation [27]. The most popular approaches for combustion phase control are exhaust gas recirculation (EGR) and the use of dual fuel [28,29,30,31]. Dual fuel involves a combination of diesel- and gasoline-like fuels. Diesel-like fuels, such as n-heptane, kerosene, dimethyl ether, diethyl ether, and biodiesel, have a high cetane number and can autoignite easily. By contrast, gasoline-like fuels, such as isooctane, ethanol, methanol, liquefied petroleum gas, and butanol, have a high-octane number and cannot autoignite easily. Gasoline-like fuels can be used as ignition suppressors, whereas diesel-like fuels function as ignition improvers [31]. The ratio of these two types of fuels has a significant effect on combustion phasing.
Combustion phasing, including CA50 and combustion duration, affect the energy distribution. CA50 is the crank angle (CA) at which the mass fraction burned (MFB) is 50%. An early CA50 increases the in-cylinder temperature and thus increases the heat transfer [24], whereas a late CA50 reduces low heat transfer loss and increases the cycle-to-cycle variation [29]. High efficiency of the HCCI engine can be achieved by using a suitable combustion phase.
This study investigated the thermal efficiency of HCCI in a small gasoline engine by using n-heptane. The engine performance, combustion characteristics, heat transfer, and thermal efficiency were analyzed from the experimental data. The double-Wiebe function [32] was applied to predict the MFB. The air-standard cycle simulation combined with the double-Wiebe function was presented to deduce a better combustion pattern for high engine efficiency.
2. Methodology
2.1. Experimental Setup
A 125 cc, single-cylinder, air-cooled SI engine was retrofitted for HCCI operation. The engine was a commercial motorcycle engine (SYM, Taipei, Taiwan) with an electronic fuel injection system and a compression ratio of 10.5. Detailed engine specifications are listed in Table 1.
n-Heptane was used for HCCI operation because of its autoignition property. Fuel properties are listed in Table 2. The autoignition temperature of n-heptane was 488 K—much lower than that of gasoline (553–729 K). The cetane number of n-heptane was 60—higher than that of diesel for motor vehicles (i.e., 40–60).
n-Heptane is a diesel-like fuel, which can easily autoignite and which does not require a high compression ratio, intake heating, or retention of high-level hot-residual gas in the cylinder. The combustion of n-heptane is characterized by a two-stage ignition process [33]. The main combustion occurs in second-stage combustion.
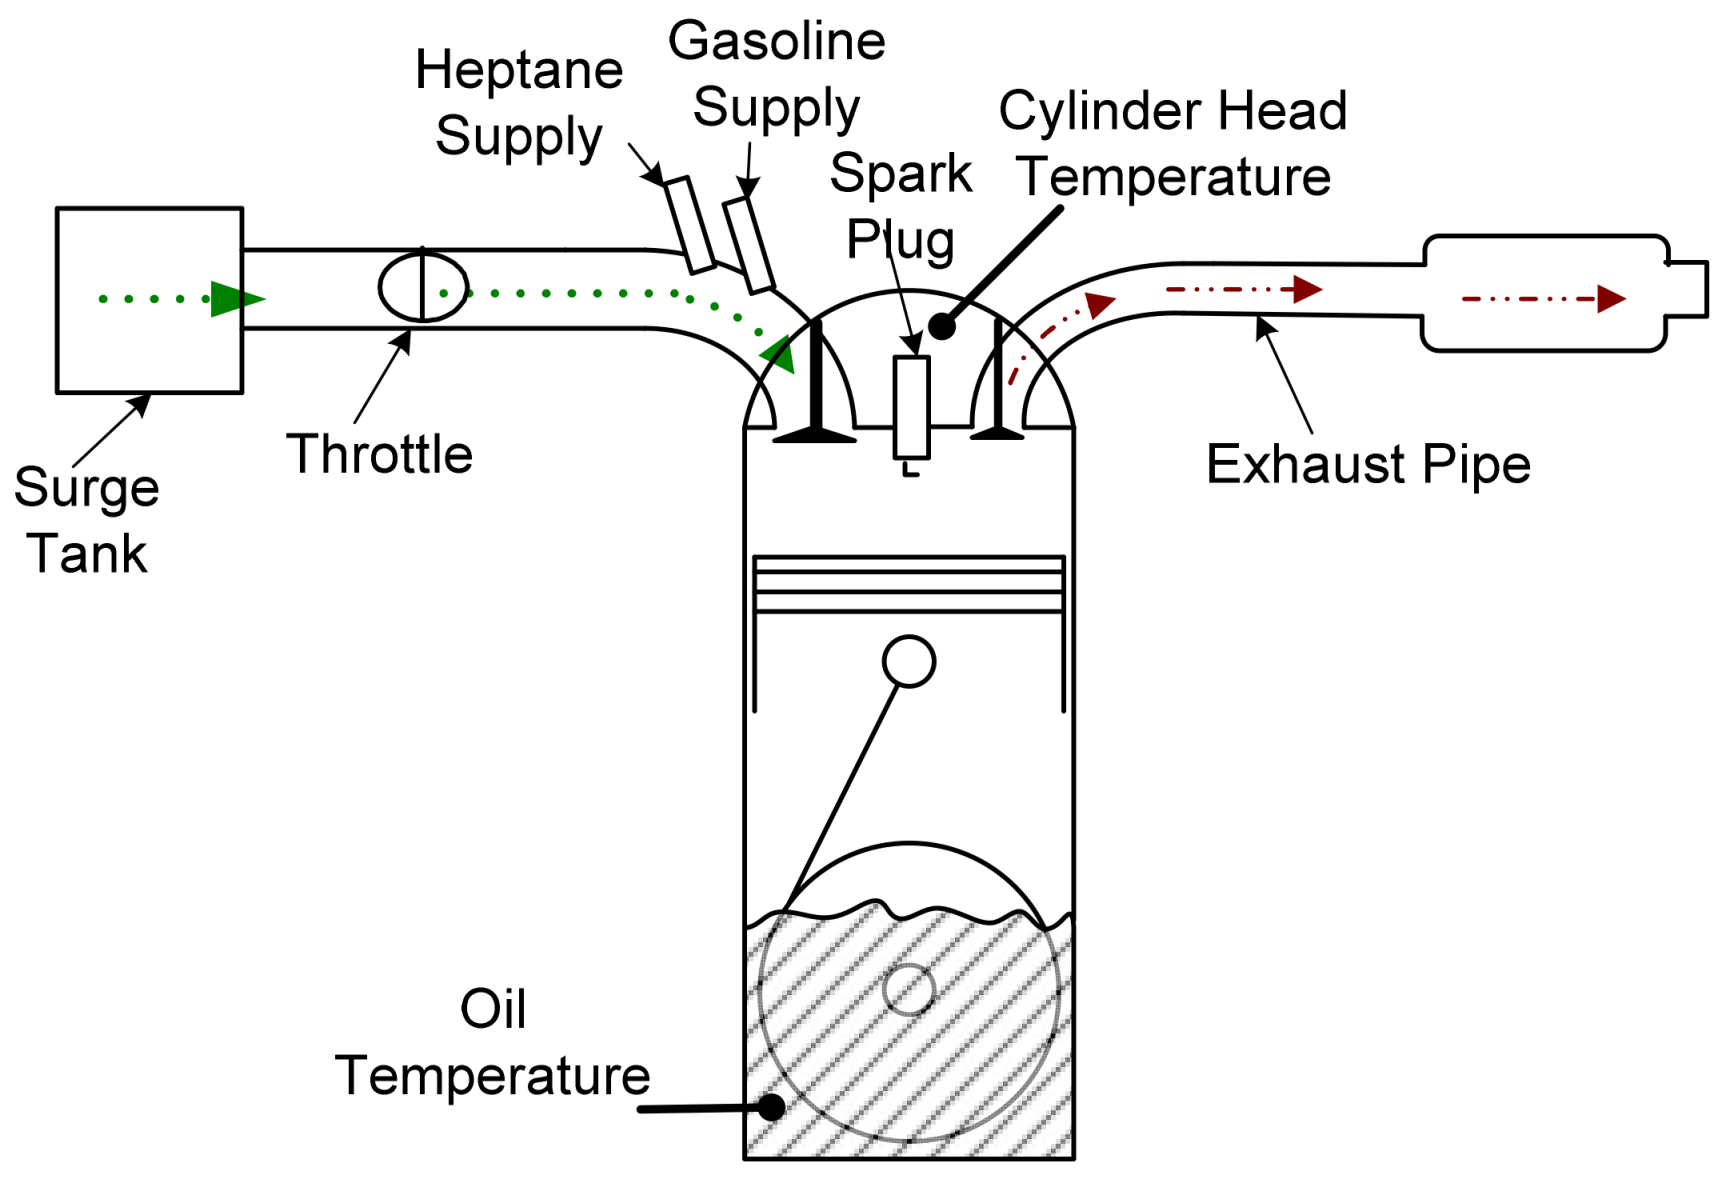
The configuration of the proposed HCCI engine is depicted in Figure 1. The original fuel and ignition systems of the SI engine were retained for starting the engine. The additional HCCI fuel (n-heptane) supplying system was attached to the target engine.
For the engine test, an eddy-current engine dynamometer (FE150-S, Borghi & Saveri S.R.L., Bologna, Italy) was used to measure the engine brake torque and speed. The gasoline flow rate was measured using a mass burette flow detector (FX-1110, Ono Sokki, Yokohama, Japan). The exhaust emissions of carbon monoxide (CO), hydrocarbon (HC), nitric oxide (NO), CO2, oxygen, and AFR were measured using an emission analyzer (MEXA-584L, Horiba, Kyoto, Japan). K-type thermocouples were installed on the engine for measuring the temperatures of the intake air, exhaust gas, cylinder head, and lube oil.
A piezoelectric pressure transducer (Kistler 6051B, Winterthur, Switzerland) coupled to a charge amplifier (Kistler 5018A) was used for recording instantaneous in-cylinder gas pressure. A shaft encoder (BEI H25, Goleta, CA, USA) was used to detect the CA. The pressure signal was transmitted to a data acquisition system (AVL IndiCom 619, Graz, Austria). The cylinder pressure was recorded for every 1° CA for 100 cycles. The pressure data can be used to analyze engine combustion parameters, such as the in-cylinder gas temperature, coefficient of variation (COV), and the heat release rate (HRR).
Because the target engine was retrofitted for the HCCI operation, the spark timing (for SI engine starting), gasoline injection, and n-heptane injection were manually controlled using a control system (MotoHawk ECU 555-80, Woodward, Inc., Fort Collins, CO, USA). MotoHawk enables the user to automatically generate machine codes from Simulink blocks and operate control hardware in real time. The fuel rate was adjusted by changing the pulse width of the fuel injector.
Temperature is the most critical factor in HCCI combustion [34]. In this study, cylinder head and oil temperatures were maintained above 120 °C and 65 °C, respectively, for stable HCCI operation [35]. The engine was started with the original SI system and warmed up to achieve these temperatures.
The target engine was started using the original ignition and fuel systems of an SI. When the cylinder head and oil temperatures reached 120 °C and 65 °C, respectively, the engine switched to HCCI mode by interrupting the ignition system and opening the throttle further, with the simultaneous adjustment of the fuel supply for the stable HCCI operation. The 2000 rpm mode and the 40% throttle opening position provided the most stable engine operation. At each test point, the fuel injection pulse width was adjusted to set various AFRs under COV < 5%.
2.2. Combustion Parameters Calculation
The combustion parameters, such as IMEP, COV, indicated thermal efficiency, combustion efficiency, cylinder gas temperature, HRR, and MFB, were used for studying the engine combustion characteristics.
The IMEP in this study was calculated during compression and expansion strokes and was thus expressed as:
where integration starts at the start of the compression stroke (−180 deg. CA) and ends at the end of the expansion stroke (180 deg. CA); Vd is the displacement volume.
The COV was expressed as:
where IMEPstd and IMEPavg are the standard deviation of IMEP and average IMEP in 100 cycles, respectively.
The indicated thermal efficiency was defined as the network output divided by the amount of heat added per cycle, expressed as:
where mf is the fuel mass supplied per cycle, QLHV is the low heating value of the fuel, and ηc is the combustion efficiency.
The combustion efficiency ηc was calculated using Equations (4) and (5) [37]:
where [ ] represents exhaust species concentration in parts per million, H2 is hydrogen, MW is the molecular weight of the fuel per carbon atom, and y is the ratio of hydrogen and carbon atoms in the fuel.
The in-cylinder gas temperature was obtained using the state equation of ideal gas. The HRR equation can be derived from the first law of thermodynamics and was thus expressed as:
where θ is the CA, dQhr/dθ is the HRR, dQht/dθ is the heat transfer rate between cylinder gas and the wall, and γ is the specific heat ratio of cylinder gas.
The specific heat ratio γ is a function of temperature. In the combustion and expansion processes, γ can be obtained using the following equation [38]:
where T is the cylinder gas temperature in K.
The heat transfer rate (dQht/dθ) between the cylinder gas and the cylinder walls was calculated using the heat transfer model for small-scale engines proposed by Wu et al. [39]:
where h is the heat transfer coefficient (Equation (9)), A is the combustion chamber surface area, Tg is the temperature of cylinder gas, and Tw is the temperature of cylinder walls; an empirical equation proposed previously [39].
The MFB at any CA is calculated from HRR and expressed as:
2.3. Air Cycle Simulation
The air-standard-Otto cycle is an easy tool for the analysis of thermal efficiency, which assumes a closed system containing standard air and four processes: isentropic compression, constant volume heat input, isentropic expansion, and constant volume heat output. In this study, the heat input was calculated using the double-Wiebe function (Equation (18)). The cylinder pressure, cylinder temperature, maximum rate of pressure rise (MRPR), IMEP, indicated thermal efficiency, heat input, and heat loss were calculated.
The starting point of the cycle was at the bottom dead center of the compression stroke. The state at the beginning of compression was P = 1.013 bar, T = 298 K, and V = 137.8 cc. The compression process was polytropic, with a polytropic index of 1.3 (rather than 1.4 of the isentropic process). It was expressed as:
After the start of combustion, the cylinder pressure was expressed as Equation (14), rearranged from Equation (6):
The rate of heat input was calculated as:
where mf is the fuel mass supplied per cycle (g), QLHV is the low heating value of fuel (J/g), xb is the MFB, ma is the air mass supplied per cycle (g), and dxb/dθ is the rate of heat input as expressed in Equations (19)–(21).
3. Results and Discussion
The experimental study of HCCI in a motorcycle engine with n-heptane fuel was conducted with regards to engine performance and combustion characteristics. Subsequently, the result of air cycle simulation was performed.
3.1. Engine Performance
HCCI was operated on a conventional motorcycle engine without major modifications. The operation condition was set at 2000 rpm, 40% throttle opening position with AFRs of 21.1, 22.1, 23.1, 24.1, and 24.5 for stable combustion.
In general, a leaner air–fuel mixture results in lower torque output. However, in this experiment, both IMEP and BMEP (brake mean effective pressure) increased with the increase in AFR (Figure 2a). This was a compound phenomenon of the engine speed, intake air mass, AFR, and fuel property. The overall effect of these factors was on the combustion pattern. The IMEP calculation was based on the integration of P·dV. In these four cases of P–V diagrams, the higher AFR resulted in a higher value of P·dV integration. This was contradictory to the general trend, because such kind of P–V diagram was a special case, which was produced by a special combustion pattern. Moreover, with an increase in AFR, indicated thermal efficiency increased and heat loss ratio decreased (Figure 2b). The main cause of the higher efficiency was the combination of combustion pattern and low heat transfer loss. The heat transfer loss was proportional to the difference of cylinder gas temperature and wall temperature, as shown in Equation (8). The leaner mixture produces lower cylinder gas temperature, and hence causes lower heat transfer loss. The maximum cylinder gas temperature decreased with an increase in AFR (Figure 3). The heat transfer loss per cycle divided by the heat input per cycle is called heat loss ratio. The summation of thermal efficiencies and heat loss ratios for various AFRs was approximately 56% (Figure 2b). That means the summation of work output and heat transfer loss was similar for different AFRs. As AFR increased from 22.1 to 24.5, the IMEP increased 15% and the indicated thermal efficiency increased 27%.
The exhaust emissions of CO, HC, and NO are depicted with brake-specific emissions (Figure 4). Brake-specific CO (BSCO) was small because of a lean burn. Brake-specific HC (BSHC) was relatively high, because of the low combustion temperature. Brake-specific NO (BSNO) dramatically decreased with an increase in AFR because of the decreased combustion temperature. In general, when the combustion temperature is lower than 1800 K, NO emission is low [40]. The maximum cylinder gas temperature of AFR 24.5 was 1851 K, which was close to 1800 K.
3.2. Combustion Characteristics
The cylinder gas pressure is illustrated in Figure 5a. The rate of cylinder pressure rise was sharp near the top dead center (TDC) for AFRs 22.1 and 23.1. As the mixture became leaner, the cylinder pressure rise rate and the peak pressure decreased. The timing of the maximum pressure was delayed with increasing AFR. The cylinder gas temperature is shown in Figure 5b. The peak temperature was approximately 2000 K for the AFRs of 22.1–24.1, and was close to 1800 K for the AFR of 24.5.
Figure 6a demonstrates that the start of combustion was delayed and the combustion rate decreased with an increase in AFR. Two-stage ignition was observed in Figure 6a because n-heptane is a diesel-like fuel. The first stage of ignition is the result of cool-combustion chemistry and negative temperature coefficient behavior [33]. The HRR of the first-stage ignition decreased after it achieved its maximum value. The temperature of maximum HRR of the first-stage ignition ranged from 714 K to 726 K (Table 4). Figure 6b shows that the MFB curve of the HCCI had a pattern different from that of the conventional SI engine, which can be expressed as a single-Wiebe function.
The factors affecting combustion includes pressure- and burn rate-related parameters. The burn rate-related parameters are illustrated in Figure 7. CA50 was defined as the CA after TDC at which the MFB was 50%. The definition of CA10 and CA90 was similar to that of CA50. MHRR1 and MHRR2 were the maximum HRR at first- and second-stage combustion, respectively. The beginning of the increase in HRR indicated the start of combustion. θ01 and θ02 marked the start of combustion in the first- and second-stage combustion, respectively.
Detailed combustion parameters are listed in Table 4. For a conventional SI engine with the best torque, the maximum pressure occurs at approximately 16° aTDC [41] (p. 375). In this study, the CA of maximum pressure varied from 5° aTDC to 22° aTDC. The relationship between the engine torque and the timing of the maximum pressure in the HCCI was more complex than that in the SI engine. The root cause was the absence of the forced trigger of ignition in the HCCI engine. The COV and MRPR decreased with an increase in AFR. The increased AFR prolonged the burn duration and combustion phase; in other words, the CA of MHHR2 was large (Table 4). If combustion occurred instantaneously at TDC, the MRPR will be extremely high.
The variations in MHRR1, and the temperature at which the MHRR1 occurred with regard to AFR, were small (Table 4). During first-stage combustion, when the temperature achieved a certain value (714–726 K), the chemical reaction rate decreased.
3.3. Air Cycle Simulation
The factors affecting the thermal efficiency of ICEs are complex. For a conventional SI engine, constant volume combustion at TDC achieves high thermal efficiency. A faster combustion process, relative to more moderate burning rate engines, is regarded as resulting in a direct engine efficiency gain [41] (p. 845).
The engine test that resulted in a higher engine output with a leaner mixture was contradictory to the general concept. Therefore, air cycle simulation was performed to calculate the IMEP and thermal efficiency with a MFB similar to the experimental data.
The P–V diagram is depicted in Figure 8. The solid black curve is the air-standard cycle and the other curves are the HCCI engine experimental results with different AFRs. Causes of the deviation between air-standard cycle and engine experiment include heat transfer, finite combustion time, exhaust blowdown loss, crevice effects and leakage, incomplete combustion, pumping loss, and non-standard-air working fluid [42]. In general, a low deviation in the P–V diagram from the air-standard cycle leads to high efficiency. However, the result of this study was contradictory to the general concept. Comparing Figure 2 and Figure 8, the higher deviation of the P–V diagram from the Otto cycle resulted in a higher engine output and thermal efficiency.
To investigate this phenomenon, the air cycle with heat input and heat transfer was simulated. The heat input was calculated from MFB. A double-Wiebe function was proposed for simulating the MFB curve.
A functional form often used to represent the MFB versus CA curve is the Wiebe function [41] (p. 390):
where θ is the CA, θ0 is the start of combustion, and Δθ is the total combustion duration (xb = 0–1); a and m are adjustable parameters.
The double-Wiebe function, a combination of two-stage combustion, is referring to [32] and expressed as:
where xb is the MFB. Subscriptions 1 and 2 indicate the first and second stages of combustion, respectively, and θ01 and θ02 represent the start of first- and second-stage combustion, respectively (Figure 7). Furthermore, α is the fraction of fuel mass burned during the first-stage combustion, which is the MFB at θ02. The combustion duration of the first stage is Δθ1 = θ02 − θ01.
The rate of MFB combined with two-stage combustion can be expressed as:
where xb1 and xb2 are the MFB of each stage of combustion.
By combining Equation (15) with Equations (19)–(21), the rate of heat input in air cycle simulation can be calculated.
The parameters of the double-Wiebe function were determined by the curve fitting from the experimental MFB data. They are listed in Table 5. θ0, Δθ, and α were identified from the experimental data, and a and m were mainly dependent on the fuel type and did not vary with AFR. In this study of n-heptane HCCI, a1 = 3 and m1 = 1 for first-stage combustion, and a2 = 10 and m2 = 1 for second-stage combustion. The start of combustion (θ01) was delayed by 5° CA, and the total combustion duration (Δθ1 + Δθ2) was lengthened by 22° CA, as AFR increased from 22.1 to 24.5.
The simulated MFB by using the double-Wiebe function was close to the experimental result. The comparisons of MFB curves between simulated and experimental results are illustrated in Figure 9, wherein the dashed and solid lines indicate simulated and experimental results, respectively.
The heat input rate in air cycle simulation was calculated from the double-Wiebe function (Equation (19)).
The double-Wiebe functions for AFR, 22.1, 24.1, and 24.5, represented three different combustion patterns, which were classified as combustion patterns 1, 2, and 3, respectively. The parameters of the double-Wiebe function for the three combustion pattern are listed in Table 6. The combustion pattern represents combustion phasing. The start of combustion was delayed from combustion patterns 1 to 3. The combustion rates became slower from combustion patterns 1 to 3, and the combustion durations, Δθ1 and Δθ2, increased.
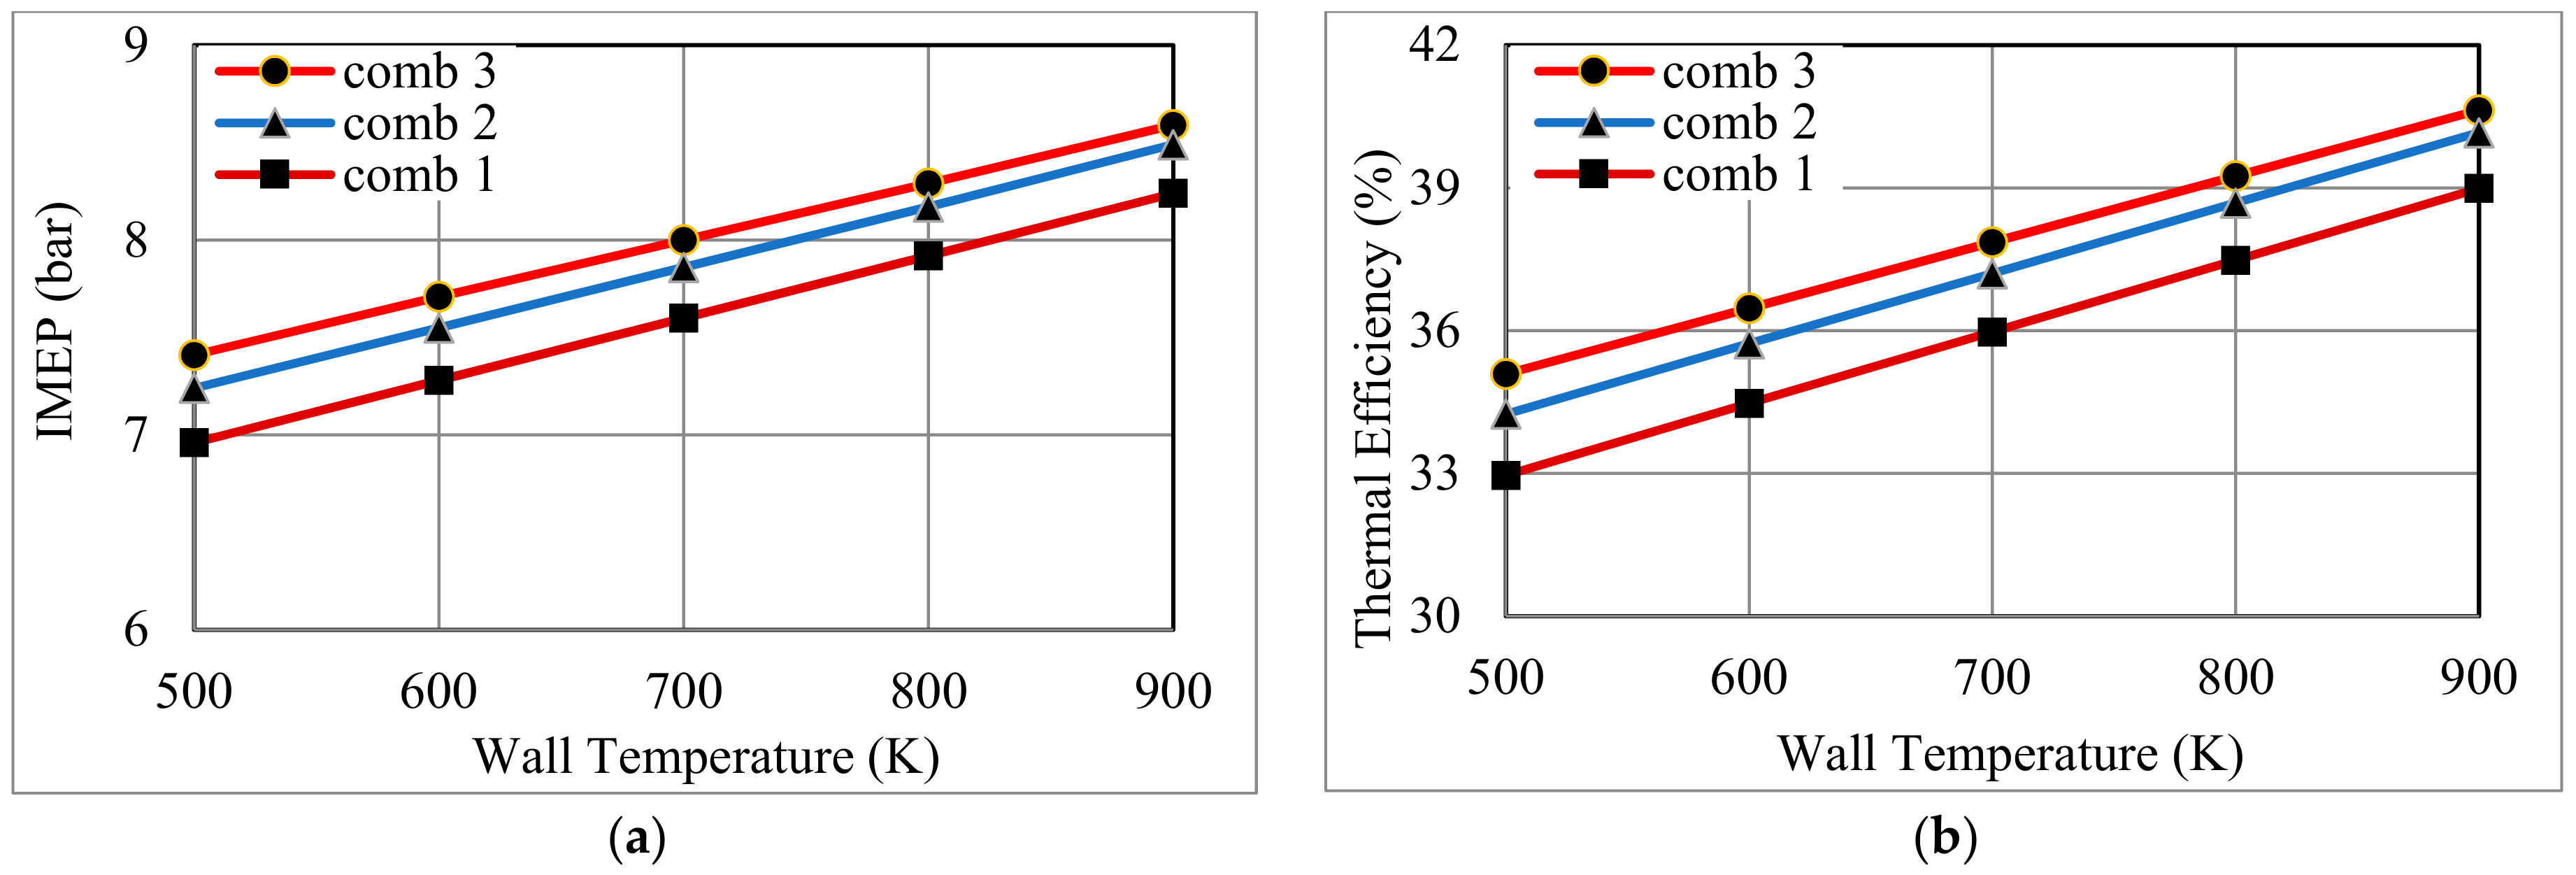
Among the three combustion patterns, pattern 3 possessed the highest IMEP and thermal efficiency (Figure 10 and Figure 11) because of low heat loss and a special case of P–V diagram. The detailed data of the air cycle simulation results are shown in Table A1, Table A2, Table A3, Table A4, Table A5 and Table A6, which include the heat loss per cycle (Qht). The slow combustion rate caused low combustion temperature and, hence, the heat transfer from the cylinder gas to the wall decreased. However, for prolonged combustion duration, such as Δθ1 = 25 and Δθ2 = 45, the IMEP and thermal efficiency decreased.
A combination of diesel- and gasoline-like fuels can be used in dual fuel for controlling the combustion phase, by using the gasoline-like fuel as the ignition suppressor and the diesel-like fuel as the ignition improver. Several studies have reported that the addition of a high octane number fuel in an HCCI engine delays the start of combustion and prolongs the combustion duration [12,28,43,44]. EGR delays the autoignition timing and reduces the combustion reaction rate [45,46,47,48]. Therefore, various combustion patterns can be achieved by adjusting AFR and the rates of dual fuel and EGR, along with the proper type of fuel.
Another method to reduce the heat loss is to increase the wall temperature. The combustion temperature of HCCI is much lower than that of SI. Thus, the capacity of the cooling system of an HCCI engine can be decreased more easily than that of the conventional SI engine. Moreover, ceramic coating on the surface of the combustion chamber can decrease heat loss. Reducing the cooling capacity or using a ceramic coating causes an increase in the wall temperature. The IMEP and the indicated thermal efficiency increased with increasing wall temperature, as shown in Figure 10, and was obviously caused by the low heat loss.
The effects of AFR on IMEP and thermal efficiency are indicated in Figure 11. No fuel was used in the air cycle simulation; AFR was used for calculating Qin rather than the fuel input. Decreasing Qin, and by extension, increasing AFR, reduced IMEP, and the indicated thermal efficiency increased by a small margin. The effects of decreasing Qin on IMEP and thermal efficiency were not as pronounced as those on combustion pattern. The change in AFR caused variation in the combustion pattern. In this study, three combustion patterns were achieved by adjusting AFR.
In the air cycle simulation, the CA of MRPR depended only on the combustion pattern. The faster the combustion rate, the more advanced the CA of MRPR (Table A1, Table A2, Table A3, Table A4, Table A5 and Table A6). The advanced CA of MRPR caused higher MRPR. Furthermore, more heat input led to higher MRPR. A study [49] set a limit of 6 bar/deg for the MRPR to decrease the combustion noise and avoid engine damage. All of the simulations of combustion pattern 1 reached an MRPR of >6 bar/deg because of fast combustion.
4. Conclusions
HCCI was operated with an n-heptane fuel in a conventional motorcycle engine. The engine test results and combustion analysis led to the following conclusions:
- (1)
- In the HCCI engine, both the engine output and efficiency can be increased with an increase in AFR. The main cause of higher engine output is the special combustion pattern, and the main cause of efficiency is the combination of combustion pattern and low heat transfer loss, because of low cylinder gas temperature. As AFR increases from 22.1 to 24.5, the IMEP increases 15% and indicated thermal efficiency increases 27%.
- (2)
- As AFR increases from 22.1 to 24.5, the start of combustion is delayed by 5° CA and the total combustion duration is lengthened by 22° CA.
- (3)
- Engine output and thermal efficiency do not require fast combustion rates in an HCCI engine. Only if the combustion pattern is appropriate, the output and efficiency can be improved.
- (4)
- The double-Wiebe function was used adequately for simulating the MFB curve of an HCCI engine with two-stage combustion. The proposed parameters of the double-Wiebe function for the n-heptane HCCI are a1 = 3 and m1 = 1 for the first-stage combustion; and a2 = 10 and m2 = 1 for the second-stage combustion.
- (5)
- A better combustion pattern for higher thermal efficiency can be achieved by adjusting AFR and the rates of dual fuel and EGR, along with the proper fuel type.
Author Contributions
J.H.W. provided the test material and designed the experiments; F.M.M. performed the air cycle simulation; Y.-Y.W. and J.H.W. analyzed the data; Y.-Y.W. wrote the paper.
Funding
This research was funded by Ministry of Science and Technology grant number MOST 106-3113-E-027-002-CC2.
Acknowledgments
The authors would like to thank the Ministry of Science and Technology (MOST, Taipei, Taiwan) for financial support. This manuscript was edited by Wallace Academic Editing.
Conflicts of Interest
The authors declare no conflicts of interest. The founding sponsors had no role in the design of the study; in the collection, analyses, or interpretation of data; in the writing of the manuscript, and in the decision to publish the results.
Nomenclature
| AFR | air–fuel ratio |
| BMEP | brake mean effective pressure |
| BSCO | brake-specific CO |
| BSHC | brake-specific HC |
| BSNO | brake-specific NO |
| aBDC | after bottom dead center |
| bBDC | before bottom dead center |
| aTDC | after top dead center |
| bTDC | before top dead center |
| CA | crank angle |
| CA10 | crank angle at which the mass fraction burned is 10% |
| CA50 | crank angle at which the mass fraction burned is 50% |
| CA90 | crank angle at which the mass fraction burned is 90% |
| COV | coefficient of variation |
| HC | hydrocarbons |
| HCCI | homogeneous charge compression ignition |
| HRR | heat release rate |
| IMEP | indicated mean effective pressure |
| MFB | mass fraction burned |
| MHRR | maximum heat release rate |
| MRPR | maximum rate of pressure rise |
| NOx | nitrogen oxides |
| SI | spark-ignition |
| TDC | top dead center |
| IMEPavg | average IMEP (bar) |
| IMEPstd | standard deviation of IMEP |
| ma | air mass supplied per cycle (g) |
| mf | fuel mass supplied per cycle (g) |
| P | cylinder gas pressure (bar) |
| T | cylinder gas temperature (K) |
| V | cylinder volume (m3) |
| QLHV | low heating value of fuel (J/g) |
| Qht | heat transfer between the cylinder gas and the wall (J/cycle) |
| Qin | heat input (J/cycle) |
| heat release rate (J/deg) | |
| heat transfer rate between cylinder gas and the wall (J/deg) | |
| α | the fraction of fuel mass burned during the first stage of combustion |
| θ | crank angle (degree) |
| θ0 | the start of combustion (deg aTDC) |
| Δθ | combustion duration (degree) |
| γ | specific heat ratio of cylinder gas |
| ηc | combustion efficiency (%) |
| ηth | thermal efficiency (%) |
Appendix A
The results of the air cycle simulation are presented in this appendix.

Table A1.
Effects of wall temperature on the simulated results for combustion pattern 1.
| AFR1 | IMEP | ηth | Qin | Qht | Tw | Pmax | Tmax | MRPR | CAMRPR |
|---|---|---|---|---|---|---|---|---|---|
| bar | % | J | J | K | bar | K | Bar/deg | deg aTDC | |
| 25 | 6.96 | 32.96 | 263.4 | 106.5 | 500 | 65.9 | 1960 | 8.29 | 2 |
| 25 | 7.28 | 34.47 | 263.4 | 95.8 | 600 | 66.7 | 1985 | 8.30 | 2 |
| 25 | 7.60 | 35.97 | 263.4 | 85.1 | 700 | 67.6 | 2011 | 8.31 | 2 |
| 25 | 7.92 | 37.48 | 263.4 | 74.3 | 800 | 68.4 | 2036 | 8.33 | 2 |
| 25 | 8.24 | 38.99 | 263.4 | 63.5 | 900 | 69.2 | 2061 | 8.34 | 2 |
1AFR, rather than the fuel input, is used for calculating Qin.
Table A2.
Effects of wall temperature on the simulated results for combustion pattern 2.
| AFR1 | IMEP | ηth | Qin | Qht | Tw | Pmax | Tmax | MRPR | CAMRPR |
|---|---|---|---|---|---|---|---|---|---|
| bar | % | J | J | K | bar | K | Bar/deg | deg aTDC | |
| 25 | 7.24 | 34.25 | 263.4 | 97.8 | 500 | 56.8 | 1870 | 4.79 | 6 |
| 25 | 7.55 | 35.73 | 263.4 | 87.3 | 600 | 57.6 | 1898 | 4.79 | 6 |
| 25 | 7.86 | 37.20 | 263.4 | 76.7 | 700 | 58.4 | 1926 | 4.80 | 6 |
| 25 | 8.17 | 38.68 | 263.4 | 66.0 | 800 | 59.3 | 1955 | 4.81 | 6 |
| 25 | 8.49 | 40.16 | 263.4 | 55.3 | 900 | 60.1 | 1983 | 4.81 | 6 |
1AFR, rather than the fuel input, is used for calculating Qin.
Table A3.
Effects of wall temperature on the simulated results for combustion pattern 3.
| AFR1 | IMEP | ηth | Qin | Qht | Tw | Pmax | Tmax | MRPR | CAMRPR |
|---|---|---|---|---|---|---|---|---|---|
| bar | % | J | J | K | bar | K | Bar/deg | deg aTDC | |
| 25 | 7.41 | 35.09 | 263.4 | 83.7 | 500 | 41.4 | 1743 | 2.07 | 14 |
| 25 | 7.71 | 36.47 | 263.4 | 73.5 | 600 | 42.1 | 1773 | 2.07 | 14 |
| 25 | 8.00 | 37.86 | 263.4 | 63.3 | 700 | 42.8 | 1803 | 2.06 | 14 |
| 25 | 8.29 | 39.25 | 263.4 | 53.1 | 800 | 43.6 | 1834 | 2.05 | 14 |
| 25 | 8.59 | 40.63 | 263.4 | 42.8 | 900 | 44.3 | 1864 | 2.04 | 14 |
1AFR, rather than the fuel input, is used for calculating Qin.
Table A4.
Air cycle simulated results with various heat inputs for combustion pattern 1.
| AFR1 | IMEP | ηth | Qin | Qht | Tw2 | Pmax | Tmax | MRPR | CAMRPR |
|---|---|---|---|---|---|---|---|---|---|
| bar | % | J | J | K | bar | K | Bar/deg | deg aTDC | |
| 20 | 8.68 | 32.88 | 329.2 | 133.9 | 507 | 76.8 | 2284 | 10.23 | 2 |
| 21 | 8.28 | 32.92 | 313.6 | 127.2 | 507 | 74.2 | 2208 | 9.78 | 2 |
| 22 | 7.91 | 32.96 | 299.3 | 121.1 | 507 | 71.9 | 2138 | 9.36 | 2 |
| 23 | 7.58 | 33.00 | 286.3 | 115.6 | 507 | 69.8 | 2075 | 8.97 | 2 |
| 24 | 7.27 | 33.03 | 274.4 | 110.5 | 507 | 67.8 | 2016 | 8.62 | 2 |
| 25 | 6.99 | 33.06 | 263.4 | 105.8 | 507 | 66.0 | 1962 | 8.29 | 2 |
| 26 | 6.72 | 33.08 | 253.3 | 101.5 | 507 | 64.3 | 1912 | 7.99 | 2 |
| 27 | 6.48 | 33.11 | 243.9 | 97.5 | 507 | 62.7 | 1865 | 7.71 | 2 |
| 28 | 6.25 | 33.12 | 235.2 | 93.8 | 507 | 61.3 | 1822 | 7.44 | 2 |
| 29 | 6.04 | 33.14 | 227.1 | 90.4 | 507 | 59.9 | 1781 | 7.20 | 2 |
| 30 | 5.84 | 33.16 | 219.5 | 87.2 | 507 | 58.7 | 1743 | 6.97 | 2 |
1AFR, rather than the fuel input, is used for calculating Qin. 2 The wall temperature was predicted by using the empirical formula proposed by Wu et al. [39].
Table A5.
Air cycle simulated results with various heat inputs for combustion pattern 2.
| AFR1 | IMEP | ηth | Qin | Qht | Tw2 | Pmax | Tmax | MRPR | CAMRPR |
|---|---|---|---|---|---|---|---|---|---|
| bar | % | J | J | K | bar | K | Bar/deg | deg aTDC | |
| 20 | 9.01 | 34.13 | 329.2 | 123.0 | 507 | 66.0 | 2178 | 5.97 | 6 |
| 21 | 8.60 | 34.18 | 313.6 | 116.9 | 507 | 63.8 | 2106 | 5.69 | 6 |
| 22 | 8.22 | 34.23 | 299.3 | 111.2 | 507 | 61.9 | 2040 | 5.43 | 6 |
| 23 | 7.87 | 34.27 | 286.3 | 106.1 | 507 | 60.0 | 1979 | 5.20 | 6 |
| 24 | 7.55 | 34.31 | 274.4 | 101.5 | 507 | 58.4 | 1923 | 4.99 | 6 |
| 25 | 7.26 | 34.35 | 263.4 | 97.2 | 507 | 56.8 | 1872 | 4.79 | 6 |
| 26 | 6.98 | 34.38 | 253.3 | 93.2 | 507 | 55.4 | 1824 | 4.60 | 6 |
| 27 | 6.73 | 34.41 | 243.9 | 89.5 | 507 | 54.1 | 1780 | 4.43 | 6 |
| 28 | 6.50 | 34.43 | 235.2 | 86.1 | 507 | 52.8 | 1738 | 4.27 | 6 |
| 29 | 6.28 | 34.45 | 227.1 | 83.0 | 507 | 51.7 | 1699 | 4.12 | 6 |
| 30 | 6.07 | 34.47 | 219.5 | 80.0 | 507 | 50.6 | 1663 | 3.98 | 6 |
1AFR, rather than the fuel input, is used for calculating Qin. 2 The wall temperature was predicted by using the empirical formula proposed by Wu et al. [39].
Table A6.
Air cycle simulated results with various heat inputs for combustion pattern 3.
| AFR1 | IMEP | ηth | Qin | Qht | Tw2 | Pmax | Tmax | MRPR | CAMRPR |
|---|---|---|---|---|---|---|---|---|---|
| bar | % | J | J | K | bar | K | Bar/deg | deg aTDC | |
| 20 | 9.22 | 34.92 | 329.2 | 105.4 | 507 | 48.0 | 2034 | 2.66 | 14 |
| 21 | 8.80 | 34.98 | 313.6 | 100.0 | 507 | 46.5 | 1966 | 2.52 | 14 |
| 22 | 8.41 | 35.04 | 299.3 | 95.2 | 507 | 45.0 | 1904 | 2.39 | 14 |
| 23 | 8.06 | 35.09 | 286.3 | 90.8 | 507 | 43.7 | 1846 | 2.28 | 14 |
| 24 | 7.73 | 35.14 | 274.4 | 86.7 | 507 | 42.5 | 1794 | 2.17 | 14 |
| 25 | 7.43 | 35.18 | 263.4 | 83.0 | 507 | 41.4 | 1745 | 2.07 | 14 |
| 26 | 7.16 | 35.22 | 253.3 | 79.6 | 507 | 40.4 | 1700 | 1.98 | 14 |
| 27 | 6.90 | 35.25 | 243.9 | 76.4 | 507 | 39.5 | 1659 | 1.90 | 14 |
| 28 | 6.66 | 35.28 | 235.2 | 73.5 | 507 | 38.6 | 1620 | 1.82 | 14 |
| 29 | 6.43 | 35.31 | 227.1 | 70.8 | 507 | 37.8 | 1583 | 1.74 | 14 |
| 30 | 6.22 | 35.34 | 219.5 | 68.2 | 507 | 37.0 | 1549 | 1.67 | 14 |
1AFR, rather than the fuel input, is used for calculating Qin. 2 The wall temperature was predicted by using the empirical formula proposed by Wu et al. [39].
References
- Cesare, M.D.; Cavina, N.; Paiano, L. Technology comparison for spark ignition engines of new generation. SAE Int. J. Engines 2017, 10, 2513–2534. [Google Scholar] [CrossRef]
- Adam, J.F.; Apostolos, P.; Amin, M.A. Variable geometry turbocharger technologies for exhaust energy recovery and boosting—A review. Renew. Sustain. Energy Rev. 2017, 71, 959–975. [Google Scholar]
- Hall, J.; Bassett, M.; Hibberd, B.; Streng, S. Heavily downsized demonstrator engine optimised for CNG operation. SAE Int. J. Engines 2016, 9, 2250–2261. [Google Scholar] [CrossRef]
- Zhao, J. Research and application of over-expansion cycle (Atkinson and Miller) engines—A review. Appl. Energy 2017, 185, 300–319. [Google Scholar] [CrossRef]
- Zhao, J.; Xu, M. Fuel economy optimization of an Atkinson cycle engine using genetic algorithm. Appl. Energy 2013, 105, 335–348. [Google Scholar] [CrossRef]
- Yan, B.; Wanga, H.; Zheng, Z.; Qin, Y.; Yao, M. The effects of LIVC Miller cycle on the combustion characteristics and thermal efficiency in a stoichiometric operation natural gas engine with EGR. Appl. Therm. Eng. 2017, 122, 439–450. [Google Scholar] [CrossRef]
- Zhaoa, F.; Lai, M.C.; Harrington, D.L. Automotive spark-ignited direct-injection gasoline engines. Prog. Energy Combust. Sci. 1999, 25, 437–562. [Google Scholar] [CrossRef]
- Mitani, S.; Hashimoto, S.; Nomura, H.; Shimizu, R.; Kanda, M. New combustion concept for turbocharged gasoline direct-injection engines. SAE Int. J. Engines 2014, 7, 551–559. [Google Scholar] [CrossRef]
- Spicher, U.; Magar, M.; Hadler, J. High pressure gasoline direct injection in spark ignition engines—Efficiency optimization through detailed process analyses. SAE Int. J. Engines 2016, 9, 2120–2128. [Google Scholar] [CrossRef]
- Agarwal, A.K.; Singh, A.P.; Maurya, R.K. Evolution, challenges and path forward for low temperature combustion engines. Prog. Energy Combust. Sci. 2017, 61, 1–56. [Google Scholar] [CrossRef]
- Reitz, R.D.; Duraisamy, G. Review of high efficiency and clean reactivity controlled compression ignition (RCCI) combustion in internal combustion engines. Prog. Energy Combust. Sci. 2015, 46, 12–71. [Google Scholar] [CrossRef]
- Polat, S. An experimental study on combustion, engine performance and exhaust emissions in a HCCI engine fuelled with diethyl ether–ethanol fuel blends. Fuel Process. Technol. 2016, 143, 140–150. [Google Scholar] [CrossRef]
- Maurya, R.K.; Agarwal, A.K. Experimental investigations of performance, combustion and emission characteristics of ethanol and methanol fueled HCCI engine. Fuel Process. Technol. 2014, 126, 30–48. [Google Scholar] [CrossRef]
- Solouk, A.; Tripp, J.; Shakiba-Herfeh, M.; Shahbakhti, M. Fuel consumption assessment of a multi-mode low temperature combustion engine as range extender for an electric vehicle. Energy Convers. Manag. 2017, 148, 1478–1496. [Google Scholar] [CrossRef]
- Bin Mamat, A.M.I.; Martinez-Botas, R.F.; Rajoo, S.; Romagnoli, A.; Petrovic, S. Waste heat recovery using a novel high performance low pressure turbine for electric turbocompounding in downsized gasoline engines: Experimental and computational analysis. Energy 2015, 90, 218–234. [Google Scholar] [CrossRef]
- Legros, A.; Guillaume, L.; Diny, M.; Zaïdi, H.; Lemort, V. Comparison and Impact of Waste Heat Recovery Technologies on Passenger Car Fuel Consumption in a Normalized Driving Cycle. Energies 2014, 7, 5273–5290. [Google Scholar] [CrossRef] [Green Version]
- Heywood, J.B. Automotive engines and fuels: A review of future options. Prog. Energy Combust. Sci. 1981, 7, 155–184. [Google Scholar] [CrossRef]
- Yamin, J.A.; Badran, O.O. Analytical study to minimise the heat losses from a propane powered 4-stroke spark ignition engine. Renew. Energy 2002, 27, 463–478. [Google Scholar] [CrossRef]
- Borman, G.; Nishiwaki, K. Internal-combustion engine heat transfer. Prog. Energy Combust. Sci. 1987, 13, 1–46. [Google Scholar] [CrossRef]
- Zhang, J.; Xu, Z.; Lin, J.; Lin, Z.; Wang, J.; Xu, T. Thermal characteristics investigation of the internal combustion engine cooling-combustion system using thermal boundary dynamic coupling method and experimental verification. Energies 2018, 11, 2127. [Google Scholar] [CrossRef]
- Haghighat, A.K.; Roumi, S.; Madani, N.; Bahmanpour, D.; Olsen, M.G. An intelligent cooling system and control model for improved engine thermal management. Appl. Therm. Eng. 2018, 128, 253–263. [Google Scholar] [CrossRef]
- Chen, X.; Yu, X.; Lu, Y.; Huang, R.; Liu, Z.; Huang, Y.; Roskilly, A.P. Study of different cooling structures on the thermal status of an Internal Combustion Engine. Appl. Therm. Eng. 2017, 116, 419–432. [Google Scholar] [CrossRef]
- Gao, J.; Wu, Y.; Shen, T. On-line statistical combustion phase optimization and control of SI gasoline engines. Appl. Therm. Eng. 2017, 112, 1396–1407. [Google Scholar] [CrossRef]
- Liu, H.; Ma, J.; Tong, L.; Ma, G.; Zheng, Z.; Yao, M. Investigation on the potential of high efficiency for internal combustion engines. Energies 2018, 11, 513. [Google Scholar] [CrossRef]
- Stuhldreher, M.; Kargul, J.; Barba, D.; McDonald, J.; Bohac, S.; Dekraker, P.; Moskalik, A. Benchmarking a 2016 Honda Civic 1.5-Liter L15B7 Turbocharged Engine and Evaluating the Future Efficiency Potential of Turbocharged Engines; SAE Technical Paper; SAE International: Warrendale, PA, USA, 2018. [Google Scholar]
- Johnson, T.; Joshi, A. Review of Vehicle Engine Efficiency and Emissions; SAE Technical Paper; SAE International: Warrendale, PA, USA, 2018. [Google Scholar]
- Hasan, M.M.; Rahman, M.M. Homogeneous charge compression ignition combustion: Advantages over compression ignition combustion, challenges and solutions. Renew. Sustain. Energy Rev. 2016, 57, 282–291. [Google Scholar] [CrossRef]
- Lu, X.; Hou, Y.; Zu, L.; Huang, Z. Experimental study on the auto-ignition and combustion characteristics in the homogeneous charge compression ignition (HCCI) combustion operation with ethanol/n-heptane blend fuels by port injection. Fuel 2006, 85, 2622–2631. [Google Scholar] [CrossRef]
- Sjöberg, M.; Dec, J.E. Comparing late-cycle autoignition stability for single- and two-stage ignition fuels in HCCI engines. Proc. Combust. Inst. 2007, 31, 2895–2902. [Google Scholar] [CrossRef]
- Nishi, M.; Kanehara, M.; Iida, N. Assessment for innovative combustion on HCCI engine by controlling EGR ratio and engine speed. Appl. Therm. Eng. 2016, 99, 42–60. [Google Scholar] [CrossRef]
- Wu, Y.Y.; Chen, B.C.; Wang, J.H. Experimental study on HCCI combustion in a small engine with various fuels and EGR. Aerosol Air Qual. Res. 2016, 16, 3338–3348. [Google Scholar] [CrossRef]
- Yıldız, M.; Ceper, B.A. Zero-dimensional single zone engine modeling of an SI engine fuelled with methane and methane-hydrogen blend using single and double Wiebe Function: A comparative study. Int. J. Hydrog. Energy 2017, 42, 25756–25765. [Google Scholar] [CrossRef]
- Kelly-Zion, P.L.; Dec, J.E. A computational study of the effect of fuel type on ignition time in homogeneous charge compression ignition engines. Proc. Combust. Inst. 2000, 28, 1187–1194. [Google Scholar] [CrossRef]
- Mack, J.H.; Flowers, D.L.; Buchholz, B.A.; Dibble, R.W. Investigation of HCCI combustion of diethyl ether and ethanol mixtures using carbon 14 tracing and numerical simulations. Proc. Combust. Inst. 2005, 30, 2693–2700. [Google Scholar] [CrossRef] [Green Version]
- Wu, Y.Y.; Jang, C.T.; Chen, B.L. Combustion characteristics of HCCI in motorcycle engine. J. Eng. Gas Turbines Power 2010, 132. [Google Scholar] [CrossRef]
- Holman, J.P. Experimental Methods for Engineers, 5th ed.; McGraw-Hill: New York, NY, USA, 1989. [Google Scholar]
- Su, J.; Xu, M.; Li, T.; Gao, Y.; Wang, J. Combined effects of cooled EGR and a higher geometric compression ratio on thermal efficiency improvement of a downsized boosted spark-ignition direct-injection engine. Energy Convers. Manag. 2014, 78, 65–73. [Google Scholar] [CrossRef]
- Ceviz, M.A.; Kaymaz, I. Temperature and air-fuel ratio dependent specific heat ratio functions for lean burned and unburned mixture. Energy Convers. Manag. 2005, 44, 2387–2404. [Google Scholar] [CrossRef]
- Wu, Y.Y.; Chen, B.C.; Hsieh, F.C. Heat transfer model for small-scale air-cooled spark ignition four-stroke engines. Int. J. Heat Mass Transf. 2006, 49, 3895–3905. [Google Scholar] [CrossRef]
- Turns, S.R. An Introduction to Combustion, 3rd ed.; McGraw-Hill: Singapore, 2012; p. 172. ISBN 978-007-108687-5. [Google Scholar]
- Heywood, J.B. Internal Combustion Engine Fundamentals; McGraw-Hill: New York, NY, USA, 1988; ISBN 0-07-028637-X. [Google Scholar]
- Pulkrabek, W.W. Engineering Fundamentals of the Internal Combustion Engines, 2nd ed.; Pearson Prentice-Hall: Upper Saddle River, NJ, USA, 2004; pp. 96–98. ISBN 0-13-191855-9. [Google Scholar]
- Uyumaz, A. An experimental investigation into combustion and performance characteristics of an HCCI gasoline engine fueled with n-heptane, isopropanol and n-butanol fuel blends at different inlet air temperatures. Energy Convers. Manag. 2015, 98, 199–207. [Google Scholar] [CrossRef]
- Shudoa, T.; Yamada, H. Hydrogen as an ignition-controlling agent for HCCI combustion engine by suppressing the low-temperature oxidation. Int. J. Hydrog. Energy 2007, 32, 3066–3072. [Google Scholar] [CrossRef] [Green Version]
- Cınar, C.; Uyumaz, A.; Polat, S.; Yılmaz, E.; Can, O.; Solmaz, H. Combustion and performance characteristics of an HCCI engine utilizing trapped residual gas via reduced valve lift. Appl. Therm. Eng. 2016, 100, 586–594. [Google Scholar] [CrossRef]
- Zhang, H.F.; Seo, K.; Zhao, H. Combustion and emission analysis of the direct DME injection enabled and controlled auto-ignition gasoline combustion engine operation. Fuel 2013, 107, 800–814. [Google Scholar] [CrossRef]
- Sjöberg, M.; Dec, J.E. Dec Effects of EGR and its constituents on HCCI autoignition of ethanol. Proc. Combust. Inst. 2011, 33, 3031–3038. [Google Scholar] [CrossRef]
- Yao, M.; Chen, Z.; Zheng, Z.; Zhang, B.; Xing, Y. Study on the controlling strategies of homogeneous charge compression ignition combustion with fuel of dimethyl ether and methanol. Fuel 2006, 85, 2046–2056. [Google Scholar] [CrossRef]
- Sun, R.; Rick Thomas, R.; Gray, C.L., Jr. An HCCI Engine: Power Plant for a Hybrid Vehicle; SAE Technical Paper; SAE International: Warrendale, PA, USA, 2004. [Google Scholar]
Figure 1.
Configuration of the proposed homogeneous charge compression ignition (HCCI) engine.

Figure 2.
The influence of AFR on engine output and efficiency: (a) IMEP and brake mean effective pressure (BMEP); and (b) indicated thermal efficiency and heat loss ratio.
Figure 2.
The influence of AFR on engine output and efficiency: (a) IMEP and brake mean effective pressure (BMEP); and (b) indicated thermal efficiency and heat loss ratio.

Figure 3.
The influence of AFR on the maximum cylinder gas temperature.

Figure 4.
The influence of AFR on exhaust emissions. BSCO, BSHC, and BSNO denote brake-specific CO, HC, and NO emissions, respectively.
Figure 4.
The influence of AFR on exhaust emissions. BSCO, BSHC, and BSNO denote brake-specific CO, HC, and NO emissions, respectively.

Figure 5.
Cylinder gas pressure and temperature with various AFRs: (a) pressure; and (b) temperature.
Figure 5.
Cylinder gas pressure and temperature with various AFRs: (a) pressure; and (b) temperature.

Figure 6.
Combustion characteristics with various AFRs: (a) heat release rate (HRR); and (b) mass fraction burned (MFB).
Figure 6.
Combustion characteristics with various AFRs: (a) heat release rate (HRR); and (b) mass fraction burned (MFB).

Figure 7.
Combustion parameters on HRR and MFB curves.

Figure 8.
P–V diagram of the air-standard cycle and experimental results.

Figure 9.
Comparison of MFB curves between simulated and experimental results: (a) AFR = 22.1 and 24.1; and (b) AFR = 23.1 and 24.5.
Figure 9.
Comparison of MFB curves between simulated and experimental results: (a) AFR = 22.1 and 24.1; and (b) AFR = 23.1 and 24.5.

Figure 10.
Effects of wall temperature on engine output and efficiency of air cycle simulation with three combustion patterns: (a) IMEP; and (b) indicated thermal efficiency.
Figure 10.
Effects of wall temperature on engine output and efficiency of air cycle simulation with three combustion patterns: (a) IMEP; and (b) indicated thermal efficiency.

Figure 11.
Effects of AFR on the engine output and efficiency of air cycle simulation with three combustion patterns: (a) IMEP; and (b) indicated thermal efficiency.
Figure 11.
Effects of AFR on the engine output and efficiency of air cycle simulation with three combustion patterns: (a) IMEP; and (b) indicated thermal efficiency.

Table 1.
Engine specifications. aTDC: after top dead center; bTDC: before top dead center; aBDC: after bottom dead center; bBDC: before bottom dead center.
Table 1.
Engine specifications. aTDC: after top dead center; bTDC: before top dead center; aBDC: after bottom dead center; bBDC: before bottom dead center.
| Items | Specifications | Units |
|---|---|---|
| Engine type | 4-stroke, 1-cylinder | - |
| Valve system | 4-valve, overhead cam | - |
| Cooling system | Forced air cooling | - |
| Displacement | 124.6 | cc |
| Bore × stroke | 52.4 × 57.8 | mm2 |
| Compression ratio | 10.5 | - |
| Fuel system | Electronic port fuel injection | - |
| Intake valve open a | 0° bTDC | CA |
| Intake valve close a | 25° aBDC | CA |
| Exhaust valve open a | 25° bBDC | CA |
| Exhaust valve close a | 3° aTDC | CA |
a Valve timing is defined at 1 mm of valve lift.
Table 2.
Fuel Properties. AFR: air–fuel ratio.
| Items | n-Heptane | Gasoline |
|---|---|---|
| Lower heating value (MJ/kg) | 44.6 | 44.0 |
| Octane number | 0 | 92 |
| Cetane number | 60 | 5–12 |
| Autoignition temperature b (K) | 488 | 553–729 |
| Stoichiometric AFR | 15.2 | 14.7 |
| Viscosity at 20 °C (cP) | 0.56 | 0.74 |
b Autoignition temperatures are obtained from the Material Safety Data Sheets.
Table 3.
Uncertainty in the experimental results of the engine test. IMEP: Indicated mean effective pressure.
Table 3.
Uncertainty in the experimental results of the engine test. IMEP: Indicated mean effective pressure.
| Items | Units | Uncertainty (±%) |
|---|---|---|
| Engine speed | rpm | 0.68 |
| Engine torque | Nm | 1.75 |
| IMEP | bar | 1.92 |
| Fuel rate | g/s | 5.57 |
Table 4.
The combustion parameters of the engine test. CA: crank angle; COV: coefficient of variation; and MRPR: maximum rate of pressure rise.
Table 4.
The combustion parameters of the engine test. CA: crank angle; COV: coefficient of variation; and MRPR: maximum rate of pressure rise.
| AFR | 22.1 | 23.1 | 24.1 | 24.5 |
| Max. pressure (bar) | 58.7 | 56.7 | 49.7 | 35.2 |
| CA of Pmax (deg aTDC) | 5 | 6 | 12 | 22 |
| Max. temperature (K) | 2128 | 2047 | 1981 | 1851 |
| CA of Tmax (deg aTDC) | 5 | 7 | 13 | 21 |
| COV of IMEP (%) | 4.6 | 3.6 | 3.5 | 2.4 |
| MRPR (bar/deg)) | 18.1 | 15.0 | 6.1 | 1.5 |
| CA of MRPR (deg aTDC) | 4 | 5 | 8 | 15 |
| MHHR1 (J/deg CA) | 2.05 | 2.03 | 2.21 | 2.20 |
| CA of MHRR1 (deg aTDC) | –10 | –10 | –7 | –4 |
| Temperature of MHRR1 (K) | 726 | 717 | 726 | 714 |
| MHRR2 (J/deg CA) | 30.1 | 29.5 | 20.8 | 10.5 |
| CA of MHRR2 (deg aTDC) | 4 | 5 | 8 | 19 |
| CA10 (deg aTDC) | –2.9 | −1.6 | –1.1 | 1.4 |
| Temperature of CA10 (K) | 813 | 812 | 807 | 810 |
| CA50 (deg aTDC) | 3.5 | 4.7 | 8.4 | 17.0 |
| CA90 (deg aTDC) | 8.1 | 8.9 | 13.2 | 24.1 |
| Burn duration of CA 10–90 | 11.0 | 10.5 | 14.3 | 22.7 |
Table 5.
Parameters of the double-Wiebe function.
| AFR | a1 | m1 | θ01 | Δθ1 | a2 | m2 | θ02 | Δθ2 | α |
|---|---|---|---|---|---|---|---|---|---|
| 22.1 | 3 | 1 | –15 | 15 | 10 | 1 | 0 | 15 | 0.130 |
| 23.1 | 3 | 1 | –14 | 15 | 10 | 1 | 1 | 15 | 0.129 |
| 24.1 | 3 | 1 | –14 | 17 | 10 | 1 | 3 | 22 | 0.134 |
| 24.5 | 3 | 1 | –10 | 19 | 10 | 1 | 9 | 33 | 0.145 |
Table 6.
Various combustion patterns determined by the double-Wiebe function.
| Combustion Pattern | a1 | m1 | θ01 | Δθ1 | a2 | m2 | θ02 | Δθ2 | α |
|---|---|---|---|---|---|---|---|---|---|
| 1 | 3 | 1 | –15 | 15 | 10 | 1 | 0 | 15 | 0.13 |
| 2 | 3 | 1 | –14 | 17 | 10 | 1 | 3 | 22 | 0.14 |
| 3 | 3 | 1 | –10 | 19 | 10 | 1 | 9 | 33 | 0.15 |
© 2018 by the authors. Licensee MDPI, Basel, Switzerland. This article is an open access article distributed under the terms and conditions of the Creative Commons Attribution (CC BY) license (http://creativecommons.org/licenses/by/4.0/).
Share and Cite
MDPI and ACS Style
Wu, Y.-Y.; Wang, J.H.; Mir, F.M. Improving the Thermal Efficiency of the Homogeneous Charge Compression Ignition Engine by Using Various Combustion Patterns. Energies 2018, 11, 3002. https://doi.org/10.3390/en11113002
AMA Style
Wu Y-Y, Wang JH, Mir FM. Improving the Thermal Efficiency of the Homogeneous Charge Compression Ignition Engine by Using Various Combustion Patterns. Energies. 2018; 11(11):3002. https://doi.org/10.3390/en11113002
Chicago/Turabian StyleWu, Yuh-Yih, James H. Wang, and Faizan Mushtaq Mir. 2018. "Improving the Thermal Efficiency of the Homogeneous Charge Compression Ignition Engine by Using Various Combustion Patterns" Energies 11, no. 11: 3002. https://doi.org/10.3390/en11113002
Note that from the first issue of 2016, this journal uses article numbers instead of page numbers. See further details here.