Experimental Study of Reverse Underground Coal Gasification

1
State Key Laboratory of Coal Combustion, Huazhong University of Science and Technology, Wuhan 430074, China
2
State Key Laboratory of Coal-Based Low Carbon Energy, ENN Science & Technology Development Co., Ltd., Langfang 065001, China
3
School of Chemical & Environmental Engineering, China University of Mining & Technology (Beijing), Beijing 100083, China
*
Author to whom correspondence should be addressed.
Energies 2018, 11(11), 2949; https://doi.org/10.3390/en11112949
Submission received: 30 September 2018
/
Revised: 25 October 2018
/
Accepted: 26 October 2018
/
Published: 29 October 2018
Abstract
:Underground coal gasification (UCG) produces less pollution and is safer than traditional coal mining. In order to investigate the effects of different gasifying agents or comprehensive analyses of the characteristics of the gas components in the three zones for the reverse underground coal gasification process, a model test was carried out. The results showed that the oxygen concentration of a gasifying agent is recommended to be higher than 21%, which will lead to more combustible gases and a higher calorific value of gas. Higher flow rates and oxygen content generally afforded more desirable gas compositions and calorific values, with the latter as high as 1430.19 kcal/Nm3. For the enriched oxygen gasifying agent in the reverse gasification process, the flow increase from 10 to 20 Nm3/h affords a rapid increase in the growth rate of the flame front, from 1.80 to 4.88 m/day, which is much faster than that for the air gasifying agent. Increasing the gas injection rate and oxygen concentration will increase the growth rate of the flame front. This affects the distribution of the three zones and further leads to different characteristics of the gas components.
1. Introduction
Underground coal gasification (UCG) converts coal into combustible gas through controlled in situ combustion, thus transforming ordinary “physical” mining into “chemical” mining. In this process, hole or channel drilling is achieved on the surface and obviates the need for underground work, large mining equipment, ground gasification equipment, and surface gasifier construction. This greatly reduces the environmental damage caused by traditional physical mining, and coal exploitation can be maximized even for steeply inclined, thin, ultra-deep, or inferior coal seams, or otherwise uneconomical coal resources that are not suitable for physical mining. The approach is highly regarded around the world, particularly as a second-generation mining method [1,2,3,4]. As an important means of clean coal technology, UCG integrates geological and environmental science; detection and coal mining technologies; computational analysis; chemical, coal chemical, and energy technologies; resource economics; and management science. UCG has many advantages, including safety and lower costs, and is also environmentally friendly [5,6,7,8,9]. As early as 1979, the United Nations World Coal Vision Conference clearly pointed out that UCG is an important way to fundamentally solve a series of technical and environmental issues caused by traditional coal mining methods, and its development should direct world coal mining research.
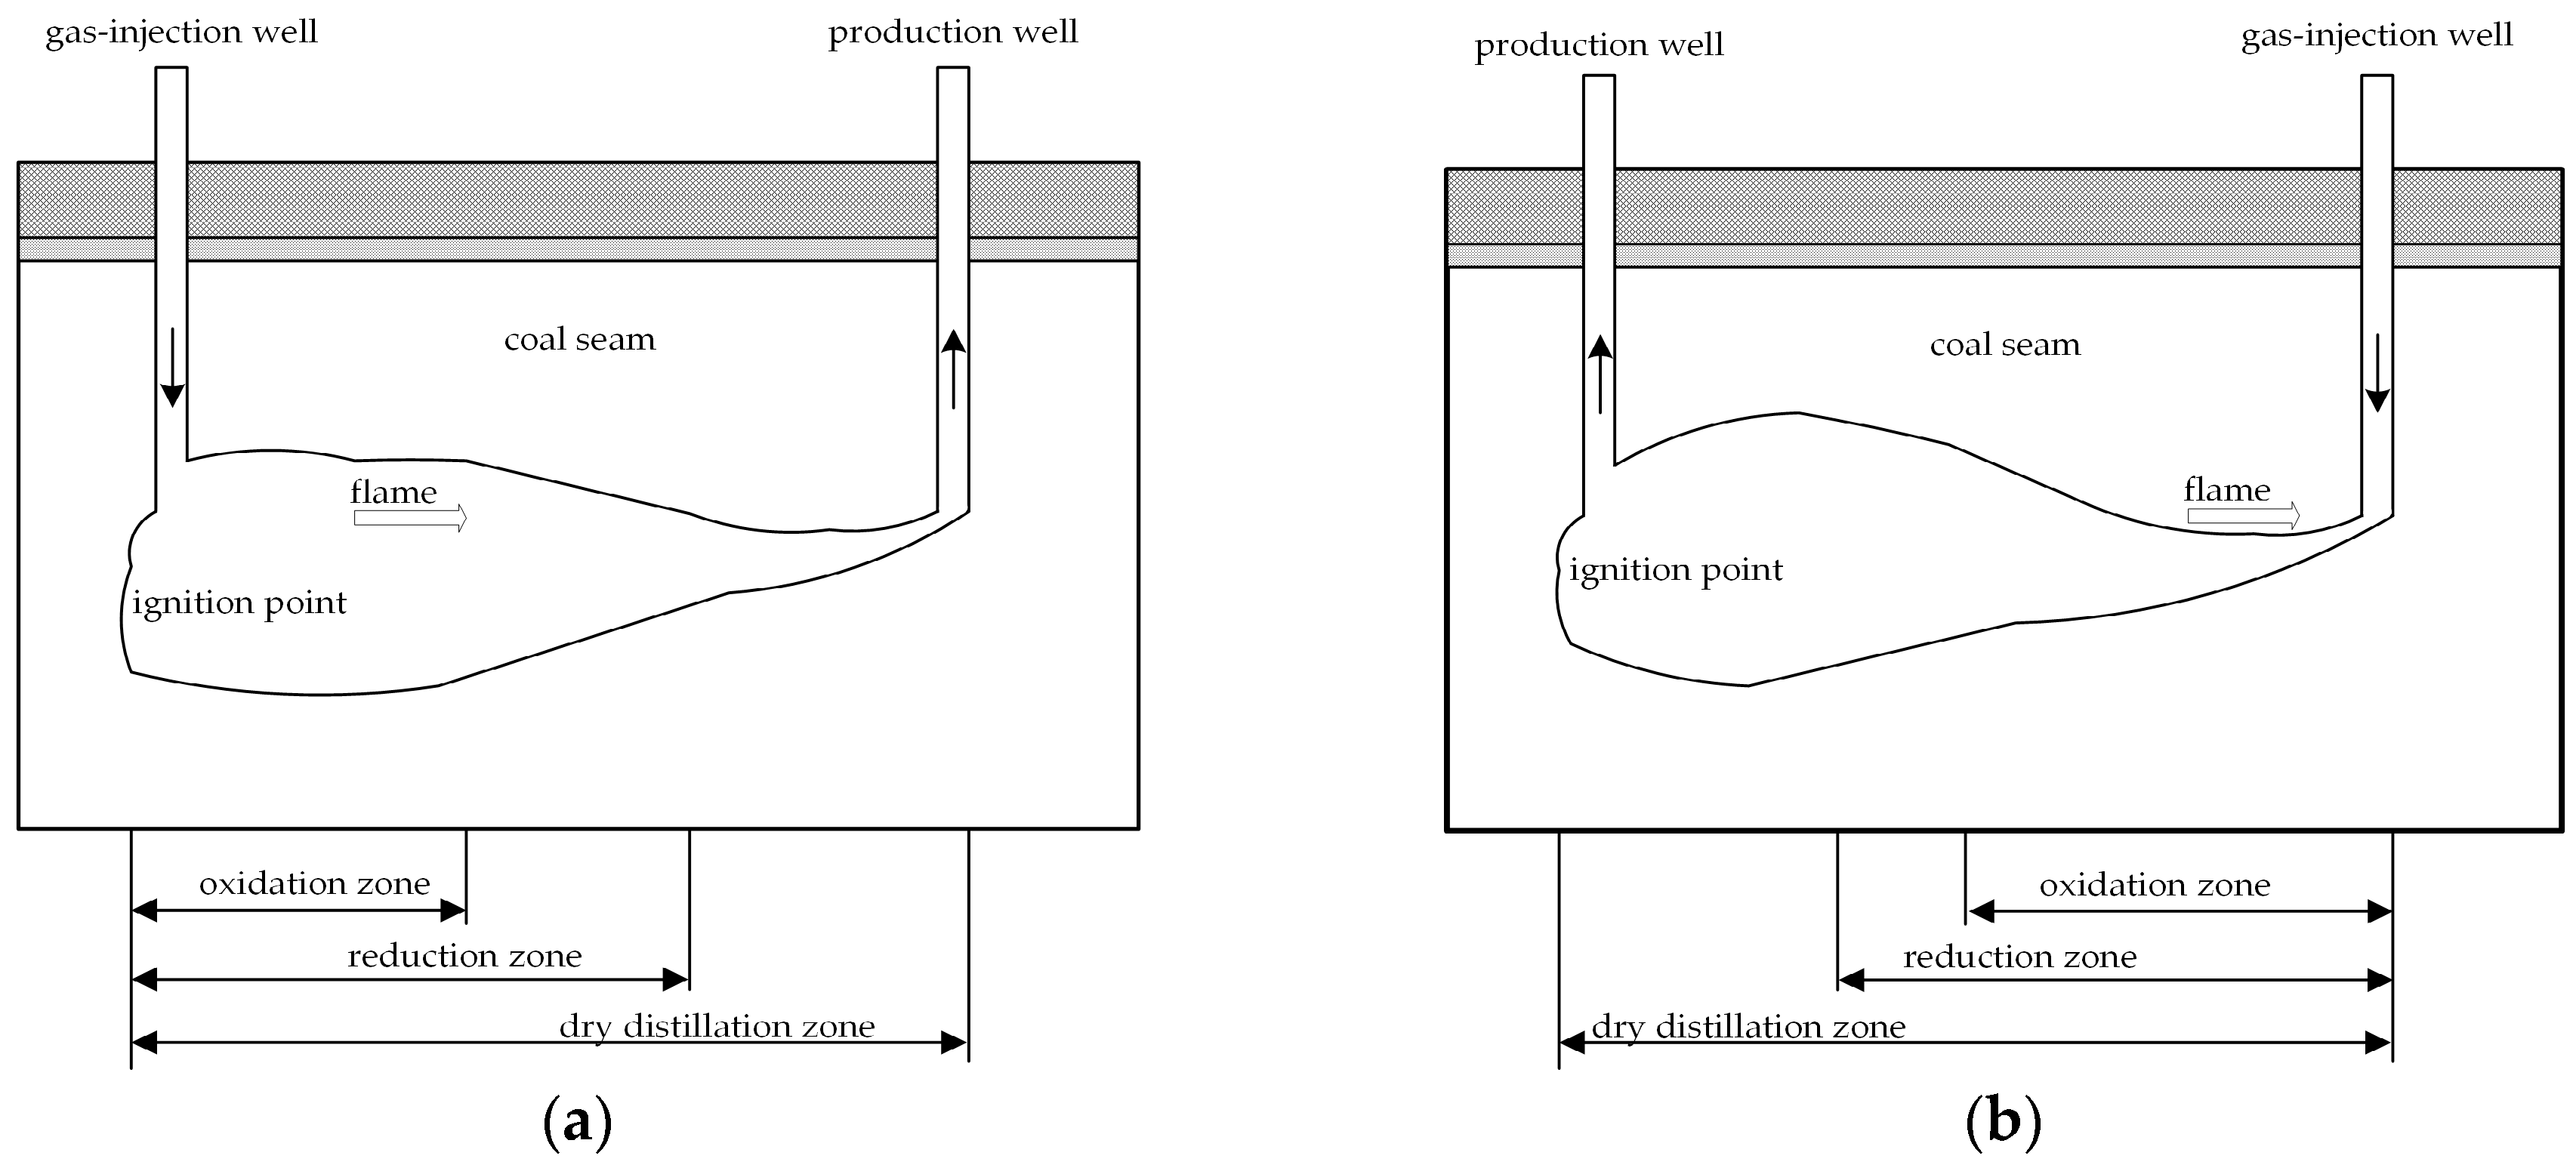
The UCG system is illustrated in Figure 1. An injection well is used to introduce the gasifying agents (air or oxygen), and the coal is ignited under certain conditions. A flame front is generated and the coal is gasified as the flame front moves through the seam. A production well, drilled downstream, collects the product gases. During UCG operation, three zones are formed along the gasification channel according to the temperature distribution and the reactions that occur between the coal and gasifying agents; these are the oxidation, reduction, and dry distillation zones, where combustion, gasification, and pyrolysis take place [10,11,12,13], respectively, as shown in Figure 1. In the oxidation zone, after the coal seam is ignited, oxygen reacts with the coal and produces tremendous heat; the highest temperature is obtained in this zone [14]. In the reduction zone, the movement of the generated steam and CO2 carries heat along the channel, whereupon the reduction reaction occurs between the gasifying agents and coal in the presence of the thermal energy from the upstream oxidation reaction. In addition, H2 and CO are produced by the catalytic action of some iron-bearing minerals in this zone. As heat is consumed, the temperature grows insufficient for the reduction reaction; however, pyrolysis and hydration of the coal will occur because of the residual heat in the gas. Volatile matter is released, including many kinds of hydrocarbons, steam, tar, and some inorganic gases. This region is designated as the dry distillation zone. Through these three zones, the product gas, containing mainly CO, H2, and CH4, is obtained [15].
According to the directions of flame and gas propagation, the UCG gasification technique can be operated as a forward or reverse gasification process. As shown in Figure 1a, in the forward gasification process, the flame follows the direction of the gas flow and moves gradually toward the production well [16], which simultaneously shortens the reduction and dry distillation zones. This leads to decreased concentrations of H2 and CO and worsens the gas quality. Internationally, scholars have attempted to solve this problem in various ways; one approach is reverse gasification, which can correct the insufficient lengths of the reduction and dry distillation zones when the flame front moves toward the production well. In reverse gasification, as shown in Figure 1b, the oxidant is injected through one well while the coal is ignited and products removed through the other, so the flame moves toward the injection well, following the oxidant source [17,18,19]. In this way, the gas flow moves towards the production well and the flame propagates in the direction opposite to the gas flow [20,21]. Under these conditions, the reduction and dry distillation zones are extended, which is beneficial for the decomposition and reduction reactions, and promotes the reactions of H2O (g) and CO2 [22].
In 1941, the Podmoskovnaya UCG plant in the former Soviet Union invented combustion linking techniques in order to connect the injection and production wells and provide a gasification channel for UCG [23]. In the intervening years, linking techniques have been extensively studied, and in practical operations, the reverse combustion linking technique has been widely applied to the linkage stage in the UCG process [20,24,25,26]. With reverse gasification linking, the flame propagates to form a desirable tube-like cavity between the wells, whereas the cavity formed by forward gasification linking is pear-like in shape [18,27]. Laboratory-scale reverse gasification experiments, performed in small-diameter tubes, have also contributed to the understanding and development of reverse gasification [28,29]. The Yuzhno-Abinsk plant in Russia was unique in operating an industrial-scale reverse gasification process. However, both the field trials and laboratory experiments were discontinued in the late 1980s because of the increased worldwide use and availability of natural gas and oil [30]. D.W. Camp summarized underground coal gasification research that took place in the United States from 1948 to 2015, including Controlled Retraction Injection Point (CRIP) field tests in the Rocky Mountain [31]. In recent years, a limited number of reports have been published concerning large-scale pilot systems operated by the reverse gasification process. Liang et al. studied both forward and reverse two-stage gasification processes, and showed that the thermal efficiency of the latter was higher than that of the former [32,33]. Yong et al. studied reverse gasification with a mixed oxygen–steam agent in a simulated pilot system [17]. Jiang et al. simulated the process of reverse combustion in porous media, and the results showed that reverse gasification was a low-temperature process with strong coupling of mass and heat transfer and chemical reaction kinetics [34].
At present, there are no reported comparative studies of the effects of different gasifying agents or comprehensive analyses of the characteristics of the gas components in the three zones for the reverse gasification process. In this paper, tests of a model system based on the reverse UCG method were performed with the objective of establishing a theoretical basis for the control and optimization of the technique. The reactor for the UCG model test was cylindrical, with a length and diameter of 7.4 and 3.5 m, respectively. The interior of the reactor was made of poured refractory material, and the outer wall was made of a special steel used for pressure vessels. The reactor could operate continuously at high temperatures for extended periods, and could sufficiently simulate the UCG conditions. We chose lignite coal for the study, because lignite has the lowest degree of coalification and is unfit for mining. Furthermore, because it possesses abundant pore structure and shows high gasification activity, it is regarded as more suitable for underground coal gasification [9]. We compared the use of air and oxygen-enriched air as gasifying agents and analyzed the characteristics of the gas components in the three zones. The transformations of the temperature field and growth rate of the flame front were also quantitatively studied.
2. Experimental
2.1. Methodology and Material
Underground coal gasification is carried out in the actual underground coal seam, so it is difficult to study the characteristics of three zones in the whole process of underground coal gasification through field test. The underground gasification model test can monitor and study the underground gasification process under similar conditions by various advanced sensors. It is hoped that the reverse gasification law can be obtained by the model test in this paper, which can provide basic data and adjustment ideas for the field test.
The lignite coal sample was obtained from the Shenbei coal mine in China. The proximate and ultimate analyses of the coal sample are shown in Table 1.
2.2. Experimental Reactor
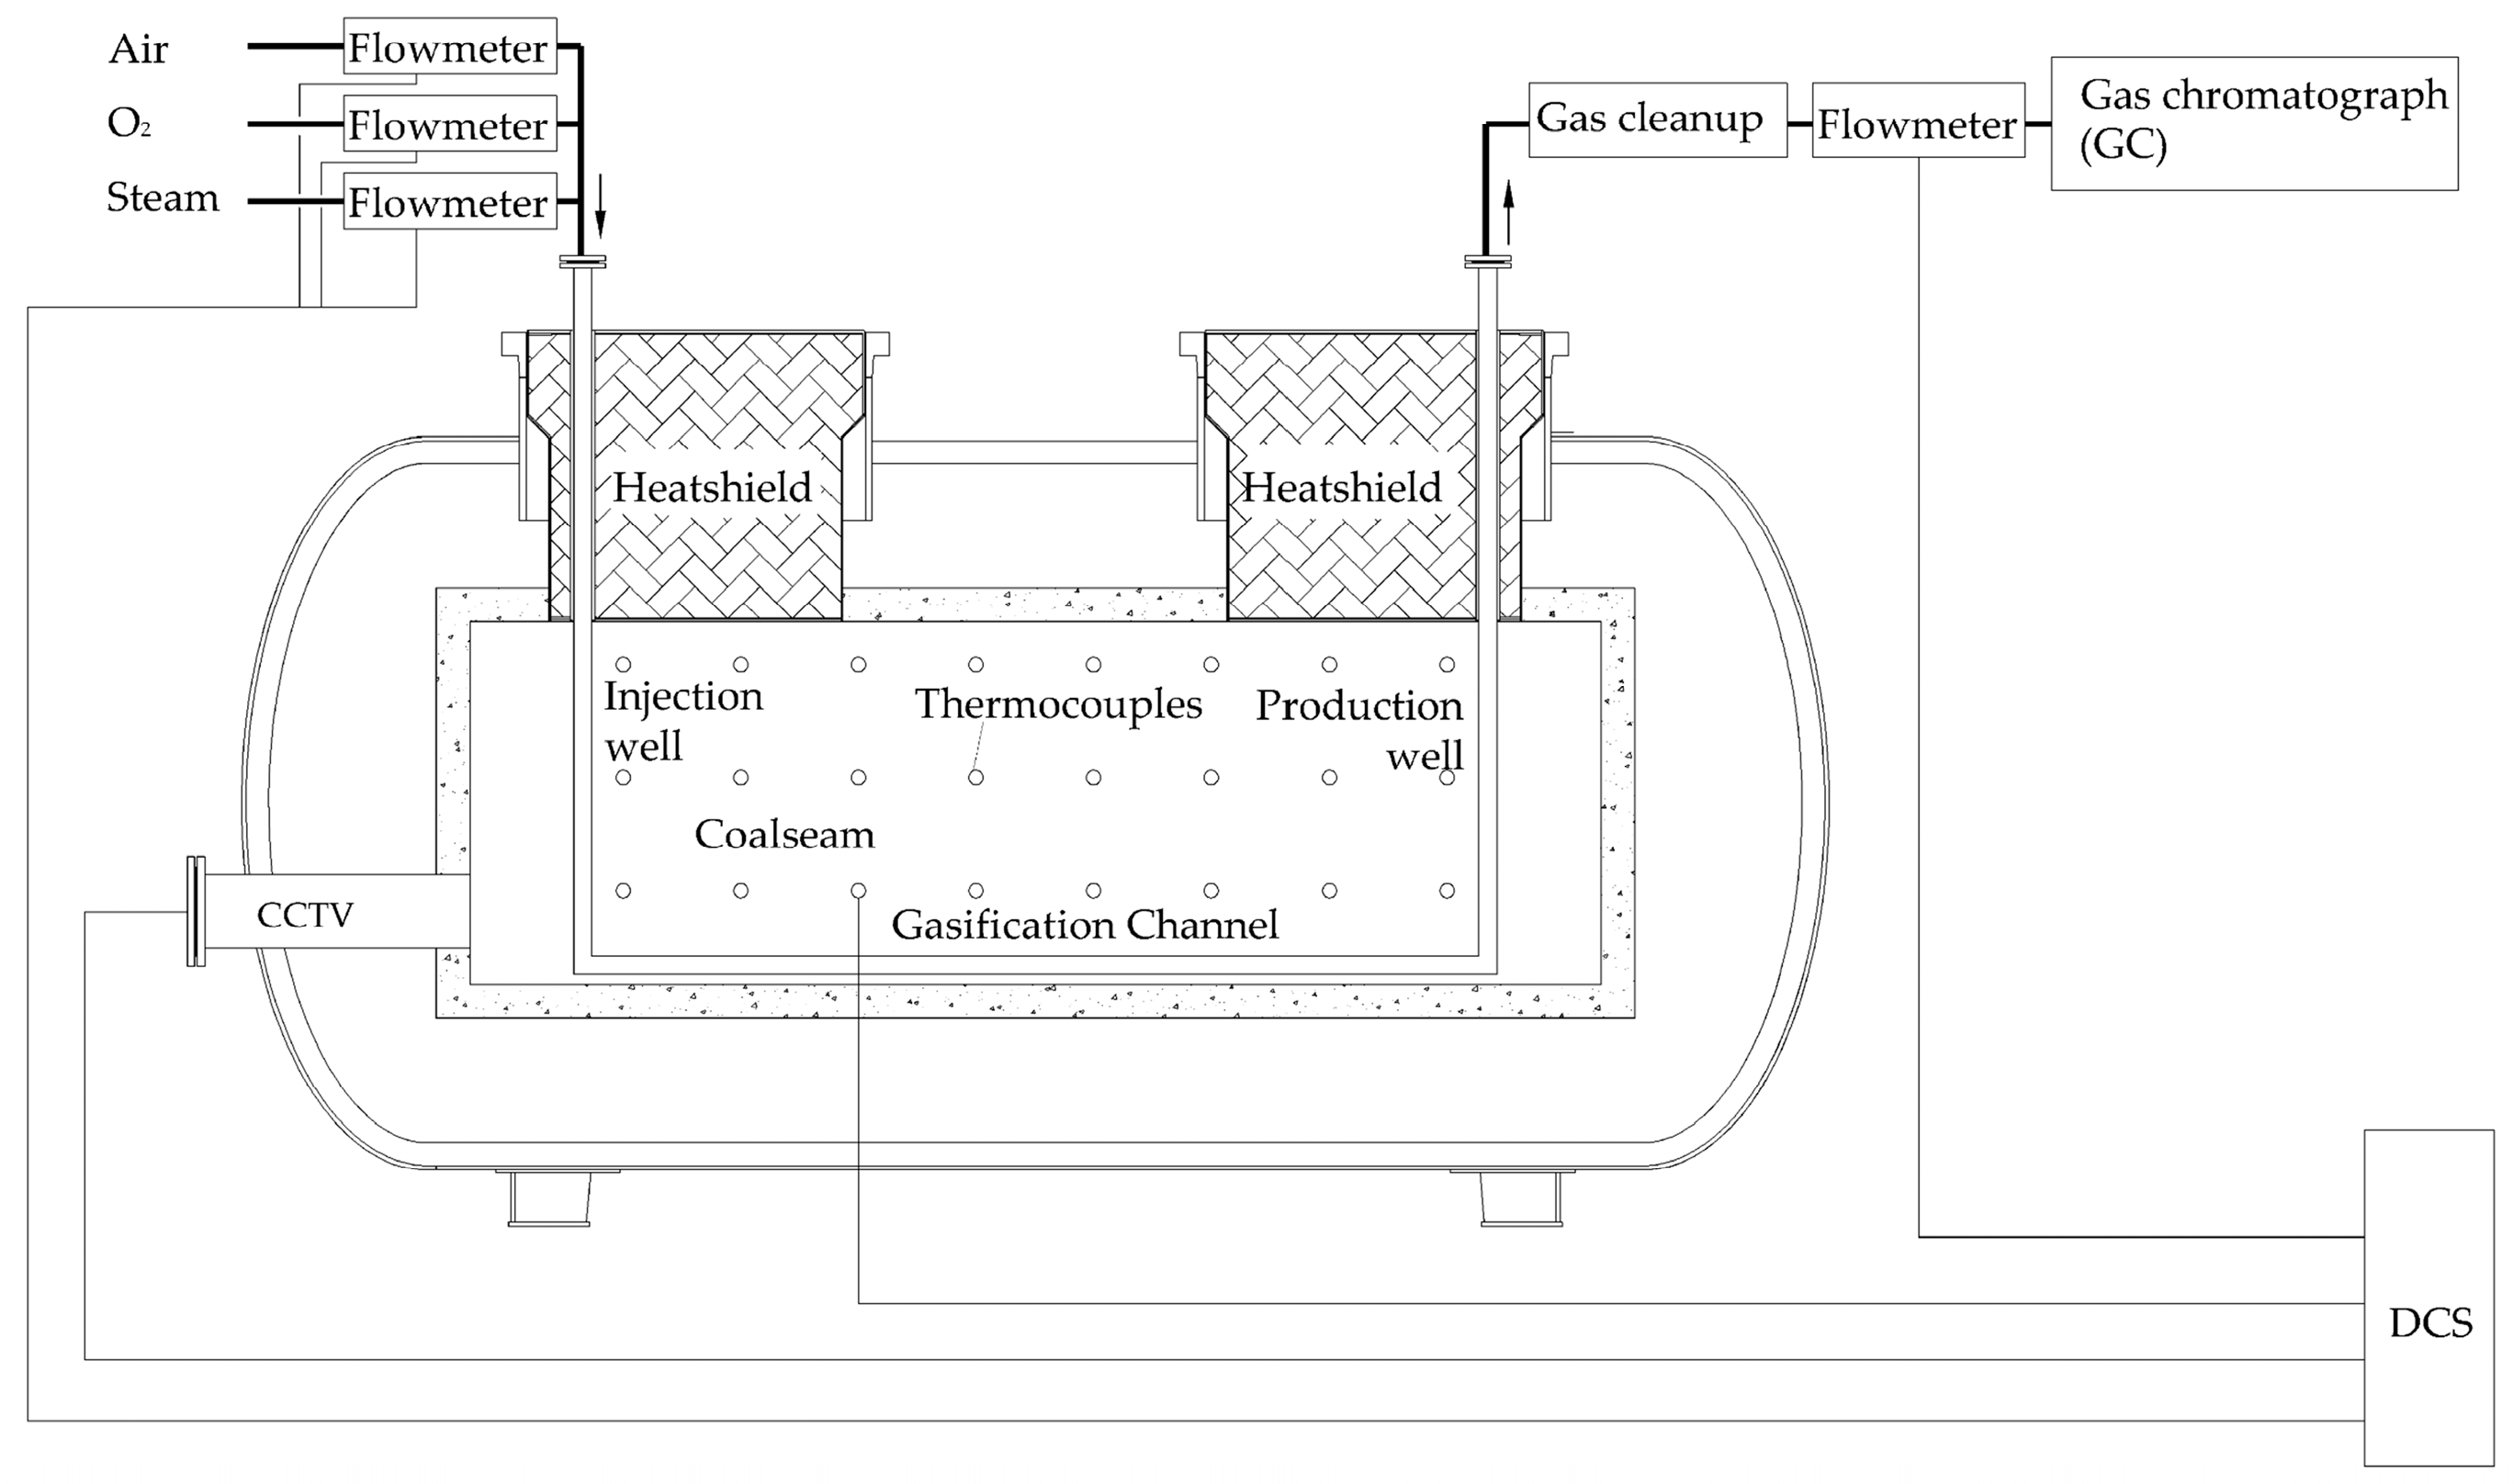
The reactor for the UCG model test was cylindrical, 7.4 m in length, and 3.5 m in diameter, as shown in Figure 2. The interior of the reactor, with dimensions of 5.0 m × 1.6 m × 1.6 m, was made of poured concrete, while the outer wall was made of 16 MnR pressure-vessel steel. The reactor was operated continuously at high temperatures for up to 15 days. Four peepholes were installed in the reactor for closed-circuit industrial television (CCTV) observation, together with five inlet (or outlet) pipes and 33 temperature and pressure measurement ports. Data acquired online during the test were collected using a Honeywell distributed control system (DCS) and saved to a hard disk, from which various curves could be exported.
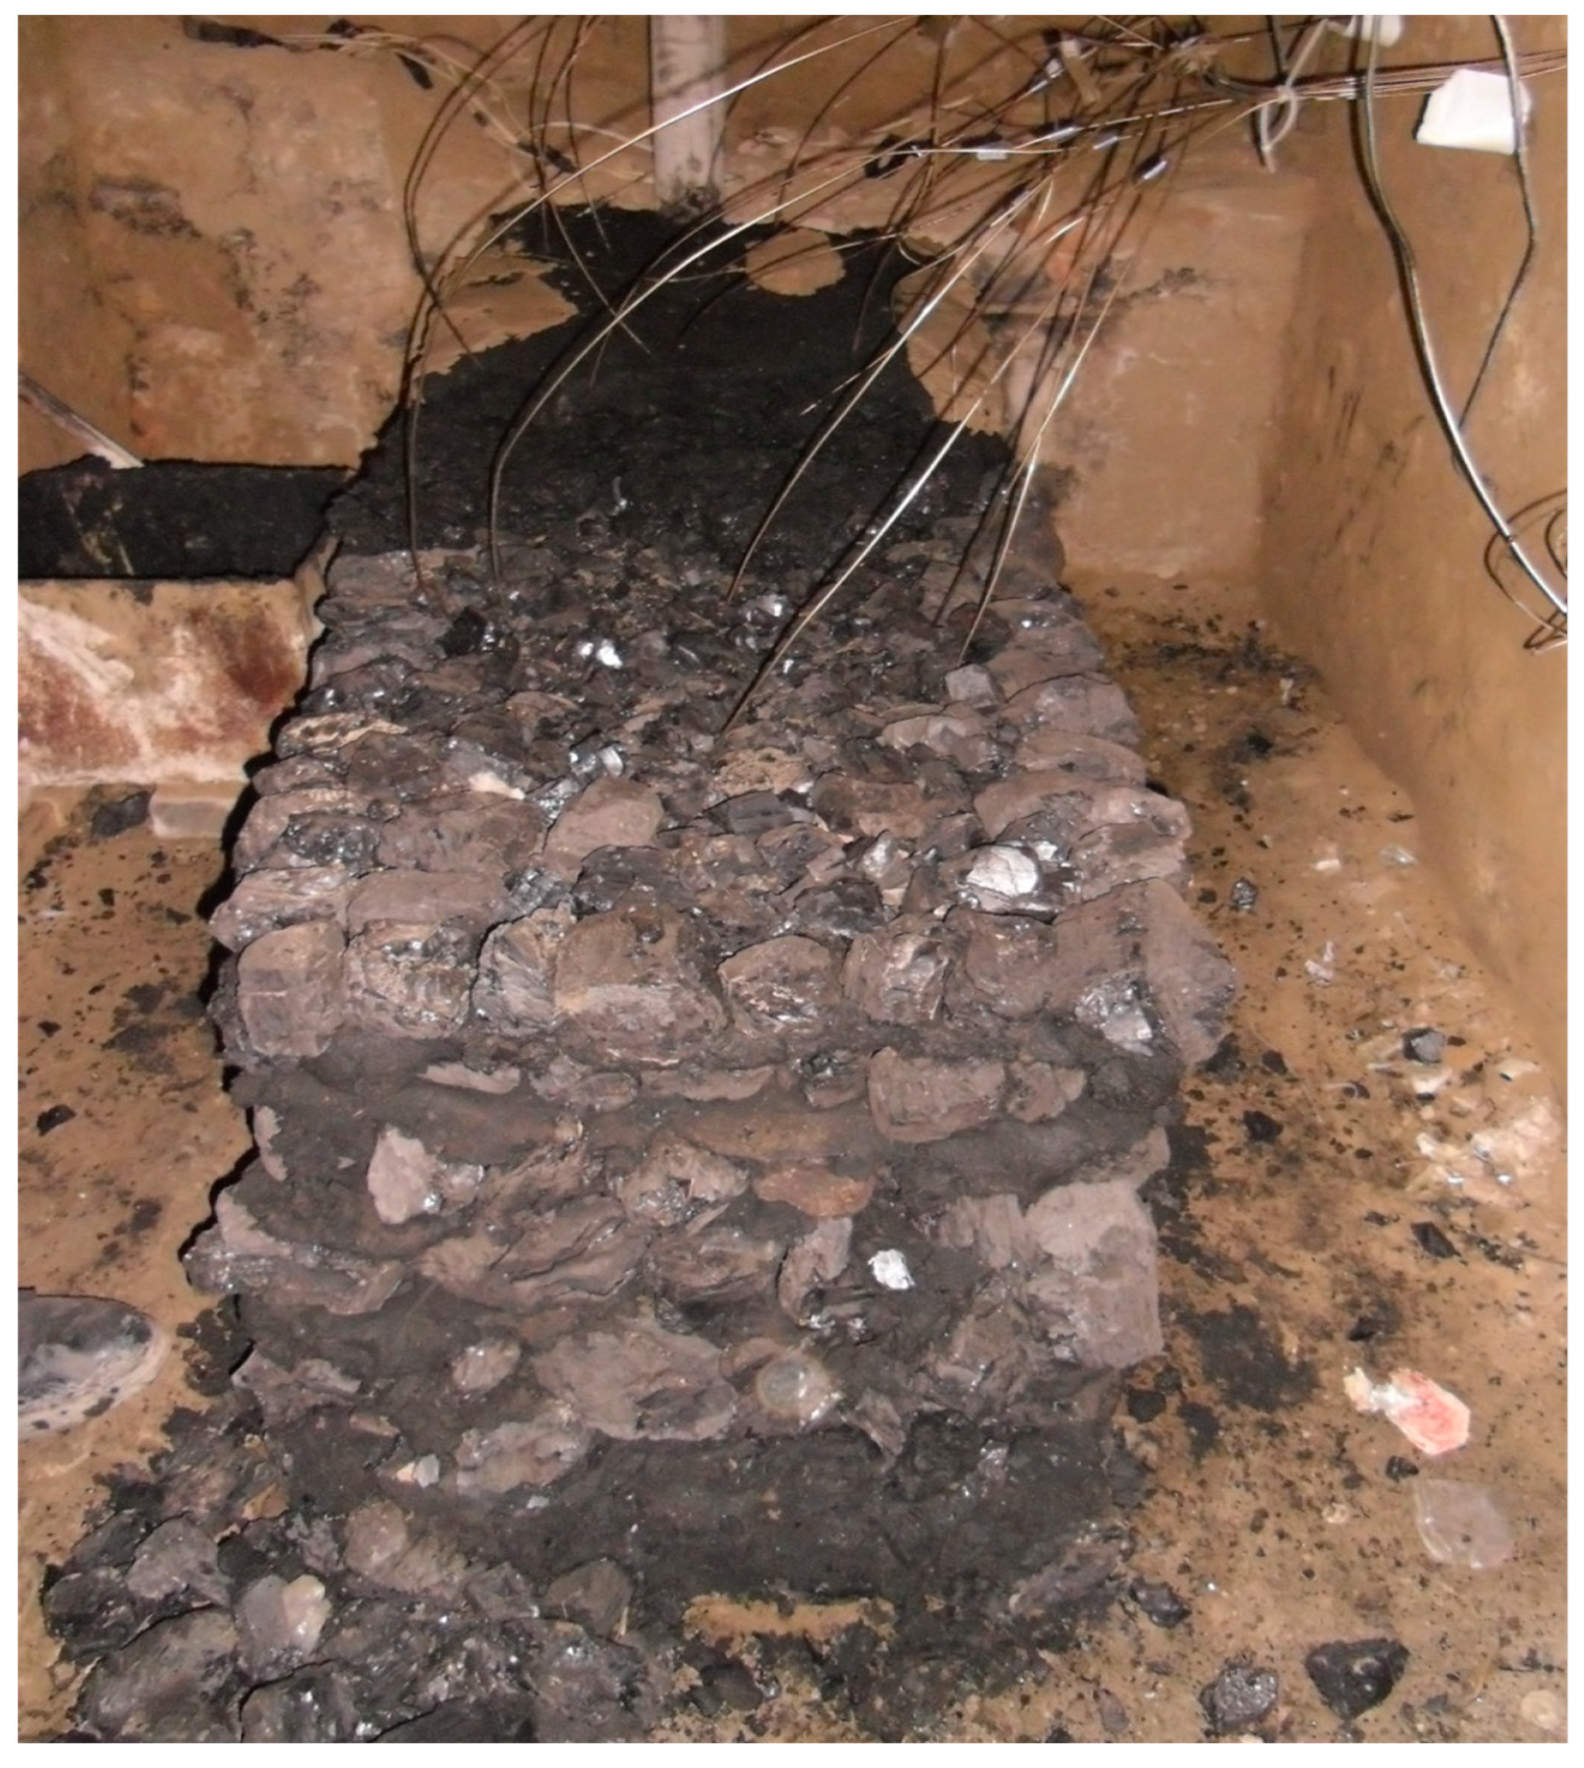
Coal lumps were piled up along the direction of stratification to simulate an underground coal seam with dimensions of 4.0 m × 0.6 m × 0.6 m, where one 50 mm × 50 mm gasification channel in the mid-bottom seam (Figure 3) was reserved. An electric igniter was placed inside the gasification channel to ignite the coal seam. The coal lumps were bonded with clay and pulverized coal mixed with water. The ratio of the coal seam size used in the model test with respect to a typical shaftless underground coal gasification site was 1:160.
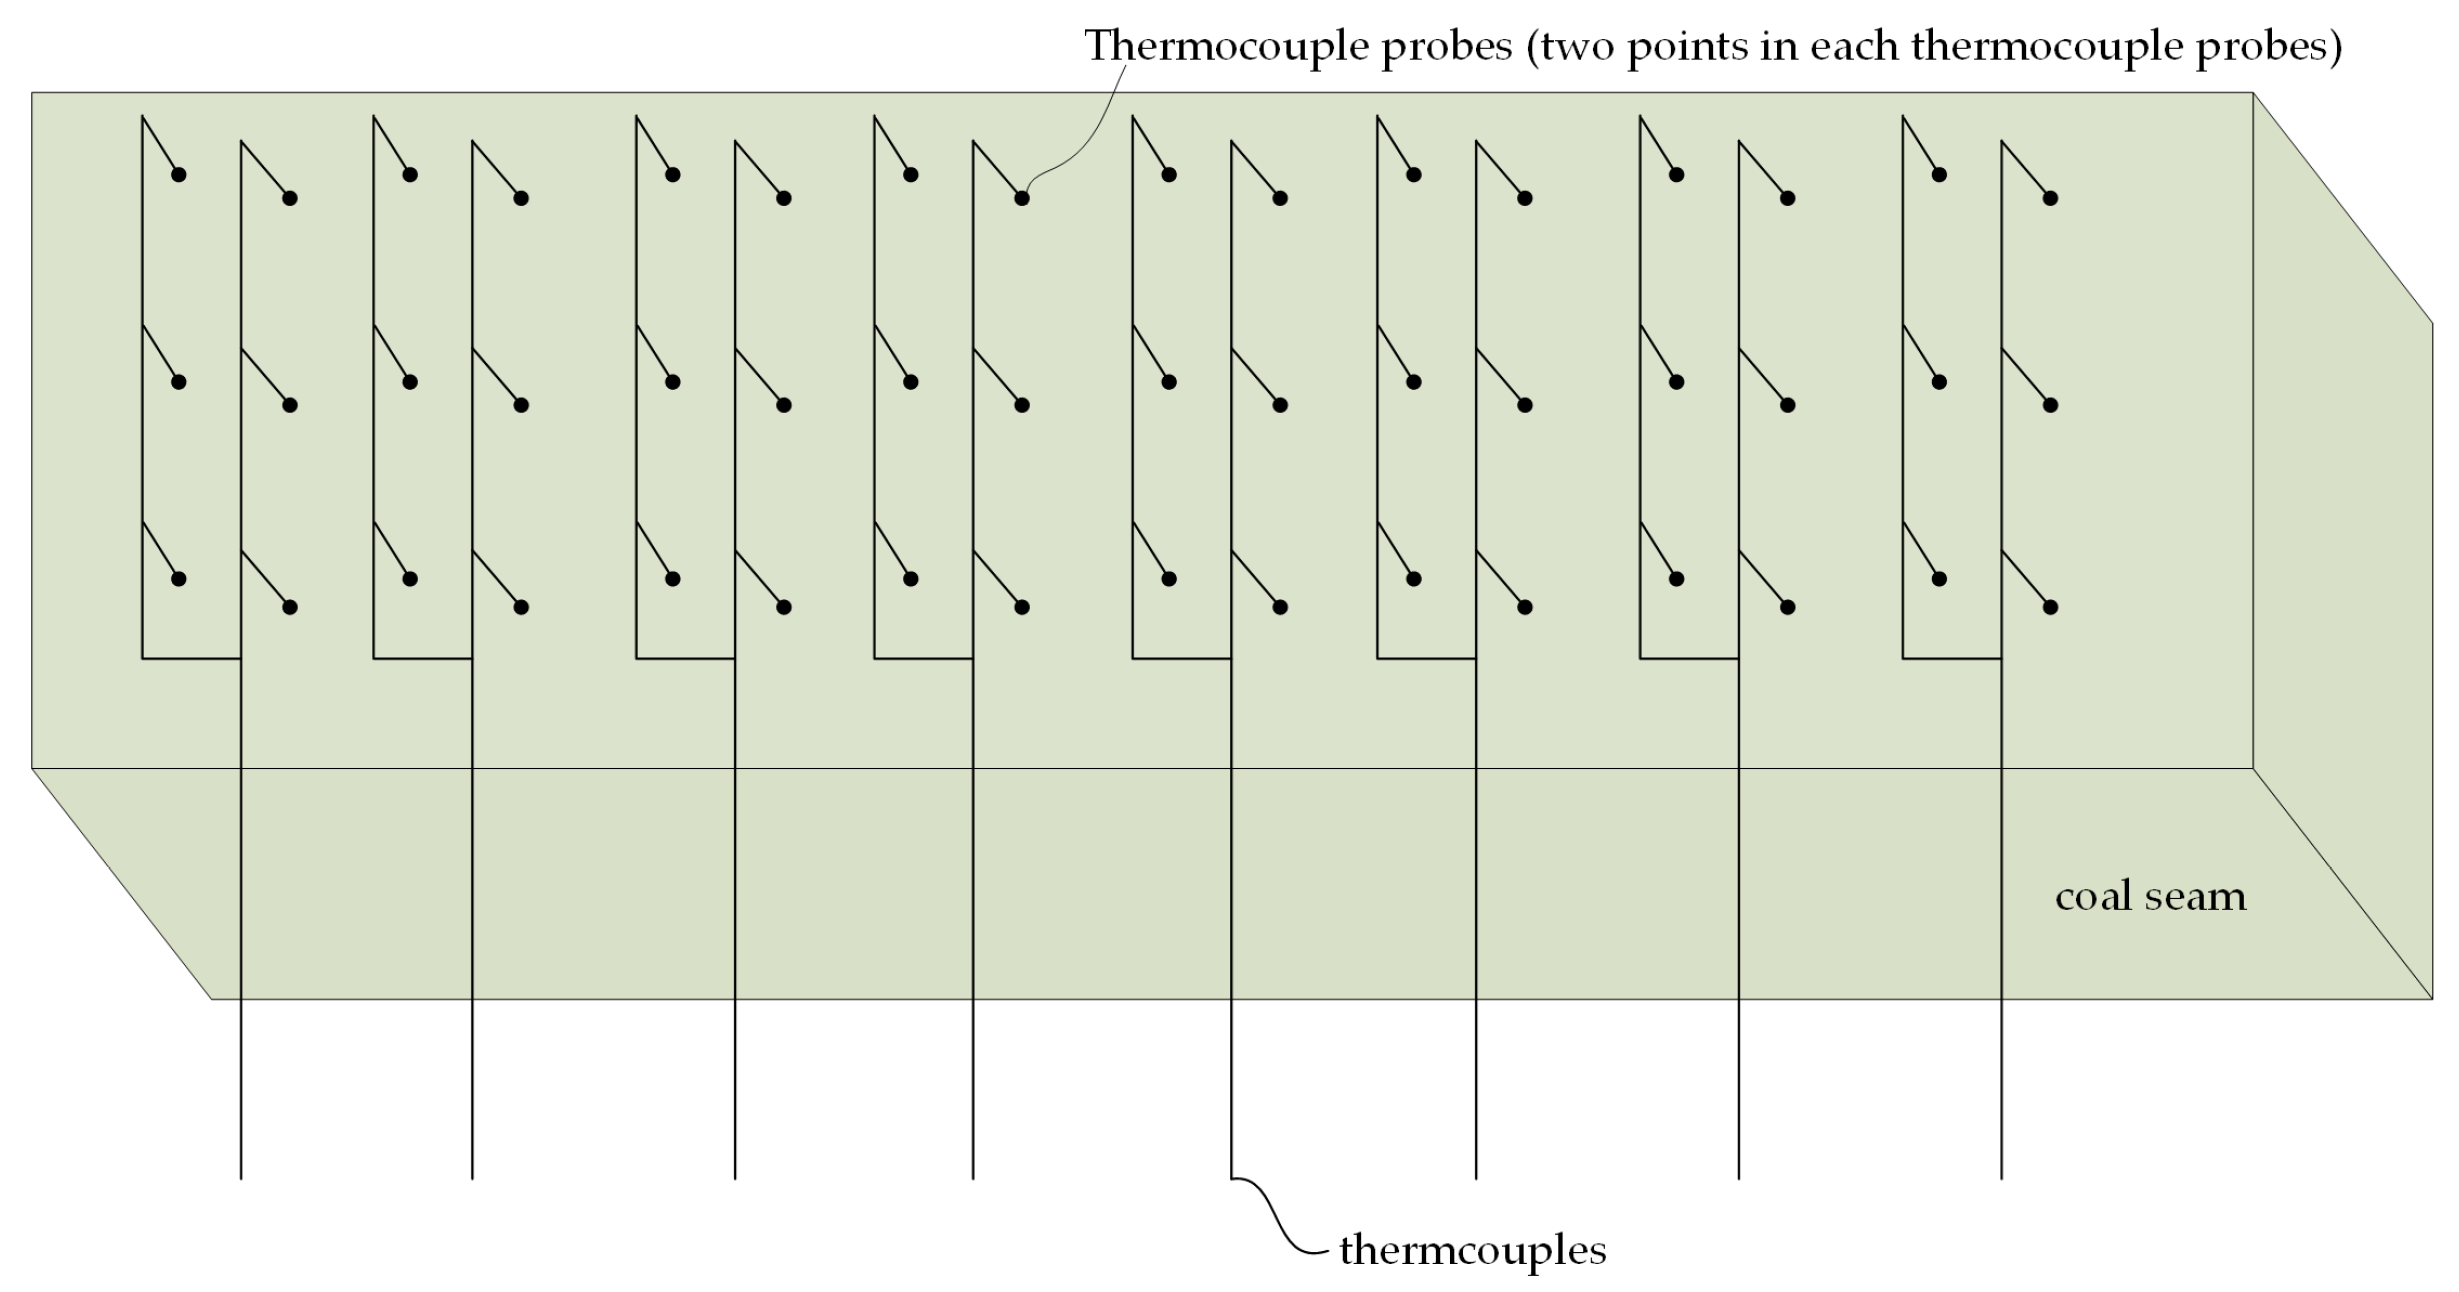
To investigate the temperature of the coal seam during the model test, 96 thermocouples were used (Figure 4). These were nickel–chromium/nickel–silicon (K-type) armored thermocouples, located in eight rows and three levels—upper, middle, and lower. The distance between these levels was 0.20 m, and the rows were separated by 0.52 m.
2.3. Experimental Procedure
After the safety of the UCG model test reactor was ensured, it was prepared for ignition. Oxygen mixed with air was first injected into the coal seam, and electricity was simultaneously supplied. The parameters of the coal seam were observed synchronously by CCTV. If the concentration of oxygen in the gas was less than 1.5% and the temperature around the ignition point was 873 K; the ignition was successful.
The reverse gasification test was officially started after the inlet and outlet wells were reversed and the gasifying agent was injected into the production well. As the gasifying agent, air was injected into the coal seam at flow rates of 10, 15, or 20 Nm3/h, and the product gas compositions were monitored and recorded at 30 min intervals for at least 7 h. The tests were then repeated using oxygen-enriched air containing 35% oxygen as the gasifying agent at flow rates of 10, 15, and 20 Nm3/h. The tests were stopped when the gas quality declined and the temperature field cooled.
3. Experimental Results
3.1. Characteristics of Gas Components
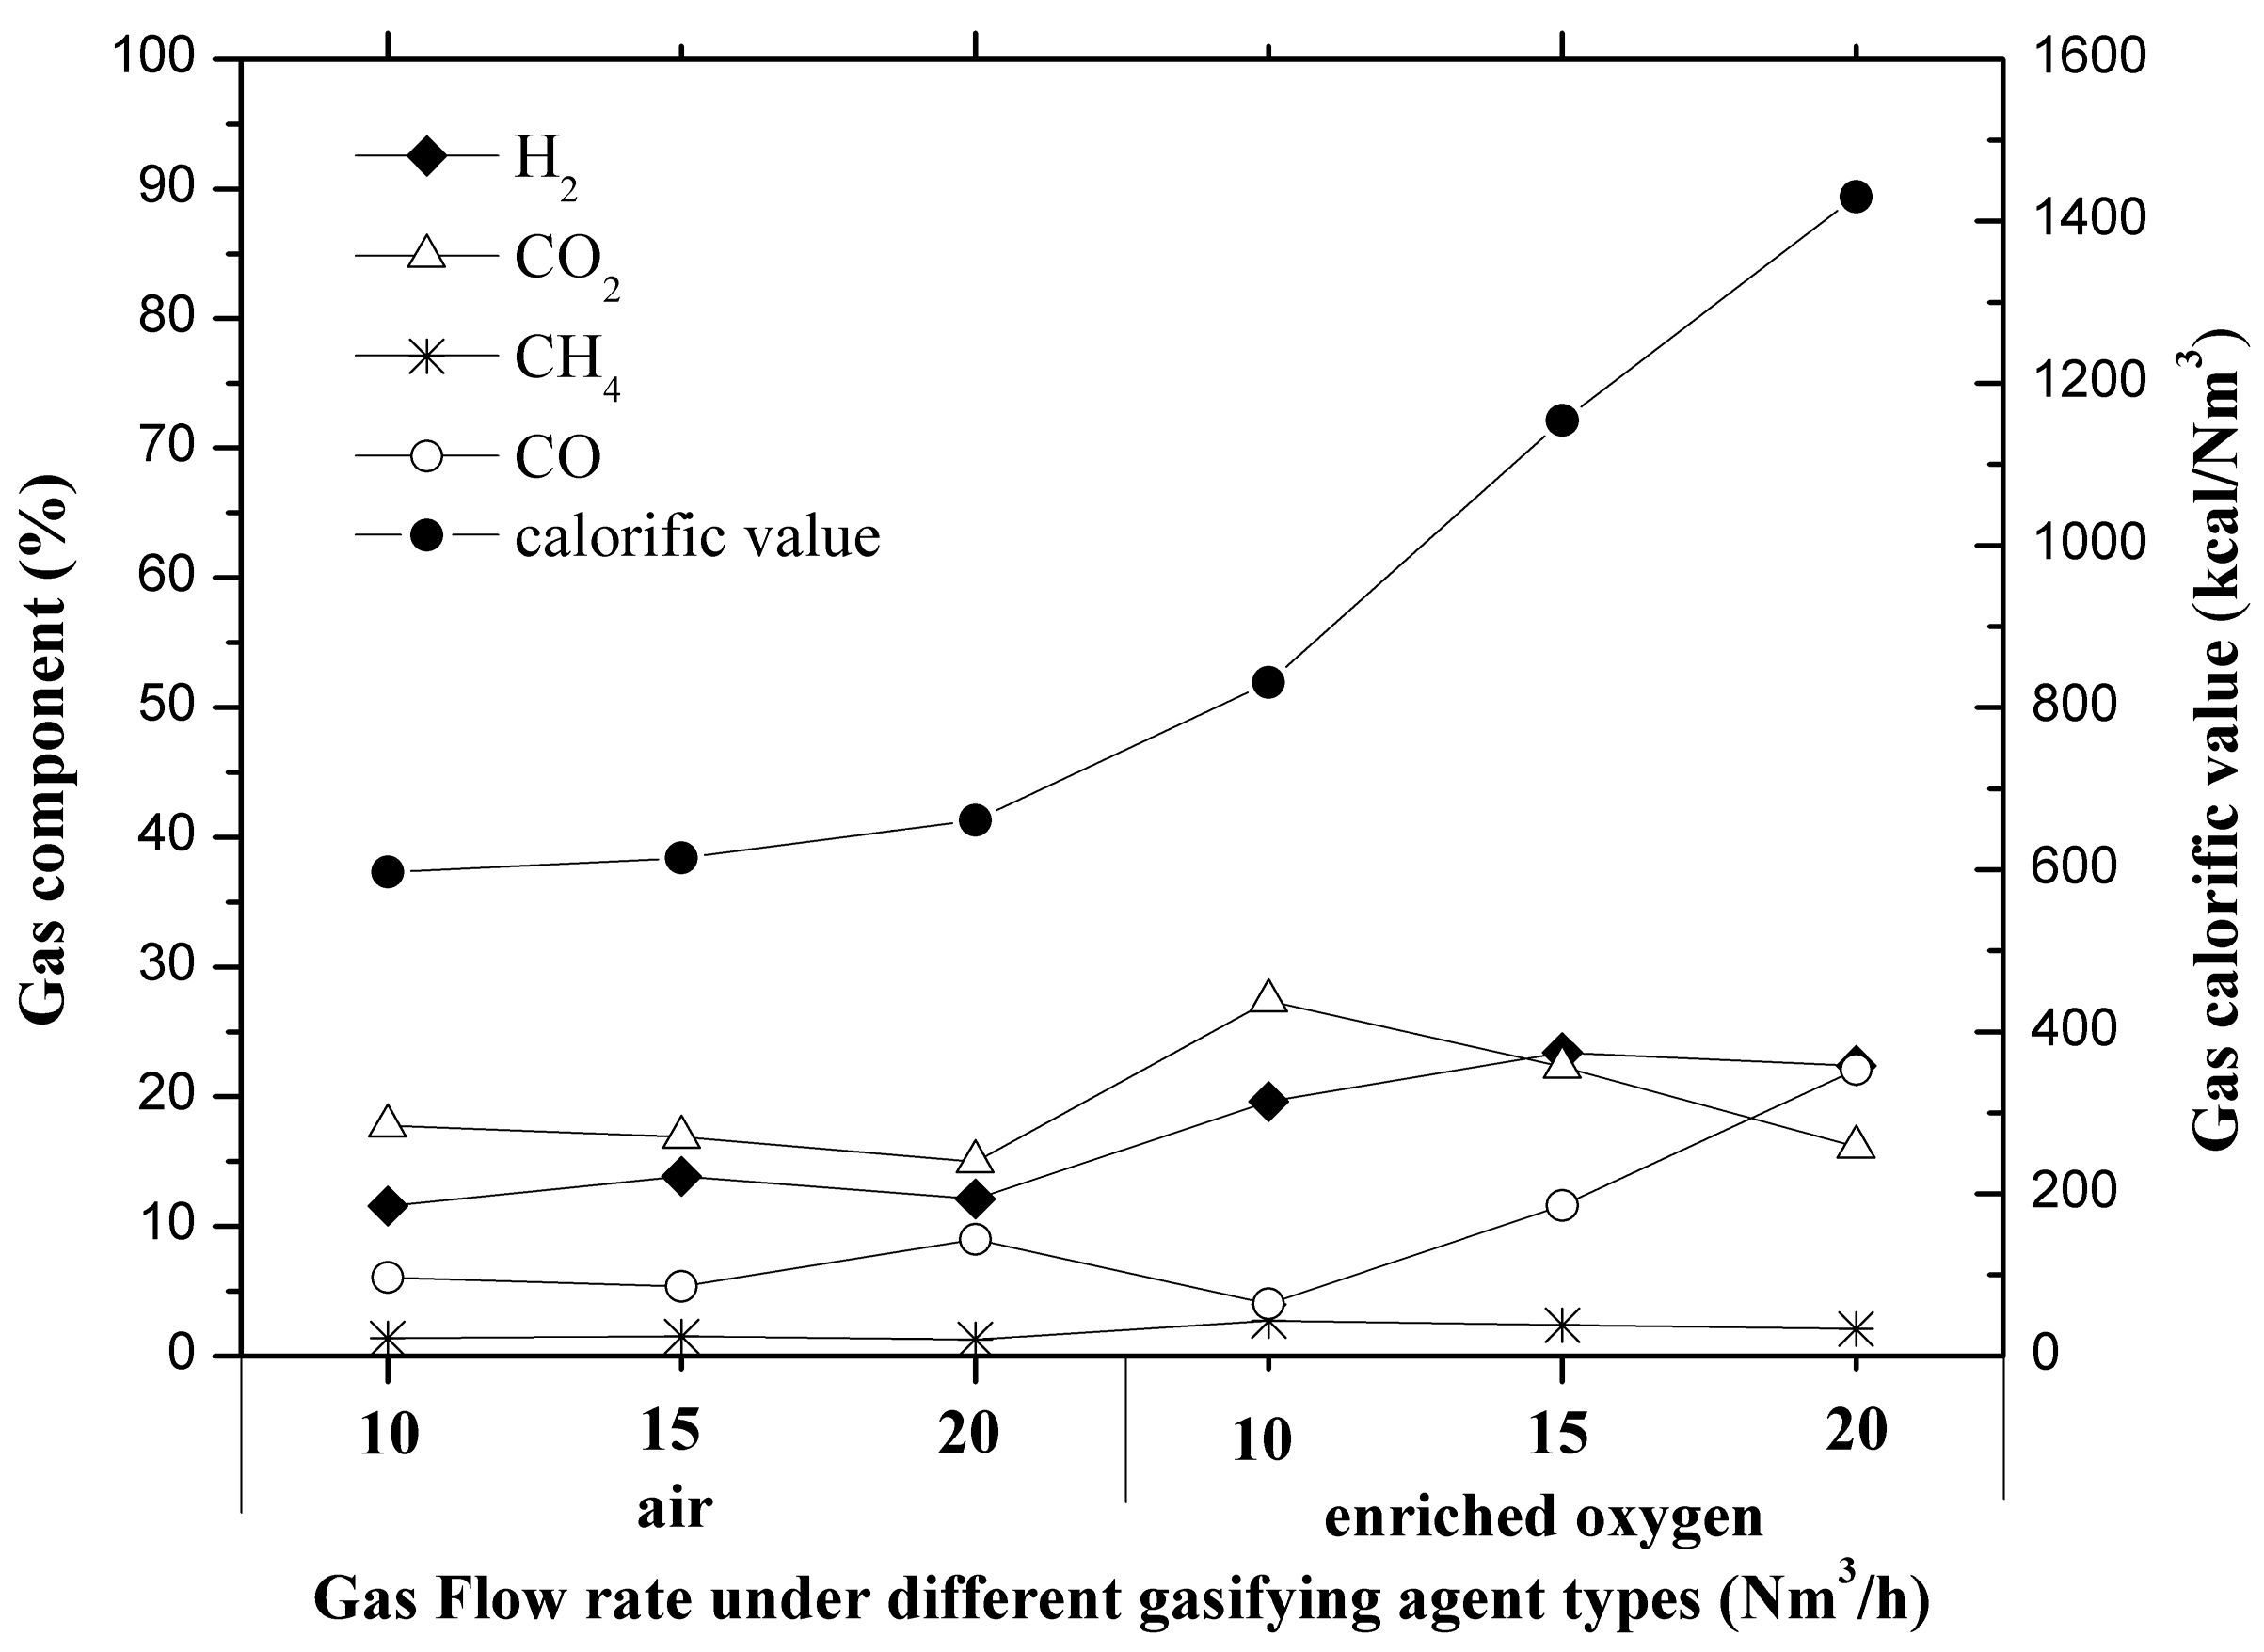
The effects of the gasifying agent on the gas composition and calorific value are illustrated in Figure 5. Clearly, when using air as the gasifying agent, the product gas composition and calorific values change only within a small range; the average H2, CO, and CH4 contents are 11.57%, 6.05%, and 1.36%, respectively, and the average calorific value is 597 kcal/Nm3. When the gasifying agent is replaced by enriched oxygen, the gas composition and calorific values both show significant degrees of growth, and as the flow of enriched oxygen increases, these values obviously increase. Thus, at 20 Nm3/h enriched oxygen, the contents of H2, CO, and CH4 increase to 22.39%, 22.10%, and 2.08%, respectively, which are 2, 3.7, and 1.6 times that of those obtained with air as the gasifying agent, respectively. Finally, the gas calorific value increases to 1430.19 kcal/Nm3, 2.4 times which obtained with air as the gasifying agent. Thus, compared with air, enriched oxygen as the gasifying agent is superior.
These results may be rationalized by the oxidant injection at one well and coal ignition at the other during the reverse UCG process, so that the flame moves toward the injection well, following the oxidant source. However, the low oxygen content in the air and the necessarily increased flow removes some of the heat, resulting in little improvement in the gas composition and calorific value. When the gasifying agent is changed to enriched oxygen, however, the flame front moves toward the gas-injection well faster because of the higher oxygen content. Additionally, the reduction and dry distillation zones become elongated, benefitting the decomposition and reduction reactions and, consequently, the conversions of H2O (g) and CO2 to H2 and CO, respectively [22]. This results in greatly increased gas composition and calorific values, with the CO content showing the most improvement.
3.2. Temperature Field Transformation
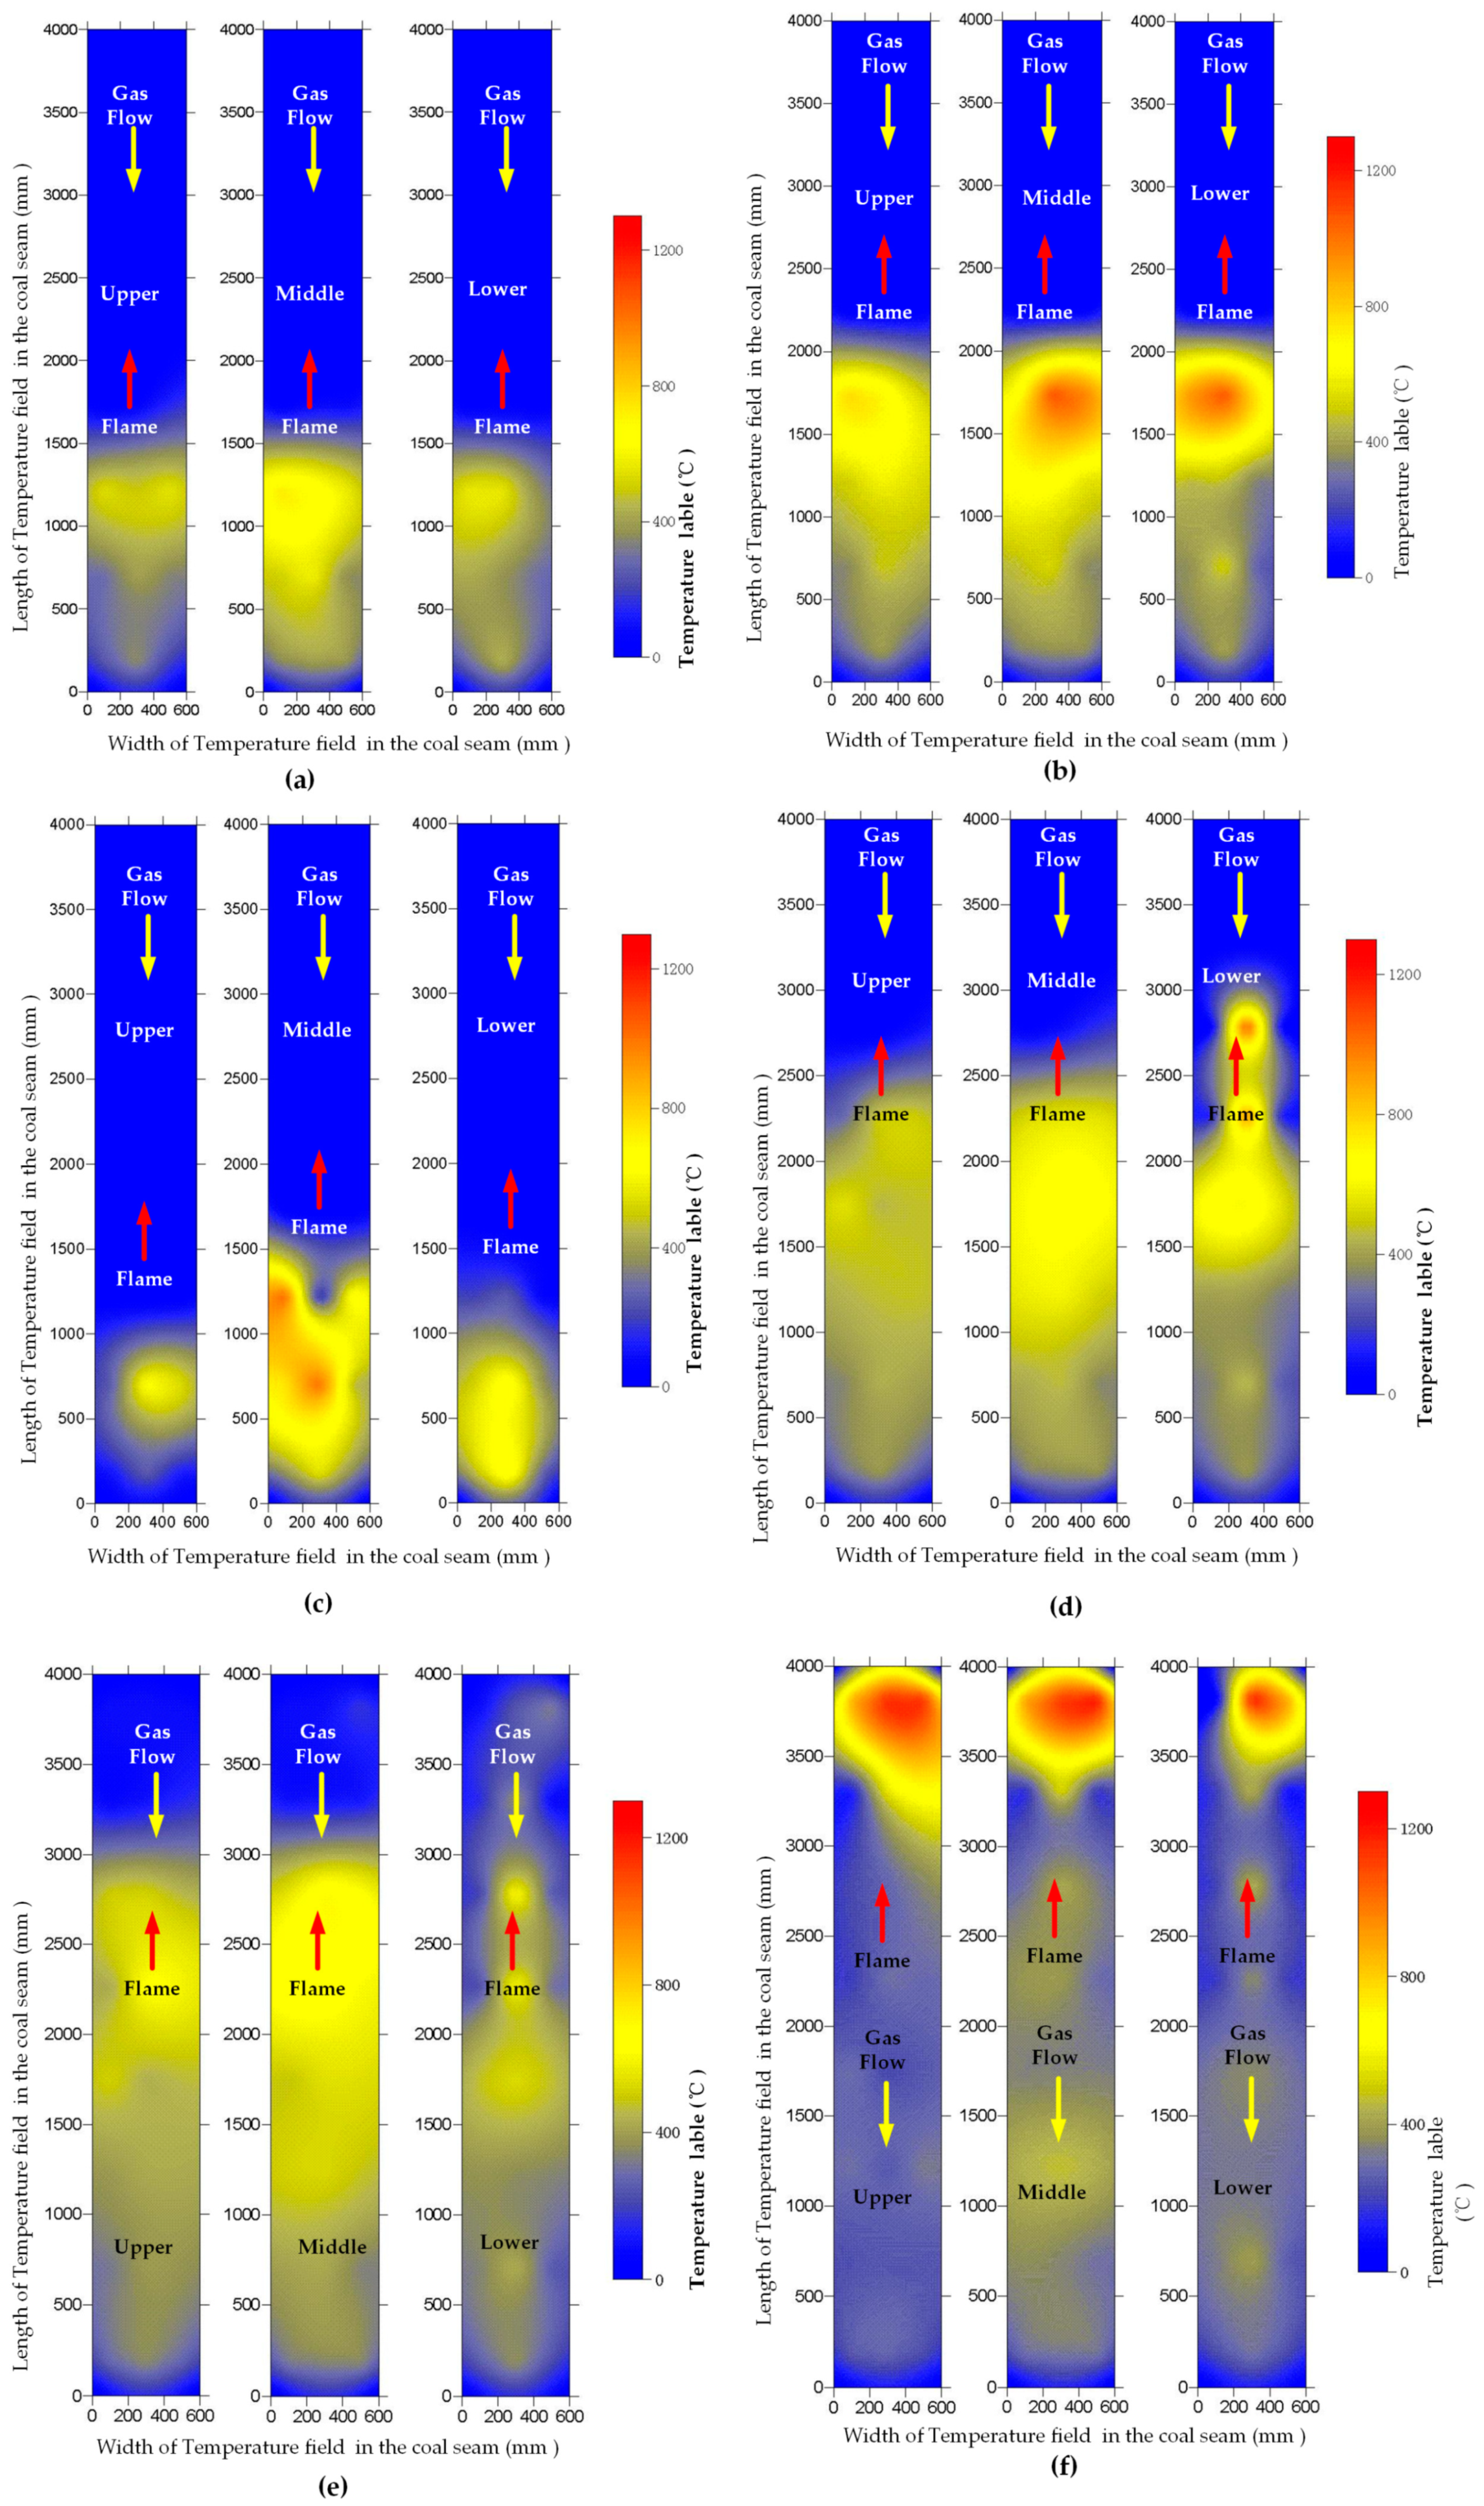
The changes in the temperature field during the reverse UCG model tests are shown in Figure 6.
For the processes using air as the gasifying agent, the flame front moves slowly toward the gas-injection well (toward the 4000 mm direction in Figure 6) as the flow rate increases. The location of the flame front in the middle of the coal seam at 2000 mm means that the reduction and dry distillation zones are shorter relative to those observed with enriched oxygen. This is a result of the lower oxygen content in the air, and accounts for the lower gas composition and calorific values.
When the gasifying agent is replaced by enriched oxygen, the flame front moves quickly toward the gas-injection well as the flow of the gasifying agent increases, with the flame front reaching the gas-injection side of the coal seam. This places the entire coal seam in the reaction zone, and the reduction and dry distillation zones are much longer than when air was used. This is because, in the reverse UCG process, in which the oxidant is injected from one well and coal is ignited in the other, the flame moves towards the injection well following the oxidant source; the higher oxygen content in the enriched mixture induces quicker movement of the flame front toward the gas-injection well and improves the gas composition and calorific values.
3.3. Growth Rate of the Flame Front
To evaluate the growth rate of the flame front in the reverse UCG model test, we analyzed the temperature field data that were exported from the DCS, calculated the position of the flame front, and then obtained its growth rate, as shown in Figure 7.
The experimental data show that, in the process using air as the gasifying agent, as the flow increases from 10 to 20 Nm3/h, the growth rate of the flame front increases slowly from 0.89 to 1.59 m/day. Thus, the flow of air has little effect on the growth rate of the flame front.
For the enriched oxygen gasifying agent, the flow increase from 10 to 20 Nm3/h affords a rapid increase in the growth rate of the flame front, from 1.80 to 4.88 m/day. Moreover, when the flow of enriched oxygen is 10 Nm3/h, the flame-front growth rate is slightly higher than that of air at 20 Nm3/h. This is because the greater oxygen content in the enriched mixture enables the flame front to move quicker towards the gas-injection well. Clearly, compared with air as the gasifying agent, enriched oxygen is significantly better, which is also proven in the literature [35,36]. In the reverse gasification process, increasing the gas injection rate and oxygen concentration will increase the growth rate of the flame front, which may help to control the gasification position of coal seam.
3.4. Characteristics of Gas Components in the Three Zones
As stated earlier, during UCG operation, three zones are formed along the gasification channel according to the temperature distribution and the reactions between the coal and gasifying agents; that is, an oxidation zone (combustion), reduction zone (gasification), and drying and decomposition zone (pyrolysis). In each test phase below, the gas components were analyzed at least six times before averaging.
3.4.1. Characteristics of Gas Components in the Oxidation Zone
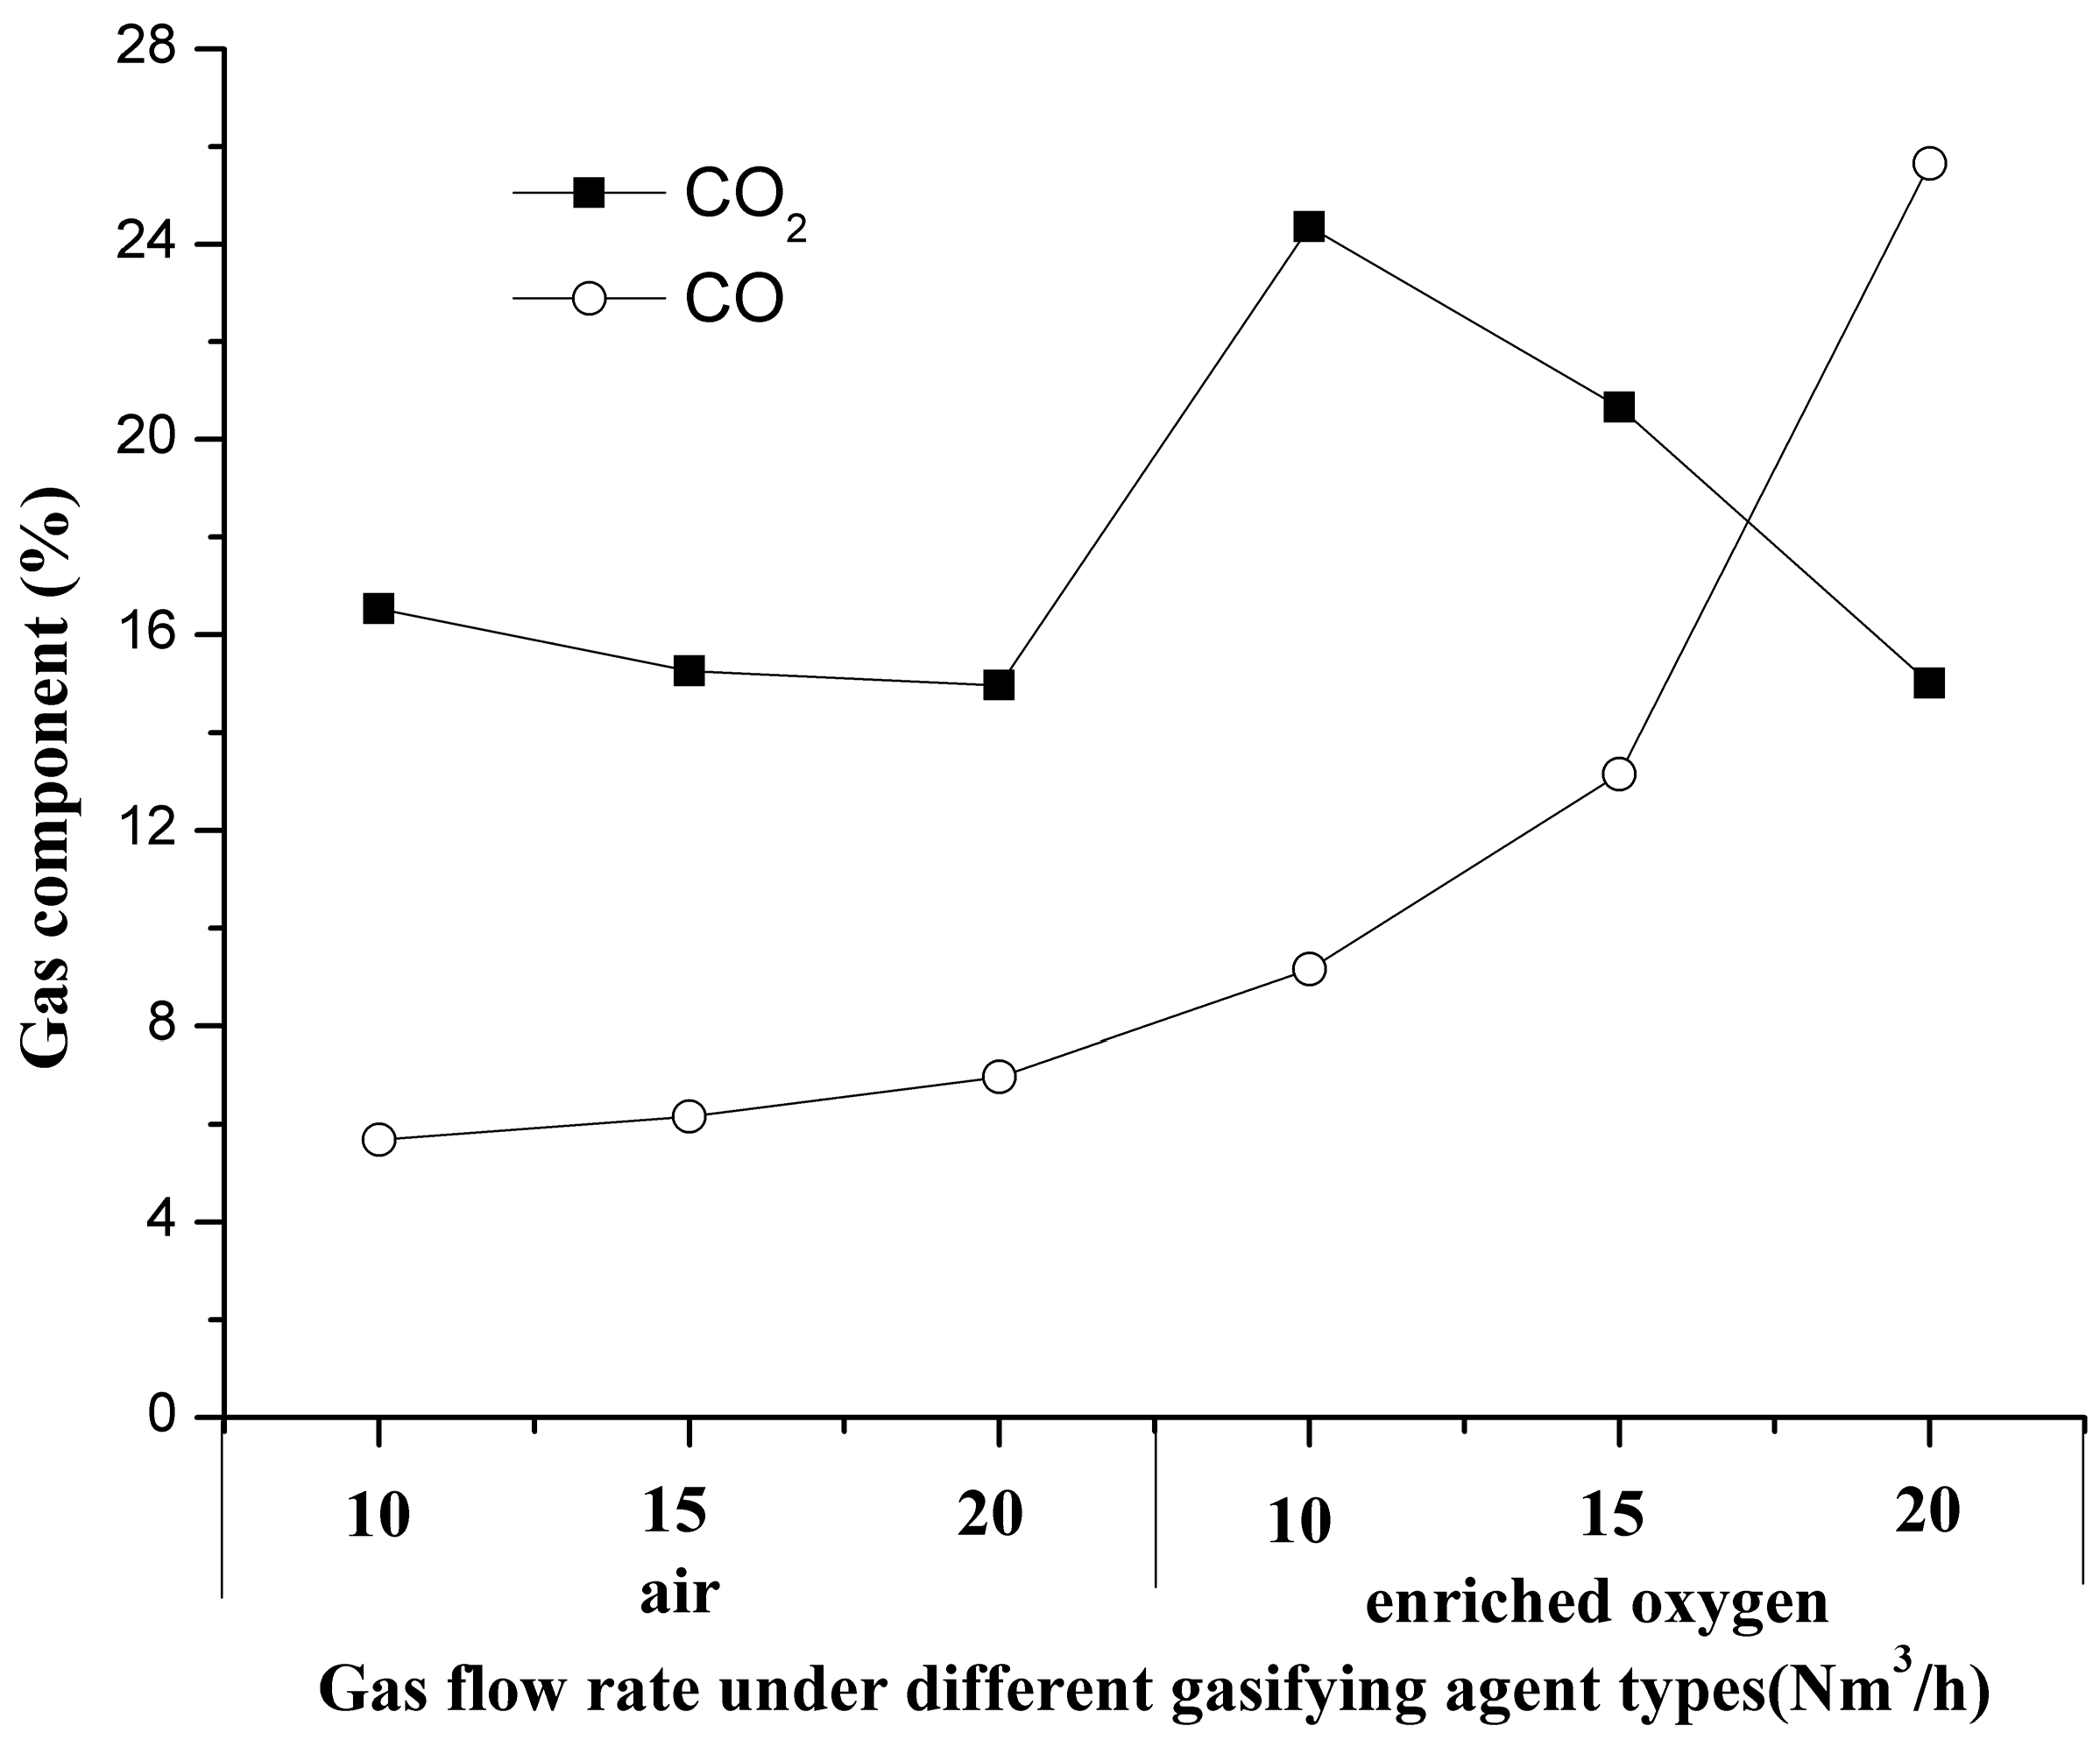
Temperatures between 1173 K and 1723 K were selected as the oxidation zone. For the air-mediated processes, Figure 8 shows that as the flow increases from 10 to 20 Nm3/h, the CO2 content declines somewhat from 16.54% to 14.97%, but the CO levels increase slightly from 5.69% to 6.97%.
Upon changing to the enriched oxygen gasifying agent, the CO2 content increases sharply from the highest value for the air-driven process (14.97%) to 24.35%; then, when the flow of the gasifying agent increases from 10 to 20 Nm3/h, the CO2 content is dramatically reduced, falling to 15.01%, which is lower than that with air as the gasifying agent. Concomitantly, the CO content grows continuously, significantly increasing by 1.8 times, and when the flow of enriched oxygen is increased to 20 Nm3/h, the CO content exceeds that of CO2, which is different from the other test phase. This is mainly because, in the oxidation zone, the reactions between coal and the oxygen contained in the gasifying agent follow the following equations:
C + O2 → CO2
2C + O2 → 2CO
2CO + O2 → 2CO2
The products of Equations (1)–(3) are CO2 and CO, which comprise the major components in the oxidation zone. Although reaction (2) is heterogeneous, reaction (3) is homogeneous, and CO is thus easily oxidized. As the coal in the channel is consumed by gasification, the cavity size increases, so the oxygen in the gasifying agent easily permeates the coal seam [37], which means that CO is more likely to be converted to CO2. All of these factors result in the higher content of CO2 than CO during most of the reverse UCG model tests, except for that with enriched oxygen at a flow of 20 Nm3/h. This is also why the content of CO2 increases sharply when the gasifying agent is changed to enriched oxygen instead of air [17,35].
On the other hand, there is an equilibrium between CO and CO2 in the oxidation zone, which follows the following equation:
where λ is a constant associated with the temperature.
λC + O2 → 2(λ − 1)CO + (2 − λ)CO2
As can be seen from Equation (4), a rise in the temperature of the oxidation reaction zone is advantageous for CO generation, but not conducive to the formation of CO2 [33]. After the gasifying agent is changed to enriched oxygen, and as its flow increases from 10 to 20 Nm3/h, the temperature in the reaction zone constantly rises, resulting in the growth of the CO content, which eventually exceeds that of CO2.
3.4.2. Characteristics of Gas Components in the Reduction Zone
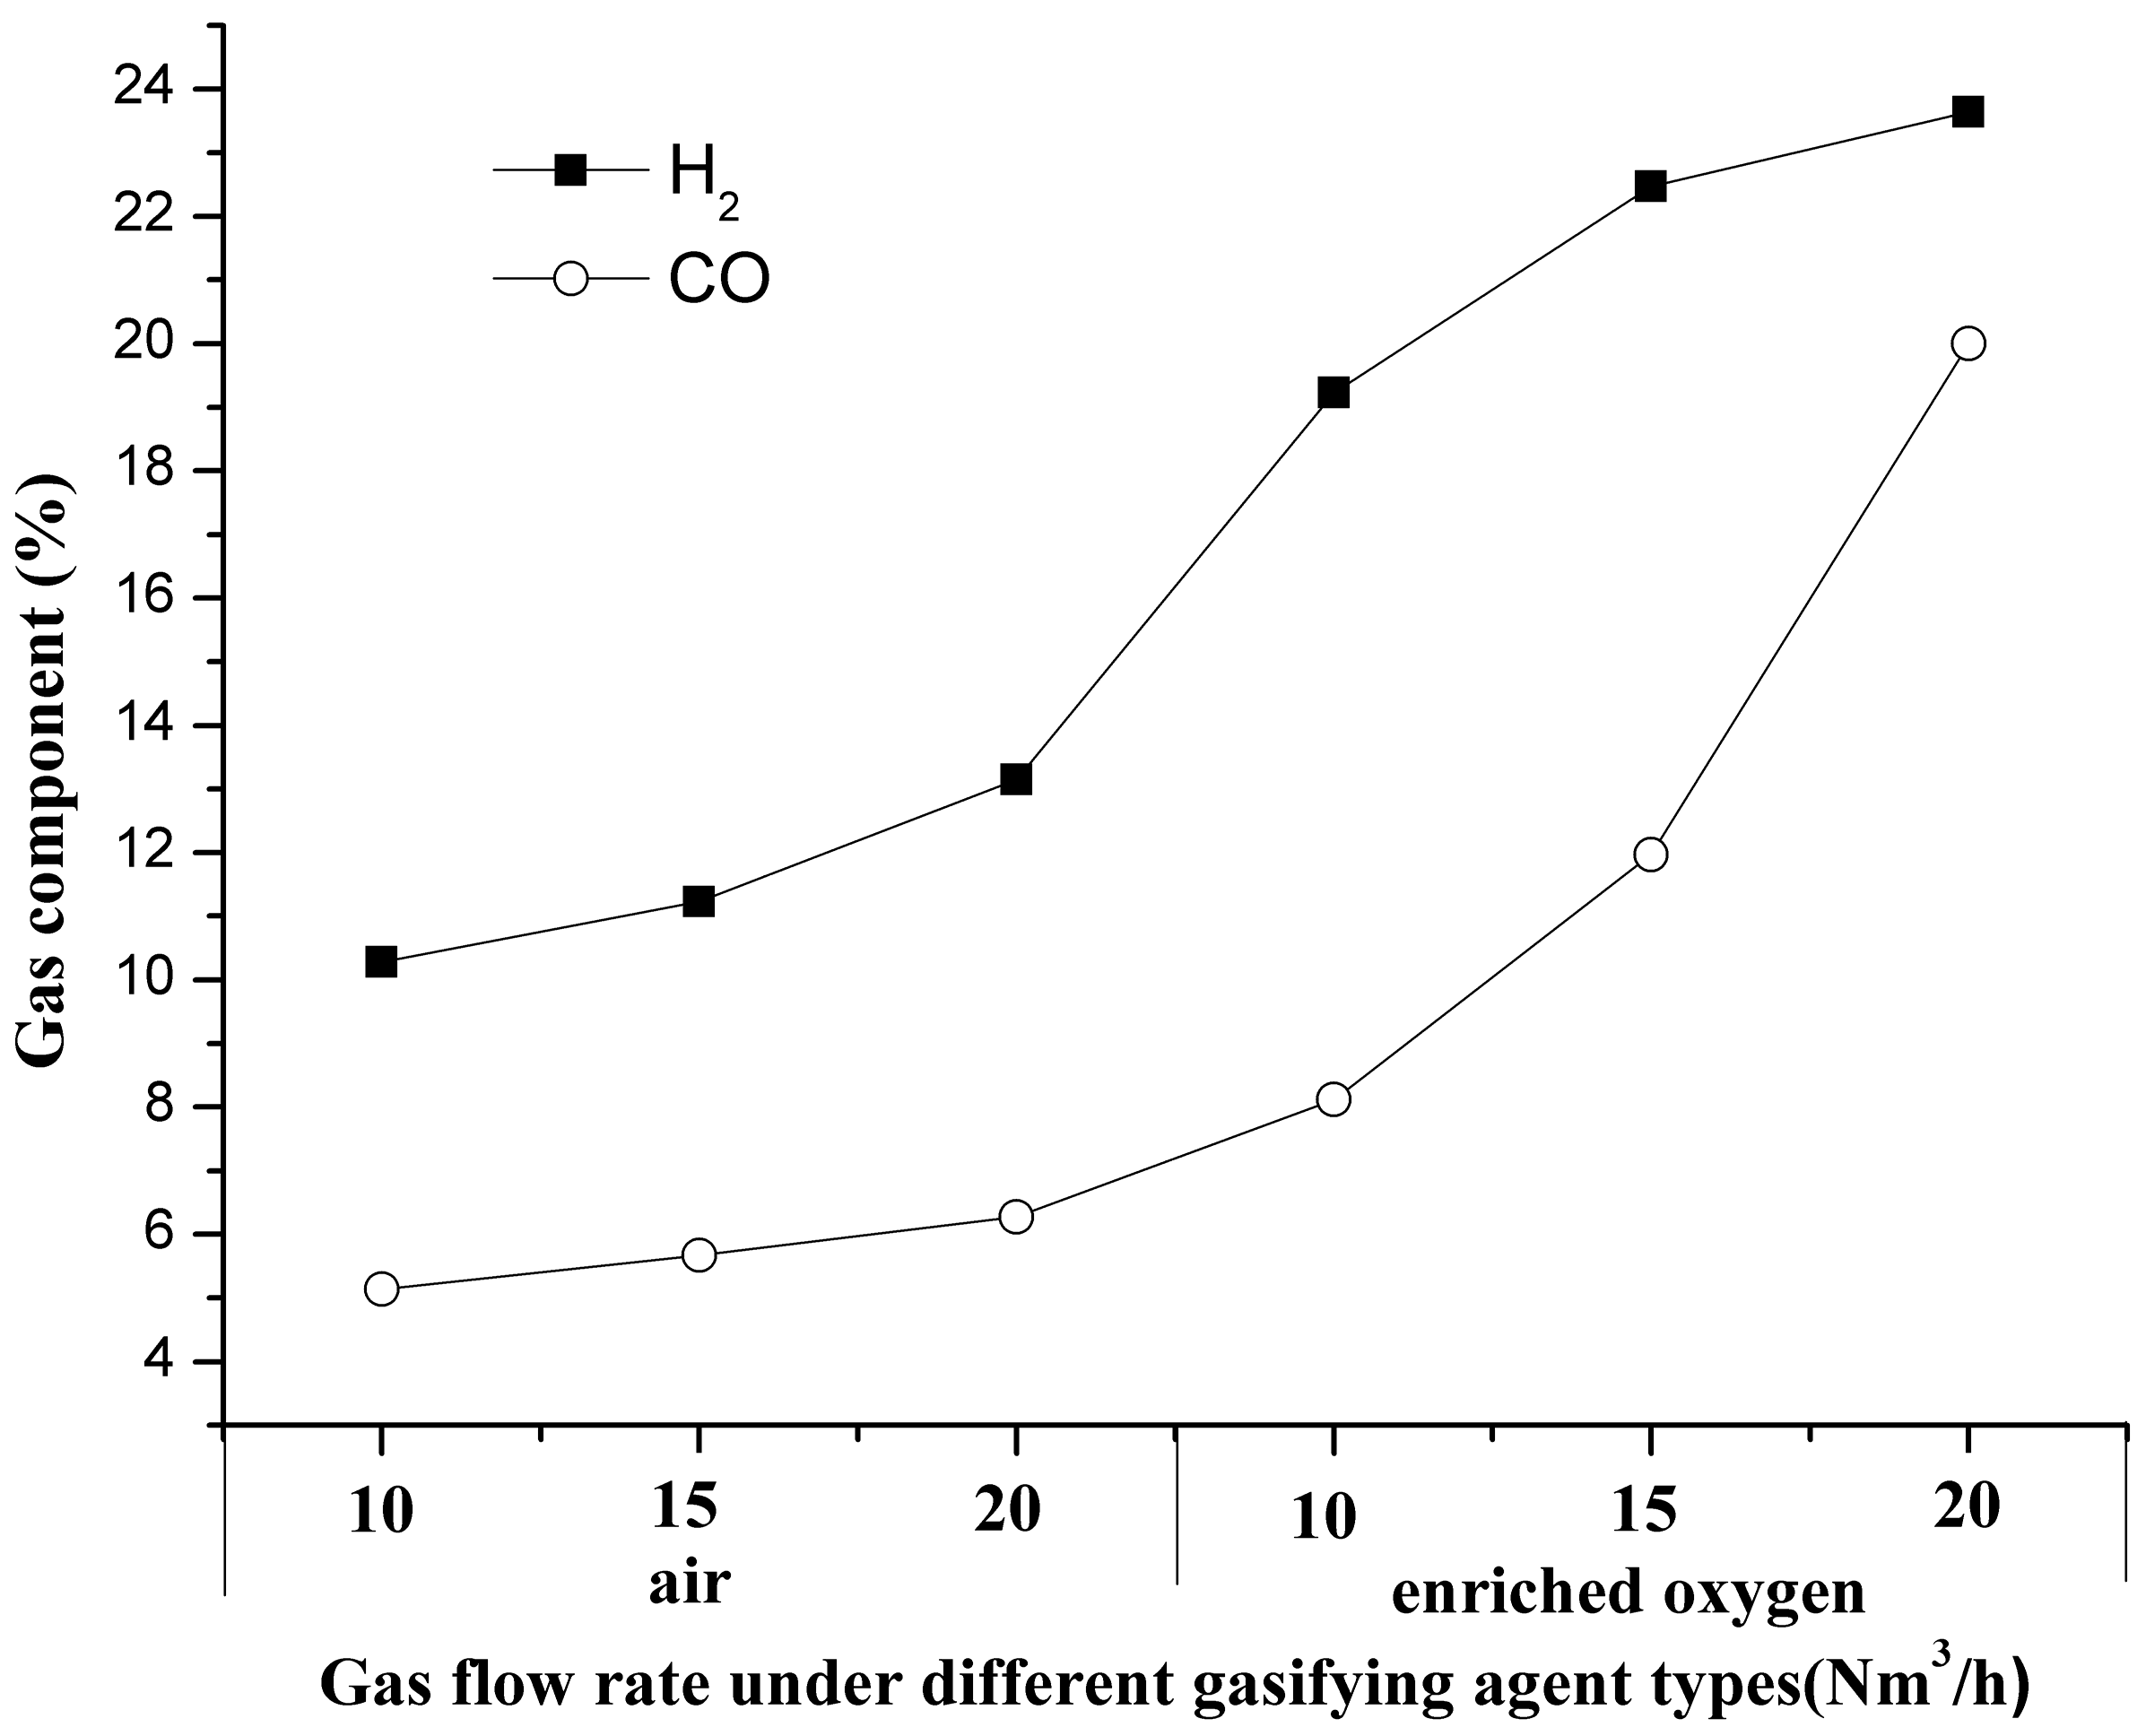
Temperatures between 873 K and 1173 K were selected as the reduction zone. In this zone, coal and the gasifying agents undergo the following reactions:
C + CO2 → 2CO
C + H2O(g) → CO + H2
The products of Equations (5) and (6) are CO and H2, respectively, which constitute the major components of the production gas in the reduction zone.
This shows that as the flow of the gasifying agent and/or its oxygen content increases, the production of both H2 and CO steadily grows; the H2 content grows from 10.28% to 23.64%, a 2.30-fold increase, and the CO level improves from 5.14% to 20.00%, a significant 3.89-fold increase, as can be seen in Figure 9. The rate of increase in the enriched-oxygen-based reverse UCG model test phase is higher than that with air as the gasifying agent. These results are related to the increases in the flow of the gasifying agent and its oxygen content, which significantly affect the length and temperature of the reduction zone and allow Equations (5) and (6) to proceed [33].
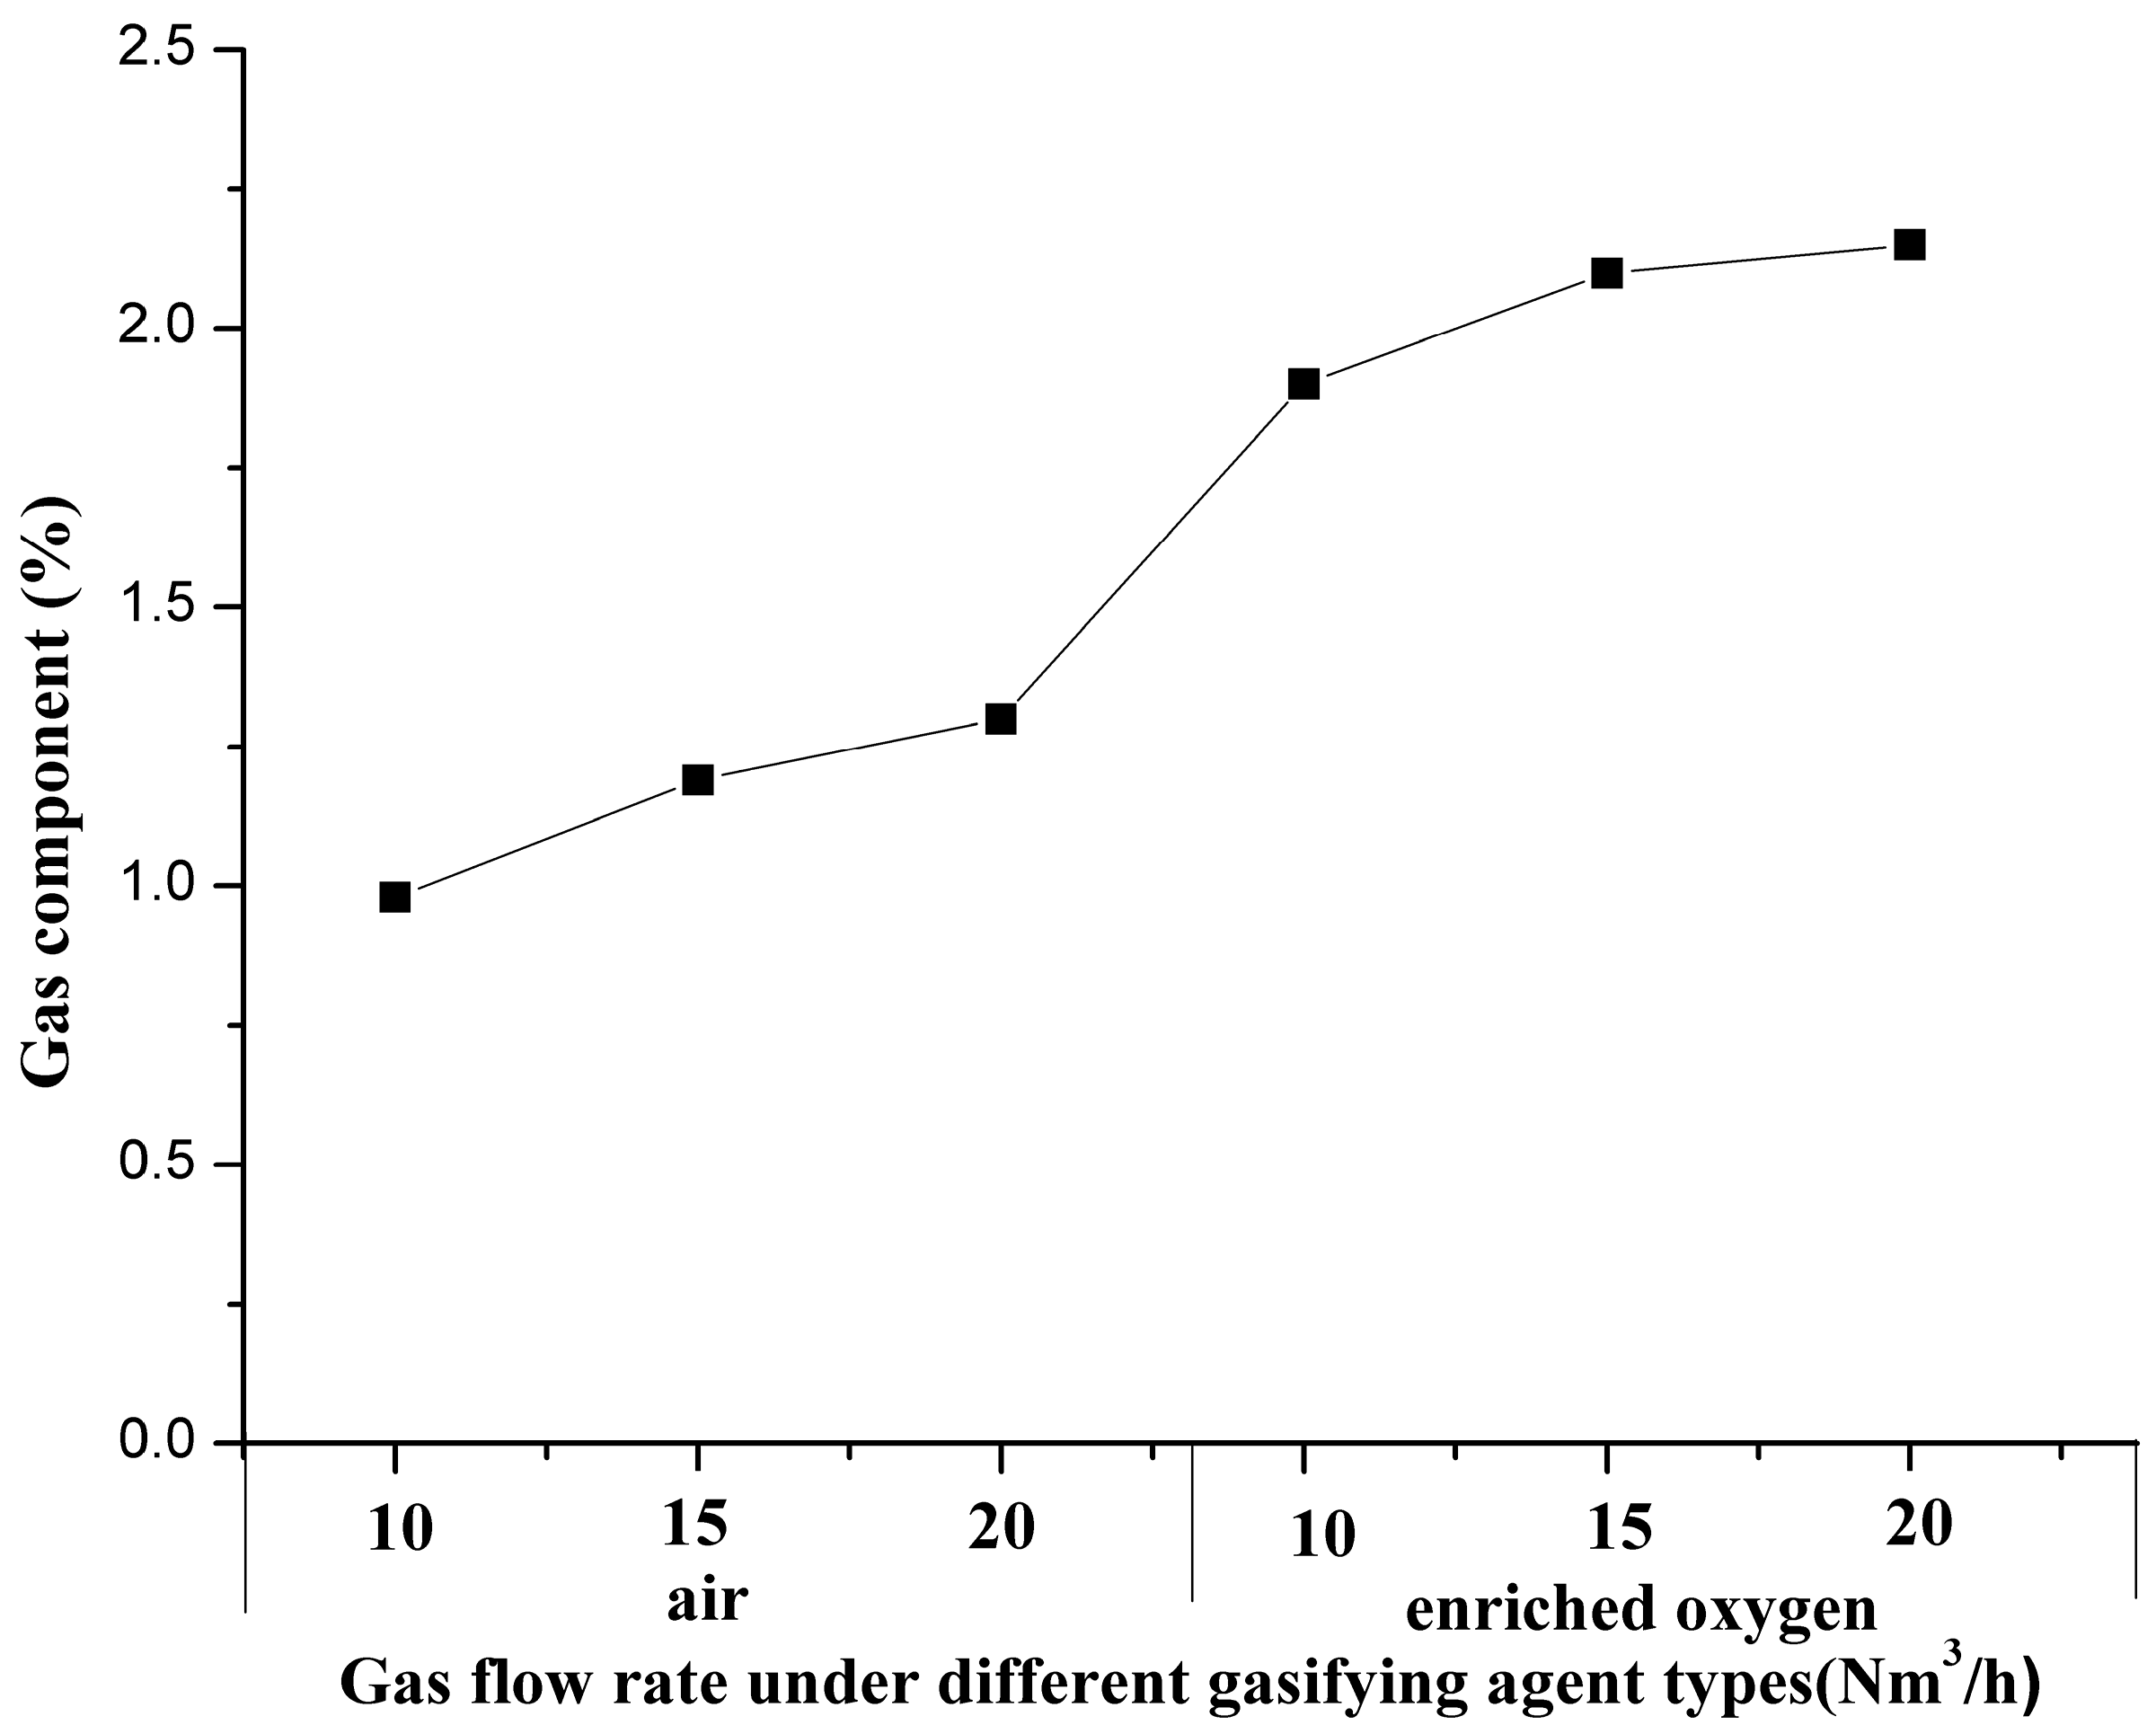
3.4.3. Characteristics of Gas Components in the Dry Distillation Zone
Temperatures between 473 K and 873 K were selected as the dry distillation zone. As can be seen from Figure 10, as the flows of the gasifying agents increase, the CH4 content continually increases. In particular, when the gasifying agent is changed to enriched oxygen from air, CH4 production improves rapidly, from 1.3% to 1.9%. This occurs mainly because, in reverse UCG, the flame front moves toward the gas-injection well toward the source of the oxidant, extending the dry distillation zone. Therefore, more coal will be separated out, releasing its volatile matter and increasing the generation of CH4.
4. Conclusions
Underground coal gasification (UCG) produces less pollution and is safer than traditional coal mining. Therefore, it may be useful to mitigate the global changes caused by anthropogenic activities. In order to investigate the effects of different gasifying agents or comprehensive analyses of the characteristics of the gas components in the three zones for the reverse gasification process, a model test of reverse underground coal gasification was carried out. The results showed that when the gasifying agent is enriched oxygen rather than air, both the gas composition and calorific values show significant growth. Compared with air as the gasifying agent, enriched oxygen is superior. The contents of H2, CO, and CH4 were 22.39%, 22.10%, and 2.08%, respectively. The gas calorific value was as high as 1430.19 kcal/Nm3, 2.4 times that of air as a gasifying agent.
The gas components in the three zones for the reverse gasification process have different characteristics. CO and CO2 are in equilibrium in the oxidation zone, where a rise in the temperature is advantageous for the generation of CO, but not conducive to CO2 formation. Under enriched oxygen instead of air, an increase in flow from 10 to 20 Nm3/h results in a steady temperature rise in the reaction zone, and consequent growth in the CO content beyond that of CO2. In the reduction zone, when the flow of gasifying agent and the oxygen content increase, both H2 and CO production continue to improve; H2 grows from 10.28% to 23.64%, a 2.3-fold increase, and CO improves from 5.14% to 20.00%, a significant 3.9-fold increase. In the dry distillation zone, when the flow of gasifying agent increases, the CH4 content also increases. Furthermore, when the gasifying agent is changed to enriched oxygen instead of air, CH4 production improves rapidly, from 1.3% to 1.9%. The effects of higher oxygen concentration in the reverse gasification process have not been comprehensive studied in this article, and it is hoped that this can be completed in further research.
The transformations of the temperature field and growth rate of the flame front were also quantitatively studied. When the flow of air as the gasifying agent increases from 10 to 20 Nm3/h, the growth rate of the flame front increases slowly from 0.89 to 1.59 m/day. In contrast, for a similar flow increase for enriched oxygen, the growth rate of the flame front rapidly increases by more than a factor of two, from 1.80 to 4.88 m/day.
Therefore, in order to achieve a better effect of reverse gasification, the oxygen concentration of gasifying agent in underground coal gasification industrialization process is recommended to be higher than 21%, which will lead to more combustible gases and a higher calorific value of gas. In the reverse gasification process, increasing the gas injection rate and oxygen concentration will increase the growth rate of the flame front, which may help to control the gasification position of coal seam.
Author Contributions
Conceptualization, H.Y.; Methodology, H.L.; Validation, H.L.; Formal Analysis, F.C. and G.L.; Data Curation, F.C., Y.W. and G.L.; Writing—Original Draft Preparation, Y.W. and H.L.; Writing—Review & Editing, H.L.; Supervision, H.Y. and S.L.; Project Administration, H.Y.
Funding
This research was funded by the National Natural Science Foundation of China (grant number: 51476185).
Acknowledgments
The completion of this paper has been helped by many teachers and classmates. We would like to express our gratitude to them for their help and guidance.
Conflicts of Interest
The authors declare no conflict of interest.
Glossary
| CCTV | closed-circuit industrial television |
| DCS | distributed control system |
| UCG | underground coal gasification |
| CRIP | controlled retraction injection point |
References
- Stańczyk, K.; Smoliński, A.; Kapusta, K.; Wiatowski, M.; Świadrowski, J.; Kotyrba, A.; et al. Dynamic experimental simulation of hydrogen oriented underground gasification of lignite. Fuel 2010, 89, 3307–3314. [Google Scholar] [CrossRef]
- Prabu, V.; Jayanti, S. Underground coal-air gasification based solid oxide fuel cell system. Appl. Energy 2012, 94, 406–414. [Google Scholar] [CrossRef]
- Prabu, V. Integration of in-situ CO2-oxy coal gasification with advanced power generating systems performing in a chemical looping approach of clean combustion. Appl. Energy 2015, 140, 1–13. [Google Scholar] [CrossRef]
- Olateju, B.; Kumar, A. Techno-economic assessment of hydrogen production from underground coal gasification (UCG) in Western Canada with carbon capture and sequestration (CCS) for upgrading bitumen from oil sands. Appl. Energy 2013, 111, 428–440. [Google Scholar] [CrossRef]
- Imran, M.; Kumar, D.; Kumar, N.; Qayyum, A.; Saeed, A.; Bhatti, M.S. Environmental concerns of underground coal gasification. Renew. Sustain. Energy Rev. 2014, 31, 600–610. [Google Scholar] [CrossRef]
- Kacur, J.; Durdán, M.; Laciak, M.; Flegner, P. Impact analysis of the oxidant in the process of underground coal gasification. Measurement 2014, 51, 147–155. [Google Scholar] [CrossRef]
- Doerell, P.E. All future energy will have to be “clean”. Appl. Energy 1999, 64, 79–88. [Google Scholar] [CrossRef]
- Friedmann, S.J.; Upadhye, R.; Kong, F.M. Prospects for underground coal gasification in carbon-constrained world. Energy Procedia 2009, 1, 4551–4557. [Google Scholar] [CrossRef]
- Liu, S.Q.; Wang, Y.Y.; Zhao, K.; Yang, N. Enhanced-hydrogen gas production through underground gasification of lignite. Min. Sci. Technol. 2009, 19, 389–394. [Google Scholar] [CrossRef]
- Perkins, G.; Sahajwalla, V. Modelling of heat and mass transport phenomena and chemical reaction in underground coal gasification. Chem. Eng. Res. Des. 2007, 85, 329–343. [Google Scholar] [CrossRef]
- Yang, L.H.; Zhang, X.; Liu, S.Q.; Yu, L.; Zhang, W.L. Field test of large-scale hydrogen manufacturing from underground coal gasification (UCG). Int. J. Hydrogen Energy 2008, 33, 1275–1285. [Google Scholar] [CrossRef]
- Yang, L.H. Study of the model experiment of blinding-hole UCG. Fuel Process. Technol. 2003, 82, 11–25. [Google Scholar] [CrossRef]
- Prabu, V.; Jayanti, S. Simulation of cavity formation in underground coal gasification using bore hole combustion experiments. Energy 2011, 36, 5854–5864. [Google Scholar] [CrossRef]
- Kapadia, P.R.; Wang, J.; Kallos, M.S.; Gates, I.D. Practical process design for in situ gasification of bitumen. Appl. Energy 2013, 107, 281–296. [Google Scholar] [CrossRef]
- Yang, L.H.; Liang, J.; Yu, L. Clean coal technology—Study on the pilot project experiment of underground coal gasification. Energy 2003, 28, 1445–1450. [Google Scholar] [CrossRef]
- Dmitry, N.; Ovid, A.; Klimenko, A. Flame propagation in a gasification channel. Energy 2010, 35, 1264–1273. [Google Scholar] [Green Version]
- Blinderman, M.; Saulov, D.; Klimenko, A. Forward and reverse combustion linking in underground coal gasification. Energy 2008, 33, 446–454. [Google Scholar] [CrossRef]
- Bhutto, A.; Bazmi, A.; Zahedi, G. Underground coal gasification: From fundamentals to applications. Prog. Energy Combust. Sci. 2013, 39, 189–214. [Google Scholar] [CrossRef]
- Blinderman, M.; Klimenko, A. Theory of reverse combustion linking. Combust. Flame 2007, 150, 232–245. [Google Scholar] [CrossRef] [Green Version]
- Cui, Y.; Liang, J.; Wang, Z.; Zhang, X.; Fan, C.; Liang, D.; Wang, X. Forward and reverse combustion gasification of coal with production. Appl. Energy 2014, 131, 9–19. [Google Scholar] [CrossRef]
- Britten, J.A.; Krantz, W.B.; Gunn, R.D. Modeling studies of reverse combustion linking at high pressures. In Proceedings of the 8th Underground Coal Conversion Symposium; Sandia National Laboratories Report Sand 82-2355. Sandia National Laboratories: Albuquerque, NM, USA, 1982; pp. 515–523. [Google Scholar]
- Liu, S.Q.; Liang, J.; Yu, L. Study on auxiliary gasification technology of CO2 control in the process of underground coal gasification. Coal Convers. 1999, 22, 50–53. (In Chinese) [Google Scholar]
- Gregg, D.; Hill, R.W.; Olness, D. An Overview of the Soviet Effort in Underground Gasification of Coal; Report No. UCR-50024; Lawrence Livermore Laboratories: Livermore, CA, USA, 1976. [Google Scholar]
- Hommertm, P.; Beard, S. Description of reverse combustion linking and forward gasification during Underground Coal Gasification. In Proceedings of the 3rd Underground Coal Conversion Symposium, Fallen Leaf Lake, CA, USA, 6–9 June 1977; pp. 267–279. [Google Scholar]
- Glaser, R.; Gunn, R.; Krantz, W.; Breidung, P.; Gudenau, H. Unexpected aspects of reverse combustion: Effects of pressure, volatility and chemical reactivity. In Proceedings of the 9th Underground Coal Conversion Symposium, Bloomingdale, IL, USA, 7–10 August 1983; pp. 219–226. [Google Scholar]
- Su, R.; Engleman, V. Reverse combustion linking phenomena in bituminous coal at high pressure. In Proceedings of the 5th Underground Coal Conversion Symposium, Alexandria, VA, USA, 18–21 June 1979; pp. 323–330. [Google Scholar]
- Skafa, P. Underground Coal Gasification; Gosgortechizdat: Moscow, Russia, 1960. (In Russian) [Google Scholar]
- Cupps, C.; Land, C.; Marchant, L. Field experiment of in-situ oil recovery from a Utah tar sand by reverse combustion. AIChE Symp. Ser. 1976, 155, 61–67. [Google Scholar]
- Gunn, R.; Krantz, W. Reverse combustion instabilities in tar sands and coal. Soc. Pet. Eng. J. 1980, 20, 267–277. [Google Scholar] [CrossRef]
- Evgeny, S.; Arvind, V. Underground coal gasification: A brief review of current status. Ind. Eng. Chem. Res. 2009, 48, 7865–7875. [Google Scholar]
- Camp, D.W. Underground coal gasification research and development in the United States. Undergr. Coal Gasif. Combust. 2018, 59–127. [Google Scholar] [CrossRef]
- Liang, J.; Yu, L. Study of two-stage underground coal gasification in counter directions. J. China Coal Soc. 1996, 21, 68–72. (In Chinese) [Google Scholar]
- Yang, L.H.; Liang, J. Model test two-stage underground coal gasification in counter directions with gently inclined coal seam. J. Chongqing Univ. 2003, 26, 47–50. (In Chinese) [Google Scholar]
- Jiang, L.; Chen, Z.; Ali, S.M.F. Modelling of reverse combustion linking in underground coal gasification. Fuel 2017, 207, 302–311. [Google Scholar] [CrossRef]
- Su, F.; Hamanaka, A.; Itakura, K.; Zhang, W.; Deguchi, G.; Sato, K.; Kodama, J. Monitoring and evaluation of simulated underground coal gasification in an ex-situ experimental artificial coal seam system. Appl. Energy 2018, 223, 82–92. [Google Scholar] [CrossRef]
- Laciak, M.; Kostúr, K.; Durdán, M.; Kačur, J.; Flegner, P. The analysis of the underground coal gasification in experimental equipment. Energy 2016, 114, 332–343. [Google Scholar] [CrossRef]
- Liang, J. Underground coal gasification stability and control technology. J. China Univ. Min. Technol. 2002, 31, 358–361. (In Chinese) [Google Scholar]
Figure 1.
Schematic views of the three zones in forward and reverse underground coal gasification (UCG) processes. (a) Forward gasification; (b) reverse gasification.
Figure 1.
Schematic views of the three zones in forward and reverse underground coal gasification (UCG) processes. (a) Forward gasification; (b) reverse gasification.

Figure 2.
Schematic diagram of the UCG model test system. CCTV—closed-circuit industrial television.
Figure 2.
Schematic diagram of the UCG model test system. CCTV—closed-circuit industrial television.

Figure 3.
Coal seam in the test.

Figure 4.
Physical layout of thermocouples in the coal seam.

Figure 5.
Changes of gas components during the reverse UCG process with air and enrich oxygen as the gasifying agent at different flow rates.
Figure 5.
Changes of gas components during the reverse UCG process with air and enrich oxygen as the gasifying agent at different flow rates.

Figure 6.
Changes in the temperature field during the reverse UCG process: with air as the gasifying agent at flow rates of (a) 10; (b) 15; and (c) 20 Nm3/h; with enriched oxygen as the gasifying agent at flow rates of (d) 10; (e) 15; and (f) 20 Nm3/h.
Figure 6.
Changes in the temperature field during the reverse UCG process: with air as the gasifying agent at flow rates of (a) 10; (b) 15; and (c) 20 Nm3/h; with enriched oxygen as the gasifying agent at flow rates of (d) 10; (e) 15; and (f) 20 Nm3/h.

Figure 7.
Changes in the growth rate of the flame front during the reverse UCG process.

Figure 8.
The gas components in the oxidation zone with air and enriched oxygen as the gasifying agent at different flow rates during the reverse UCG process.
Figure 8.
The gas components in the oxidation zone with air and enriched oxygen as the gasifying agent at different flow rates during the reverse UCG process.

Figure 9.
The gas components in the reduction zone with air and enriched oxygen as the gasifying agent at different flow rates during the reverse UCG process.
Figure 9.
The gas components in the reduction zone with air and enriched oxygen as the gasifying agent at different flow rates during the reverse UCG process.

Figure 10.
The gas components in the dry distillation zone with air and enriched oxygen as the gasifying agent at different flow rates during the reverse UCG process.
Figure 10.
The gas components in the dry distillation zone with air and enriched oxygen as the gasifying agent at different flow rates during the reverse UCG process.


Table 1.
Proximate and ultimate analyses of Shenbei lignite (wt %, air-dried basis).
| Proximate Analysis a | Ultimate Analysis | |||||||
|---|---|---|---|---|---|---|---|---|
| M | A | V | FC | C | H | O | N | S |
| 11.87 | 22.89 | 32.88 | 32.36 | 44.93 | 4.35 | 14.41 | 1.01 | 0.5 |
a M: moisture; A: ash; V: volatile matter; FC: fixed carbon.
© 2018 by the authors. Licensee MDPI, Basel, Switzerland. This article is an open access article distributed under the terms and conditions of the Creative Commons Attribution (CC BY) license (http://creativecommons.org/licenses/by/4.0/).
Share and Cite
MDPI and ACS Style
Liu, H.; Chen, F.; Wang, Y.; Liu, G.; Yao, H.; Liu, S. Experimental Study of Reverse Underground Coal Gasification. Energies 2018, 11, 2949. https://doi.org/10.3390/en11112949
AMA Style
Liu H, Chen F, Wang Y, Liu G, Yao H, Liu S. Experimental Study of Reverse Underground Coal Gasification. Energies. 2018; 11(11):2949. https://doi.org/10.3390/en11112949
Chicago/Turabian StyleLiu, Hongtao, Feng Chen, Yuanyuan Wang, Gang Liu, Hong Yao, and Shuqin Liu. 2018. "Experimental Study of Reverse Underground Coal Gasification" Energies 11, no. 11: 2949. https://doi.org/10.3390/en11112949
Note that from the first issue of 2016, this journal uses article numbers instead of page numbers. See further details here.