Controlled Mechanical Ventilation in Buildings: A Comparison between Energy Use and Primary Energy among Twenty Different Devices


Department of Architecture, University of Bologna, Via Machiavelli, I-47521 Cesena, Italy
*
Author to whom correspondence should be addressed.
Energies 2018, 11(8), 2123; https://doi.org/10.3390/en11082123
Submission received: 28 June 2018
/
Revised: 8 August 2018
/
Accepted: 9 August 2018
/
Published: 14 August 2018
Abstract
:Indoor air quality (IAQ) of buildings is a problem that affects both comfort for occupants and the energy consumption of the structure. Controlled mechanical ventilation systems (CMVs) make it possible to control the air exchange rate. When using CMV systems, it is interesting to investigate the relationship between the useful thermal energy requirements for ventilation and the energy consumption of these systems. This paper addresses whether there is a correlation between these two parameters. The methodology used in this work involves the application of equations of technical Italian regulations UNI/TS 11300 applied to a case study. The case study is represented by a 54 m3 room, which is assumed to have three CMV systems installed (extraction, insertion, insertion and extraction) for twenty different devices available on the market. Afterwards, simulations of useful thermal energy requirements QH,ve and primary energy EP,V were performed according to the electrical power of each fan W and the ventilation flow. The results show that the two values are not linearly correlated: it is not possible to clearly associate the operating cost for CMV systems according to building requirements. The study also shows that CMV systems are particularly efficient for high-performance buildings, where there is no leakage that can be ascribed to windows infiltrations.
1. Introduction
The Indoor Air Quality (IAQ) defines the air quality inside and around buildings, measuring health and comfort in relation to the occupants. In a residential building, daily activities contaminate the ambient air with odors, carbon dioxide and water vapor. To ensure the healthiness of the environment and to avoid the formation of pollutants, toxicity or allergens, it is necessary to dilute the concentration of the pollutants dispersed into volumes of indoor air through the air exchange by means of ventilation. In this way, it is possible to guarantee the conditions of comfort, hygiene and health. Moreover, the ventilation of rooms also constitutes a legislative and regulatory requirement with regard to two aspects: (a) the healthiness of the environment, or rather, the removal of pollutants through ventilation; (b) the energy consumption due to natural and mechanical ventilation, because of the entry of air masses at different temperatures and, for the Controlled Mechanical Ventilation (CMV), the energy costs required to operate the fan.
The international and national institutions that study and legislate within the field of hygiene and health of indoor environments, regarding the concentration of pollutants, consider CMV more risky compared to natural ventilation, as reported in the guidelines of the World Health Organization (WHO) [1].
CMV is a common definition, in standard nomenclature, for mechanical ventilation in buildings. In CMV systems, air supplies in rooms are delivered based on a set of variables. CMV represents a component of Air Handle Units (AHU). CMV can be a part of HVAC (Heating and Ventilation Air-Conditioning) or CMV could simply be applied to a single room or apartment. In this work, it is applied to a single room. CMV is often utilized in residential buildings in order to reduce energy losses by natural ventilation. For this reason, CMV is mandatory in cases of passive-house design or in near-zero energy buildings (NZEB). Thermal energy, or, in other words, “Energy needed for natural or mechanical ventilation” should be calculated following standards. In this work, it is calculated following the Italian standards (UNI/TS), which are a transposition of the European standards (EN). Therefore, CMV has a double role, it allows for the control of indoor air quality (IAQ) inside buildings, and it also allows for reducing energy consumption for natural ventilation.
The study of Wei et al [2] reported a useful review on the parameters adopted by the different green buildings certification systems (31 certifications world-wide were reviewed), and regulations (ASHRAE 62.1 [3], EN 15251 [4], EN 13779 [5], AS 1668-2 [6], etc.) about certification and values of IAQ which should be assessed, through: (a) the control of sources, or rather the removal of pollutants through the choice of building materials, finishing and furnishings; (b) the use of CMV and airtightness; and (c) the instrumental measurement of IAQ and the pollutants concentration
Therefore, we have two approaches: (1) to optimize Indoor Air Quality and environmental healthiness, allowing for ventilation thanks to air-leakage, and (2) to optimize air-tight buildings provided with CMV.
The WHO considers the study of IAQ of primary interest and provides guidelines for the presence of pollutants and health effects due to mold and condensation [7,8]. This aspect has not been considered in this study, since the technical standard calculation regarding natural ventilation and ventilation in the presence of a CMV system establishes the set-point values of the concentration of water vapor and relative humidity.
1.1. Literature Review
The scientific literature about IAQ and/or ventilation is very wide and there are different case studies concerning the use of CMV. We could define three areas of interest in the literature:
- mechanical ventilation application in case studies;
- mechanical ventilation and indoor microclimate, especially indoor air quality;
- relation between energy saving, mechanical ventilation in building energy performance points of view.
1.2. Mechanical Ventilation Application in Case Studies
Mechanical ventilation facilitates the improvement of indoor thermal comfort, air temperature and energy saving; some case studies describe the relationship between a specific CMV typology and their effect inside buildings. For example, a study on ventilation systems [9] with individual controls of airflow rate in a hot and humid climate, the research consisted of a series of experiments was performed in which the set-point values of ambient temperature and of ventilation air-flow temperature were modified. The results showed that when the ventilation air temperature was kept at 20 °C, the energy consumption at an ambient temperature of 23 °C was 10.8% higher than that at 26 °C. The study concluded that increasing the ambient temperature is a solution to reduce energy consumption.
The research of Fehrm M. et al. reported the development of markets in Sweden and Germany (considered similar to each other) of CMV systems with heat recovery [10]. The types and the benefits for the environment were described in detail. This study demonstrated that the new building code for the year 2000 contained requirements for the realization of insulated buildings where the energy request for heating ventilation and air tended to reach 60% of the annual building energy requirement. The approach to airtightness and the use of CMV is highly useful and valued in the countries of Central and Northern Europe, as in the Passive-house standards.
Fucci F. et al. evaluated the energy performance of a CMV system with heat recovery [11]. The study was realized to evaluate the energy performance of the system, tested during winter, modifying the outside temperature (−5 °C; 0 °C; 5 °C; 10 °C) and keeping the inner temperature fixed (20 °C). This type of system had a higher energy performance, considering an extended range of temperature, than other systems analyzed. Orme M. conducted an evaluation of the energy impact of ventilation and the associated financial costs. This study showed that thermal energy losses related to air changes were as important as losses by conduction [12].
Tronchin L. et al. performed a study using three different models for the calculation with the Energy Performance of Buildings (EPB) software, comparing their quantification discrepancies with real consumptions. The study was conducted by considering a single-family house in Italy and focusing on the differences between numerical codes and consumption in connection with flexible architectural solutions, which are widely used, especially in rural areas of Mediterranean countries [13].
1.3. Mechanical Ventilation and Indoor Micro-Climate, Especially Indoor Air Quality
This research is focused on the study of the relation between ventilation, useful for guaranteeing the IAQ, and the related energy costs. However, it is noticeable that the values established for space ventilation depend on health studies in buildings (Sick Building Syndrome, etc.).
The WHO (World Health Organization) represents the international reference entity for research, standards and policy direction. Among all the documents processed, the WHO approved the guidelines concerning the relationship between the presence of indoor pollutants and health effects.
The presence of pollutants derived from combustion products falls within the scope of the study of the IAQ, for example the concentration of CO (carbon monoxide) produced by the incomplete combustion of boilers to natural gas or LPN, biomass generators, or with open fireplaces in environments such as chimneys and stoves that produce dust. About that, the WHO has prepared a specific guideline [14]. However, since in Europe, particularly in Italy, heat generators must be controlled and revised yearly, these risks are avoided. For high-performance buildings, it is preferable to choose heat pumps rather than CMV systems.
Simonson C. proposed the analysis of an eco-friendly single-family building situated in Helsinki, Finland, built of wood and well insulated [15]. He described the measurement and analysis of its energy consumption and ventilation rate. The results of the measurements and simulations showed that the energy consumption was low and the outdoor ventilation rate based on the CO2 concentration was satisfactory. The study proved that the primary and thermal energy consumptions were lower than other buildings built with traditional methods.
Normally, research on IAQ focuses on case studies related to school buildings, as the users (children, kids) are more sensitive to respiratory problems due to IAQ. Among these are the research results of Gao J. et al. [16], Stabile L. et al. [17] and Fabbri K. [18].
Among the research applied to residential buildings and IAQ, Fabbri K. et al. reported the results obtained from monitoring the IEQ (Indoor Environmental Quality) of a low-energy building (Energy Class A+ and 25 kWh/m2y). The results showed that buildings with low energy performances do not always guarantee a better level of IEQ, especially during the summer [19].
Sekhar SC. et al. [20] carried out a study on twelve bedrooms subjected to natural/mechanical air-conditioning, measuring the thermal comfort and IAQ over the course of a two-month period. At the end of the test they asked occupants to express an opinion on sleep quality, and in rooms where there was mechanical ventilation, it was reported to be better; whereas, Shan X. et al. [21] conducted a study of two identical rooms to compare the thermal comfort on human subjects, Sick Building Syndrome (SBS), and short-term performance, under the effect of “mixing ventilation” and “displacement ventilation”. The results showed that the “mixing ventilation” was less comfortable due to the high speed of the air coming out from the air vents.
Mahdavi A. et al. conducted a comparative study of the “Passive House”, measuring indoor air parameters of two flats in Vienna [22]; one of these was a passive house equipped with a CMV system, and the other a low energy consumption house subjected to natural ventilation. The internal environmental conditions were measured (indoor air temperature, relative humidity, CO2 concentration) for two units of each flat for five months.
1.4. Energy Saving and Mechanical Ventilation Following a Building Energy Performance Perspective
This research aims to investigate the relationship between ventilation and energy consumption, including all values related to the indoor pollutants concentration in the presence of a CMV system, considered as set-point data and complying with technical regulations of the national and international sectors, such as the ASHRAE Standard 62 of 2016. The standards that define the requirements of mechanical ventilation are EN 12792 [23], which provides the terms and explanations concerning ventilation in rooms. Regarding the requirements of useful thermal energy, EN ISO 13790 [24] shows the calculation method to evaluate ventilation dispersion. Finally, EN 15251 [4] defines the parameters to evaluate the Indoor Environmental Quality (IEQ) and proposes values of air exchange for the residential and tertiary sectors.
In Italy, the European standards for the calculation of energy needs of buildings, defined by the CEN (European Committee for Standardization), have been implementing with the approval of standards UNI/TS 11300, the realization of the transposition of Directive 2002/91/CE (EPBD) [25] and by Directive 2010/31/UE (EPBD II Recast) [26]. To calculate the requirements of useful thermal energy we should refer to UNI/TS 11300-Part 1 [27], which introduces a calculation method to evaluate ventilation dispersions, and to UNI/TS 11300-Part 2 [28], which provides methods for the calculation of primary energy needs for ventilation and for winter heating in the presence of aeraulic systems.
Tronchin L. et al. carried out a study based on Directive 2002/91/EC, “Energy Performance of Building Directive (EPBD)”. The method proposed started from the LowEX tool, previously developed in the IEA ECBCS Annex 37 framework. By using the exergy approach, new (non-economic) indices have been utilised, as Tonne of Oil Equivalent (TOE) [29].
Pisello AL. et al. studied the impact of natural ventilation on the energy needs of buildings [30]. They compared an isolated building with the same building surrounded by other buildings. A simulation of thermal energy in different scenarios was performed to investigate the impact of external airflows on the primary energy needs of a building for cooling, heating and indoor thermal comfort. The results showed that the effect between buildings was much more influenced by the opening percentage of buildings, by the rate of infiltration and the local wind compared to the climatic context; meanwhile, Lazzarin R. et al. [31] evaluated the recovery of air flow ventilation and its economic savings, considering the differences in weather among three Italian cities: Milan, Rome and Palermo. Finally, Tronchin L. et al. [32] presented a study that performs a simulation energy retrofit in an Italian case study, a building containing enlargements realized in different years, and with different thermo-physical parameters; four energy retrofit actions were applied, together with software evaluation of the energy performances.
In the existing buildings, especially those built before the 21st century, a considerable component of air exchange is due to air leakage through doors and windows, or because of inefficient maintenance, deterioration of the gaskets, the poor quality of the materials and the absence of insulation. Therefore, these buildings consume a surplus of energy that is required for heating in winter conditions.
The buildings realized following the European Directives EPBD and EPBD II Recast (or other protocols such as Green Building, LEED, BREAM, Passive House, etc.) are more airtight, thanks to features and the proper installation of the windows. The products and laying techniques minimize heat exchanges and air leakage, but this can also increase the risk of pollutant concentrations.
To ensure a constant air exchange, it is necessary to manually open windows, depending on the arbitrary choices of the user (i.e., based on human behavior), causing a significant exchange of thermal energy for ventilation.
In order to reduce such heat exchanges in high-energy performance buildings (i.e., Near Zero Energy Buildings), it is preferable to use CMV to control the rate of air exchange. CMV systems, compared with natural ventilation, guarantee high values of IAQ and dilute the indoor air exhausted without allowing the heat to leave the indoor rooms.
The use of CMV in buildings is not mandatory in the Standards or in European (EPBD) and Italian legislation; CMV is only mandatory in some voluntary labelling, such as Passive-house, to obtain the labelling. We do not have an opinion regarding CMV being mandatory, or whether it should be adopted or not; our research focuses instead on the relations between energy needs for heating and cooling and primary energy for ventilation.
2. Goals
The goal of our research is to study the relationship between the energy needs for heating and cooling for ventilation and the primary energy necessary for the operation of CMV systems. In the case of natural ventilation, the costs are obviously zero, while in the case of CMV the primary energy needed to operate the building should be added together with the related operating costs.
One purpose of this research is the study of the relationship between the airflow provided in the case of natural ventilation and in the case of CMV, in agreement with the standards UNI/TS 11300.
Moreover, another purpose is the study of the relationship between the energy needs for heating and cooling for ventilation (Qve) and the primary energy needs for ventilation (EP,V), or rather, the primary energy relative to the amount of electrical energy absorbed by CMV systems, according to a thermo-economic approach.
One more important aspect to be observed is the relationship between the various types of CMV available on the markets (i.e., emission; insertion; emission/insertion) in relation to the operating costs (electricity) and energy needs for heating and cooling.
3. Methodology
This research finds it important to compare the energy needs for heating and cooling for ventilation Qve with the primary energy needs for ventilation EP,V, applied to a specific case study and a series of products available on the market.
In order to compare different products, the calculations refer to a hypothetical case study, defined as a living room having the typical dimensions of a standard living space for a residential building.
For the choice of the individual devices, it was decided to adopt the rated values provided by the following manufacturers, which are commonly available in the Italian market: ALDES, IRSAP, FRANCE AIR, ELICENT, and VORTICE. The real products were used because the standards UNI/TS 11300 do not define “reference” values, such as the minimum flow rate of the fan or the minimum electrical power absorbed by fan, for data that will be provided directly from the producers.
Once the variables of the research have been defined, the standards UNI/TS 11300 were analyzed, obtaining the formulas relating to the useful thermal energy and primary energy needs. With regard to the thermal exchanges for transmission, the solar contribution or the use of renewable energy, they were considered to be the same in all the simulations; therefore, the analysis refers only to energy exchange due to ventilation. Beginning from the formulas from the standards, the relationships were represented by means of histograms and line diagrams that show the relationships between the parameters.
The management costs (i.e., costs related to the consumption of electricity absorbed by CMV systems) were determined based on the values, expressed in €/kWh of electricity, provided by AEEGSI (the Italian Regulatory Authority for Electricity Gas and Water) for the fourth quarter of 2016, using the average value.
The procedure adopted here involves a first phase of analysis of the standards and devices:
- The definition of useful thermal energy and primary energy needs
- The choice of CMV devices
- The definition of management costs
Once defined, the algorithm and the case studies (in the following, a test room is defined) for which the requirements for each device were simulated. The comparison and discussion of the results are the last phase of the research.
3.1. Calculation of Useful Thermal Energy Needs
The technical standard UNI/TS 11300-1 provides data and methods for the evaluation of the energy needs of a building for heating and cooling. The exchanges of thermal energy are calculated for each building’s thermal area and for each month or part of a month through the following equations:
In the case of heating:
QH,ve = Hve,adj∙(θint,set,H − θe)∙t
In the case of cooling:
where Hve,adj is the global heat transfer coefficient for ventilation of the area considered, expressed in W/K; θint,set,H is the indoor temperature of regulation for heating of the area considered expressed in °C, and is assumed to be equal to 26 °C; θint,set,C is the indoor temperature of regulation for cooling the area considered expressed in °C, and is assumed to be equal to 20 °C; θe is the mean external temperature of the month or part of the month considered expressed in °C; and t is the duration of the month or part of the month considered expressed in Ms. The global heat transfer coefficient for ventilation Hve,adj is obtained through the equation:
where ρa × ca is the air volumetric heat capacity, equal to 1200 J/(m3 × K); bve,k is the correction factor of temperature for the airflow; and qve,k,mn is the flow mediated the time of airflow, expressed in m3/s.
QC,ve = Hve,adj (θint,set,C − θe)∙t
Hve,adj = ρ𝑎 ∙ ca ∙ {Σk bve,k ∙ qve,k,mn} (kWh)
In buildings where there is only mechanical ventilation, qve,k,mn is calculated by the equation:
where q̅′ve,x is the additional airflow average due to the effects of wind in the period of non-operation of mechanical ventilation; βk is the temporal interval fraction calculation with functioning mechanical ventilation for the airflow; qve,f is the nominal flow rate of mechanical ventilation; bve,k is the correction factor for the actually present temperature in the air flux; FCve is the efficiency factor of the system adjustment of mechanical ventilation; and q̅ve,x is the additional daily average airflow with functioning mechanical ventilation due to thermal and transverse natural ventilation.
qve,k,mn = (q̅′ve,x) ∙(1 − βk) + (qve,f ∙ bve ∙ FCve + 𝑞̅ve,x)∙ βk (m3/s)
3.2. Calculation of Primary Energy Needs
The technical standard UNI/TS 11300-2 provides the method of calculating primary energy needs for ventilation. The primary energy needs for mechanical ventilation is calculated by considering the electricity requirements for the air movement.
The primary energy needs for mechanical ventilation EP,V, expressed in kWh, is determined through the equation:
where fp,el is the electrical energy conversion factor in primary energy and Eve,el is the electrical energy need of the fans, expressed in kWh.
EP,V = fp,el ∙ Σ Eve,el
The electrical energy needs of the fans Eve,el is determined through the equation:
where Wve,el is the electric power of the emission fan, expressed in W; FCve is the load factor of mechanical ventilation; and t is the time interval of calculation, expressed in h.
Eve,el = Wve,el ∙ FCve ∙ t
3.3. Criteria for Choice of CMV Devices
To define the criteria used to select the CMV systems, following the guidelines of the UNI/TS 11300-2, it should be clarified that the standard defines the typologies of ventilation systems and the related devices for ventilation. In other words, the UNI/TS 11300 defines the system typologies, while the market (or rather the manufacturers) defines the devices and the related technical features.
The regulation UNI/TS 11300-1 defines the typologies of ventilation systems, which are reported in chart Table 8, of the regulation itself
However, this research is limited to devices that could be used for single rooms or residential flats:
- Centralized extraction systems with a single conduit
- Centralized insertion systems with a single conduit
- Balanced insertion and extraction systems with a double conduit.
Single-conduit CMV systems differ depending on whether it is necessary to extract exhaust air by moist environments (i.e., bathroom, kitchen) or introduce fresh air in the bedroom, living room, etc.
Double-conduit CMV systems provide simultaneous extraction of exhaust air and insertion of fresh air. In some cases, the CMV systems are combined with a heat recovery unit that recovers part of the heat from the extracted air and pre-heats the incoming air.
In this research, recovery units have not been considered, because they require a proper CMV system designs adapted to single users, while this study is focused exclusively on the characteristics of mechanical ventilation systems. The analysis of the most common devices available on the market, and of their corresponding “data plaques” provided by the manufacturers, shows that centralized extraction systems with single conduits have electric power, and therefore higher electrical energy needs for the fans.
3.4. Criteria for Management Costs
The costs of the three different typologies of CMV systems were determined adopting a rate of 0.18 €/kWh; a value found on the AEEGSI website. The time rate was multiplied by the electrical energy needs of every single fan (Eve,el), expressed in kWh, to obtain the final management cost, expressed in €.
The purchase and installation costs lie outside the scope of this research, because they are almost impossible to configure, and market research would be required, so only management costs due to electric energy consumptions are taken into account here. If the purchase and installation costs were factored in, this analysis might result in slightly different results.
3.5. The Boundaries of Research and Simulations
The considerations presented in this study are applicable to residential buildings. Offices, hospitals and other similar buildings are therefore not considered. Heat recovery units are also not considered in the following, because they are usually combined with CMV systems. These units allow pre-heating or pre-cooling of fresh air by recovering the thermal energy at zero cost from the extracted air.
4. The Case Study
4.1. Test-Room
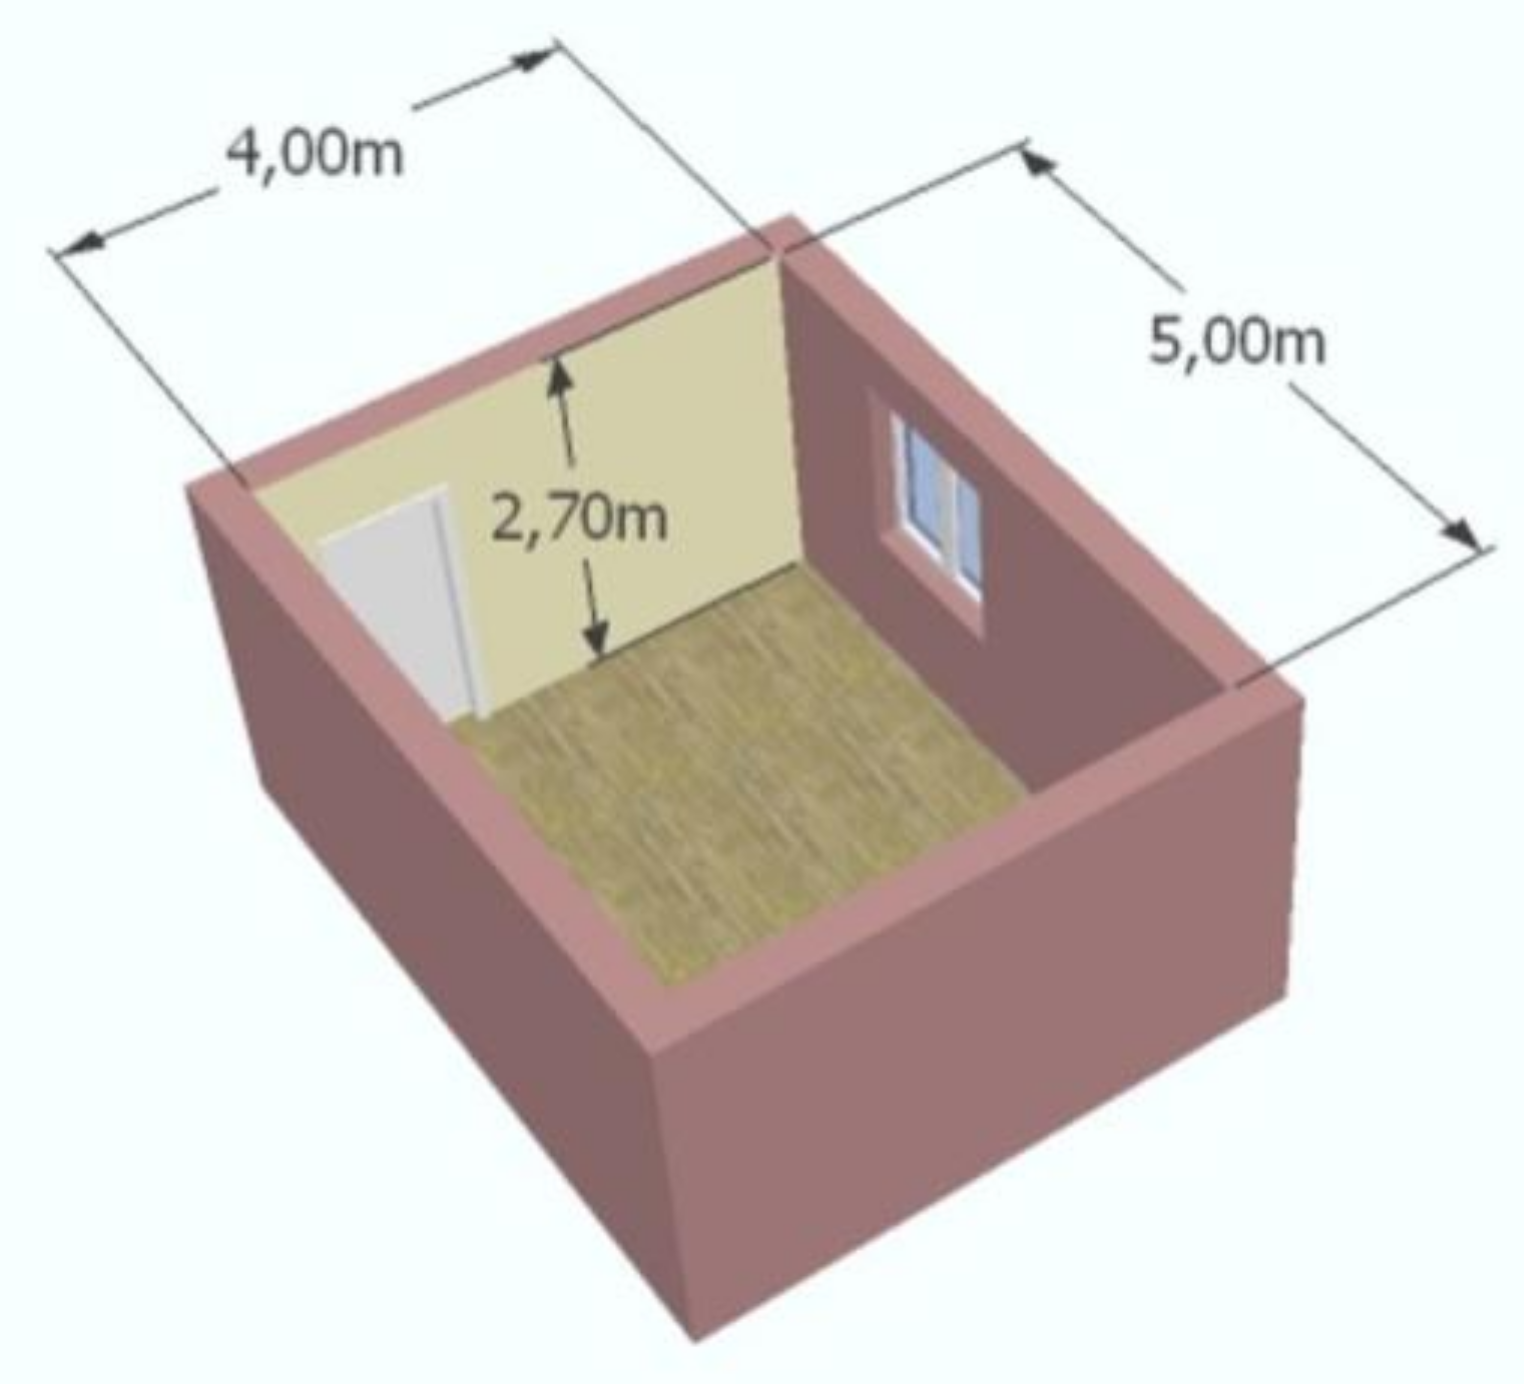
The case study consists of a standardized room with dimensions of a l1 = 4.0 m, l2 = 5.0 m, hint = 2.7 m (net internal height), therefore having a volume equal to 54 m3; these dimensions are typical for environments such as living rooms and bedrooms (Figure 1). This standardized room suits the characteristics of the CMV systems analyzed here, which are normally applied to environments with less than 150 m3 net volume, composed of not more than three rooms of the same size.
The calculation and comparison between useful thermal energy needs (Qve) for ventilation and primary energy needs for ventilation is related to this standardized test room.
4.2. The CMV Devices
In the following, twenty commercially available fans were chosen from the online catalogues of 5 different producing companies (Table 1). To perform the simulations, the following elements were selected from each data sheet:
- The minimum flow rate of the fan; that is, the amount of air that the fan is able to move per unit time, expressed in m3/h
- The minimum electric power absorbed by the fan; that is, the power required by the fan motor in certain working conditions, expressed in W
- The nominal diameter of the fan; that is, the diameter of the hole that will be drilled into the wall for its accommodation, expressed in meters.
The selected fans are products for small rooms, suitable for residential buildings. The table shows that the selected fans have different powers, in order to better understand the correlation between thermal energy and primary needs. The nominal diameter of the fan was considered, because the dimensions are important—the smaller they are, the less visual impact to the users. Moreover, a proper design is recommended to improve their integration within the room.
5. Results
This section shows the diagrams of the results of calculation for the standard test room and the different CMV devices; specifically:
- The relationship between devices and data, according to UNI/TS 11300-1
- The comparison between useful thermal energy needs (QH,ve) and primary energy needs (EP,V) among the different CMV systems
- The correlation between useful thermal energy and primary energy needs.
5.1. Relationships between the Various Devices and Input Data According to UNI/TS 11300-1
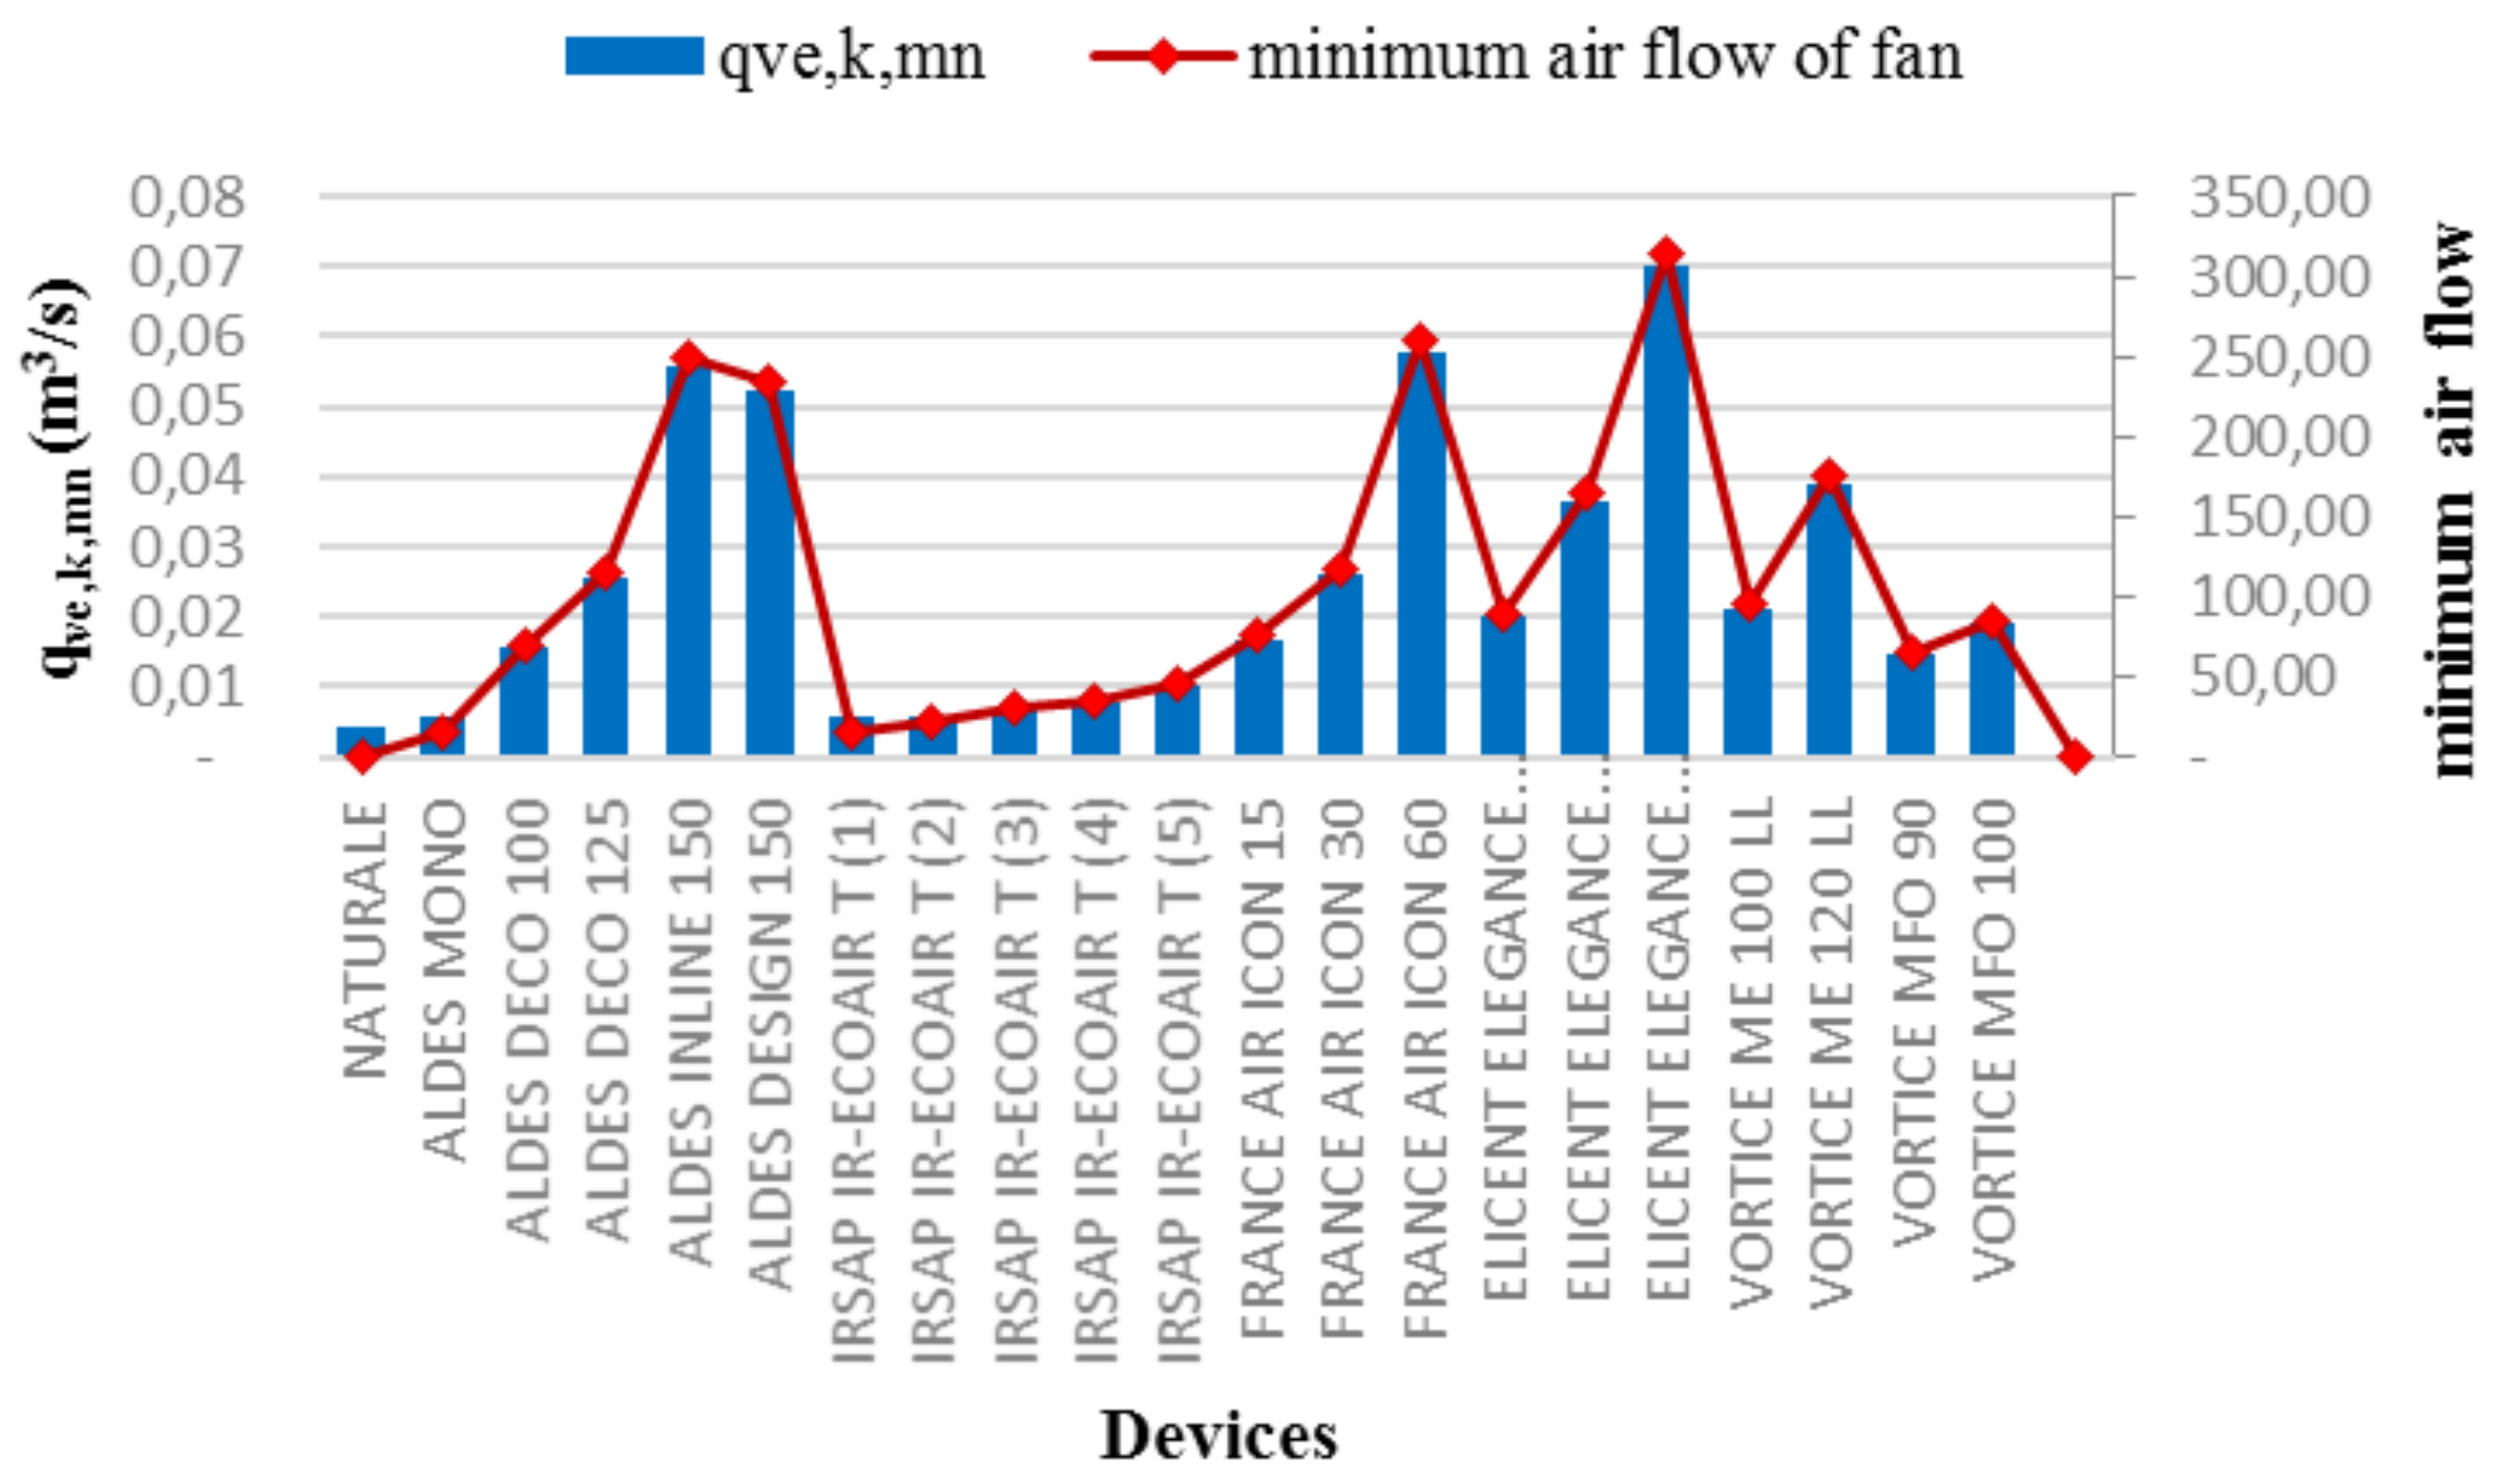
Figure 2 shows, for each device analyzed, the time-averaged airflow qve,k,mn (left), calculated according to UNI/TS 11300-1 and the minimum flow rate of the fan (right, red line), provided by the data plaque on the data sheet of the device. The diagram shows that the two values have a linear trend: if the device has high value for minimum ventilation flow, the relative airflow qve,k,mn will be higher, so the choice of the device defines the rate of air exchange (m3/s) of the environment (or conversely).
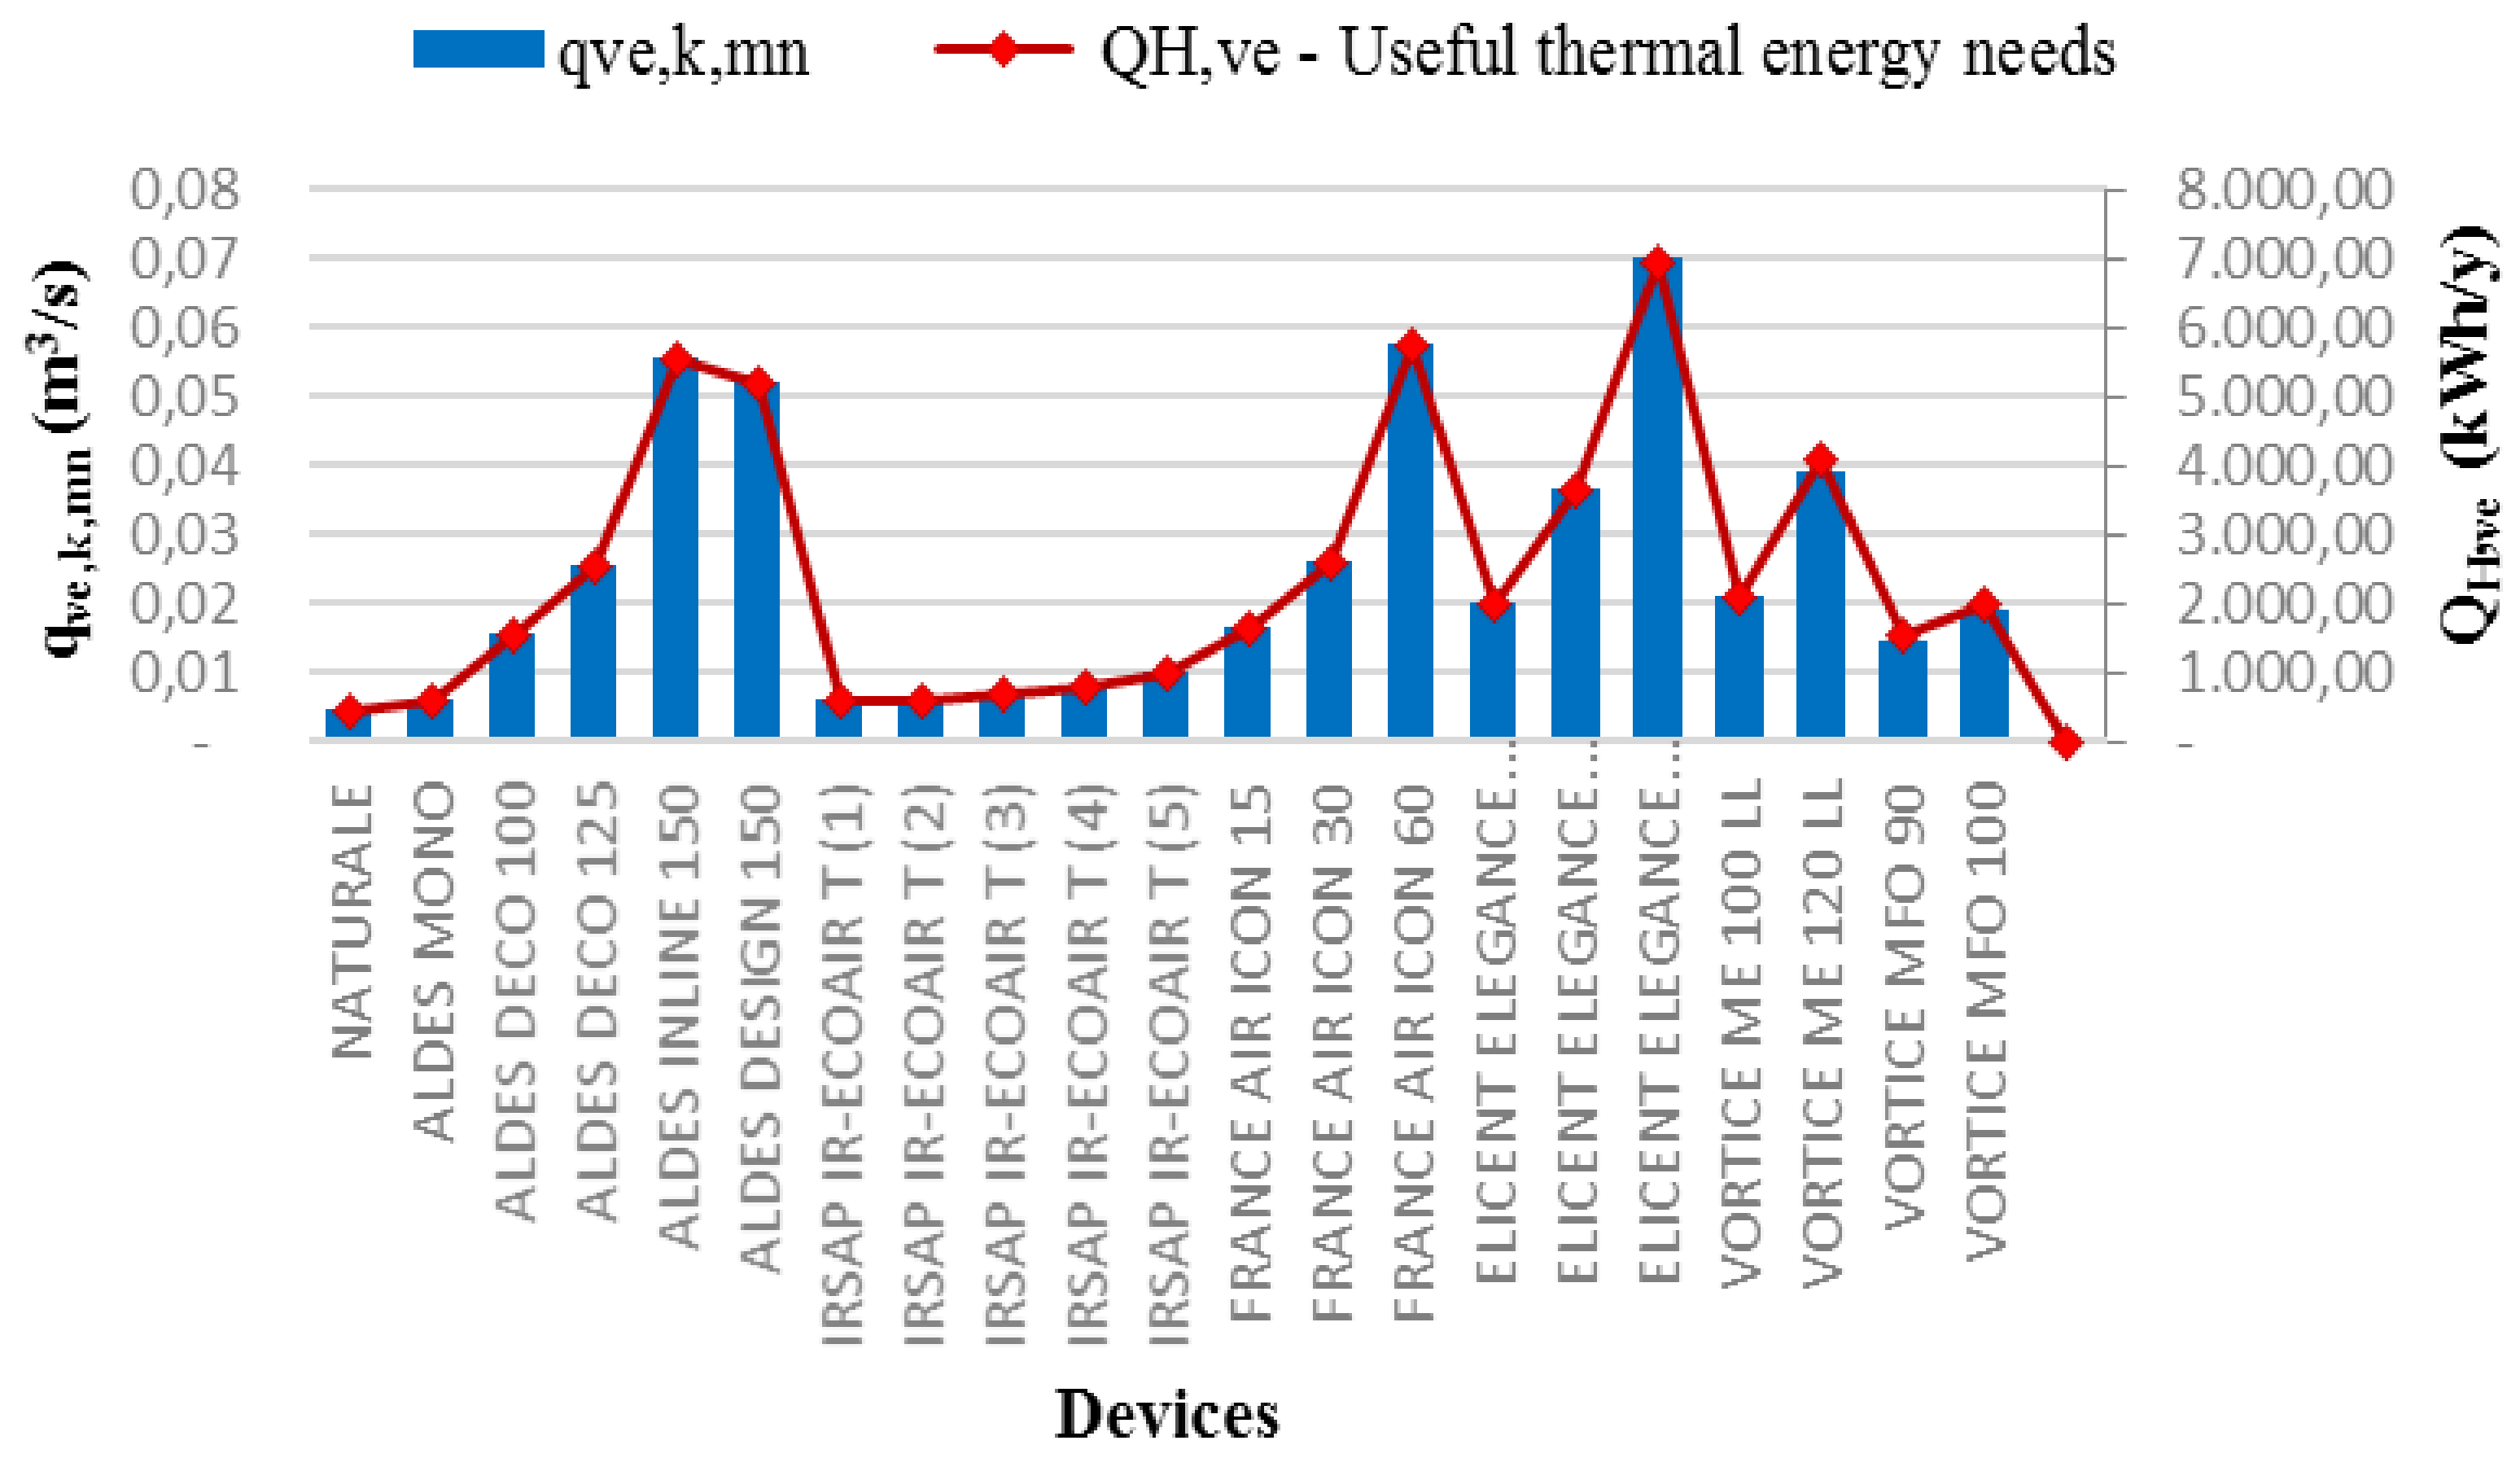
Figure 3 shows, for each device analyzed, the time-averaged airflow qve,k,mn (left) and the useful thermal energy for ventilation (QH,ve) (right, red line), calculated according to Formula (1).
The relationship is also linear in this case: the greater the ventilation flow rate, the higher the thermal energy needs for ventilation. The choice of devices for mechanical ventilation must obviously refer to ventilation flow (m3/s); on the other hand, the input data required to determine the predicted value using Formula (4) requires information on the nominal flow rate of mechanical ventilation (qve,f), so it is likely that in order to determine the type of fan, it will be necessary to know the ventilation flow rate of the device. It follows that the criteria for choosing a suitable CMV device, by extension, could be based on the minimum ventilation flow rate in the case of natural ventilation and, once the device is chosen and the minimum ventilation flow rate known, it would be possible to calculate the ventilation flow rate and the useful thermal energy needs (QH,ve). It is also of interest to note that the results of the calculation of qve,k,mn are linearly proportional to the results of calculation of Qve. Figure 3 reports (left) the electric power of the fan Wve,el of each device, and (right) the values of useful thermal energy needs for ventilation QH,ve (x axis) and (left) the values of primary energy needs EP,V or rather the primary energy needs to run the fans (y axis).
Comparing the tendency of QH,ve with EP,V (Figure 4), the values of EP,V are strongly linear, and depend on Wve,el. The values of QH,ve are not linear, but they are initially distributed according to a trendline that represents the growing trend of the elements, and later deviate from it with increasing values.
At the right side, there is an anomalous situation due to a system with a high value of Wve,el. (France Air ICON 60).
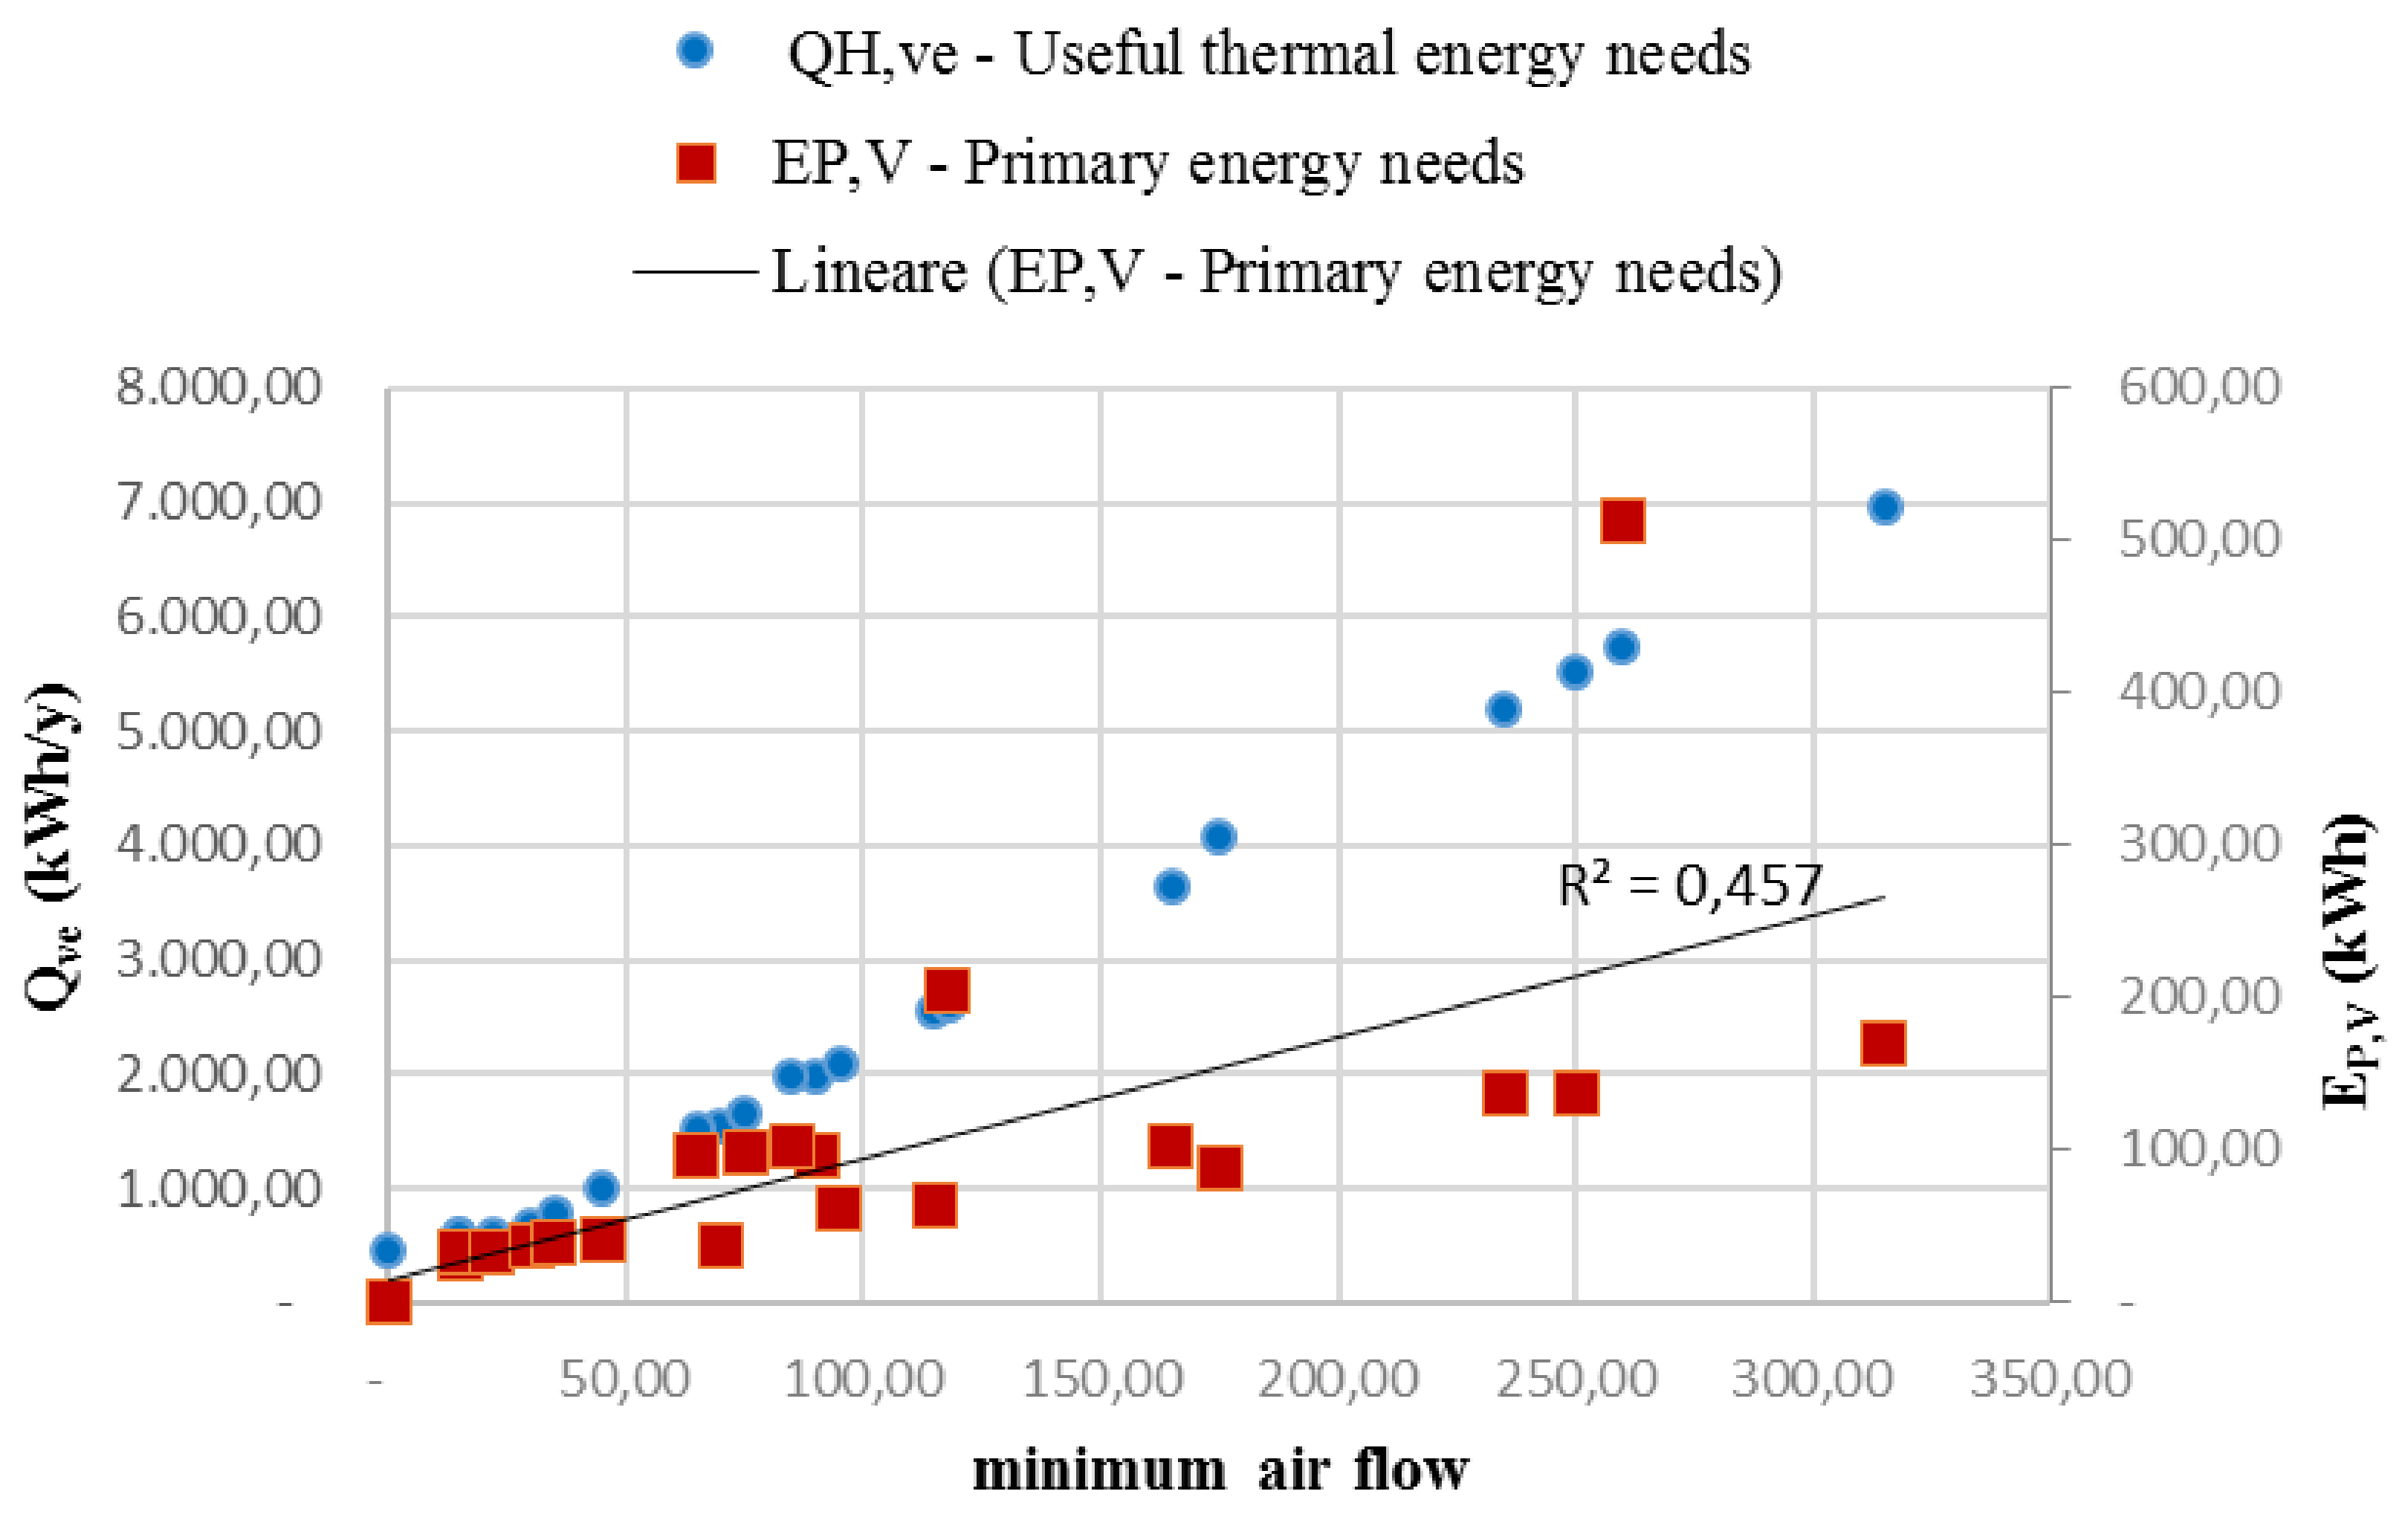
Figure 5 shows the minimum flow rate of the fan for each device, provided by the plaque data on the their corresponding sheets (axis x), and (left) the values of QH,ve and (right) the values of EP,V (axis y). Comparing the tendency of QH,ve with EP,V, the values of QH,ve are strongly linear and depend on the minimum flow rate of the fan. The values of EP,V are initially linear, but they later deviate from the initial straight line with the increase of the flow rate of the fan.
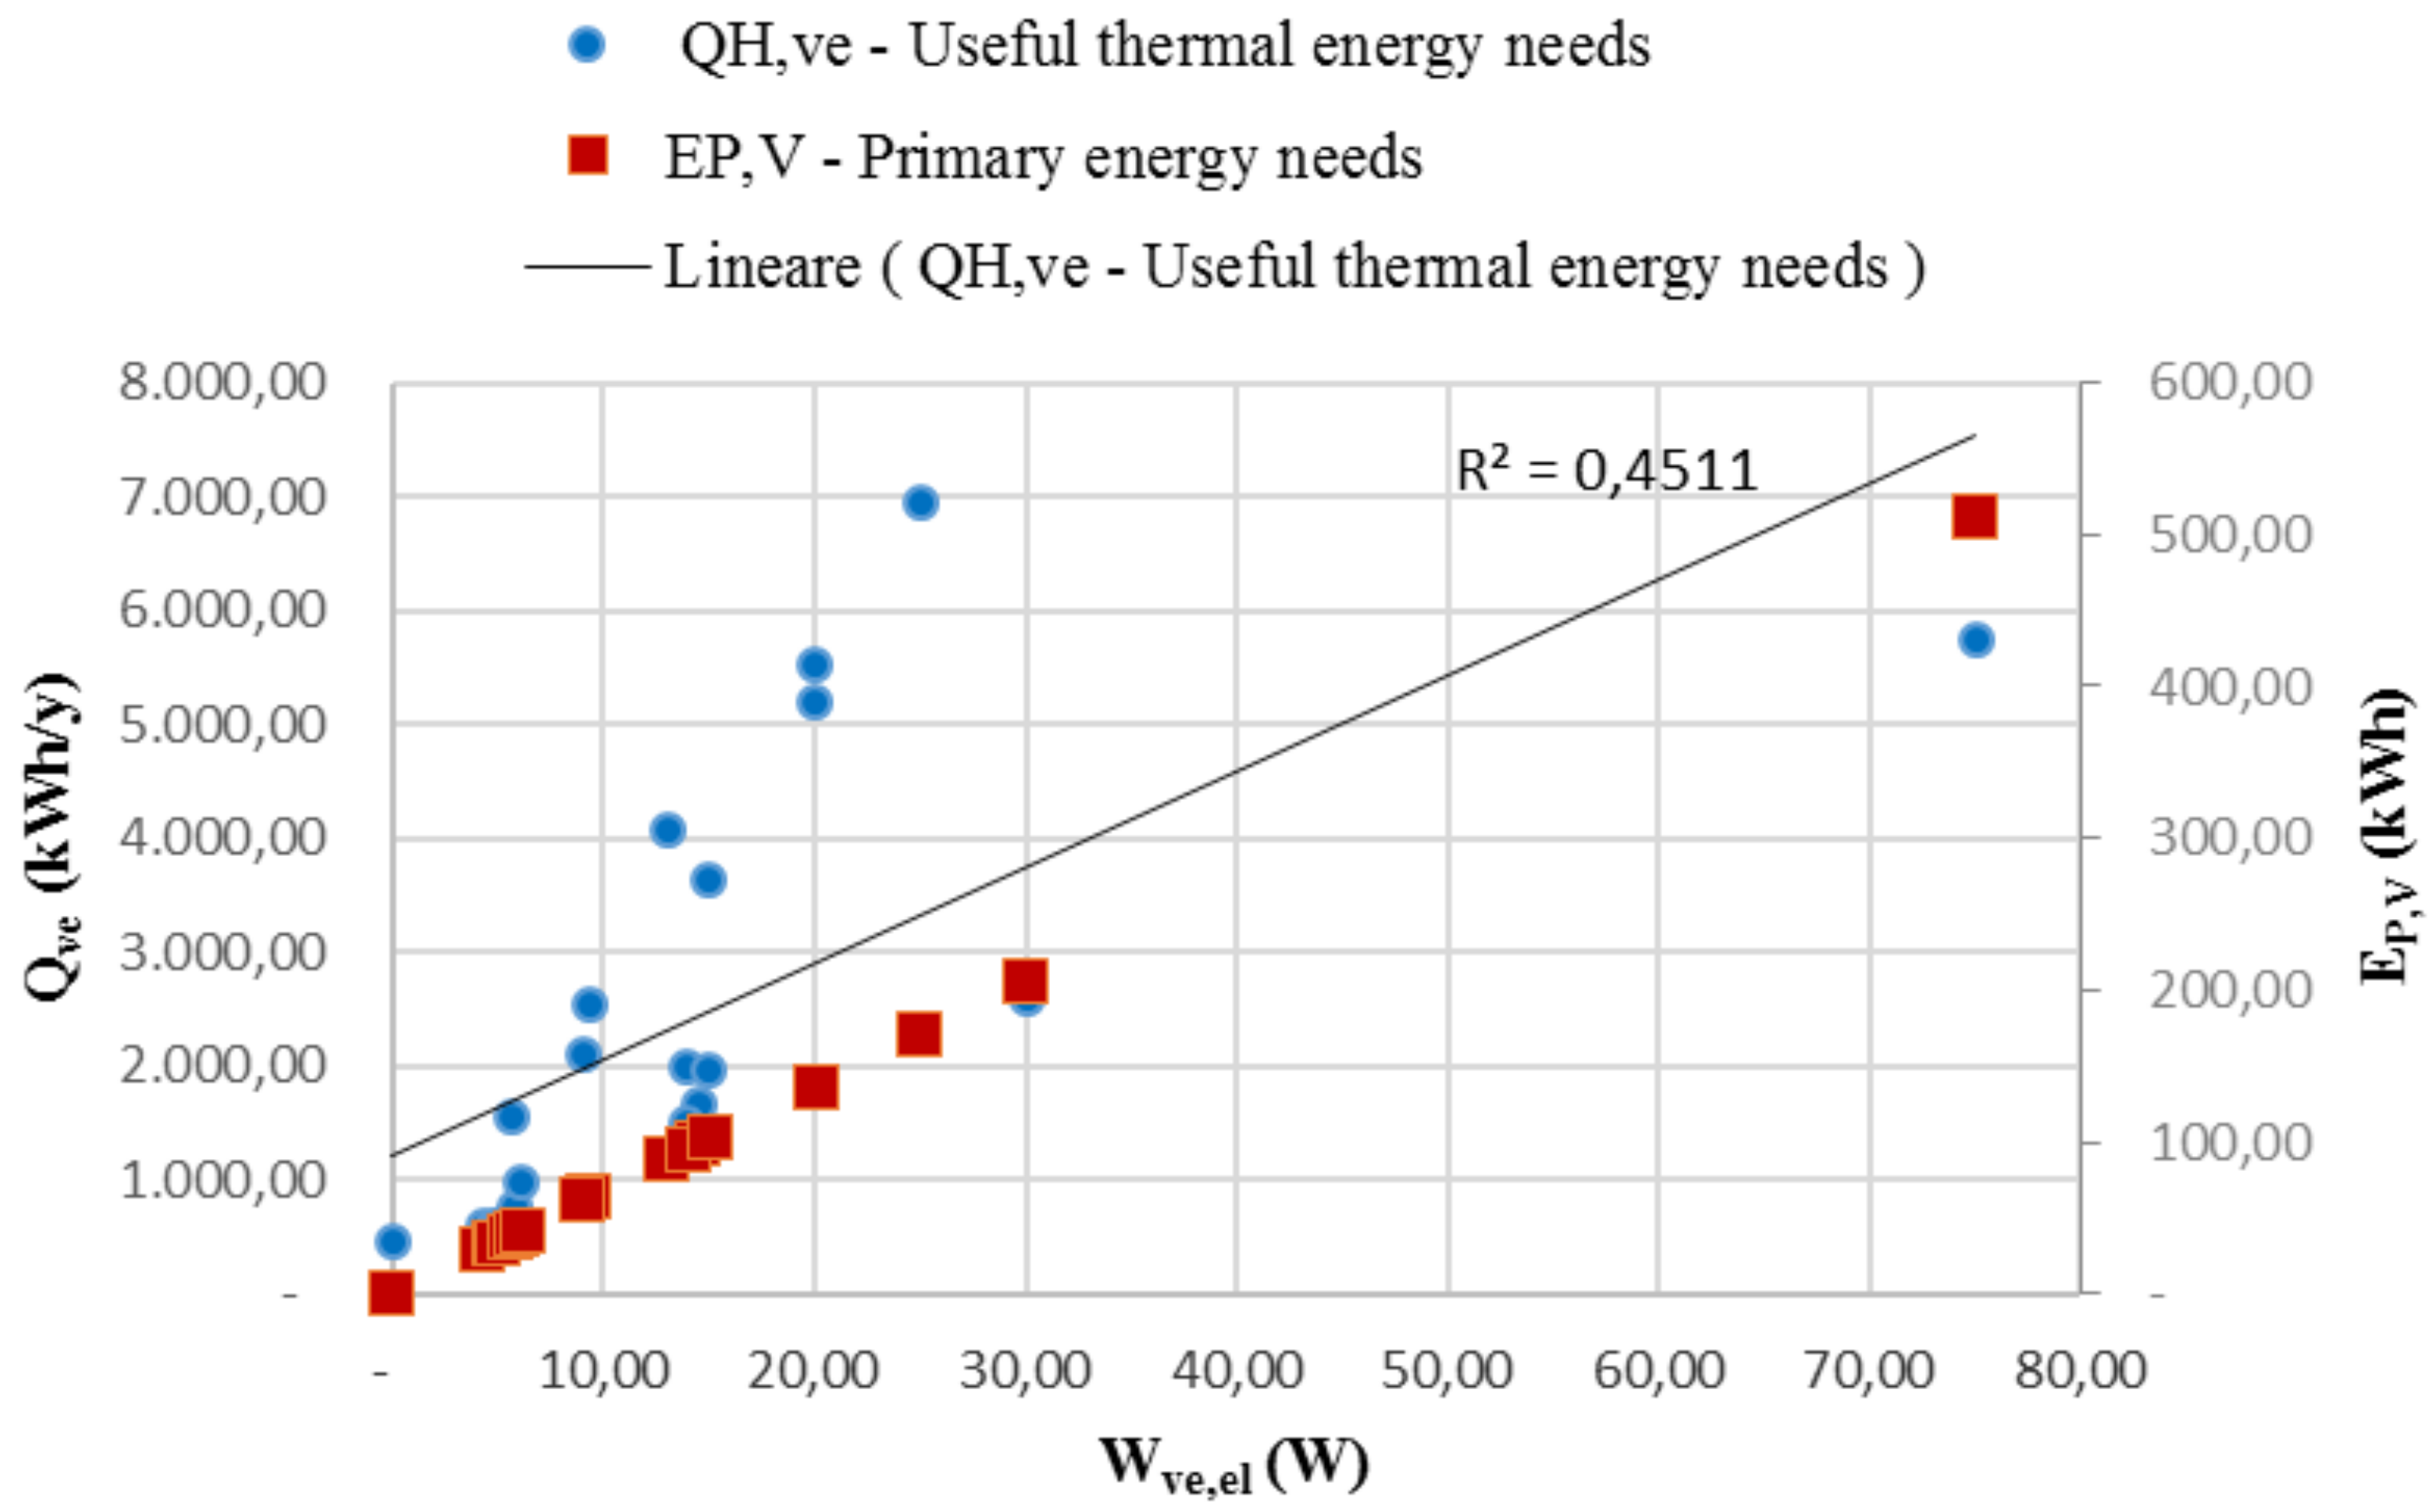
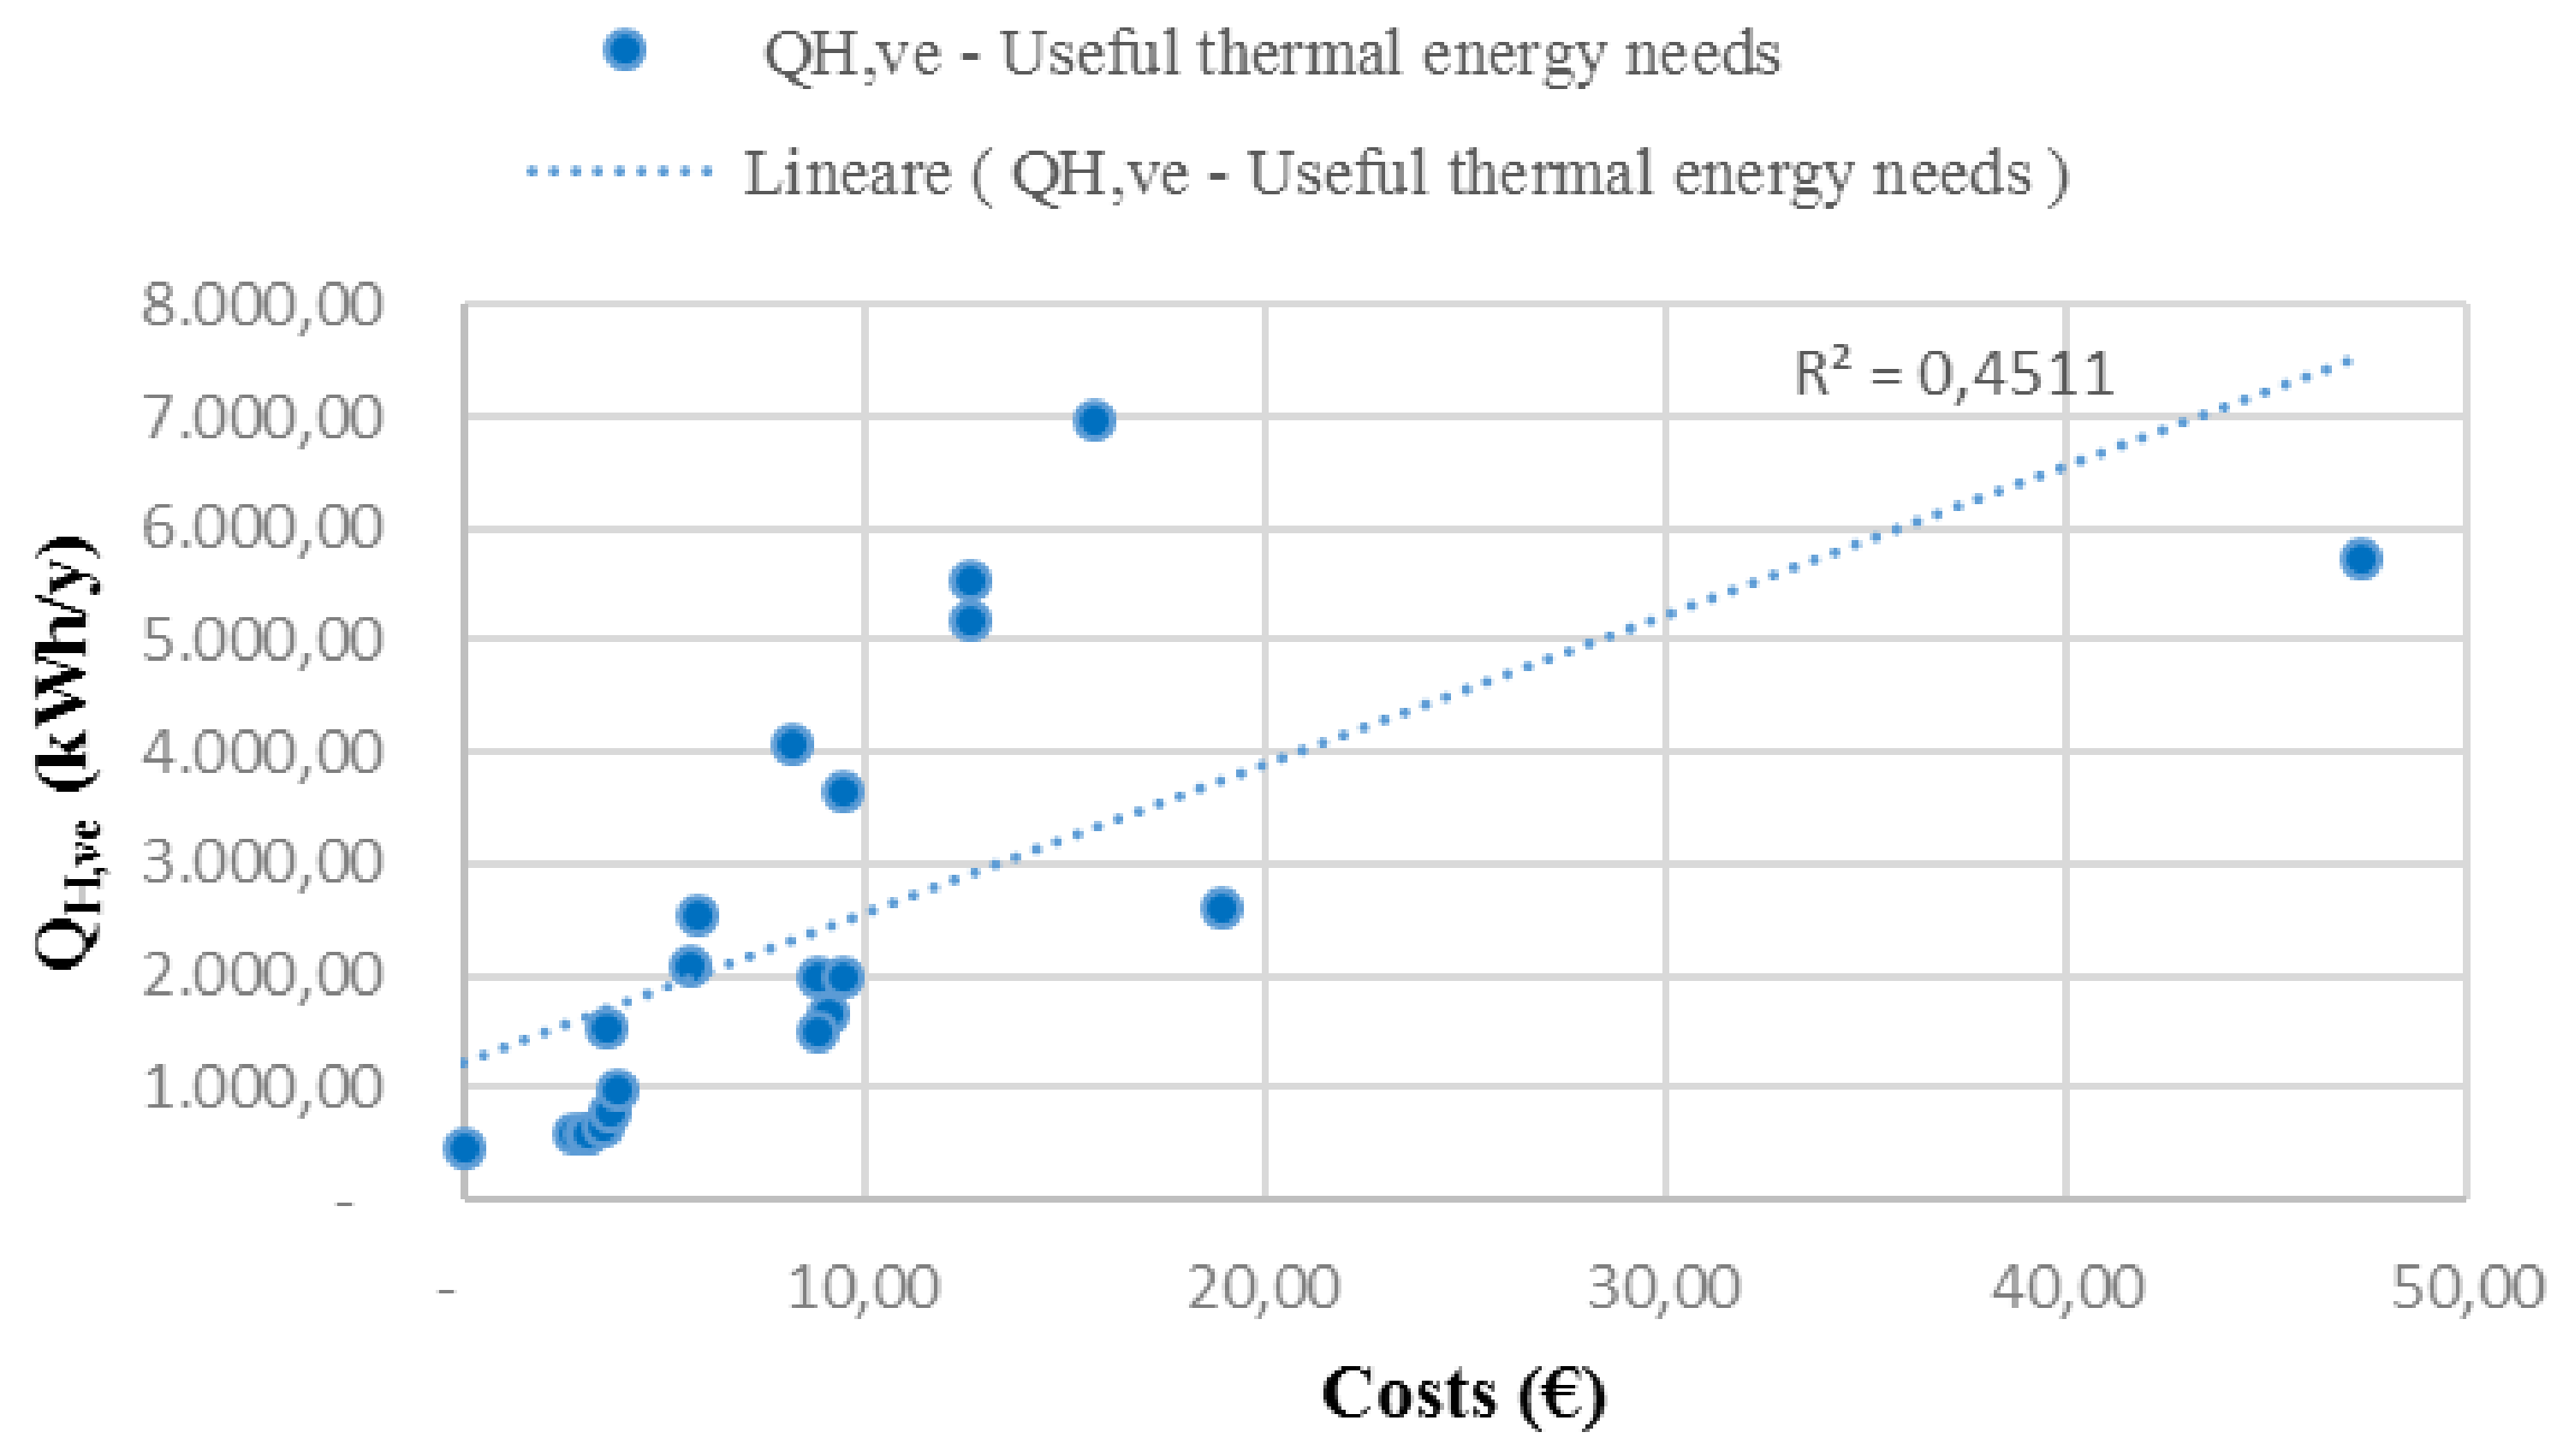
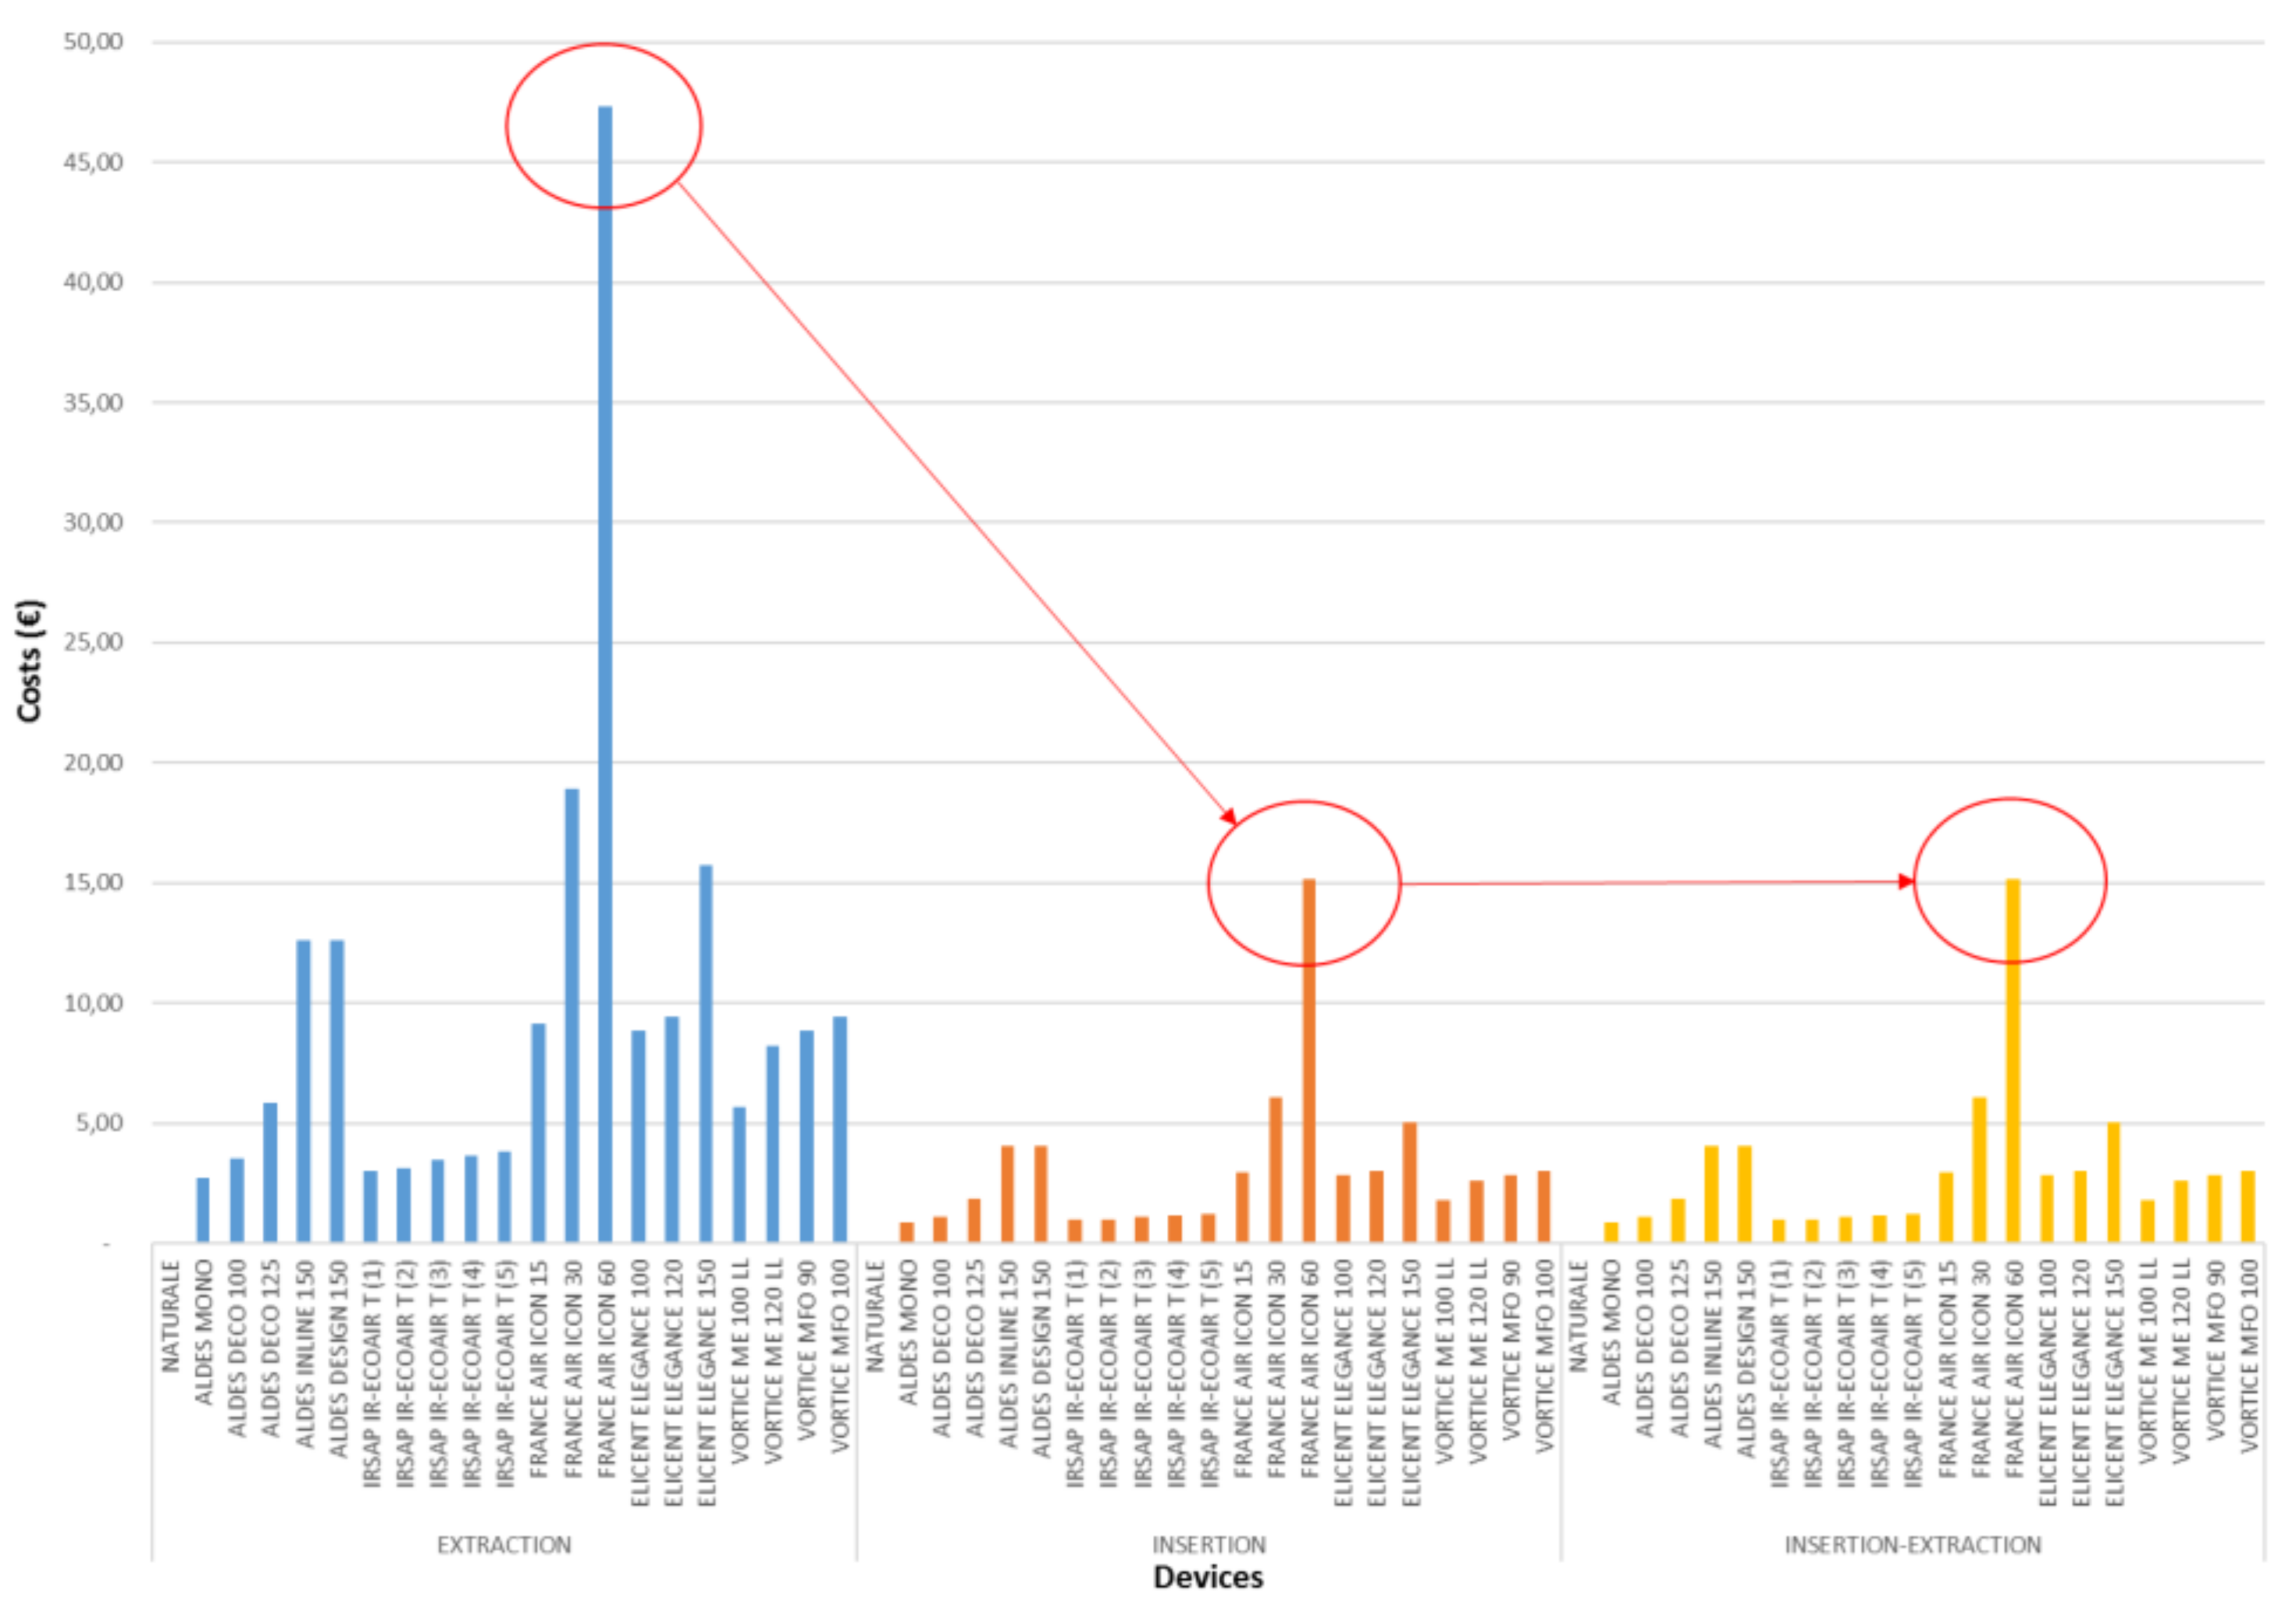
Figure 6 shows the values of useful thermal energy needs (QH,ve) on the y axis and the management costs related to each device on the x axis. The straight line trend that describes the relationship between the two parameters is not linearly proportional, but contains anomalous situations that deviate from the straight line, and the regression coefficient R2 is equal to 0.451. This result confirms that the management costs depend completely on the primary energy needs for ventilation, and then the minimum flow rate of the ventilation. The anomalous situations, which differ from the trend line R2, represent the devices that have a high value of EP,V.
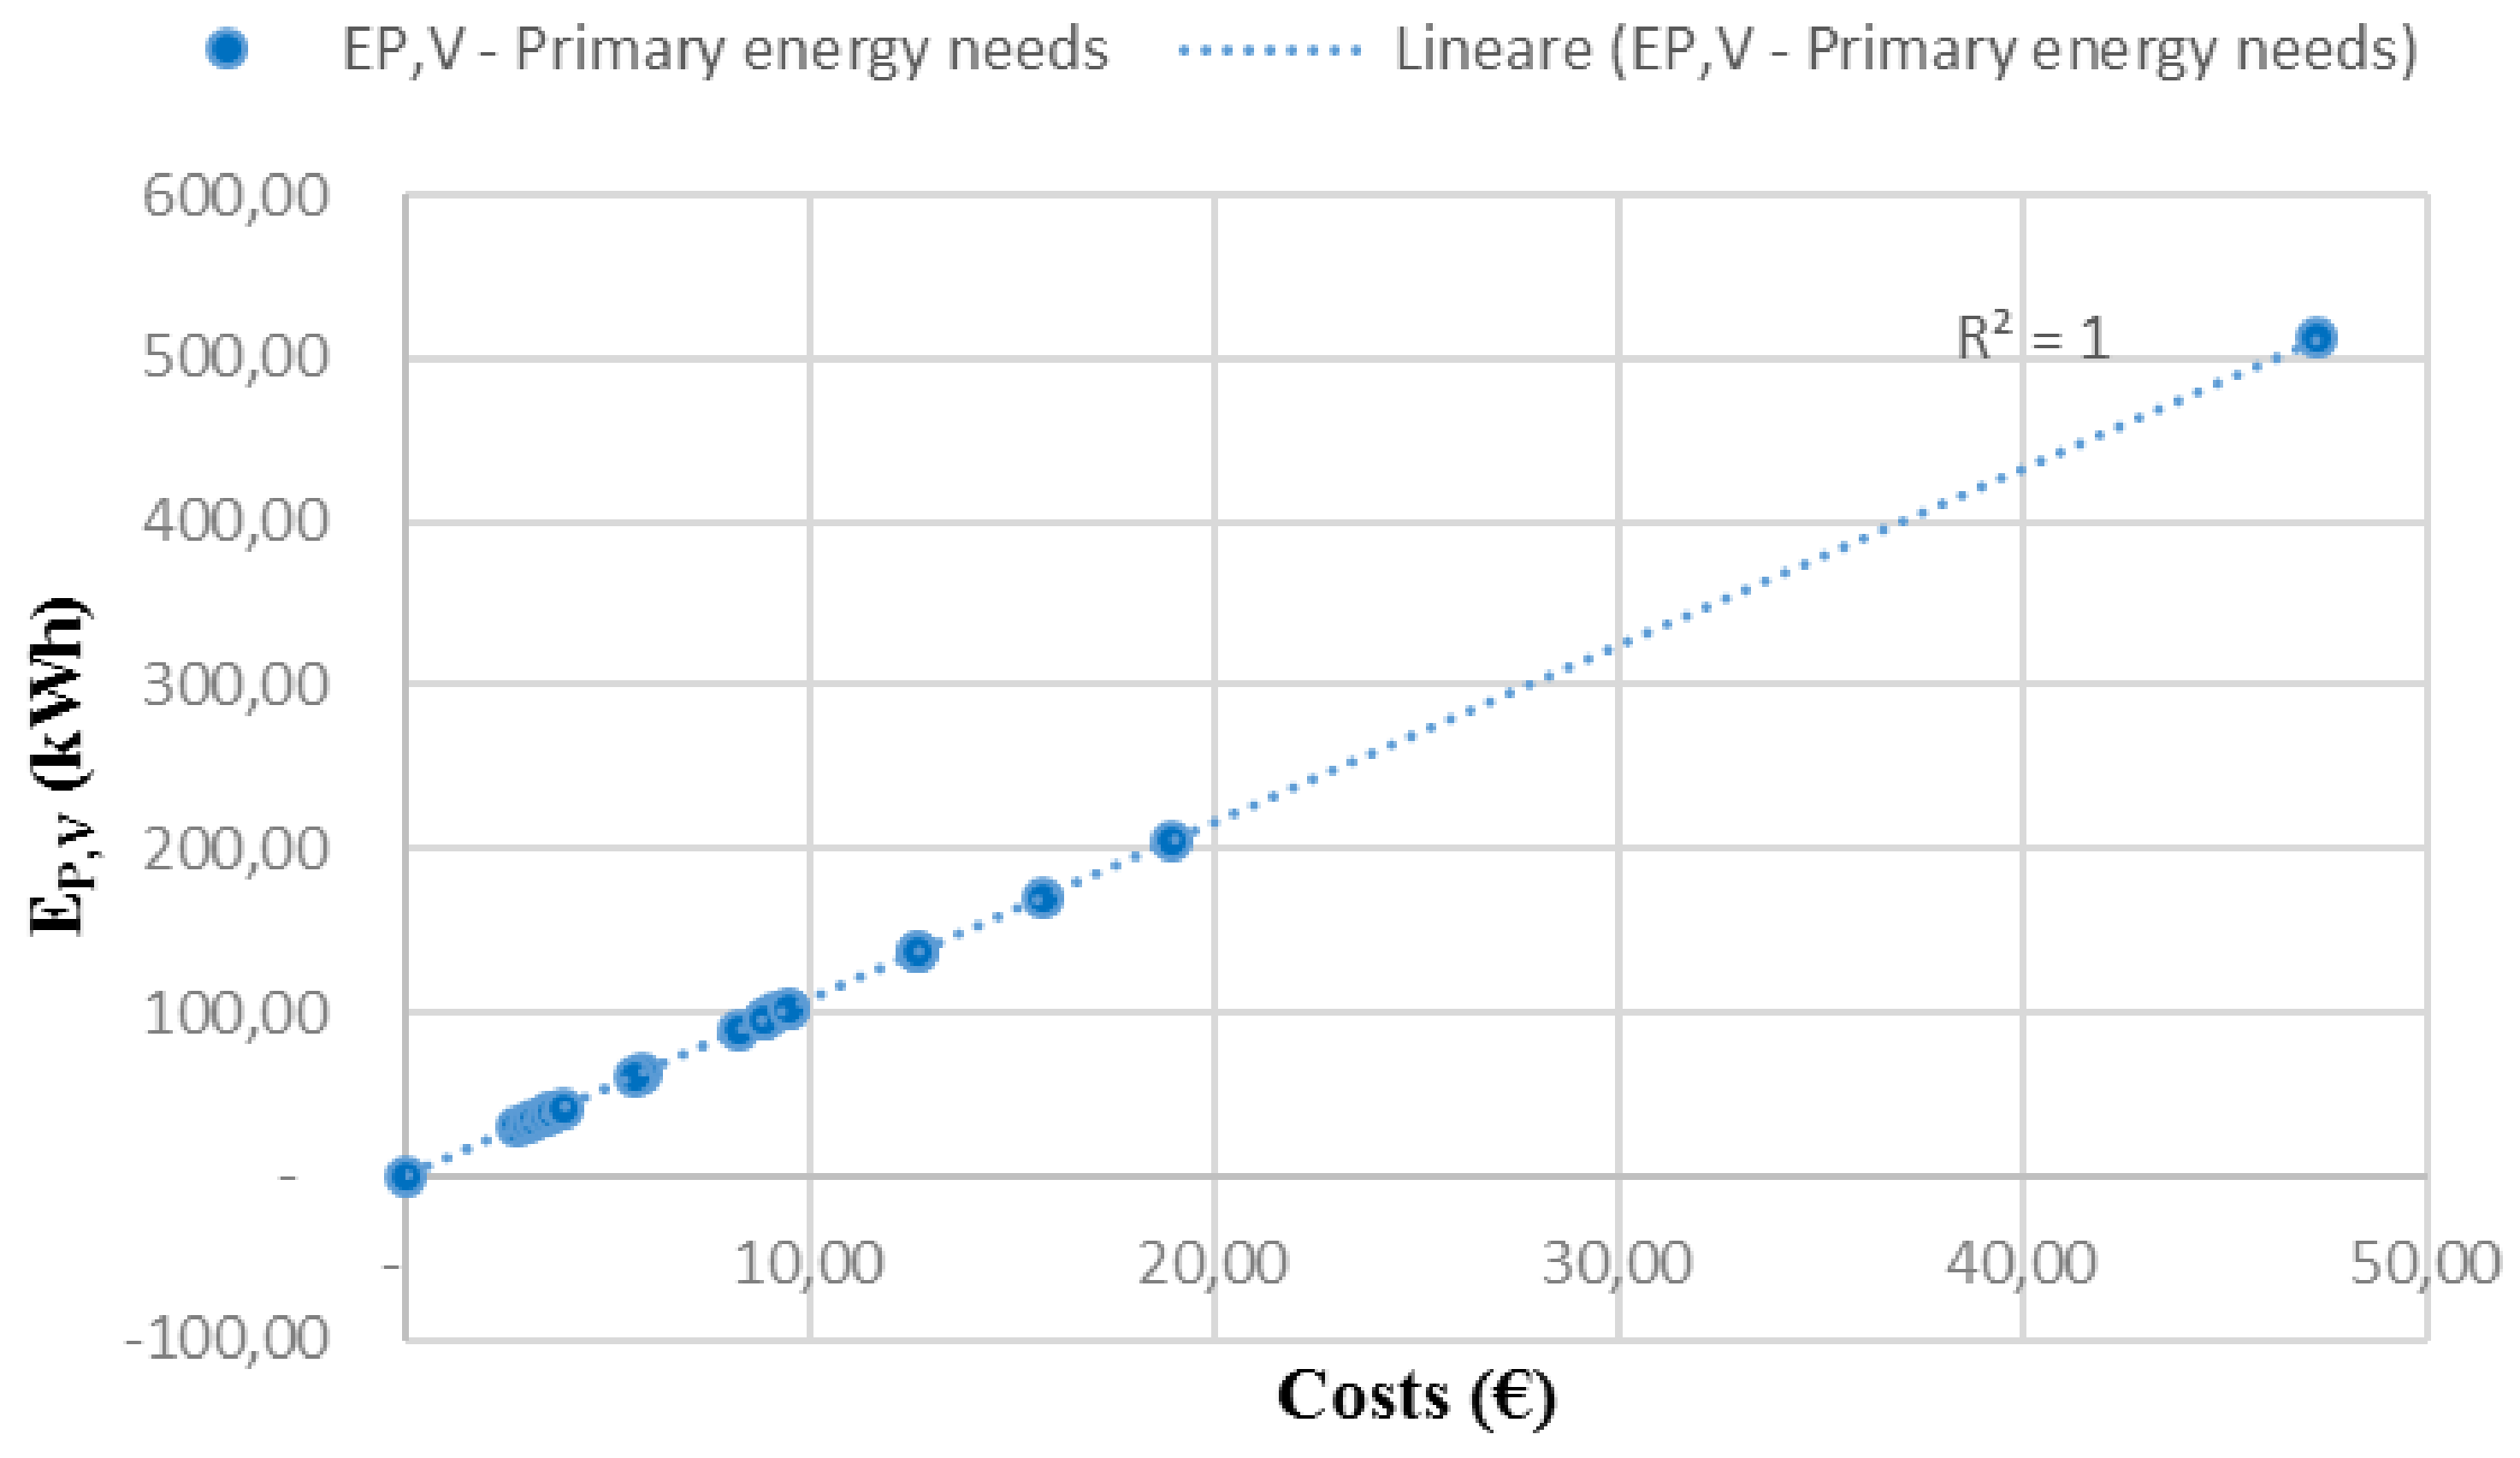
Figure 7 shows the value of primary energy needs (EP,V) on the y axis, and the management costs related to each device on the x axis. In this case, the relationship is linear: the trend line that describes the two parameters grows linearly with a regression coefficient R2 equal to 1. In other words, if the primary energy needs increase, the management costs also increase.
5.2. Comparison of the 3 CMV Systems
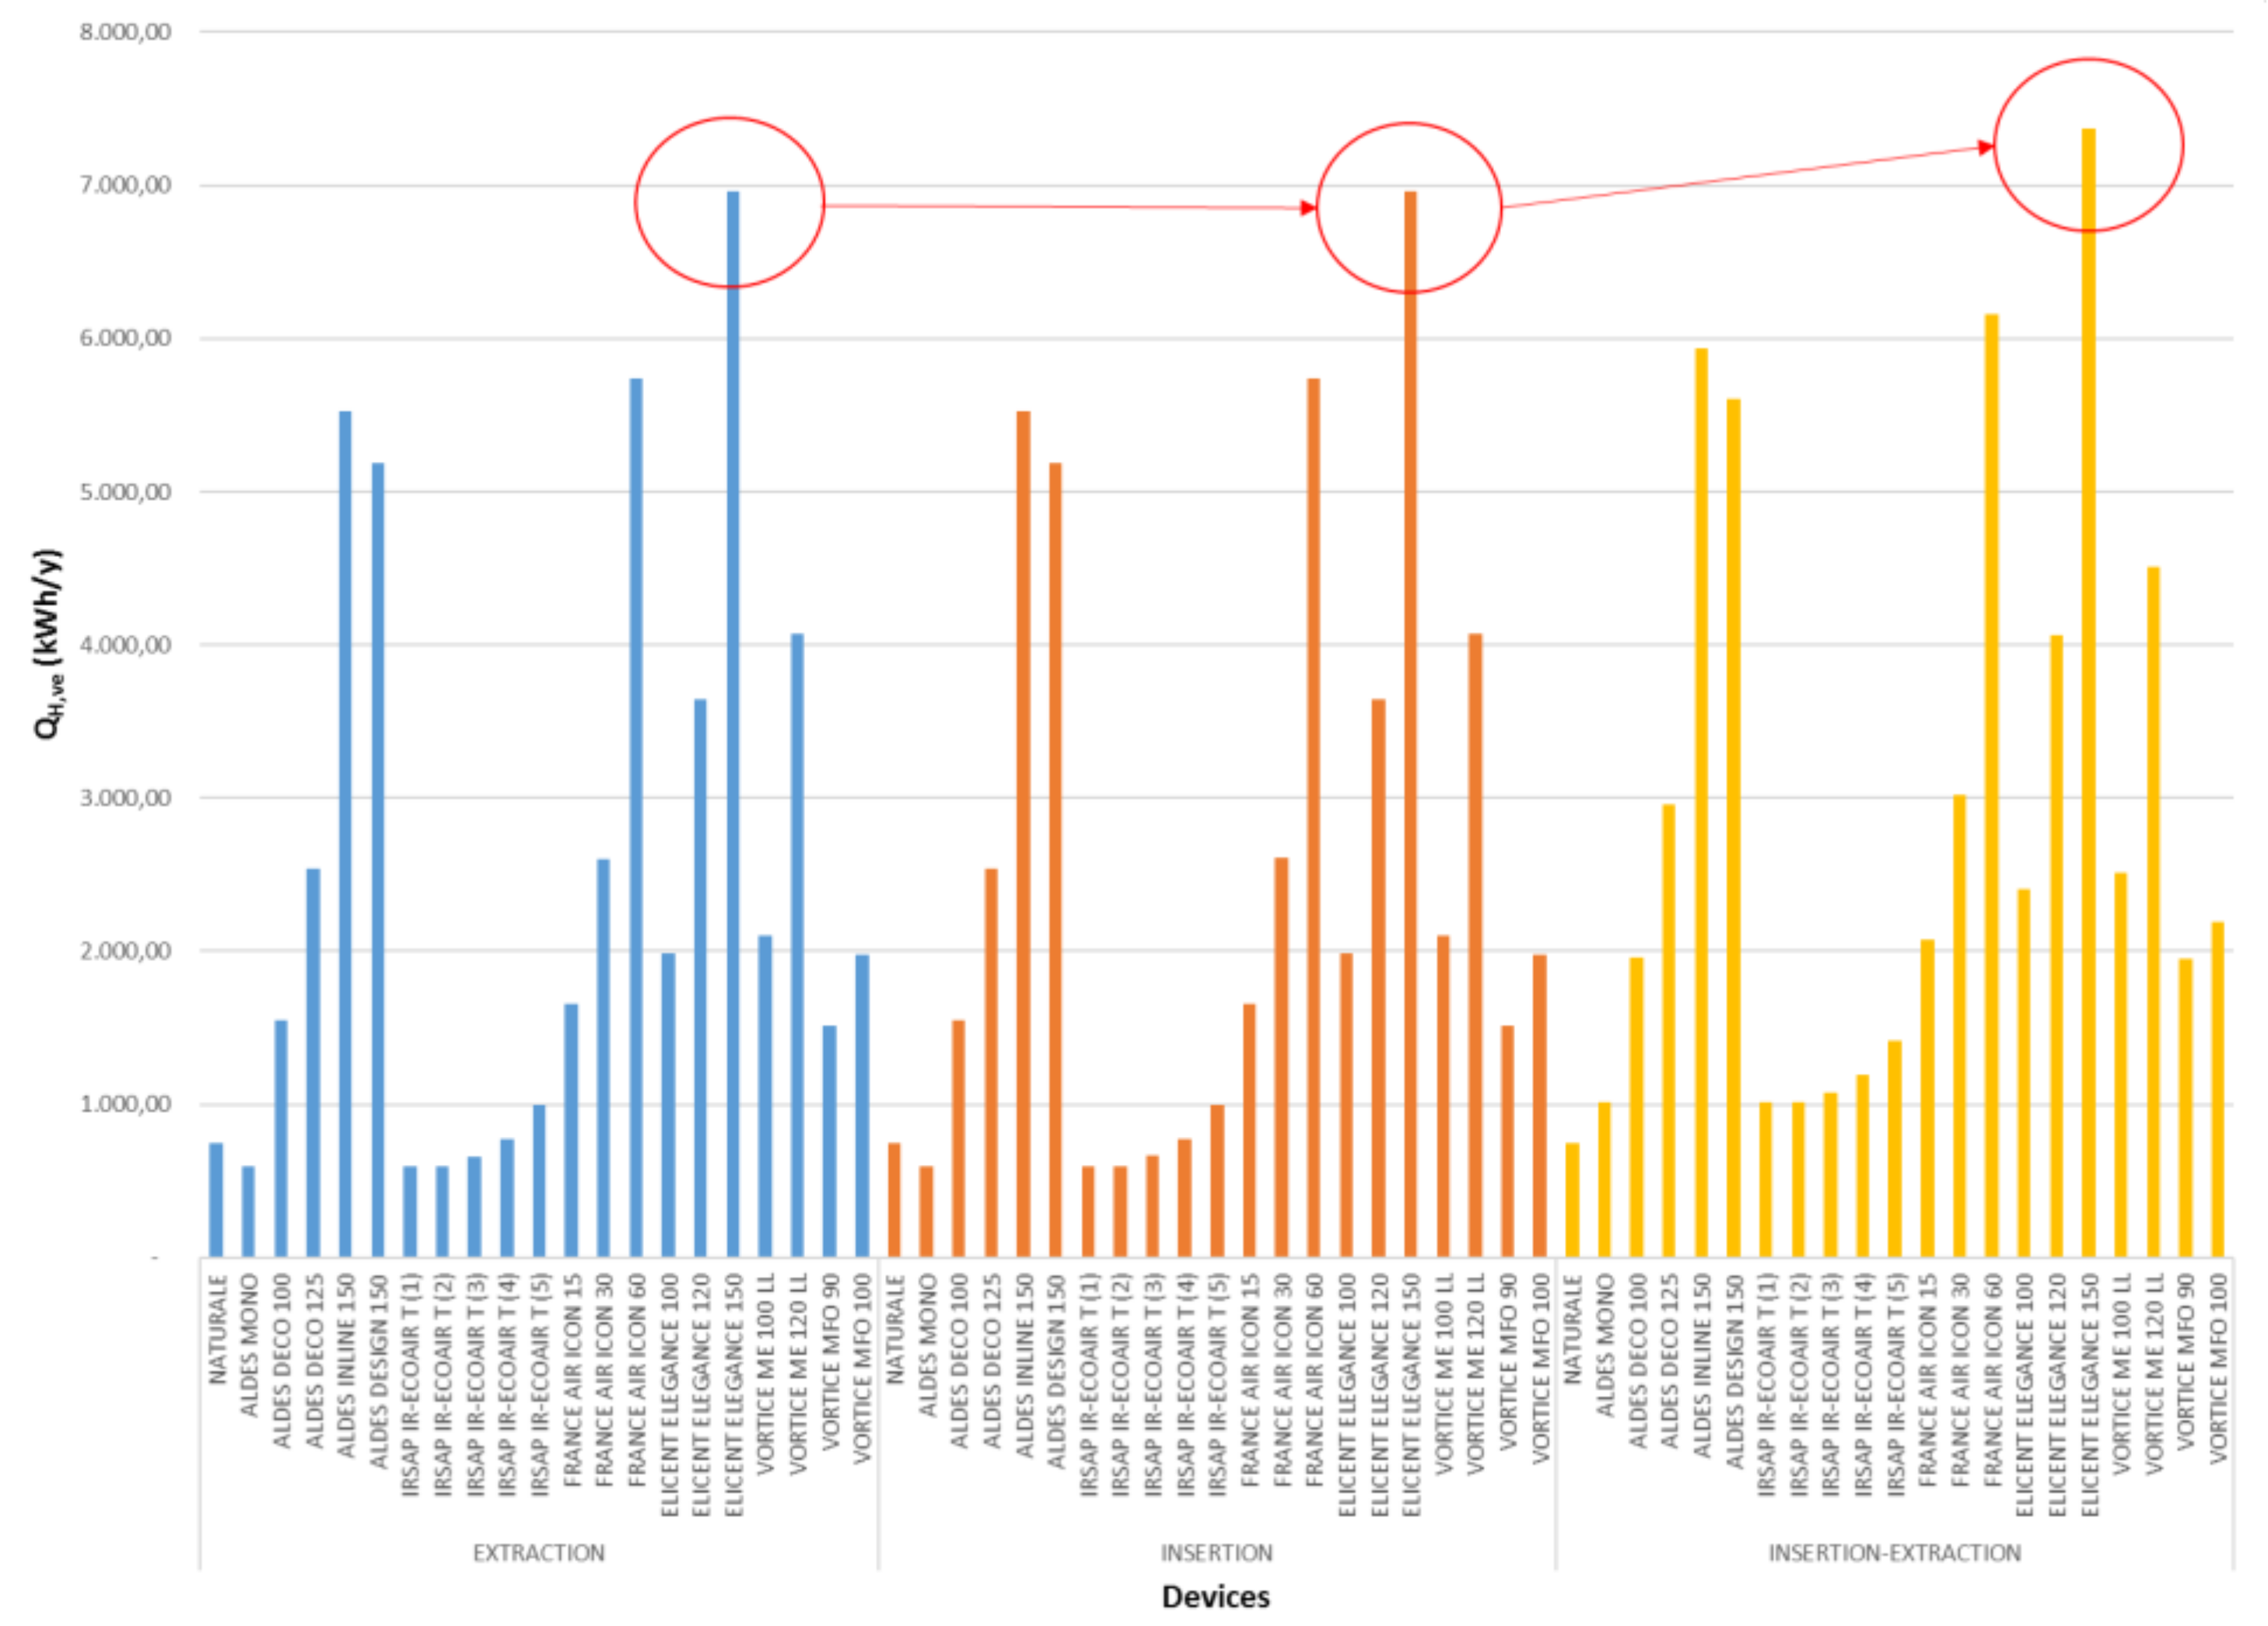
Figure 8 shows, for each CMV device, according to each characteristic (emission, insertion, emission/insertion) the value of useful thermal energy needs for ventilation (QH,ve), expressed in kWh/y. The values are similar between the first two types of CMV, while the third typology, corresponding to balanced insertion and extraction systems with double conduits, has slightly higher values.
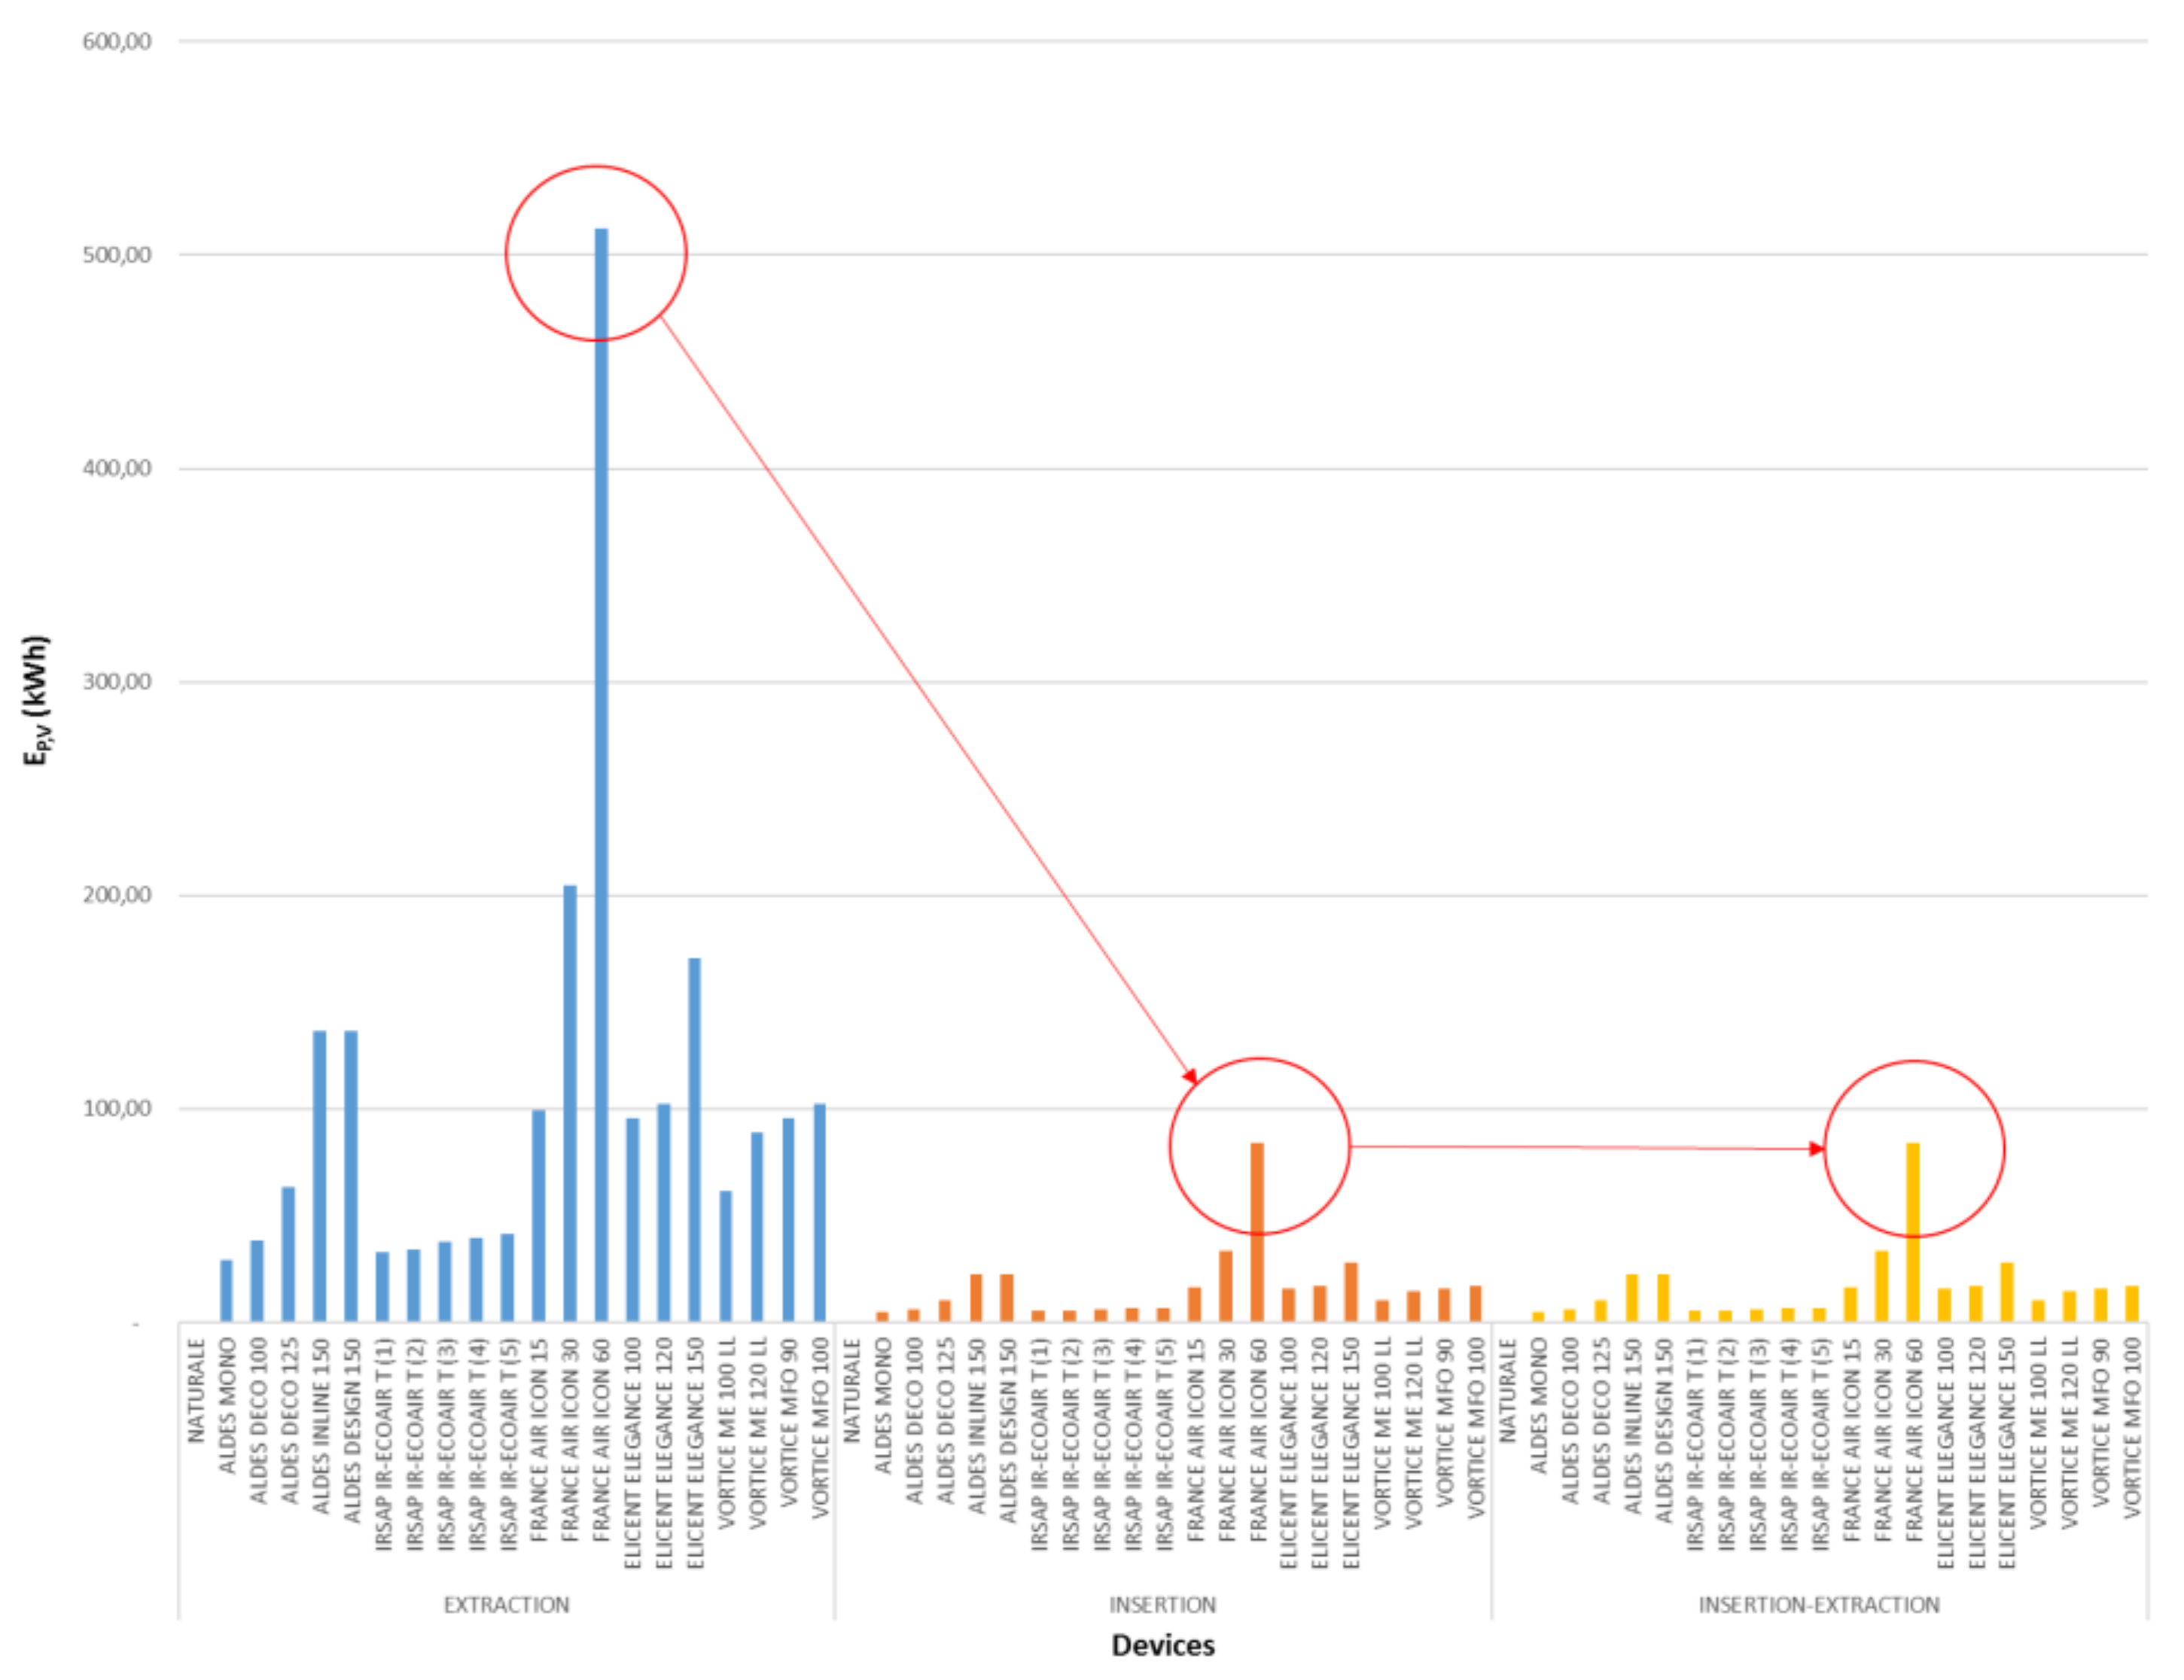
Figure 9 reports, for each product and CMV system, the value of primary energy needs (EP,V), expressed in kWh/y; it is evident that the first set of columns, which represents the centralized extraction systems with a single conduit, requires a higher quantity of primary energy needs (EP,V) for the same ventilation flow and useful thermal energy needs. Conversely, the other two column groups, which represent relatively centralized insertion systems with single conduits and balanced insertion and extraction systems with double conduits, are roughly equivalent.
In the first column, there is a situation where the device requires a large amount of primary energy, and is attributed to the product of France Air model Icon 60, which requires higher electric power for the fan (Wve,el) equal to 75 W.
5.3. The Correlation between Useful Thermal Energy and Primary Energy Needs
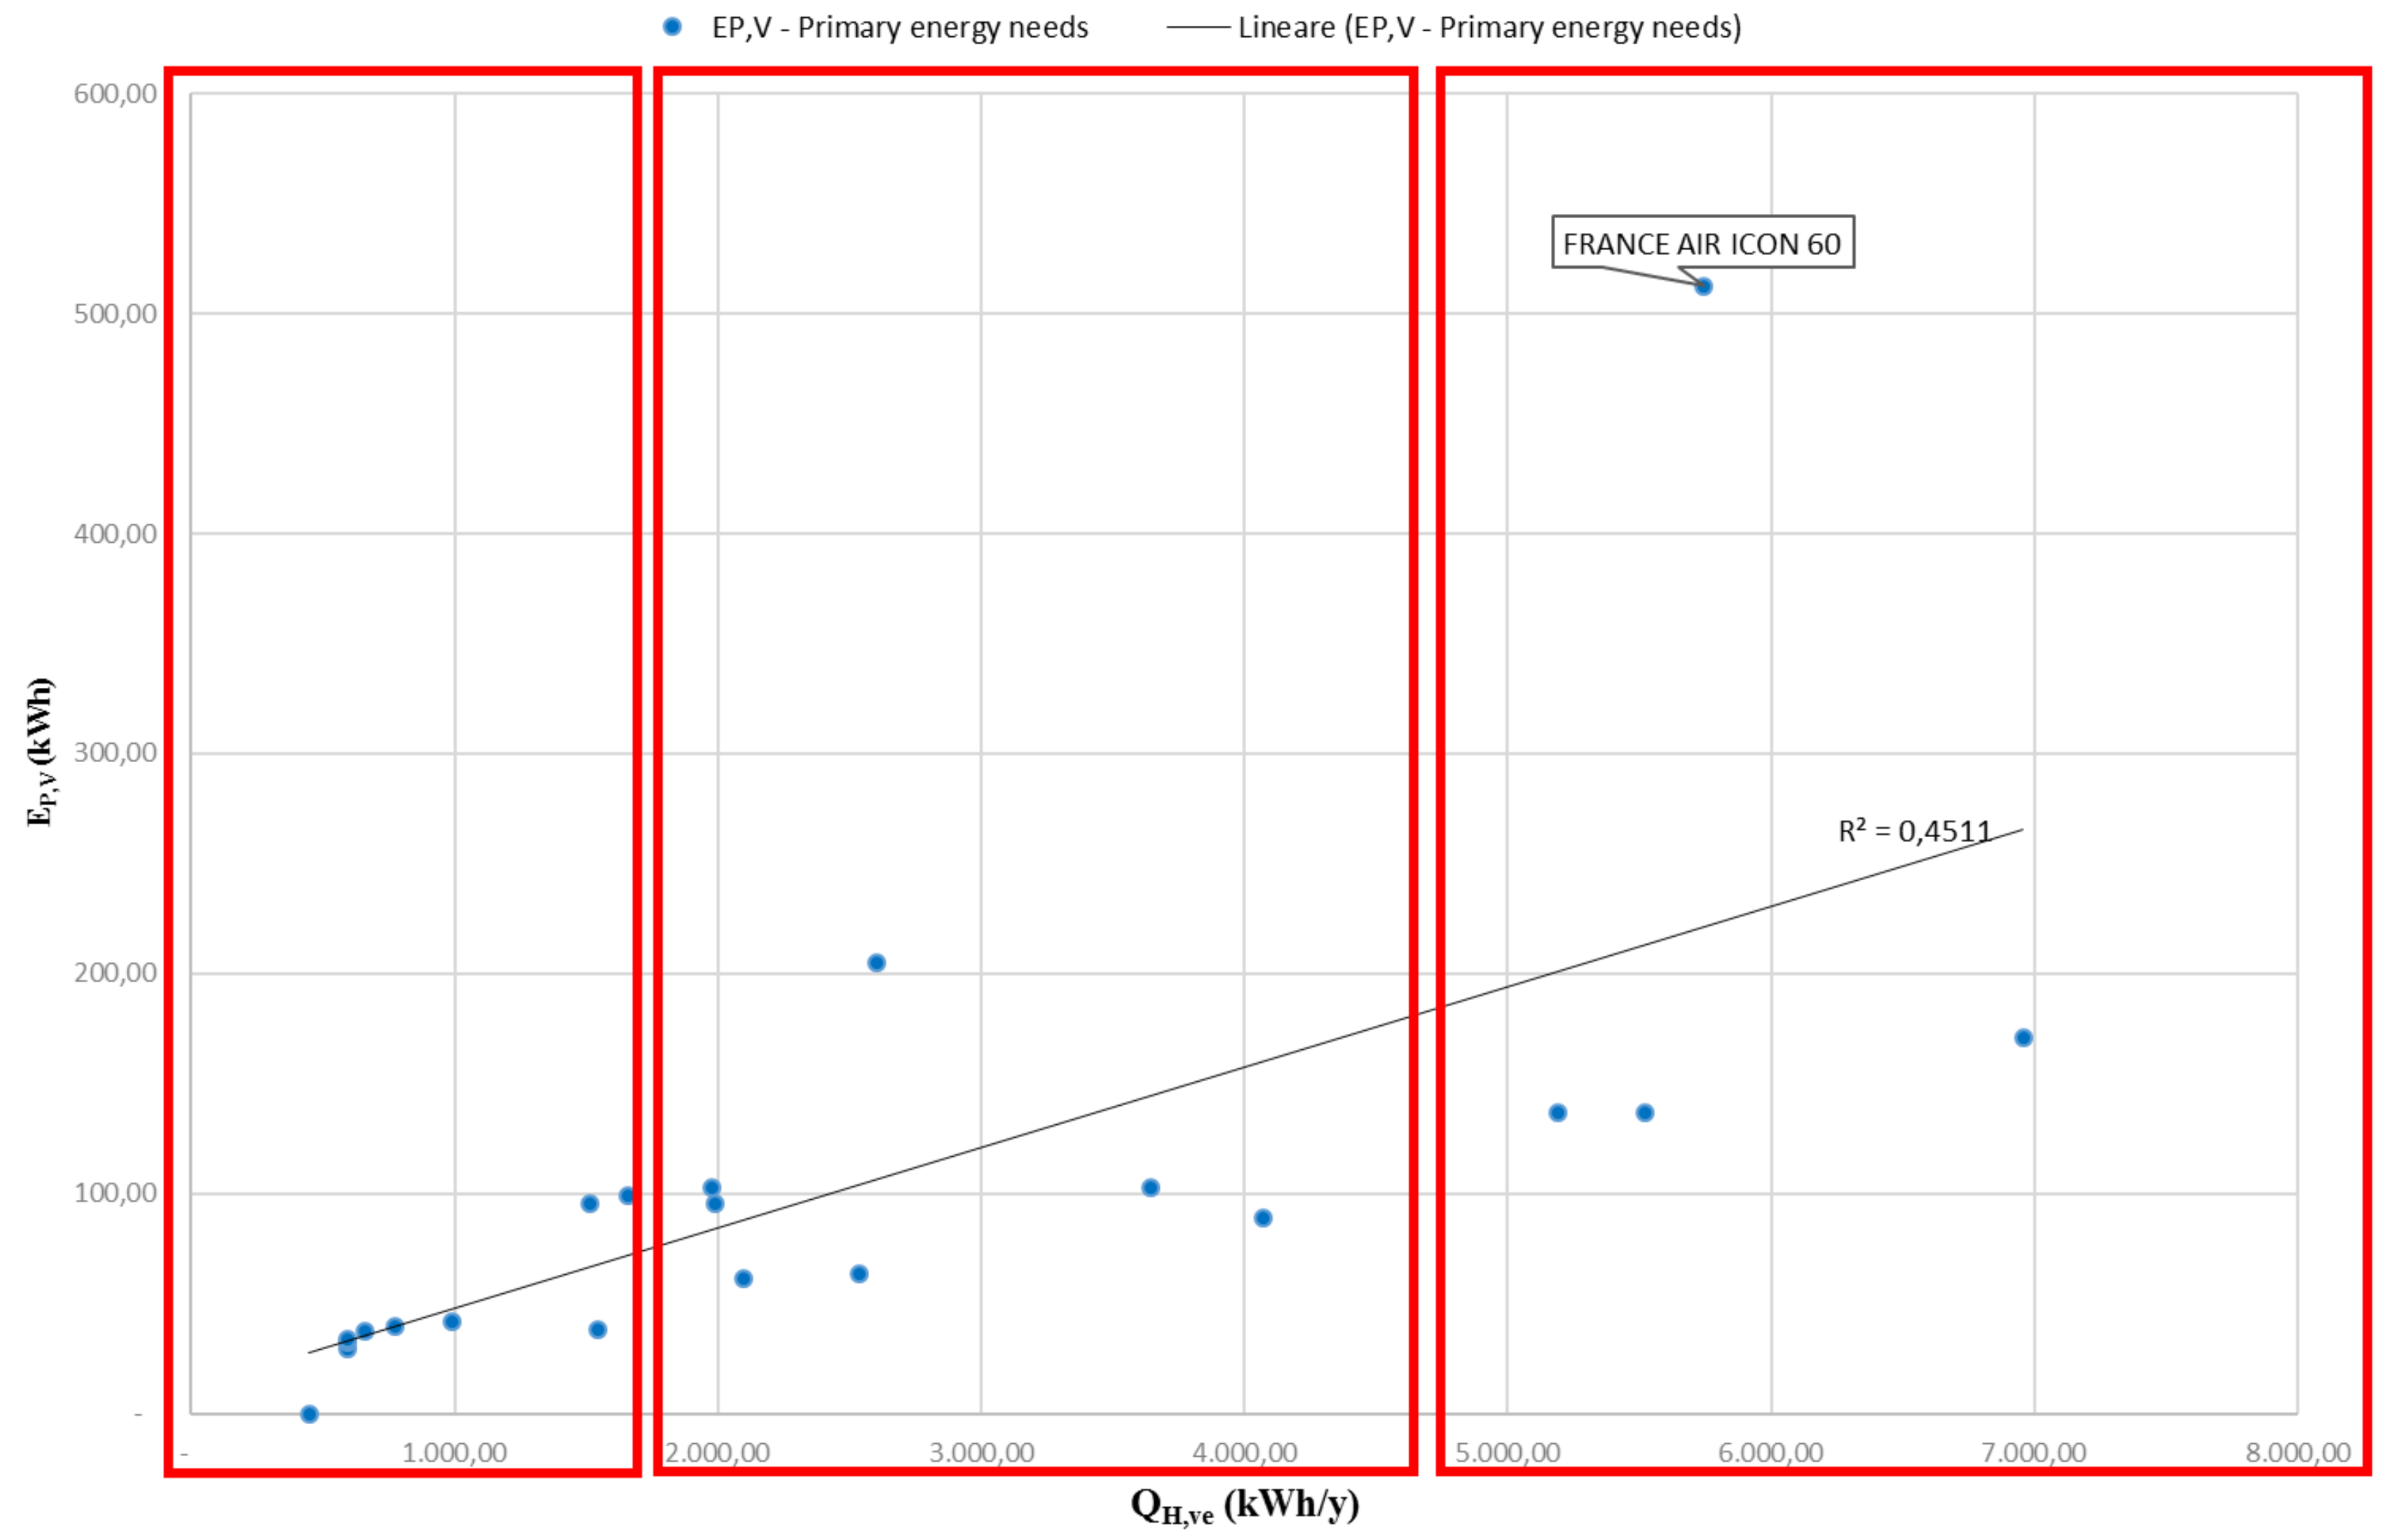
The simulation compares the relationship between useful thermal energy needs (QH,ve), which depends on the geometrical characteristics of the room (volume) and the nominal flow rate of controlled mechanical ventilation with primary energy needs (EP,V), which depends on the electric power of the insertion or extraction fan, i.e., technical data provided by the manufacturer. The aim of the research is to check whether there is a linear relationship, or rather whether the increase in thermal energy necessitates an increase in the primary energy needs.
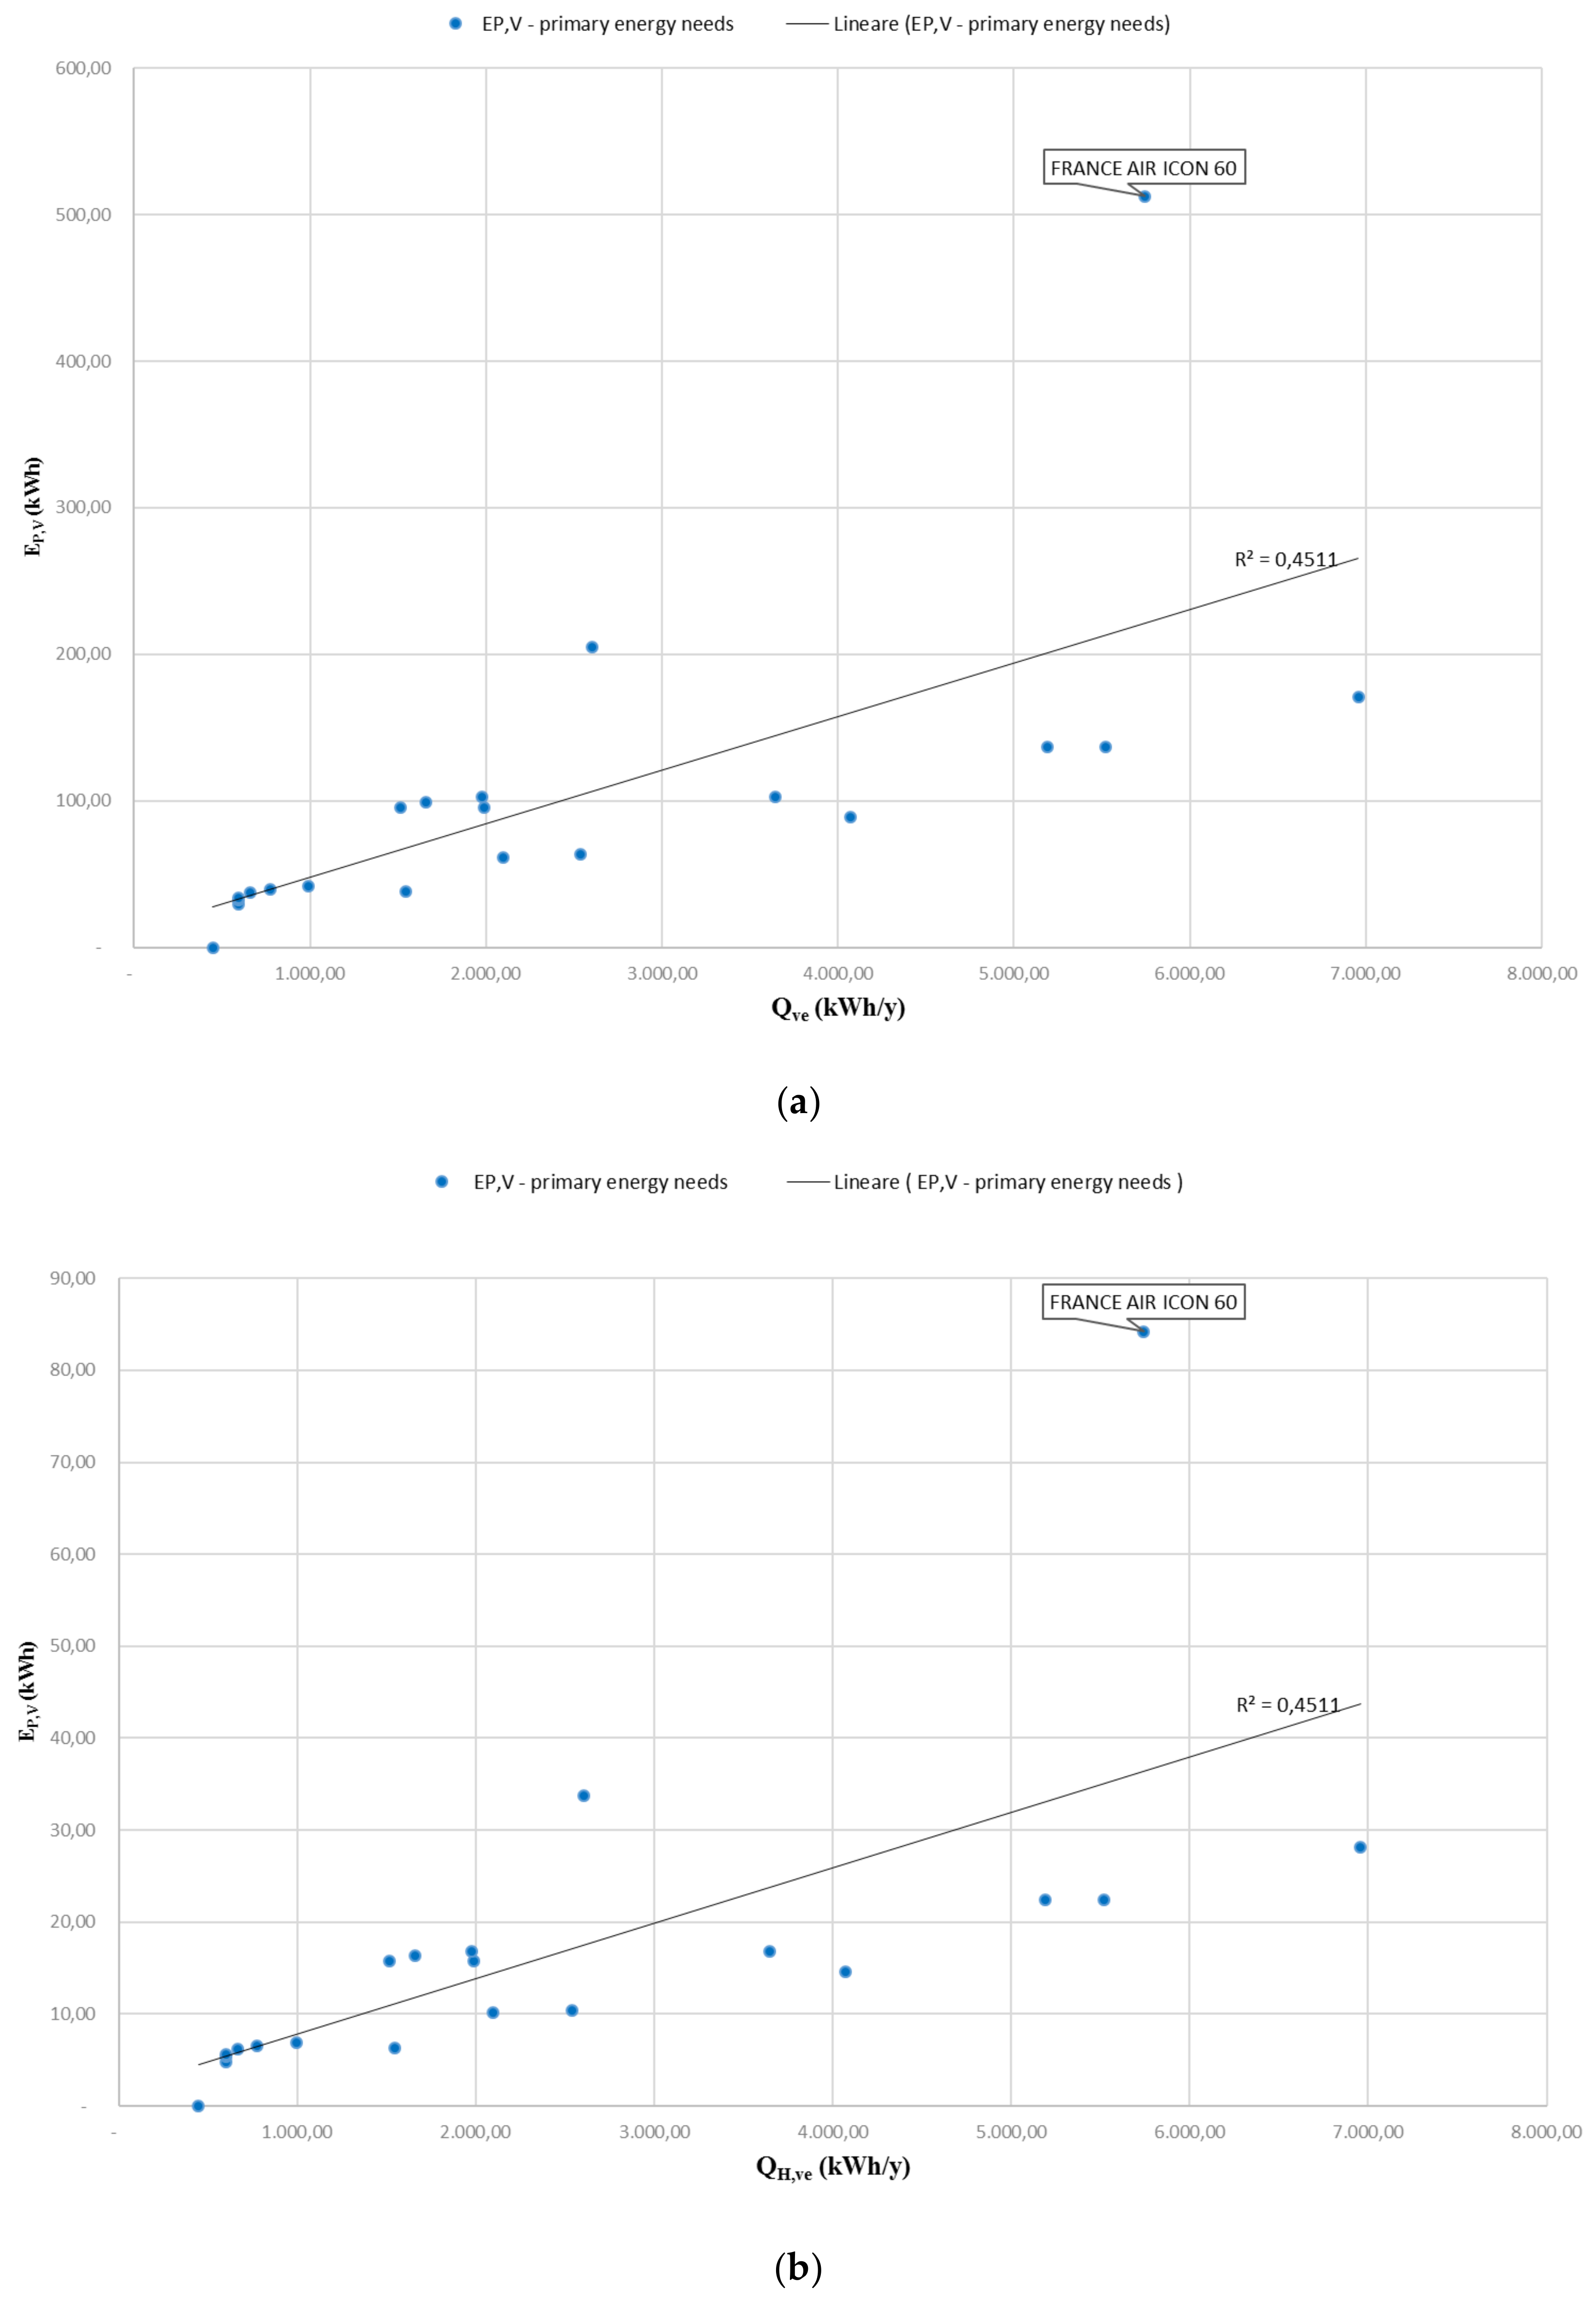
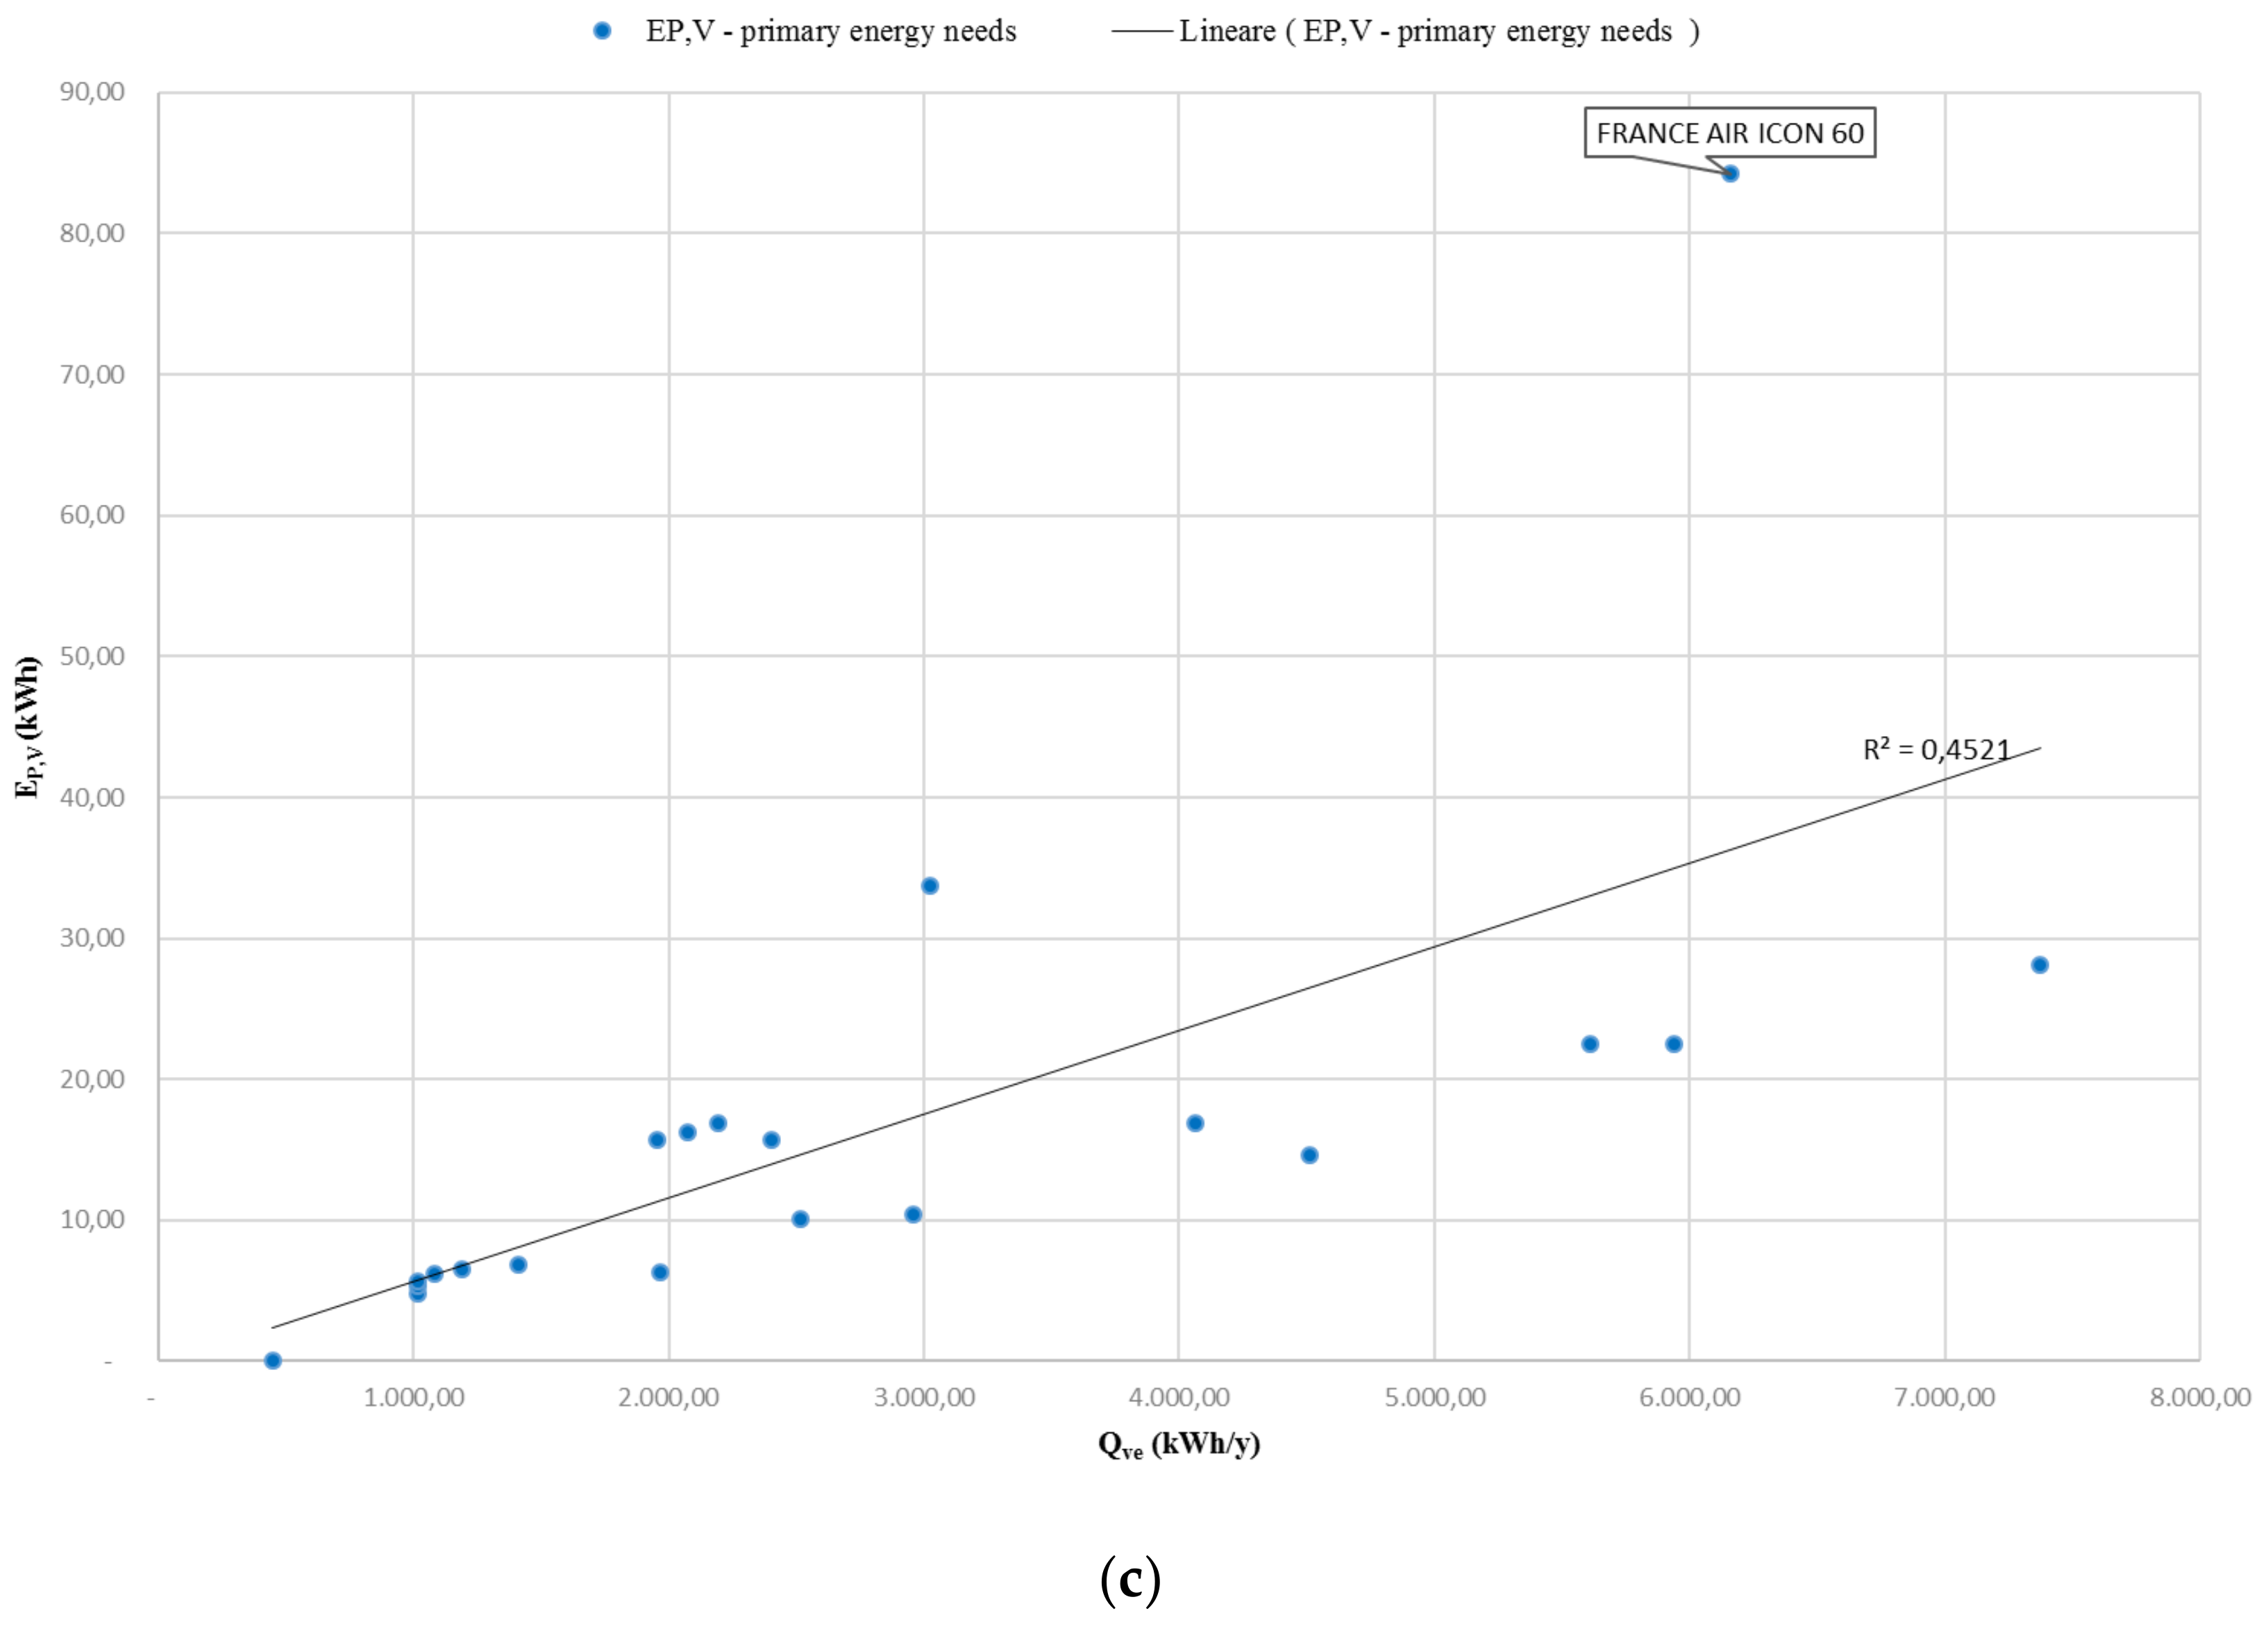
Figure 11 shows the relationship between primary energy needs (EP,V) on the y axis and the useful thermal energy needs (QH,ve) on the x axis. The first diagram (Figure 11a) shows that between the two parameters there is a clear and evident linear correlation—in some situations, the values deviate from the trend line represented. For all three types of CMV systems, the France Air model Icon 60 shows an abnormal situation.
This confirms that, according to the formulas used by UNI/TS and the characteristics of CMV products, it is not possible to identify a strong linear correlation between useful thermal energy needs (QH,ve) and primary energy (EP,V); it is necessary to perform the calculations each time.
The linear trendline shows a regression index (R2) of 0.45 for all three types of CMV systems, with a weak association to useful heat energy need values (Qve) exceeding 5000 kWh/y.
6. Discussion
In the context of UNI/TS 11300 for the calculation of the energy performance necessary for energy certification and/or of the application of Directive 2010/31/EU, this research helps understand whether there is a strong or weak correlation between ventilation requirements and management costs. Figure 10 shows that there is a correlation, but it is a “weak positive correlation”. We could assume that higher levels of thermal energy needs for ventilation correspond to higher costs for ventilation.
Figure 12 gives more detail about the comparison between the values of QH,ve and those of EP,V; there is not a strong linear correlation. The two values are strongly dependent on the time-averaged airflow (qve,k,mn) and the electric power of the fan (Wve,el).
Analyzing the results in detail, it is interesting to note that for values of QH,ve below 1000 (kWh/y), the natural ventilation systems and CMV systems could be considered similar, because they have a strong correlation. However, for values of QH,ve over 2000 kWh/y it becomes convenient for the CMV system because it has moderate values of EP,V. For values of QH,ve exceeding 5000 kWh/y, the correlation is weak and some devices on the market, having the same ventilation capacity, require a high value of EP,V and are therefore more costly.
Analyzing the graphs of Figure 6 and Figure 7, in which EP,V and QH,ve are compared with their management costs, EP,V has a linear correlation with them, because this parameter depends on the power of the fan Wve,el, while QH,ve has no significant direct proportionality.
In our research, we analyzed twenty devices, and our statistical analysis allowed us to evaluate whether a correlation exists between energy need and primary energy; a correlation exists, as shown in Figure 11c. Multivariate analysis could be more detailed, but in our case, we do not need to reduce the dimension of the data set, it is just simplified; our aims were to verify if this kind of research could be done, and to understand the case of small CMVs. In future studies, Factor Analysis (FA) and Principal Components Analysis (PCA) could be used.
Is Natural or Mechanical Ventilation Better?
Is controlled mechanical ventilation always to be applied? The research aims to assess the relationship between useful thermal energy and primary energy needs for ventilation, when there is a natural ventilation system. It is obvious that if the CMV system does not exist, its energy costs and needs are null.
The study shows that it is not possible to identify a criterion, economic or energetic, which by itself justifies the adoption of a CMV system. The decision of whether or not to adopt CMV systems is ‘upstream’ with respect to these evaluations and concerns design choices. Generally, it is observed that CMV systems are most prevalent in buildings that are extremely airtight, and are intended as mandatory in some certification protocols like the buildings Passive House, Casaclima, LEED NaturePlus, etc.
7. Conclusions
In conclusion, the study shows that it is interesting and useful for the design of ventilation systems in buildings to investigate the relationship between the useful thermal energy needs for ventilation (QH,ve) and the primary energy needs for ventilation (EP,V).
The analysis shows that there is not a strong linear correlation between the useful thermal energy needs and management costs, so it is not possible to adopt a simplified design criterion, it is necessary to provide compliant solutions or examples of CMV systems applied to individual houses. Perhaps for these reasons, the brochures of CMV systems provided by companies contain designs or patterns referring to specific cases, while expeditious design criteria are missing, because each situation has boundary conditions and different design requirements.
The CMV systems are particularly effective for high-performance buildings, in which there losses or leakage through doors and windows do not occur, while other types of buildings require a thorough investigation to assess whether such systems can provide benefits or simply additional costs in terms of electrical absorptions. In buildings where the airtightness is low, it is not necessary to provide CMV systems, because the natural ventilation is enough.
In addition, as previously mentioned, the total costs of constructing a building with CMV has not been considered; only operating costs, tailored through the monetary cost in relation to the kWh needed for selected fans, have been considered. However, if the installation and design costs had been considered, the research might have obtained different results.
Finally, it would be useful to have standardized flow and power values of the fans of CMV, avoiding having to rely only on information provided by manufacturers/producers. It would also be useful to have a statistical evaluation, or database of the mechanical characteristics of these devices.
Author Contributions
The study was designed by all the Authors. Lamberto Tronchin provided funding for the research, Kristian Fabbri conceived the research. Chiara Bertolli analyzed the data. The simulation, the results, and the analysis were performed by Kristian Fabbri and Chiara Bertolli, and checked by Lamberto Tronchin. The text was written by Kristian Fabbri and Chiara Bertolli and checked and amended by Lamberto Tronchin.
Funding
This research was partially funded by Italian Minister for University and Research (Ministero dell’Istruzione, dell’Università e della Ricerca) PRIN2015-201594LT3F.
Acknowledgments
The Authors wish to thank David J. Knight for having proofread this article.
Conflicts of Interest
The Authors declare no conflicts of interest.
References
- World Health Organization. Natural Ventilation for Infection Control in Health-Care Settings; WHO Guidelines; WHO: Geneva, Switzerland, 2009; Section 2, Part 4. [Google Scholar]
- Wei, W.; Ramlho, O.; Mandin, C. Indoor air quality requirements in green building certifications. Build. Environ. 2015, 92, 10–19. [Google Scholar] [CrossRef]
- ASHRAE. Standard 62, Ventilation for Acceptable Indoor Air Quality; ASHRAE: Atlanta, GA, USA, 2016. [Google Scholar]
- EN 15251. Indoor Environmental Input Parameters for Design and Assessment of Energy Performance of Buildings Addressing Indoor Air Quality, Thermal Environment, Lighting and Acoustics; CEN-CENELEC: Brussels, Belgium, 2007. [Google Scholar]
- EN 13779. Ventilation for Non-Residential Buildings—Performance Requirements for Ventilation and Room-Conditioning Systems; CEN-CENELEC: Brussels, Belgium, 2007. [Google Scholar]
- Australian Standard 1668. The Use of Ventilation and Air Conditioning in Buildings, Part 2: Ventilation Design for Indoor Air Contaminant Control (Excluding Requirements for the Health Aspects of Tobacco Smoke Exposure; Standards Australia Limited: Sydney, Australia, 2016. [Google Scholar]
- World Health Organization. Selected Pollutants: WHO Guideline for Indoor Air Quality; WHO Guidelines; WHO: Geneva, Switzerland, 2009. [Google Scholar]
- World Health Organization. WHO Guidelines for Indoor Air Quality: Dampness and Mould; WHO Guidelines; WHO: Geneva, Switzerland, 2009. [Google Scholar]
- Chen, Y.; Raphael, B.; Sekhar, S.C. Experimental and simulated energy performance of a personalized ventilation system with individual airflow control in a hot and humid climate. Energy Environ. 2016, 96, 283–292. [Google Scholar] [CrossRef]
- Fehrm, M.; Reiners, W.; Ungemach, M. Exhaust air heat recovery in buildings. Int. J. Refrig. 2002, 25, 439–449. [Google Scholar] [CrossRef]
- Fucci, F.; Perone, C.; La Fianza, G.; Brunetti, L.; Giametta, F.; Catalano, P. Study of a prototype of an advanced mechanical ventilation system with heat recovery integrated by heat pump. Energy Build. 2016, 133, 111–121. [Google Scholar] [CrossRef]
- Orme, M. Estimates of the energy impact of ventilation and associated financial expenditures. Energy Build. 2001, 33, 199–205. [Google Scholar] [CrossRef]
- Tronchin, L.; Fabbri, K. Energy performance building evaluation in Mediterranean countries: Comparison between software simulations and operating rating simulation. Energy Build. 2008, 40, 1176–1187. [Google Scholar] [CrossRef]
- World Health Organization. Household Fuel Combustion, Indoor Air Quality Guidelines; WHO: Geneva, Switzerland, 2014. [Google Scholar]
- Simonson, C. Energy consumption and ventilation performance of a naturally ventilated ecological house in a cold climate. Energy Build. 2005, 37, 23–35. [Google Scholar] [CrossRef]
- Gao, J.; Wargocki, P.; Wang, Y. Ventilation system type, classroom environmental quality and pupil’s perceptions and symptoms. Build. Environ. 2014, 75, 46–57. [Google Scholar] [CrossRef]
- Stabile, L.; Dell’Isola, M.; Frattolillo, A.; Massimo, A.; Russi, A. Effect of natural ventilation and manual airing on indoor air quality in naturally ventilated Italian classrooms. Build. Environ. 2016, 98, 180–189. [Google Scholar] [CrossRef]
- Fabbri, K. Thermal comfort evaluation in kindergarten: PMV and PPD measurement through datalogger and questionnaire. Build. Environ. 2013, 68, 202–214. [Google Scholar] [CrossRef]
- Fabbri, K.; Tronchin, L. Indoor Environmental Quality in Low Energy Buildings. Energy Procedia 2015, 78, 2778–2783. [Google Scholar] [CrossRef]
- Sekhar, S.C.; Goh, S.E. Thermal comfort and IAQ characteristics of naturally/mechanically ventilated and air-conditioned bedrooms in a hot and humid climate. Build. Environ. 2011, 46, 1905–1916. [Google Scholar] [CrossRef]
- Shan, X.; Zhou, J.; Chang, V.W.C.; Yang, E. Comparing mixing and displacement ventilation in tutorial rooms: Students’ thermal comfort, sick building syndromes, and short-term performance. Build. Environ. 2016, 102, 128–137. [Google Scholar] [CrossRef]
- Mahdavi, A.; Doppelbauer, E. A performance comparison of passive and low-energy buildings. Energy Build. 2010, 42, 1314–1319. [Google Scholar] [CrossRef]
- EN 12792. Ventilation for Buildings—Symbols, Terminology and Graphical Symbols; CEN-CENELEC: Brussels, Belgium, 2003. [Google Scholar]
- EN ISO 13790. Energy Performance of Buildings—Calculation of Energy Use for Space Heating and Cooling; CEN-CENELEC: Brussels, Belgium, 2008. [Google Scholar]
- Directive 2002/91/EC of the European Parliament and of the Council of 16 December 2002 on the Energy Performance of Buildings; EU commission: Brussels, Belgium, 2002.
- Directive 2010/31/UE of the European Parliament and of the Council of 19 May 2010 on the Energy Performance of Buildings (Recast); EU commission: Brussels, Belgium, 2010.
- UNI/TS 11300 Energy Performance of Buildings. Part 1: Evaluation of Energy Need for Space Heating and Cooling; UNI: Milan, Italy, 2014.
- UNI/TS 11300 Energy Performance of Buildings Part 2: Evaluation of Primary Energy Need and of System Efficiencies for Space Heating, Domestic Hot Water Production, Ventilation and Lighting for Non-Residential Buildings; UNI: Milan, Italy, 2014.
- Tronchin, L.; Fabbri, K. Analysis of buildings' energy consumption by means of exergy method. Int. J. Exergy 2008, 5, 605–625. [Google Scholar] [CrossRef]
- Pisello, A.L.; Castaldo, V.L.; Taylor, J.E.; Cotana, F. The impact of natural ventilation on building energy requirement atinter-building scale. Energy Build. 2016, 127, 870–883. [Google Scholar] [CrossRef]
- Lazzarin, R.M.; Gasparella, A. Technical and economical analysis of heat recovery in building ventilation systems. Appl. Therm. Eng. 1998, 18, 47–67. [Google Scholar] [CrossRef]
- Tronchin, L.; Tommasino, M.C.; Fabbri, K. On the cost-optimal levels of energy-performance requirements for buildings: A case study with economic evaluation in Italy. Int. J. Sustain. Energy Plan. Manag. 2014, 3, 49–62. [Google Scholar]
Figure 1.
The test room. NB: all the figures use dots and commas as per Italian standards.

Figure 2.
Relationship between qve,k,mn and minimum air flow of fan. NB: all the figures use dots and commas as per Italian standards.
Figure 2.
Relationship between qve,k,mn and minimum air flow of fan. NB: all the figures use dots and commas as per Italian standards.

Figure 3.
Relationship between qve,k,mn and QH,ve. NB: all the figures use dots and commas as per Italian standards.
Figure 3.
Relationship between qve,k,mn and QH,ve. NB: all the figures use dots and commas as per Italian standards.

Figure 4.
Relationship between QH,ve, EP,V e W. NB: all the figures use dots and commas as per Italian standards.
Figure 4.
Relationship between QH,ve, EP,V e W. NB: all the figures use dots and commas as per Italian standards.

Figure 5.
Relationship between QH,ve, EP,V and minimum air flow of fan. NB: all the figures use dots and commas as per Italian standards.
Figure 5.
Relationship between QH,ve, EP,V and minimum air flow of fan. NB: all the figures use dots and commas as per Italian standards.

Figure 6.
Relationship between QH,ve and management costs. NB: all the figures use dots and commas as per Italian standards.
Figure 6.
Relationship between QH,ve and management costs. NB: all the figures use dots and commas as per Italian standards.

Figure 7.
Relationship between EP,V and management costs. NB: all the figures use dots and commas as per Italian standards.
Figure 7.
Relationship between EP,V and management costs. NB: all the figures use dots and commas as per Italian standards.

Figure 8.
Values of QH,ve for the three systems of CMV. NB: all the figures use dots and commas as per Italian standards.
Figure 8.
Values of QH,ve for the three systems of CMV. NB: all the figures use dots and commas as per Italian standards.

Figure 9.
Values of EP,V for the three systems of CMV. NB: all the figures use dots and commas as per Italian standards.
Figure 9.
Values of EP,V for the three systems of CMV. NB: all the figures use dots and commas as per Italian standards.

Figure 10.
Relationship between management costs for the three systems of CMV. NB: all the figures use dots and commas as per Italian standards.
Figure 10.
Relationship between management costs for the three systems of CMV. NB: all the figures use dots and commas as per Italian standards.

Figure 11.
Relationship between QH,ve and EP,V for the three systems of CMV (a) extraction; (b) insertion; (c) insertion/extraction. NB: all the figures use dots and commas as per Italian standards.
Figure 11.
Relationship between QH,ve and EP,V for the three systems of CMV (a) extraction; (b) insertion; (c) insertion/extraction. NB: all the figures use dots and commas as per Italian standards.


Figure 12.
Relationship between QH,ve and EP,V. NB: all the figures use dots and commas as per Italian standards.
Figure 12.
Relationship between QH,ve and EP,V. NB: all the figures use dots and commas as per Italian standards.


Table 1.
Manufacturer’s data of selected devices.
| Company | Model | Series | Minimum Fan Capacity [m3/h] | Minimum Electrical Power Absorbed [W] | Nominal Diameter [m] |
|---|---|---|---|---|---|
| ALDES | ALDES MONO | MONO 100 | 15 | 4.3 | 0.100 |
| ALDES DECO | DECO 100 | 70 | 5.6 | 0.100 | |
| ALDES DECO | DECO 125 | 115 | 9.3 | 0.125 | |
| ALDES IN LINE | IN LINE 150 | 250 | 20.0 | 0.150 | |
| ALDES DESIGN | DESIGN 150 | 235 | 20.0 | 0.150 | |
| IRSAP | IR-ECOAIR | T-1 | 15 | 4.8 | 0.100 |
| IR-ECOAIR | T-2 | 22 | 5.0 | 0.100 | |
| IR-ECOAIR | T-3 | 30 | 5.5 | 0.100 | |
| IR-ECOAIR | T-4 | 35 | 5.8 | 0.100 | |
| IR-ECOAIR | T-5 | 45 | 6.1 | 0.100 | |
| FRANCE AIR | ICON | 15 | 75 | 14.5 | 0.100 |
| ICON | 30 | 118 | 30.0 | 0.100 | |
| ICON | 60 | 260 | 75.0 | 0.150 | |
| ELICENT | ELEGANCE | 100 | 90 | 14.0 | 0.100 |
| ELEGANCE | 120 | 165 | 15.0 | 0.120 | |
| ELEGANCE | 150 | 315 | 25.0 | 0.150 | |
| VORTICE | MFO | 90 | 65 | 14.0 | 0.090 |
| MFO | 100 | 85 | 15.0 | 0.100 | |
| ME LL | 95 | 95 | 9.0 | 0.100 | |
| ME LL | 175 | 175 | 13.0 | 0.100 |
© 2018 by the authors. Licensee MDPI, Basel, Switzerland. This article is an open access article distributed under the terms and conditions of the Creative Commons Attribution (CC BY) license (http://creativecommons.org/licenses/by/4.0/).
Share and Cite
MDPI and ACS Style
Tronchin, L.; Fabbri, K.; Bertolli, C. Controlled Mechanical Ventilation in Buildings: A Comparison between Energy Use and Primary Energy among Twenty Different Devices. Energies 2018, 11, 2123. https://doi.org/10.3390/en11082123
AMA Style
Tronchin L, Fabbri K, Bertolli C. Controlled Mechanical Ventilation in Buildings: A Comparison between Energy Use and Primary Energy among Twenty Different Devices. Energies. 2018; 11(8):2123. https://doi.org/10.3390/en11082123
Chicago/Turabian StyleTronchin, Lamberto, Kristian Fabbri, and Chiara Bertolli. 2018. "Controlled Mechanical Ventilation in Buildings: A Comparison between Energy Use and Primary Energy among Twenty Different Devices" Energies 11, no. 8: 2123. https://doi.org/10.3390/en11082123
Note that from the first issue of 2016, this journal uses article numbers instead of page numbers. See further details here.