Customer Segmentation Based on the Electricity Demand Signature: The Andalusian Case


1
Departamento de Lenguajes y Ciencias de la Computación, Universidad de Málaga, 29071 Málaga, Spain
2
Bettergy, Parque Tecnológico de Andalucía, 29590 Málaga, Spain
*
Author to whom correspondence should be addressed.
Energies 2018, 11(7), 1788; https://doi.org/10.3390/en11071788
Submission received: 12 June 2018
/
Revised: 28 June 2018
/
Accepted: 3 July 2018
/
Published: 7 July 2018
Abstract
:A smart meter enables electric utilities to get detailed insights into their customer needs, allowing them to offer tailored products and services, and to succeed in an increasingly competitive market. While in an ideal world companies would treat every customer as an individual, in practice this is rather difficult. For this reason, companies usually have to target smaller groups of customers that are similar. There are several ways of tackling this matter and finding the right approach is a key to success. Therefore, in this study we introduce the electricity demand signature, a novel approach to characterize and cluster electricity customers based on their demand habits. We test our proposal using the electricity demand of 64 buildings in Andalusia, Spain, and compare our results to the state-of-the-art. The results show that our proposal is useful for clustering customers in a meaningful way, and that it is an easy and friendly representation of the behavior of a customer that can be used for further analysis.
1. Introduction
The massive roll out of smart meters to electricity customers in many countries around the World, especially in Europe and North America, has led to big opportunities for utilities to improve their on-line services and sales. A smart meter provides a detailed breakdown of the electric energy consumption over time, usually referred to as the load curve or load profile. By analyzing these load curves, electric utilities gain insights into their customers needs, which are then used to offer tailored products and services (marketing), as well as to improve their own operation (e.g., minimize energy loss [1,2], react to failures [1,3], program maintenances [2], among others).
To maximize the benefits of these (marketing) initiatives, utilities usually have to target smaller groups of customers who have similar needs [4], i.e., customer segmentation. The days of “in any color as long as it is black” are over, however it might be inviable to treat every customer solely in this context. Therefore, the key to success is finding an appropriate and meaningful customer segmentation (clustering problem).
Due to the importance of this process, there have been several alternatives proposed for clustering electricity customers [5,6,7], however, most of the studies and proposals focus on a specific customer type, e.g., residential customers, industrial/commercial customers, or small customers. Indeed, electric utilities usually deal with multiple types of customers. Furthermore, the large amount and the high dimensionality of the data produced by every customer imposes a challenge to most clustering techniques, because they are not well suited off-the-shelf for this kind of real-world big data [7,8].
Therefore, the aim of this study is to present an alternative for clustering multiple types of electricity customers. Particularly, the main contributions of this work are:
- [C1]
- Electricity demand signature: In this study we introduce a new approach to characterize the behavior of an electricity customer based on the relative importance of the measurements of the daily load curve, which is able to manage multiple types of customers.
- [C2]
- Evolutionary computation of the signature: We present a method grounded on an evolutionary algorithm (EA) to compute the electricity demand signature and show that our proposal outperforms the state-of-the-art.
- [C3]
- Customer segmentation analysis: Using the electricity demand of 64 buildings located in Andalusia, Spain, we perform a comparison of the customer segmentation results based on the electricity demand signature against the segmentation based on the characteristic typical load curve [9]. This shows the suitability of our proposal to manage multiple types of customers and its capability of dealing with real, large and high dimensional data.
The rest of this work is structured as follows: Section 2 provides an overview of the state-of-the-art, Section 3 presents the electricity demand signature (contributions C1 and C2), Section 4 describes the data used to test our proposal, Section 5 and Section 6 present the results obtained (contributions C2 and C3), and Section 7 outlines the conclusions of this study and proposes the future work.
2. Related Work
Cluster analysis in general is a rather well defined problem that consists in classifying a group of objects into subsets that are meaningful in the context of some problem [10].
In the context of energy customers clustering, the methods may be grouped by the data source used to characterize (and later to group) the customers into three main categories: load-based (i.e., methods that rely solely on the electricity demand), non-load-based (i.e., methods that do not use the demand data, but try to infer demand behavior from other sources, such as socio-demographics or building properties), and multimodal (i.e., use all available data). At first sight, the latter category would seem to be the most suitable, however, several studies show that intra-day behavior cannot be described by non-load data [5,11] and that there are weak correlations between electricity demand and typical demographic data [12]. Therefore, in this study we will focus on load-based approaches.
There are several load-based proposals for clustering electricity customers, ranging from data mining-related techniques [9,13] to artificial neural network-related approaches [6,14,15]. In spite of the technique used to classify a customer, we might group these approaches into two main categories: proposals that use all the data (full time series) and the ones that use a specific set of features (attributes) or calculated metrics. Due to the characteristics of our problem, including the fact that we might deal with extremely volatile, noisy, high dimensional and big data [5,9,16], it might be preferable to use as few attributes as possible [17,18]. Thereby, we reduce the computational power needed and minimize the sensitivity of the classification process to missing data.
Many approaches that rely on a specific subset of features or calculated metrics have also been proposed, including proposals that are based on principal component analysis [19], self-organizing map (where the map is used to represent a customer) [6], harmonic analysis [20], and in load pattern analysis (in general) [9,14]. The results presented in the state-of-the-art are encouraging, however most studies focus on a specific type (or combination) of electricity customers [7]. By contrast, electricity companies usually have a mixture of customer types, so being capable of managing all types of customers might be useful (in some cases). Figure 1 presents a taxonomy of energy customers clustering approaches.
Besides the great results in terms of the clustering ability, some of these proposals are capable of providing human meaningful insights, i.e., the process outputs information that can be interpreted and used by an expert. For example, Tsekouras et al. [9] presented a methodology for classifying customers based on the characteristic typical load curve, a load curve obtained by clustering the (daily) load curves and selecting the load curve that represents the most populated cluster. This curve synthesizes the load of an arbitrary long period into a unique daily load curve that might be useful to aid the work of an expert (Section 6 presents an example). However, due to its definition, the characteristic typical load curve discards all the information contained in the secondary clusters, therefore the expert only receives a part of the information of the customer.
Considering the advances made to date, the drawbacks detected and the usefulness of having an expert understandable representation of a customer, we propose to define a new representation of an electricity customer that is useful for both clustering and aiding an expert in his work.
3. Electricity Demand Signature
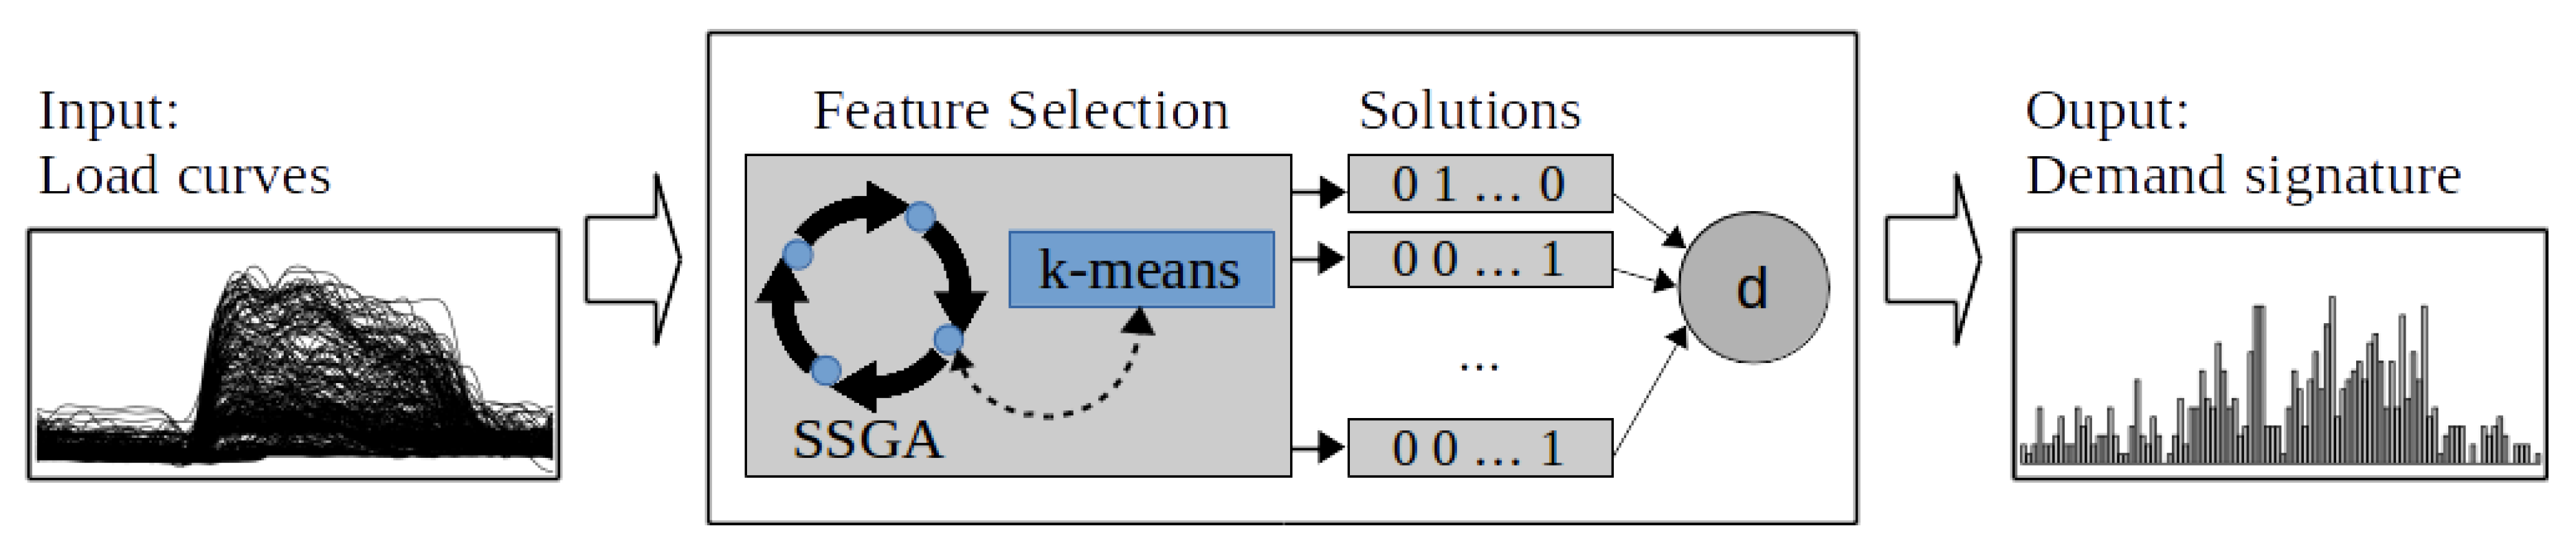
In this section we introduce our main contribution (C1): the electricity demand signature, a representation that synthesizes the demand of a customer by extracting the most relevant information of the daily load curves. First, (i) we define a measurement for selecting the most relevant information (the fitness), then (ii) we present an EA to select the most relevant information (contribution C2), and finally, (iii) we define how this information is synthesized into the electricity demand signature. Figure 2 shows a high-level view of our proposal. The load curves are transformed into the electricity demand signature using an EA.
3.1. Feature Selection
An intuitive approach to select the most relevant information of a dataset is to select a subset of the data that allows us to characterize the original dataset without losing information (usually referred to as the feature selection problem). Formally (in our context), given a daily load curve L, sampled at an arbitrary daily rate R (number of samples per day), we define Y to be the original set of samples or features of L (thus ), and to be a subset of the original set of features.
Given a set of daily load curves of an electricity customer , we define the function to be the function that partitions the set B into G groups using the features selected by S.
Let us define as the function that computes the Rand index [21] (a measurement of partitions similarity). The Rand index returns a value in the range between 0 and 1 (both values included), where the maximum value (1) implies that and represent the same partition.
Then, in order to find a balance between the quality of the clustering obtained using a set of features S and the number of features selected by the given subset (), we define the function as (Equation (1)):
Each term is weighted with a value indicating its contribution to the final fitness value. As the main objective is to obtain high quality clustering, we decided to give a larger value to the weight related to the similarity of the partitions, therefore we set = 0.8. In addition, note that the referred term is squared in order to induce higher differences between good solutions (i.e., closer to 1).
Finally, we state the problem of selecting the most relevant information of a dataset as maximizing the fitness (Equation (2)).
3.2. Evolutionary Approach
As our second contribution (C2), we designed an EA based on a steady state genetic algorithm (SSGA) [22] to solve the problem of selecting the most relevant information of a dataset (Equation (2)). At a glance, the idea is to encode a subset of features as a binary array (individual) and then, use selection, crossover, and mutation, to evolve (in terms of fitness) a set of individuals or population. The evolutionary process is executed a predefined number of times and the results are accumulated. Algorithm 1 shows the proposed process at a high level.
| Algorithm 1 Pseudo-code of the proposed algorithm for computing the electricity demand signature. |
|
We define an individual as a binary vector, where R is the number of features of the original set and (the j-th gene) represents the selection of the j-th feature. Then, we define the population as the set of individuals in time , where is the population size. Note that the initial population is generated by a random uniform distribution of values, function , and then each individual is evaluated using the fitness function defined in Equation (1) (line 5 in the Algorithm 1).
Once the initial population is evaluated, an evolutionary process takes place, evolving the population until the number of evaluations is greater than MaxEvaluations. A new offspring is created by a three step process. First, in [Selection (Pop(t))], two parents are selected using a binary tournament selection. Second, in [Crossover()], an offspring is created using a single-point crossover function with a probability , i.e., selecting r genes from and genes from (the parents), where is uniformly drawn. Note that with probability one of the parent is returned unmodified with equal probability. Thirdly, in [Mutation()], the offspring is mutated by a bit-flip of the j-th gene with probability of mutating each bit. Once the offspring is evaluated, the function substitutes the worst individual in terms of fitness from with , generating a new population .
Finally, every time an evolutionary sub process is finished (while loop), the best individual (in terms of fitness) is selected by the function and it is passed to the function.
3.3. Demand Signature Representation
The set of features that maximizes the fitness (Equation (2)) is not guaranteed to be unique, i.e., there might be , , and . Thus, if we want to select a subset of features that is statistically sound, we need to find several solutions (normally a number equal to or greater than 30 [23]). Let us define , the set of sets of solutions to Equation (2).
Then, we define the electricity demand signature of a customer as the vector () that accumulates (i.e., sum up) the number of times a feature is selected by each of the sets of . In other words, the vector represents the frequency or density distribution of the features selected in . To ease the interpretation of the results, we decided to represent as a histogram.
To compute the electricity demand signature we defined the function (Algorithm 1) as the function that accumulates the features selected by an individual (in this case, the best one of the last generation).
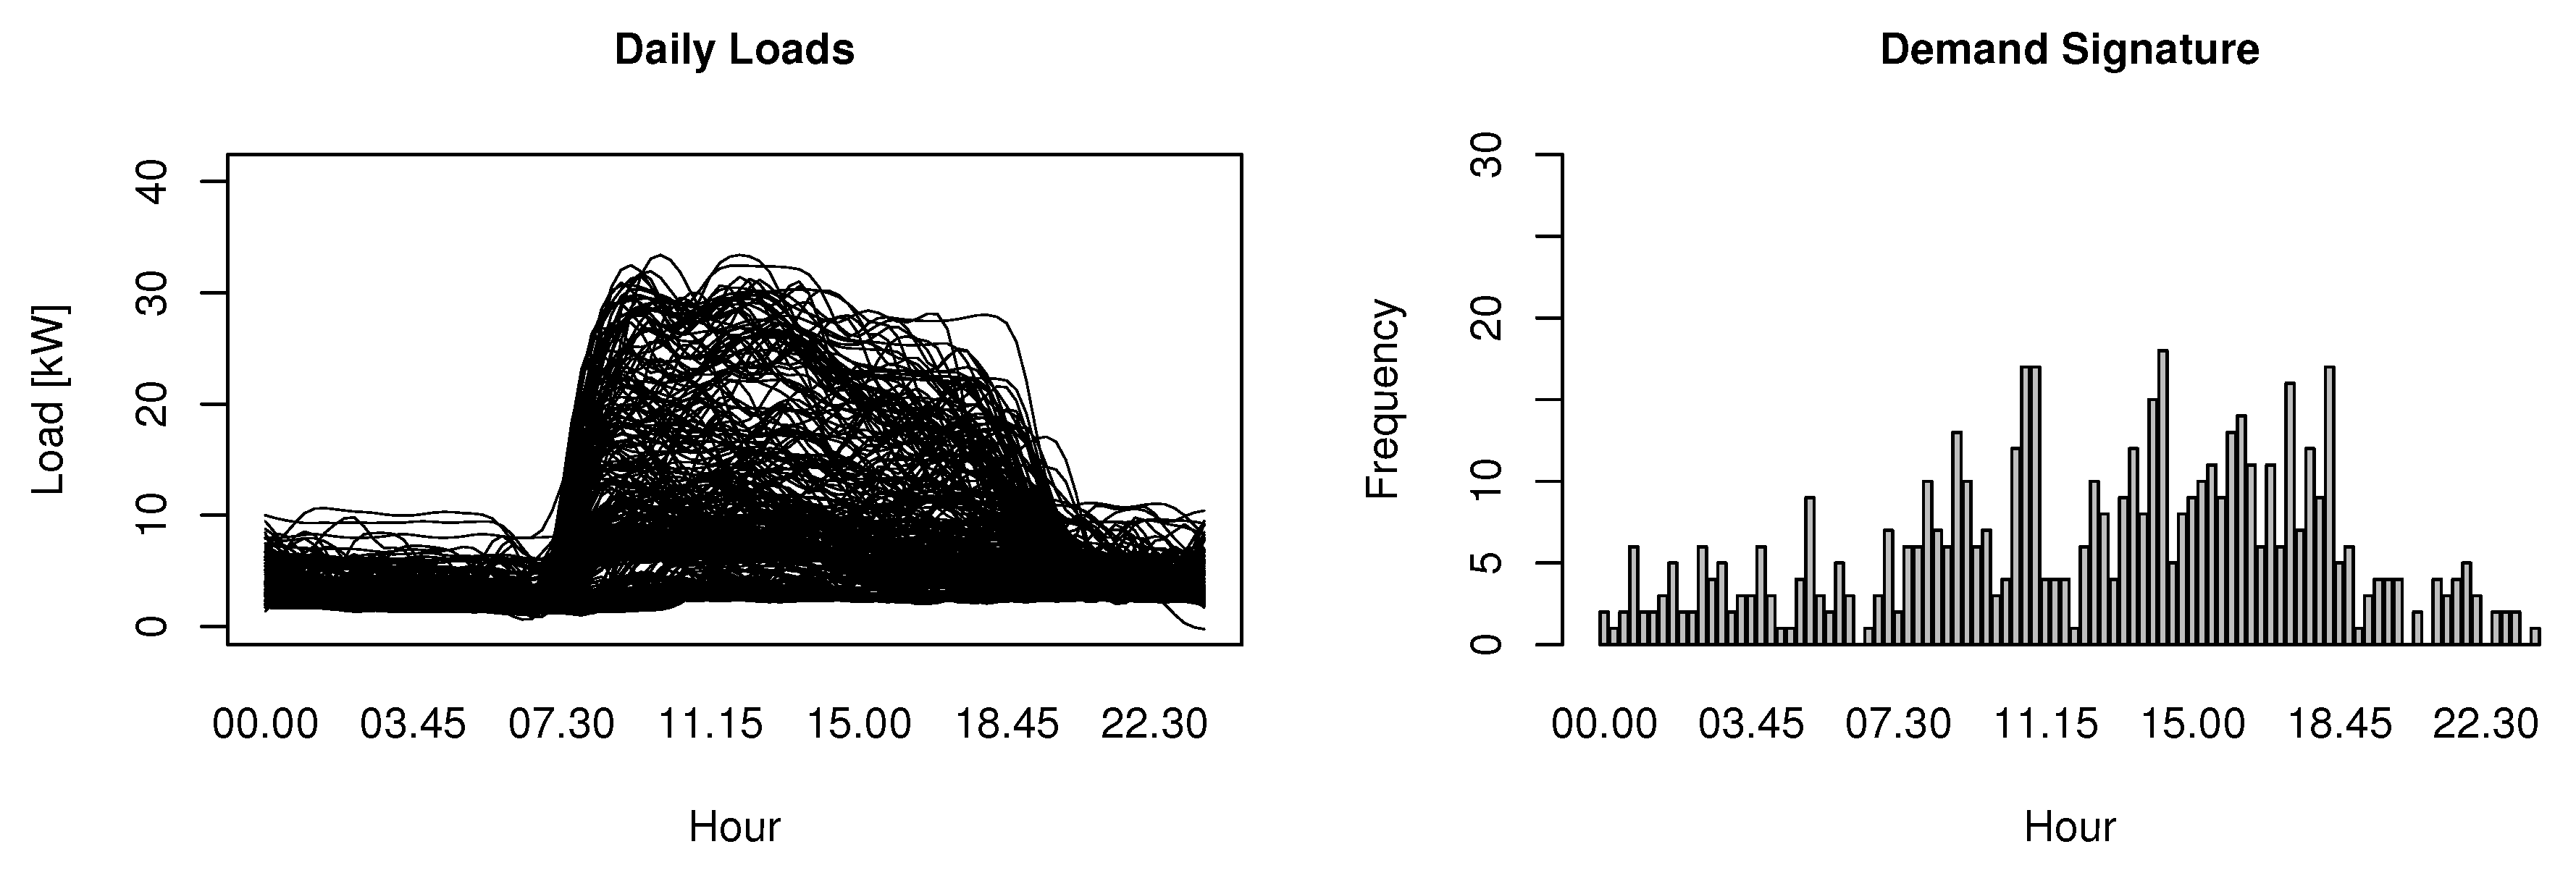
Figure 3 shows on the left side the daily load curves of a building for a whole year superposed (i.e., each line represents a daily load curve) and on the right side the electricity demand signature computed over the same period (for the same building). A higher bar (in the histogram) implies that a feature is more relevant in regard to Equation (1).
The demand signature summarizes and synthesizes the demand behavior in an easy to read format. At first sight it is clear that both representations are complementary. While the daily load curve gives detailed information (in some cases it may be over detailed), the demand signature presents a simpler representation of the demand. Having a deeper look into the example, we might find out that the demand signature highlights the differences found in the superposed daily load curves (it is possible to notice two main groups of daily load curves, represented by the darker zones in the plot). Moreover, the higher frequencies (bars) in the histogram are related to the hours of the daily loads where the two darker zones split-up. On the other hand, lower frequencies relate to time periods where there is a clear tendency (i.e., all daily load curves on that period have a similar value).
4. Case Study: Andalusia, Spain
To evaluate our proposal we used the load data of 64 buildings located in Andalusia, Spain. The set includes several types of buildings, not only in terms of their consumption, but also in terms of their use. For each building the energy consumption was recorded every 15 min for a year.
Table 1 presents a summary of the customers grouped by their industrial division classification, according to the Standard Industrial Classification (SIC) [24], where N is the number of customers, MC is the mean power consumption record (15 min), PC is the mean of the daily power consumption, and both columns preceded by Sd correspond to the standard deviation of the referred value. Note that the power consumption is measured in [kWh]. More details can be found in the Appendix A Table A1 and the whole data set is available upon request.
Due to the great extent and the wide variety of the data set, note that it encompasses most industrial divisions and several building sizes (from low to high energy consumption), we expect that the results of this study are sufficiently general so they can be reused and extended to other buildings.
5. Feature Selection Results
The electricity demand signature relies on the selection of the most relevant information from the load curve, thus in this section we compare our proposed feature selection method (defined in Equation (2)) against the state-of-the-art of feature selection techniques.
On the one hand, we implemented our proposal (Algorithm 1) in the computational language R (version 3.2.3). Without loss of generality, we used the k-means clustering technique to partition a set of daily load curves ( function) and we set the number of groups to G = 2, aiming to separate the daily load curves into working and non-working days. Then, for each building we executed the algorithm using the parameters defined in Table 2, i.e., 1920 runs of the features selection process encapsulated in the algorithm, and we collected all features selected sets (results of the evolutionary part of the algorithm). It is important to notice that the consumption is recorded every 15 min, thus a day contains R = 96 measurements. The rest of the parameters are taken from the related literature.
On the other hand, we implemented (in R) three different methods to select the most relevant subset of features (for each building). Particularly, we used two well know state-of-the-art techniques: Information Gain (IG) [25] and Correlation-based Feature Selection (CFS) [26], and a sanity check: Random Search (RS, i.e., select a random subset of attributes), because it is expected that our proposal improves the simplest search method. In all cases, the suitability of the subset was measured using the fitness defined in Equation (1).
Table 3 summarizes the results obtained in terms of fitness for all buildings. Notice that values closer to 1 are desirable, except for the standard deviation (Sd). Our proposal (SSGA) exceeds all its competitors in terms of the fitness value.
Table 4 presents a summary of the results obtained in terms of the number of features selected.
The best results in terms of the number of features selected (less is more) were obtained by CFS, however the best results in terms of fitness were obtained by the SSGA. Moreover, the CFS obtained the worst results in terms of the (mean) fitness. This phenomena may be explained by the fact that CFS and IG methods are both completely independent of the fitness function. On the other hand, the SSGA method looks for solutions that are fitted to the objective (the fitness function).
In order to assure that the performance of our proposed method (in terms of the fitness) is significantly better we executed the Friedman Align Rank test. The p-value of the test is equal to 1.44 ×, thus we can safely reject the null hypothesis (that all algorithms perform the same). Then, we performed a Friedman Aligned test for post hoc comparison and the Holland procedure to correct the p-values, obtaining the results shown in Table 5. These results statistically confirm that our proposed method has a better performance in terms of the defined fitness, thus our contribution C2 is supported by the numerical results.
6. Segmentation Results
The aim of this study is to provide an alternative for customer segmentation that is able to manage multiple types of customers. In the previous section we showed that the proposed method for selecting the most relevant features is suitable, i.e., outperforms the state-of-the-art techniques in the context of the problem being solved. Now, in this section we study the use of the electricity demand signature to perform a customer segmentation (our third contribution). First, we present the results of a classification based on the electricity demand signature. Then, we introduce the results of a segmentation based on the characteristic typical load curve [9], and finally, we compare both alternatives and discuss the usefulness of the proposed segmentation.
6.1. Demand Signature Segmentation
First, we compute the demand signature for each customer using our proposal (Algorithm 1) and the parameters defined in Table 2. Note that the results presented in Section 5 constitute the inner part of the these results, i.e., the partial results that are accumulated into the demand signature.
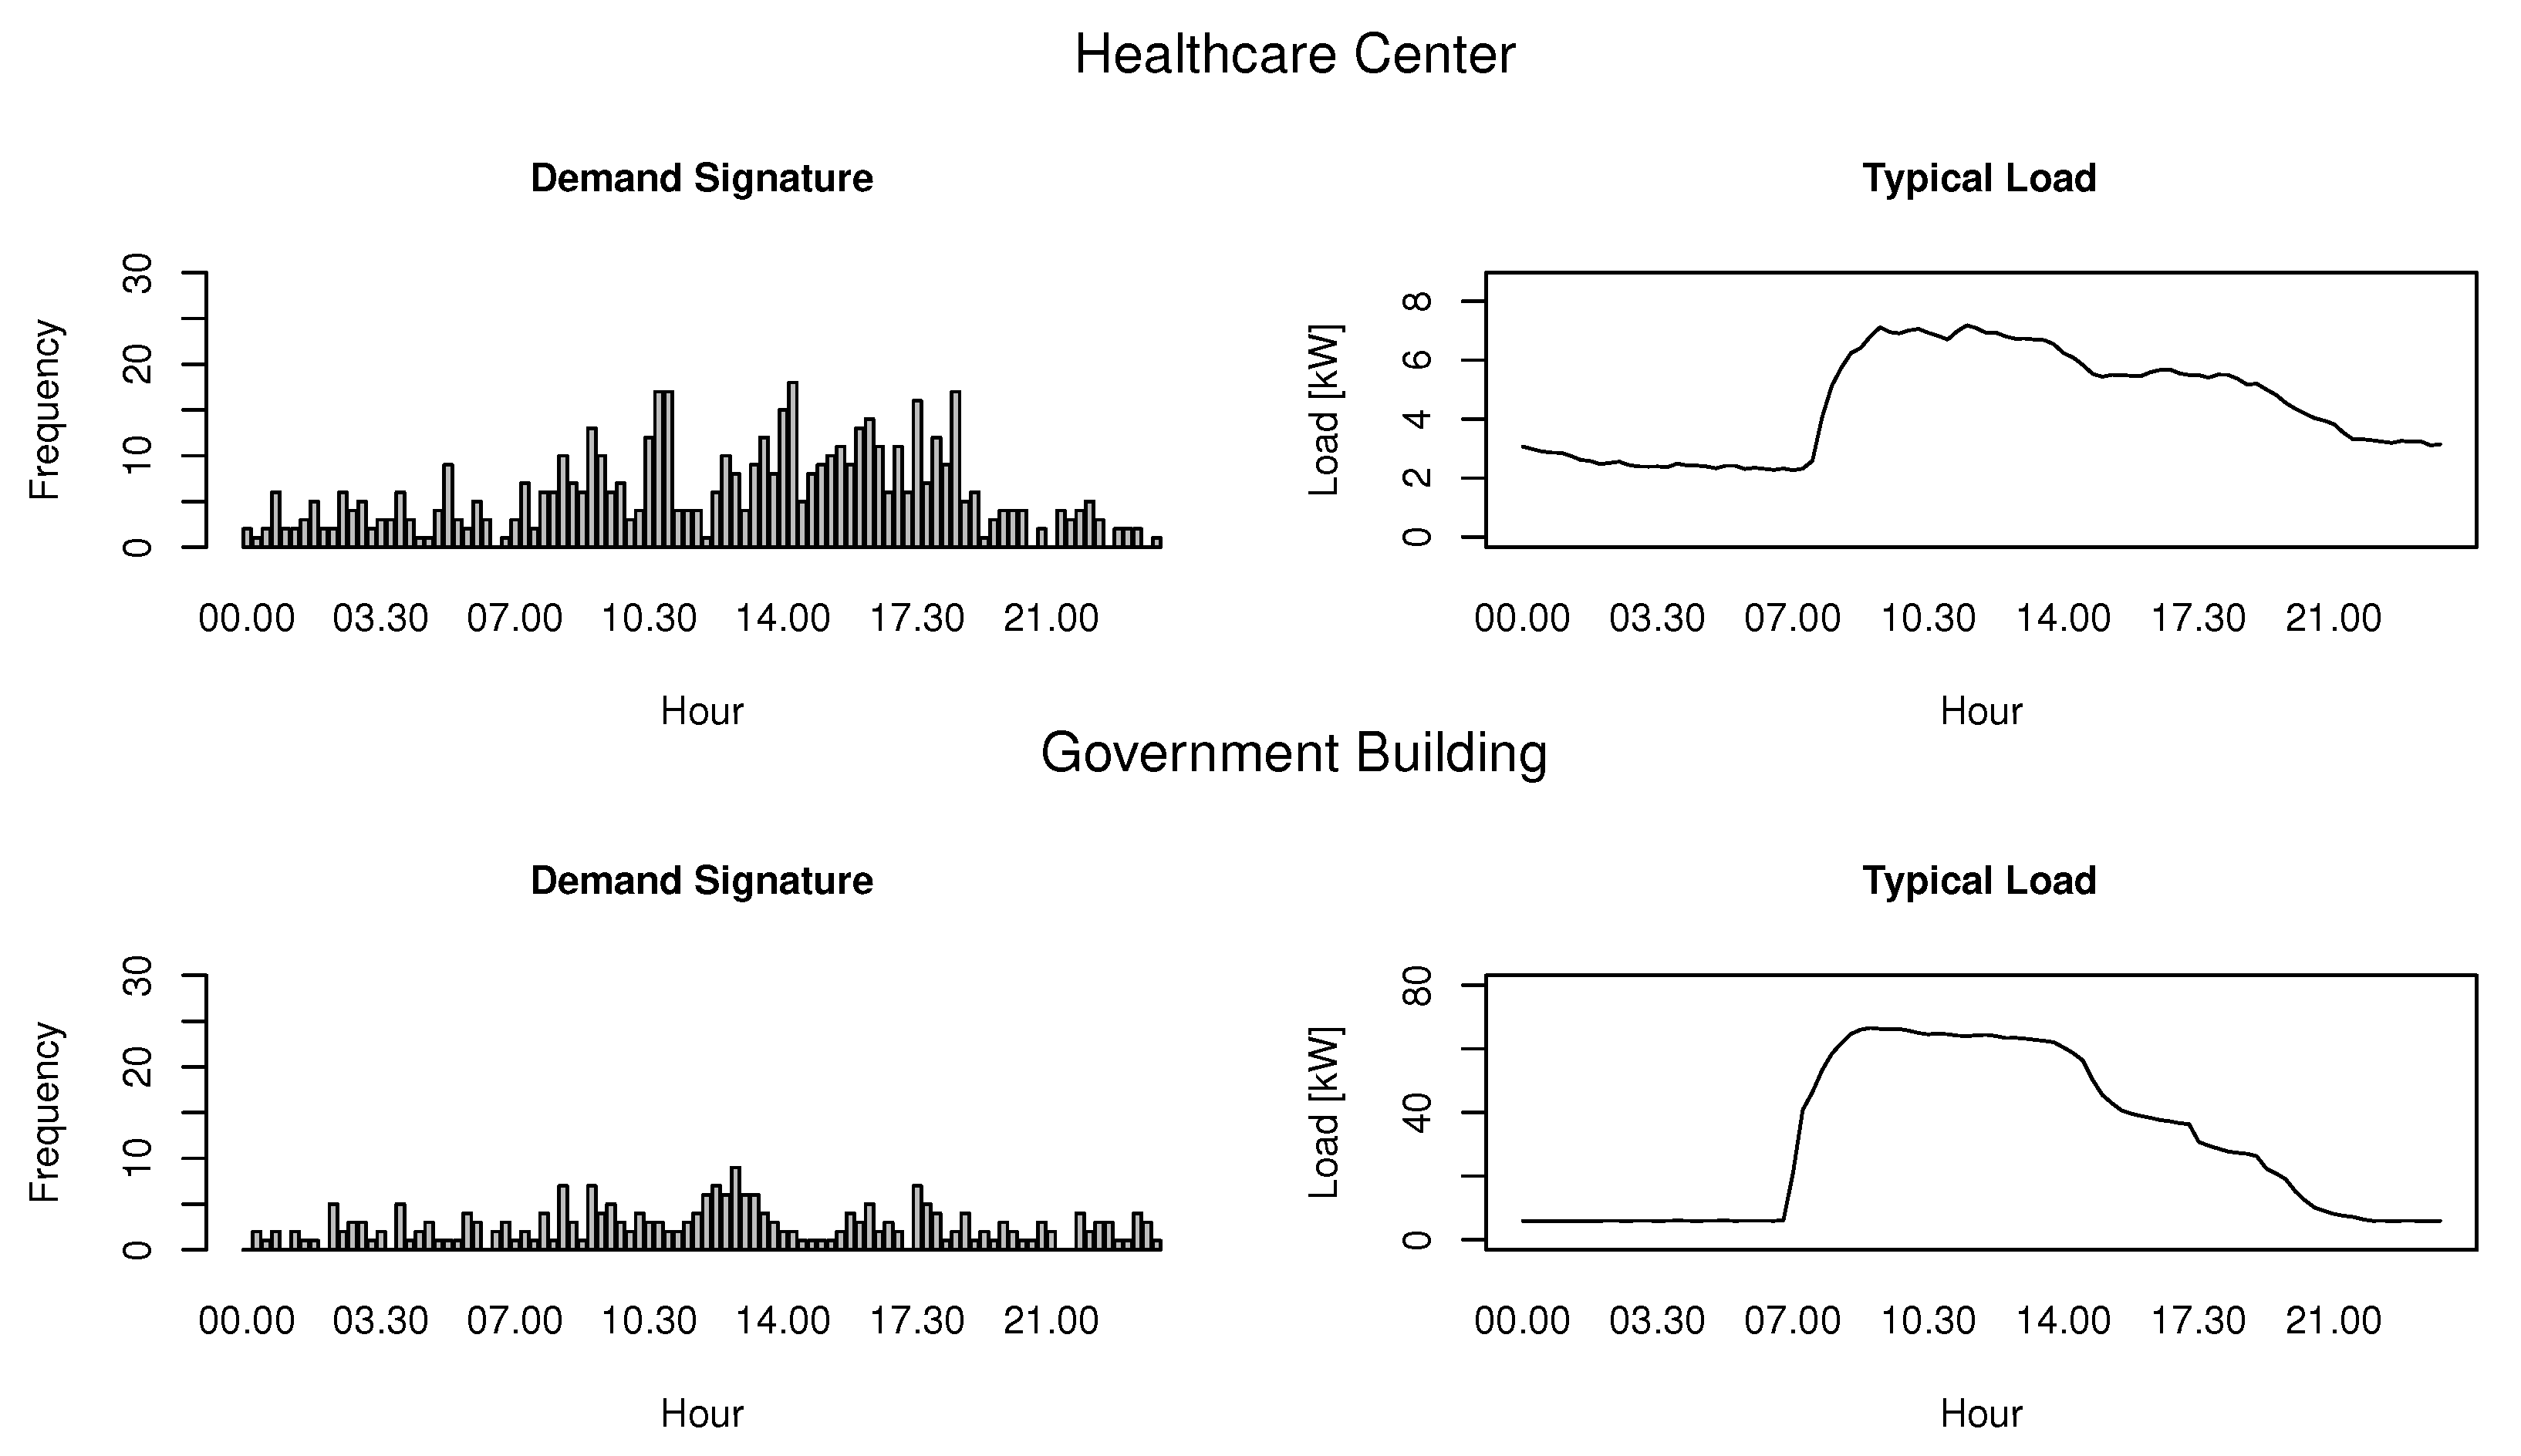
Figure 4 presents the demand signature (on the left side) of two different customers. The bottom axis shows the features (time of the day), while the left axis shows how many times a feature is selected by our algorithm. A useful characteristic of our proposed signature is its independence in regards to the order of magnitude of the power demanded. The representations are complementaries, while the characteristic typical load curve highlights the gross behavior of the customer (the typical day), the demand signature encapsulates the behavior of all days.
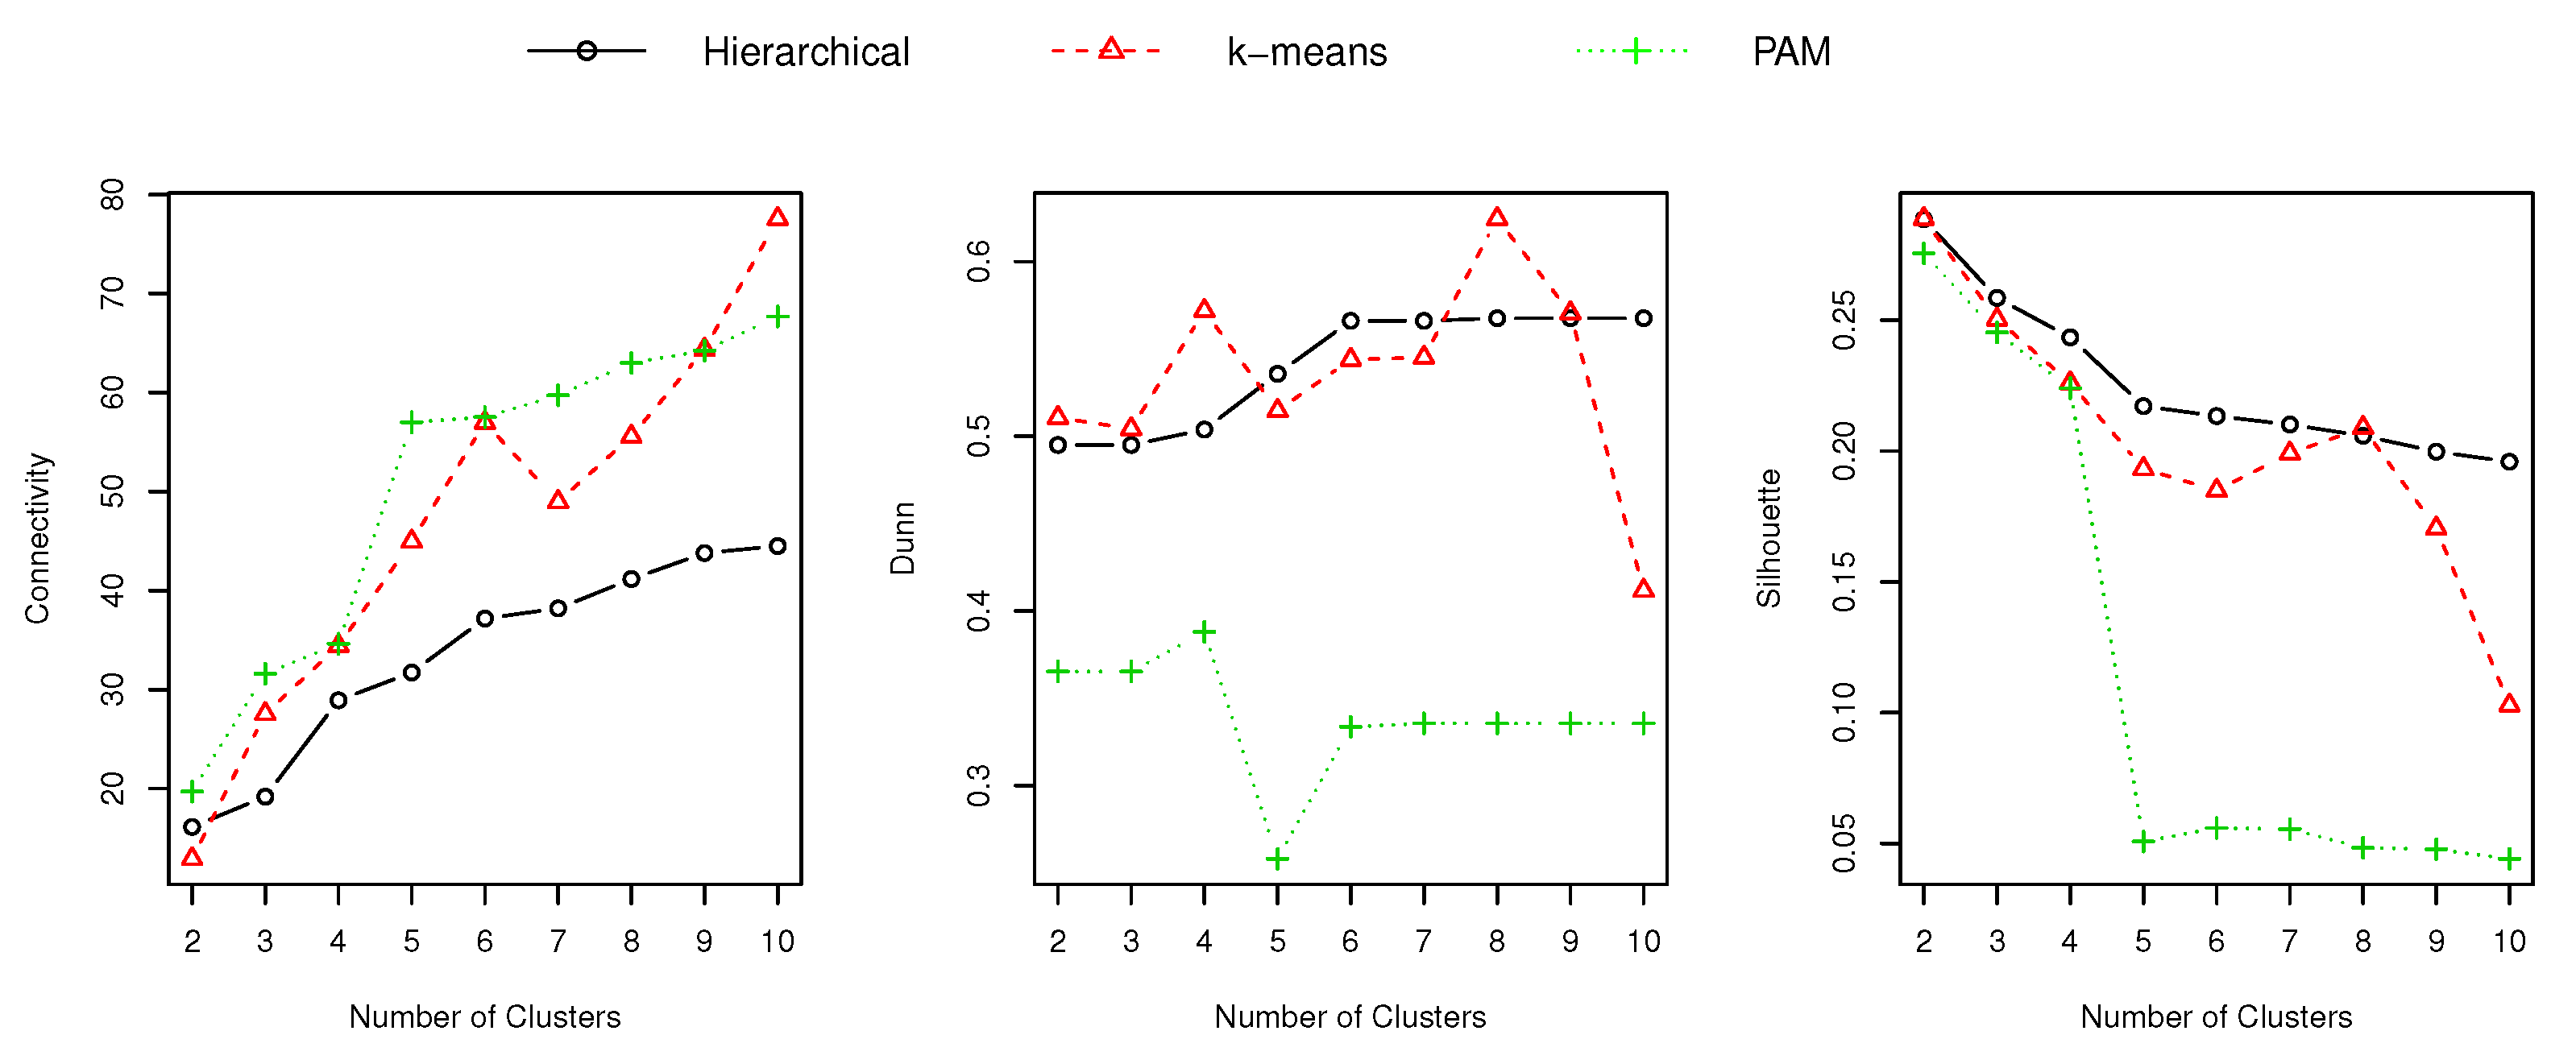
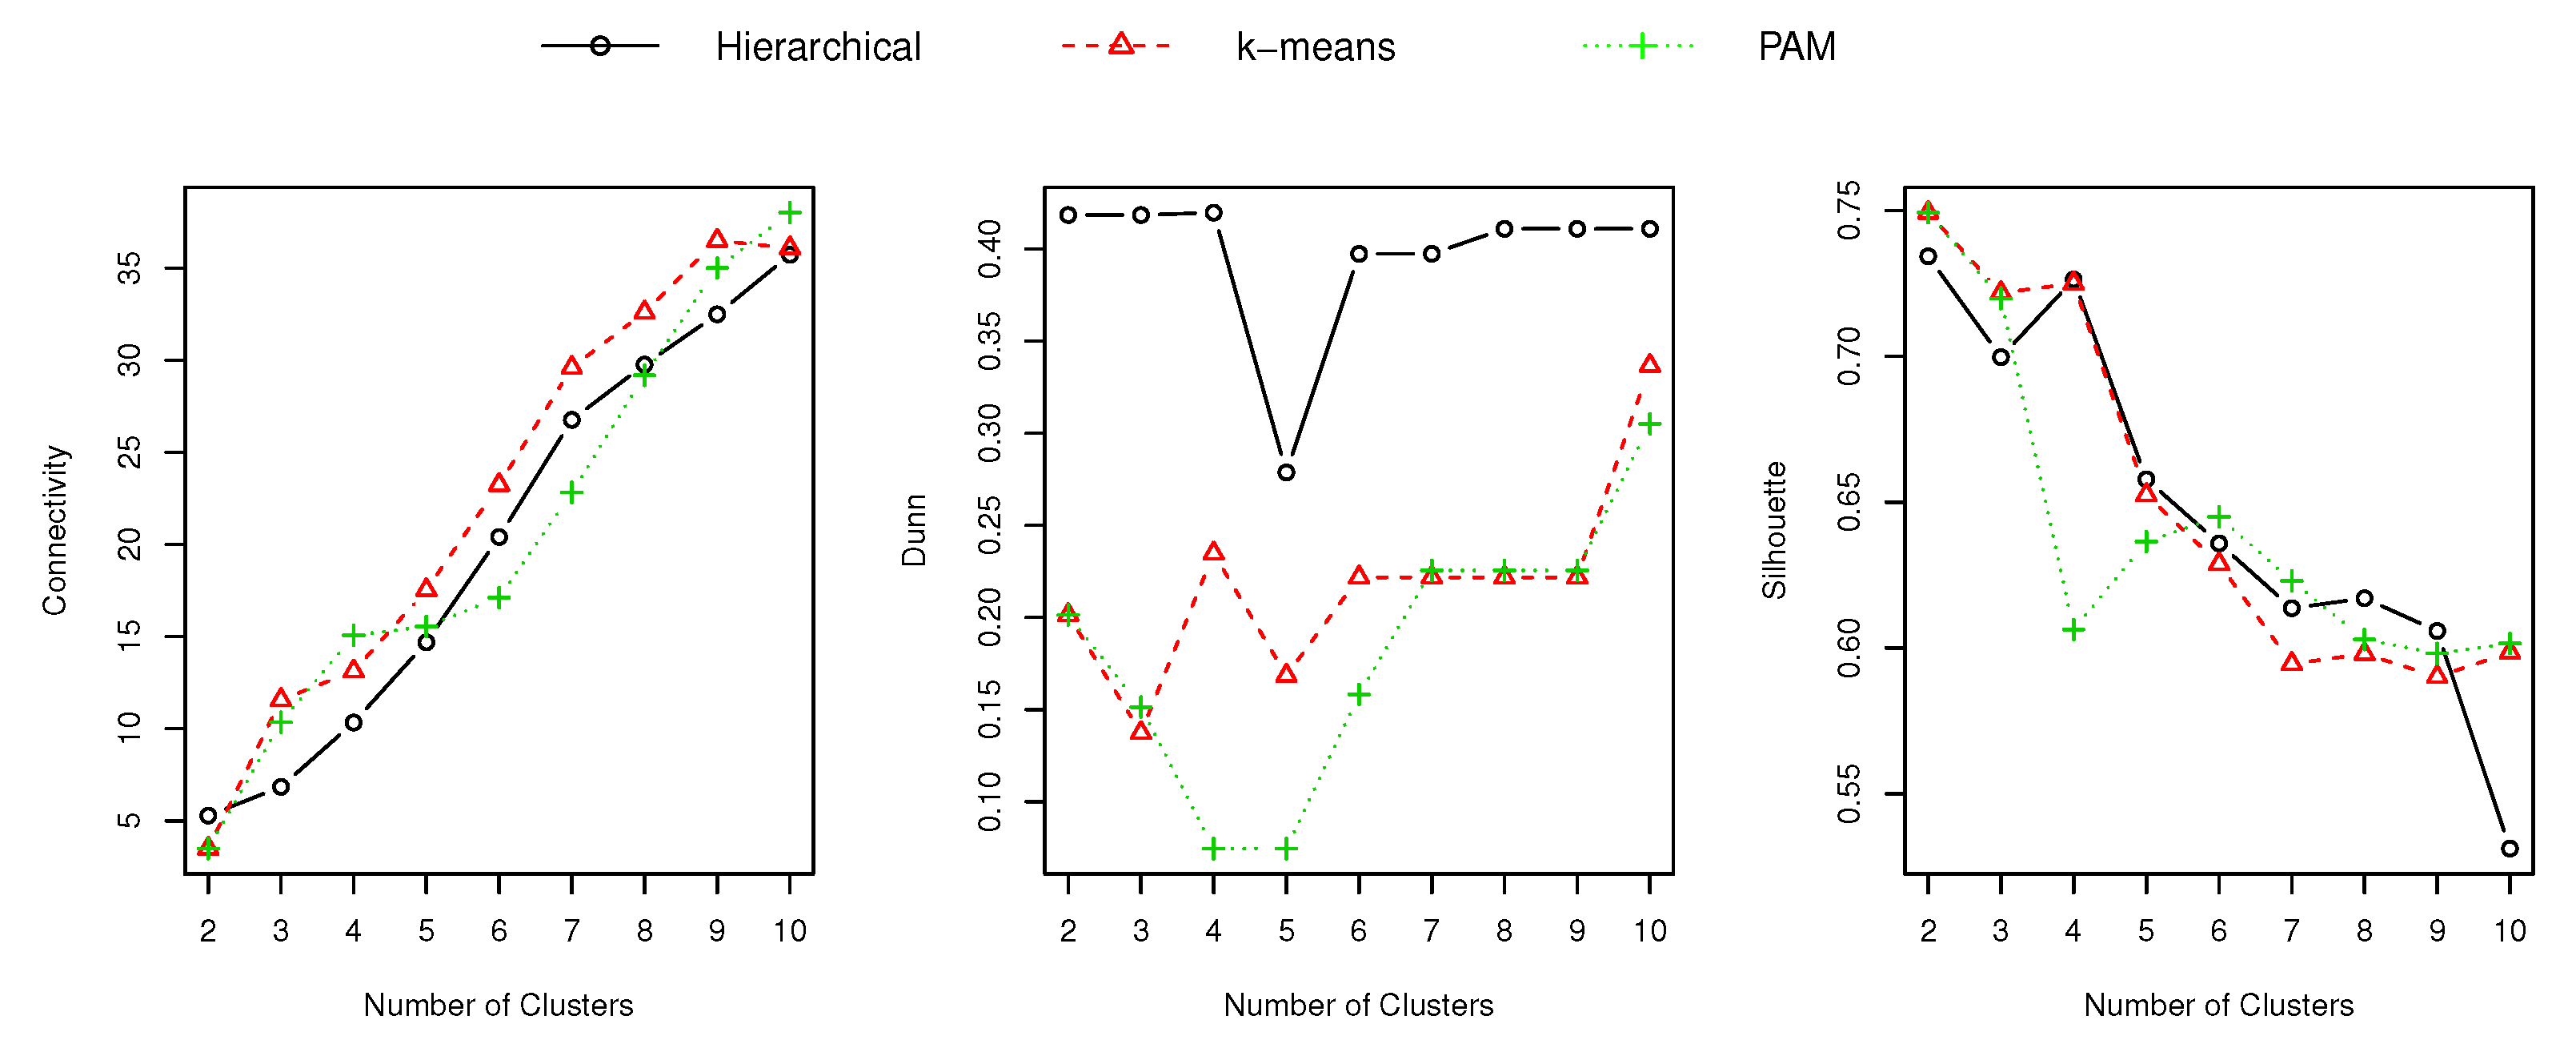
Then, we performed an internal cluster validation study [27] to determine the suitability of the demand signature for grouping customers. Particularly, we computed the Connectivity, Dunn and Silhouette indexes for the clusters obtained using k-means, PAM and Hierarchical techniques [27,28], for sizes ranging from 2 to 10. Figure 5 presents the results obtained for the referred indexes, and Section 6.3 presents the insights of these results, as well as a comparison against the results presented in Figure 5. At a glance, the Connectivity index refers to the number of elements that are placed in the same cluster as their nearest neighbors (in the data space), its value ranges from 0 to infinity and it has to be minimized. The Dunn index seeks for dense and well-separated clusters, thus a higher value is desirable. The Silhouette coefficient contrasts the average distance between the elements of one cluster to the average distance to the elements of another one, thus a higher value is preferred.
6.2. Characteristic Typical Load Curve Segmentation
Secondly, we computed the characteristic typical load curve for each customer [9], then the centroid of the biggest cluster (in terms of the number of observations) was regarded as the characteristic typical load curve.
Then, we repeated the internal cluster validation study (described in the previous subsection) using the characteristic typical load curve to group the set of customers. Figure 6 shows the results of the study. Section 6.3 presents the insights of these results, as well as a comparison against the results presented in Figure 5.
6.3. Customer Segmentation: Demand Signature vs. Characteristic Typical Load Curve
To asses the suitability of the electricity demand signature to characterize a customer, i.e., how good it is to segment a set of customers, we compared the internal cluster validation metrics calculated for the demand signature versus the ones calculated for the characteristic typical load curve (refer to Figure 5 and Figure 6). Table 6 presents the number of clusters determined from the results presented above (Figure 5 and Figure 6).
According to the Dunn index, the best results were obtained by the demand signature approach, with a cluster size equal to 8. According to Connectivity and Silhouette indexes, the characteristic typical load curve is regarded as the best technique for classifying electricity customers. It is important to notice that according to Connectivity and Silhouette results, the customers should be clustered into two groups, which means that (from a marketing point of view) there are two types of customers. Saying that, grouping the customers into eight clusters (i.e., using the demand signature) might be more adequate, allowing to target smaller and more specific groups of customers. Therefore, from the perspective of having a useful and manageable segmentation tool (for marketing purposes), the demand signature is a good alternative.
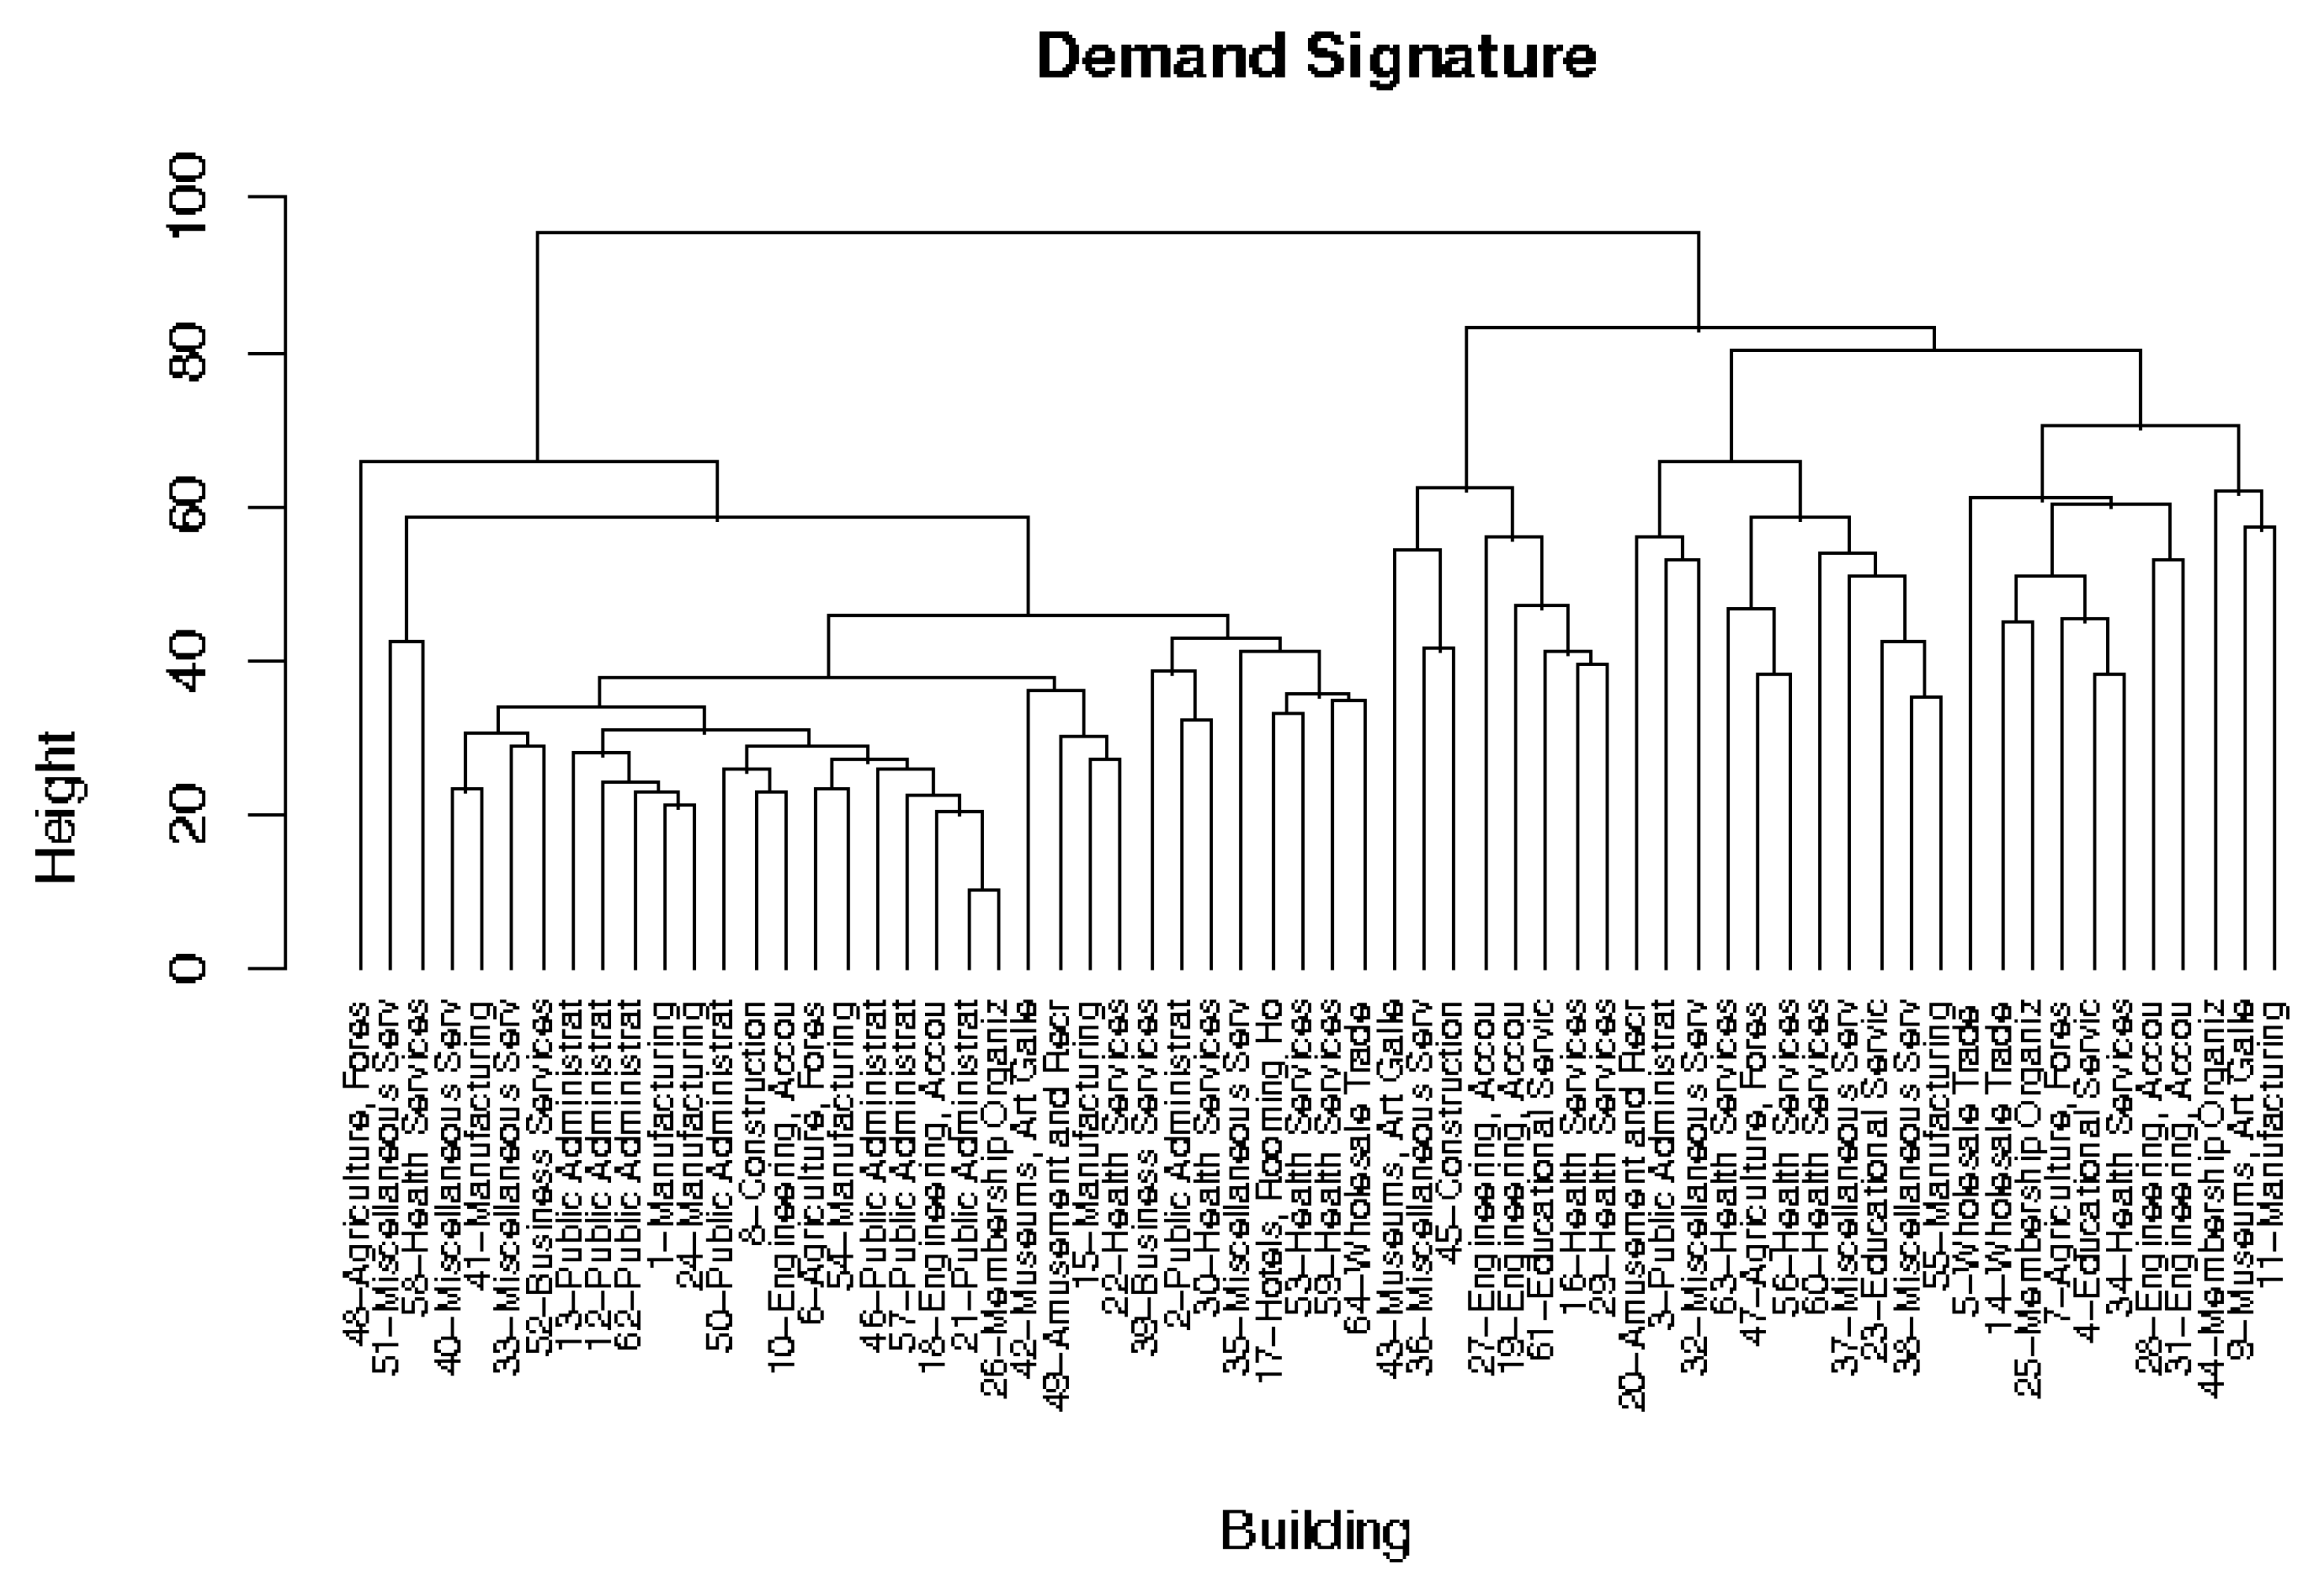
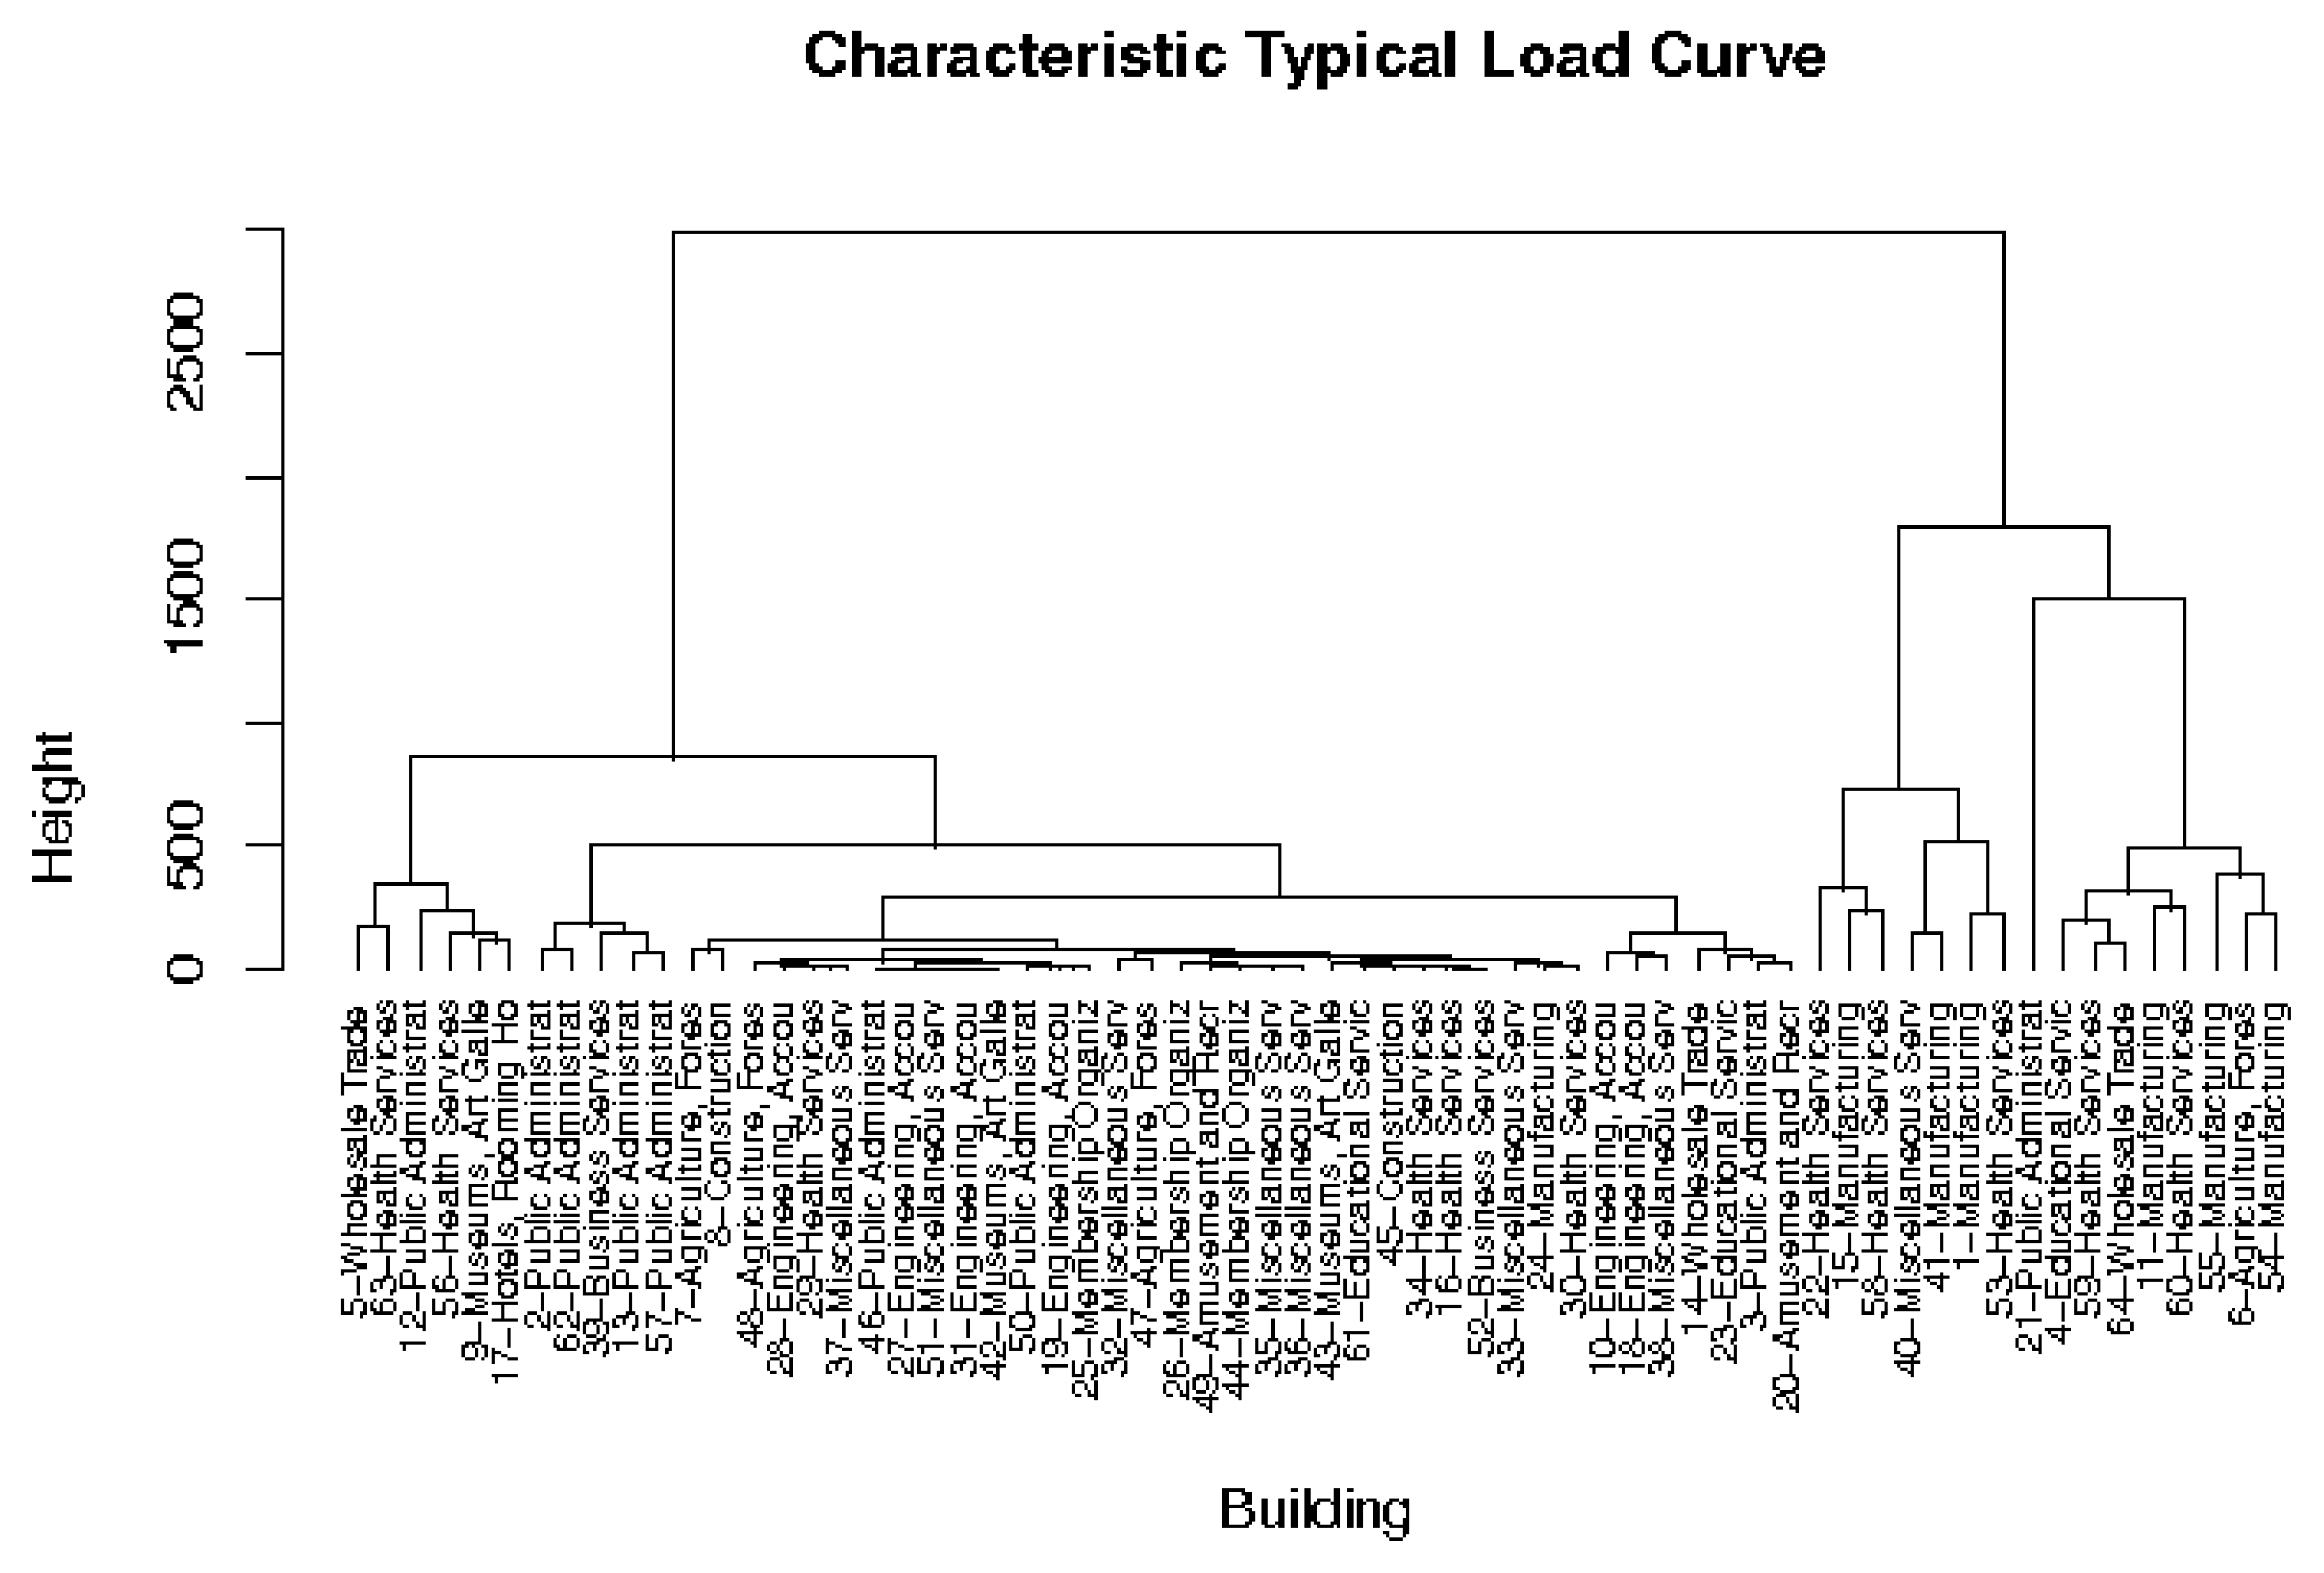
To present the segmentation results in a meaningful way, we plotted the dendogram for both segmentation approaches. Figure 7 and Figure 8 present the dendograms for the hierarchical classification of customers based on the demand signature and on the characteristic typical load curve, respectively. The buildings are informed using an ID and the industrial division. The referred ID can be linked to Table A1. At a glance it is possible to observe that the dendogram based on the demand signature is better balanced than the one based on the characteristic typical load curve. Moreover, the first dendogram groups the customers in a more semantic way (from an expert point of view). In addition, there is a noticeable difference in the way buildings are grouped. For example, the buildings that are closer in Figure 8 (e.g., IDs 27, 31, 42, 46, and 51), are presented in a completely different way in Figure 7.
7. Conclusions and Future Work
Nowadays, electric utilities who want to succeed in a competitive market are compelled to broaden the products and services that they offer. Getting to know what their customers want or who will be interested in a specific product or service is not trivial and it becomes more difficult when we consider that a utility might have hundred of thousands of customers. To tackle this problem it is useful to segment the customers into small clusters according to their similarities. Therefore, the key to success consists in choosing an appropriate way of characterizing a customer (so that one customer might be compared to other customers).
In this work, (contribution C1) we present a new approach approach to characterizing a customer: the electricity demand signature, a novel representation based on the relative importance of the measurements of the daily load curve. We introduce (contribution C2) an evolutionary algorithm to compute the electricity demand signature and we compare (contribution 3) the results of a customer segmentation based on our proposal against a segmentation based on the characteristic typical load curve using a set of 64 buildings located in Andalusia, Spain.
We show that the electricity demand signature can be represented as a histogram, becoming an easy-to-understand visualization of the load patterns variability for a given electricity consumer. On the other hand, the customer segmentation analysis show that that the clustering based on the demand signature is more meaningful (from an expert point of view) than the segmentation based on the characteristic typical load curve, and our proposal enables targeting smaller groups of customers. It is important to remark that our proposal does not exclude other representations, on the contrary we consider it to be a complimentary tool.
The results presented suggest that the electricity demand signature might also be used to accomplish further analysis of the customers, including outliers detection (e.g., why 4 a.m. is so important in a school?), behavioral studies (e.g., does lunch time affect the load?), among others.
As future work we plan to extend the proposed signature by adding more data, e.g., consumption of reactive energy, demographics, or building characteristics. We also propose to study different alternatives for selecting the most relevant information (multi-objective, different fitness, etc.).
Author Contributions
Conceptualization, A.C. and G.L.; Methodology, A.C.; Software, A.C.; Validation, A.C., G.L. and Y.B.; Formal Analysis, A.C.; Investigation, A.C.; Resources, E.A. and Y.B.; Data Curation, A.C.; Writing–Original Draft Preparation, A.C.; Writing–Review & Editing, A.C., G.L. and E.A.; Visualization, A.C.; Supervision, E.A.; Project Administration, A.C.; Funding Acquisition, E.A.
Funding
This research was partially funded by Ministerio de Economía, Industria y Competitividad, Gobierno de España, and European Regional Development Fund grant numbers TIN2014-57341-R (http://moveon.lcc.uma.es), TIN2016-81766-REDT (http://cirti.es), and TIN2017-88213-R (http://6city.lcc.uma.es).
Acknowledgments
The dataset was provided by BETTERGY, S.L. (http://www.bettergy.es), located in Parque Tecnológico de Andalucía (PTA). All data has been anonymised and it can be used freely for further (non-profit) research, with the obligation to cite BETTERGY, S.L. as the data source.
Conflicts of Interest
The authors declare no conflict of interest.
Appendix A
The data set used to test our proposal includes several types of buildings located in Andalusia, Spain. The load was recorded every 15 min for a whole year. Table A1 presents a summary of each customer, including the industrial division and category, according to the Standard Industrial Classification (SIC) [24]. MC, the mean power consumption register (taken every 15 min), and PC, the mean of the daily power consumption. MC and PC are measured in [kWh].

Table A1.
Mean power consumption (MC) and the mean of the daily power consumption (PC).
| ID | Industrial Division | Industrial Category | MC | PC |
|---|---|---|---|---|
| 1 | Manufacturing | 243 | 23,290 | |
| 2 | Public Administration | 38 | 3630 | |
| 3 | Public Administration | 30 | 2849 | |
| 4 | Services | Educational Services | 120 | 11,494 |
| 5 | Wholesale Trade | 60 | 5807 | |
| 6 | Agriculture, Forestry and Fishing | 149 | 14,349 | |
| 7 | Agriculture, Forestry and Fishing | 21 | 2004 | |
| 8 | Construction | 7 | 643 | |
| 9 | Services | Museums, Art Galleries, and Botanical and Zoological Gardens | 70 | 6679 |
| 10 | Services | Engineering, Accounting, Research, Management, and Related Services | 13 | 1294 |
| 11 | Manufacturing | 103 | 9916 | |
| 12 | Public Administration | 55 | 5303 | |
| 13 | Public Administration | 24 | 2271 | |
| 14 | Wholesale Trade | 39 | 3716 | |
| 15 | Manufacturing | 183 | 17,564 | |
| 16 | Services | Health Services | 6 | 575 |
| 17 | Services | Hotels, Rooming Houses, Camps, and Other Lodging Services | 94 | 9021 |
| 18 | Services | Engineering, Accounting, Research, Management, and Related Services | 19 | 1791 |
| 19 | Services | Engineering, Accounting, Research, Management, and Related Services | 3 | 251 |
| 20 | Services | Amusement and Recreation Services | 28 | 2687 |
| 21 | Public Administration | 164 | 15,729 | |
| 22 | Services | Health Services | 292 | 27,994 |
| 23 | Services | Educational Services | 20 | 1892 |
| 24 | Manufacturing | 4 | 409 | |
| 25 | Services | Membership Organizations | 3 | 245 |
| 26 | Services | Membership Organizations | 12 | 1118 |
| 27 | Services | Engineering, Accounting, Research, Management, and Related Services | 1 | 63 |
| 28 | Services | Engineering, Accounting, Research, Management, and Related Services | 4 | 373 |
| 29 | Services | Health Services | 5 | 522 |
| 30 | Services | Health Services | 4 | 403 |
| 31 | Services | Engineering, Accounting, Research, Management, and Related Services | 1 | 126 |
| 32 | Services | Miscellaneous Services | 9 | 900 |
| 33 | Services | Miscellaneous Services | 8 | 771 |
| 34 | Services | Health Services | 6 | 589 |
| 35 | Services | Miscellaneous Services | 5 | 472 |
| 36 | Services | Miscellaneous Services | 7 | 719 |
| 37 | Services | Miscellaneous Services | 5 | 456 |
| 38 | Services | Miscellaneous Services | 16 | 1523 |
| 39 | Services | Business Services | 29 | 2811 |
| 40 | Services | Miscellaneous Services | 216 | 20,748 |
| 41 | Manufacturing | 225 | 21,616 | |
| 42 | Services | Museums, Art Galleries, and Botanical and Zoological Gardens | 1 | 106 |
| 43 | Services | Museums, Art Galleries, and Botanical and Zoological Gardens | 3 | 244 |
| 44 | Services | Membership Organizations | 6 | 541 |
| 45 | Construction | 4 | 371 | |
| 46 | Public Administration | 0 | 47 | |
| 47 | Agriculture, Forestry and Fishing | 7 | 683 | |
| 48 | Agriculture, Forestry and Fishing | 5 | 450 | |
| 49 | Services | Amusement and Recreation Services | 11 | 1073 |
| 50 | Public Administration | 2 | 145 | |
| 51 | Services | Miscellaneous Services | 1 | 77 |
| 52 | Services | Business Services | 4 | 352 |
| 53 | Services | Health Services | 342 | 32,850 |
| 54 | Manufacturing | 110 | 10,545 | |
| 55 | Manufacturing | 110 | 10,579 | |
| 56 | Services | Health Services | 100 | 9601 |
| 57 | Public Administration | 22 | 2134 | |
| 58 | Services | Health Services | 285 | 27,402 |
| 59 | Services | Health Services | 150 | 14,427 |
| 60 | Services | Health Services | 169 | 16,233 |
| 61 | Services | Educational Services | 6 | 608 |
| 62 | Public Administration | 34 | 3299 | |
| 63 | Services | Health Services | 57 | 5459 |
| 64 | Wholesale Trade | 111 | 10,650 |
References
- Fang, X.; Misra, S.; Xue, G.; Yang, D. Smart grid—The new and improved power grid: A survey. IEEE Commun. Surv. Tutor. 2012, 14, 944–980. [Google Scholar] [CrossRef]
- Raza, M.Q.; Khosravi, A. A review on artificial intelligence based load demand forecasting techniques for smart grid and buildings. Renew. Sustain. Energy Rev. 2015, 50, 1352–1372. [Google Scholar] [CrossRef]
- Khurana, H.; Hadley, M.; Lu, N.; Frincke, D.A. Smart-grid security issues. IEEE Secur. Priv. 2010, 8. [Google Scholar] [CrossRef]
- Baker, M.; Hart, S. The Marketing Book, 5th ed.; Butterworth Heinemann: Oxford, UK, 2003. [Google Scholar]
- Haben, S.; Singleton, C.; Grindrod, P. Analysis and clustering of residential customers energy behavioral demand using smart meter data. IEEE Trans. Smart Grid 2016, 7, 136–144. [Google Scholar] [CrossRef]
- Hernández, L.; Baladrón, C.; Aguiar, J.M.; Carro, B.; Sánchez-Esguevillas, A. Classification and clustering of electricity demand patterns in industrial parks. Energies 2012, 5, 5215–5228. [Google Scholar] [CrossRef]
- Wang, Y.; Chen, Q.; Kang, C.; Xia, Q. Clustering of electricity consumption behavior dynamics toward big data applications. IEEE Trans. Smart Grid 2016, 7, 2437–2447. [Google Scholar] [CrossRef]
- Kriegel, H.P.; Kröger, P.; Zimek, A. Clustering high-dimensional data. ACM Trans. Knowl. Discov. Data 2009, 3, 1–58. [Google Scholar] [CrossRef]
- Tsekouras, G.J.; Hatziargyriou, N.D.; Dialynas, E.N. Two-stage pattern recognition of load curves for classification of electricity customers. IEEE Trans. Power Syst. 2007, 22, 1120–1128. [Google Scholar] [CrossRef]
- Jain, A.K.; Dubes, R.C. Algorithms for Clustering Data; Prentice Hall: Englewood Cliffs, NJ, USA, 1988. [Google Scholar]
- McLoughlin, F.; Duffy, A.; Conlon, M. Characterising domestic electricity consumption patterns by dwelling and occupant socio-economic variables: An Irish case study. Energy Build. 2012, 48, 240–248. [Google Scholar] [CrossRef] [Green Version]
- Haben, S.; Rowe, M.; Greetham, D.V.; Grindrod, P.; Holderbaum, W.; Potter, B.; Singleton, C. Mathematical solutions for electricity networks in a low carbon future. In Proceedings of the 22nd International Conference and Exhibition on Electricity Distribution (CIRED 2013), Stockholm, Sweden, 10–13 June 2013. [Google Scholar]
- Pitt, B.; Kitschen, D. Application of data mining techniques to load profiling. In Proceedings of the 21st 1999 IEEE International Conference, PICA’99 Power Industry Computer Applications, Santa Clara, CA, USA, 21 May 1999; pp. 131–136. [Google Scholar]
- Chicco, G.; Napoli, R.; Piglione, F.; Postolache, P.; Scutariu, M.; Toader, C. Load pattern-based classification of electricity customers. IEEE Trans. Power Syst. 2004, 19, 1232–1239. [Google Scholar] [CrossRef]
- Nazarko, J.; Styczynski, Z.A. Application of statistical and neural approaches to the daily load profiles modelling in power distribution systems. In Proceedings of the 1999 IEEE Transmission and Distribution Conference, New Orleans, LA, USA, 11–16 April 1999; Volume 1, pp. 320–325. [Google Scholar]
- Haben, S.; Ward, J.; Greetham, D.V.; Singleton, C.; Grindrod, P. A new error measure for forecasts of household-level, high resolution electrical energy consumption. Int. J. Forecast. 2014, 30, 246–256. [Google Scholar] [CrossRef]
- Dash, M.; Liu, H. Feature Selection for Classification. Intell. Data Anal. 1997, 1, 131–156. [Google Scholar] [CrossRef]
- Porkodi, R. Comparison of filter based feature selection algorithms: An overview. Int. J. Innov. Res. Technol. Sci. 2014, 2, 108–113. [Google Scholar]
- Chicco, G.; Napoli, R.; Piglione, F. Comparisons among clustering techniques for electricity customer classification. IEEE Trans. Power Syst. 2006, 21, 933–940. [Google Scholar] [CrossRef]
- Carpaneto, E.; Chicco, G.; Napoli, R.; Scutariu, M. Electricity customer classification using frequency–domain load pattern data. Int. J. Electr. Power Energy Syst. 2006, 28, 13–20. [Google Scholar] [CrossRef]
- Hubert, L.; Arabie, P. Comparing partitions. J. Classif. 1985, 2, 193–218. [Google Scholar] [CrossRef]
- Syswerda, G. A study of reproduction in generational and steady state genetic algorithms. Found. Genet. Algorithms 1991, 2, 94–101. [Google Scholar]
- Sheskin, D.J. Parametric and Nonparametric Statistical Procedures; CRC Press: Boca Raton, FL, USA, 2000. [Google Scholar]
- Pearce, E. History of the Standard Industrial Classification; Executive Office of the President Office of Statistical Standards, US Bureau of the Budget) (Mimeograph): Washington, DC, USA, 1957. [Google Scholar]
- Roobaert, D.; Karakoulas, G.; Chawla, N.V. Information gain, correlation and support vector machines. In Feature Extraction; Springer: Berlin, Germany, 2006; pp. 463–470. [Google Scholar]
- Hall, M.A. Correlation-based feature selection for discrete and numeric class machine learning. In Proceedings of the Seventeenth 2000, ICML ’00 International Conference on Machine Learning, Stanford, CA, USA, 29 June–2 July 2000; pp. 359–366. [Google Scholar]
- Gan, G.; Ma, C.; Wu, J. Data Clustering: Theory, Algorithms, and Applications; Society for Industrial and Applied Mathematics (SIAM): Philadelphia, PA, USA, 2007; Volume 20. [Google Scholar]
- Aggarwal, C.C.; Reddy, C.K. Data Clustering: Algorithms and Applications; CRC Press: Boca Raton, FL, USA, 2013. [Google Scholar]
Figure 1.
Taxonomy of energy customers clustering approaches.

Figure 2.
Electricity demand signature computation.

Figure 3.
One year of daily load curves superposed and the related electricity demand signature.

Figure 4.
Demand signature vs. characteristic typical load curve for two buildings.

Figure 5.
Internal cluster validation for customer segmentation based on the demand signature.

Figure 6.
Internal cluster validation for customer segmentation based on the characteristic typical load curve.
Figure 6.
Internal cluster validation for customer segmentation based on the characteristic typical load curve.

Figure 7.
Classification of customers based on the demand signature.

Figure 8.
Classification of customers based on the characteristic typical load curve.

Table 1.
Summary of the customers present in our dataset grouped by industrial division.
| Industrial Division | N | MC | Sd MC | PC | Sd PC |
|---|---|---|---|---|---|
| Agriculture, Forestry and Fishing | 4 | 46 | 70 | 4371 | 6687 |
| Construction | 2 | 5 | 2 | 507 | 193 |
| Manufacturing | 7 | 140 | 82 | 13,417 | 7954 |
| Wholesale Trade | 3 | 70 | 37 | 6725 | 3557 |
| Services | |||||
| Hotels, Rooming Houses, Camps, and Other Lodging Services | 1 | 94 | - | 9021 | - |
| Business Services | 2 | 16 | 18 | 1582 | 1739 |
| Amusement and Recreation Services | 2 | 20 | 12 | 1880 | 1141 |
| Health Services | 11 | 129 | 129 | 12,368 | 12,351 |
| Educational Services | 3 | 49 | 62 | 4665 | 5949 |
| Museums, Art Galleries, and Botanical and Zoological Gardens | 3 | 24 | 39 | 2343 | 3755 |
| Membership Organizations | 3 | 7 | 5 | 634 | 444 |
| Engineering, Accounting, Research, Management, and Related Services | 6 | 7 | 7 | 650 | 717 |
| Miscellaneous Services | 8 | 33 | 74 | 3208 | 7099 |
| Public Administration | 9 | 41 | 49 | 3934 | 4719 |
| Total | 64 | 61 | 83 | 5820 | 8057 |
Table 2.
Evolutionary algorithm parameters used to test our proposal.
| Parameter | Value |
|---|---|
| Number of genes (R) | 96 |
| Population Size () | 10 |
| Crossover probability () | 0.8 |
| Mutation probability () | 1/96 |
| Max evaluations | 1000 |
| Number of times | 30 |
Table 3.
Fitness results summary for the feature selection problem.
| Method | Min | Max | Mean | Median | Sd |
|---|---|---|---|---|---|
| SSGA | 0.91 | 0.99 | 0.96 | 0.97 | 0.02 |
| RS | 0.34 | 0.92 | 0.84 | 0.88 | 0.11 |
| IG | 0.33 | 0.94 | 0.83 | 0.83 | 0.08 |
| CFS | 0.38 | 0.99 | 0.73 | 0.85 | 0.24 |
Table 4.
Number of features selected.
| Method | Min | Max | Mean | Median | Sd |
|---|---|---|---|---|---|
| SSGA | 5 | 37 | 18.19 | 16 | 8.77 |
| RS | 33 | 64 | 47.80 | 47 | 5.68 |
| IG | 1 | 95 | 62.43 | 63 | 25.24 |
| CFS | 1 | 15 | 4.33 | 3 | 3.48 |
Table 5.
Post hoc comparison of the results in terms of fitness.
| Comparison | Adjusted p-Value |
|---|---|
| SSGA vs. RS | 1.02 × |
| SSGA vs. IG | 8.41 × |
| SSGA vs. CFS | 0 |
Table 6.
Optimal segmentation based on the internal cluster validation.
| Connectivity | Dunn | Silhouette | ||||
|---|---|---|---|---|---|---|
| Score | Opt. Cls. | Score | Cls. | Score | Cls. | |
| Demand Signature | 12.91 | 2 | 0.62 | 8 | 0.29 | 2 |
| Typical Load Curve | 3.49 | 2 | 0.42 | 4 | 0.75 | 2 |
© 2018 by the authors. Licensee MDPI, Basel, Switzerland. This article is an open access article distributed under the terms and conditions of the Creative Commons Attribution (CC BY) license (http://creativecommons.org/licenses/by/4.0/).
Share and Cite
MDPI and ACS Style
Camero, A.; Luque, G.; Bravo, Y.; Alba, E. Customer Segmentation Based on the Electricity Demand Signature: The Andalusian Case. Energies 2018, 11, 1788. https://doi.org/10.3390/en11071788
AMA Style
Camero A, Luque G, Bravo Y, Alba E. Customer Segmentation Based on the Electricity Demand Signature: The Andalusian Case. Energies. 2018; 11(7):1788. https://doi.org/10.3390/en11071788
Chicago/Turabian StyleCamero, Andrés, Gabriel Luque, Yesnier Bravo, and Enrique Alba. 2018. "Customer Segmentation Based on the Electricity Demand Signature: The Andalusian Case" Energies 11, no. 7: 1788. https://doi.org/10.3390/en11071788
Note that from the first issue of 2016, this journal uses article numbers instead of page numbers. See further details here.