Power System Restoration Planning Strategy Based on Optimal Energizing Time of Sectionalizing Islands
by
 ,
,
Dian Najihah Abu Talib
1, 
Hazlie Mokhlis
1,*,
Mohamad Sofian Abu Talip
1,
Kanendra Naidu
2 and
Hadi Suyono
3 1
Department of Electrical Engineering, University of Malaya, Kuala Lumpur 50603, Malaysia
2
Electrical Technology Section, University of Kuala Lumpur, British Malaysian Institute, Gombak 53100, Selangor, Malaysia
3
Department of Electrical Engineering, Faculty of Engineering, University of Brawijaya, Malang 65145, Indonesia
*
Author to whom correspondence should be addressed.
Energies 2018, 11(5), 1316; https://doi.org/10.3390/en11051316
Submission received: 14 April 2018
/
Revised: 11 May 2018
/
Accepted: 14 May 2018
/
Published: 22 May 2018
(This article belongs to the Section F: Electrical Engineering)
Abstract
:Common power system restoration planning strategy is based on a ‘build up’ approach, where a blackout system is sectionalized among several islands for parallel restoration prior to resynchronization. In order to speed up the resynchronization of the islands, each island must have similar energizing times. However, there is a huge number of possible combinations of islands that can be formed. Thus, this paper proposes a method to determine optimal islands that have similar energizing times. The method involves identifying transmission lines that should not be connected to form the islands. The proposed method is based on the combination of heuristic and discrete optimization methods. The heuristic technique is proposed to find initial solution that is close to the optimal solution. This solution will guide the optimization technique, which is the discrete Artificial Bee Colony optimization method, to find the optimum solution. The proposed method also considers restoration constraints including black start generator availability, load-generation balance, and the maintenance of acceptable voltage magnitude within each island. The proposed method is validated via simulation using IEEE 39, 118-bus and 89-bus European systems. The advantage of the proposed method in terms of restoration time is demonstrated through a comparison with other literature.
1. Introduction
Several blackouts have occurred recently, such as the major disturbance in Western Europe in September 2003 [1], in northern India in July 2012 [2], in Pakistan in January 2015 [3], and the widespread power blackout in March 2015 in Turkey [4]. Such blackouts caused economic losses due to business disruptions, loss of production, as well as causing high safety risk to the public. In order to minimize losses, the system needs to be restored as fast as possible. However, this requires careful planning during the process of energizing individual power system components, such as generator units, transmission lines, substation buses, loads, and other facilities, back to normal.
Two main restoration techniques to restore a blackout system are well explained in [5,6]. The first technique is referred to as the ‘build-up’ technique, where the system is sectionalized into subsystems or islands. The islands formed should fulfill the power generation-load balance and voltage limit constraints. This can be done by ensuring that the total capacity of generators in the island is able to fulfill the maximum load demand of the island. The availability of black start (BS) generators in each island must also be considered. The BS generator, which operates using auxiliary supply, is required to initiate the reenergizing process. Parallel restoration of the islands is carried out before resynchronizing the islands to a complete system. The main premise of this technique is to reduce the total restoration time and avoid system blackout from reoccurring due to recurrent disturbances in the affected island. In reenergizing power system units such as generators, buses, and loads in the islands, two approaches are available. The first is to energize the islands’ backbone, which contains the main units such as BS generator, non-black start generators (NBS), and critical loads (CLs) [7,8]. Once this step has been carried out, the islands are resynchronized, and the rest of the units will continue to be energized. The second approach is to energize all the power system units in the islands [9] before the resynchronization process is carried out. The second technique is referred to as the ‘build-down’ technique, where the ‘bulk network’ is energized prior to resynchronizing loads and generators. This process is carried out without sectionalizing the system into islands. Loads and generators will be energized in parallel.
Since the main objective of the restoration process is to restore the system within a minimal time, the ‘build up’ technique is commonly preferred. For example, this technique has been applied to restore the power system network in the British network [10], Mexican network [11], and PJM interconnections [12]. Many researchers have proposed power system restoration methods based on this technique. The proposed strategy in [13] determines the cut set (line that should not be connected) to sectionalize the system into islands using the graph theory method. Each island will be restored independently before connecting all islands. In [9,14] graph theory and mathematical techniques were combined and formed using spectral clustering based methodology to determine the islands. In these works, the eigenvalues of Laplacian matrices are calculated to cluster the graph into subgraphs, where the nodes in each subgraph are strongly connected based on the edge’s weight factor. There are also attempts at using graph theory with Binary Decision Diagram (BDD) to sectionalize the system [7,8]. In [7], BS availability, power balance and voltage stability constraints are considered to determine the cut set. However, the energizing time is not a factor considered to determine the created islands. The main consideration in this work is to maintain the stability margins of the islands. The best energizing time is calculated once the islands have been formed. In [8], energizing time is considered but the islands’ steady-state stability was not taken into account. The mathematical approach is fast in terms of computation time. However, the combination of multiple linear and nonlinear objectives, operation stages and constraints are complex and difficult to be incorporated in determining the best possible islands with minimum restoration time. Due to this, researchers have used heuristic techniques.
A heuristic technique for restoration strategy was proposed in [15,16]. This technique is based on the search strategy such as breadth-first search or depth-first search, incorporated with specific information to guide the search process. The method in [15] uses information such as local network information for the target configuration and switching sequence. In addition, service restoration and system reconfiguration are used to restore the system based on operator practices in [16]. However, the published techniques are implemented for a small scale-network system (14 and 20 buses). For large-scale and complex networks, heuristic technique may encounter difficulty in finding the best solution. This technique might overlook the optimal solution due to single searching direction. Furthermore, its accuracy depends on the specific rules which are based on the given information such as level searching while fulfilling the restoration objective, operation stages and constraints. Due to these problems, different optimization methods such as the Genetic Algorithm (GA), Firefly Algorithm (FA) and Particle Swarm Optimization (PSO) algorithm have been applied to seek the global optima.
In [17], GA is used to form the islands by determining the optimal load un-served. In [18], FA is applied to search the optimal sequences of generator unit’s restoration path and optimal load pickup sequences with and without the presence of renewable energy resources. A discrete (PSO) algorithm is investigated in [19] to determine the optimal skeleton paths for energizing the network. The optimization method has the capability to find an optimal solution since it searches all possible solutions in different directions. Furthermore, multi nonlinear objectives, multi restoration stage operation and multi constraints can be considered. The limitation of this technique is its high computation time due to the huge searching space of a possible set of lines that can create islands for restoration.
Considering the strength of the optimization method in finding the optimal solution and its flexibility incorporating multiple objectives and constraints, this paper proposes a combination of heuristic and optimization methods assisted by graph theory technique. The proposed heuristic technique is to find initial cut set solutions which separate the blackout system among islands that have an almost identical restoration time. Subsequently, the solution is used in the optimization method to find the optimal solution which reduces the total restoration time until complete interconnection. Finding the initial solutions is important to reduce the search space and increase the possibility of finding the optimal solution in the optimization stage.
The proposed method defines the energizing time and minimum lines in the cut set as the objectives while simultaneously considering the restoration constraints, which are BS generator availability, load-generation power balance and maintaining acceptable voltage magnitude. The discrete Artificial Bee Colony (DABC) is chosen due to its discrete nature of system network topology. In addition, the ABC algorithm has a triple search operator and greedy selection scheme that will maximize the possibility of finding the optimal solution in a short time. The proposed method is implemented for both re-energizing approaches, (1) re-energizing the islands’ backbone units and (2) re-energizing all islands’ units. The method has been tested using a 39 and 118 IEEE bus test system and has shown promising results compared to other methods in literature.
This paper is organized in the following order; Section 2 shows the power restoration formulation used in the proposed planning followed by Section 3, which presents the proposed power system restoration strategy based on the heuristic technique and the DABC method. In Section 4, the detail of the energizing time calculation algorithm is presented. Section 5 presents the proposed strategy and the results gathered from the IEEE 39 and 118-bus test system. Finally, Section 6 presents the conclusion drawn from the proposed strategy.
2. Power System Restoration Formulation
2.1. Objective Function
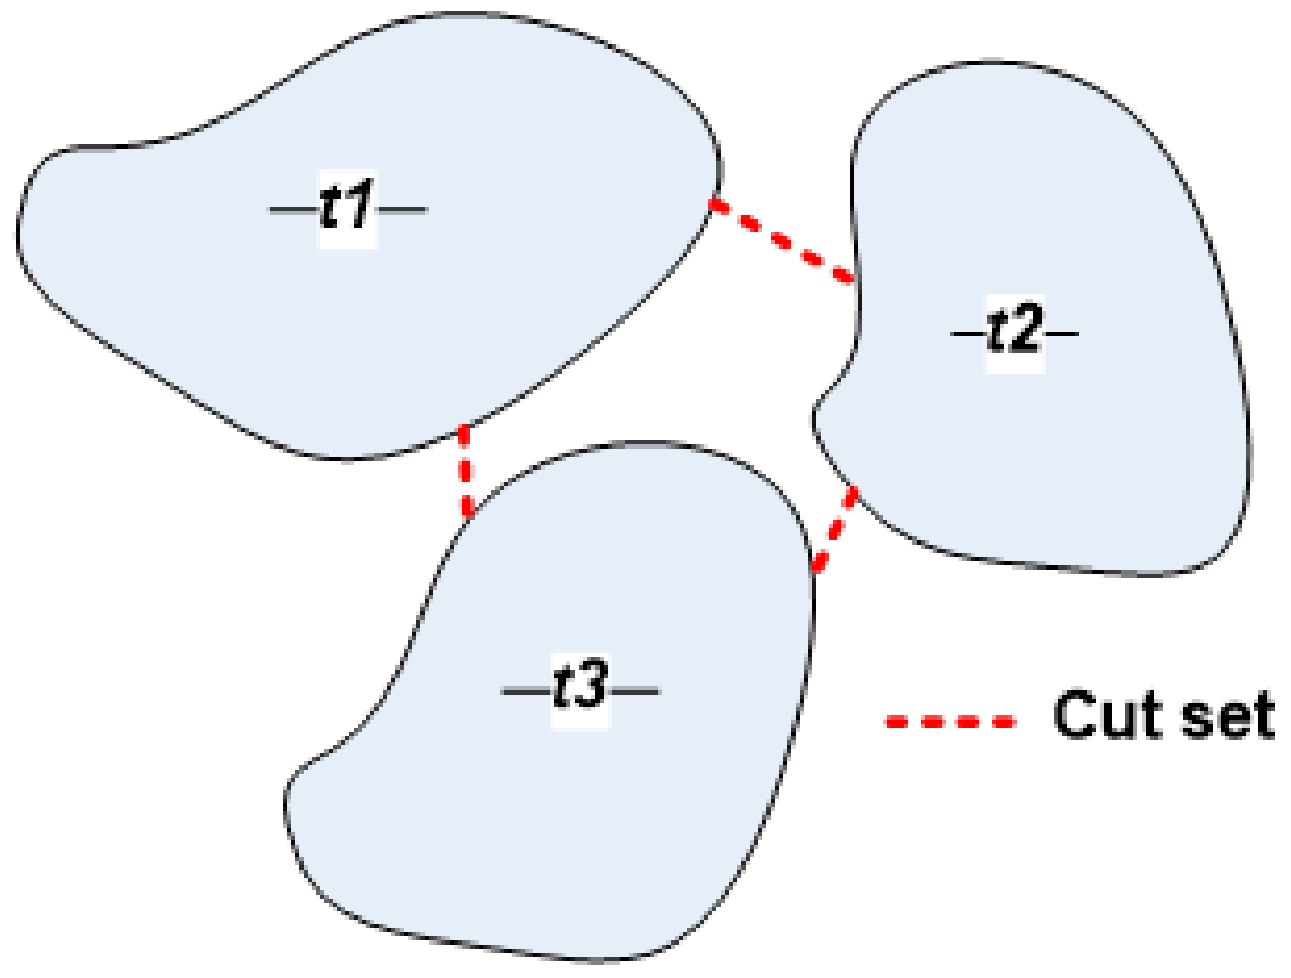
In this work, a strategy is proposed to create islands with almost identical energizing time, t as shown in Figure 1, where t1 ≈ t2 ≈ t3. It is imperative that a common energizing time is achieved between all the islands to speed up the system resynchronization process. For three islands, if t1 = α, t2 = β and t3 = γ, the system resynchronization time is max (α, β, γ).
In order to create number of islands, ‘r’ with almost identical energizing time, which in turn reduces total restoration time until complete interconnection, a fitness function () is proposed as shown in (1).
where: represents the restoration time gap between the ‘r’ islands. A smaller gap indicates that the islands created have almost identical restoration time, corresponds to the total time of the interconnection process, z is the number of lines in the cut set and is the time to interconnect the cut set. Fewer lines identified will reduce the total interconnection time.
2.2. Constraints
The restoration planning strategy needs to fulfill the restoration constraints in the following manner:
- BS unit availability at each island.where: is a set of buses in each ‘r’ island created, b is the bus number and ∂ is the total number of islands. A subset is defined to represent generators which are BS units in set of total buses in a system. Each island must have at least one BS generator.
- Load-generation balance.where: In each ‘r’ island, the total maximum active power generation must be higher than the total load in order to avoid frequency drop and subsequent system collapse. In this paper, reactive power balance is not considered. However, the balance of reactive power is indirectly taken into account thorough the voltage profile constraint as per Equation (4). This is due to the strong dependence of voltage magnitude on reactive power.
- To maintain an acceptable steady state voltage profile.where: Each bus voltage in each ‘r’ island is within the acceptable voltage range in ±5–10% of the rated voltage. Violating the boundaries of the nominal voltage will cause voltage instability, which might affect the system.
3. Power System Restoration Planning
The proposed power system restoration planning is divided into three procedures. The first is network modelling via graph theory, the second is the implementation of the heuristic technique to identify the initial solutions, and the last procedure is to employ the DABC to determine the optimal cut set. The procedures are explained as follows.
3.1. Network Modelling via Graph Theory
Power system properties can be described as an undirected graph, G = (V, E, W), consisting of a set of nodes, V connected by a set of edges, E with weight factor, W [7]. V and E represent the system buses and the transmission lines that connect the buses, respectively. The weight factor, W represents the internal connectivity status of the edges. The connectivity status of the edge or line is 1 if it is connected, and 0 if it is not connected. An example is a network model with b buses and l edges. The elements are V = {v1, v2 … vi}, i = b, E = {e1, e2 … ei}, I = l and W = {w1, w2 … wi}, i = l. Subset VG ⊂ V is defined as generator buses and VL ⊂ V as load buses. Other subsets in the system are VBS ⊂ VG BS generator bus and VCL ⊂ VL critical load buses.
Determination of the Shortest Energizing Path
The energizing path is determined between major equipment in the blackout system using the k-shortest path method based on Dijkstra’s algorithm [20]. The algorithm is applied in the graph theory model. The shortest energizing path is required to reduce the total restoration time. The path is determined based on the total weight, Wk-path along the energizing path, k-path from node i to node j. The weight is calculated using Equation (5). k represents the number of paths identified between two nodes.
where: a represents the edges of connected sequence nodes {v1, v2 … vi}, i = b in each k path. l is the total number of edges.
The shortest energizing path is identified between the k paths that have the lowest number of connectivity. However if there is more than one path with a similar number of connections, the electrical distance of the total edges along the paths will be calculated. The path with the lowest value of the electrical distance along the path is selected as the shortest path.
Electrical distance in this paper is referred to the total line impedance between node i to node j across the selected energizing path. The impedance in transmission line is defined as the line reactance xij, excluding the line resistance, rij, because the value of the resistance is usually small, rendering it negligible.
Sectionalizing the system into islands can be achieved by determining the edges to be removed to create subgraphs. This is important in order to create optimum islands that have the lowest energizing time.
3.2. Heuristic Technique
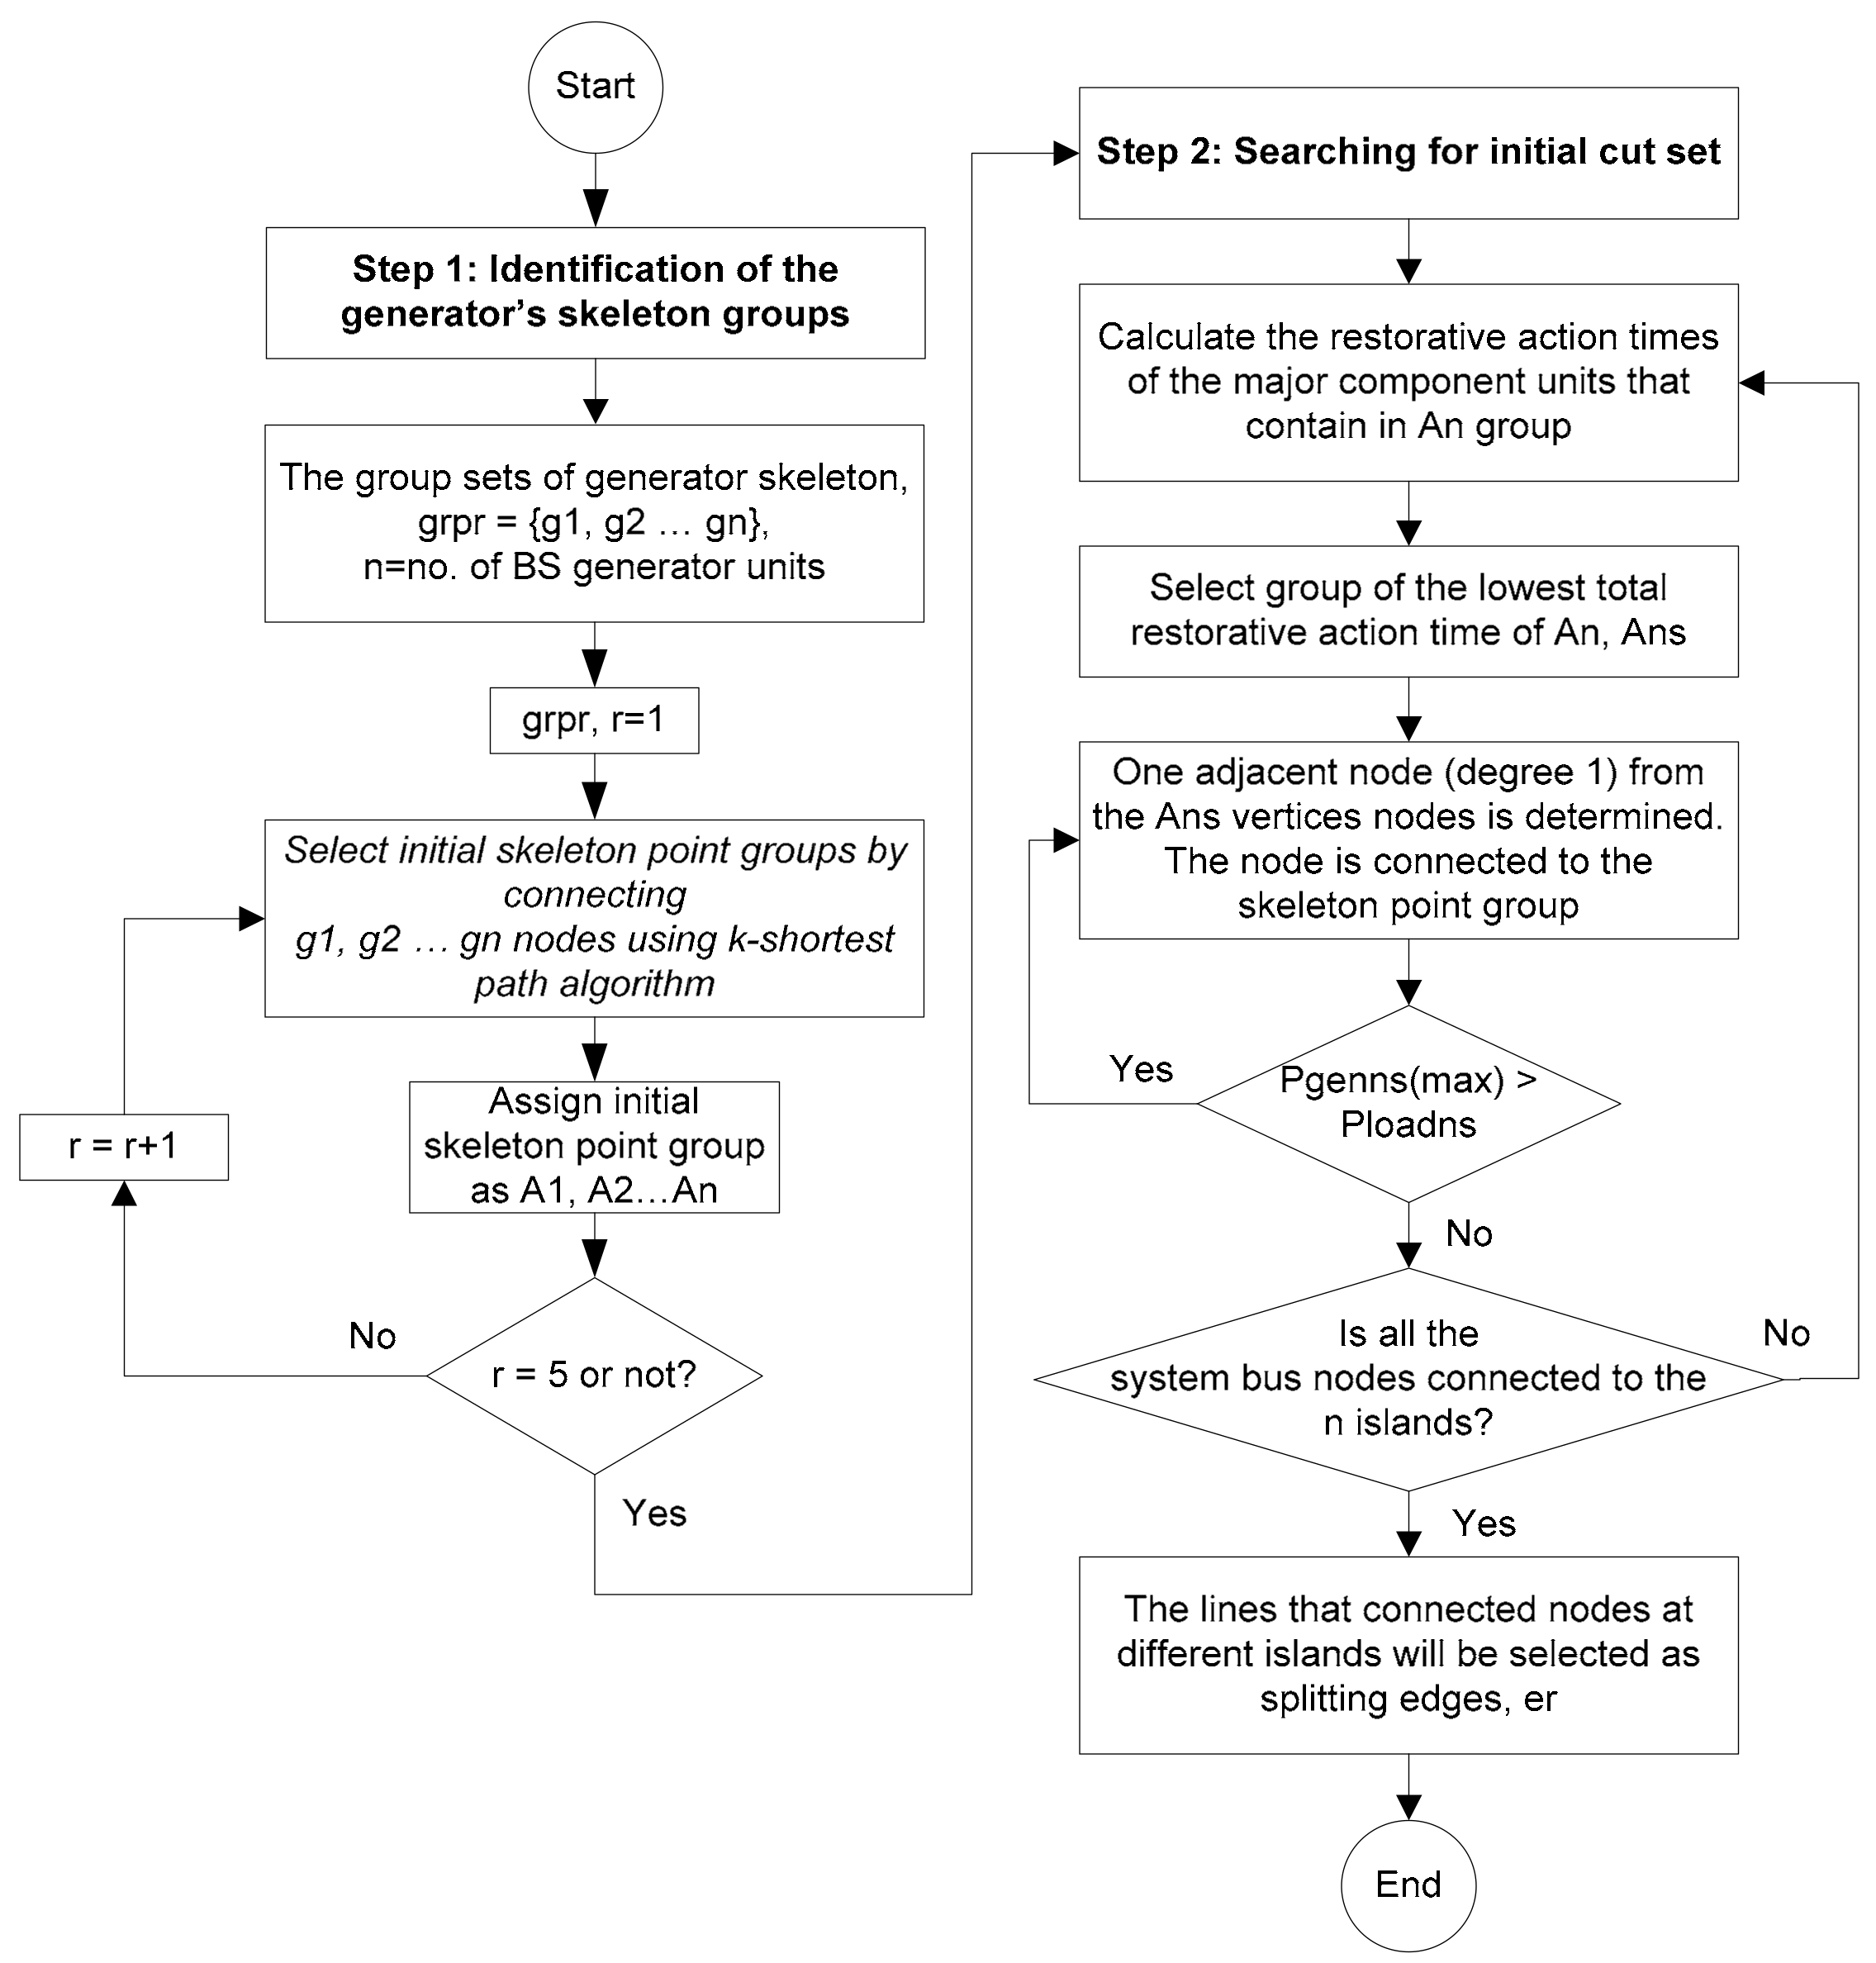
An initial cut set is required to guide the DABC optimization method to seek the optimum solution. Without an initial solution, it will be time consuming and will be a daunting task for DABC to determine the optimum solution. This is due to the nature of the power system configuration, which consists of massive and non-continuous combinatorial search space. The proposed heuristic technique is shown in Figure 2.
The technique is divided into two main steps. The first is to identify the generator skeleton units available in each group island. This information is required to obtain a good starting point to create islands with balanced size. Island size is described by the total restoration time taken by individual generators, loads, and lines in each island. The second step is to expand the generator skeleton group based on adjacent nodes to obtain the initial cut set.
The two main steps taken to determine the initial islanding solutions are described as follows.
3.2.1. Step 1: Identification of the Generator’s Skeleton Groups
Generator units for each island are identified by grouping them according to the shortest path. This can be done by searching the entire possible generator skeleton group according to the number of desired islands. The generator skeleton is the node point that connects the generators based on the nearest edge paths using the k-shortest path method. The generator’s skeleton group is determined and ranked according to the total power generation balance and skeleton’s size between the generator groups. The procedure to identify generator’s skeleton groups is explained as follows:
- The k-shortest path method is used to list all possible sets of generator’s groups, grpσ = {g1, g2 … gσ}, where ‘σ’ represents the possible set number of different generator groups, while ‘r’ represents the number of generator groups for each set by referring to the number of BS generators. Each set needs to fulfill the following requirements (i) the skeletons of each group do not overlap with each other, and (ii) each group must have at least one BS generator unit.
- In each set of the generator groups, the total power generation and their skeleton size are determined. The total power generation for ‘r’ generator group = {PG1, PG2 … PGr}, while the skeleton size is the number of edges covering the path between generator units in a group, s = {s1, s2 … sr}. The total power generation balance (∆PG) and the gap of the skeleton size (∆s) are calculated using Equations (6) and (7), respectively.
Total power generation balance between the islands,
∆PG = max {PG1, PG2 … PGr} − min {PG1, PG2 … PGr}
Gap of the generator group’s skeleton size,
∆s = max {s1, s2 … sr} − min {s1, s2 … sr}
- 3.
- Rank the sets according to the lowest active power generation balance between the groups and the smallest gap size of the skeletons. This criterion is chosen to obtain a good initial starting point to create islands with similar energizing time. In this work, five possible sets of generator groups are selected as initial solutions.
- 4.
- Each set of generator group’s initial skeleton point is determined by connecting the generator groups, g1, g2 … gr nodes using the k-shortest path algorithm. Assign the initial skeleton point as {A1, A2 … Ar}.
3.2.2. Step 2: Searching for the Initial Cut Set
After identifying and ranking the group sets for the initial generator skeleton points, the first five groups will undergo a search process to find the initial cut set. The steps required are explained as follows:
- Expanding the island step from the initial skeleton point is done by considering the restorative time of generators, loads, buses and lines. The time taken to re-energize major power system units is as follows: (1) Restart BS unit, 15 min; (2) Energise a bus from BS unit, 5 min; (3) Connect tie line, 25 min; (4) Crank power to a NBS unit from a bus, 15 min; (5) Synchronized subsystems, 25 min; (6) Pick up load, 20 min [9,21]. The group with the lowest restoration times is chosen and assigned as Ans.
- Adjacent node with a degree of 1 from Ars nodes is determined. The nodes are connected one by one to the skeleton group while checking their load-generation balance shown in Equation (8). The connection process is continued until the total load is greater than the maximum active power generation.rs = island with lowest energizing time.
- The steps in 1 & 2 are repeated until all nodes in the system are connected to r islands.
- The lines that connect the nodes at different islands will be selected as the cut set.
3.3. Discrete ABC Method
Various researchers have implemented the ABC optimization technique in their studies [22,23]. Generally, the method comprises of 3 bee stages; employed, onlooker, and scout bee, all of which look for the optimum solution. The conventional ABC optimization method is unsuitable for this work due to the nature of power system configuration with the physical connection which acts as a discrete behaviour without a linear relationship while the positions of transmission lines are represented as integer numbers. The conventional method is based on a continuous approach that uses the floating numbers. Thus, the modified discrete mutation process of the ABC method is proposed. The modified mutation process for each stage of DABC method is implemented, as shown in Table 1.
The initial solution z1, z2 and z3 represents the cut set, which is determined from the heuristic technique. The fitness function in Equation (1) will be calculated for each new cut set mutated using the DABC method. The cut set with the lowest fitness function will be selected as the final solution.
4. Power Energizing Time Calculation
In this study, the energizing time is calculated once the cut set is determined and the islands are created. The energizing time reflects the time taken for the major power system units in the island to be energized. The calculation is based on the following order; BS generator starts up using auxiliary supply, transmission line re-energizing to provide power to other generating units, and load reconnection. Priority is given to reconnect the CLs followed by other loads in the system. The k-shortest path is used to determine the shortest path to restore the major units in the island based on the unit’s priority. There are two reenergizing approaches that can be used to restore the power system. The first approach is to reenergize the backbone of the islands (BS, NBS and CLs units), including the edges that reconnect the units. The second approach is to reenergize all units in each island. The energizing time calculation is carried out in parallel for each island. Details of the calculation process are explained as follows:
- Graph theory is used to model the power system using the bus and line data. Both data are required to assign the nodes, edges, and weights in the graph. The cut set is determined using the proposed restoration strategy to create the desired number of islands. Each island calculates the energizing time in parallel.
- The energizing time algorithm uses the k-shortest method assisted by graph theory to search the shortest path to reenergize the backbone, starting with the BS unit. The time taken to energize the searched units is calculated. The first reenergizing approach will stop at this step.
- The second approach continues to search and calculate the energizing time for the rest of the major power system units. This step is repeated until all units in the island are restored.
5. Simulation Results
The proposed strategy is tested and validated using the IEEE 39 and IEEE 118-bus test systems. In each test system, heuristic technique and DABC optimization method were used to determine the optimal cut set. In this work, two reenergizing approaches cases are studied and analysed for each test system. The cases are (1) re-energization of the island’s backbone network which energizes the BS unit, NBS units, and CLs, and (2) re-energization of all power system units. Both approaches are calculated for each created islands.
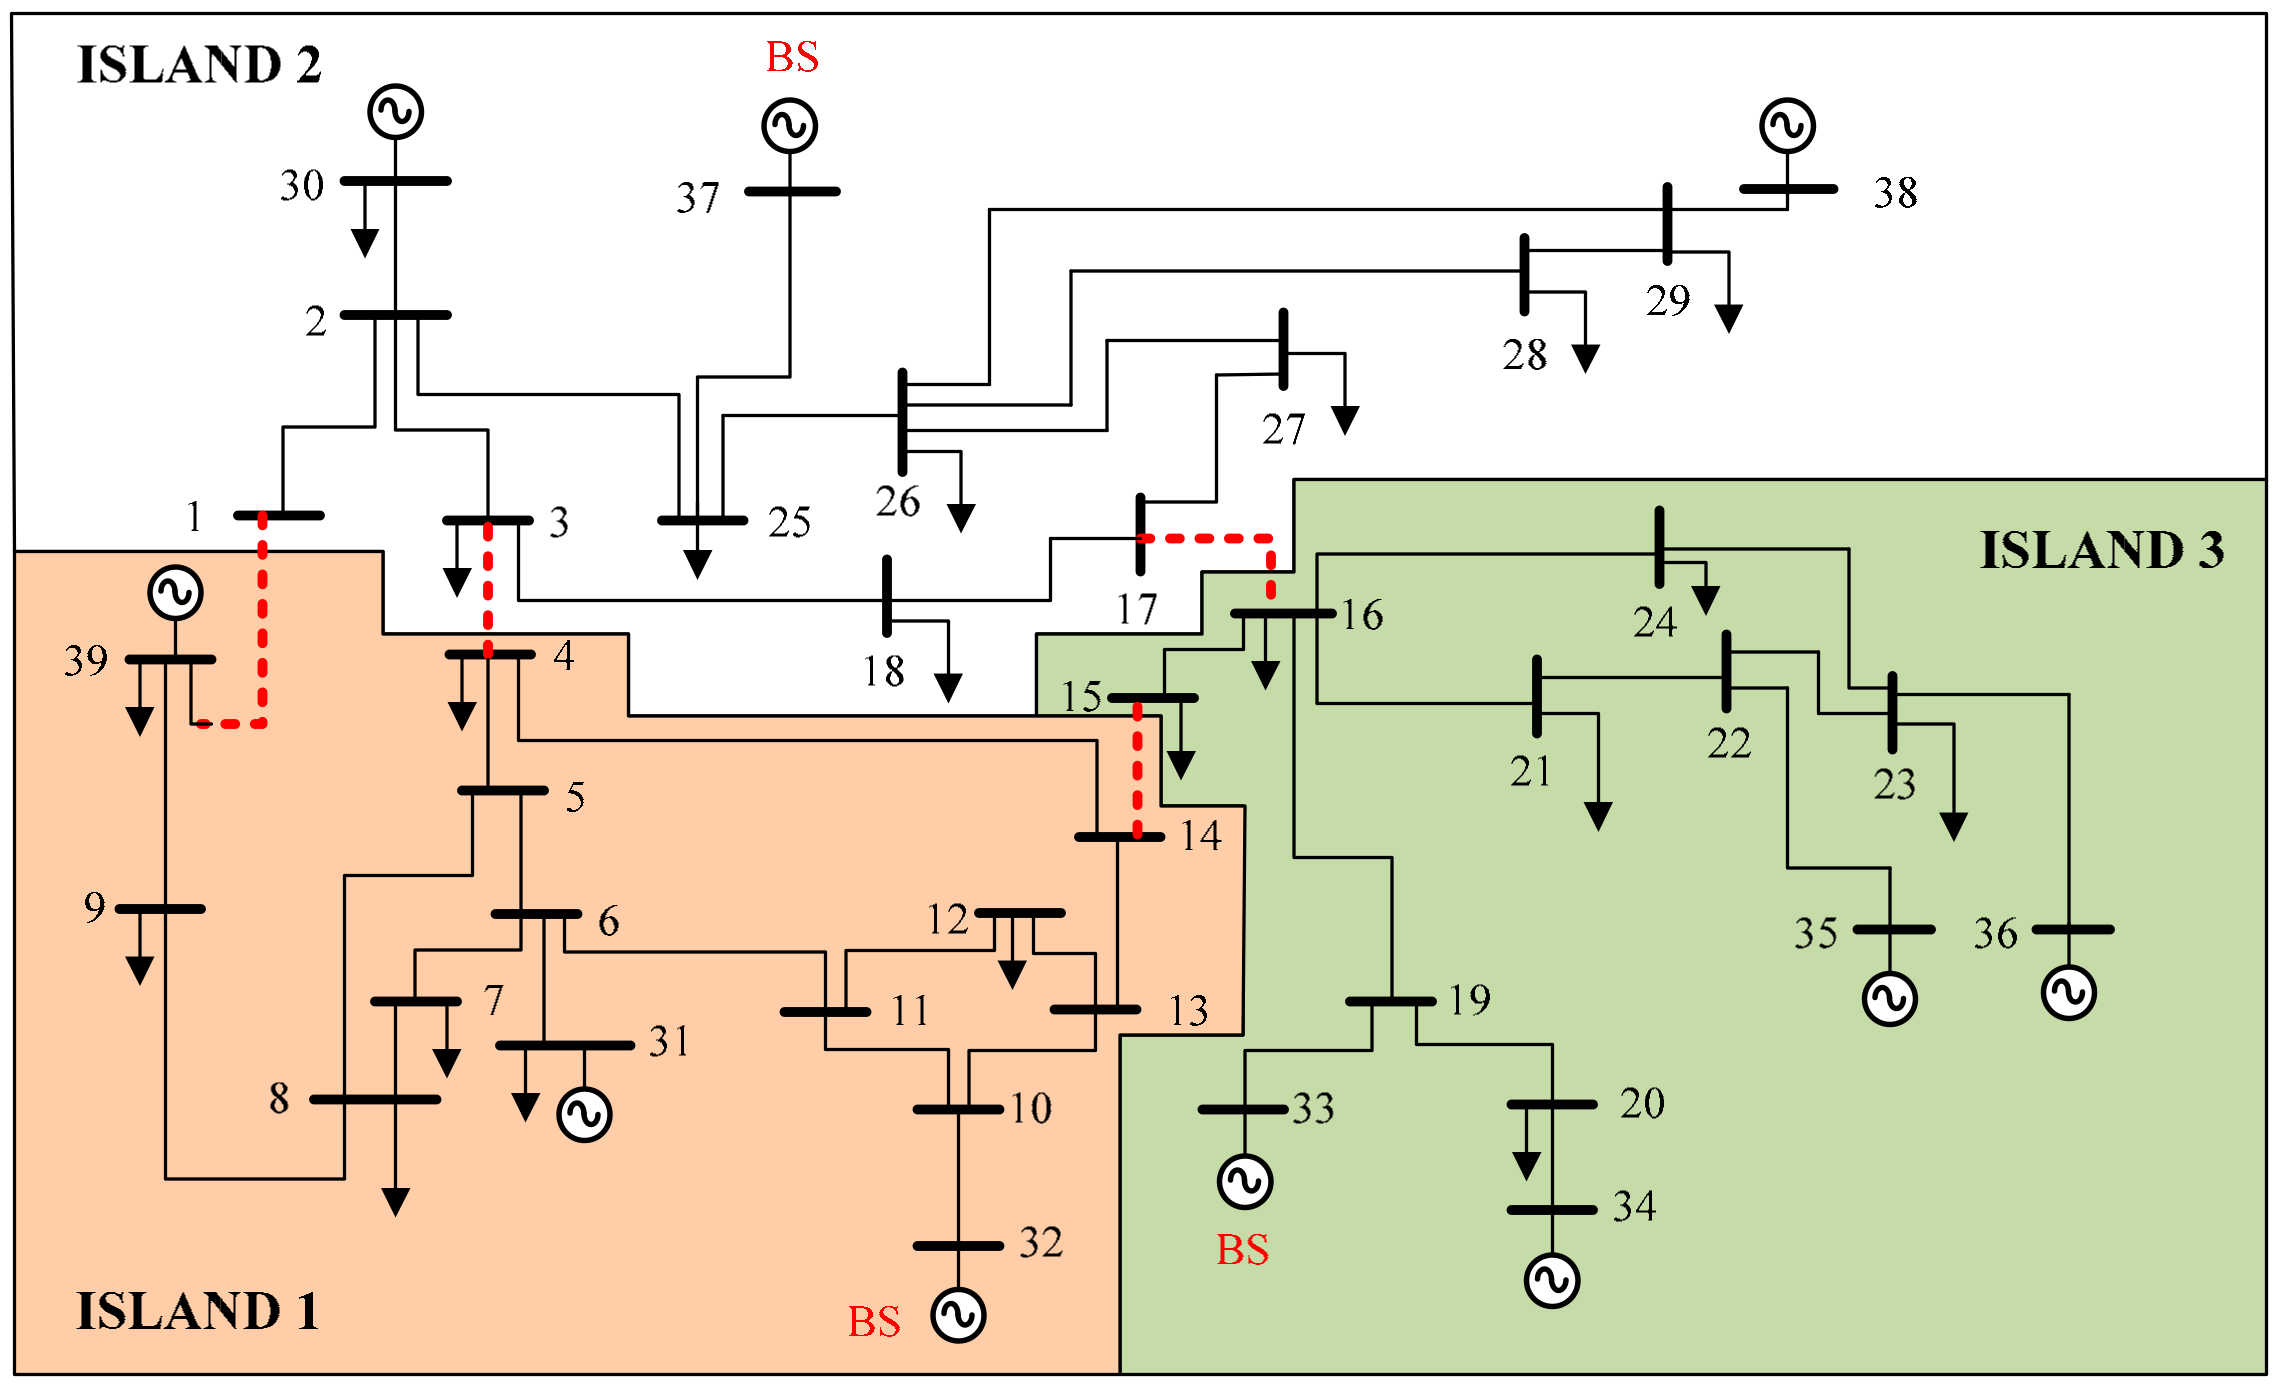
5.1. IEEE 39-Bus Test System
Figure 3 shows the test system of the IEEE 39 bus network. This test system consists of 10 generator units, 21 load buses, and 46 transmission lines. Three BS units are located at buses 32, 33, and 37 [9]. Based on the BS unit, 3 islands can be created. The CLs are located at bus 7, 18, 21, 23 and 26. The rest of the generator units and loads are considered as NBS and non-critical loads, respectively. Transformer feeder is excluded from the possible cut set solution. All feeders except the transformer feeder are assumed to have synchro check relay.
The test case is initially constructed as an undirected graph. The heuristic technique is applied to create sets of generator’s groups based on the total power generation balance and gap of the skeleton size using the k-shortest path method. Initially, the k-shortest path method is used to search for the three shortest paths between the generator units in the test system. The weight of the edges’ connection number and electrical distance are listed to rank the suitable answers. All generator unit buses with shortest connections are shown in Table 2.
The heuristic technique is applied to the graph model of the test case to obtain the generator grouping. By referring to Table 2, the generator unit located at bus 30 will search the first three nearest generator units. They are found at buses 37, 39, and 38. The shortest path connecting to these three generators are through buses (30, 2, 25, 37), (30, 2, 1, 39), and (30, 2, 25, 26, 29, 38), respectively. Generators at buses 37 and 39 are nearest to bus 30, with three edges connecting them. However, as the electrical distance from (30 → 37) is smaller compared to (30 → 39), the selected sequence is from bus 30 to bus 37. The same step will continue with bus 37, and subsequently, until all generator units are sequentially arranged. Finally, the generators are arranged according to the following sequence of buses as 30, 37, 39, 31, 32, 33, 34, 35, 36, and 38. This arrangement gives a rough idea of how to arrange the generators to form islands with approximately similar sizes.
Based on the generator grouping sequence, all the possible groups of generators are searched. The groups are then ranked according to two criteria:
- (a)
- Maximum active power generation balance
- (b)
- Gap of the skeleton size.
The generator grouping is ranked based on criterion (a) and if the values are identical, criterion (b) will be considered. The best five group sets for this test system are presented in Table 3. Group set 1 is ranked first, since it has the lowest maximum power balance, which is 44 MW.
The searching process to obtain the initial cut set for Group Set 1, as shown in Table 3, is as follows:
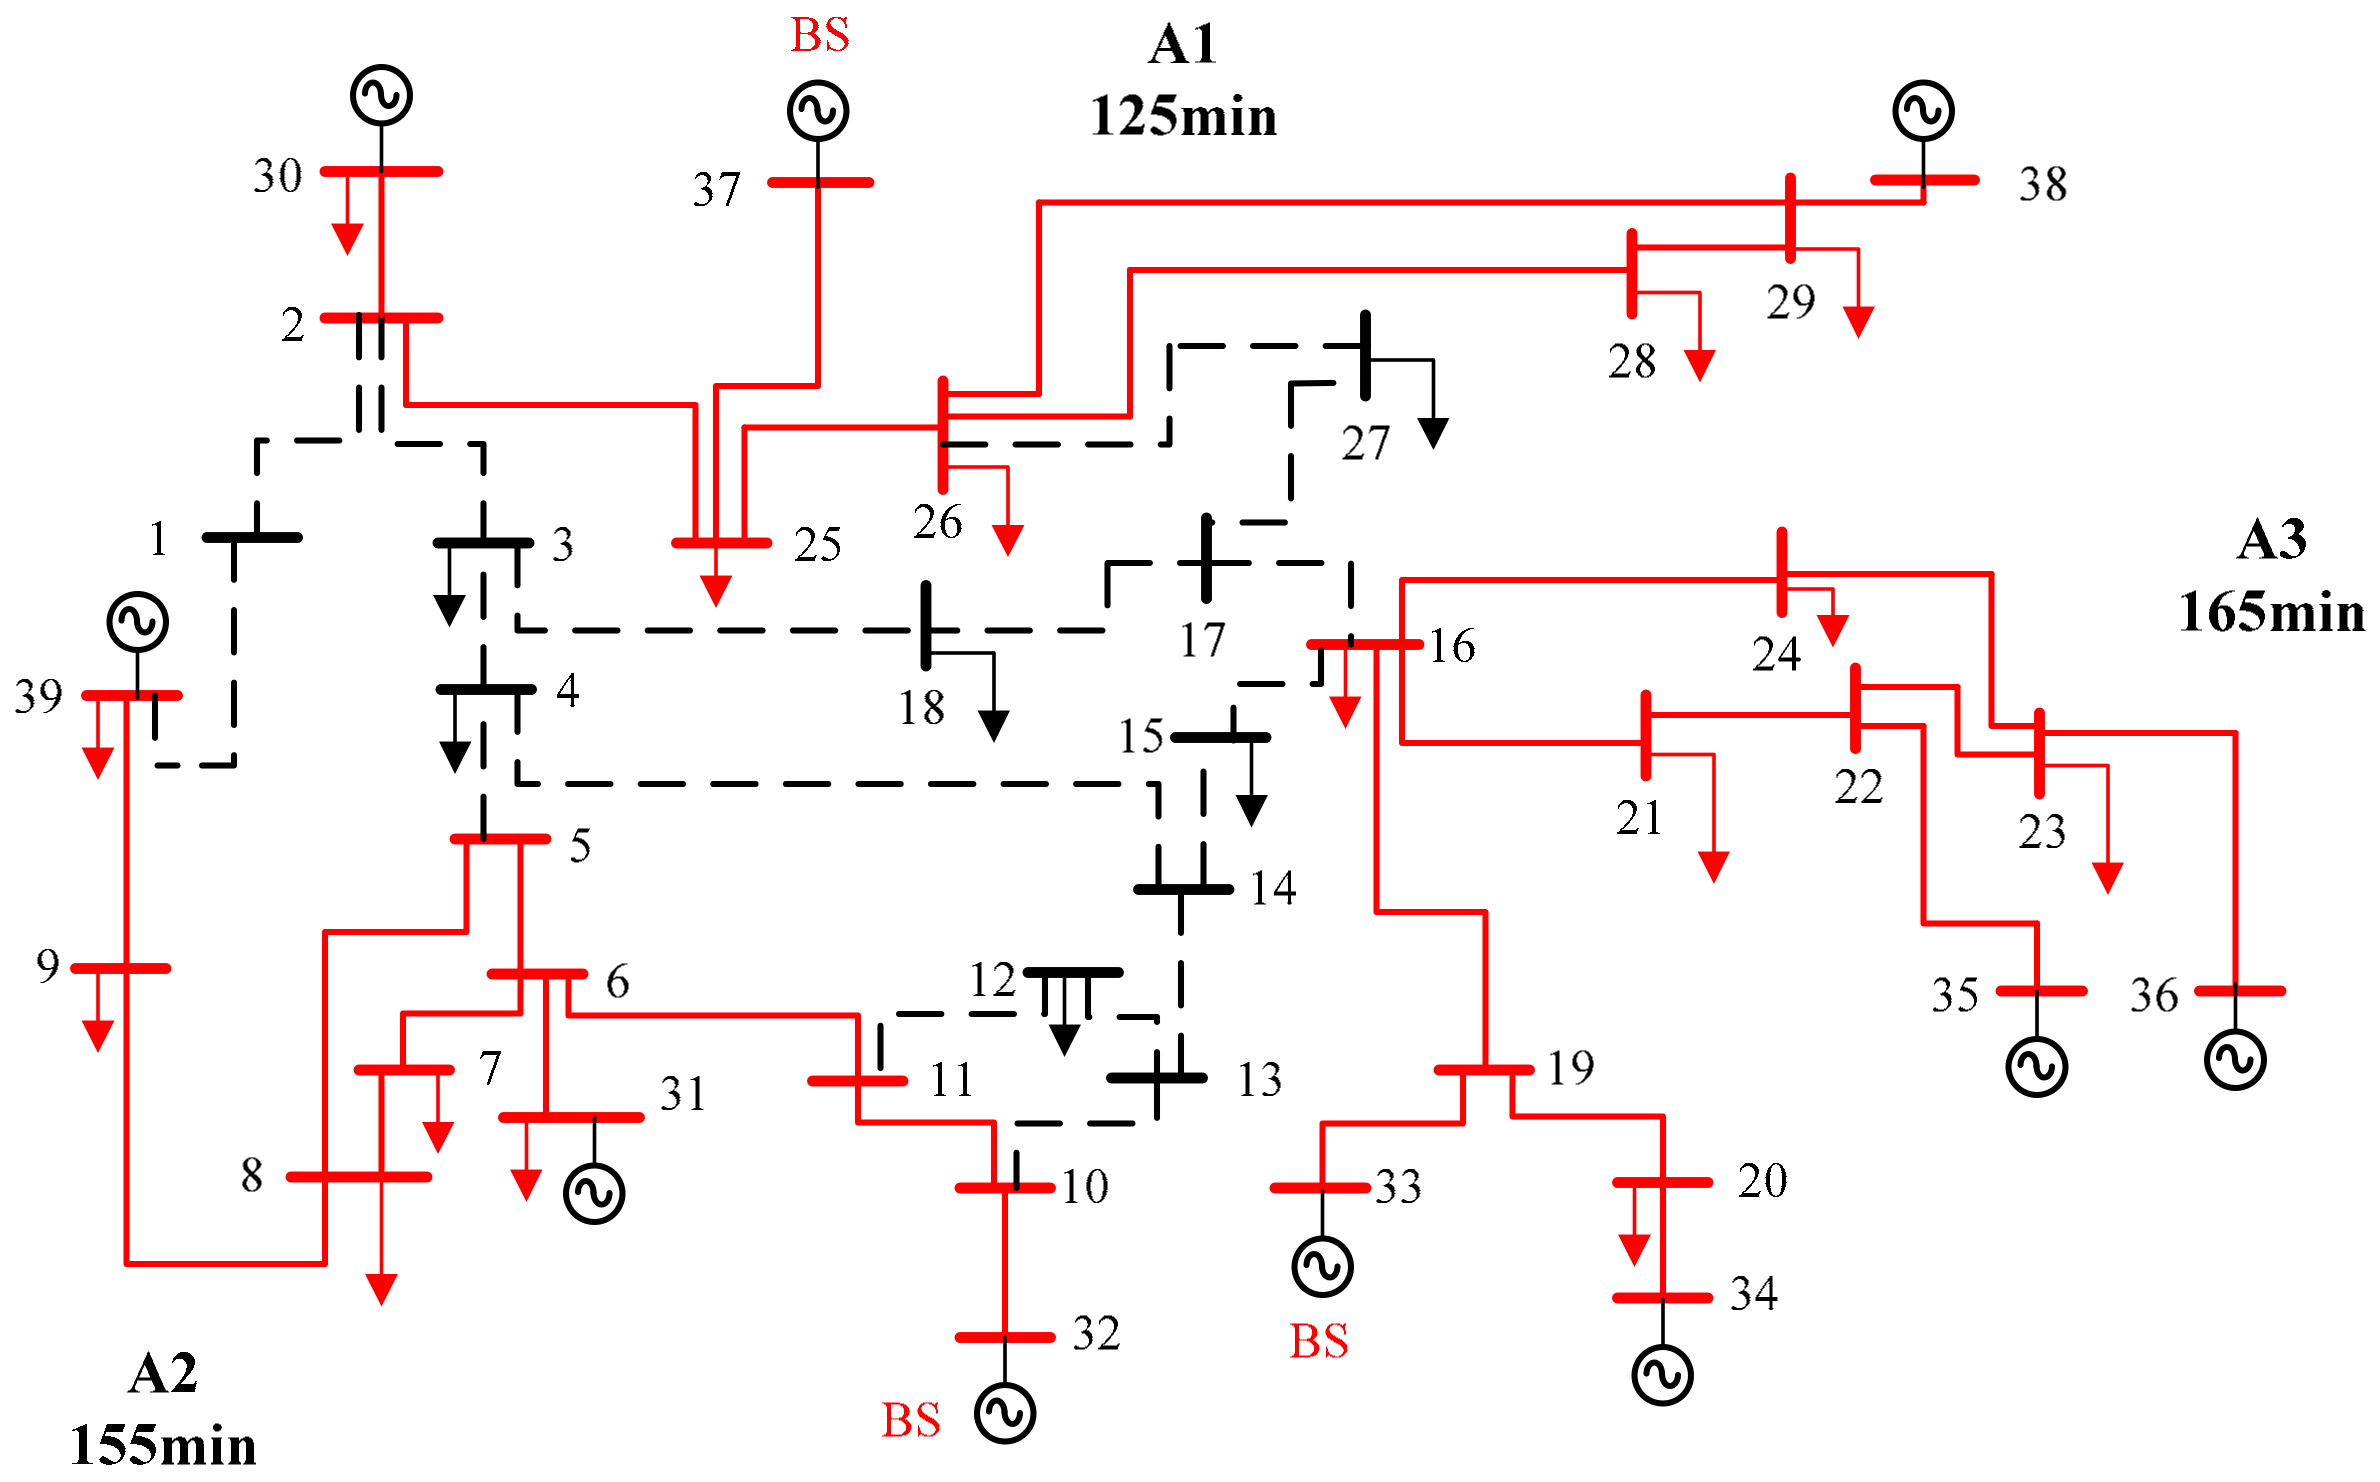
- Figure 4 shows the generator skeleton for group A1, A2, and A3 groups. The buses that connect the generator units are set in the same skeleton group. The load-generation power balance and restorative time of individual power units for each skeleton group are determined. The group that has the lowest restorative time is selected to expand the search for adjacent buses. Comparing the 3 groups, A1 has the lowest energizing time, which is 125 min, while A2 and A3 are 155 min and 165 min, respectively. Thus, A1 is selected first.
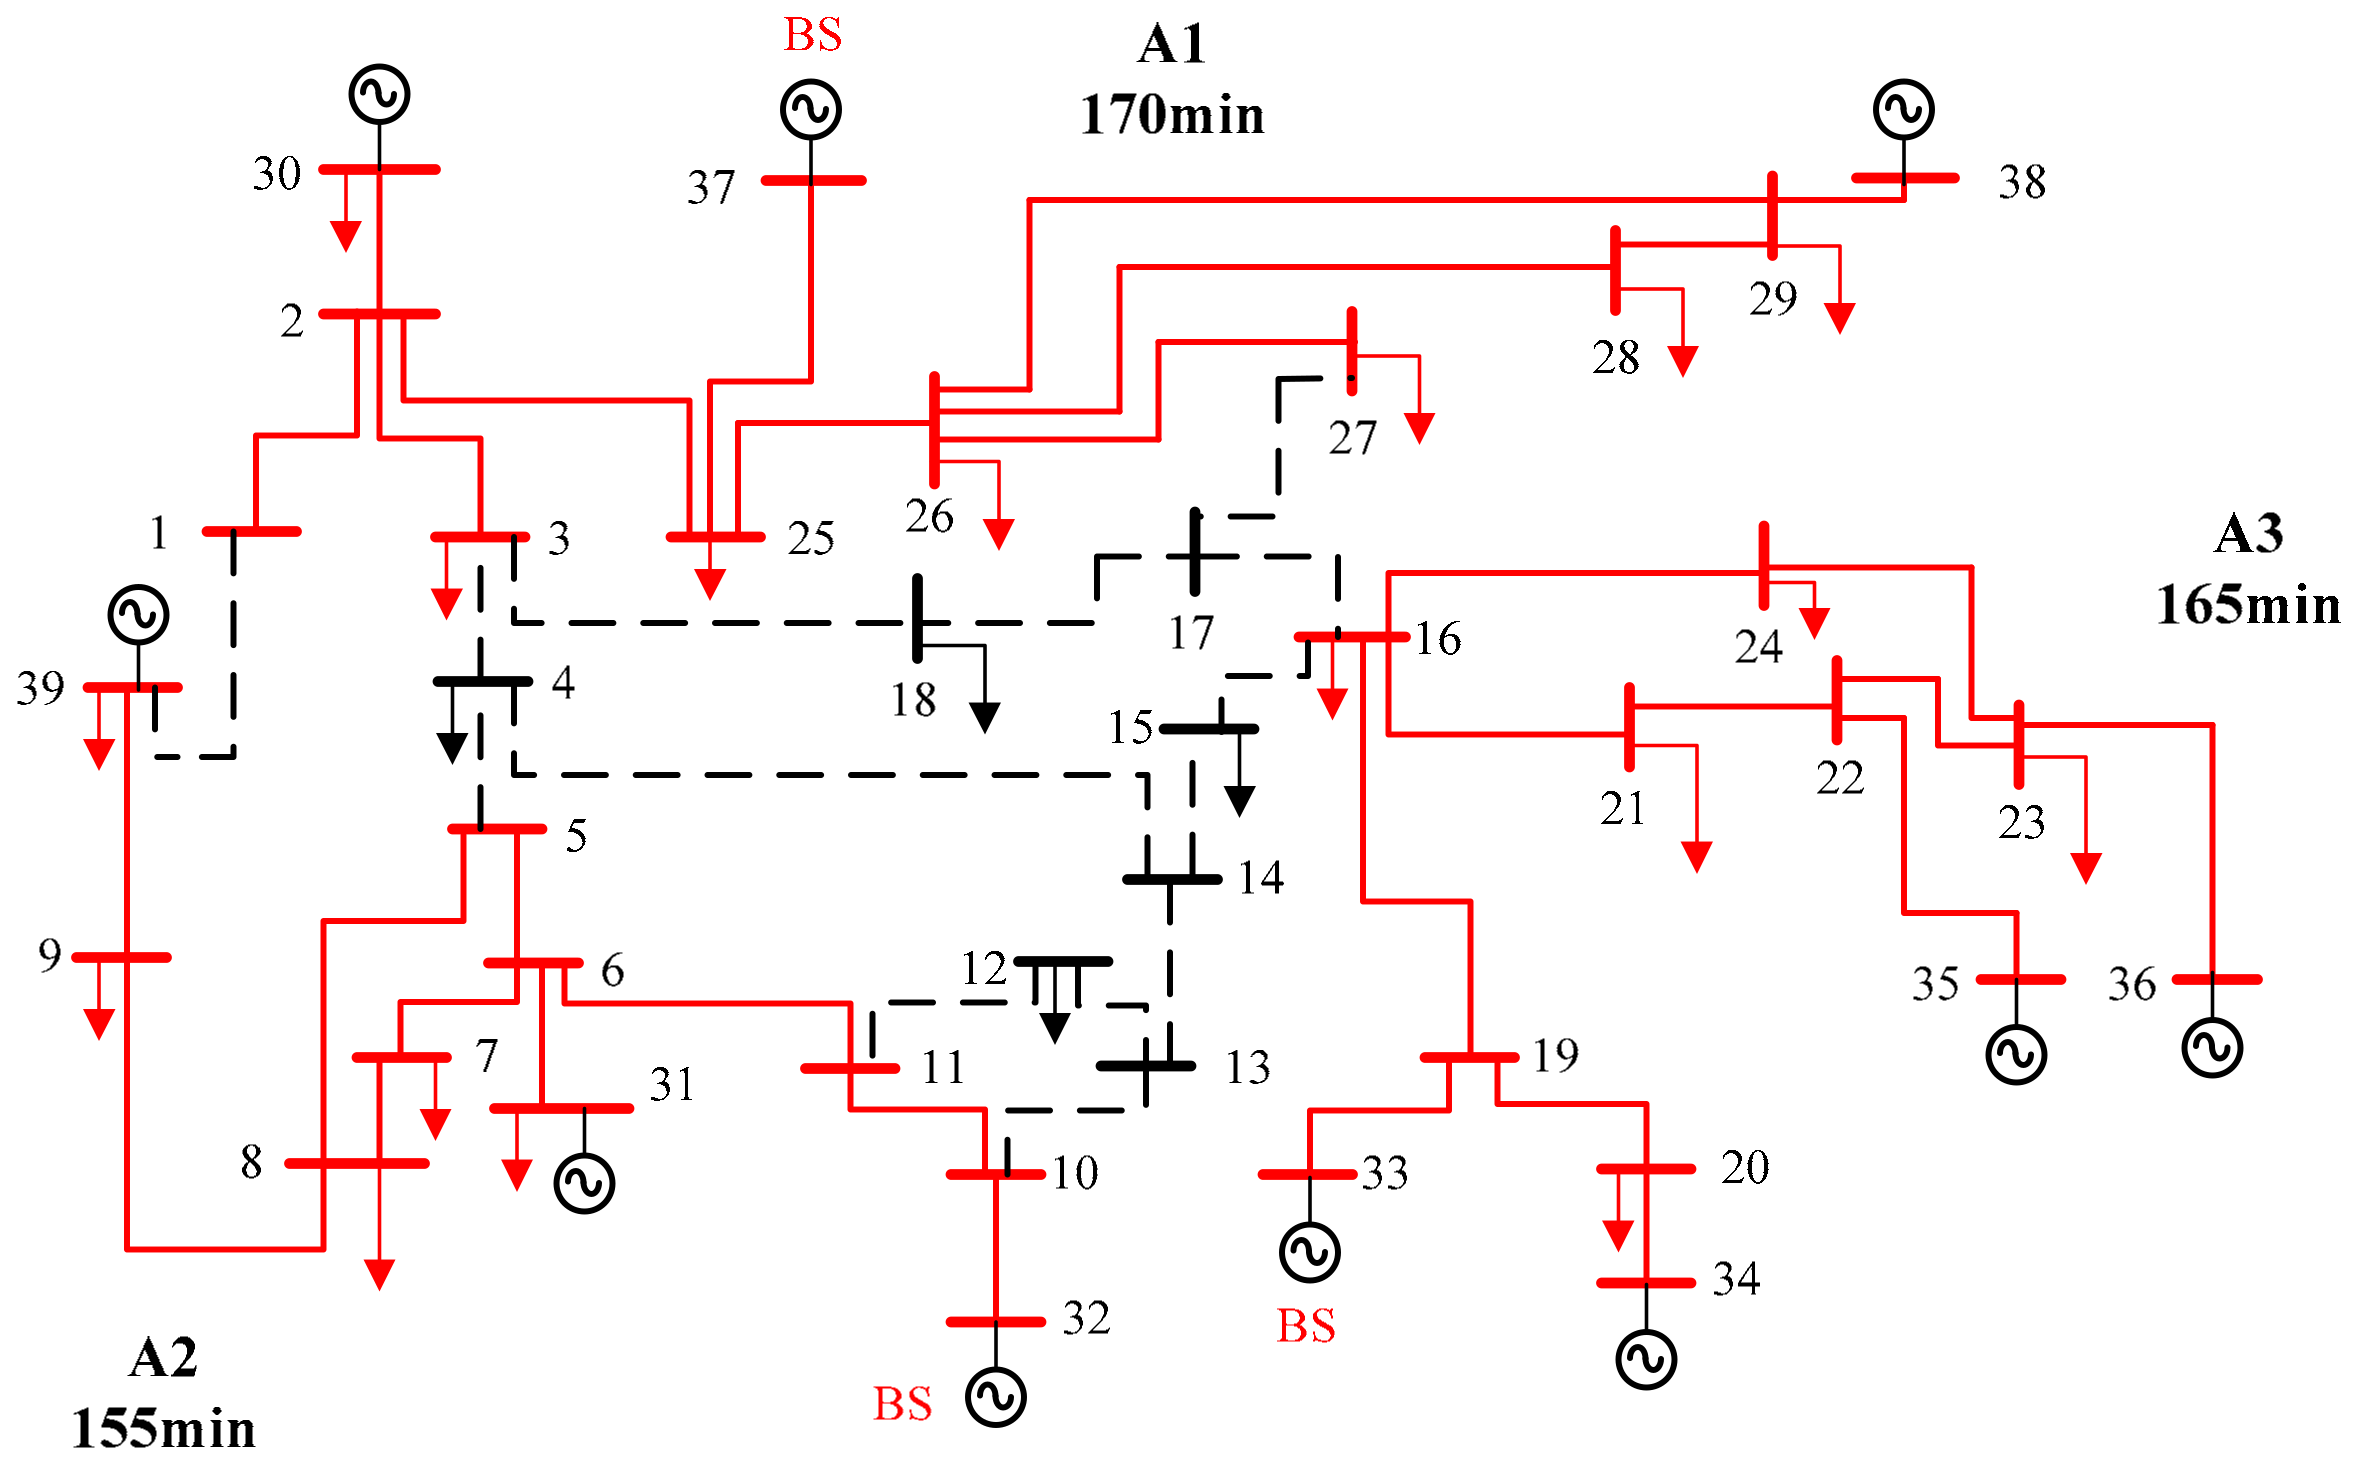
- The search step is carried out by determining the buses that are adjacent to buses in group A1 with one degree of connection. Nodes 1, 3, and 27 are selected and connected to A1, as shown in Figure 5. The energizing time for A1 becomes 170 min.
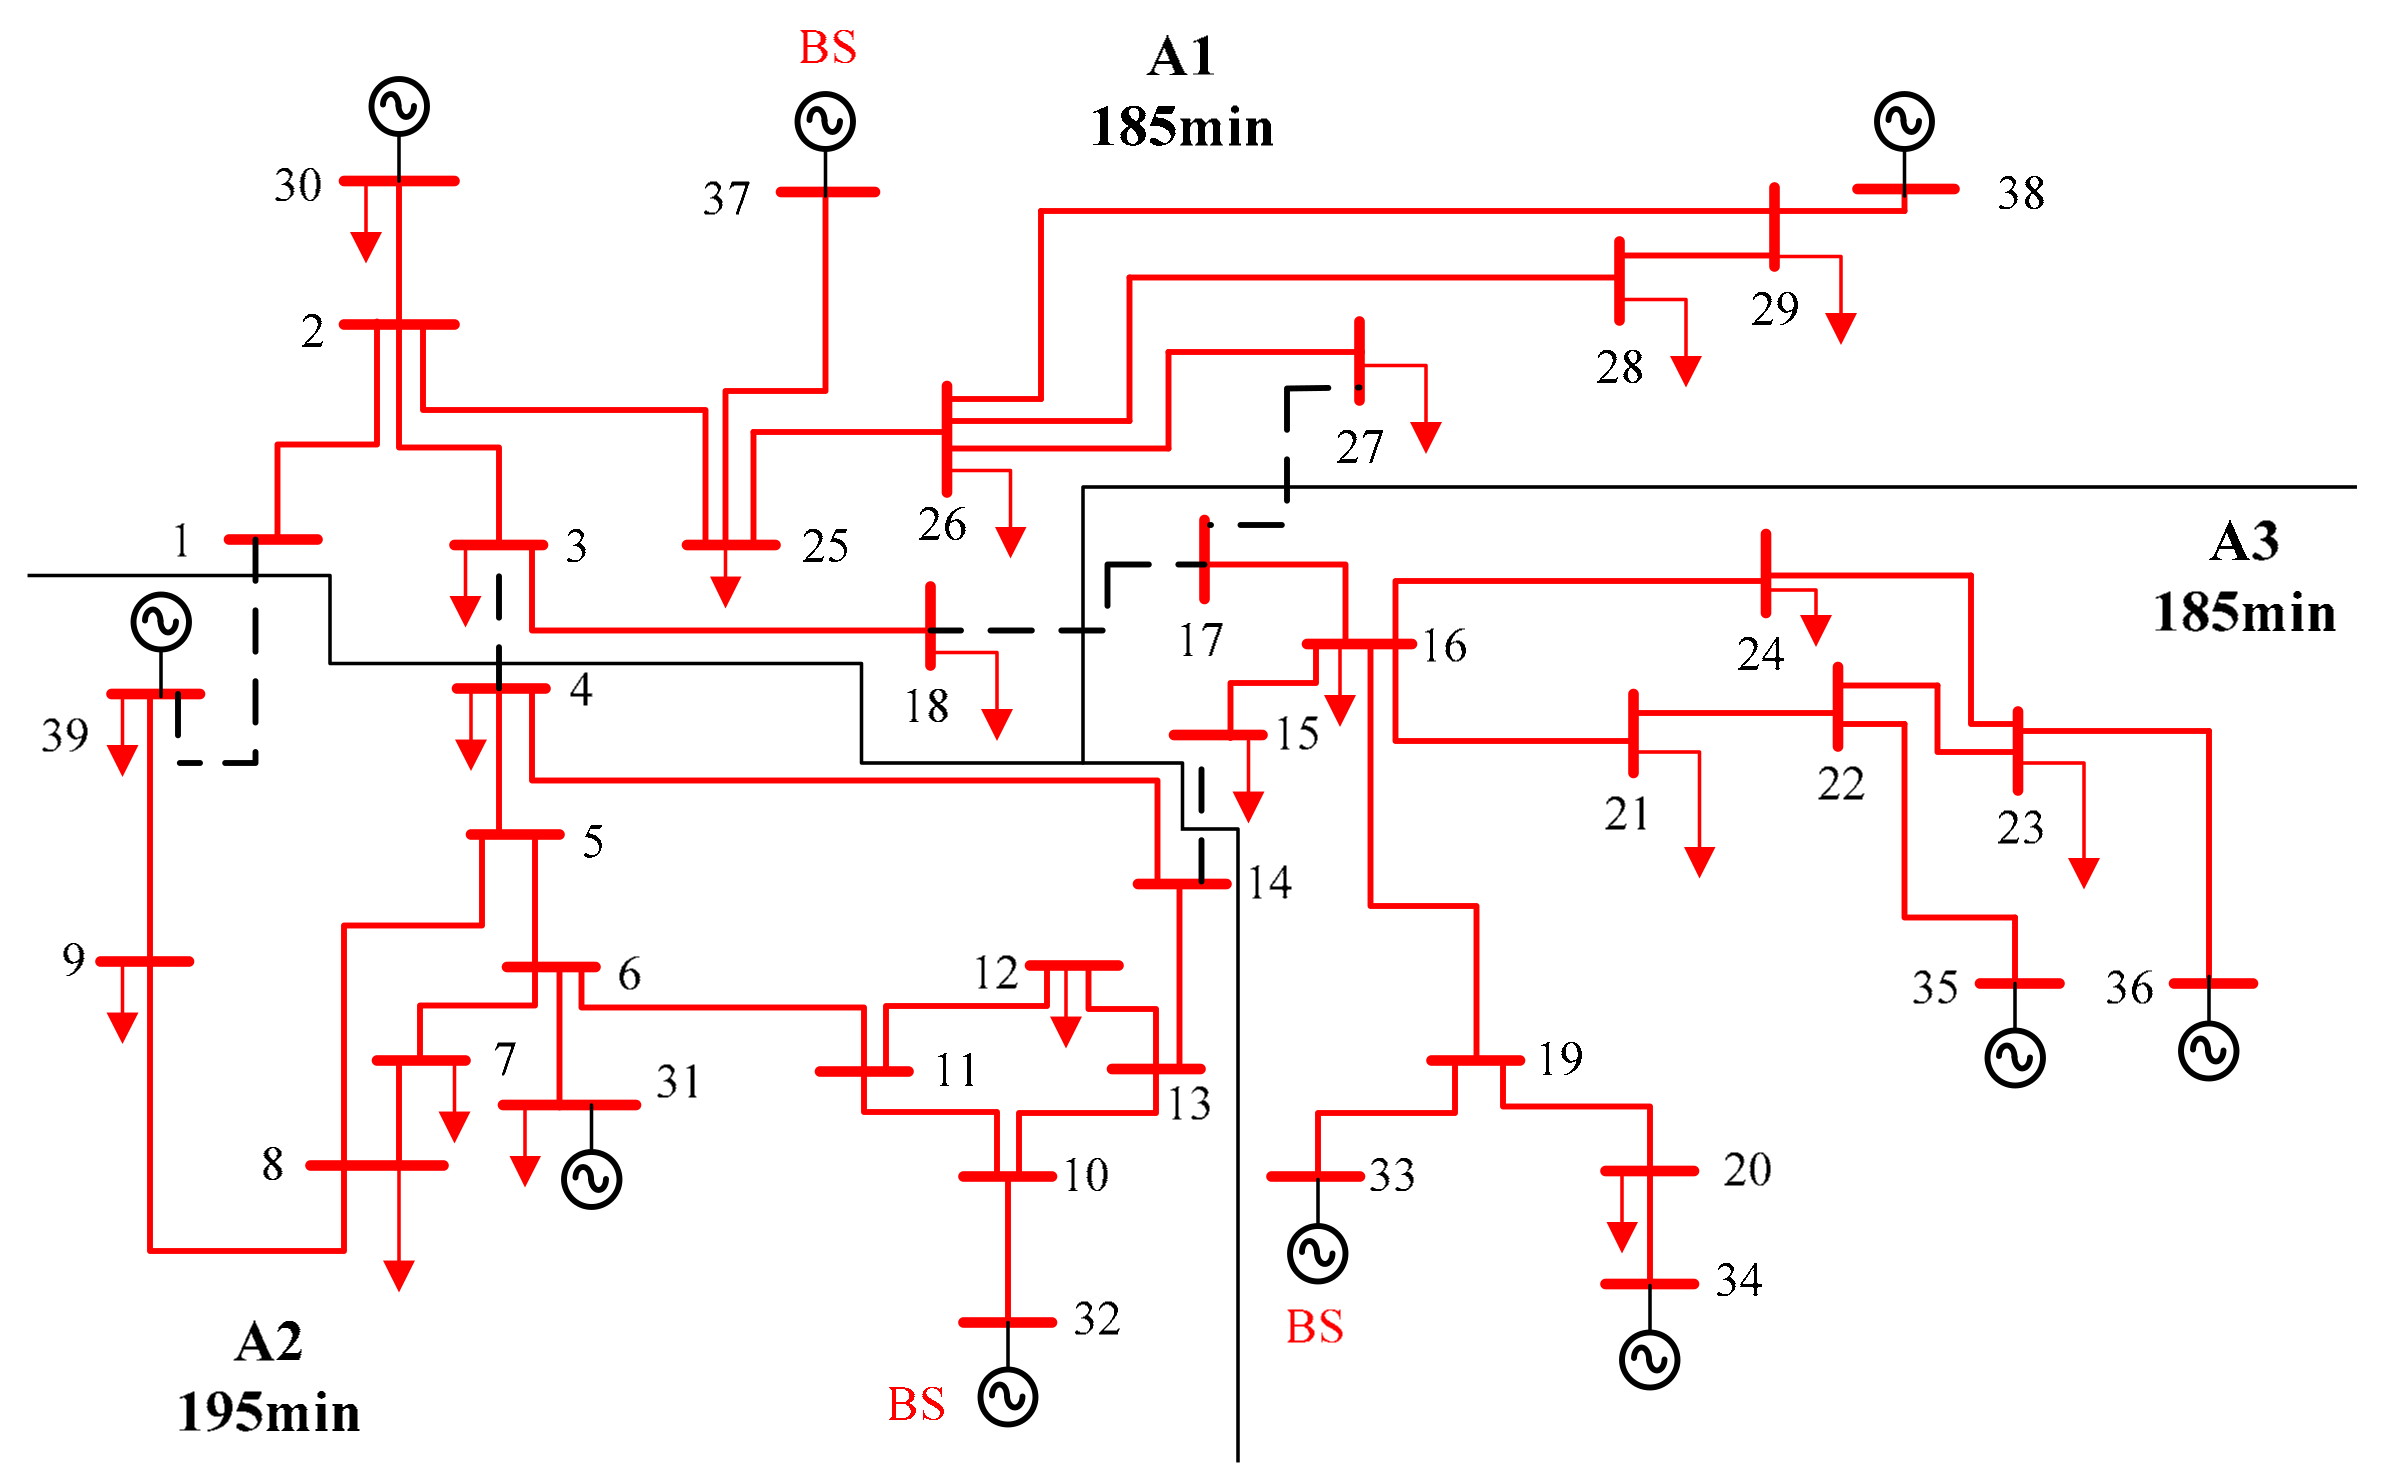
- The process is iterated until all buses are selected and included in their respective groups. The final result of group set 1 and the resultant initial cut set is shown in Figure 6.
The initial cut sets obtained from heuristic technique in Table 3 are used to guide the DABC optimization method to search for the optimum solution. The DABC optimization method for both reenergizing approaches, backbone, and total island network is conducted. For the purpose of comparison with published work, only the result of the second reenergizing approach as shown in Table 4 is discussed in detail.
From Table 4, it is shown that the cut sets 1–39, 3–4, 14–15, and 16–17 (as shown in Figure 3) are the optimum results that have a fitness function of 115. The maximum energizing among the islands is 195 min. The result shows that this is the fastest time in which the islands can be resynchronized. A comparison of the optimal result with the initial cut set for group set 1 in Table 3 (1–39, 3–4, 14–15, 17–18, 17–27) indicates that three edges of the optimal cut sets (1–39, 3–4, 14–15) are similar while one of the edges (16–17) are located at one degree adjacent different from 17–18, 17–27. Thus, it can be concluded that the proposed heuristic technique helps narrow the search space to obtain the final solution. Table 4 also compares the obtained results with [9,24,25]. The results show that the proposed method is able to find similar cut sets with [9,24] and a better cut set 70 min faster compared to [25].
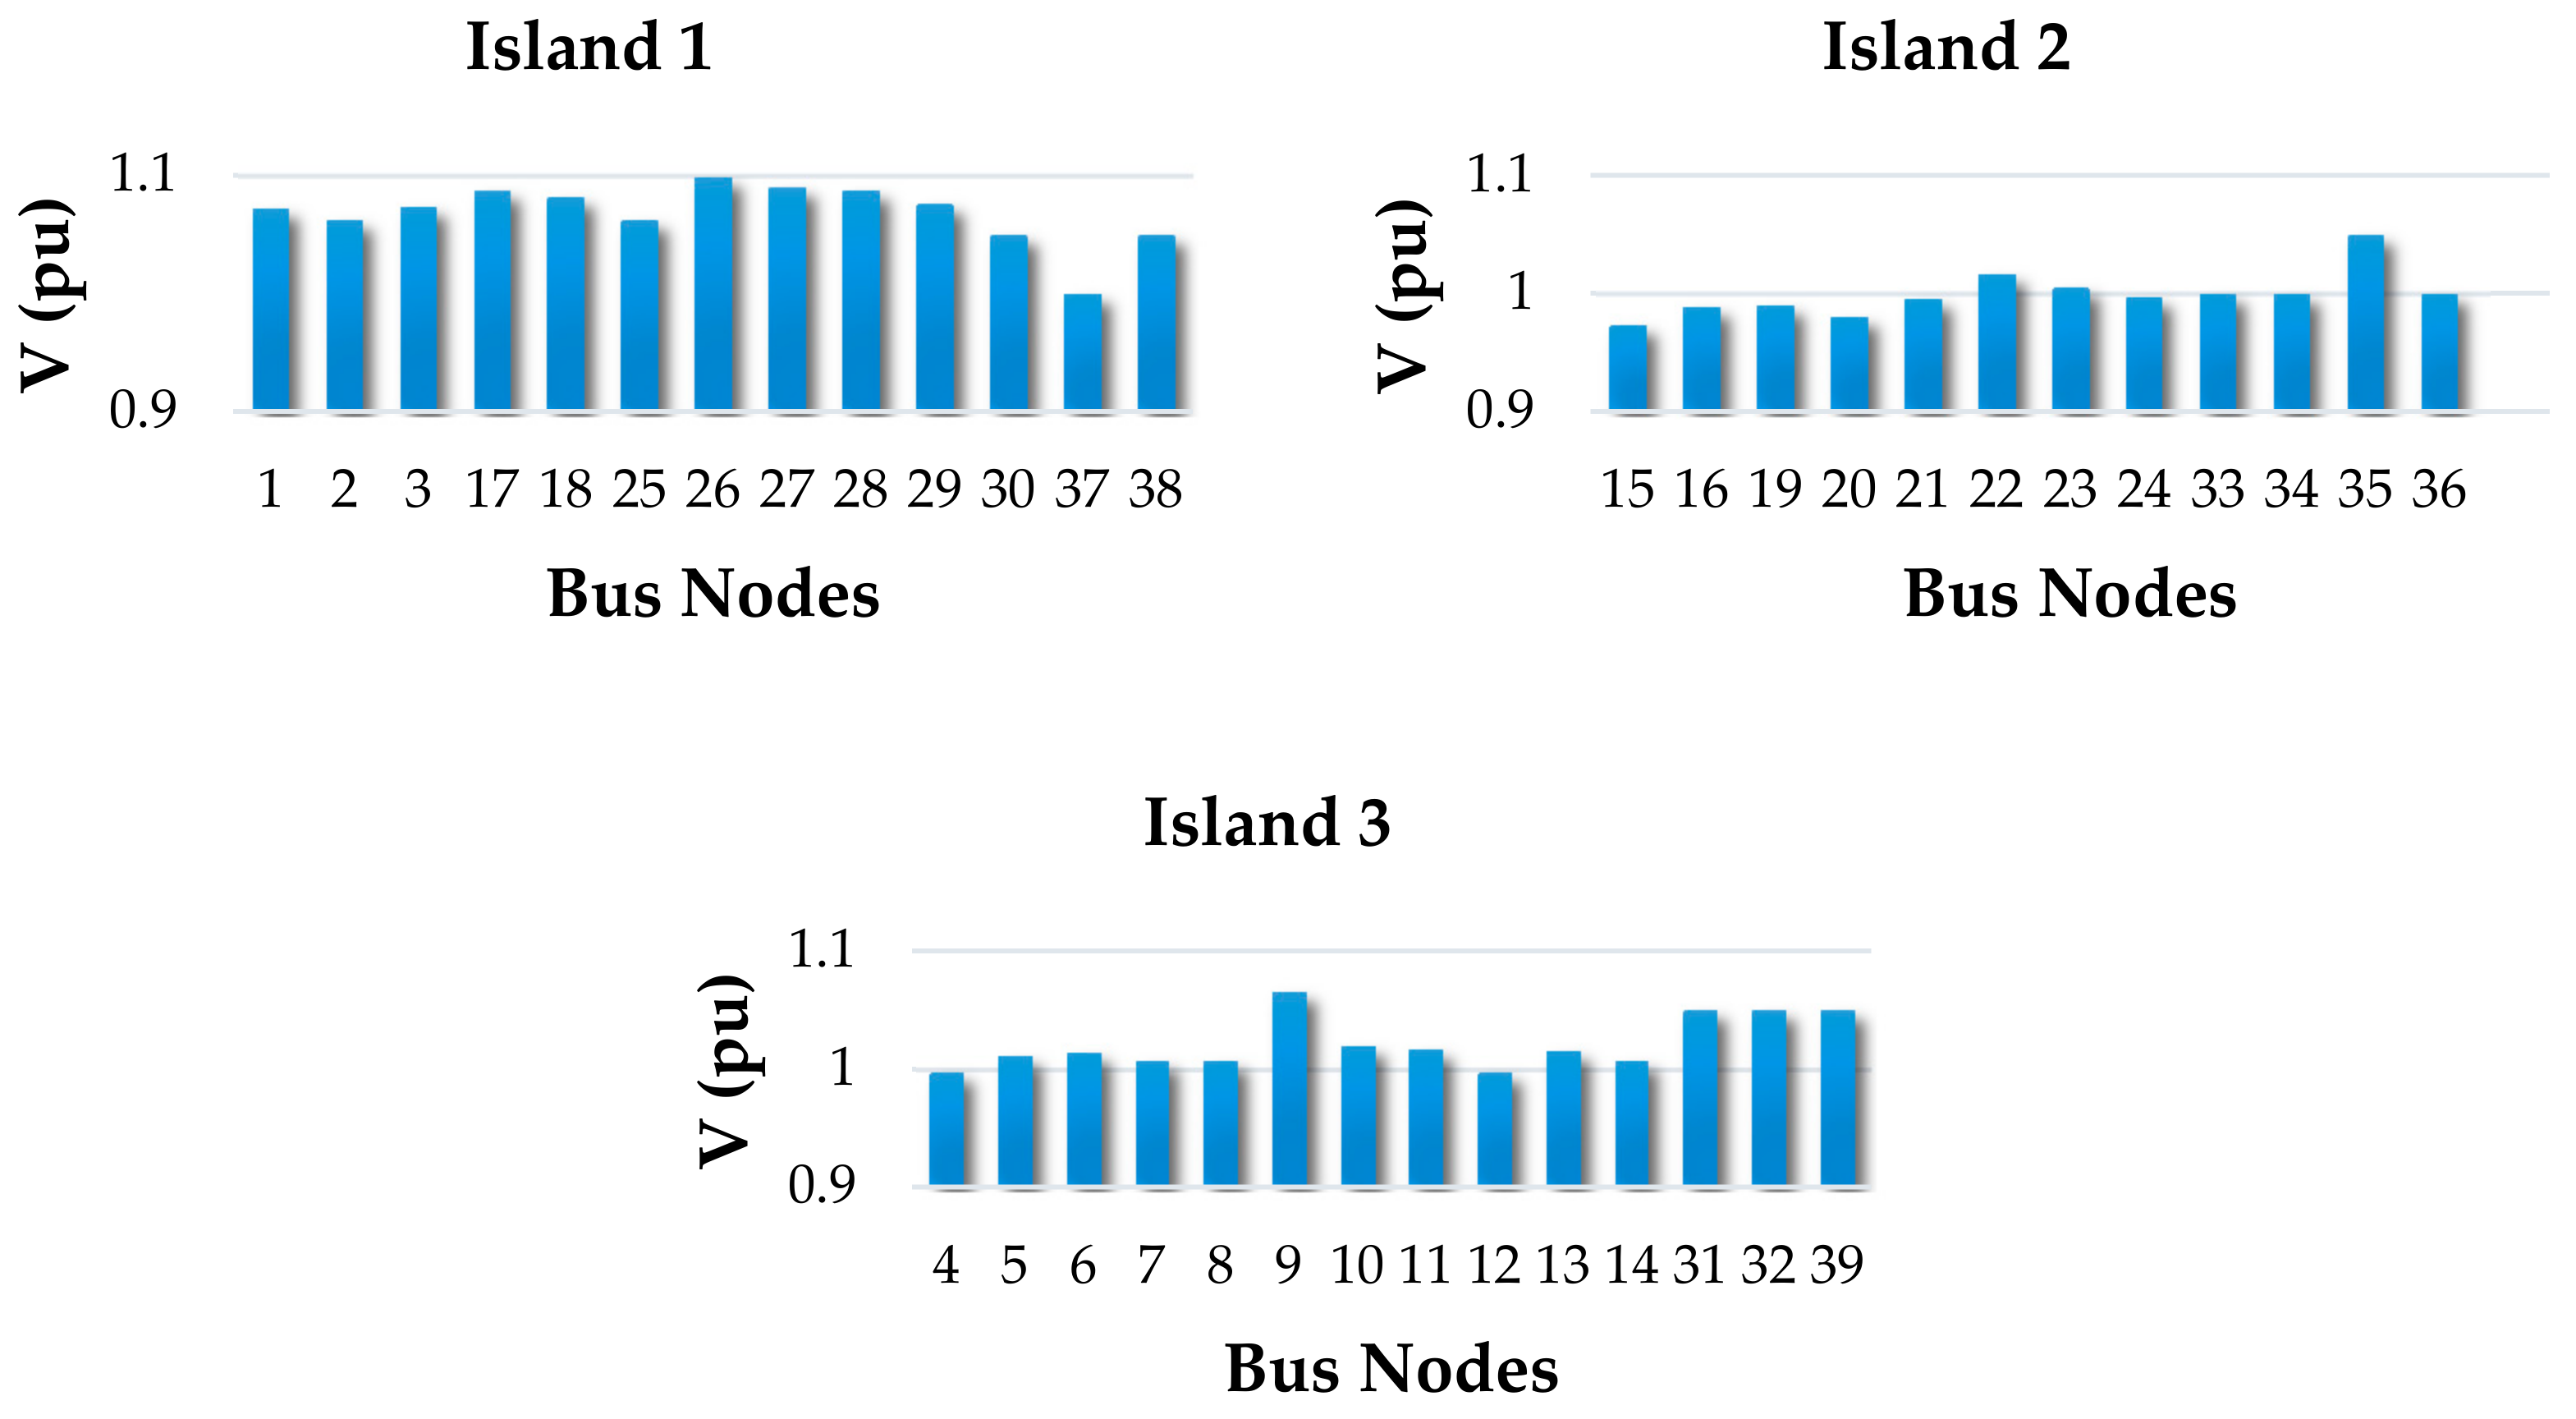
Power flow is conducted on the optimum solution to ensure that the voltage profile of the islanded areas is in the acceptable range of ±5–10% of the rated voltage. The generator bus with the highest generation capacity in each island is selected as the slack bus. The results are presented in Figure 7. The results show that the voltage at each bus in the optimal islands falls within 0.9 p.u. to 1.1 p.u.
5.2. IEEE 118-Bus Test System
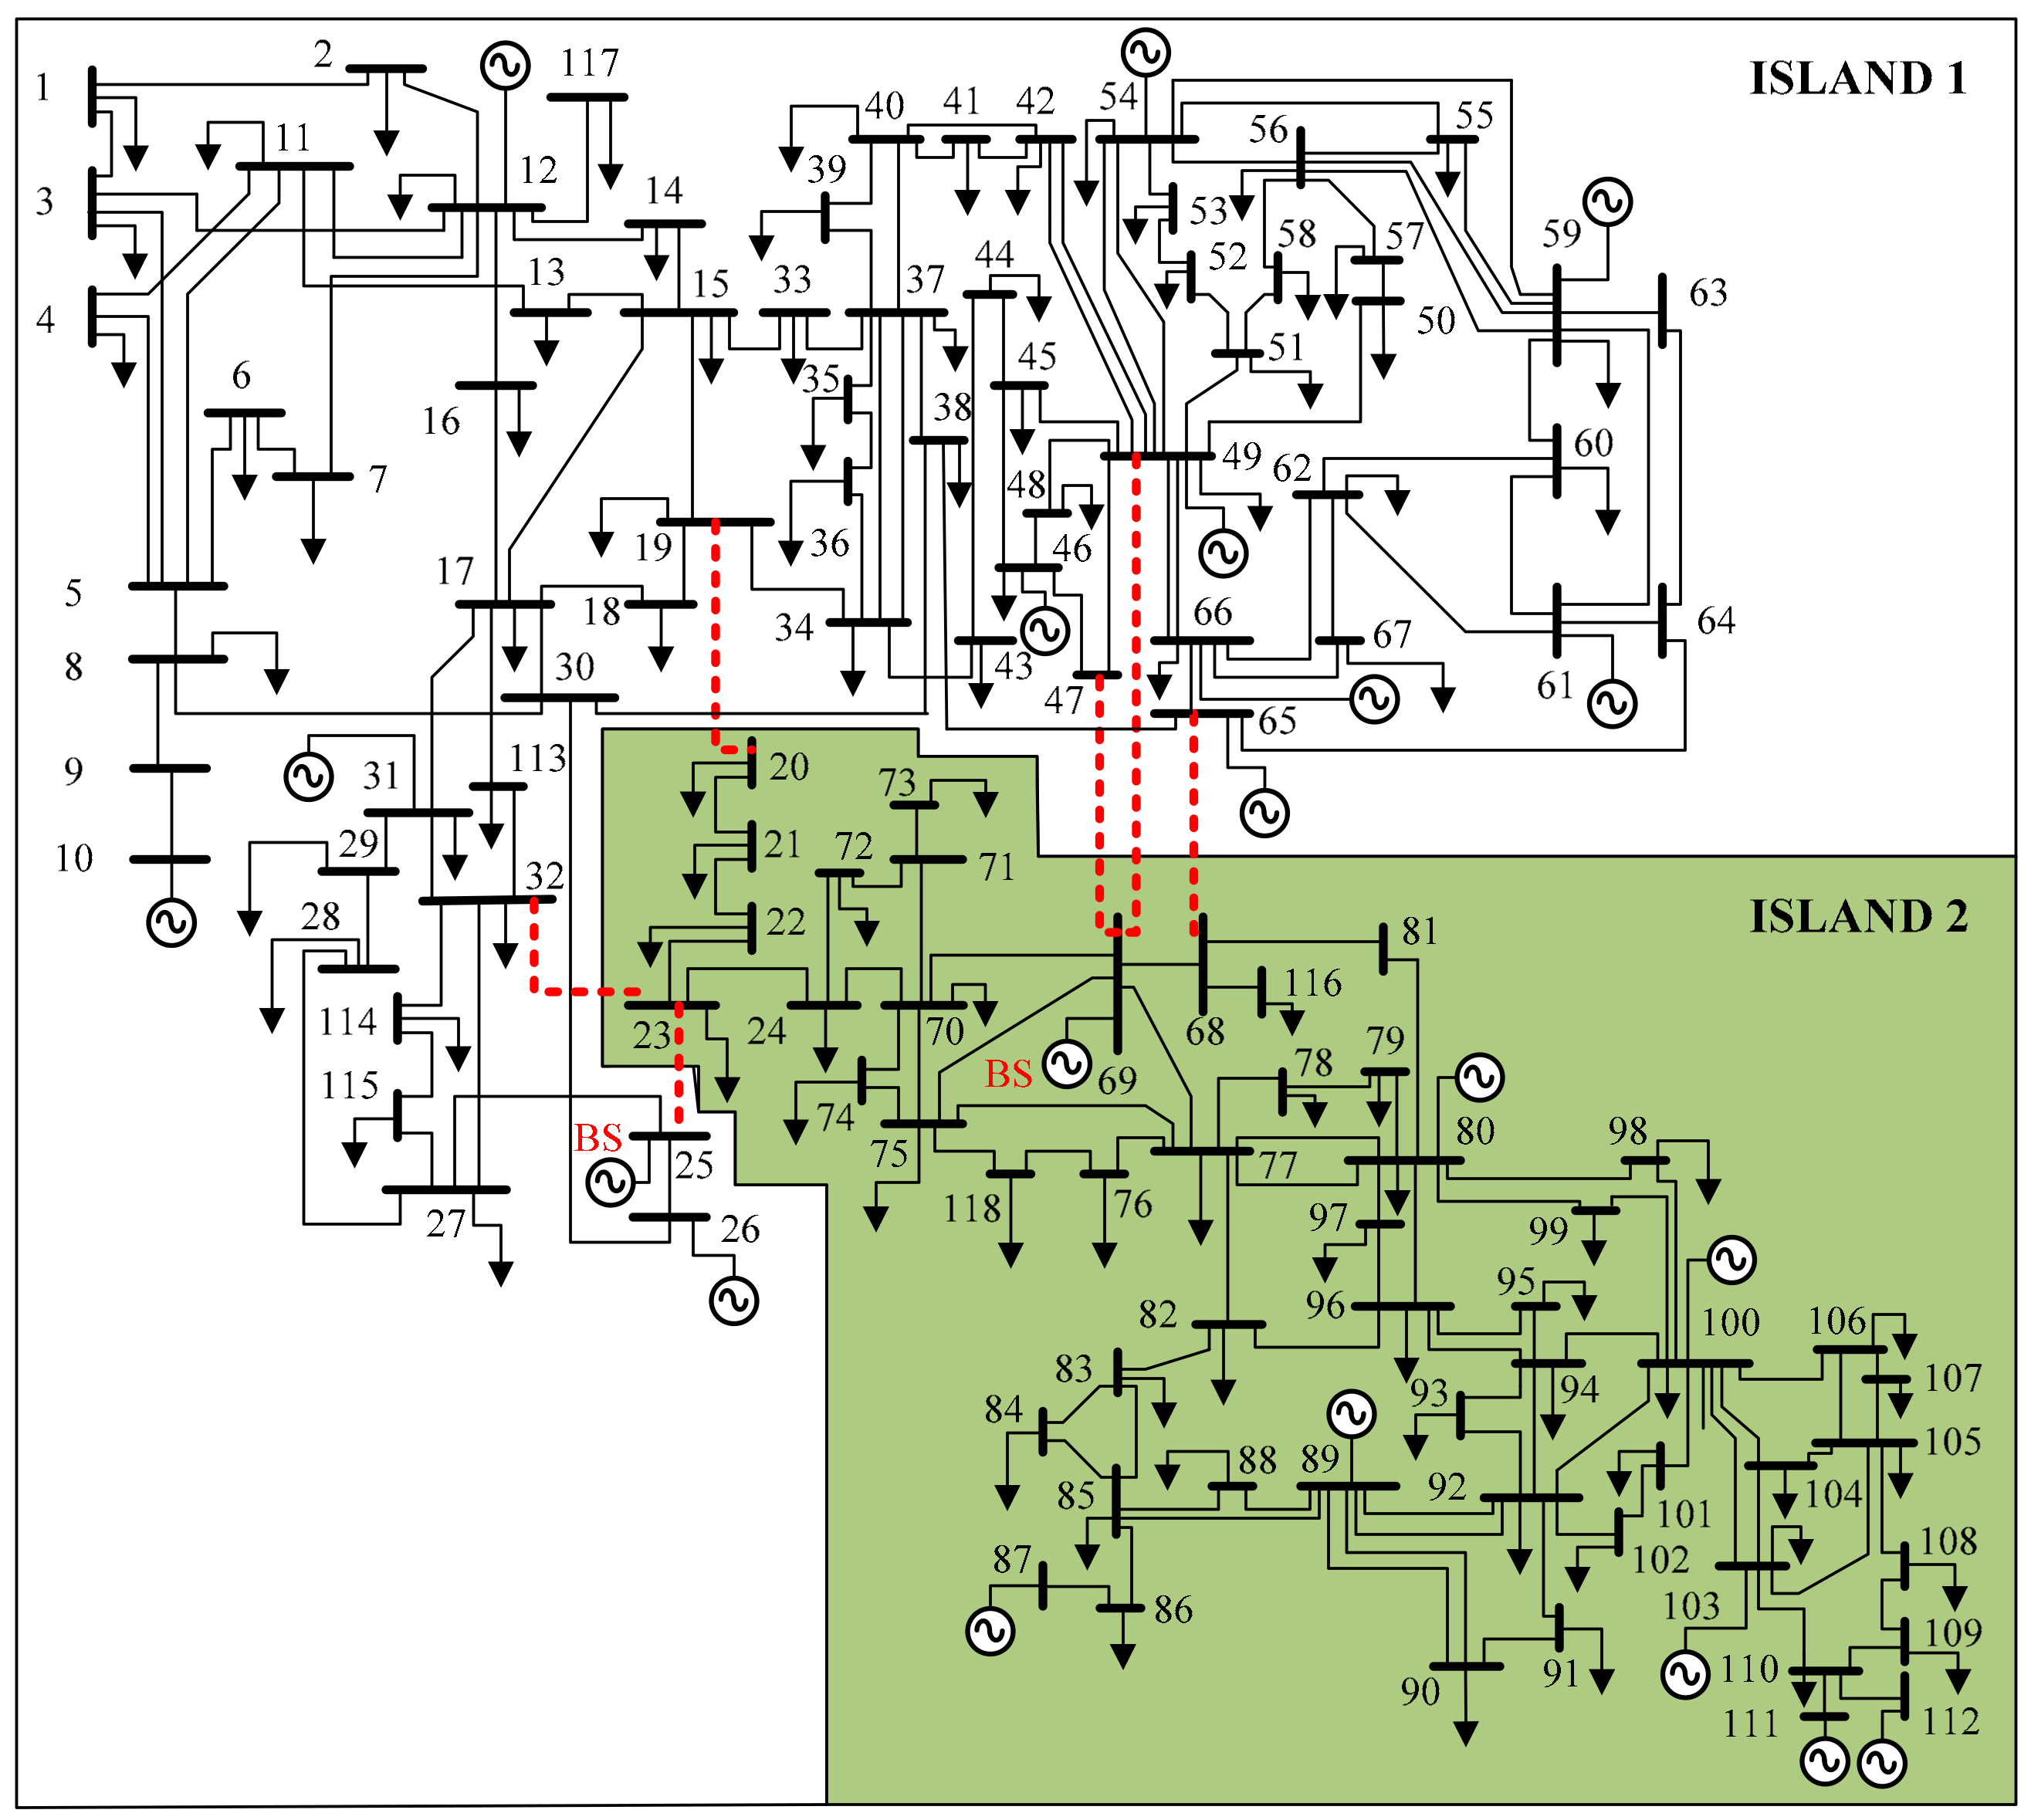
The proposed strategy is applied to the IEEE 118 bus system. The system has 19 generator units, 99 load buses, and 186 transmission lines as shown in Figure 8. Two BS units’ availability is assumed as in [7] at buses 25 & 69. Other generators are defined as NBS units. The critical loads (CLs) are located at buses 15, 18, 23, 27, 49, 54, 59, 80, 90, & 92, as in [7].
For comparison with published work in [7,14,26], similar conditions were applied, where only the time of the backbone (first reenergizing approach) energizing was considered. The results of the proposed methods are shown in Table 5 and Table 6. Referring to Table 6, the cut sets using DABC are 19–20, 23–25, 23–32, 47–69, 49–69, and 65–68 with a fitness function of 265. The two islands are shown in Figure 8. Similar to the 39 bus case, the optimal edges are compared with the initial cut set of the first group set from heuristic result in Table 5 (22–23, 23–25, 23–32, 44–45, 47–49, 45–49, 48–49, 65–68, 49–69). The optimal edges contain four of the initial edges (23–25, 23–32, 49–69 65–68), with two of the edges located at one and three degree adjacent different buses (47–69) and (19–20), respectively. The optimum solution is found with three fewer edges compared to the initial solution.
The energizing time for the backbone network of each island is compared with published results from previous studies [7,14,26], as shown in Table 6. The final cut set from other studies is taken, and the energizing time algorithm is calculated and compared. Even though the answer shows that the proposed method contains more edges (6) in the cut set compared to other studies [7,14] and is similar to [26], which contains 5, 5 and 6 edges in the cut set, the system resynchronization time of the proposed method is the lowest. The time for the biggest island determines the system resynchronization start time, and in this case, the proposed study reported an energizing time (360 min) that is 15 min lower compared to literatures (375 min) in [7,14,26]. The proposed method has the advantage of flexibility to search for the best islands in a larger system.
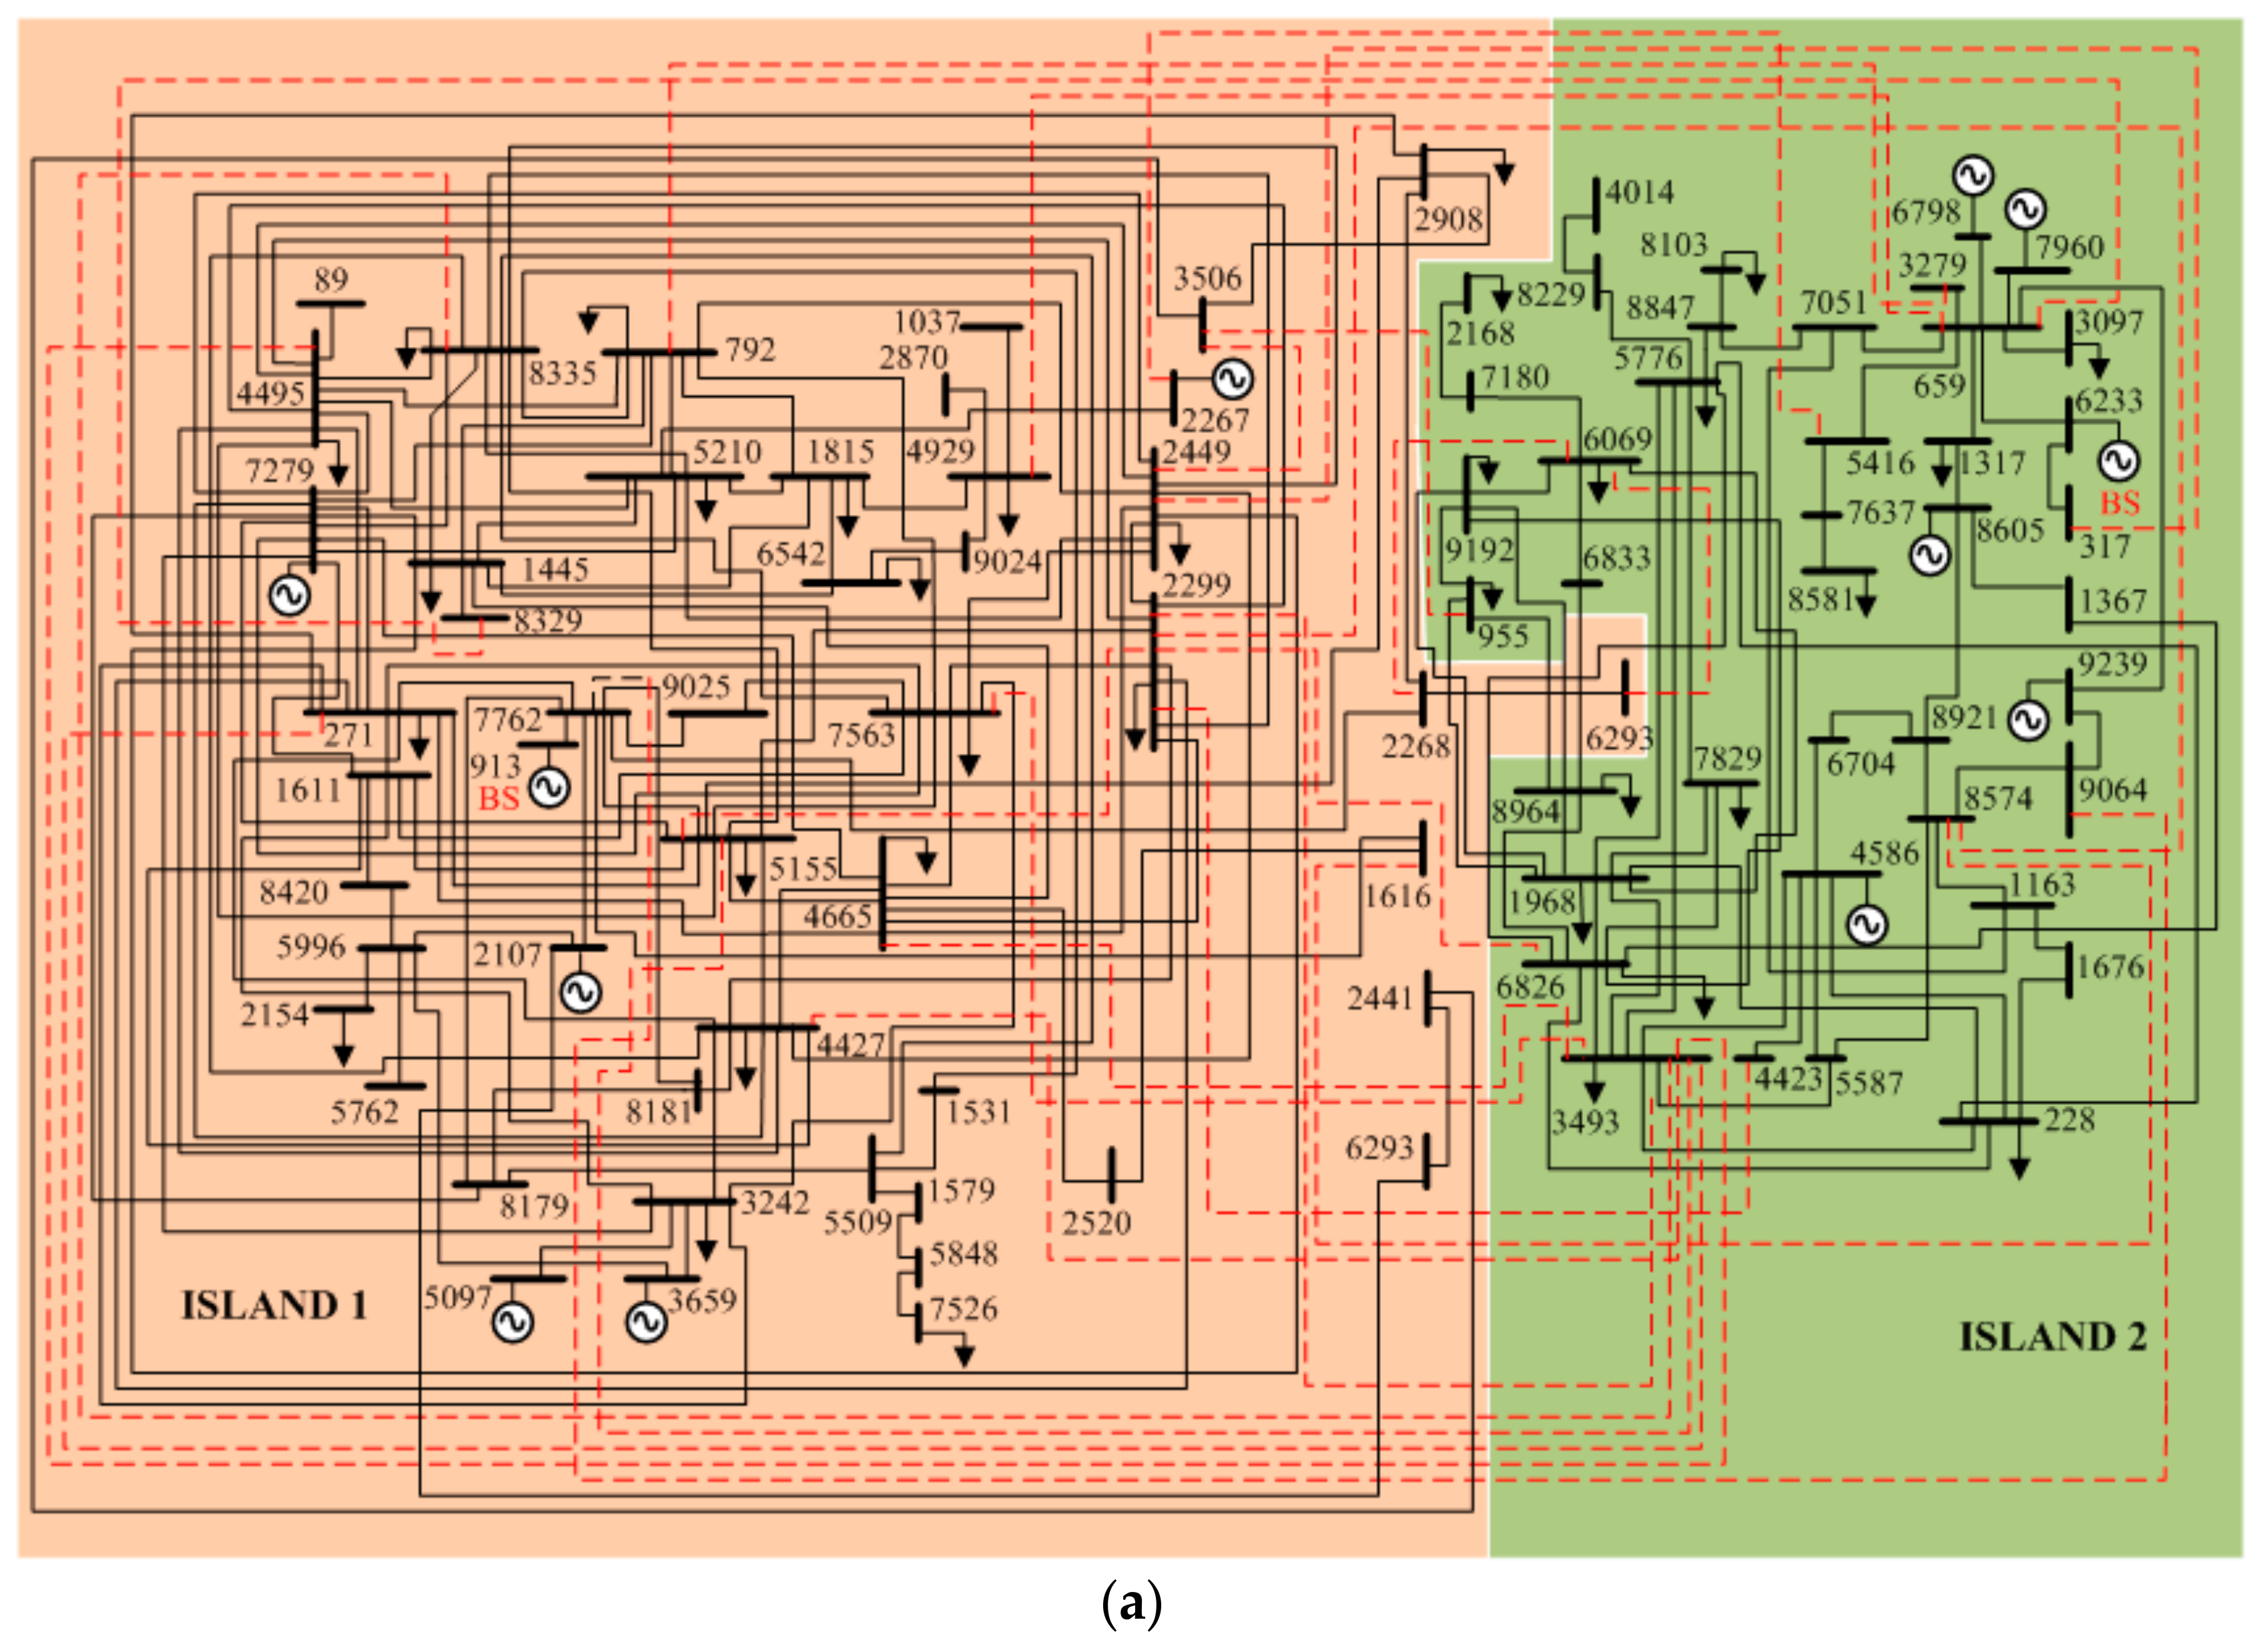
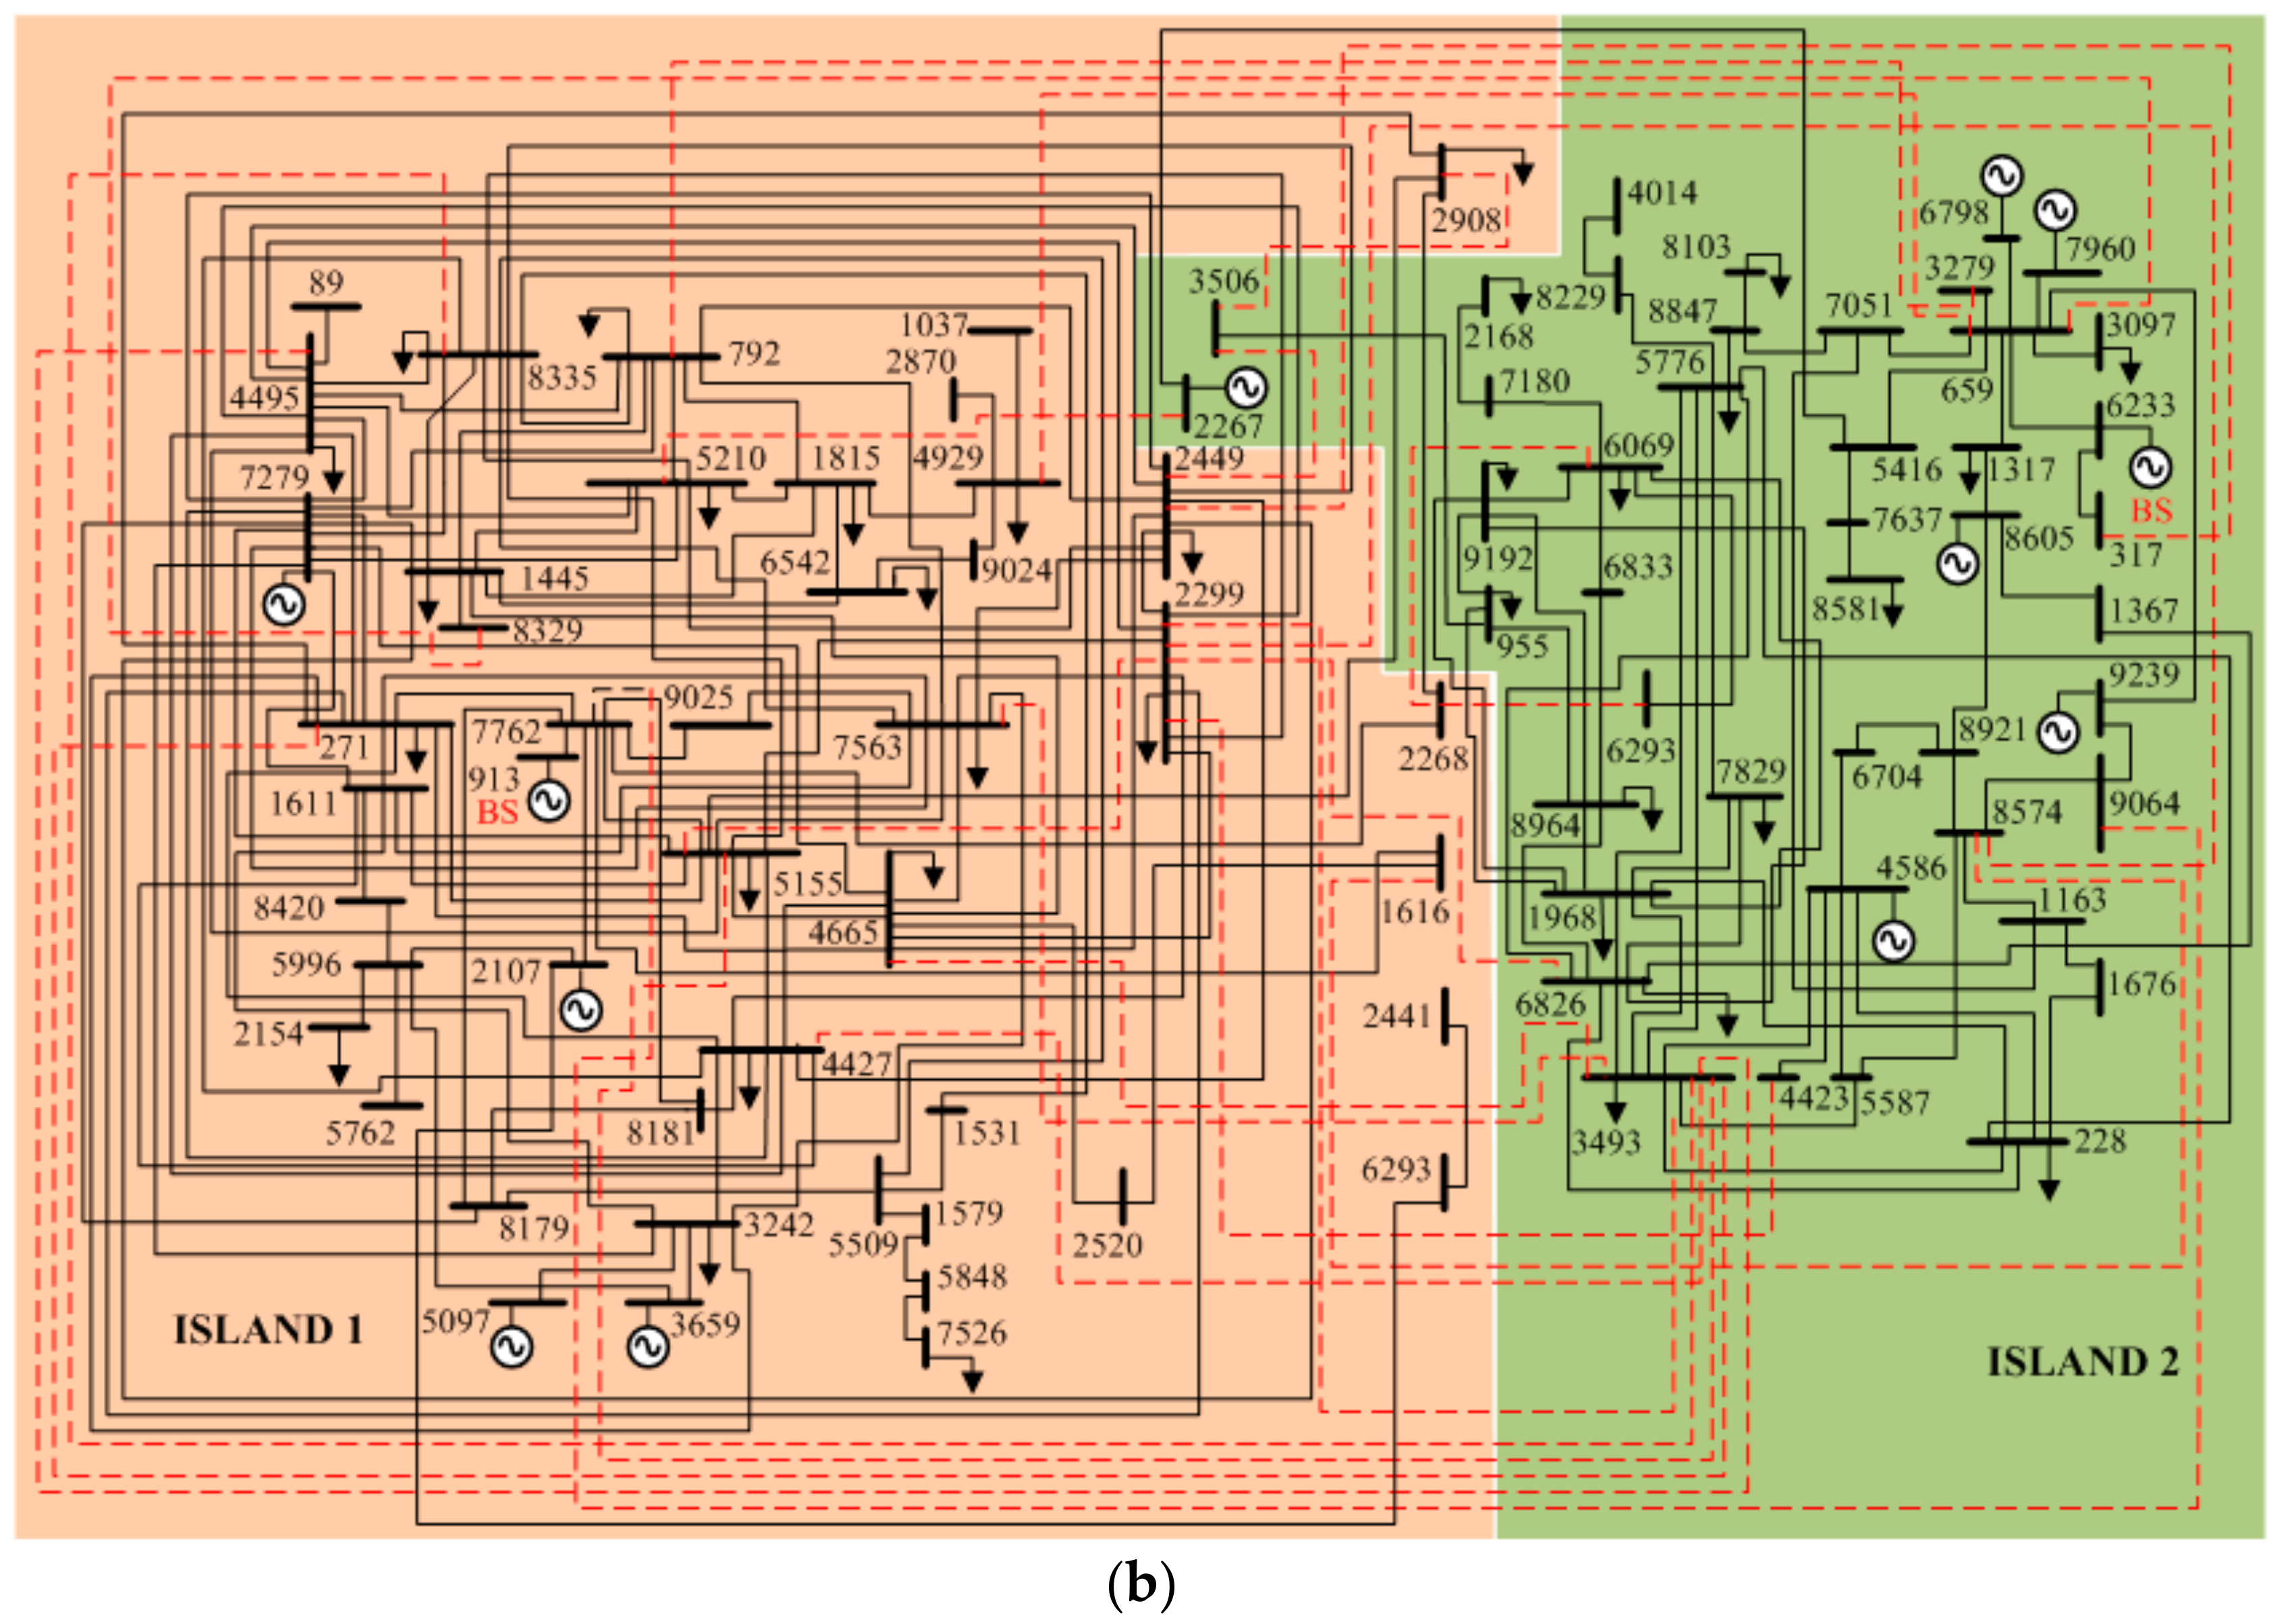
5.3. 89 Bus European Transmission System
To further validate the flexibility of the proposed method, a practical power system network from part of the European high voltage transmission network is used. The network contains 89 buses, 12 generators, and 210 branches and it operates at 380, 220, and 150 kV [27]. This network is more complex in terms of the number of interconnection lines as compared to IEEE 118. It has a high number of line interconnection between buses. For example, for bus 659 it has 9 branches connected to other buses.
For the test, the network is sectionalized into two islands via two re-energizing approaches; (1) re-energizing the islands’ backbone units, (2) re-energizing all islands’ units. It is assumed that the BS unit is at bus 913 & bus 6233 respectively. Meanwhile, the critical loads (CLs) are located at buses 1317, 2154, 3097, 4665, 6069, 7829 & 9192.
The results are presented in Table 7. It can be observed that the final cut set is high, up to 22 lines to separate the system to assign number of island. This occurs since the test system consists of a high number of interconnected lines. Based on the results, the heuristic and DABC method found an identical cut-set with maximum island restoration time of 260 min for the first approach. However, for the second approach, the DABC method managed to find a better cut-set compared to the heuristic solution with 40 min difference, i.e., 840 min and 880 min respectively, with similar number of edges in the cut-set. Figure 9 shows the 89 bus system separated into two islands for the second approach. The DABC method managed to find different sets of generator groups with faster restoration times.
6. Discussion and Future Work
In the proposed method, generators based on renewable energy such as solar photovoltaic, PV and wind were not considered in the process of determining islands for restoration. These types of generators will be connected to the power system network only when the restoration is completed and the system is stable. The reason is because these generators are intermittent in nature since they depend highly on the availability of solar and wind energy. Their unstable power supply will pose a high risk for the instability of the system during the restoration process. Furthermore, the low inertia in this type of power generation will also affect the stability of the overall system, mainly in the frequency in the case disturbance occurs during the restoration process.
The proposed method also can be used as the basis for future work in the area of dynamic analysis. The restoration steps in each island could be analyzed to observe the best energizing steps (lines and loads). From the analysis, a method to determine the best sequence of energizing considering the stability frequency of the system could be proposed. This future method is important since large frequency deviations in the build-up of an island may provoke the collapse of the islanded part of the grid. Various control and protection strategies could be also proposed to cater for frequency deviations during restoration sequences.
7. Conclusions
In this paper, a power system restoration planning strategy based on the combination of heuristic and discrete optimization methods is proposed. A cut set (lines that should not be connected) to sectionalize the system to islands during a total blackout was determined. Islands with almost identical energizing time are searched to speed up the resynchronization time. The heuristic technique scours the search space and provides the initial cut set based on lowest power active generation balance and smallest gap of the generator skeleton size. The DABC optimization method further uses this information to find the optimal cut set solution while fulfilling the restoration constraints. Two different re-energizing approaches are carried out, (1) re-energizing the islands’ backbone units, and (2) re-energizing all islands’ unit. The proposed strategy is tested using IEEE 39, IEEE 118 bus and 89 bus European systems. Based on the results, it can be seen that for the 39 bus system, the proposed strategy is able to obtain the same results as published by other researchers. The robustness of the proposed strategy is highlighted in the 118 bus system when the strategy is able to find optimal cut set with lowest energizing time. The proposed technique is able to find a solution with 15-min faster energizing time compared to published results. The proposed method’s robustness is further proven in the test of 89 bus European system that has a high number of interconnection lines. In summary, the proposed strategy managed to achieve the optimal solution for large and complex systems.
Author Contributions
Dian Najihah Abu Talib is responsible of designing the proposed method and performing the simulation works. This work is performed under supervision of Hazlie Mokhlis and Mohamad Sofian Abu Talip. Kanendra Naidu and Hadi Suyono provide advice and feedback regarding this work. All the authors have reviewed and approved this paper.
Acknowledgments
This work is supported by the University of Malaya under a BKP special grant (grant No. BKS061-2017).
Conflicts of Interest
The authors declare no conflicts of interest.
References
- Corsi, S.; Sabelli, C. General blackout in Italy Sunday September 28, 2003, h. 03:28:00. In Proceedings of the IEEE Power Engineering Society General Meeting, Denver, CO, USA, 6–10 June 2004; pp. 1691–1702. [Google Scholar]
- Shuran, L.; Hui, D.; Su, G. Analyses and discussions of the blackout in Indian power grid. Energy Sci. Technol. 2003, 6, 61–66. [Google Scholar]
- Massive Power Failure Plunges 80% of Pakistan into Darkness. Available online: https://www.theguardian.com/world/2015/jan/25/massive-power-failure-plunges-80-of-pakistan-into-darkness (accessed on 13 March 2018).
- Report on Blackout in Turkey on 31st March 2015. Available online: https://www.entsoe.eu/Documents/SOC%20documents/Regional_Groups_Continental_Europe/20150921_Black_Out_Report_v10_w.pdf (accessed on 13 March 2018).
- Adibi, M.M.; Clelland, P.; Fink, L.; Happ, H. Power system restoration—A task force report. IEEE Trans. Power Syst. 1987, 2, 271–277. [Google Scholar] [CrossRef]
- Adibi, M.M.; Fink, L.H. Power system restoration planning. IEEE Trans. Power Syst. 1994, 9, 22–28. [Google Scholar] [CrossRef]
- Quiros-Tortos, J.; Terzija, V. A smart power system restoration based on the merger of two different strategies. In Proceedings of the IEEE PES Innovative Smart Grid Technology (ISGT) Europe, Berlin, Germany, 14–17 October 2012; pp. 1–8. [Google Scholar]
- Liang, H.P. Subsystem partitioning for power system black-start considering restoration reliability. Tehnicki Vjesnik/Tech. Gaz. 2015, 22, 637. [Google Scholar] [CrossRef]
- Quiros-Tortos, J.; Terzija, V. A graph theory based new approach for power system restoration. In Proceedings of the IEEE Power Technology, Grenoble, France, 16–20 June 2013; pp. 1–6. [Google Scholar]
- The Grid Code; National Grid Electricity Transmission: London, UK, 2013.
- Gutierrez, J.; Staropolsky, M.; Garcia, A. Policies for restoration of a power system. IEEE Trans. Power Syst. 1987, 2, 436–442. [Google Scholar] [CrossRef]
- PJM Manual 36: System Restoration; PJM: Valley Forge, PA, USA, 2013.
- Quiros-Tortos, J.; Panteli, M.; Wall, P.; Terzija, V. Sectionalizing methodology for parallel system restoration based on graph theory. IET Gener. Transm. Distrib. 2015, 9, 1216–1225. [Google Scholar] [CrossRef]
- Quiros-Tortos, J.; Wall, P.; Ding, L.; Terzija, V. Determination of sectionalizing strategies for parallel power system restoration: A spectral clustering-based methodology. Electr. Power Syst. Res. 2014, 116, 381–390. [Google Scholar] [CrossRef]
- Afrakhteh, H.; Haghifam, M.R. Optimal islands determination in power system restoration. Iran. J. Sci. Technol. 2009, 33, 1–8. [Google Scholar]
- El-Zonkoly, A.M. Renewable energy sources for complete optimal power system black-start restoration. IET Gener. Transm. Distrib. 2015, 9, 531–539. [Google Scholar] [CrossRef]
- Nagata, T.; Sasaki, H. A multi-agent approach to power system restoration. IEEE Trans. Power Syst. 2002, 17. [Google Scholar] [CrossRef]
- Morelato, A.L.; Monticelli, A. Heuristic search approach to distribution system restoration. IEEE Trans. Power Deliv. 1989, 4. [Google Scholar] [CrossRef]
- Liu, Y.; Gu, X. Skeleton-network reconfiguration based on topological characteristics of scale-free networks and discrete particle swarm optimization. IEEE Trans. Power Syst. 2010, 22, 1267–1274. [Google Scholar] [CrossRef]
- Skiena, S. Dijkstra’s Algorithm, Implementing Discrete Mathematics: Combinatorics and Graph Theory with Mathematica Reading; Addison-Wesley: Boston, MA, USA, 1990; pp. 225–227. [Google Scholar]
- Sun, W.; Liu, C.C.; Zhang, L. Optimal generator start-up strategy for bulk power system restoration. IEEE Trans. Power Syst. 2011, 26, 1357–1366. [Google Scholar] [CrossRef]
- Karaboga, D.; Basturk, B. On the performance of artificial bee colony (ABC) algorithm. Appl. Soft Comput. 2008, 8, 687–697. [Google Scholar] [CrossRef]
- Karaboga, D.; Gorkemli, B.; Ozturk, C.; Karboga, N. A comparative survey: Artificial bee colony (ABC) algorithm and applications. Artif. Intell. Rev. 2014, 42, 21–57. [Google Scholar] [CrossRef]
- Lin, Z.Z.; Wen, F.S.; Wong, K.P.; Zhou, H. Division algorithm and interconnection strategy of restoration subsystems based on complex network theory. IET Gener. Transm. Distrib. 2011, 5, 674–683. [Google Scholar] [CrossRef]
- Liu, W.; Lin, Z.; Wen, F.; Chung, C.Y.; Xue, Y.; Ledwich, G. Sectionalizing strategies for minimizing outage durations of critical loads in parallel power system restoration with bi-level programming. Electr. Power Energy Syst. 2015, 71, 327–334. [Google Scholar] [CrossRef]
- Wang, C.; Vittal, V.; Sun, K. OBDD-based sectionalizing strategies for parallel power system restoration. IEEE Trans. Power Syst. 2011, 26, 1426–1433. [Google Scholar] [CrossRef]
- Josz, C.; Fliscounakis, S.; Maeght, J.; Panciatici, P. AC Power Flow Data in MATPOWER and QCQP Format: ITesla, RTE Snapshots, and PEGASE. arXiv, 2016; arXiv:1603.01533. [Google Scholar]
Figure 1.
Three island power system.

Figure 2.
Heuristic technique.

Figure 3.
Restoration strategy for IEEE 39-bus.

Figure 4.
Initial skeleton bus points for group A1, A2 and A3.

Figure 5.
Bus points for group A1, A2 and A3 after first searching step.

Figure 6.
Initial solution for A1, A2 and A3 islands with 5 cutting edges.

Figure 7.
IEEE 39-bus voltage profile for the optimal three islands.

Figure 8.
Restoration strategy for IEEE 118 bus.

Figure 9.
All islands’ unit restoration for the 89 bus European system, (a) Heuristic result (b) DABC result.
Figure 9.
All islands’ unit restoration for the 89 bus European system, (a) Heuristic result (b) DABC result.


Table 1.
Discrete ABC mutation stages.
| Initial Solution | z1 | z2 | z3 | ||
|---|---|---|---|---|---|
| Stage 1: Employed Bee Stage Mutation | |||||
| First edge is randomly replaced | x | z2 | z3 | ||
| Second edge is randomly replaced | z1 | x | z3 | ||
| Third edge is randomly replaced | z1 | z2 | x | ||
| One edge is randomly added | z1 | z2 | z3 | A | |
| First edge is randomly replaced | x | z2 | z3 | A | |
| Second edge is randomly replaced | z1 | x | z3 | A | |
| Third edge is randomly replaced | z1 | z2 | x | A | |
| Two edge is randomly added | z1 | z2 | z3 | B | C |
| First edge is randomly replaced | x | z2 | z3 | B | C |
| Second edge is randomly replaced | z1 | x | z3 | B | C |
| Third edge is randomly replaced | z1 | z2 | x | B | C |
| Stage 2: Onlooker Bee Stage Mutation 1 | |||||
| First edge of initial solution is removed | z2 | z3 | |||
| Second edge is randomly replaced | x | z3 | |||
| Third edge is randomly replaced | z2 | x | |||
| One edge is randomly added | z2 | z3 | A | ||
| Second edge is randomly replaced | x | z3 | A | ||
| Third edge is randomly replaced | z2 | x | A | ||
| Two edge is randomly added | z2 | z3 | B | C | |
| Second edge is randomly replaced | x | z3 | B | C | |
| Third edge is randomly replaced | z2 | x | B | C | |
| Stage 3: Scout Bee Stage Mutation | |||||
| First & second edge is randomly replaced | x | x | z3 | ||
| Second & third edge is randomly replaced | z1 | x | x | ||
| First & third edge is randomly replaced | x | z2 | x | ||
| One edge is randomly added | z1 | z2 | z3 | A | |
| First & second edge is randomly replaced | x | x | z3 | A | |
| Second & third edge is randomly replaced | z1 | x | x | A | |
| First & third edge is randomly replaced | x | z2 | x | A | |
| Two edge is randomly added | z1 | z2 | z3 | B | C |
| First & second edge is randomly replaced | x | x | z3 | B | C |
| Second & third edge is randomly replaced | z1 | x | x | B | C |
| First & third edge is randomly replaced | x | z2 | x | B | C |
Edges which have been replaced or added randomly (x, A, B) are highlighted in grey box. 1 Stage 2 will be repeated by removing the second and third edges of the initial solution before proceeding to Stage 3.
Table 2.
Three shortest paths from one generator unit to others.
| Generator Bus | Shortest Path | w, Edges No. (pu) | z, Edges Electrical Distance (pu) |
|---|---|---|---|
| 30 | (30, 2, 25, 37) | 3 | 0.0499 |
| (30, 2, 1, 39) | 3 | 0.0842 | |
| (30, 2, 25, 26, 29, 38) | 5 | 0.1371 | |
| 37 | (37, 25, 2, 1, 39) | 4 | 0.0979 |
| (37, 25, 26, 29, 38) | 4 | 0.1336 | |
| (37, 25, 2, 3, 4, 5, 6, 31) | 7 | 0.1086 | |
| 39 | (39, 9, 8, 7, 6, 31) | 5 | 0.1001 |
| (39, 1, 2, 25, 26, 29, 38) | 6 | 0.1851 | |
| (39, 9, 8, 7, 6, 11, 10, 32) | 7 | 0.1076 | |
| 31 | (31, 6, 11, 10, 32) | 4 | 0.0575 |
| (31, 6, 5, 4, 14, 15, 16, 19, 33) | 8 | 0.1181 | |
| (31, 6, 5, 4, 14, 15, 16, 19, 20, 34) | 9 | 0.1357 | |
| 32 | (32, 10, 13, 14, 15, 16, 19, 33) | 7 | 0.0992 |
| (32, 10, 13, 14, 15, 16, 19, 20, 34) | 8 | 0.1168 | |
| (32, 10, 13, 14, 15, 16, 21, 22, 35) | 8 | 0.1268 | |
| 33 | (33, 19, 20, 34) | 3 | 0.046 |
| (33, 19, 16, 21, 22, 35) | 5 | 0.0755 | |
| (33, 19, 16, 24, 23, 36) | 5 | 0.1018 | |
| 34 | (34, 20, 19, 16, 21, 22, 35) | 6 | 0.0931 |
| (34, 20, 19, 16, 24, 23, 36) | 6 | 0.1194 | |
| (34, 20, 19, 16, 17, 27, 26, 29, 38) | 8 | 0.1703 | |
| 35 | (35, 22, 23, 36) | 3 | 0.0511 |
| (35, 22, 21, 16, 17, 27, 26, 29, 38) | 8 | 0.1608 | |
| 36 | (36, 23, 24, 16, 17, 27, 26, 29, 38) | 8 | 0.1871 |
Table 3.
Heuristic technique for IEEE 39 test system.
| Group Set | Group Island | Generator Bus | Power Gen. Balance, ∆P (MW) | Skeleton Size Gap, ∆s | Initial Cut Set |
|---|---|---|---|---|---|
| 1 | A1 | 30 37 38 | 44 | 26 | 1–39, 3–4, 14–15, 17–18, 17–27 |
| A2 | 31 32 39 | ||||
| A3 | 33 34 35 36 | ||||
| 2 | A1 | 33 34 35 36 38 | 1688 | 28 | 1–39, 5–6, 5–8, 10–13, 11–12, 14–15, 17–18, 25–26 |
| A2 | 30 37 | ||||
| A3 | 31 32 39 | ||||
| 3 | A1 | 33 34 35 36 38 | 1921 | 26 | 3–4, 5–8, 7–8, 15–16, 17–18, 25–26 |
| A2 | 30 37 39 | ||||
| A3 | 31 32 | ||||
| 4 | A1 | 30 37 38 39 | 2198 | 24 | 3–4, 3–18, 9–39, 14–15, 17–27 |
| A2 | 33 34 35 36 | ||||
| A3 | 31 32 | ||||
| 5 | A1 | 30 35 36 37 38 39 | 3676 | 26 | 3–4, 9–39, 14–15, 16–19 |
| A2 | 31 32 | ||||
| A3 | 33 34 |
Table 4.
Methods for the ‘total island’ network reenergizing approach.
| Method | Group Island | Generator Bus | tGP (min) | Final Cut Set | Obj. Func., ∆T |
|---|---|---|---|---|---|
| Proposed method | 1 | 31 32 39 | 195 | 1–39, 3–4, 14–15, 16–17 | 115 |
| 2 | 30 37 38 | 195 | |||
| 3 | 33 34 35 36 | 180 | |||
| Ref [9] | 1 | 31 32 39 | 195 | 1–39, 3–4, 14–15, 16–17 | 115 |
| 2 | 30 37 38 | 195 | |||
| 3 | 33 34 35 36 | 180 | |||
| Ref [24] | 1 | 31 32 39 | 195 | 1–39, 3–4, 14–15, 16–17 | 115 |
| 2 | 30 37 38 | 195 | |||
| 3 | 33 34 35 36 | 180 | |||
| Ref [25] | 1 | 31 32 | 165 | 9–39, 8–9, 3–4, 26–27, 18–19, 15–16 | 185 |
| 2 | 33 34 35 36 | 185 | |||
| 3 | 30 37 38 39 | 200 |
Table 5.
Heuristic technique for IEEE 118 test system.
| Group Set | Generator Bus Group 1 Island | Generator Bus Group 2 Island | ∆P (MW) | ∆s | Initial Cut set |
|---|---|---|---|---|---|
| 1 | 46 69 80 87 89 100 103 111 | 10 12 25 26 31 49 54 59 61 65 66 | 474.6 | 2 | 22–23, 23–25, 23–32, 44–45, 47–49, 45–49, 48–49, 65–68, 49–69 |
| 2 | 46 49 54 59 61 69 80 87 89 100 103 111 | 10 12 25 26 31 65 66 | 659.4 | 6 | 40–42, 41–42, 43–44, 59–60, 60–61, 61–62, 63–59, 64–61, 49–66, 68–69, 69–70, 70–74, 70–75, 81–80 |
| 3 | 10 12 25 26 31 65 | 46 49 54 59 61 66 69 80 87 89 100 103 111 | 1443.4 | 8 | 40–42, 41–42, 34–43, 63–64, 61–64, 65–66, 68–69, 24–70, 70–71, 68–81 |
| 4 | 10 12 25 26 31 | 46 49 54 59 61 65 66 69 80 87 89 100 103 111 | 2225.4 | 11 | 23–24, 19–34, 33–37, 30–38 |
| 5 | 46 49 54 59 61 69 | 10 12 25 26 31 65 66 80 87 89 100 103 111 | 2172.6 | 19 | 40–42, 41–42, 34–43, 60–62, 61–62, 64–65, 49–66, 68–69, 69–70, 69–75, 69–77 |
Table 6.
Methods for island’s backbone energizing approach.
| Method | Group Island | Generator Bus | tGP (min) | Final Cut set | Obj. Func., ∆T |
|---|---|---|---|---|---|
| Proposed method | 1 | 69 80 87 89 100 103 111 | 245 | 19–20, 23–25, 23–32, 47–69, 49–69, 65–68 | 265 |
| 2 | 10 12 25 26 31 46 49 54 59 61 65 66 | 360 | |||
| Ref [7] | 1 | 46 49 54 59 61 65 66 69 80 87 89 100 103 111 | 375 | 15–33, 19–34, 24–70,24–72, 30–38 | 315 |
| 2 | 10 12 25 26 31 | 185 | |||
| Ref [14] | 1 | 46 49 54 59 61 65 66 69 80 87 89 100 103 111 | 375 | 33–37, 19–34, 30–38, 24–72, 24–70 | 315 |
| 2 | 10 12 25 26 31 | 185 | |||
| Ref [26] | 1 | 46 49 54 59 61 65 66 69 80 87 89 100 103 111 | 375 | 15–33, 19–34, 30–38,69–70, 70–75, 70–74 | 340 |
| 2 | 10 12 25 26 31 | 185 |
Table 7.
89 bus European test system results.
| Re-Energizing Approach | Method | Group Island | Generator Bus | tGP (min) | Final Cut set |
|---|---|---|---|---|---|
| The islands’ backbone units | Heuristic | 1 | 913 2107 2267 3659 5097 7279 | 255 | 2268–6069, 6069–6293, 1616–8574, 2299–3493, 2299–4423, 2299–6826, 3493–7563, 3493–4427, 3493–8335, 3493–5155, 271–3493, 2449–3506, 3493–4665, 3493–4495, 659–4929, 7762–9064, 955–3506, 659–8329, 792–3279, 2267–5416, 2299–8574, 317–2449 |
| 2 | 4586 6233 6798 7960 8605 9239 | 260 | |||
| DABC | 1 | 913 2107 2267 3659 5097 7279 | 255 | 2268–6069, 6069–6293, 1616–8574, 2299–3493, 2299–4423, 2299–6826, 3493–7563, 3493–4427, 3493–8335, 3493–5155, 271–3493, 2449–3506, 3493–4665, 3493–4495, 659–4929, 7762–9064, 955–3506, 659–8329, 792–3279, 2267–5416, 2299–8574, 317–2449 | |
| 2 | 4586 6233 6798 7960 8605 9239 | 260 | |||
| All islands’ units | Heuristic | 1 | 913 2107 2267 3659 5097 7279 | 880 | 2268–6069, 6069–6293, 1616–8574, 2299–3493, 2299–4423, 2299–6826, 3493–7563, 3493–4427, 3493–8335, 3493–5155, 271–3493, 2449–3506, 3493–4665, 3493–4495, 659–4929, 7762–9064, 955–3506, 659–8329, 792–3279, 2267–5416, 2299–8574, 317–2449 |
| 2 | 4586 6233 6798 7960 8605 9239 | 560 | |||
| DABC | 1 | 913 2107 3659 5097 7279 | 840 | 2268–6069, 1616–8574, 2299–3493, 2299–4423, 2299–6826, 3493–7563, 3493–4427, 3493–8335, 3493–5155, 271–3493, 2449–3506, 3493–4665, 3493–4495, 659–4929, 7762–9064, 2268–6293, 2908–3506, 659–8329, 792–3279, 2299–8574, 2267–5210, 317–2449 | |
| 2 | 2267 4586 6233 6798 7960 8605 9239 | 600 |
BS bus in each generator group is highlighted in bold.
© 2018 by the authors. Licensee MDPI, Basel, Switzerland. This article is an open access article distributed under the terms and conditions of the Creative Commons Attribution (CC BY) license (http://creativecommons.org/licenses/by/4.0/).
Share and Cite
MDPI and ACS Style
Abu Talib, D.N.; Mokhlis, H.; Abu Talip, M.S.; Naidu, K.; Suyono, H. Power System Restoration Planning Strategy Based on Optimal Energizing Time of Sectionalizing Islands. Energies 2018, 11, 1316. https://doi.org/10.3390/en11051316
AMA Style
Abu Talib DN, Mokhlis H, Abu Talip MS, Naidu K, Suyono H. Power System Restoration Planning Strategy Based on Optimal Energizing Time of Sectionalizing Islands. Energies. 2018; 11(5):1316. https://doi.org/10.3390/en11051316
Chicago/Turabian StyleAbu Talib, Dian Najihah, Hazlie Mokhlis, Mohamad Sofian Abu Talip, Kanendra Naidu, and Hadi Suyono. 2018. "Power System Restoration Planning Strategy Based on Optimal Energizing Time of Sectionalizing Islands" Energies 11, no. 5: 1316. https://doi.org/10.3390/en11051316
Note that from the first issue of 2016, this journal uses article numbers instead of page numbers. See further details here.