Optimization and Scale-Up of Coffee Mucilage Fermentation for Ethanol Production


1
Laboratory of Renewable Resources Engineering, Purdue University, West Lafayette, IN 47907, USA
2
Department of Agricultural and Biological Engineering, Purdue University, West Lafayette, IN 47907, USA
3
School of Chemistry, Faculty of Science, National University of Colombia, Calle 59A N, Medellin 63-20, Colombia
4
Department of Biology, Hood College, 401 Rosemont Avenue, Frederick, MD 21701, USA
*
Author to whom correspondence should be addressed.
†
Authors contributed equally to the study.
Energies 2018, 11(4), 786; https://doi.org/10.3390/en11040786
Submission received: 31 January 2018
/
Revised: 5 March 2018
/
Accepted: 5 March 2018
/
Published: 29 March 2018
(This article belongs to the Special Issue BioEnergy and BioChemicals Production from Biomass and Residual Resources)
Abstract
:Coffee, one of the most popular food commodities and beverage ingredients worldwide, is considered as a potential source for food industry and second-generation biofuel due to its various by-products, including mucilage, husk, skin (pericarp), parchment, silver-skin, and pulp, which can be produced during the manufacturing process. A number of research studies have mainly investigated the valuable properties of brewed coffee (namely, beverage), functionalities, and its beneficial effects on cognitive and physical performances; however, other residual by-products of coffee, such as its mucilage, have rarely been studied. In this manuscript, the production of bioethanol from mucilage was performed both in shake flasks and 5 L bio-reactors. The use of coffee mucilage provided adequate fermentable sugars, primarily glucose with additional nutrient components, and it was directly fermented into ethanol using a Saccharomyces cerevisiae strain. The initial tests at the lab scale were evaluated using a two-level factorial experimental design, and the resulting optimal conditions were applied to further tests at the 5 L bio-reactor for scale up. The highest yields of flasks and 5 L bio-reactors were 0.46 g ethanol/g sugars, and 0.47 g ethanol/g sugars after 12 h, respectively, which were equal to 90% and 94% of the theoretically achievable conversion yield of ethanol.
1. Introduction
According to previous research studies, coffee is one of the most traded commodities, along with crude oils, and is consumed by millions of people on a daily basis. It is known that more than 70 countries in South American and tropical nations, including Brazil, Vietnam, Colombia, Indonesia, and Ethiopia extensively produce coffee, and they play major roles in the global coffee trades, developments, and the country’s economy [1,2]. Furthermore, the current trend of coffee consumption and its relative global market has rapidly grown over recent decades due to an intriguing ingredient—caffeine as a stimulant. Because of the increase of consumption of coffee with consumers’ interest in health and functional foods, a number of works have investigated the cognitive, physical, and functional attributes of coffee (mainly caffeine) [3,4].
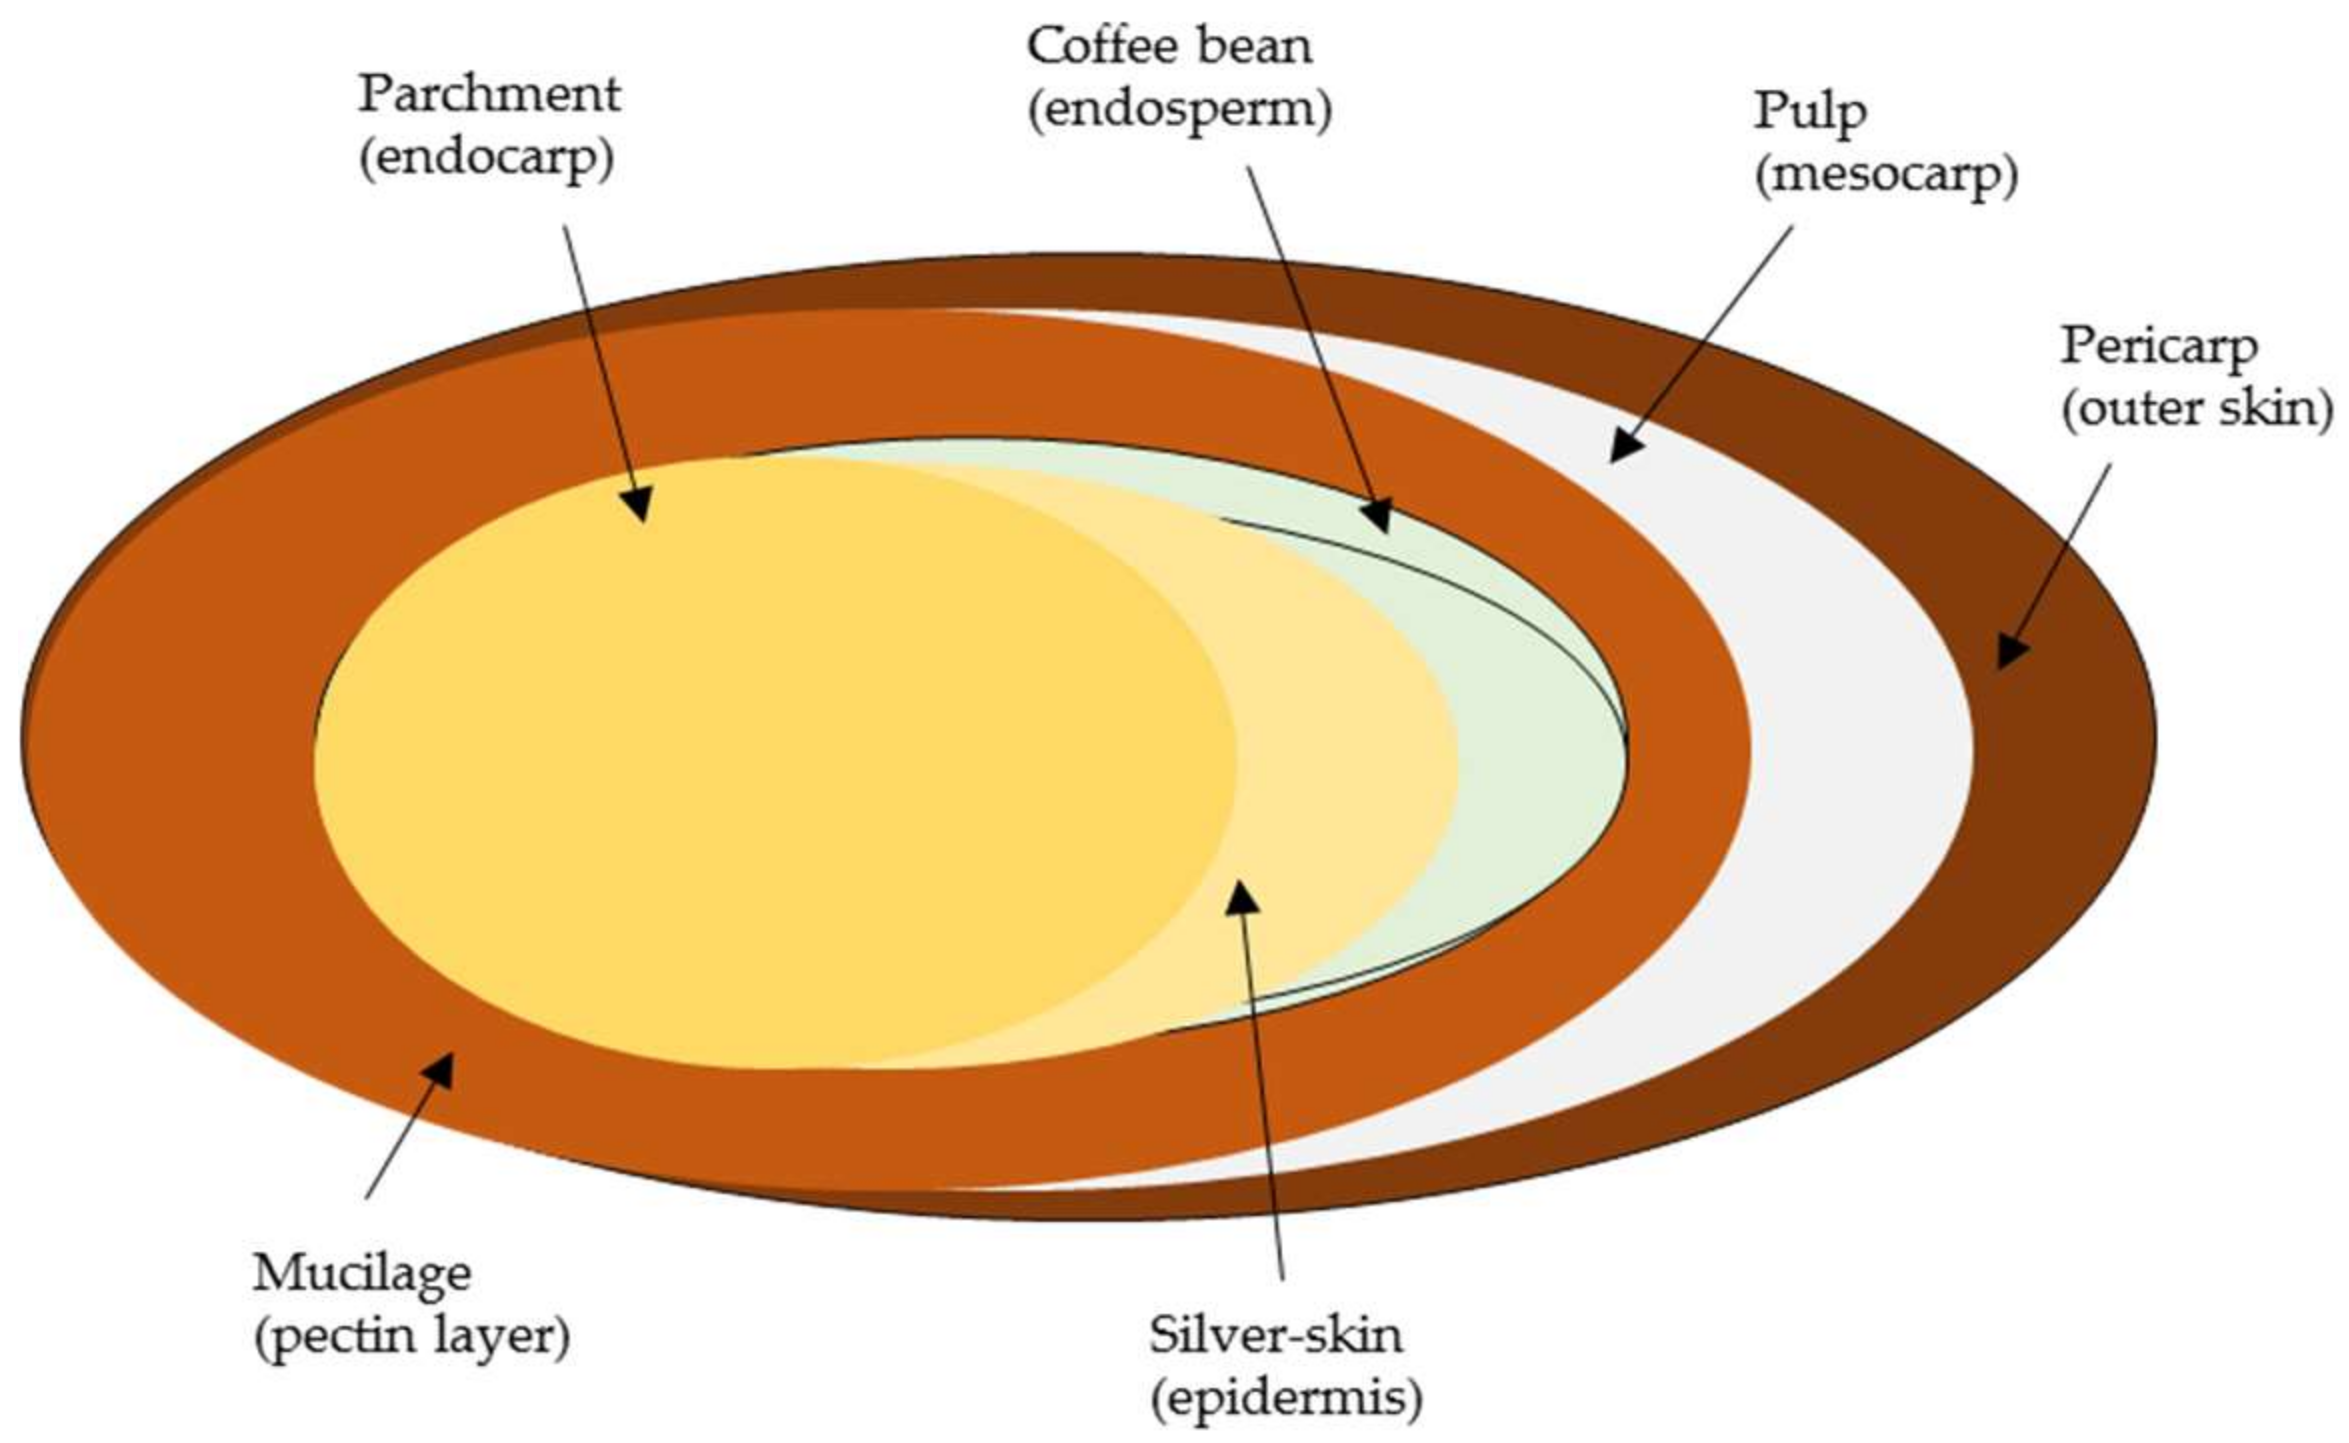
The coffee fruit is mainly composed of bean, silver-skin, parchment, mucilage, pulp, and pericarp [5,6]. The endosperm (coffee bean) is attached and covered by silver-skin, which is enclosed in parchment (yellowish thin endocarp). The thin, colorless, and hydrated pectin layer, which is called the mucilage, covers the parchment, and finally a soft and stiff outer pericarp protects the fibrous pulp and parchment. The brief structure of the coffee bean is shown in Figure 1.
As the production of coffee has increased, the resulting by-products of coffee generated during wet or dry processing also increased [7]. In the common coffee production process, the green coffee bean is mainly used while other components of silver-skin, parchment, mucilage, pulp, and pericarp, which are more than 50% of the coffee fruit, are removed and discarded during processing [8,9]. Bressani [10] reported that the recovery of the coffee residuals after wet process contained 43.2% (w/w) skin and pulp, 11.8% (w/w) mucilage and soluble sugars, and 6.1% (w/w) parchment. Recently, it has been found that the coffee residual by-products made up approximately 15 million tons per year [11], and they generated a large amount of agricultural waste. This includes the coffee mucilage, which represents approximately 22% of the grain wet weight [12]. Some coffee by-products are currently used in manure [12], adsorption molecules [13,14,15], ethanol [16,17,18], gibberellic acid [19], and α-amylase [20]. Further studies of the coffee silver-skin showed that it could be utilized as a functional material due to its high dietary fiber component (60%), low contents of fat and carbohydrate, and associated antioxidant phenolic compounds [21,22]. Although coffee by-product wastes could be utilized in agricultural fertilizer and animal feedstock, the high composition of lignin (25% w/w in coffee ground) and anti-nutritional components (phenolics and caffeine) in the coffee wastes are restrictive factors of direct use for animal feedstock [23,24,25,26,27,28]. Un-utilized coffee industry residuals are discarded into land or water resources, which could generate environmental issues with their high biochemical oxygen demand and toxic compounds [29,30]; therefore, further utilization and practical application of these residues are required.
Coffee mucilage, rich in carbohydrates and nitrogen, is considered to be a potential substrate in bio-based industry to produce value-added molecules and commodities, such as ethanol and lactic acid because it consists of 85–91% (w/w) water, 6.2–7.4% (w/w) sugars and small amounts of protein, non-reducing sugar, and pectin [12,30]. Moreover, the sugars present in the mucilage are mainly composed of reducing sugars (63%, w/w) that can be biochemically transformed to other molecules [23,31]. Although several research studies have been published regarding the chemical/structural composition of coffee mucilage [32], functional properties [33] and production of value-added products such as hydrogen [34], ethanol [17,18], and lactic acid [35], to the best of our knowledge there is no research study for the scale-up of ethanol production using coffee mucilage under optimal conditions. This study reports the use of coffee mucilage waste as a substrate for bioethanol production without any pretreatment or addition of nutrition sources prior to microbial fermentation. Initially, the evaluation of microbial fermentations using a Saccharomyces cerevisiae NRRL (Northern Regional Research Laboratory) Y-1546 strain was carried out at the lab scale with flasks to find an optimal condition, and the designed experimental condition was applied to the 5 L bio-reactors, which resulted in 0.47 g ethanol/g fermentable sugars, showing almost theoretically achievable yield (94%). Different variable parameters such as temperature, pH, and inoculum concentrations were tested and compared. Our work presents the potential to directly utilize reducing sugars (mainly glucose) in the coffee mucilage for ethanol production through microbial fermentation.
2. Results and Discussion
2.1. Compositional Analysis of Coffee Mucilage
Chemical composition of the initial coffee mucilage was determined by International Organization for Standardization (ISO) standard analytical methods as described in the methods section. The coffee mucilage was provided from a production farm in Antioquia, Colombia and its initial chemical composition is summarized in Table 1. Previous studies on the chemical composition of the coffee mucilage reported that it had a composition of 84.2% water, 8.9% protein, 4.1% sugar, 0.91% pectin, and 0.7% ash [5]. To identify the cell growth and fermentability of reducing sugars in the coffee mucilage, initial runs with nutrient supplements of yeast extract (1 g L−1) or diammonium hydrogen phosphate ((NH4)2HPO4, 0.5 g L−1) in the mucilage were examined and compared to the tests without additional supplements. The presence of nitrogen source in the mucilage had little or no difference compared to the results from control, and all tests resulted in similar final ethanol yields (unpublished observations). Other previous studies support this phenomenon, since the mucilage contains various nutrients, protein, and valuable sources that could meet the requirements of cell growth and conversion of fermentable sugars to ethanol [17,35]. In addition, there was no substrate inhibition from the coffee mucilage that was consistent with another work done by Margaritis and Bajpai [36] for the ethanol production from artichoke extract, where substrate inhibition was observed at 250 g L−1 of reducing sugar concentration. Considering previous references and our preliminary data, we used the coffee mucilage without additional supplements in further microbial fermentation tests.
2.2. Optimization of Coffee Mucilage Fermentation
In order to determine the optimal experimental condition for ethanol fermentation from the coffee mucilage, a full factorial design method was considered and designed with different levels of temperature, pH, and initial inoculum concentration. Generally, the Saccharomyces cerevisiae strain has its optimal growth condition at a temperature range of 25–30 °C [37] or 30–33 °C [38] with acid pH ranging from 3.0 to 7.0, and the optimal pH condition being at 5.0 [38]. Another study found that S. cerevisiae was able to grow at 4 °C with the minimum growth while the maximum cell growth was achieved at 38–39 °C [39]. Recent research of the utilization of coffee mucilage reported that the reducing sugars in the coffee mucilage could effectively be fermented to ethanol at 32 °C, pH 5.1, and initial reducing sugar concentration of 61.8 g L−1 with a cell density of 1.0 × 10⁶ cfu/mL [17]. In the light of previous publications, different levels of temperature (28–35 °C), pH (4.0–7.0), and initial cell concentration (3.0–6.0 g L−1) were selected to determine optimal experimental conditions. Because substrate inhibition (reducing sugar) would occur at >250 g L−1 [36], we have not considered the reducing sugar concentration and directly used the initial mucilage as a substrate.
To fulfill tests, a two-level full factorial experimental fermentation was designed by Minitab 17 software; the total regular experiments were 9, including + 1 central point experiment, which was for the estimation of the experimental variance. The total experiments were also carried out in random order to avoid lurking variables, and ethanol yield was calculated each run. The designed experiments, results of ethanol production and percent ethanol yields are summarized in Table 2. The theoretical achievable ethanol yield was estimated with the calculation of 0.511 times the total initial fermentable sugars (glucose and galactose) in the coffee mucilage medium [40,41]. All glucose and galactose were metabolized and converted to ethanol within 24 h, however, the final yields were different, depending on experimental factors of temperature, pH, and initial cell density.
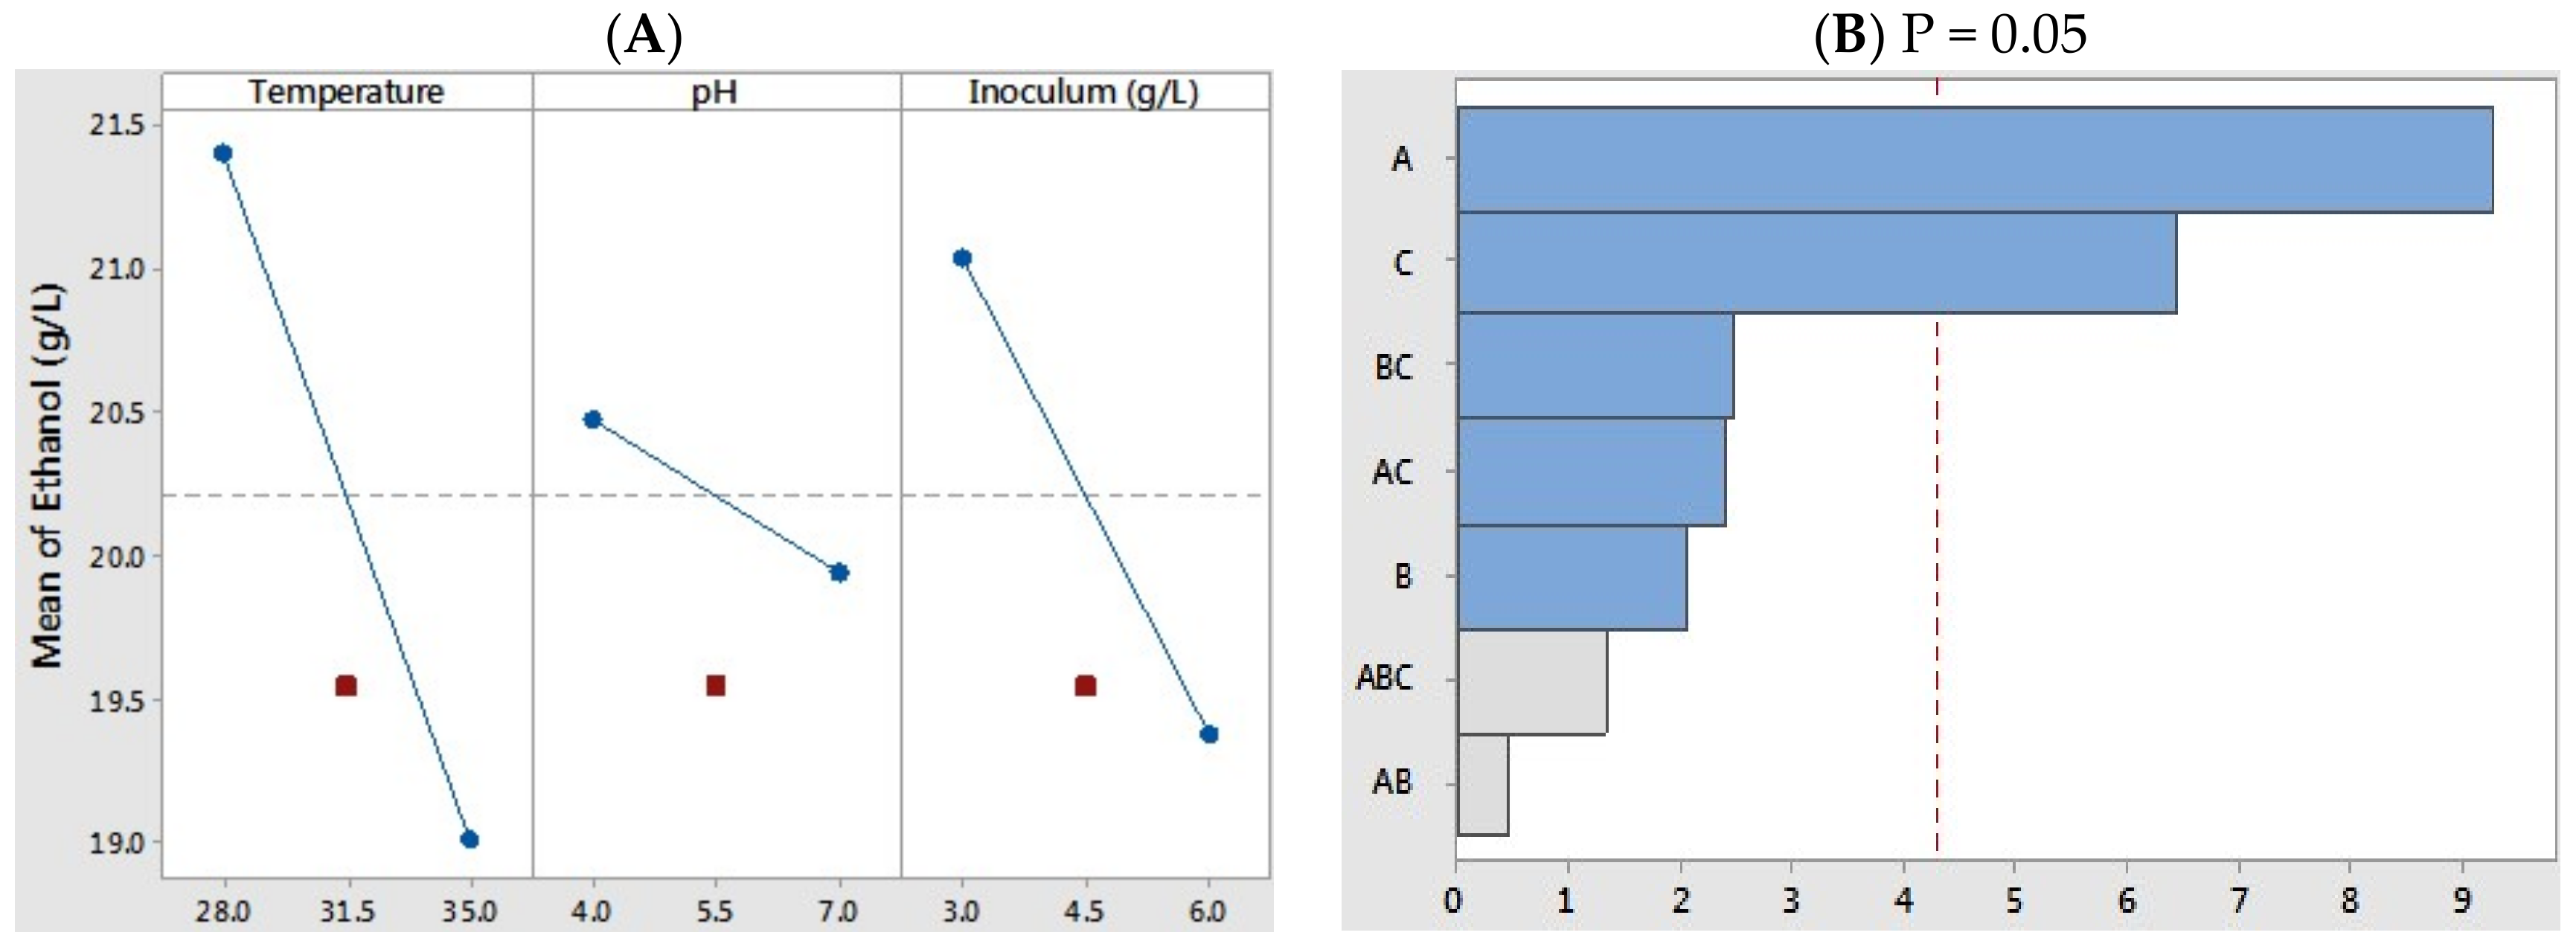
At a given experimental condition, the highest ethanol production of 22.2 g L−1 was obtained at 28°C (pH 4.0) with an initial cell density of 3.0 g L−1, which was equivalent to 83.9% of the theoretically achievable yield. On the other hand, the lowest yield (17.4 g L−1) was achieved at 35 °C (pH 7.0) with an initial inoculum of 6 g L−1. To better understand the main factors for the microbial fermentations, the analysis of each variance was carried out by ANOVA tests. As shown in Figure 2A, the incubation temperature and initial cell concentration significantly contributed toward the ethanol production (sharp slope). The coefficient correlation (R2) of the best model was 0.9449, which indicated the variability of response in this experimental design was 94.49%. In order to verify the superior model with a less than 0.05 probability value, the minor reciprocal interaction factors were excluded, and the model was adjusted with the Pareto chart for individual and two-factor interaction effects. Similar to previous analytic results, the resulting data presented that the levels of temperature and initial cell density had remarkable effects on the ethanol fermentation, while the variable of pH had less effect (Figure 2B). Our previous studies highlighted that the acetic acid concentration and pH on microbial fermentation were thought to be the major contributors for cell growth and metabolic ethanol yield [40,42]. For example, a 67% reduction in ethanol productivity was observed in the presence of 15 g L−1 acetic acid at pH 5.0 compared to the control run without acetic acid or under the lower acetic acid concentration of 3 g L−1. The un-dissociated and/or un-charged form of weak acids (mainly acetic acid) could disrupt the proton influx system in the cell membrane [40,43,44]; however, with a small amount of acetic acid (1.2 g L−1), no dramatic response was observed in the pH range of 4.0 and 7.0.
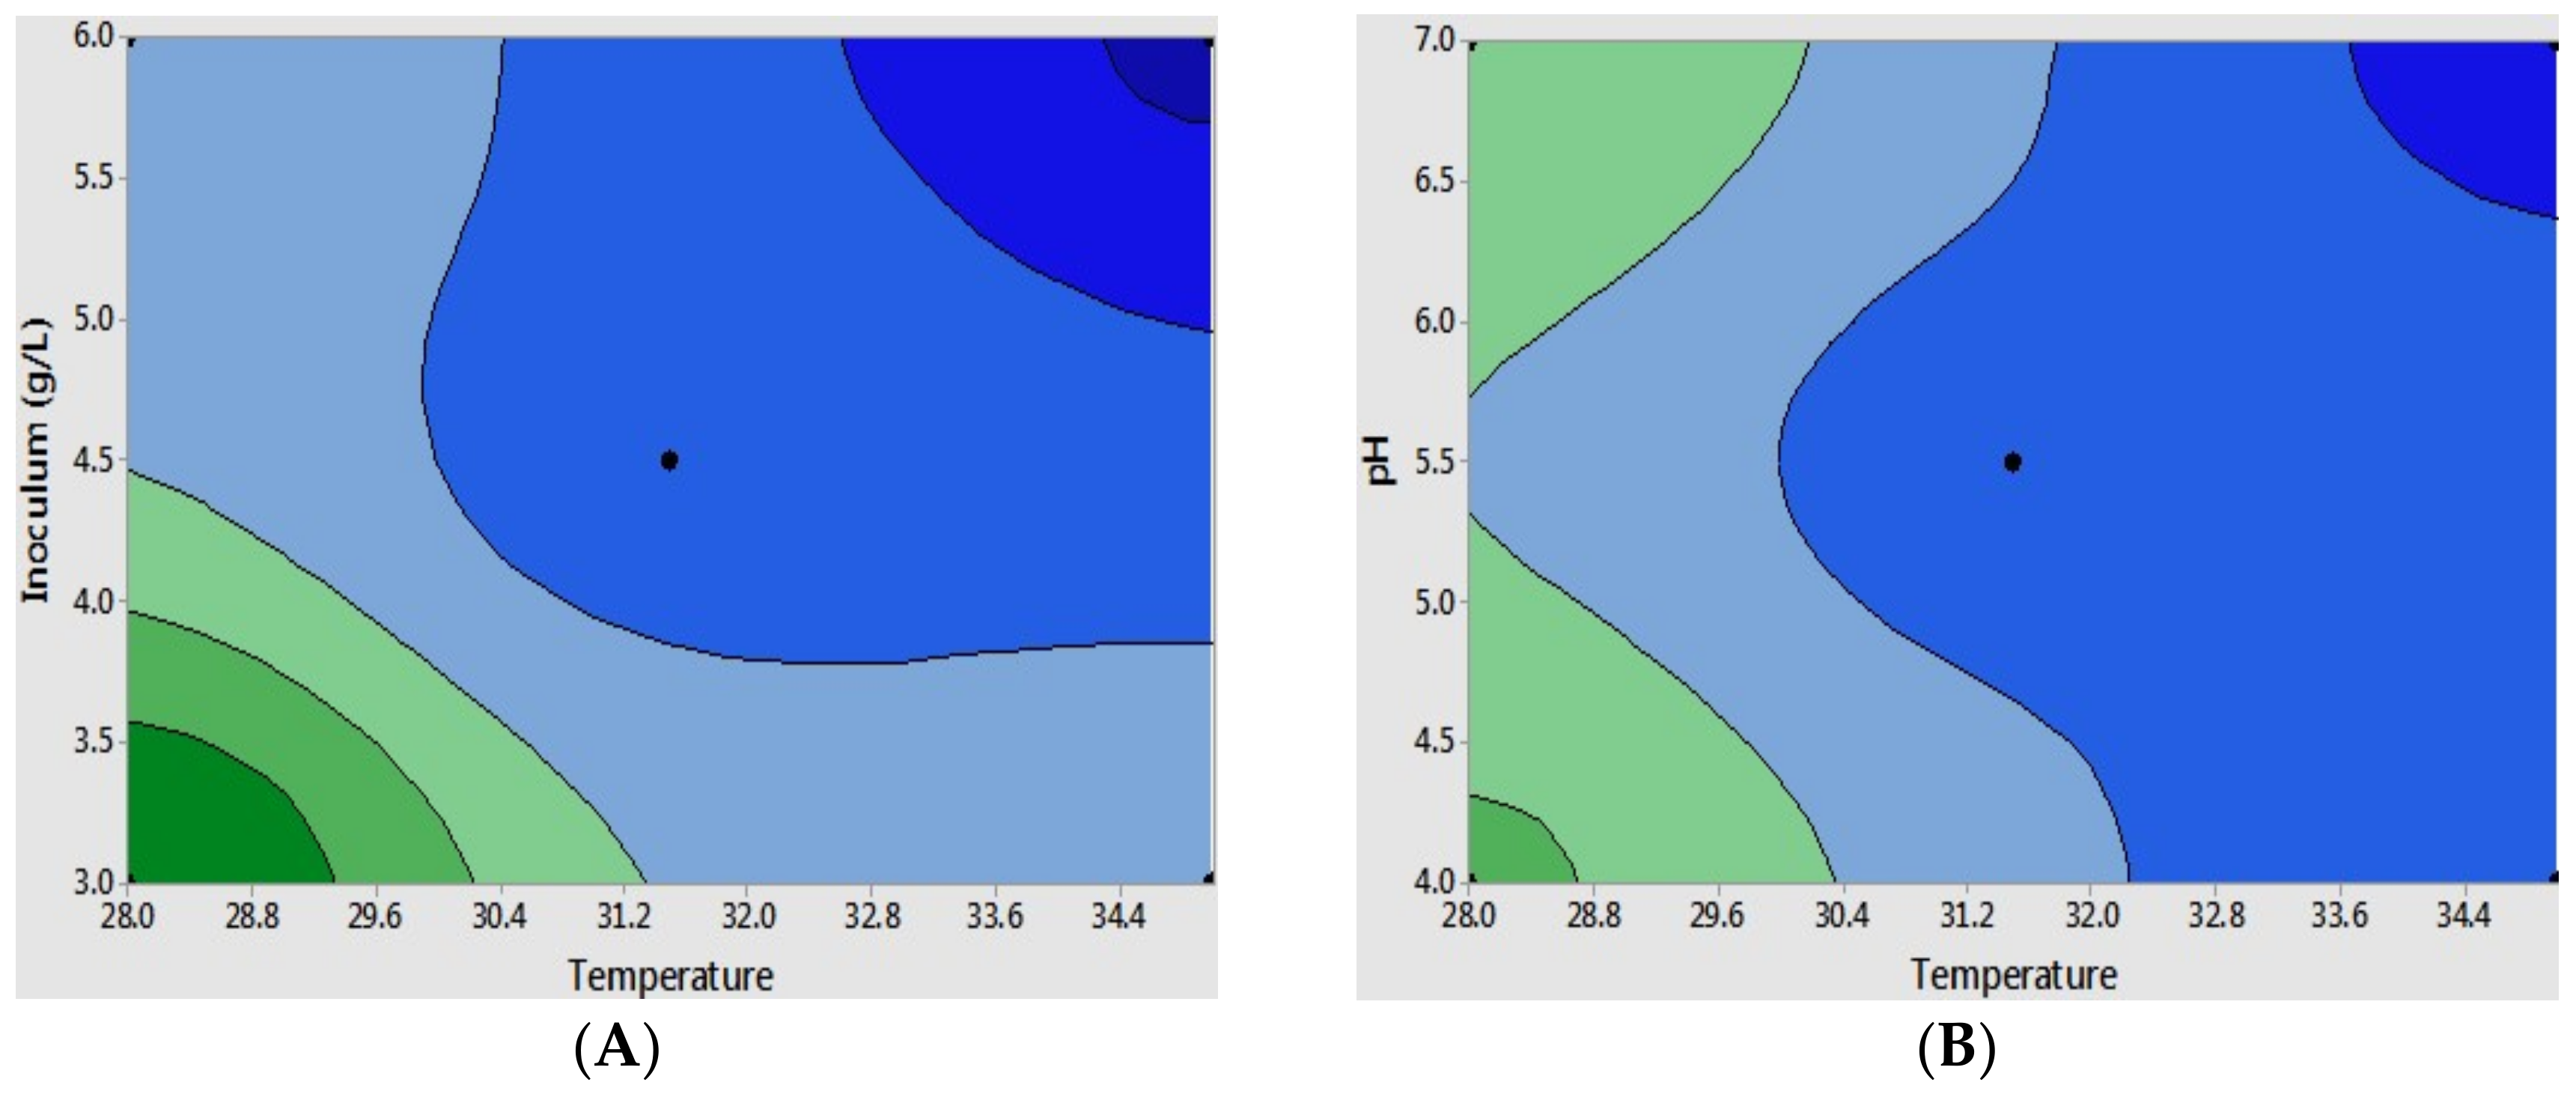
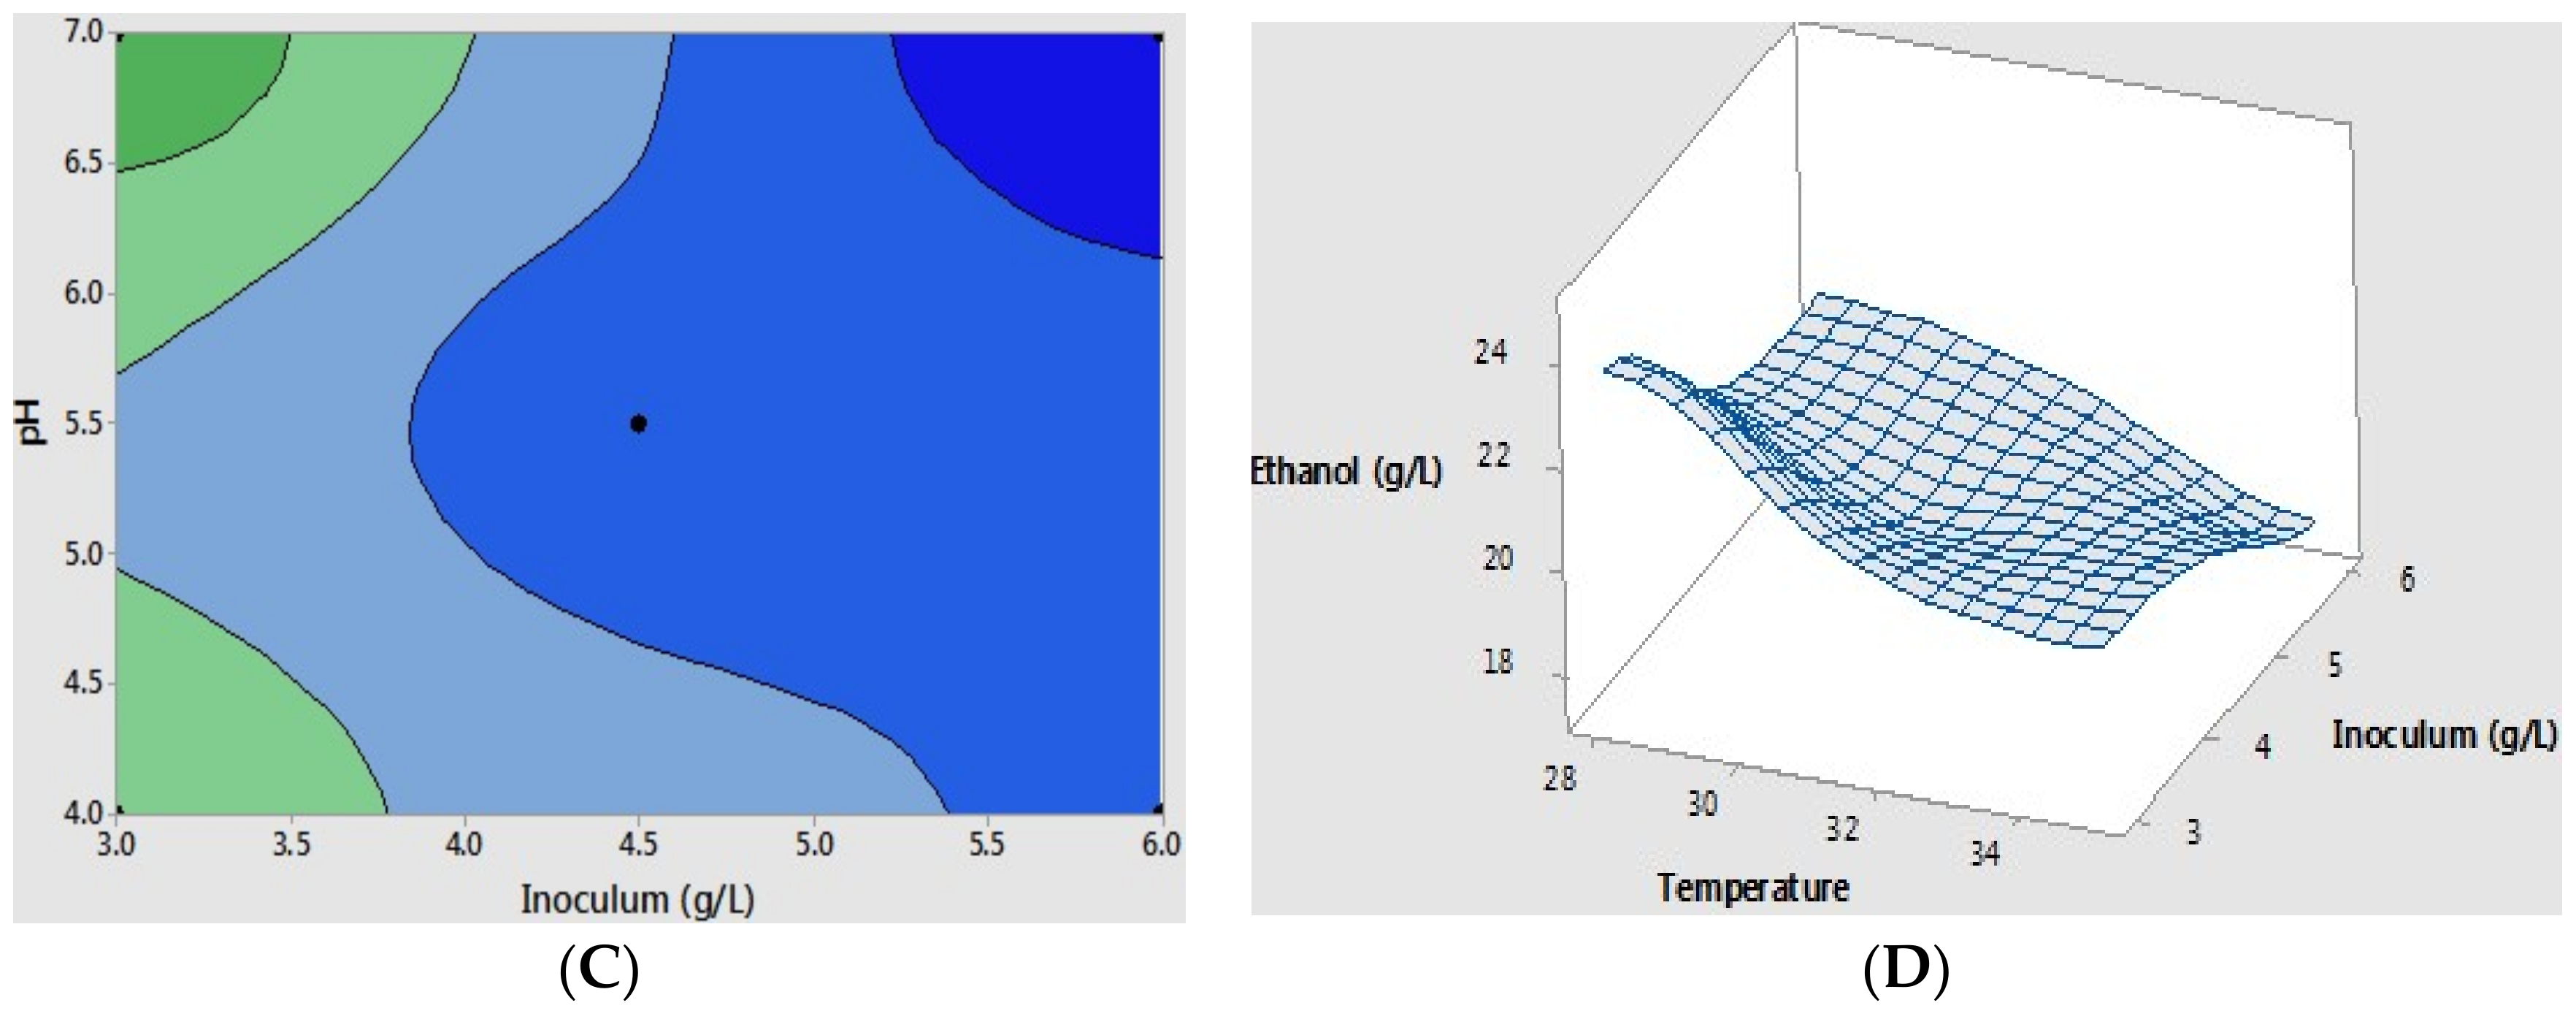
So far, as temperature and initial cell inoculum were considered as dominant parameters, we were interested in exploring their interaction and optimal conditions for the scale-up at the 5 L bio-reactors. Response surface (optimal condition) was performed for the maximum ethanol yield using a contour plot experimental design (Figure 3A–C). The critical point was determined regarding the modification of the obtained experimental results, which resulted in the following equation with >95% correlation coefficients (R2). The data was fitted with the key factors of temperature and initial cell inoculum; the resulting equation represented the dependent response with regard to the relation to the variable factors under the experimental conditions: ethanol yield (g L−1) = 20.68 − 0.017 temperature + 0.81 pH + 2.07 inoculum − 0.011 temperature * pH − 0.0586 temperature * inoculum − 0.1422 pH * inoculum − 0.66 center point. The optimal ethanol estimation is shown in the surface plot model in Figure 3D.
The maximum yield of ethanol was obtained at a low temperature of 28 °C, pH 4.0, with an initial cell density of 3 g L−1, which reached around 23 g L−1 of ethanol production, corresponding to 86.9% theoretically achievable yield. The statistical analysis of the resulting equation was employed by a T-test analysis, which showed more than 95% significant difference for ethanol production from the mucilage at a given experimental condition. Interestingly, the effect of initial pH on ethanol production was less than the other two factors, possibly due to the low acid concentration in the substrate medium and the acceptable pH changes during the fermentation performances [40,42]. For the next step, the application of the designed optimal condition to the lab scale (flasks) and the 5 L bio-reactor fermentation were studied, respectively.
2.3. Mucilage Fermentation Both in the Flasks and 5 L Bio-Reactors
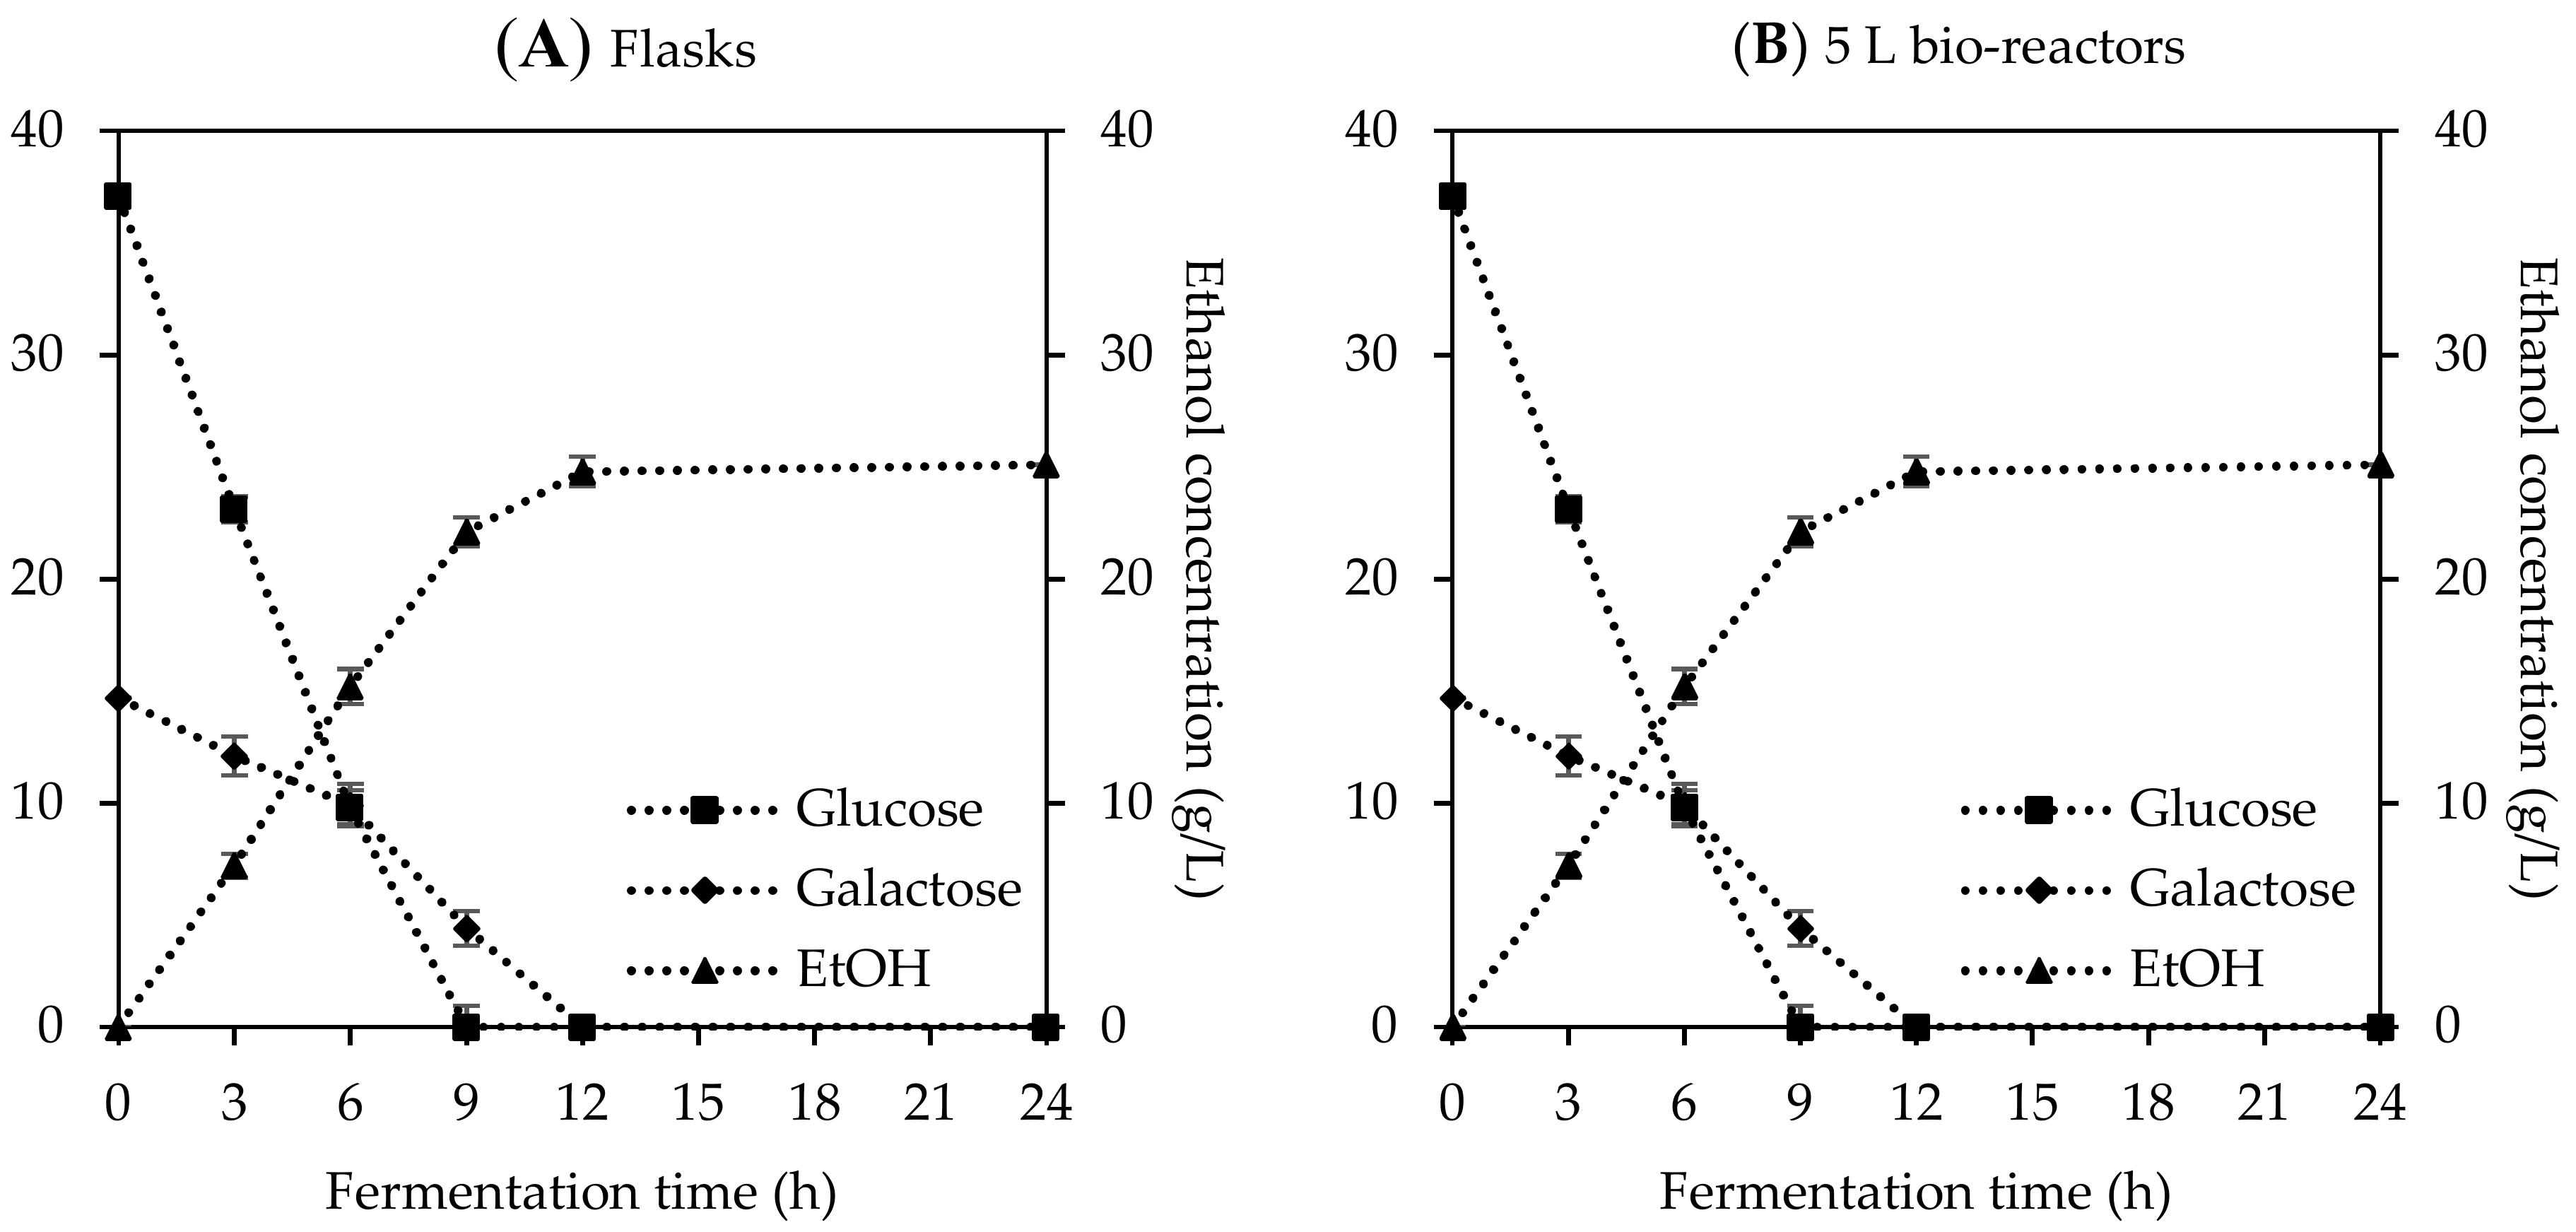
In order to access the optimal condition of temperature, pH, and initial cell density, further tests were carried out both in the lab scale level and scale-up at the 5 L bio-reactors, respectively. In initial runs with the flasks, most of the glucose and galactose were consumed at 9 h and the final ethanol concentration (23.8 g L−1) was achieved at 12 h, which was equal to approximately 89.9% theoretically achievable yield (Figure 4A). In the scale-up test at the 5 L bio-reactor at similar experimental conditions, a slight increase of the final ethanol concentration (24.8 g L−1) was observed with a 93.7% theoretically achievable value (Figure 4B). It might have happened that the remaining sugars in the small coffee mucilage slurries provided more fermentable sugars and/or better mixing with the dual impeller that resulted in the higher ethanol production compared to the results from the flasks. Both runs in the flasks and bio-reactors had a similar fermentation pattern, where glucose was primarily utilized and converted into ethanol within 9 h, while the galactose was slowly metabolized and totally consumed in 12 h (Figure 4A,B). S. cerevisiae has the ability to utilize and metabolize different C6 sugars, including glucose, fructose, mannose, and galactose; however, the yeast prefers to use simple structure sugars such as glucose and fructose rather than galactose because the metabolic pathway of galactose requires a combined step of the Leloir pathway and glycolysis for alcohol fermentation [45].
Our fermentation results are somewhat different from previous observations for ethanol production from coffee mucilage. Pérez-Sariñana et al. [17] have reported that the best ethanol concentration (16.29 g L−1) was obtained at 32 °C, pH 5.1, cell inoculum of 1.0 × 10⁶ cfu/mL, and initial sugar concentration of 61.8 g L−1. Distinctions in the coffee mucilage material, sugar concentration, and yeast strain may help to explain this. Some inhibitory compounds such as acetic acid and phenolic compounds were detected in the previous study [17] while fewer or no potential inhibitors were identified in our work. Phenolic molecules are one of the dominant contributors to inhibit enzymes [46,47,48,49] and microbial fermentation [50,51,52]; thus, remarkable inhibition could have occurred even at a low concentration, which results in the reduction of sugar utilization and diminished final product yield. Also, the use of different yeast strain and initial cell concentration may reflect the different ethanol yields under optimal conditions. Further studies are required in order to gain a better knowledge and understanding of the coffee mucilage and its practical utilization.
Further comparison between our data and earlier study [23] with the fermentative ethanol production from the sulfuric acid treated coffee silver-skin and spent coffee grounds hydrolysates is summarized in Table 3. When the reducing sugars (mainly galactose and mannose) in the coffee silver-skin and spent coffee grounds hydrolysates were fermented into ethanol by different yeast strains, a maximum ethanol yield of 0.13 g ethanol/g substrate and 0.26 g ethanol/g substrate were obtained, respectively (Table 3). The ethanol production of coffee mucilage was evaluated at around 0.46 g ethanol/g substrate (lab scale), which was 1.77 times higher compared to the previous research data from the coffee silver-skin and spent coffee grounds. Furthermore, the ethanol yield slightly increased when the mucilage fermentation was performed at the 5 L bio-reactors, which gave 1.84 times higher yield than the results from silver-skin and coffee grounds (Table 3). It can be explained that the different chemical composition of the coffee by-products (mucilage vs. silver-skin vs. grounds) and the acid pretreatment before the fermentation step generated toxic compounds (mainly phenolic molecules), and inhibited the fermentation performance [41,48,49,53].
It is worth stating that the sugar metabolism and ethanol production in this study did not require any pretreatment step. Additional supplement of nutrition sources, and further processes could avoid the higher costs of other methods and can be suggested as a potential application for industrial fields. In addition, this research on fermentative utilization of the coffee mucilage is a first attempt to optimize and scale-up ethanol production. The resulting design model and ethanol yield here would be enhanced if other valuable factors were considered and performed at the best performing conditions (oxygen availability, genetically modified yeast strain, impeller type, mixing condition, and others). Therefore, the present study with the coffee mucilage is thought to be a promising alternative agricultural waste feedstock for further re-use and applications with a high ethanol yield.
3. Materials and Methods
3.1. Coffee Mucilage
Coffee mucilage was collected from the San Rafael farm located in the municipality of Envigado (Antioquia, Colombia) at 1575 MASL (meters above sea level) and an average temperature throughout the year of 21 °C. As soon as the coffee mucilage was provided by the San Rafael farm, the materials were sterilized at 121 °C for 15 min and stored at 10 °C. In order to separate the biggest solids in the coffee mucilage, a sample of 500 mL mucilage was sieved over a stainless-steel screen with a 20-mesh opening size (Tyler, USA standard testing sieve, ASTM E11 specification, VWR, Philadelphia, PA, USA). The resulting slurry was centrifuged at 8000 rpm for 5 min to eliminate the remaining solids and identified in regard to the concentration of fermentable sugars, including glucose and galactose by HPLC. The prepared mucilage medium was adjusted to the pH range 4.0 to 7.0 by adding NaOH (pellets) and stored at 4°C until used in fermentation tests.
3.2. Microorganism and Fermentation Experiments
A yeast strain of Saccharomyces cerevisiae NRRL Y-1546 was utilized for all fermentations of the coffee mucilage. This S. cerevisiae is able to metabolize C6 sugars (glucose, fructose, mannose, and galactose) for ethanol fermentation [41,54,55]. Our previous research studies highlighted that S. cerevisiae NRRL Y-1546 was suitable to ferment the sugars in the pretreated-lignocellulosic material hydrolysates and other agricultural residues, which had some inhibitory compounds [41,50,53]; thus, we selected this strain for current work and evaluated the fermentation tests. 2 mL of the stock solution was used for the inoculum preparation in 250 mL Erlenmeyer flasks containing 100 mL YEPD medium (1% yeast extract, 2% peptone, and 2% glucose) [41]. The prepared flasks were cultured in an orbital shaking incubator (Centricol, Colombia) at 30°C, overnight with agitation of 150 rpm. When the cell density was reached to a desired concentration, cells were centrifuged (at 5000 rpm for 5 min), recovered, and re-suspended with YEP medium (no glucose).
For the lab scale tests, batch fermentation tests were performed in 250 mL Erlenmeyer flasks containing 100 mL of the mucilage samples at desired experimental conditions: temperature range of 28–35 °C, pH range of 4.0–7.0, and initial cell concentration range of 3.0–9.0 g L−1 (Table 2). For further tests of the scale-up, 5 L bio-reactors (Bioengineering AFL, Wald, Switzerland) were used in the presence of a 3 L mucilage medium. Scale-up fermentations were carried out at optimal experimental conditions (28 °C, pH 4.0, and an initial cell density of 3 g L−1) obtained from the lab scale tests. Instead of orbital agitation, mixing was performed at 350 rpm using two Rushton impellers. During all fermentation experiments in flasks and bio-reactors, samples were taken regularly for the consumption of fermentable sugars and ethanol production. All the fermentation experiments were carried out in triplicate.
3.3. Analytic Assays
A two-level factorial experimental design and statistical analysis was conducted by Minitab 17 software program. The T-test was performed with >95% significant difference for ethanol production from the coffee mucilage. The fermentable sugars and ethanol were analyzed by high performance liquid chromatography (HPLC) before and after fermentation performances followed by previous works [41,48,49] using a Waters alliance 2695 system coupled to a FID detector with an Aminex HPX-87H ion-exchange column (300 nm × 7.8 mm, Bio-Rad Laboratories, Hercules, CA, USA). The HPLC system was maintained at 60 °C with a 5 mM diluted sulfuric acid in distilled water as eluent mobile phase at 0.6 mL/min flow rate. Other mineral components, including calcium, iron, magnesium, potassium, sodium, and zinc were determined by atomic absorption spectroscopy (ISO 6869:2012) [56]. The analysis of phosphorous and crude protein content were identified by UV-VIS spectrophotometry (ISO method 6498:1998) [57] and Kjeldahl method (ISO method 5983:2005) [58], respectively. The theoretical maximum ethanol yield (26.47 g L−1) was calculated based on the equation; Ymax (g L−1) = G × 0.511, where the value of G represents the initial total fermentable sugars of glucose (37.1 g L−1) and galactose (14.7 g L−1) in the coffee mucilage. A percent of ethanol yield was estimated as per equation; YEtOH (%) = E/Ymax × 100, where E denotes ethanol production during microbial fermentation [59].
4. Conclusions
Coffee mucilage, un-utilized agro-industrial residue from coffee processing, was successfully re-used as a potential substrate for ethanol production. Through the two-level factorial experimental design, the optimal condition for microbial fermentation was obtained at 28 °C, pH 4.0, and initial cell concentration of 3 g L−1, which resulted in 0.46 (g ethanol/g sugars) ethanol concentration with a 90% theoretically achievable value. Such designed conditions applied to 5 L scale-up tests, which improved the final ethanol yield (Yp/s = 0.47 g/g) with a volumetric productivity (Qp) of 2.26 g/Lh. The incubation temperature and initial cell density were considered to be key factors for the conversion of fermentable sugars in the coffee mucilage to ethanol, while the pH value between 4.0 and 7.0 had less effect on the fermentations. The ethanol yield (Yp/s, g ethanol/g substrate) of coffee mucilage is higher than the results from other agro-industrial residues such as barley hay (0.3 g/g), barley straw (0.31 g/g), hay millet (0.27 g/g), sweet sorghum hay (0.31 g/g), triticale hay (0.34 g/g), and wheat straw (0.31 g/g) [59]. Furthermore, the raw coffee mucilage material does not require any pretreatment processes and supplement sources prior to fermentation, which could also be attractive to other applications and utilization in fermentation processes.
Acknowledgments
The authors thank Deisy Sanchez Cuasapud and Doriett Ceilia Prada at the National University of Colombia for their technical assistance; Juan Fernando Botero and Diana Ramirez Lopez of the National University of Colombia for their internal review of this manuscript; Rachel Atherton of Purdue University for her professional assistance in preparing this draft. The authors also thank Michael R. Ladisch and Eduardo A. Ximenes for their assistance and support of David Orrego and Daehwan Kim.
Author Contributions
David Orrego and Arley David Zapata-Zapata started this research at the National University of Colombia and completed with Daehwan Kim at Purdue University. As a principal author of this research, David Orrego performed the designed microbial fermentation experiments and literature research. Arley Zapata-Zapata designed and supported the experiments. Daehwan Kim contributed to summarize, revise, and analyze data for this manuscript.
Conflicts of Interest
The authors declare no conflict of interest.
References
- Moore, P.H.; Ming, R. (Eds.) Genomics of Tropical Crop Plants; Springer: New York, NY, USA, 2008; ISBN 9780387712185. [Google Scholar]
- Souza, R.M. (Ed.) Plant-Parasitic Nematodes of Coffee; Springer: Dordrecht, The Netherlands, 2008; ISBN 9781402087196. [Google Scholar]
- McLellan, T.M.; Caldwell, J.A.; Lieberman, H.R. A review of caffeine’s effects on cognitive, physical and occupational performance. Neurosci. Biobehav. Rev. 2016, 71, 294–312. [Google Scholar] [CrossRef] [PubMed]
- Cappelletti, S.; Daria, P.; Sani, G.; Aromatario, M. Caffeine: Cognitive and Physical Performance Enhancer or Psychoactive Drug? Curr. Neuropharmacol. 2015, 13, 71–88. [Google Scholar] [CrossRef] [PubMed]
- Belitz, H.D.; Grosch, W.; Schieberle, P. Food Chemistry; Springer: Berlin, Germany, 2009; ISBN 9783540699330. [Google Scholar]
- Berbert, P.A.; Queiroz, D.M.; Sousa, E.F.; Molina, M.B.; Melo, E.C.; Faroni, L.R.D. Dielectric properties of parchment coffee. J. Agric. Eng. Res. 2001, 80, 65–80. [Google Scholar] [CrossRef]
- Prata, E.R.B.A.; Oliveira, L.S. Fresh coffee husks as potential sources of anthocyanins. LWT Food Sci. Technol. 2007, 40, 1555–1560. [Google Scholar] [CrossRef]
- Kondamudi, N.; Mohapatra, S.K.; Misra, M. Spent Coffee Grounds as a Versatile Source of Green Energy. J. Agric. Food Chem. 2008, 56, 11757–11760. [Google Scholar] [CrossRef] [PubMed]
- Saenger, M.; Hartge, E.U.; Werther, J.; Ogada, T.; Siagi, Z. Combustion of coffee husks. Renew. Energy 2001, 23, 103–121. [Google Scholar] [CrossRef]
- Bressani, R.; Braham, J.E. (Eds.) Coffee Pulp: Composition, Technology, and Utilization; International Development Research Centre: Ottawa, ON, Canada, 1978. [Google Scholar]
- Bakker, R.R.C. Availability of Lignocellulosic Feedstocks for Lactic Acid Production. Feedstock Availability, Lactic Acid Production Potential and Selection Criteria; Wageningen UR Food & Biobased Research: Wageningen, The Netherlands, 2013; pp. 1–62. [Google Scholar]
- Murthy, P.S.; Madhava Naidu, M. Sustainable management of coffee industry by-products and value addition—A review. Resour. Conserv. Recycl. 2012, 66, 45–58. [Google Scholar] [CrossRef]
- Franca, A.S.; Oliveira, L.S.; Nunes, A.A.; Alves, C.C.O. Microwave assisted thermal treatment of defective coffee beans press cake for the production of adsorbents. Bioresour. Technol. 2010, 101, 1068–1074. [Google Scholar] [CrossRef] [PubMed]
- Oliveira, W.E.; Franca, A.S.; Oliveira, L.S.; Rocha, S.D. Untreated coffee husks as biosorbents for the removal of heavy metals from aqueous solutions. J. Hazard. Mater. 2008, 152, 1073–1081. [Google Scholar] [CrossRef] [PubMed]
- Oliveira, L.S.; Franca, A.S.; Alves, T.M.; Rocha, S.D.F. Evaluation of untreated coffee husks as potential biosorbents for treatment of dye contaminated waters. J. Hazard. Mater. 2008, 155, 507–512. [Google Scholar] [CrossRef] [PubMed]
- Gouvea, B.M.; Torres, C.; Franca, A.S.; Oliveira, L.S.; Oliveira, E.S. Feasibility of ethanol production from coffee husks. Biotechnol. Lett. 2009, 31, 1315–1319. [Google Scholar] [CrossRef] [PubMed]
- Pérez-Sariñana, B.Y.; De León-Rodriguez, A.; Saldaña-Trinidad, S.; Joseph, S.P. Optimization of bioethanol production from coffee mucilage. BioResources 2015, 10, 4326–4338. [Google Scholar] [CrossRef]
- Pérez-Sariñana, B.Y.; Saldaña-Trinidad, S.; Guerrero-Fajardo, C.A.; Santis-Espinosa, L.F.; Sebastian, P.J. A simple method to determine bioethanol production from coffee mucilage, verified by HPLC. BioResources 2015, 10, 2691–2698. [Google Scholar] [CrossRef]
- Machado, C.M.M.; Soccol, C.R.; De Oliveira, B.H.; Pandey, A. Gibberellic acid production by solid-state fermentation in coffee husk. Appl. Biochem. Biotechnol. Part A Enzym. Eng. Biotechnol. 2002, 102–103, 179–191. [Google Scholar] [CrossRef]
- Murthy, P.S.; Naidu, M.M.; Srinivas, P. Production of α-amylase under solid-state fermentation utilizing coffee waste. J. Chem. Technol. Biotechnol. 2009, 84, 1246–1249. [Google Scholar] [CrossRef]
- Borrelli, R.C.; Esposito, F.; Napolitano, A.; Ritieni, A.; Fogliano, V. Characterization of a New Potential Functional Ingredient: Coffee Silverskin. J. Agric. Food Chem. 2004, 52, 1338–1343. [Google Scholar] [CrossRef] [PubMed]
- Napolitano, A.; Fogliano, V.; Tafuri, A.; Ritieni, A. Natural occurrence of ochratoxin A and antioxidant activities of green and roasted coffees and corresponding byproducts. J. Agric. Food Chem. 2007, 55, 10499–10504. [Google Scholar] [CrossRef] [PubMed]
- Mussatto, S.I.; Machado, E.M.S.; Carneiro, L.M.; Teixeira, J.A. Sugars metabolism and ethanol production by different yeast strains from coffee industry wastes hydrolysates. Appl. Energy 2012, 92, 763–768. [Google Scholar] [CrossRef] [Green Version]
- Brand, D.; Pandey, A.; Rodriguez-Leon, J.A.; Roussos, S.; Brand, I.; Soccol, C.R. Packed bed column fermenter and kinetic modeling for upgrading the nutritional quality of coffee husk in solid-state fermentation. Biotechnol. Prog. 2001, 17, 1065–1070. [Google Scholar] [CrossRef] [PubMed]
- Brand, D.; Pandey, A.; Roussos, S.; Soccol, C.R. Biological detoxification of coffee husk by filamentous fungi using a solid state fermentation system. Enzyme Microb. Technol. 2000, 27, 127–133. [Google Scholar] [CrossRef]
- Orozco, A.L.; Pérez, M.I.; Guevara, O.; Rodríguez, J.; Hernández, M.; González-Vila, F.J.; Polvillo, O.; Arias, M.E. Biotechnological enhancement of coffee pulp residues by solid-state fermentation with Streptomyces. Py-GC/MS analysis. J. Anal. Appl. Pyrolysis 2008, 81, 247–252. [Google Scholar] [CrossRef]
- Pandey, A.; Soccol, C.R.; Nigam, P.; Brand, D.; Mohan, R.; Roussos, S. Biotechnological potential of coffee pulp and coffee husk for bioprocesses. Biochem. Eng. J. 2000, 6, 153–162. [Google Scholar] [CrossRef]
- Ulloa Rojas, J.B.; Verreth, J.A.J.; Van Weerd, J.H.; Huisman, E.A. Effect of different chemical treatments on nutritional and antinutritional properties of coffee pulp. Anim. Feed Sci. Technol. 2002, 99, 195–204. [Google Scholar] [CrossRef]
- Heimbach, J.T.; Marone, P.A.; Hunter, J.M.; Nemzer, B.V.; Stanley, S.M.; Kennepohl, E. Safety studies on products from whole coffee fruit. Food Chem. Toxicol. 2010, 48, 2517–2525. [Google Scholar] [CrossRef] [PubMed]
- Murthy, P.S.; Naidu, M.M. Recovery of Phenolic Antioxidants and Functional Compounds from Coffee Industry By-Products. Food Bioprocess Technol. 2012, 5, 897–903. [Google Scholar] [CrossRef]
- Clifford, M.N.; Willson, K.C. (Eds.) Coffee: Botany, Biochemistry and Production of Beans and Beverage; AVI Publishing Company, Inc.: Westport, CT, USA, 1985; ISBN 9781461566595. [Google Scholar]
- Avallone, S.; Guyot, B.; Brillouet, J.M.; Olguin, E.; Guiraud, J.P. Microbiological and biochemical study of coffee fermentation. Curr. Microbiol. 2001, 42, 252–256. [Google Scholar] [CrossRef] [PubMed]
- Esquivel, P.; Jiménez, V.M. Functional properties of coffee and coffee by-products. Food Res. Int. 2012, 46, 488–495. [Google Scholar] [CrossRef]
- Hernández, M.A.; Rodríguez Susa, M.; Andres, Y. Use of coffee mucilage as a new substrate for hydrogen production in anaerobic co-digestion with swine manure. Bioresour. Technol. 2014, 168, 112–118. [Google Scholar] [CrossRef] [PubMed]
- Neu, A.K.; Pleissner, D.; Mehlmann, K.; Schneider, R.; Puerta-Quintero, G.I.; Venus, J. Fermentative utilization of coffee mucilage using Bacillus coagulans and investigation of down-stream processing of fermentation broth for optically pure l(+)-lactic acid production. Bioresour. Technol. 2016, 211, 398–405. [Google Scholar] [CrossRef] [PubMed]
- Margaritis, A.; Bajpai, P. Effect of sugar concentration in Jerusalem artichoke extract on Kluyveromyces marxianus growth and ethanol production. Appl. Environ. Microbiol. 1983, 45, 723–725. [Google Scholar] [PubMed]
- Spencer, J.F.T.; Spencer, D.M. (Eds.) Yeasts in Natural and Artificial Haritats; Springer: Berlin/Heidelberg, Germany, 1997; ISBN 9783642081606. [Google Scholar]
- Campbell, I. Yeast and Fermentation; Elsevier Ltd.: Amsterdam, The Netherlands, 2003; ISBN 9780126692020. [Google Scholar]
- John, I.P.; Ailsa, D.H. Fungi and Food Spoilage; Springer: Berlin/Heidelberg, Germany, 2009; ISBN 9780387922065. [Google Scholar]
- Casey, E.; Sedlak, M.; Ho, N.W.Y.; Mosier, N.S. Effect of acetic acid and pH on the cofermentation of glucose and xylose to ethanol by a genetically engineered strain of Saccharomyces cerevisiae. FEMS Yeast Res. 2010, 10, 385–393. [Google Scholar] [CrossRef] [PubMed]
- Kim, D.; Ximenes, E.A.; Nichols, N.N.; Cao, G.; Frazer, S.E.; Ladisch, M.R. Maleic acid treatment of biologically detoxified corn stover liquor. Bioresour. Technol. 2016, 216, 437–445. [Google Scholar] [CrossRef] [PubMed]
- Casey, E.; Mosier, N.S.; Adamec, J.; Stockdale, Z.; Ho, N.; Sedlak, M. Effect of salts on the Co-fermentation of glucose and xylose by a genetically engineered strain of Saccharomyces cerevisiae. Biotechnol. Biofuels 2013, 6, 1–10. [Google Scholar] [CrossRef] [PubMed]
- Narendranath, N.V.; Thomas, K.C.; Ingledew, W.M. Effects of acetic acid and lactic acid on the growth of Saccharomyces cerevisiae in a minimal medium. J. Ind. Microbiol. Biotechnol. 2001, 26, 171–177. [Google Scholar] [CrossRef] [PubMed]
- Pampulha, M.E.; Loureiro-Dias, M.C. Combined effect of acetic acid, pH and ethanol on intracellular pH of fermenting yeast. Appl. Microbiol. Biotechnol. 1989, 31, 547–550. [Google Scholar] [CrossRef]
- Van Maris, A.J.A.; Abbott, D.A.; Bellissimi, E.; van den Brink, J.; Kuyper, M.; Luttik, M.A.H.; Wisselink, H.W.; Scheffers, W.A.; van Dijken, J.P.; Pronk, J.T. Alcoholic fermentation of carbon sources in biomass hydrolysates by Saccharomyces cerevisiae: Current status. Antonie van Leeuwenhoek 2006, 90, 391–418. [Google Scholar] [CrossRef] [PubMed]
- Ximenes, E.; Kim, Y.; Mosier, N.; Dien, B.; Ladisch, M. Deactivation of cellulases by phenols. Enzyme Microb. Technol. 2011, 48, 54–60. [Google Scholar] [CrossRef] [PubMed]
- Ximenes, E.; Kim, Y.; Mosier, N.; Dien, B.; Ladisch, M. Inhibition of cellulases by phenols. Enzyme Microb. Technol. 2010, 46, 170–176. [Google Scholar] [CrossRef]
- Cao, G.; Ximenes, E.; Nichols, N.N.; Frazer, S.E.; Kim, D.; Cotta, M.A.; Ladisch, M. Bioabatement with hemicellulase supplementation to reduce enzymatic hydrolysis inhibitors. Bioresour. Technol. 2015, 190, 412–415. [Google Scholar] [CrossRef] [PubMed]
- Kim, D.; Orrego, D.; Ximenes, E.A.; Ladisch, M.R. Cellulose conversion of corn pericarp without pretreatment. Bioresour. Technol. 2017, 245, 511–517. [Google Scholar] [CrossRef] [PubMed]
- Kim, D. Physico-Chemical Conversion of Lignocellulose: Inhibitor Effects and Detoxification Strategies: A Mini Review. Molecules 2018, 23, 309. [Google Scholar] [CrossRef] [PubMed]
- Adeboye, P.T.; Bettiga, M.; Aldaeus, F.; Larsson, P.T.; Olsson, L. Catabolism of coniferyl aldehyde, ferulic acid and p-coumaric acid by Saccharomyces cerevisiae yields less toxic products. Microb. Cell Fact. 2015, 14, 149. [Google Scholar] [CrossRef] [PubMed]
- Klinke, H.B.; Thomsen, A.B.; Ahring, B.K. Inhibition of ethanol-producing yeast and bacteria by degradation products produced during pre-treatment of biomass. Appl. Microbiol. Biotechnol. 2004, 66, 10–26. [Google Scholar] [CrossRef] [PubMed]
- Kim, Y.; Kreke, T.; Hendrickson, R.; Parenti, J.; Ladisch, M.R. Fractionation of cellulase and fermentation inhibitors from steam pretreated mixed hardwood. Bioresour. Technol. 2013, 135, 30–38. [Google Scholar] [CrossRef] [PubMed]
- Kim, D.; Ku, S. Beneficial Effects of Monascus sp. KCCM 10093 Pigments and Derivatives: A Mini Review. Molecules 2018, 23, 98. [Google Scholar] [CrossRef] [PubMed]
- Kim, D.; Ku, S. Bacillus Cellulase Molecular Cloning, Expression, and Surface Display on the Outer Membrane of Escherichia coli. Molecules 2018, 23, 503. [Google Scholar] [CrossRef] [PubMed]
- International Oranization for Standardization. ISO 6869 Animal Feeding Stuffs—Method Using Atomic Absorption Spectrometry; ISO: Geneva, Switzerland, 2000. [Google Scholar]
- International Oranization for Standardization. Validating UV/Visible Spectrophotometers; ISO: Geneva, Switzerland, 1998; pp. 1–10. [Google Scholar]
- International Oranization for Standardization. International Standard; ISO: Geneva, Switzerland, 2005. [Google Scholar]
- Chen, Y.; Sharma-Shivappa, R.R.; Keshwani, D.; Chen, C. Potential of agricultural residues and hay for bioethanol production. Appl. Biochem. Biotechnol. 2007, 142, 276–290. [Google Scholar] [CrossRef] [PubMed]
Figure 1.
The structure of the coffee fruit.

Figure 2.
(A) The main effect of temperature, pH, and inoculum concentration on the ethanol production from coffee mucilage; (B) Pareto chart of individual and reciprocal interaction effects of temperature, pH, and inoculum concentration. A: temperature, B: pH, C: inoculum concentration.
Figure 2.
(A) The main effect of temperature, pH, and inoculum concentration on the ethanol production from coffee mucilage; (B) Pareto chart of individual and reciprocal interaction effects of temperature, pH, and inoculum concentration. A: temperature, B: pH, C: inoculum concentration.

Figure 3.
Contour plots present effect of varying (A) temperature and inoculum; (B) temperature and pH; and (C) inoculum and pH. The dark green and dark blue colors denote a high ethanol concentration and a low ethanol concentration, respectively. The fitted optimal conditions with two dominant factors of temperature and initial cell concentration are presented by the surface plot (D).


Figure 4.
Consumption of glucose and galactose and production of ethanol during microbial fermentation in the (A) flasks level and (B) scale-up at 5 L bio-reactors. All experimental tests were performed at 28 °C, pH 4.0, and initial cell concentration of 3 g L−1. Orbital shake agitation of 150 rpm was utilized for the flasks fermentation while a double Rushton impeller at 350 rpm was used for the 5 L bio-reactors fermentation.


Table 1.
Chemical composition of coffee mucilage.
| (A) Component | Concentration (g L−1) |
| Glucose | 37.1 |
| Galactose | 14.7 |
| Lactose | 0.8 |
| Acetic acid | 1.2 |
| Protein | 0.3 |
| (B) Mineral | Parts-Per-Million (ppm) |
| Calcium | 337 |
| Iron | 73 |
| Magnesium | 81 |
| Potassium | 116 (mg L−1) |
| Phosphorus | 115 |
| Sodium | 29 |
Table 2.
Two-level full factorial experimental design and brief summary of the results. Ethanol fermentation tests were carried out in 250 mL Erlenmeyer flasks at the given experimental conditions for 24 h with agitation of 150 rpm in a shaking incubator. All tests were performed in triplicate.
Table 2.
Two-level full factorial experimental design and brief summary of the results. Ethanol fermentation tests were carried out in 250 mL Erlenmeyer flasks at the given experimental conditions for 24 h with agitation of 150 rpm in a shaking incubator. All tests were performed in triplicate.
| Experiment | Temperature (°C) | pH | Inoculum (g L−1) | Ethanol Production (g L−1) | Standard Deviation (g L−1) | Percent Ethanol Yield (%) |
|---|---|---|---|---|---|---|
| 1 | 28.0 | 4.0 | 3.0 | 22.2 | 0.8 | 83.9 |
| 2 | 35.0 | 4.0 | 3.0 | 20.3 | 1.2 | 76.8 |
| 3 | 28.0 | 7.0 | 3.0 | 21.6 | 1.3 | 81.8 |
| 4 | 35.0 | 7.0 | 3.0 | 20.0 | 0.8 | 75.5 |
| 5 | 28.0 | 4.0 | 6.0 | 21.6 | 0.7 | 81.5 |
| 6 | 35.0 | 4.0 | 6.0 | 18.4 | 1.2 | 69.3 |
| 7 | 28.0 | 7.0 | 6.0 | 19.2 | 1.1 | 72.5 |
| 8 | 35.0 | 7.0 | 6.0 | 17.4 | 0.9 | 65.8 |
| 9 | 31.5 | 5.5 | 4.5 | 19.6 | 1.2 | 73.9 |
Table 3.
Comparison of ethanol productions from coffee by-products of mucilage, silver-skin, and grounds using different yeast strains.
Table 3.
Comparison of ethanol productions from coffee by-products of mucilage, silver-skin, and grounds using different yeast strains.
| Yeast Strain | Ethanol Yield (g ethanol/g Substrate) | Reference | ||
|---|---|---|---|---|
| Coffee Mucilage | Coffee Silver-Skin | Spent Coffee Grounds | ||
| S. cerevisiae (NRRL Y-1546) | 0.46 ± 0.02 | - | - | Current Study |
| P. stiptis (NRRL-Y-7124) | - | 0.11 ± 0.02 | 0.26 ± 0.01 | [23] |
| S. cerevisiae (RL-11) | - | 0.13 ± 0.03 | 0.26 ± 0.02 | [23] |
| K. fragilis (Kf1) | - | 0.01 ± 0.00 | 0.13 ± 0.02 | [23] |
© 2018 by the authors. Licensee MDPI, Basel, Switzerland. This article is an open access article distributed under the terms and conditions of the Creative Commons Attribution (CC BY) license (http://creativecommons.org/licenses/by/4.0/).
Share and Cite
MDPI and ACS Style
Orrego, D.; Zapata-Zapata, A.D.; Kim, D. Optimization and Scale-Up of Coffee Mucilage Fermentation for Ethanol Production. Energies 2018, 11, 786. https://doi.org/10.3390/en11040786
AMA Style
Orrego D, Zapata-Zapata AD, Kim D. Optimization and Scale-Up of Coffee Mucilage Fermentation for Ethanol Production. Energies. 2018; 11(4):786. https://doi.org/10.3390/en11040786
Chicago/Turabian StyleOrrego, David, Arley David Zapata-Zapata, and Daehwan Kim. 2018. "Optimization and Scale-Up of Coffee Mucilage Fermentation for Ethanol Production" Energies 11, no. 4: 786. https://doi.org/10.3390/en11040786
Note that from the first issue of 2016, this journal uses article numbers instead of page numbers. See further details here.