A Novel Hybrid Wind-Wave Energy Converter for Jacket-Frame Substructures


School of Engineering, University of Plymouth, Reynolds Building, PL4 8AA Plymouth, UK
*
Author to whom correspondence should be addressed.
Energies 2018, 11(3), 637; https://doi.org/10.3390/en11030637
Submission received: 27 February 2018
/
Revised: 9 March 2018
/
Accepted: 11 March 2018
/
Published: 13 March 2018
(This article belongs to the Special Issue Offshore Renewable Energy: Ocean Waves, Tides and Offshore Wind)
Abstract
:The growth of the offshore wind industry in the last couple of decades has made this technology a key player in the maritime sector. The sustainable development of the offshore wind sector is crucial for this to consolidate within a global scenario of climate change and increasing threats to the marine environment. In this context, multipurpose platforms have been proposed as a sustainable approach to harnessing different marine resources and combining their use under the same platform. Hybrid wind-wave systems are a type of multipurpose platform where a single platform combines the exploitation of offshore wind and wave energy. In particular, this paper deals with a novel hybrid wind-wave system that integrates an oscillating water column wave energy converter with an offshore wind turbine on a jacket-frame substructure. The main objective of this paper is to characterise the hydrodynamic response of the WEC sub-system of this hybrid energy converter. A 1:50 scale model was tested under regular and irregular waves to characterise the hydrodynamic response of the WEC sub-system. The results from this analysis lead to the proof of concept of this novel hybrid system; but additionally, to characterising its behaviour and interaction with the wave field, which is a requirement for fully understanding the benefits of hybrid systems.
1. Introduction
In the last couple of decades, offshore wind energy has become a major player in the world’s renewable energy sector, with 15.8 GW of installed capacity in Europe at the end of 2017 [1]. This exceptional development has been, to a large extent, driven by the relatively shallow waters and good wind resources of the North Sea, which washes the shores of one of the most industrialised regions of the planet [2]. The great potential for development of offshore wind has raised the expectations that this will play a leading role in Europe’s future energy supply, pushing its industry to establish a target of 460 GW of installed capacity by 2050 [3]. It is clear that, for this target to be realised, a significant increase must be achieved, especially by developing deep water and floating substructure systems.
In a global scenario of climate change and amid mounting threats to the marine environment [4,5,6,7], the sustainable development of offshore wind is not only crucial for the consolidation of the industry, but also to providing a reliable and accessible source of renewable energy. In this context, multipurpose platforms have been suggested as a sustainable means of exploitation of certain maritime resources, which are usually in the same area [8,9,10,11]—e.g., marine renewable energies (MREs), food resources (fisheries and aquaculture), maritime transport and leisure, among others. On the basis of the strong synergies between offshore wind and wave energy [12,13,14], hybrid wind-wave systems have been proposed as one of the most promising types of multipurpose platforms [15].
Previous works on hybrid systems have mostly been grouped around some EU-funded projects, whose aim was to develop some conceptual ideas and set the basis for future developments, defining guidelines and recommended practices for the wider group of multipurpose platforms [16,17,18,19,20]. This work has been complemented with some concepts proposed by the industry, e.g., [21,22,23,24]. At the moment of writing, there are only a few scientific publications dealing with hybrid systems [25,26,27,28], with most of the previous work around the wider group of combined wind-wave systems [29]. The characterisation of the combined resource together with the study of the potential combination of both technologies has been studied by [30,31,32]—e.g., through the co-location feasibility index [33,34]. The effects of the temporal correlation of both wind and wave resources on the combined power output and its grid integration have been studied by [35,36,37,38,39,40,41,42,43]. The study of the shadow-effect of co-located wind-wave farms on the operation and cost of the overall farm was carried out by [44,45,46].
In particular, this research deals with the development of a novel hybrid wind-wave energy converter for jacket-frame offshore wind substructures. The proposed hybrid system integrates an oscillating water column (OWC) wave energy converter (WEC) sub-system with a jacket-frame type of offshore wind substructure. An intensive test campaign was carried out using a 1:50 scale model of the hybrid device to characterise the hydrodynamic response of the WEC sub-system. This was carried out following a three-step methodology: (i) the interaction between the device and its surrounding wave field was studied by means of an incident and reflected wave analysis (IRWA); (ii) the performance of the OWC was studied using the capture width ratio; and (iii) the response of the main parameters influencing the performance of the OWC—i.e., the free surface elevation and the pneumatic pressure inside the OWC chamber—was studied by means of the response amplitude operator (RAO).
The content of this article is structured as follows. Section 2 defines the hybrid device’s WEC sub-system. Section 3 tackles the materials and methods for the experimental campaign, including the physical model, the experimental set-up and programme, and the data analysis. The results are presented in Section 4 and discussed in Section 5. Finally, conclusions are drawn in Section 6.
2. The OWC WEC Sub-System
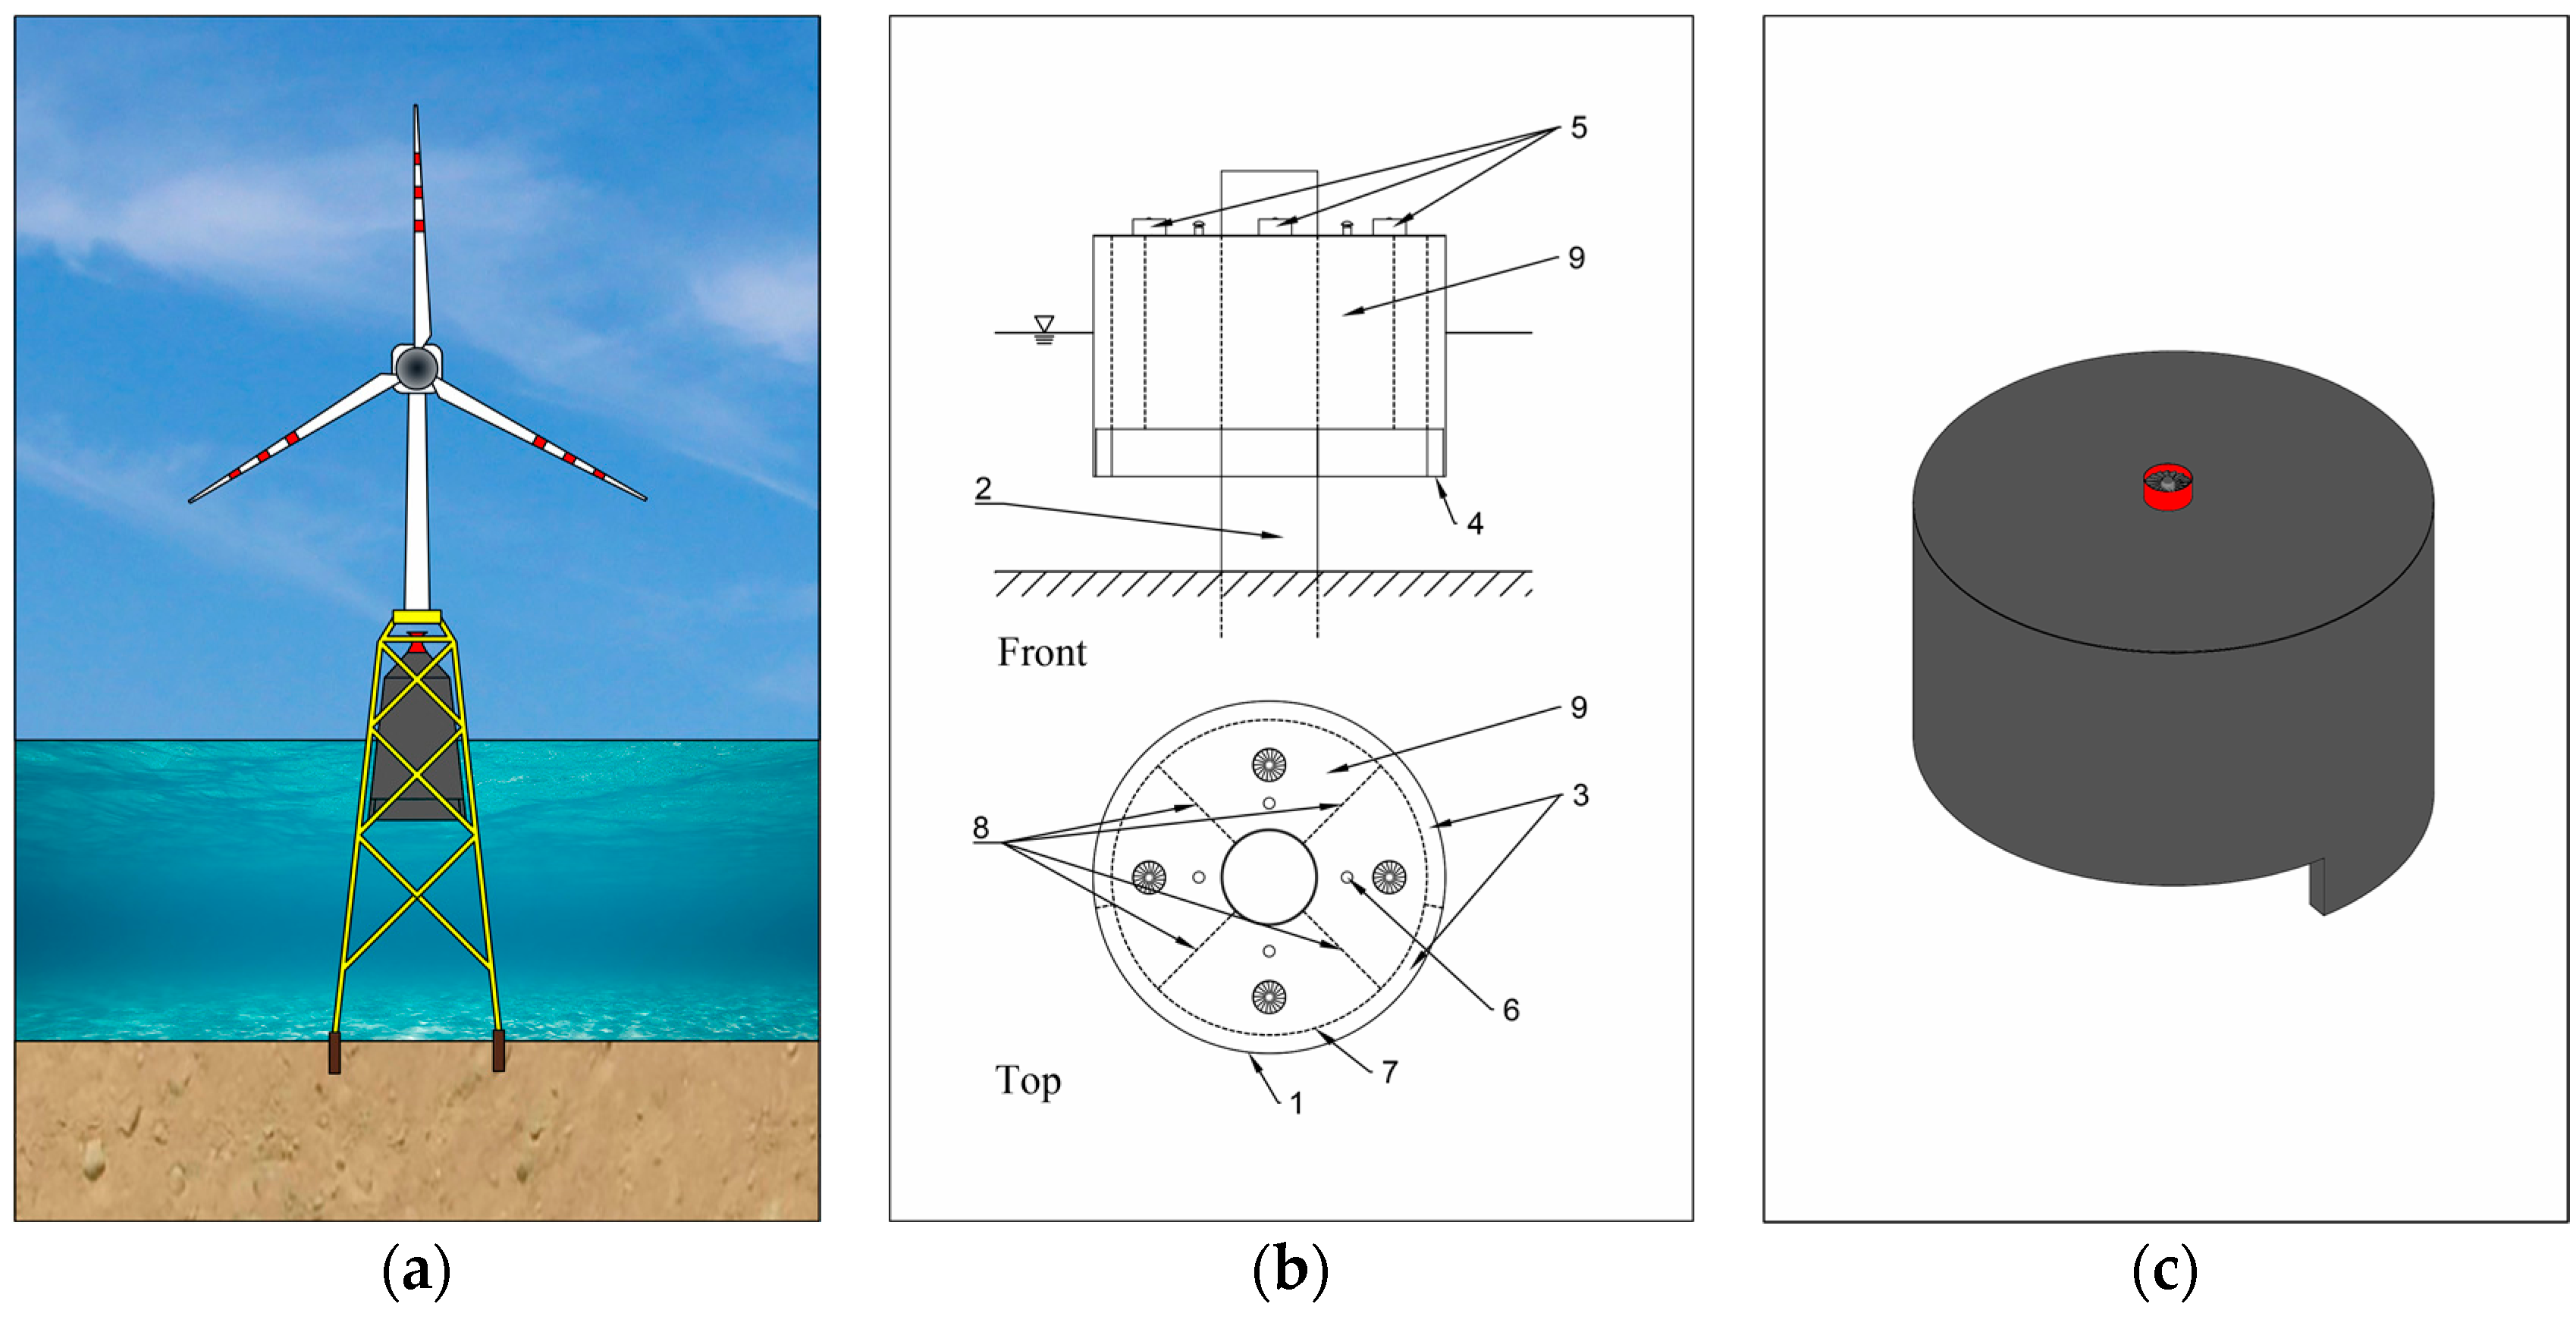
The hybrid wind-wave energy converter concept considered for this work builds on that presented in [47] (Figure 1a). An OWC WEC sub-system prototype (Figure 1c) was outlined in the framework of a new patent [48], with number WO2016185189A1. A novel hybrid wind-wave energy converter is defined, where the OWC chamber forming the WEC sub-system has the capability to self-adapt to different wave heights and tidal ranges as well as to the direction of the incident waves. The adaptability of the OWC chamber is achieved by means of a self-adaptable skirt and the change of the relative position between the chamber and the substructure.
Figure 1b shows a schematic representation of one of the possible configurations of the prototype. The figure shows frontal and top views of the device, where some of its components and parts are indicated. The proposed device is formed by a chamber (1); a substructure system (2) to link the device to the seabed (i.e., usually the substructure system will be shared with a wind turbine); a ballast tank (3), defined as part of the hull of the chamber between the inner (7) and external walls of the chamber; a skirt (4) or extension at the bottom of the chamber; one or more air turbines (5), which act as the OWC power take-off, driving the electric generator to produce electricity; a security and control system including pressure relief valves (6); and a set of bulkheads (8) that provide structural strength and divide the internal part of the chamber into separate segments (9). Note that the numbers shown in brackets refer to those in the figure.
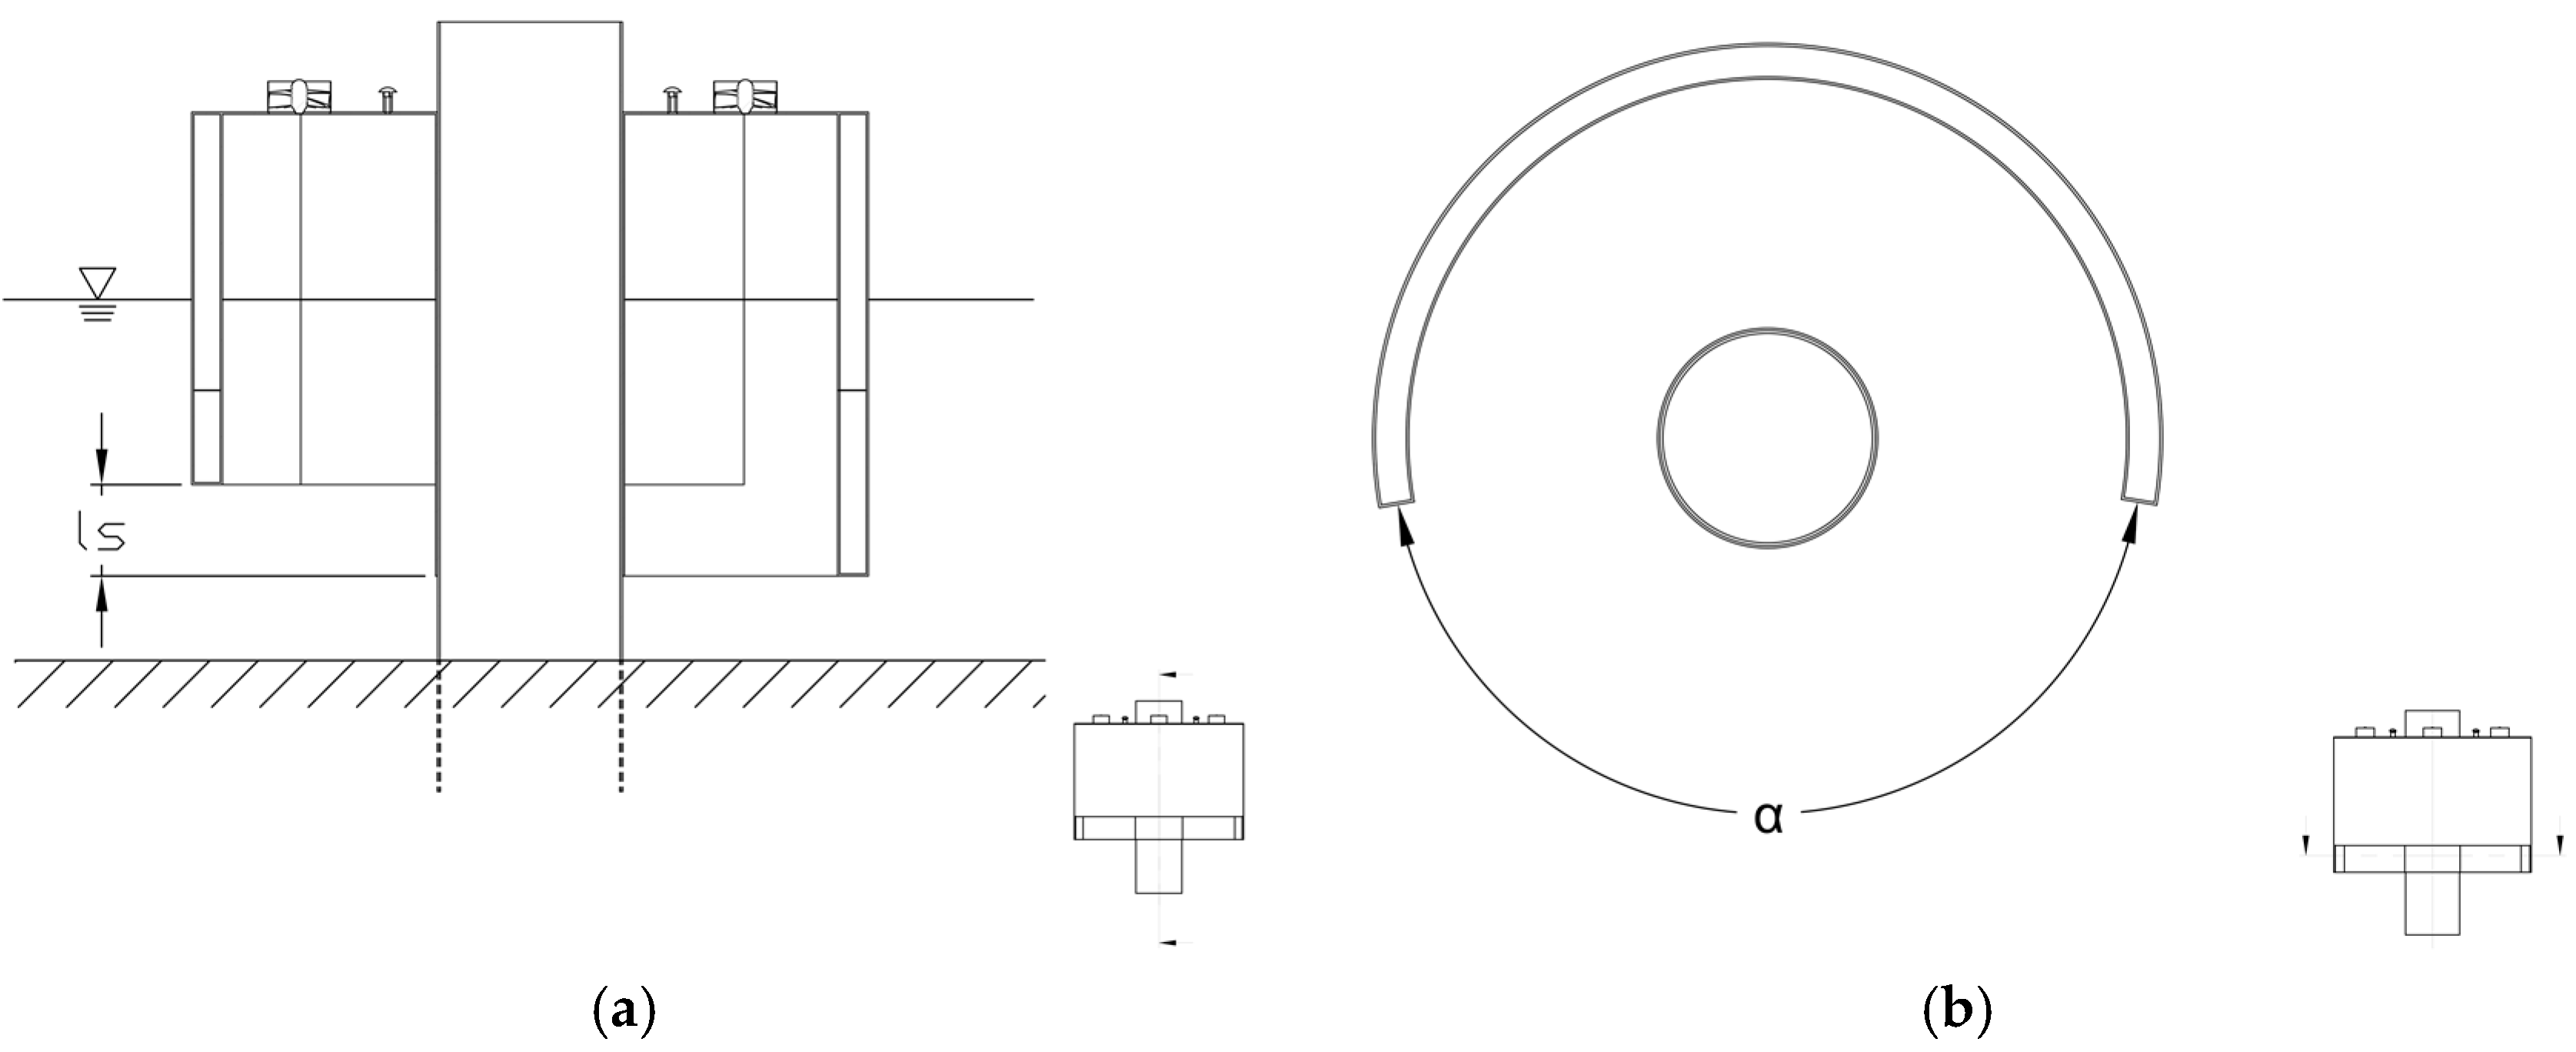
The hybrid system proposed in the patent includes an OWC WEC sub-system that integrates a skirt of a certain length lS (Figure 2a) over a certain angular sector α (Figure 2b). The device can be either designed for the skirt length and aperture angle to be constant, or equipped with a mechanism that enables the aperture angle and depth to be modified.
3. Materials and Methods
3.1. The Physical Model
A 1:50 scale model of the proposed hybrid wind-wave energy converter was built. The design of the model (Figure 3) considered the limitations of the experimental facility—e.g., the wave maker capabilities and main dimensions of the flume [49], and tank blockage effects [50]—together with various guidelines and recommended practices for physical modelling of WECs [51,52]. A jacket-frame substructure proposed by [53] was considered to define the model for a 50 m water depth site [54]. Froude similitude and geometrical similarity were considered to define the jacket frame and the section of the OWC chamber below the mean water level. However, the volume of the pneumatic section of the OWC—i.e., the OWC chamber above the mean water level—was scaled [55,56,57] using λ2 as the scale ratio, rather than the λ3 dictated by Froude similarity, to account for air compressibility [58,59]. The jacket-frame substructure was the limiting factor in designing the OWC subsystem, and in particular in defining its diameter, which was selected to fit within the jacket-frame, and so that the connection pipe between the OWC chamber and the air reservoir could pass through the top aperture of the jacket-frame. Table 1 shows the main characteristics and dimensions of the model.
The model was built out of four different parts. First, a lattice of welded carbon steel pipes was used for the jacket-frame. A clear acrylic pipe of 0.16 m diameter was used for the OWC chamber. The air reservoir—for the additional volume of air—was built using galvanised steel pipe of 0.45 m diameter and galvanised sheets. Finally, the section linking the OWC chamber and the air reservoir was built using the same acrylic pipe as for the OWC chamber.
The damping exerted on the OWC chamber by an impulse turbine can be modelled by means of an orifice [60,61]. But if further calculations concerning the efficiency of the turbine are required, the orifice may be replaced by an Actuator Disk Model in the case of a numerical simulation [62,63]. In order to study the effect of the turbine-chamber coupling in the model, three different orifice sizes (turbine damping) were considered [64]. The diameter of the orifices was selected for three values of the area coefficient—i.e., the area coefficient is defined as the ratio between the area of the orifice and the water plane area of the inner OWC chamber—of 0.5%, 1% and 1.5% [65].
3.2. Experimental Set-Up and Testing Programme
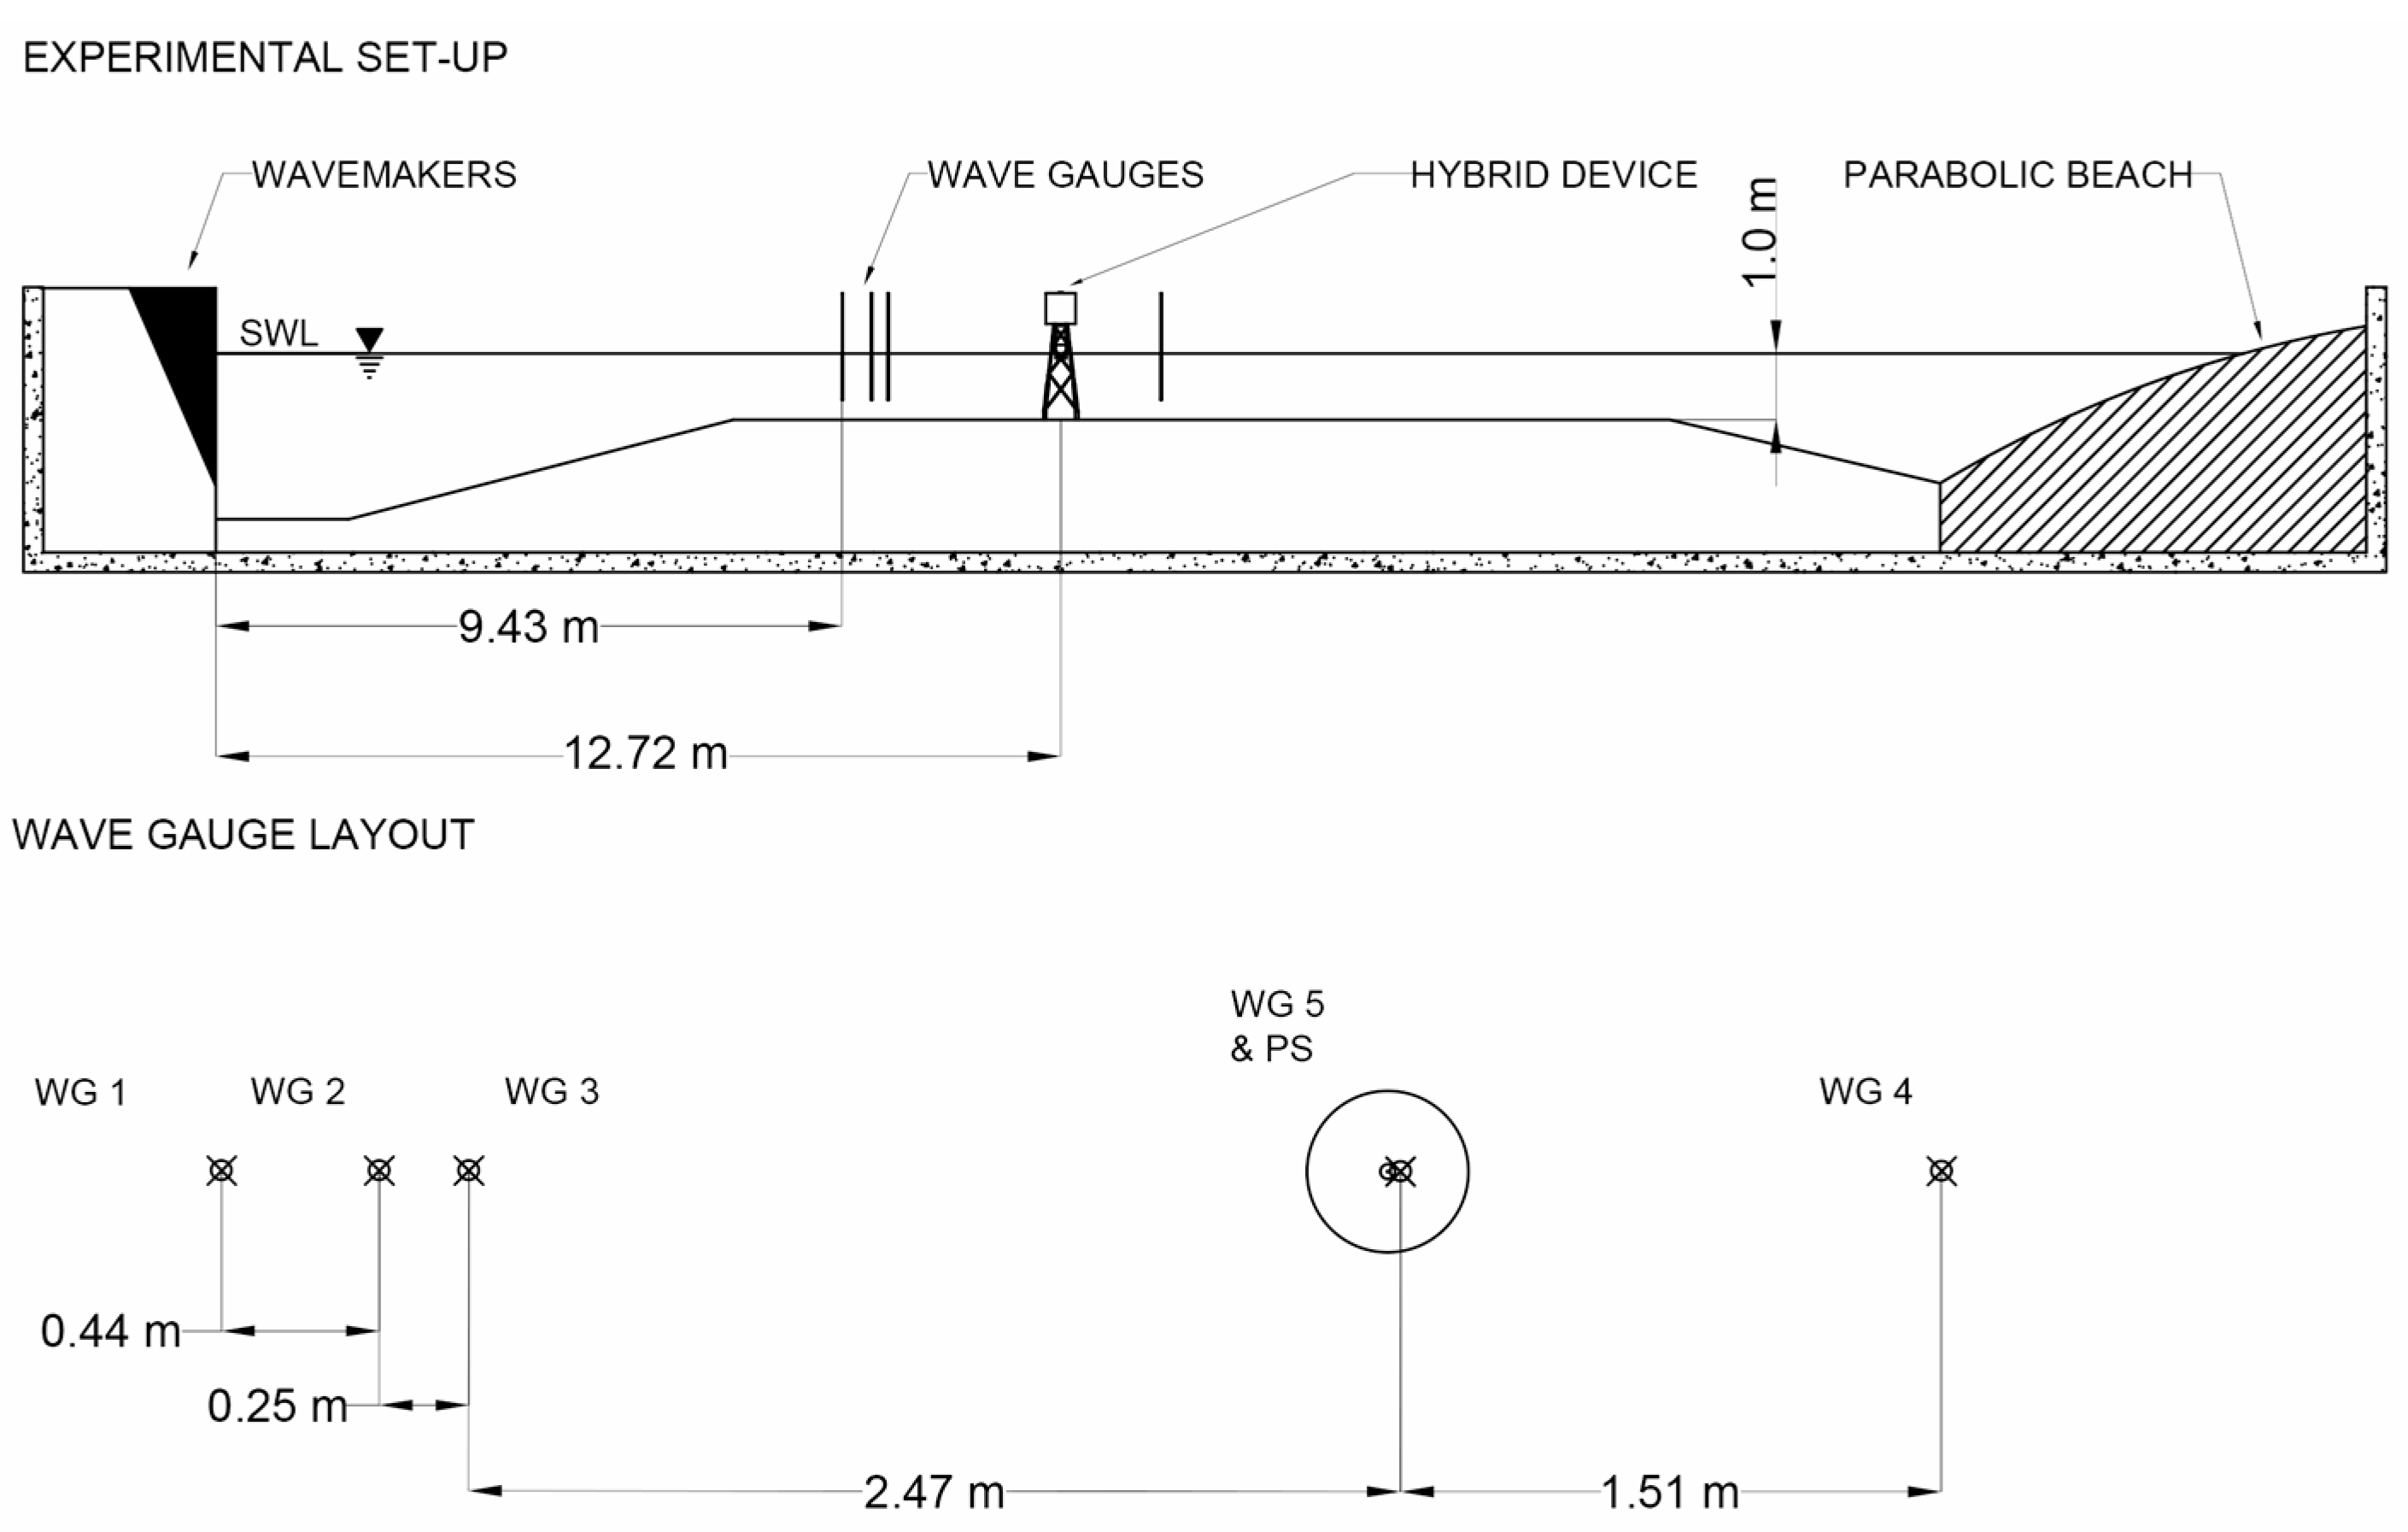
The ocean basin at the University of Plymouth’s COAST Laboratory was the facility selected to conduct the experimental campaign. This has a total length of 35 m, a width of 15.5 m and a variable floor depth that, for the purpose of this study, was adjusted at 1.0 m to match the Wave Hub test site—i.e., a test centre of the North coast of Cornwall and in particular in selecting the wave conditions. Waves are generated from a flap-type wave-maker, from Edinburg Designs, Ltd. (EDL, Edinburgh, UK). The reference system adopted for the experimental set-up defines: the longitudinal axis (Ox), passing through the mid plane of the basin, with x = 0 at the wave-makers and positive towards the model; the vertical axis (Oz), with positive direction upwards and z = 0 at the still water level; and the transversal axis (Oy), perpendicular to the basin, with positive direction such that the trihedral Oxyz has a positive orientation.
The free surface displacement along the basin was measured using four conductive wave gauges (WGs), and the displacement of the free surface inside the OWC chamber with an additional WG (Figure 4). The first group of WGs (WG1, WG2 and WG3) were positioned along the centreline of the basin, at x1 = 9.43 m, x2 = 9.87 m and x3 = 10.12 m, to record the data for an IRWA. The fourth (WG4) was positioned in the lee of the model along the centreline of the basin, at x4 = 14.23 m, to record the transmitted wave. The remaining wave gauge (WG5) was positioned inside the OWC chamber at x5 = 12.72 m, to measure the free surface oscillation inside the chamber. In addition, a differential pressure transducer (PT), PX2300-0.5BDI, from Omega was used to measure the differential pneumatic pressure between inside and outside the OWC chamber. Data were acquired using Edinburg Designs hardware and a National Instruments acquisition system for the wave WG and the PT, respectively, both at a sampling frequency of 128 Hz.
The experimental programme was defined for a range of regular and irregular wave conditions and three different orifice sizes—note that for irregular waves, only the intermediate orifice size was used. Following [51,66], the tests were structured into three different series, one for regular waves (Series A) and two for irregular waves (Series B and Series C). Series A defines regular waves by combining five wave heights (H = 1.5, 2.5, 3.5, 4.5 and 5.5 m, in prototype values) and seven wave periods (T = 7, 8, 9, 10, 11, 12 and 13 s, also in prototype values). The duration of the tests was defined to cover at least 100 waves. Series B defines six sea states using a joint North Sea wave project (JONSWAP) spectrum [49], to study the hydrodynamic response of the device under irregular waves. In addition, the effect of the wave period on the response of the device is studied in Series C, which is defined for seven JONSWAP sea states with the same significant wave height and different peak wave periods (Table 2). The duration of all the irregular tests was selected to match 60 min at prototype scale following [51], covering between 271 and 571 waves.
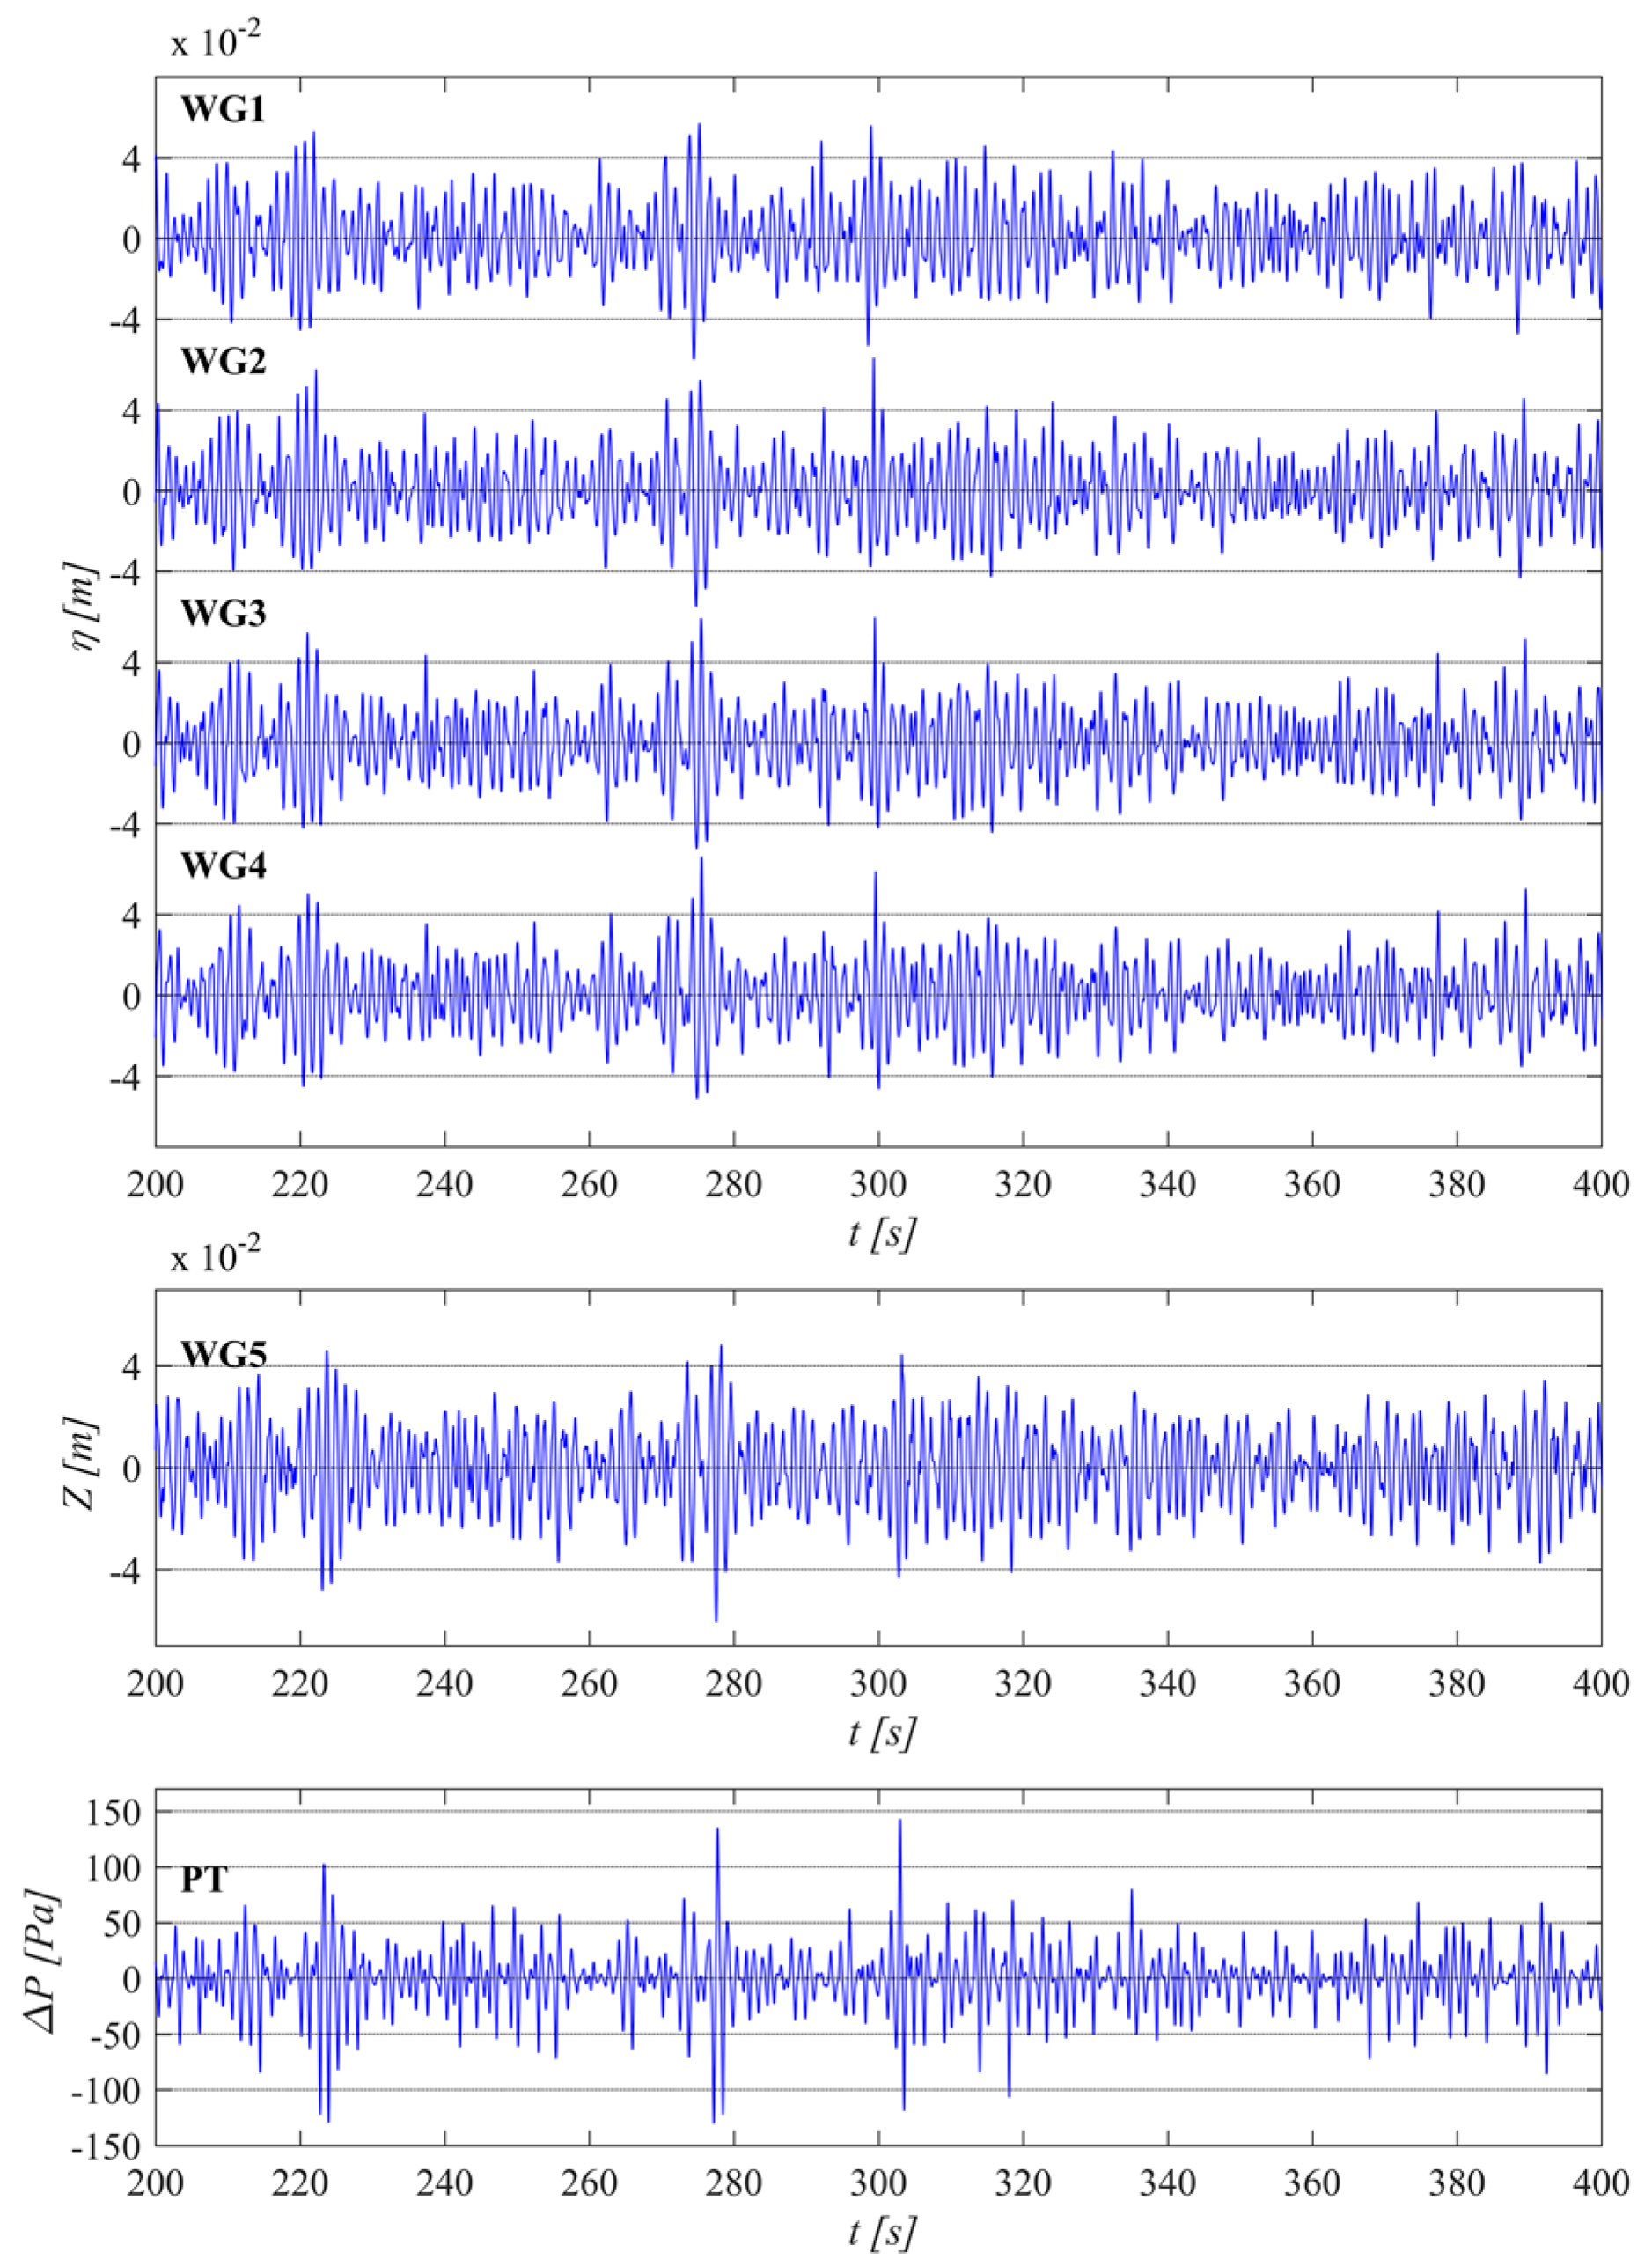
The time series of the free surface elevation recorded from the wave gauges at their different positions along the basin, the free surface recorded by the wave gauge inside the oscillating water column and the differential pneumatic pressure between inside and outside the OWC chamber recorded by the pressure transducer are presented in Figure 5 as an example of an irregular waves test.
3.3. Data Analysis
Incident and reflected waves were characterised following the incident and reflected wave analysis (IRWA) method proposed by [67,68]. Data from the frontal group of wave gauges (WG1, WG2 and WG3) were used as input for the method. Based on the incident and reflected wave heights and on the transmitted wave height obtained from the wave gauge in the lee of the model (WG4), the reflection and transmission coefficients (KR and KT) can be defined for regular waves [69] as
and for irregular waves as
where m0i is the generic zero order moment,
Si is a generic power spectral density, and the respective incident, reflected and transmitted zero-order moments (m0I, m0R and m0T) can be obtained by replacing Si with the power spectral density of the respective incident, reflected and transmitted waves.
The wave energy flux, or mean power for the incident waves per metre of wave front (J), can be calculated from the incident wave from the IRWA for regular waves
and for irregular waves
where ρw is the water density; g the gravitational acceleration; HI the incident wave height: N is the number of frequency components or bands (for each Δf), and Si and (cg)i are the spectral density and the group velocity for the i-th band, respectively. The group velocity is given by
where h is the water depth, ki the wave number for the i-th frequency band and ci is the phase celerity,
where ωi is the angular frequency of the i-th band, obtained from the dispersion relationship,
The mean pneumatic power of the OWC (Pm) during a test can be defined, following [64], by
where ∆p is the relative pressure, i.e., the pressure difference between the inner chamber and the atmosphere, q is the volumetric air flow rate through the chamber’s orifice, t is time and tmax is the duration of the test. Here, ∆p is directly obtained from the differential pressure transducer (PT) data, while q is approximated assuming incompressible flow and using the velocity of the free surface inside the inner chamber [60,70], obtained by numerical differentiation of the free surface elevation recorded by wave gauge WG5.S.
The capture width ratio (CWR) is the parameter used to evaluate the performance of the WEC sub-system. CWR is defined as the ratio between the power absorbed by the WEC—i.e., the mean pneumatic power (Pm)—and the wave power incident on the device per metre of wave front (J) times a relevant dimension of the device (b) in m—i.e., for this paper, this is the external diameter of the chamber (dOWC)—
The response amplitude operator (RAO) is used to characterise the response of the two main parameters controlling the performance of the device—i.e., the amplitude of the free surface oscillation and the pneumatic pressure of the OWC chamber—against the incident wave. The RAO operator for the translation motion of the chamber’s free surface oscillation in heave (RAOC) can be rewritten as
where HI is the incident wave height and HC is the chamber’s free surface oscillation height. A similar approach is followed for the RAO of the pneumatic pressure (RAOP), but divided by the water density (ρw) and the gravitational acceleration (g) to make the RAO non-dimensional
where HI is the incident wave height and HP is the variation of the pneumatic pressure height.
The five parameters defined to characterise the hydrodynamic response of the hybrid device (KR, KT, CWR, RAOC and RAOP) depend not only on the wave conditions (wave height and period) but also on the damping induced by the orifice on the OWC system [71]. To quantify its influence, the dimensionless damping coefficient (B*) can be defined, following [49], as
where ∆p is the pressure between the chamber and the atmosphere, q is the volumetric air-flow rate through the chamber’s orifice, and ρa is the air density. For this work, the damping coefficients for the three orifice diameters tested (do = 11, 15 and 19 mm) are B* = 64.10, 47.87 and 39.59, respectively.
4. Results
4.1. Incident and Reflected Wave Analysis (IRWA)
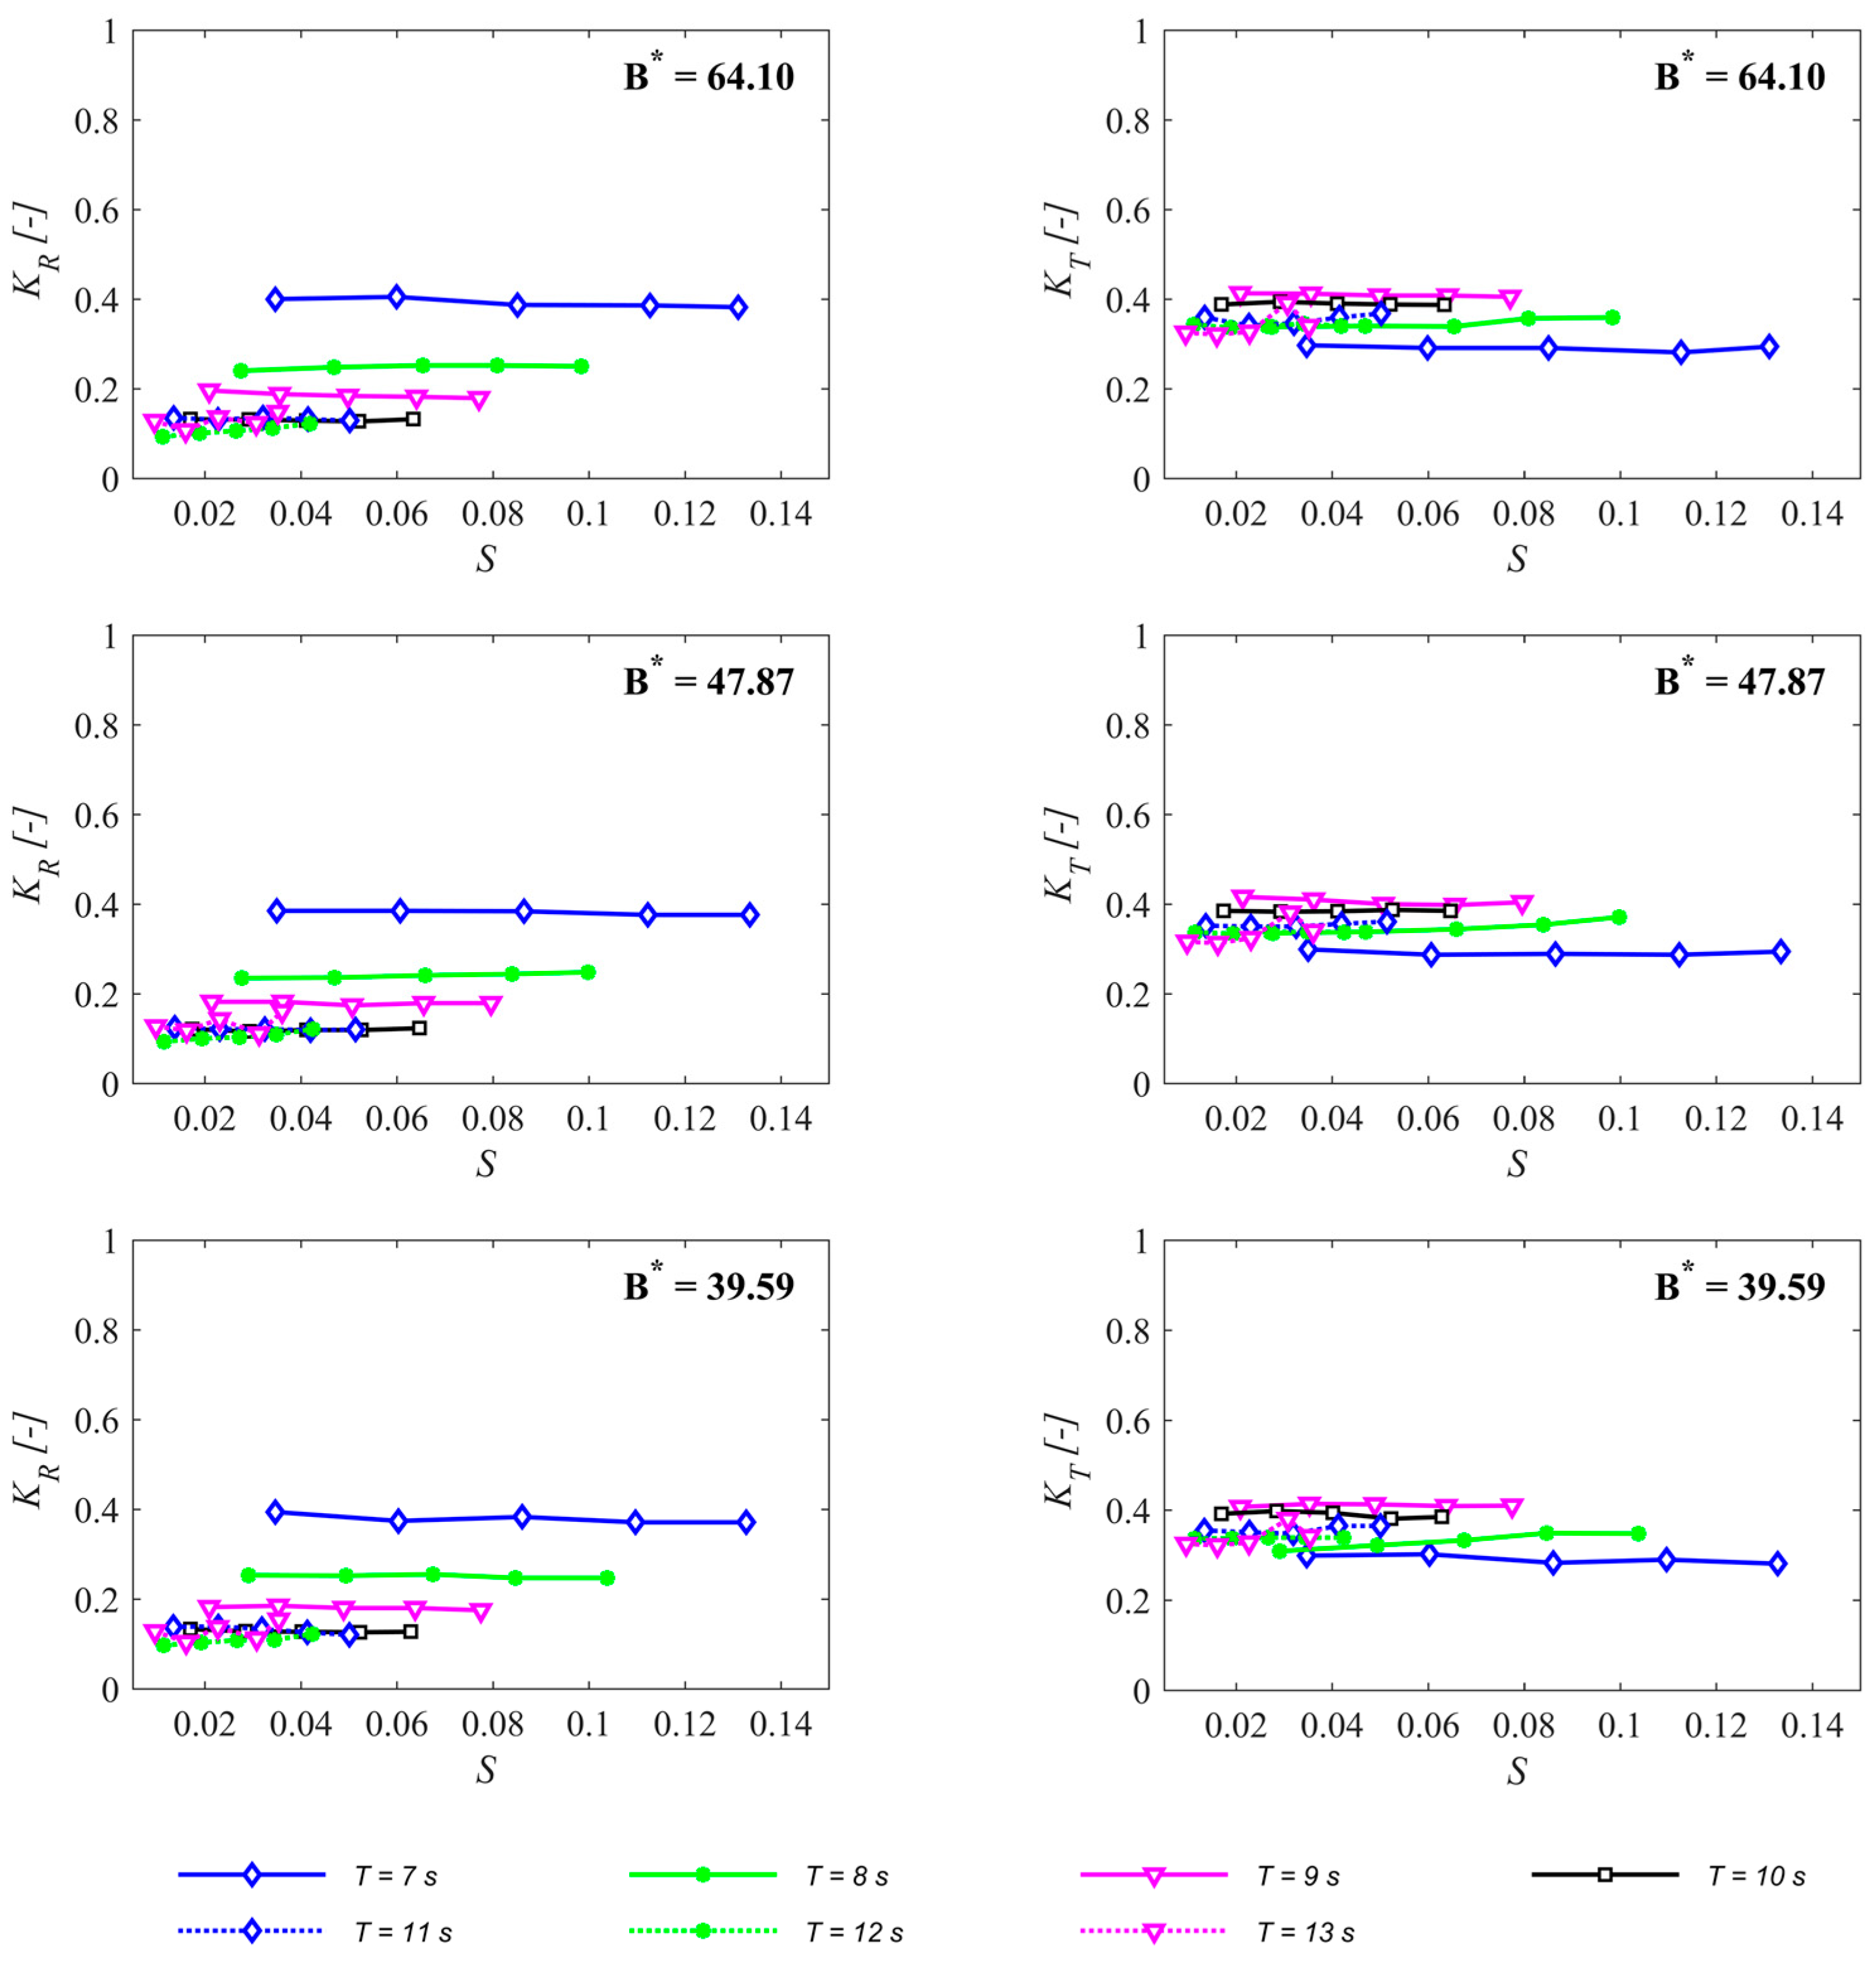
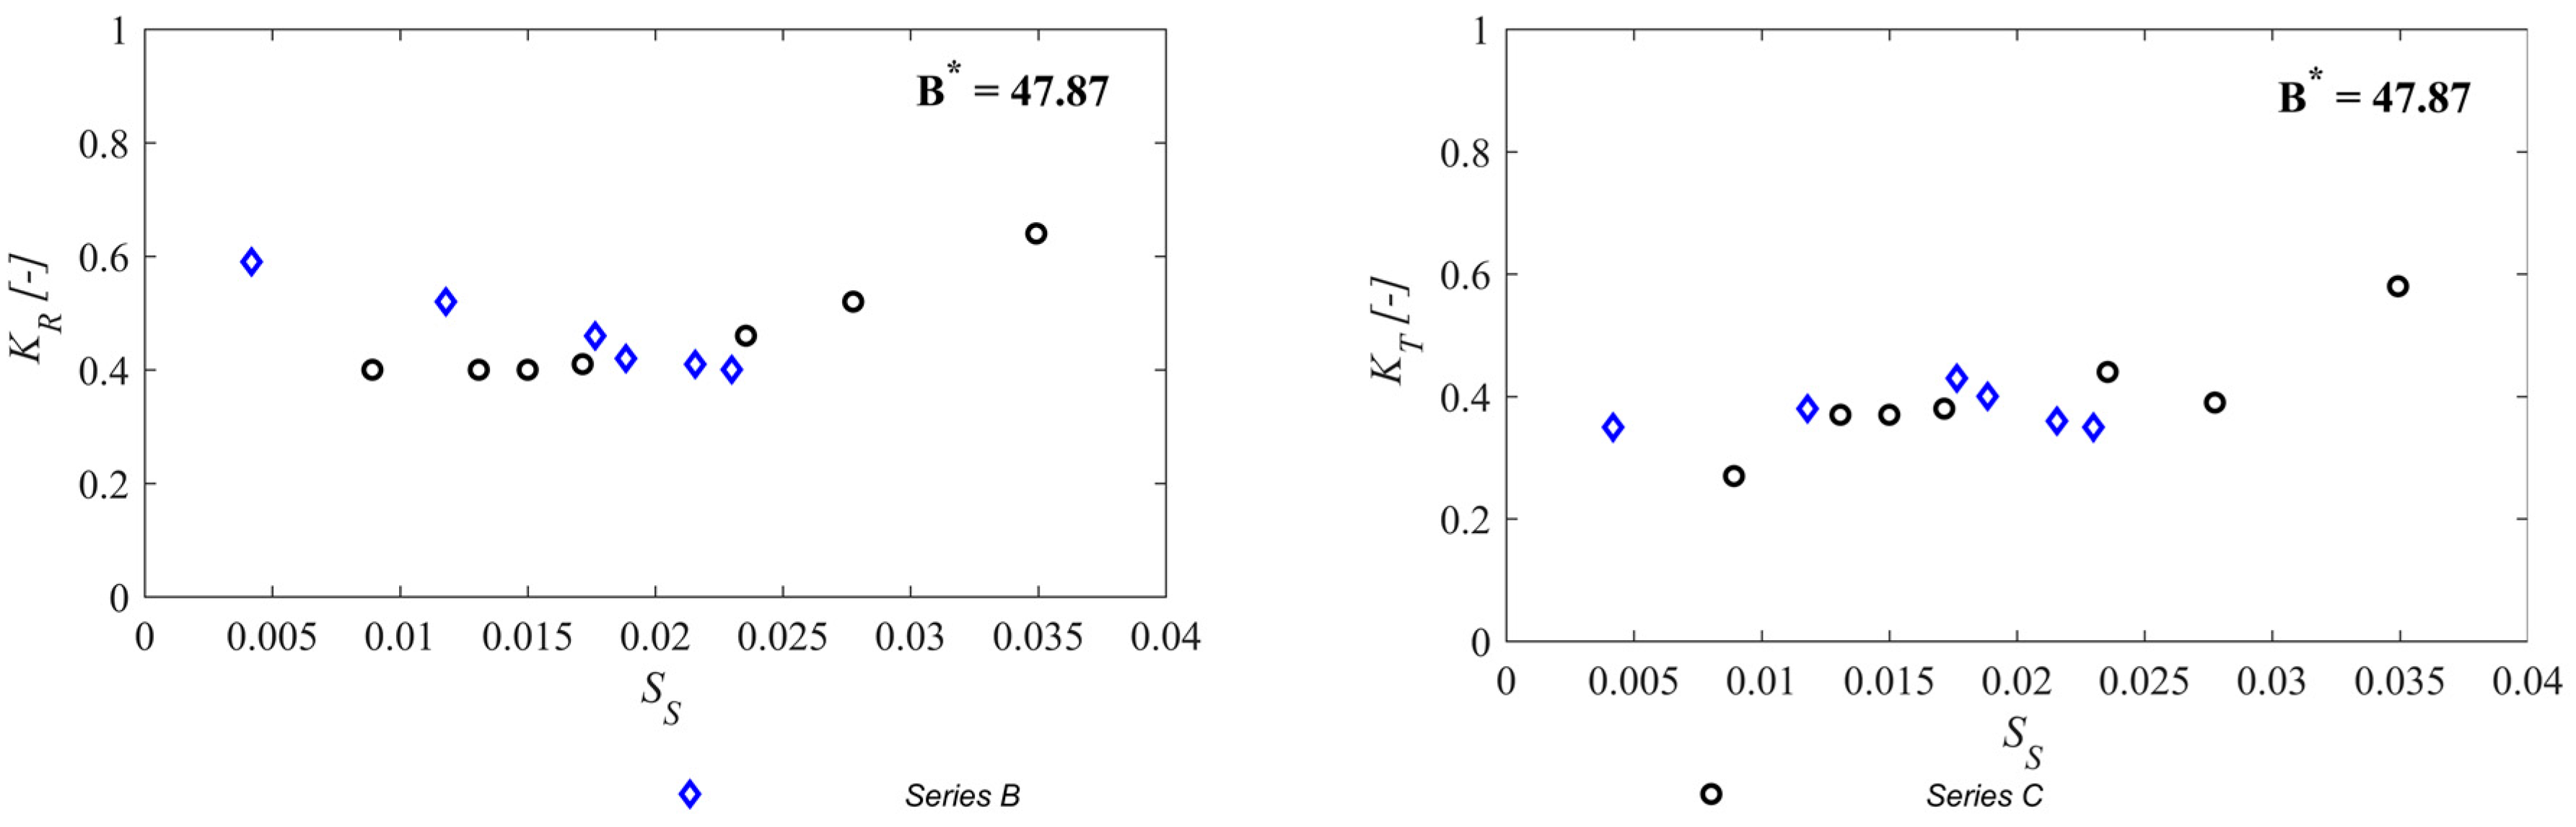
An IRWA was carried out with data from the experimental campaign to obtain the incident and reflected wave heights and to determine the reflection and transmission coefficients (KR and KT). The results for regular waves are presented in Figure 6 for the three damping coefficients versus the wave steepness (S). In addition, Figure 7 presents the results for irregular waves for the intermediate damping coefficient (B* = 47.87) versus the significant wave steepness (SS)—refer to Appendix A for the definition of both wave steepnesses (S and SS).
KR values range from 0.09 to 0.40, with an average value of 0.19, for regular waves; while it ranges from 0.40 to 0.64, with an average value of 0.46, for irregular waves. KT values range from 0.28 to 0.42, with an average value of 0.35, for regular waves; and from 0.27 to 0.58, with an average value of 0.39, for irregular waves. It is clear that both coefficients (KR and KT) are, in general, driven by the wave period and, to a small extent, the wave steepness and turbine damping. Data are, in general, well grouped, except for the two smallest periods (T = 7 and 8 s) in regular waves, which show more scattered results.
For a given value of wave height (Series C), the reflection coefficient (KR) does not vary significantly with the wave steepness for wave steepness values of up to 0.02, beyond with the reflection coefficient increases with the wave steepness (Figure 6). This means that the influence of the wave steepness on the reflection coefficient is limited to large wave periods. Furthermore, it can also be noticed that KR increases when the damping coefficient increases—i.e., when the orifice diameter size decreases. The transmission coefficient (KT) shows, in general, well-grouped values around 0.35–0.40 for both regular and irregular waves. For regular waves, contrary to the reflection coefficient, KT increases with the wave period and decreases with the damping coefficient; similarly, for irregular waves, KT increases with the significant wave steepness.
4.2. OWC Performance
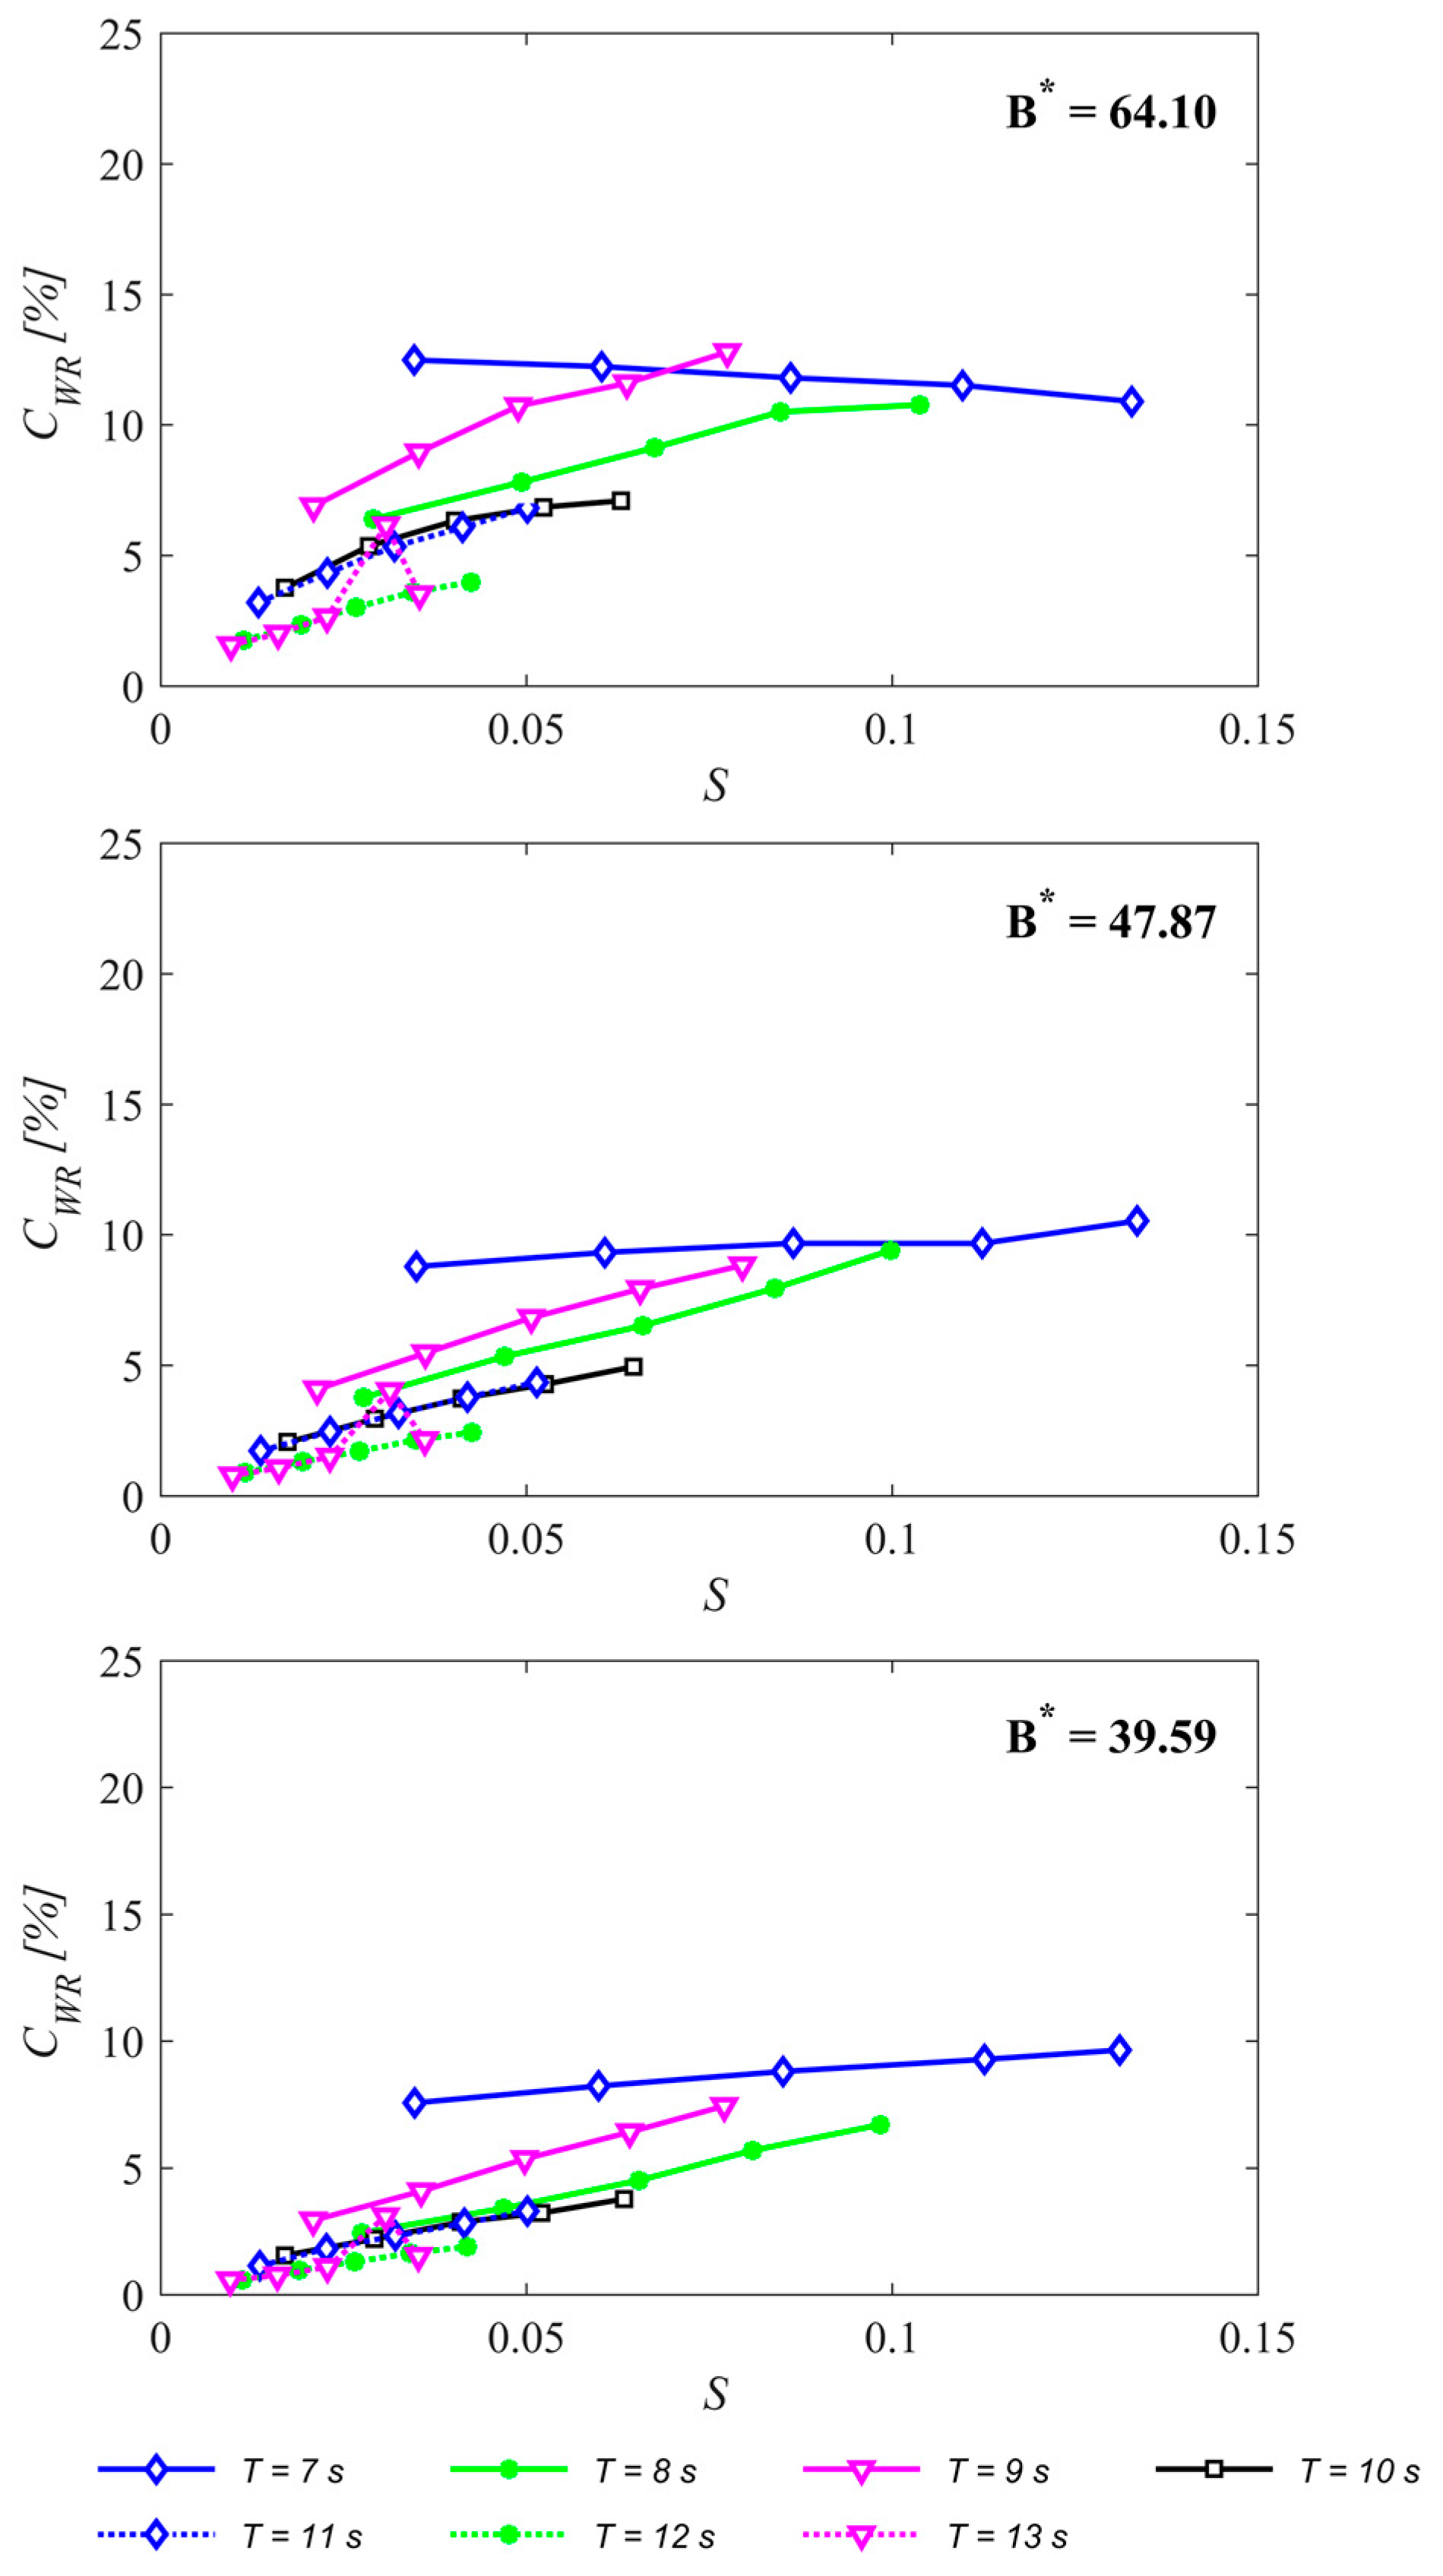
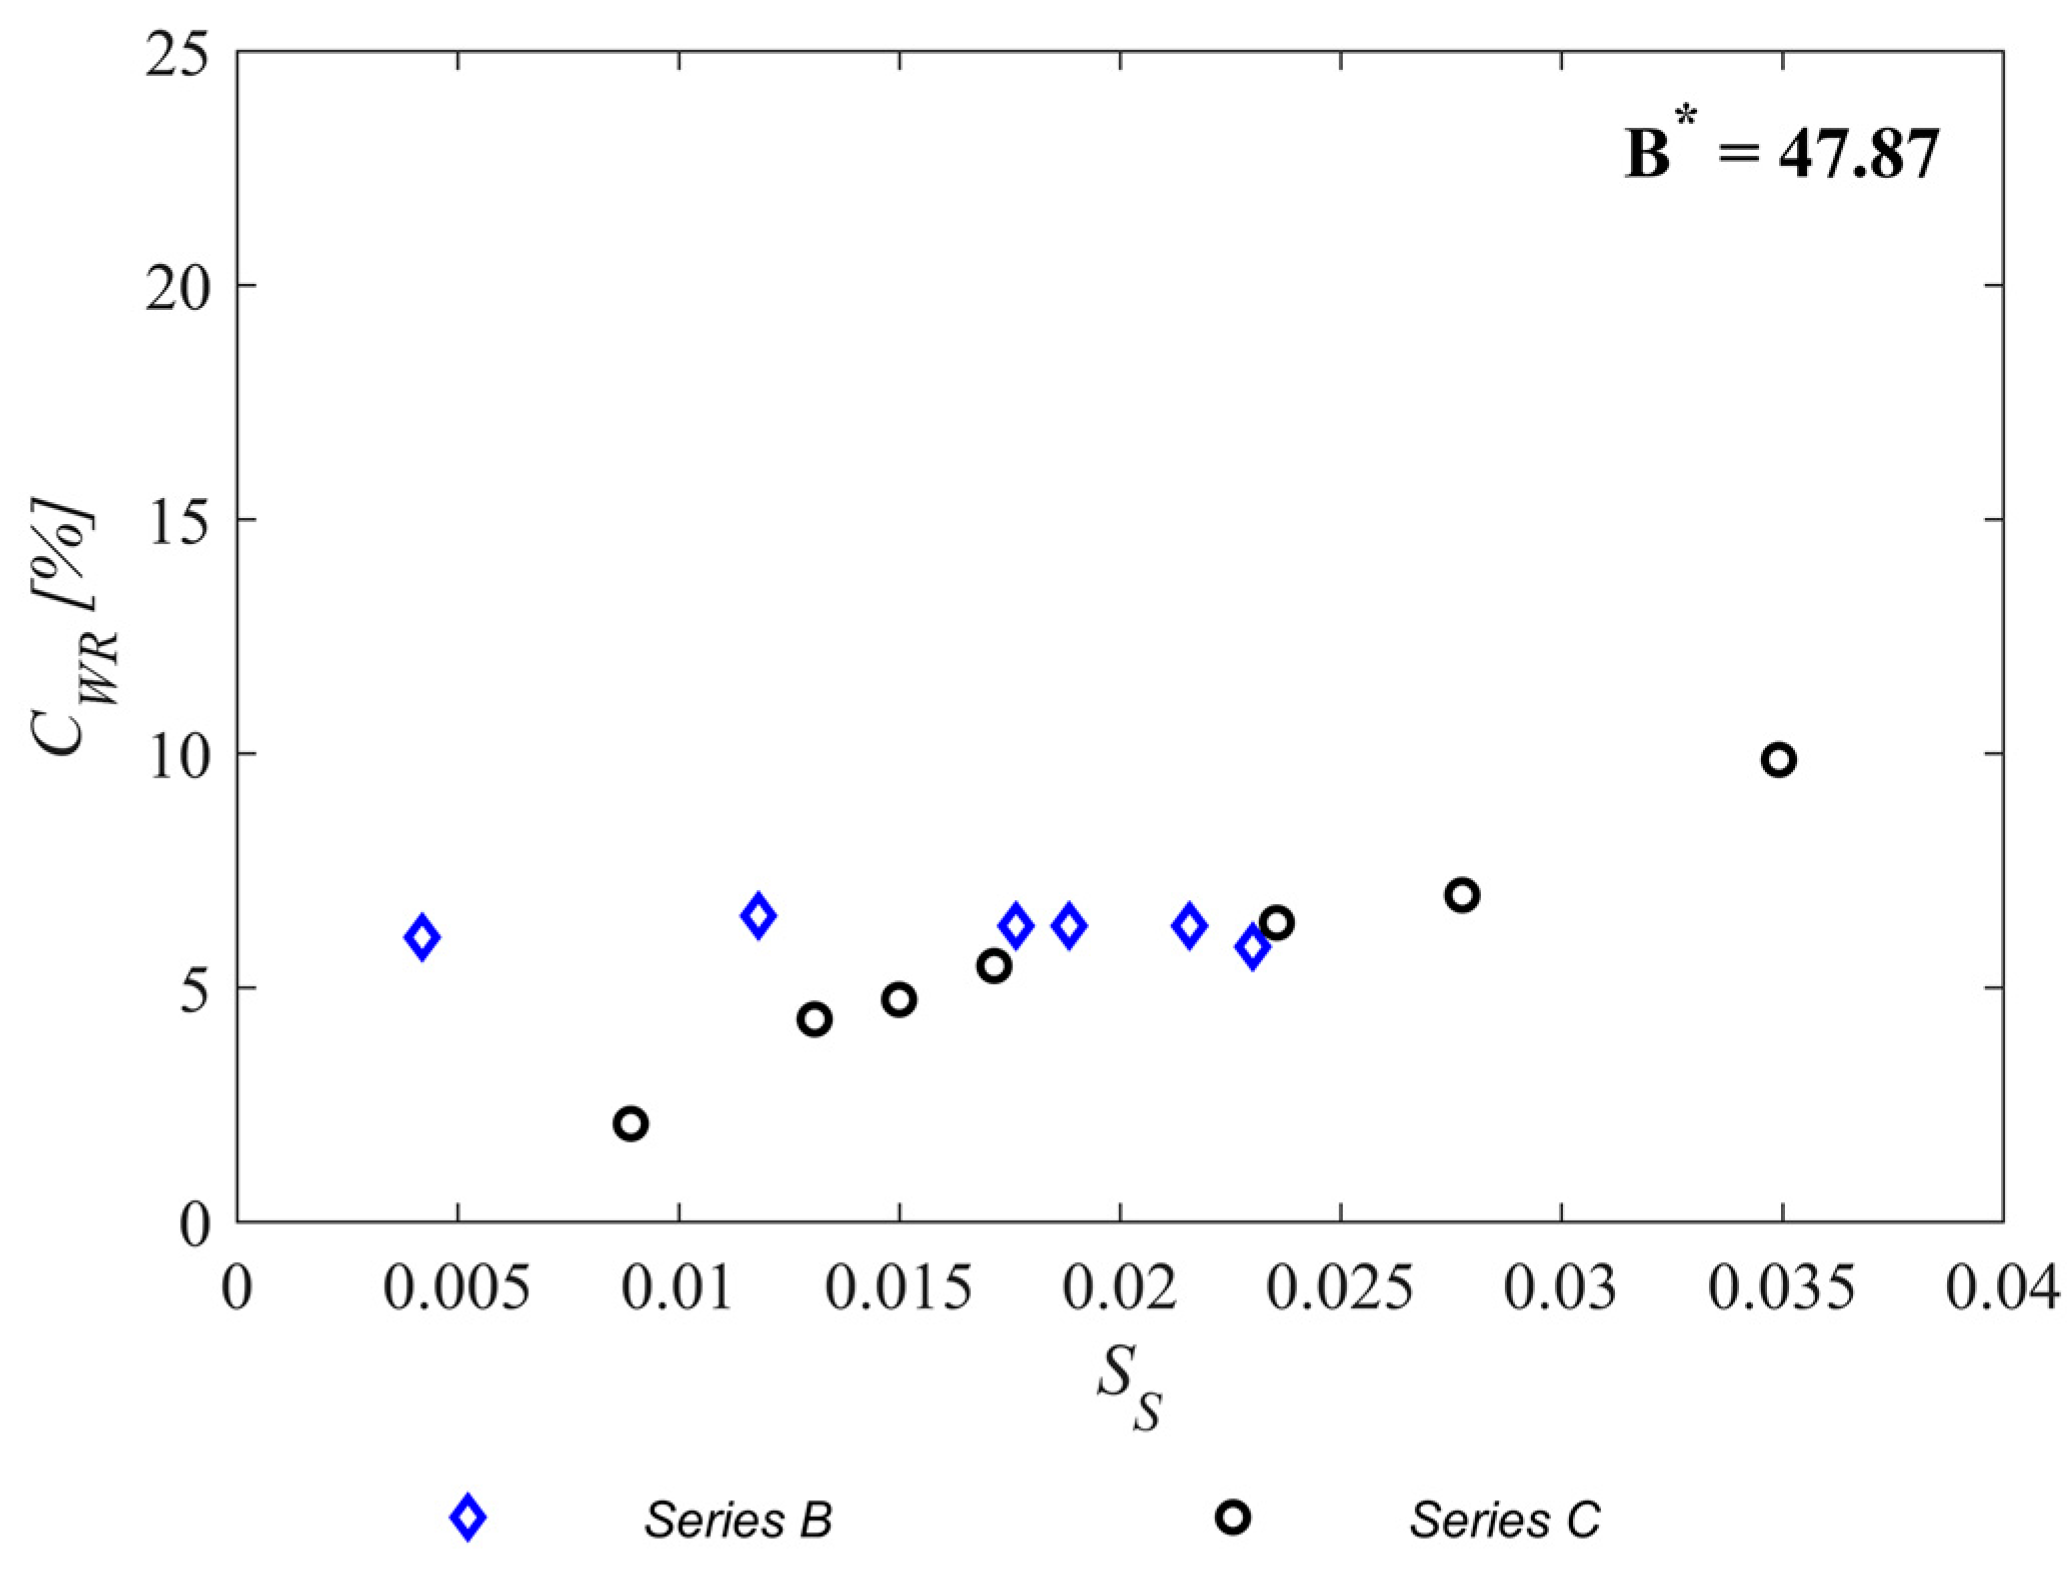
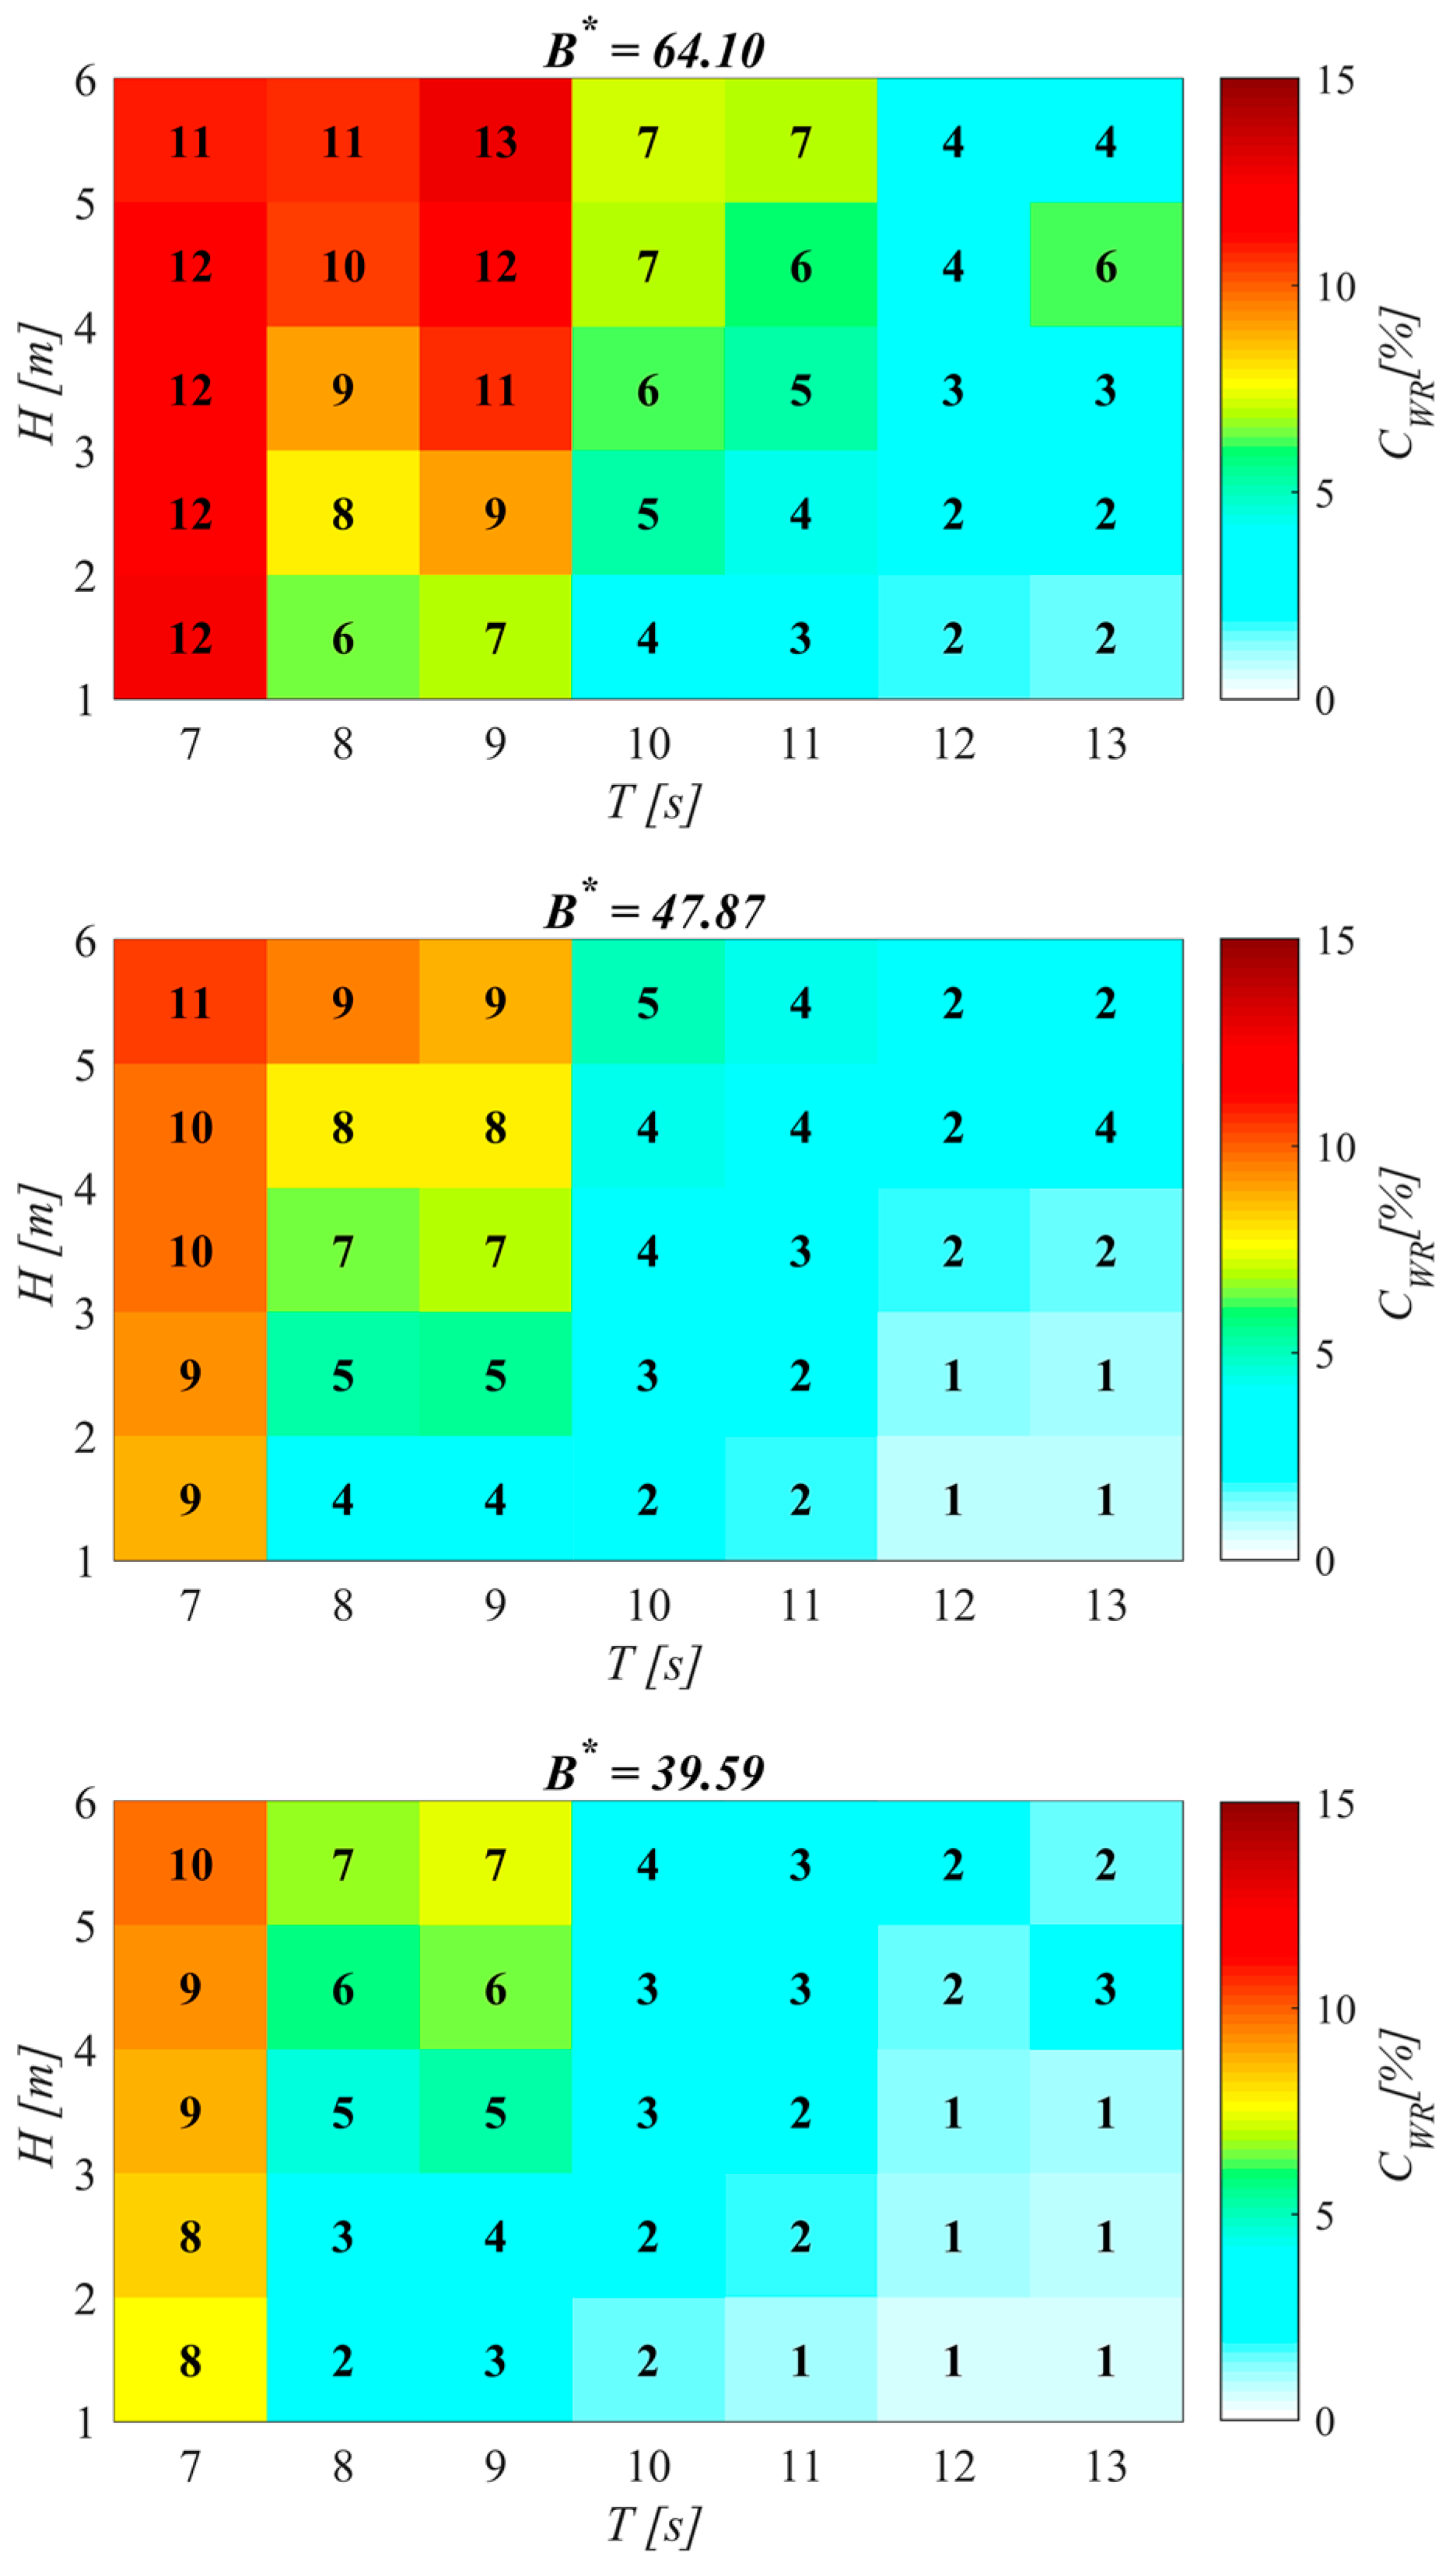
The capture width ratio (CWR) was used to evaluate the performance of the hybrid wind-wave energy converter. The CWR is represented for regular waves in Figure 8 for the three damping coefficients tested versus the wave steepness (S); and for irregular waves in Figure 9 for the intermediate damping coefficient (B* = 47.87) versus the significant wave steepness (SS). In addition, the CWR and mean pneumatic power (Pm) are also represented as the capture width and power matrices in Figure 10 and Figure 11, respectively.
CWR values range from 1% to 13%, with an average value of 5%, for regular waves; and from 2% to 10% for irregular waves, with an average value of 6%. It is clear that the CWR is mostly driven by the turbine damping and the wave period, and to a small extent by the wave steepness. Data are, in general, well grouped and show a similar trend, except for the smallest period (T = 7 s) in regular waves, which shows more scattered results. Note that the regular wave condition with a wave height (H = 4.5 m) and a wave period (T = 13 s) seems to be an outlier (Figure 10).
From Figure 8 and Figure 9, it can be observed that the capture width ratio (CWR) is highly influenced by the turbine damping—with average values of the CWR 7%, 5% and 4% for turbine damping values of B* = 64.10, 47.87 and 39.59, respectively, for regular waves and 6% for irregular waves and B* = 47.87. The largest turbine damping value—i.e., the smallest orifice diameter size (B* = 64.10)—thus, not only the best performance—i.e., the maximum CWR for this damping is 13% while the maximum value for the other two damping values is 11% and 10% for B* = 47.87 and 39.59, respectively—but also a wider region of larger efficiency. Furthermore, the wave period does exert a strong influence on the CWR, increasing, in general, when the wave period decreases; with the exception of the smallest wave period (T = 7 s) for the largest damping value (B* = 64.10). This behaviour can also be clearly identified for irregular waves (Figure 9) by comparing the results of both Series. While CWR remains, in general, constant for Series B, it increases with the significant wave steepness (SS) for Series C, and so it does when the wave period decreases (Series C keeps a constant significant wave height).
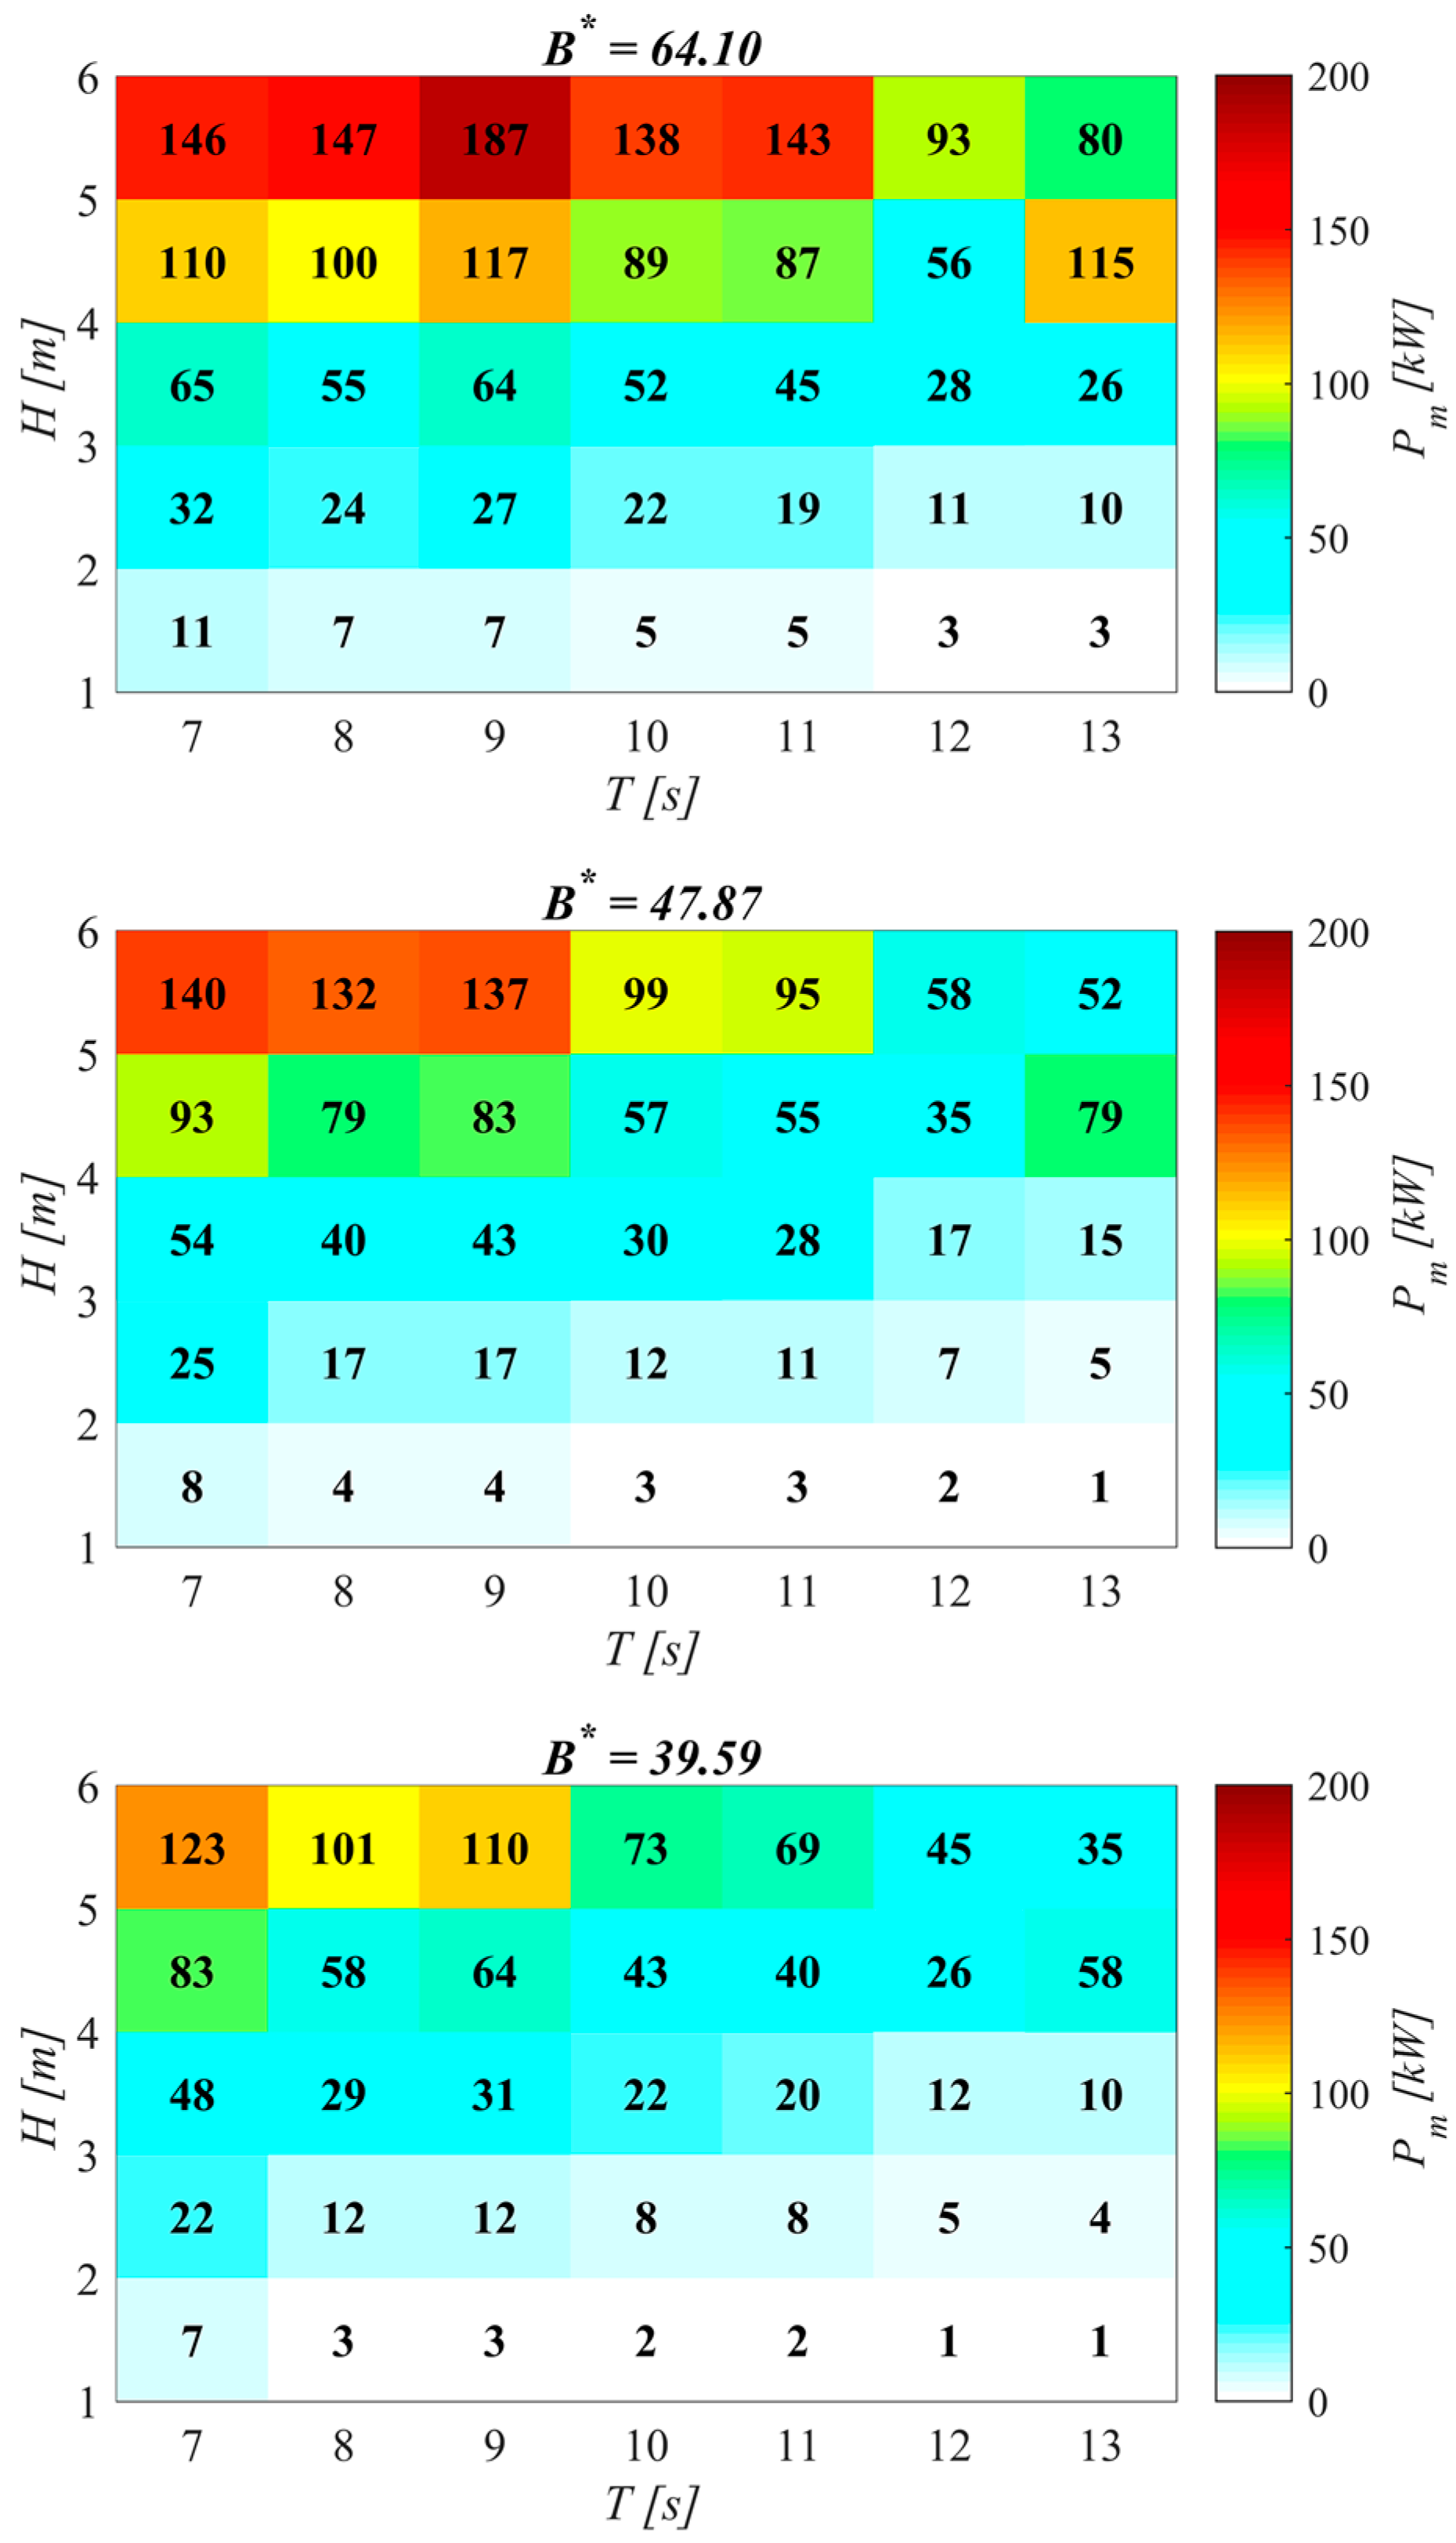
To better understand the relevance of the different parameters influencing the performance of the device, the capture width matrix is represented, for regular waves, in terms of the wave height (H) and the wave period (T) for the three turbine damping values (B*) (Figure 10). An area of best performance can be identified for the three damping values for the lower wave periods (T < 10 s). The intermediate and the smallest damping values (B* = 47.87 and 39.59) have their peaks of maximum efficiency at T = 7 s; by contrast, the largest damping value (B* = 64.10) has a primary efficiency peak at T = 9 s, followed closely by a secondary efficiency peak at T = 7 s. Complementarily, the mean pneumatic power (Pm) may be presented in terms of the wave height (H) and period (T) for the three turbine damping values (B*) in the form of power matrices (Figure 11). An area of best performance can be identified for the larger wave heights (H > 3 m). Similarly to the capture width matrix, two peaks of power output are found for the three damping values at T = 7 s and T = 9 s.
4.3. Device Response
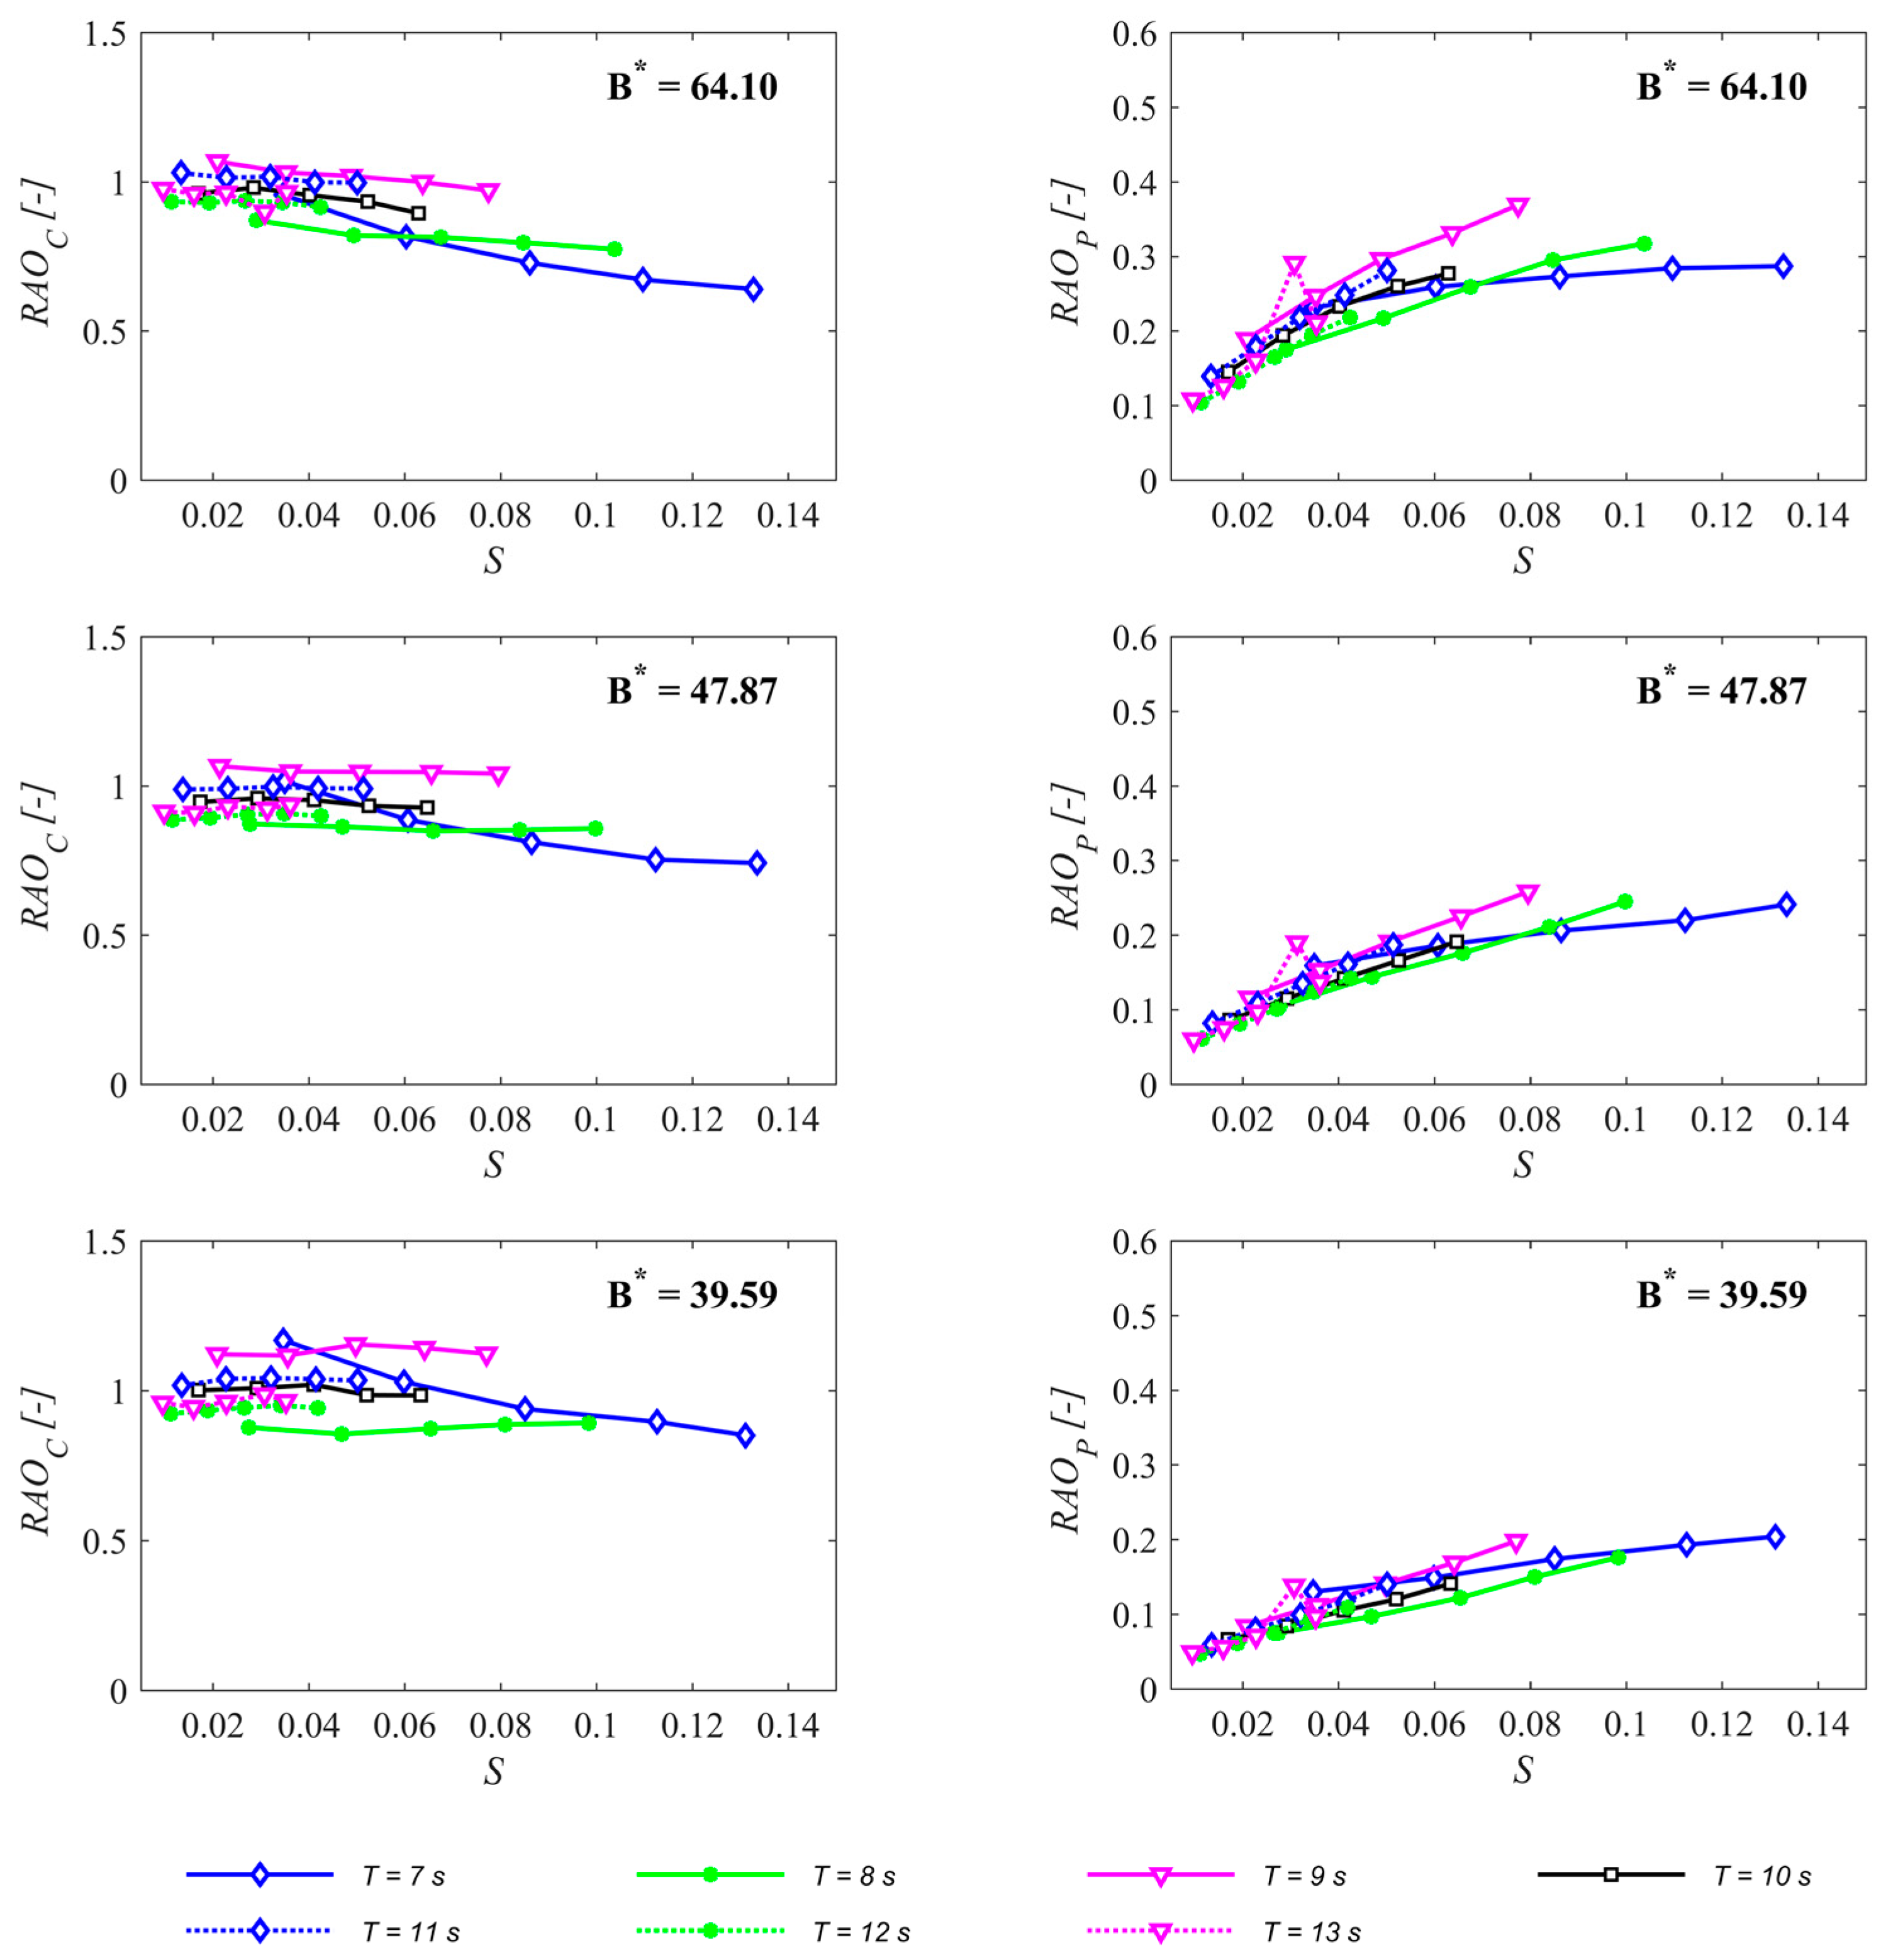
The response amplitude operator (RAO) was used to evaluate the response of the two main parameters influencing the performance of the OWC—i.e., the free surface elevation and the pneumatic pressure inside the OWC chamber (RAOC and RAOP respectively). The results for regular waves are presented in Figure 12 for the three damping coefficient values versus the wave steepness (S) and in Figure 13 versus the wave frequency.
RAOC values range from 0.64 to 1.17, with an average value of 0.95 while RAOP values range from 0.05 to 0.37, with an average value of 0.16. Data are, in general, well grouped and show similar trends. Note that the wave condition with a wave height H = 4.5 m and a wave period T = 13 s seems to be an outlier, as identified in the previous section.
In Figure 12, it can be clearly observed that both RAOs are mainly driven by the damping coefficient (B*) and the wave steepness (S). RAOC and RAOP show opposite behaviours, when RAOC increases RAOP decreases and vice versa. The higher the damping coefficient value and the higher the wave steepness, the lower the amplitude of the free surface oscillation (RAOC). Therefore, the higher the damping coefficient and the higher the wave steepness, the lower the amplitude of the differential pneumatic pressure between the inner OWC chamber and the atmosphere (RAOP).
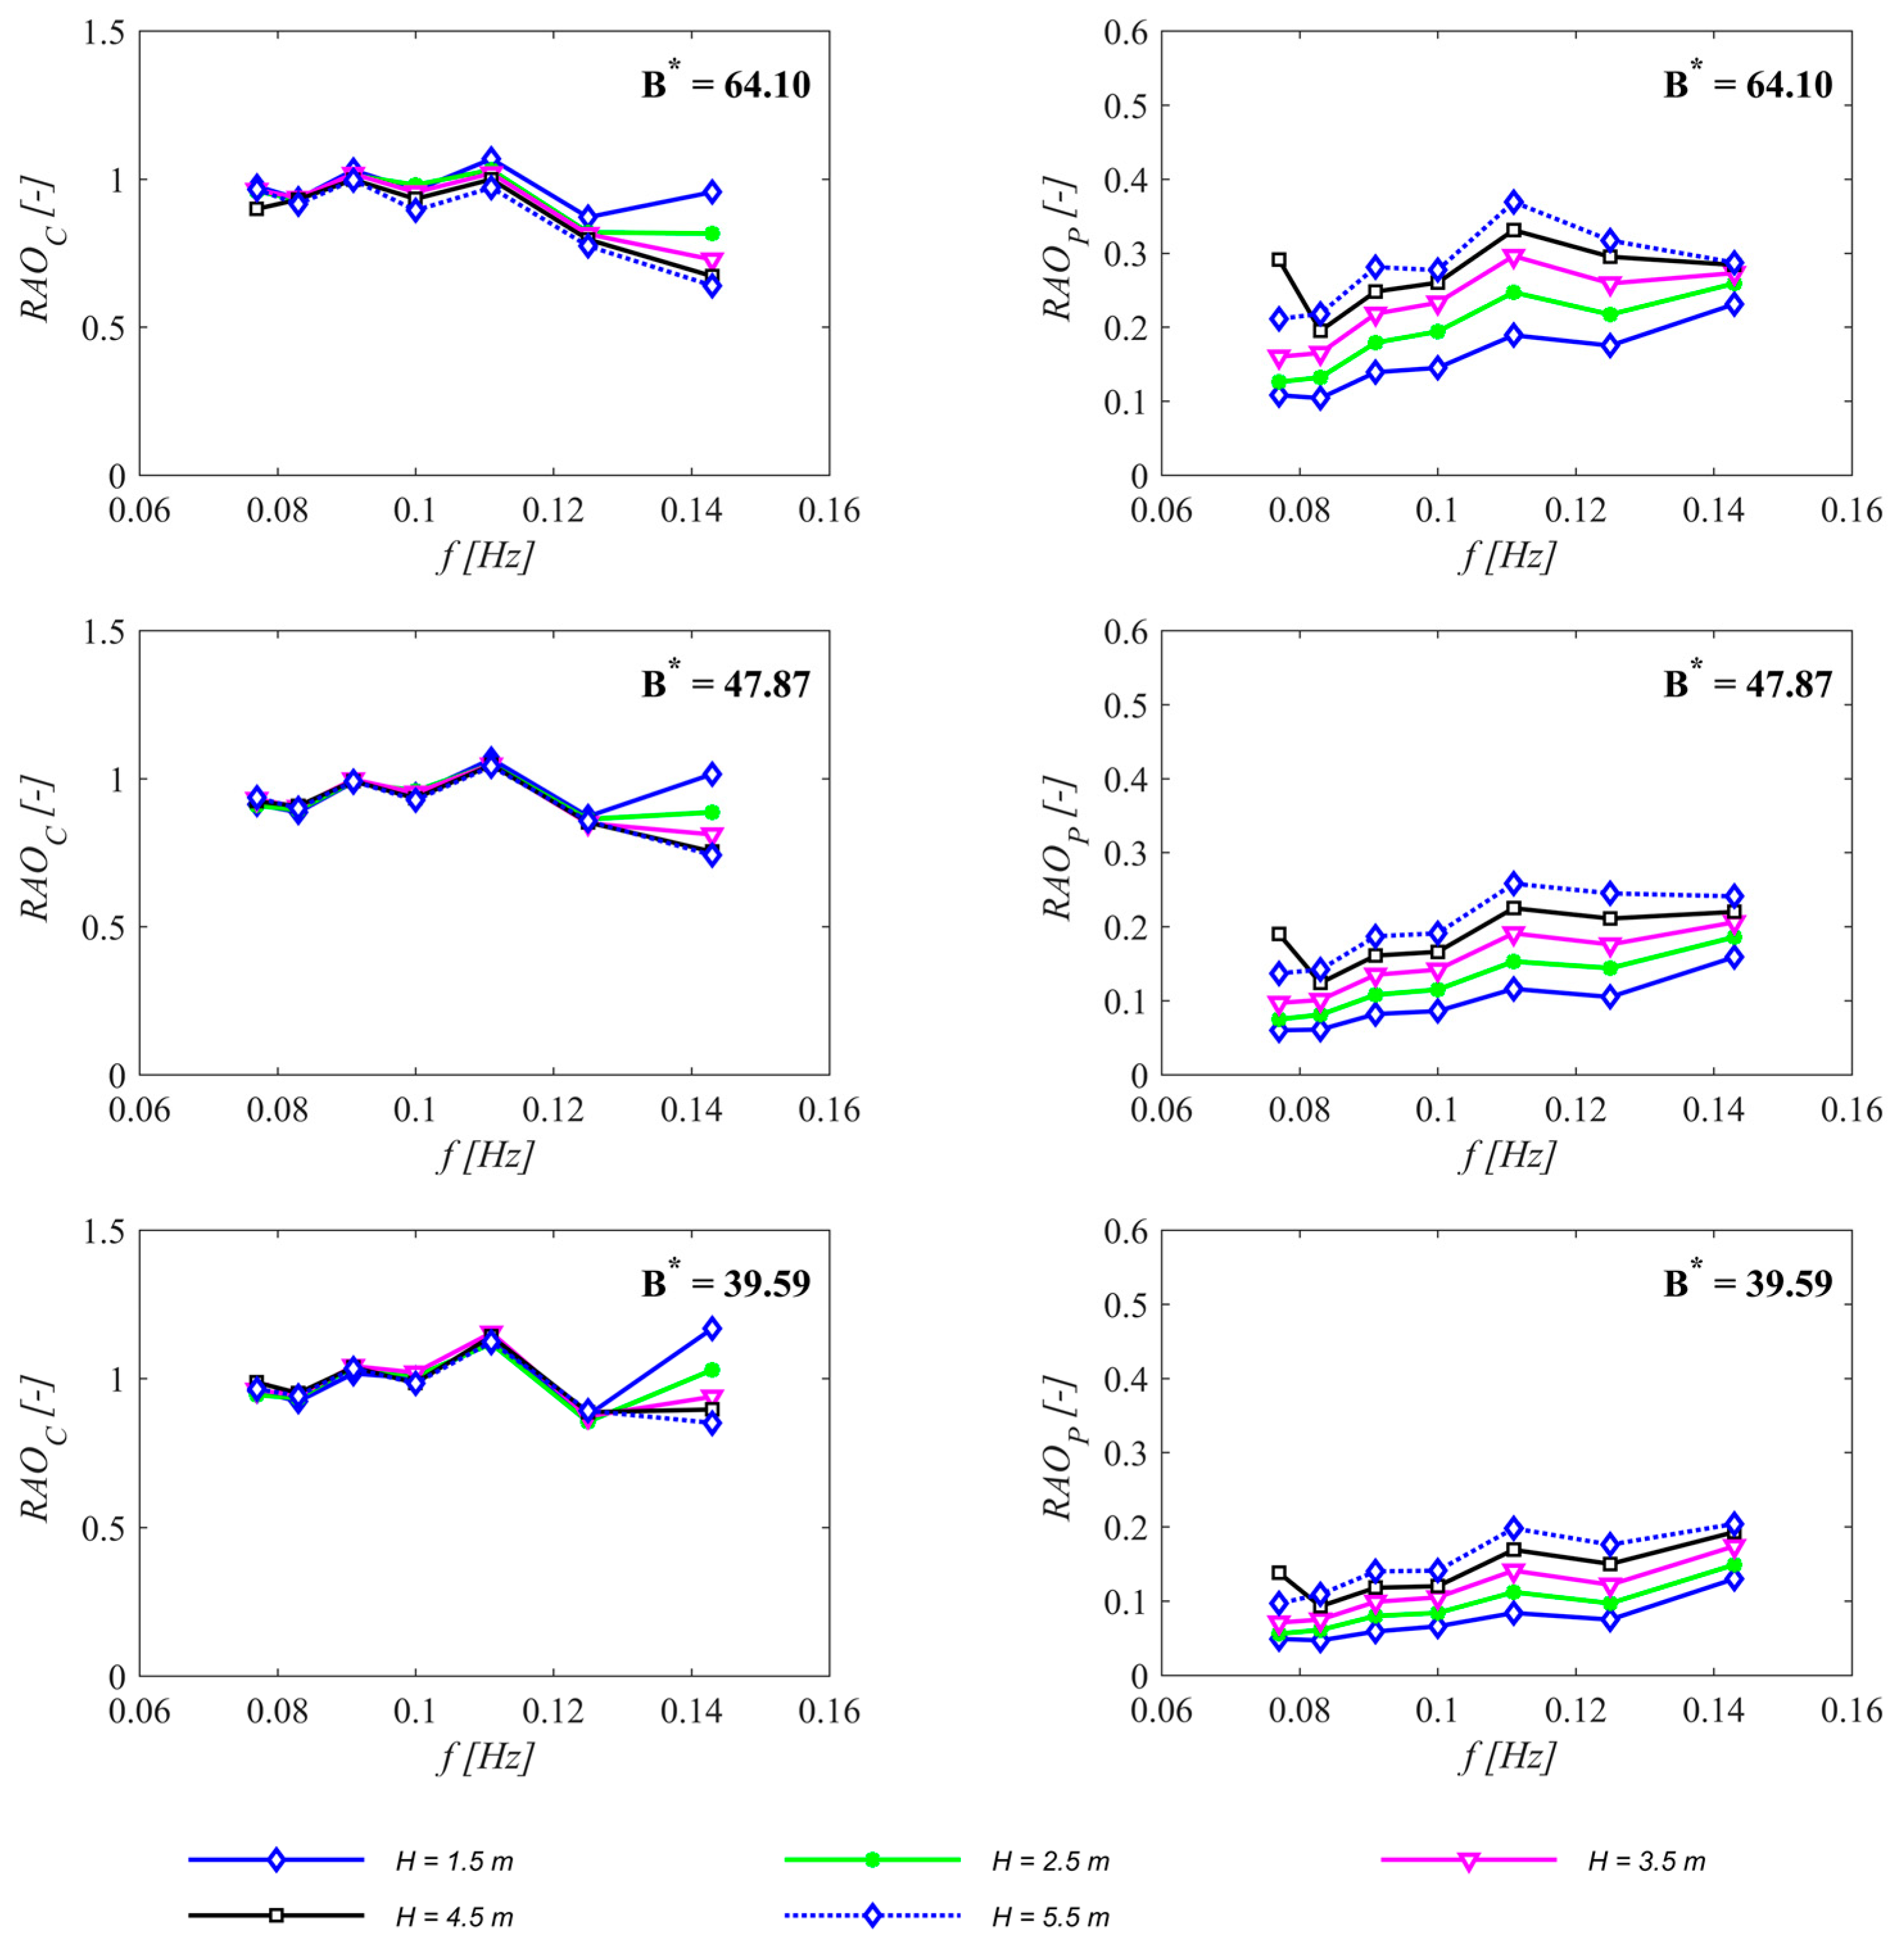
Figure 13 shows the traditional representation for RAOs—i.e., versus wave frequency (f). From the analysis of this figure, the following observations can be made:
- (1)
- RAOC values converge, in general, to 1 for lower wave frequencies for all damping values.
- (2)
- The effect of the wave height on RAOC is, in general, very limited for medium to low wave frequency values; however, this influence becomes more relevant for larger wave frequency values (f > 0.12 Hz, in prototype values).
- (3)
- Two peaks of maximum free surface oscillations (RAOC) values are found at the frequency values corresponding to the wave periods T = 7 and 9 s—i.e., matching the two periods of maximum OWC efficiency identified in the previous section (Figure 10).
- (4)
- RAOC diverges for the larger wave frequencies.
- (5)
- The parameter affecting the RAOP values most is the damping coefficient, increasing with RAOP value with the damping.
- (6)
- The higher the wave height and the lower the wave period, the higher the RAOP.
- (7)
- Two peaks of maximum values of RAOP can be observed for the largest damping value (B* = 64.10) at the frequencies (f = 0.111 and 0.143 Hz) while only the second one is observed for the other two damping values—i.e., these correspond to the same peaks observed for the CWR at T = 9 and 7 s, respectively.
5. Discussion
A comprehensive series of physical model tests were carried out as a first step in the development of this novel concept of a hybrid wind-wave energy converter for jacket-frame substructures. A simplified version of the WEC sub-system was defined and tested. Its hydrodynamic response was characterised to better understand the performance of the device and its interaction with the wave field; and to set the reference for future developments of the device.
Three parameters were selected to investigate the hydrodynamic response of the hybrid energy converter: the wave height, the wave period and the damping coefficient—i.e., different turbine damping values were modelled by considering different orifice plates, with three different orifice diameter sizes. In total, 118 tests were performed, considering regular and irregular waves, and these were structured into three test series. The methodology followed to characterise the hydrodynamic response of the device was carried out considering three different sets of analysis techniques: (i) an incident and reflected wave analysis (IRWA), to determine the reflection and transmission coefficients (KR and KT); (ii) the analysis of the capture width ratio (CWR), to study the efficiency or ratio between the pneumatic power output of the OWC and the incident wave power; and (iii) the analysis of the RAOs of the free surface oscillation and the pneumatic pressure inside the OWC chamber (RAOC and RAOP respectively), to study the relationship between these key components of the OWC power output with the incident wave.
The IRWA identified the wave period as the parameter that influences the wave reflection and transmission coefficients most—i.e., the influence of the wave period is much more relevant than that of the turbine damping coefficient or the wave steepness. As the wave period increases, KR decreases—note that this behaviour is the opposite to that observed for a coastal structure extending down to the seabed, but similar to the one observed for other WECs, e.g., [72,73]. As the wave period increases, KT increases very slightly. The IRWA shows an interaction of the device with the wave field that reflects between 9% and 40% of the incident wave power and reflects between 28% and 42%. Note that this interaction is crucial to understanding the implications that the ‘shadow effect’ may have at a larger scale—at the wind farm scale or at the nearest coasts.
The analysis of the hybrid energy converter performance identified the damping and the wave period as the parameters influencing the CWR the most. The accentuated influence of the turbine damping on the device performance highlights the importance of the appropriate selection of the turbine damping when designing an OWC device, as shown previously by, e.g., [49,74,75,76,77,78]. For the wave conditions and damping coefficient values tested, the largest damping coefficient (B* = 64.10) is the one showing, generally, the highest values of CWR. A peak of CWR was found for the three damping values at T = 7 s, and a second peak was found for the larger damping coefficient value (B* = 64.10) at T = 9 s. The capture width ratio matrix shows an area of maximum efficiency for the lower wave period (T < 10 s) and across most of the wave heights. The maximum value of CWR is approx. 13%, with average values between 4% and 7%. These results are in line with the best-fit equation based on the statistical analysis of about 20 different OWC devices [79]. Indeed, following the best-fit equation, and considering the diameter of the OWC chamber (8 m, at prototype scale) as the width of the device, a CWR value of about 15.5% is to be expected. Notwithstanding, previous work has shown that maximum values that are remarkably higher can be attained, e.g., 80% [60] or 87% [76]. In principle, these figures would appear to indicate that there is plenty of margin to optimise the performance of the OWC chamber. However, given the dependence of the CWR on the chamber width that is apparent in the best-fit equation, the CWR is limited by the restriction imposed on the chamber dimensions by the jacket-frame substructure within which it is to be mounted.
Comparing the shape of the capture width and power matrices with those from previous works, certain differences are apparent. For example, comparing the previous Figure 10 with the results in [49], it may be seen that maximum CWR values correspond to greater wave heights in the case of the present OWC—and in both cases to lower wave periods (T < 10 s). The power matrix from Figure 11 bears some resemblance to those of point-absorbers in [80]—further research is needed in this respect.
Finally, the analysis of the response of the two main parameters that influence the power output of an OWC—the relative pneumatic pressure between inside the chamber and the atmosphere, and the free surface oscillation inside the chamber—was carried out by means of the RAO. Both RAOs (RAOC and RAOP) are strongly driven by the damping coefficient and wave steepness—when the damping coefficient or the wave steepness increases, RAOC decreases and RAOP increases. RAOC converges to 1 for the lower wave frequencies and wave steepness—i.e., the amplitude of the free surface oscillation inside the OWC chamber equals the incident wave amplitude, reducing the efficiency of the device (Figure 8). On the one hand, the effect of the wave height on RAOP is quite marked, increasing the RAO with the wave height. On the other hand, the effect of the wave height on RAOC is of little significance with the exception of the longest wave frequency tested—corresponding to the shortest wave period, T = 7 s. Furthermore, both RAOs show peaks of maximum values for the wave frequencies corresponding to the wave periods T = 7 s and 9 s, matching the periods where the peaks of maximum efficiency are found.
6. Conclusions
In this work, a novel hybrid wind-wave energy converter for jacket-frame substructures was successfully studied by means of an intensive physical modelling test campaign. Based on the results of the model tests, two main objectives were achieved: (i) the proof of concept of the proposed WEC sub-system was successfully carried out for a jacket-frame substructure; and (ii) the hydrodynamic response of the OWC WEC sub-system was characterised following a comprehensive methodology that makes it possible to better understand the performance of the device and its interaction with the wave field.
Previous research on either hybrid or WEC devices was mostly focused on individual parameters, such as the efficiency or the RAOs. This work follows a comprehensive methodology to characterise the hydrodynamic response of a hybrid system’s WEC sub-system; a methodology based on three main pillars: (i) the interaction between the device and the wave field; (ii) the OWC efficiency; and (iii) the response of the two main parameters driving the efficiency of the OWC—the free surface oscillation and the pressure drop inside the OWC chamber—to the incident wave field. This methodology makes it possible to fully characterise the behaviour of the WEC sub-systems and will constitute a starting point for future research to further evaluate the effects of this behaviour at a larger scale (e.g., the behaviour of a hybrid wind-wave farm).
Based on the results from this work, it may be concluded that the proposed hybrid wind-wave energy converter constitutes a viable solution for installation on jacket-frame substructures; notwithstanding, further work is required for its development and to tackle some fundamental issues—e.g., the increased loads on the substructure. Thus, the results of this work are but an initial step towards the development of the proposed prototype.
Supplementary Materials
The research materials supporting this publication may be accessed at http://hdl.handle.net/10026.1/11045. If you have any question regarding these research materials, please contact the corresponding author of this paper.
Acknowledgments
This work was carried out with the financial support of the Higher Education Innovation Fund (HEIF) and the School of Engineering of the University of Plymouth. The Authors are grateful to Johan Skanberg-Tippen, Tim Hatton and James Harvey for their help during the experimental campaign.
Author Contributions
Carlos Perez-Collazo and Gregorio Iglesias conceived and designed the physical modelling; Carlos Perez-Collazo conducted the experimental campaign, analysed the data and wrote the paper; and Deborah Greaves and Gregorio Iglesias gave helpful comments and revised the paper.
Conflicts of Interest
The authors declare no conflict of interest.
Appendix A
The wave steepness parameter (S) used to analyse the results for regular waves is defined as
where H is the wave height, g is the acceleration of gravity (9.81 m/s2) and T is the wave period. For irregular waves, the significant steepness parameter (SS) is defined as
where Hs is the significant wave height, g is the acceleration of gravity and TP is the peak wave period.
References
- Remy, T.; Mbistrova, A. Offshore Wind in Europe: Key Trends and Statistics 2017; Wind Europe: Brussels, Belgium, 2018; p. 36. [Google Scholar]
- Royal Belgiam Institute of Natural Sciences NORTH SEA FACTS Web Page. Available online: http://www.mumm.ac.be/EN/NorthSea/facts.php (accessed on 14 December 2012).
- Jeffrey, H.; Sedgwick, J. ORECCA. European Offshore Renewable Energy Roadmap; ORECCA: Munchen, Germany, 2011; pp. 1–201. [Google Scholar]
- Weisse, R.; von Storch, H.; Callies, U.; Chrastansky, A.; Feser, F.; Grabemann, I.; Günther, H.; Pluess, A.; Stoye, T.; Tellkamp, J.; et al. Regional Meteorological–Marine Reanalyses and Climate Change Projections. Bull. Am. Meteorol. Soc. 2009, 90, 849–860. [Google Scholar] [CrossRef]
- Pryor, S.C.; Barthelmie, R.J. Climate change impacts on wind energy: A review. Renew. Sustain. Energy Rev. 2010, 14, 430–437. [Google Scholar] [CrossRef]
- Azzellino, A.; Conley, D.; Vicinanza, D.; Kofoed, J.P. Marine Renewable Energies: Perspectives and Implications for Marine Ecosystems. Sci. World J. 2013, 2013, 547563. [Google Scholar] [CrossRef] [PubMed]
- Astariz, S.; Iglesias, G. Wave energy vs. other energy sources: A reassessment of the economics. Int. J. Green Energy 2016, 13, 747–755. [Google Scholar] [CrossRef]
- Quevedo, E.; Delory, M.; Castro, A.; Llinas, O.; de Lara, J.; Papandroulakis, N.; Anasrasiadis, P.; Bard, J.; Jeffrey, H.; Ingram, D.; et al. Multi-use offshore platform configurations in the scope of the FP7 TROPOS Project. In Proceedings of the OCEANS MTS/IEE Conference, Bergen, Norway, 10–13 June 2013; pp. 1–7. [Google Scholar]
- Stuiver, M.; Soma, K.; Koundouri, P.; van den Burg, S.; Gerritsen, A.; Harkamp, T.; Dalsgaard, N.; Zagonari, F.; Guanche, R.; Schouten, J.J.; et al. The Governance of Multi-Use Platforms at Sea for Energy Production and Aquaculture: Challenges for Policy Makers in European Seas. Sustainability 2016, 8, 333. [Google Scholar] [CrossRef] [Green Version]
- Van den Burg, S.; Stuiver, M.; Norrman, J.; Garção, R.; Söderqvist, T.; Röckmann, C.; Schouten, J.J.; Petersen, O.; García, R.; Diaz-Simal, P.; et al. Participatory Design of Multi-Use Platforms at Sea. Sustainability 2016, 8, 127. [Google Scholar] [CrossRef] [Green Version]
- Astariz, S.; Iglesias, G. Enhancing Wave Energy Competitiveness through Co-Located Wind and Wave Energy Farms. A Review on the Shadow Effect. Energies 2015, 8, 7344–7366. [Google Scholar] [CrossRef]
- Perez-Collazo, C.; Jakobsen, M.M.; Buckland, H.; Fernandez Chozas, J. Synergies for a wave-wind energy concept. In Proceedings of the European Offshore Wind Energy Conference, Frankfurt, Germany, 21 November 2013; EWEA: Frankfurt, Germany, 2013; pp. 1–10. [Google Scholar]
- Casale, C.; Serri, L.; Stolk, N.; Yildiz, I.; Cantù, M. Synergies, Innovative Designs and Concepts for Multipurpose Use of Conversion Platforms; Results of ORECCA Project—WP4; ORECCA: Munchen, Germany, 2012; pp. 1–77. [Google Scholar]
- Astariz, S.; Abanades, J.; Perez-Collazo, C.; Iglesias, G. Improving wind farm accessibility for operation & maintenance through a co-located wave farm: Influence of layout and wave climate. Energy Convers. Manag. 2015, 95, 229–241. [Google Scholar]
- Perez-Collazo, C.; Greaves, D.; Iglesias, G. A review of combined wave and offshore wind energy. Renew. Sustain. Energy Rev. 2015, 42, 141–153. [Google Scholar] [CrossRef]
- CORDIS MARINA Platform. Available online: http://cordis.europa.eu/project/rcn/93425_en.html (accessed on 24 February 2018).
- CORDIS ORECCA. Available online: http://cordis.europa.eu/project/rcn/94058_en.html (accessed on 24 February 2018).
- CORDIS TROPOS. Available online: http://cordis.europa.eu/project/rcn/101556_en.html (accessed on 24 February 2018).
- CORDIS H2OCEAN. Available online: http://cordis.europa.eu/project/rcn/102016_en.html (accessed on 24 February 2018).
- CORDIS MERMAID. Available online: http://cordis.europa.eu/project/rcn/101743_en.html (accessed on 24 February 2018).
- Floating Power Plant AS Poseidon Floating Power Web Page. Available online: http://www.floatingpowerplant.com/ (accessed on 22 November 2016).
- NEMOS GmBH NEMOS Web Page. Available online: http://www.nemos.org/english/technology/ (accessed on 10 October 2015).
- Wave Star AS Wave Star Energy Web Page. Available online: http://wavestarenergy.com/ (accessed on 5 November 2015).
- Pelagic Power AS W2Power Web Page. Available online: http://www.pelagicpower.no/ (accessed on 31 March 2016).
- Hanssen, J.E.; Margheritini, L.; O’Sullivan, K.; Mayorga, P.; Martinez, I.; Arriaga, A.; Agos, I.; Steynor, J.; Ingram, D.; Hezari, R.; et al. Design and performance validation of a hybrid offshore renewable energy platform. In Proceedings of the 2015 Tenth International Conference on Ecological Vehicles and Renewable Energies (EVER), Monte-Carlo, Monaco, 31 March–2 April 2015; pp. 1–8. [Google Scholar]
- O’Sullivan, K. Feasibility of Compbined Wind-Wave Energy Platform. Ph.D. Thesis, University College Cork, Cork, Ireland, 2014. [Google Scholar]
- O’Sullivan, K.; Murphy, J. Deterministic Economic Model for Wind-Wave Energy Hybrid Energy Conversion Systems. In Proceedings of the Fourth International Conference on Ocean Energy (ICOE), Dublin, Ireland, 17–19 October 2012; p. 7. [Google Scholar]
- Chen, W.; Gao, F.; Meng, X.; Chen, B.; Ren, A. W2P: A high-power integrated generation unit for offshore wind power and ocean wave energy. Ocean Eng. 2016, 128, 41–47. [Google Scholar] [CrossRef]
- Zanuttigh, B.; Angelelli, E.; Kortenhaus, A.; Koca, K.; Krontira, Y.; Koundouri, P. A methodology for multi-criteria design of multi-use offshore platforms for marine renewable energy harvesting. Renew. Energy 2016, 85, 1271–1289. [Google Scholar] [CrossRef]
- Veigas, M.; Iglesias, G. A Hybrid Wave-Wind Offshore Farm for an Island. Int. J. Green Energy 2014, 12, 570–576. [Google Scholar] [CrossRef]
- Fusco, F.; Nolan, G.; Ringwood, J.V. Variability reduction through optimal combination of wind/wave resources—An Irish case study. Energy 2010, 35, 314–325. [Google Scholar] [CrossRef]
- Fernandez Chozas, J.; Kofoed, J.P.; Sørensen, H.C. Predictability and Variability of Wave and Wind: Wave and Wind Forecasting and Diversified Energy Systems in the Danish North Sea; No. 156; DCE Technical Reports; Aalborg University, Department of Civil Engineering: Aalborg, Denmark, 2013. [Google Scholar]
- Astariz, S.; Iglesias, G. Selecting optimum locations for co-located wave and wind energy farms. Part I: The Co-Location Feasibility index. Energy Convers. Manag. 2016, 122, 589–598. [Google Scholar] [CrossRef]
- Astariz, S.; Iglesias, G. Selecting optimum locations for co-located wave and wind energy farms. Part II: A case study. Energy Convers. Manag. 2016, 122, 599–608. [Google Scholar] [CrossRef]
- Fernandez Chozas, J.; Helstrup Jensen, N.E.; Sørensen, H.C. Economic benefit of combining wave and wind power productions in day-ahead electricity markets. In Proceedings of the Fourth International Conference on Ocean Energy (ICOE), Dublin, Ireland, 17–19 October 2012. [Google Scholar]
- Fernandez Chozas, J.; Kofoed, J.P.; Kramer, M.M.; Sørensen, H.C. Combined production of a full-scale wave converter and a full-scale wind turbine—A real case study. In Proceedings of the Fourth International Conference on Ocean Energy (ICOE), Dublin, Ireland, 17–19 October 2012. [Google Scholar]
- Azzellino, A.; Ferrante, V.; Kofoed, J.P.; Lanfredi, C.; Vicinanza, D. Optimal siting of offshore wind-power combined with wave energy through a marine spatial planning approach. Int. J. Mar. Energy 2013, 3–4, e11–e25. [Google Scholar] [CrossRef]
- Lund, H. Large-scale integration of optimal combinations of PV, wind and wave power into the electricity supply. Renew. Energy 2006, 31, 503–515. [Google Scholar] [CrossRef]
- Stoutenburg, E.D.; Jenkins, N.; Jacobson, M.Z. Power output variations of co-located offshore wind turbines and wave energy converters in California. Renew. Energy 2010, 35, 2781–2791. [Google Scholar] [CrossRef]
- Wang, L.; Jan, S.-R.; Li, C.-N.; Li, H.-W.; Huang, Y.-H.; Chen, Y.-T. Analysis of an integrated offshore wind farm and seashore wave farm fed to a power grid through a variable frequency transformer. In Proceedings of the 2011 IEEE Power and Energy Society General Meeting, Detroit, MI, USA, 24–29 July 2011; pp. 1–7. [Google Scholar]
- Wang, L.; Jan, S.-R.; Li, C.-N.; Li, H.-W.; Huang, Y.-H.; Chen, Y.-T.; Wang, S.-W. Study of a hybrid offshore wind and seashore wave farm connected to a large power grid through a flywheel energy storage system. In Proceedings of the 2011 IEEE Power and Energy Society General Meeting, Detroit, MI, USA, 24–29 July 2011; pp. 1–7. [Google Scholar]
- Cradden, L.; Mouslim, H.; Duperray, O.; Ingram, D. Joint exploitation of wave and offshore wind power. In Proceedings of the Nineth European Wave and Tidal Energy Conference (EWTEC), Southampton, UK, 5–9 September 2011; pp. 1–10. [Google Scholar]
- Astariz, S.; Iglesias, G. Output power smoothing and reduced downtime period by combined wind and wave energy farms. Energy 2016, 97, 69–81. [Google Scholar] [CrossRef]
- Astariz, S.; Iglesias, G. Co-located wind and wave energy farms: Uniformly distributed arrays. Energy 2016, 113, 497–508. [Google Scholar] [CrossRef]
- Astariz, S.; Perez-Collazo, C.; Abanades, J.; Iglesias, G. Co-located wind-wave farm synergies (Operation & Maintenance): A case study. Energy Convers. Manag. 2015, 91, 63–75. [Google Scholar]
- Astariz, S.; Perez-Collazo, C.; Abanades, J.; Iglesias, G. Towards the optimal design of a co-located wind wave farm. Energy 2015, 84, 15–24. [Google Scholar] [CrossRef]
- Perez, C.; Iglesias, G. Integration of wave energy converters and offshore windmills. In Proceedings of the Fourth International Conference on Ocean Energy (ICOE), Dublin, Ireland, 30 October 2012; pp. 1–6. [Google Scholar]
- Collazo, C.P.; Rodriguez, J.G.I.; Greaves, D. Wave Energy Capture Device. Patent WO2016185189 A1, 21 May 2015. [Google Scholar]
- López, I.; Pereiras, B.; Castro, F.; Iglesias, G. Performance of OWC wave energy converters: Influence of turbine damping and tidal variability. Int. J. Energy Res. 2015, 39, 472–483. [Google Scholar] [CrossRef]
- Chakrabarti, S.K. Offshore Structure Modeling; World Scientific: Singapore, 1994; Volume 9, p. 460. [Google Scholar]
- Nielsen, K. Annex II Report 2003. Development of Recommended Practices for Testing and Evaluating Ocean Energy Systems; IEA—Ocean Energy Systems: Lisbon, Portugal, 2003; pp. 1–62. [Google Scholar]
- Holmes, B. Tank Testing of Wave Energy Conversion Systems; The European Marine Energy Centre (EMEC): London, UK, 2009; pp. 1–82. [Google Scholar]
- Jonkman, J.; Butterfield, S.; Musial, W.; DScott, G. Definition of a 5-MW Reference Wind Turbine for Offshore System Development; NREL/TP-500-38060; National Renewable Energy Laboratory: Golden, CO, USA, 2009. [Google Scholar]
- Kenny, J.P. SW Wave Hub—Metocean Design Basis; SWRDA: Hants, UK, 2009; p. 64. [Google Scholar]
- Falcão, A.F.O.; Henriques, J.C.C. Model-prototype similarity of oscillating-water-column wave energy converters. Int. J. Mar. Energy 2014, 6, 18–34. [Google Scholar] [CrossRef]
- Elhanafi, A.; Macfarlane, G.; Fleming, A.; Leong, Z. Scaling and air compressibility effects on a three-dimensional offshore stationary OWC wave energy converter. Appl. Energy 2017, 189, 1–20. [Google Scholar] [CrossRef]
- Simonetti, I.; Cappietti, L.; Elsafti, H.; Oumeraci, H. Evaluation of air compressibility effects on the performance of fixed OWC wave energy converters using CFD modelling. Renew. Energy 2018, 119, 741–753. [Google Scholar] [CrossRef]
- Weber, J.W. Representation of non-linear aero-thermodynamic effects during small scale physical modelling if OWC WECs’. In Proceedings of the Seventh European Wave and Tidal Energy Conference (EWTEC), Porto, Portugal, 11–14 September 2007; pp. 11–14. [Google Scholar]
- Sarmento, A.J.N.A.; Falcão, A.F.O. Wave generation by an oscillating surface-pressure and its applications in wave energy extraction. J. Fluid Mech. 1985, 150, 467–485. [Google Scholar] [CrossRef]
- Morris-Thomas, M.T.; Irvin, R.J.; Thiagarajan, K.P. An investigation into the hydrodynamic efficiency of an oscillating water column. J. Offshore Mech. Arct. Eng. 2007, 129, 273–278. [Google Scholar] [CrossRef]
- Dizadji, N.; Sajadian, S.E. Modeling and optimization of the chamber of OWC system. Energy 2011, 36, 2360–2366. [Google Scholar] [CrossRef]
- Moñino, A.; Medina-López, E.; Clavero, M.; Benslimane, S. Numerical simulation of a simple OWC problem for turbine performance. Int. J. Mar. Energy 2017, 20, 17–32. [Google Scholar] [CrossRef]
- Medina-López, E.; Moñino, A.; Borthwick, A.G.L.; Clavero, M. Thermodynamics of an OWC containing real gas. Energy 2017, 135, 709–717. [Google Scholar] [CrossRef]
- López, I.; Pereiras, B.; Castro, F.; Iglesias, G. Optimisation of turbine-induced damping for an OWC wave energy converter using a RANS–VOF numerical model. Appl. Energy 2014, 127, 105–114. [Google Scholar] [CrossRef]
- Sheng, W.; Lewis, A.; Alcorn, R. On wave energy extraction of oscillating water column device. In Proceedings of the Fourth International Conference on Ocean Energy (ICOE), Dublin, Ireland, 17–19 October 2012. [Google Scholar]
- Hann, M.; Perez-Collazo, C. Chapter 7: Physical Modelling. In Wave and Tidal Energy; Greaves, D., Iglesias, G., Eds.; John Wiley & Sons Ltd.: West Sussex, UK, 2018; in press; pp. 233–288. [Google Scholar]
- Mansard, E.P.; Funke, E.R. The Measurement of incident and reflected spectra using a least squares method. In Proceedings of the International Conference on Coastal Engineering (ICCE), Sydney, Australia, 23–28 March 1980. [Google Scholar]
- Baquerizo, A.; Losada, M.A.; Smith, J.M. Wave reflection from beaches: A predictive model. J. Coast. Res. 1998, 14, 291–298. [Google Scholar]
- Hughes, S.A. Physical Models and Laboratory Techniques in Coastal Engineering; World Scientic Publishing Co. Pte. Ltd.: Singapore, 1993; p. 568. [Google Scholar]
- Wang, D.J.; Katory, M.; Li, Y.S. Analytical and experimental investigation on the hydrodynamic performance of onshore wave-power devices. Ocean Eng. 2002, 29, 871–885. [Google Scholar] [CrossRef]
- Pereiras, B.; López, I.; Castro, F.; Iglesias, G. Non-dimensional analysis for matching an impulse turbine to an OWC (oscillating water column) with an optimum energy transfer. Energy 2015, 87, 481–489. [Google Scholar] [CrossRef]
- Zanuttigh, B.; Angelelli, E.; Kofoed, J.P. Effects of mooring systems on the performance of a wave activated body energy converter. Renew. Energy 2013, 57, 422–431. [Google Scholar] [CrossRef]
- Fernandez, H. WaveCat: Concepto y Desarrollo Mediante Modelización Física de un Nuevo Convertidor de Energía del Oleaje. Ph.D. Thesis, University of Santiago de Compostela, Santiago de Compostela, Spain, 2012. [Google Scholar]
- Kamath, A.; Bihs, H.; Arntsen, Ø.A. Numerical investigations of the hydrodynamics of an oscillating water column device. Ocean Eng. 2015, 102, 40–50. [Google Scholar] [CrossRef]
- Elhanafi, A.; Fleming, A.; Macfarlane, G.; Leong, Z. Underwater geometrical impact on the hydrodynamic performance of an offshore oscillating water column–wave energy converter. Renew. Energy 2017, 105, 209–231. [Google Scholar] [CrossRef]
- Simonetti, I.; Cappietti, L.; Elsafti, H.; Oumeraci, H. Optimization of the geometry and the turbine induced damping for fixed detached and asymmetric OWC devices: A numerical study. Energy 2017, 139, 1197–1209. [Google Scholar] [CrossRef]
- López, I.; Iglesias, G. Efficiency of OWC wave energy converters: A virtual laboratory. Appl. Ocean Res. 2014, 44, 63–70. [Google Scholar] [CrossRef]
- López, I.; Castro, A.; Iglesias, G. Hydrodynamic performance of an oscillating water column wave energy converter by means of particle imaging velocimetry. Energy 2015, 83, 89–103. [Google Scholar] [CrossRef]
- Babarit, A. A database of capture width ratio of wave energy converters. Renew. Energy 2015, 80, 610–628. [Google Scholar] [CrossRef]
- Babarit, A.; Hals, J.; Muliawan, M.J.; Kurniawan, A.; Moan, T.; Krokstad, J. Numerical benchmarking study of a selection of wave energy converters. Renew. Energy 2012, 41, 44–63. [Google Scholar] [CrossRef]
Figure 1.
Proposed hybrid wind-wave energy converter for jacket-frame offshore wind substructures: (a) conceptual representation of the hybrid model; (b) front and top views of the prototype showing its different parts; and (c) a perspective view of the WEC sub-system.
Figure 1.
Proposed hybrid wind-wave energy converter for jacket-frame offshore wind substructures: (a) conceptual representation of the hybrid model; (b) front and top views of the prototype showing its different parts; and (c) a perspective view of the WEC sub-system.

Figure 2.
Schematic representation of the OWC skirt, its length (lS) and aperture angle (α): (a) cut view of the device with a vertical lateral plane; and (b) cut view of the device with a horizontal plane at the skirt level (partially reproduced from [48]).
Figure 2.
Schematic representation of the OWC skirt, its length (lS) and aperture angle (α): (a) cut view of the device with a vertical lateral plane; and (b) cut view of the device with a horizontal plane at the skirt level (partially reproduced from [48]).

Figure 3.
1:50 model of the hybrid wind-wave energy converter: (a) during tests at the University of Plymouth’s COAST Laboratory, and (b) cross-sectional view of the model.
Figure 3.
1:50 model of the hybrid wind-wave energy converter: (a) during tests at the University of Plymouth’s COAST Laboratory, and (b) cross-sectional view of the model.

Figure 4.
Side and top views of the experimental set-up.

Figure 5.
Recorded data, during part of a test, from the free surface elevations along the flume, the oscillation of the water column and the differential pressure between the inner OWC chamber and the atmosphere (HS = 3.5 m, TP = 9.33 s, B* = 47.87).
Figure 5.
Recorded data, during part of a test, from the free surface elevations along the flume, the oscillation of the water column and the differential pressure between the inner OWC chamber and the atmosphere (HS = 3.5 m, TP = 9.33 s, B* = 47.87).

Figure 6.
Variation of the reflection and transmission coefficients (KR and KT) with the wave steepness (S) for regular waves (Series A); and for different values of the wave period (T) and damping coefficient (B*) (prototype data).
Figure 6.
Variation of the reflection and transmission coefficients (KR and KT) with the wave steepness (S) for regular waves (Series A); and for different values of the wave period (T) and damping coefficient (B*) (prototype data).

Figure 7.
Variation of the reflection and transmission coefficients (KR and KT) with the significant wave steepness (SS) for irregular waves (Series B and C); and for the intermediate damping coefficient (prototype data).
Figure 7.
Variation of the reflection and transmission coefficients (KR and KT) with the significant wave steepness (SS) for irregular waves (Series B and C); and for the intermediate damping coefficient (prototype data).

Figure 8.
Variation of the capture width ratio (CWR) with the wave steepness (S) for regular waves (Series A); and for different values of the wave period (T) and damping coefficient (B*) (prototype data).
Figure 8.
Variation of the capture width ratio (CWR) with the wave steepness (S) for regular waves (Series A); and for different values of the wave period (T) and damping coefficient (B*) (prototype data).

Figure 9.
Variation of the capture width ratio (CWR) with the significant wave steepness (SS) for irregular waves (Series B and C); and for the intermediate damping coefficient (prototype data).
Figure 9.
Variation of the capture width ratio (CWR) with the significant wave steepness (SS) for irregular waves (Series B and C); and for the intermediate damping coefficient (prototype data).

Figure 10.
Variation of the capture width ratio (CWR) with the wave height (H) and wave period (T), or CWR matrix, for regular waves (Series A) and for different values of the damping coefficient (B*) (prototype data).
Figure 10.
Variation of the capture width ratio (CWR) with the wave height (H) and wave period (T), or CWR matrix, for regular waves (Series A) and for different values of the damping coefficient (B*) (prototype data).

Figure 11.
Power matrix showing the variation of the mean pneumatic power (Pm) with the wave height (H) and period (T) for regular waves (Series A) and for different values of the damping coefficient (B*) (prototype data).
Figure 11.
Power matrix showing the variation of the mean pneumatic power (Pm) with the wave height (H) and period (T) for regular waves (Series A) and for different values of the damping coefficient (B*) (prototype data).

Figure 12.
Variation of the response amplitude operator (RAO) for the free surface elevation and the differential pressure between inside the OWC chamber and the atmosphere (RAOC and RAOP respectively) with the wave steepness (S) for regular waves (Series A): and for different values of the wave period (T) and damping coefficient (B*) (prototype data).

Figure 13.
Variation of the response amplitude operator (RAO) for the free surface elevation and the differential pressure between inside the OWC chamber and the atmosphere (RAOC and RAOP respectively) with the wave frequency (f) for regular waves (Series A); and for different values of the wave height (H) and damping coefficient (B*) (prototype data).


Table 1.
Model characteristics and dimensions.
| Parameter | Symbol | Dimension |
|---|---|---|
| Air reservoir external diameter | dres | 0.450 m |
| Air reservoir external length | lres-e | 0.585 m |
| Air reservoir internal length | lres-i | 0.545 m |
| Air reservoir wall thickness | eres | 1.5 × 10⁻³ m |
| Chamber draught | c | 8.0 × 10⁻² m |
| Chamber external diameter | dOWC | 0.160 m |
| Chamber length | lOWC | 0.200 m |
| Chamber-reservoir link length | llink | 0.294 m |
| Chamber wall-thickness | eOWC | 4.0 × 10⁻³ m |
| Distance from the skirt to the floor | c | 0.884 m |
| Jacket-frame length | ljf | 1.438 m |
| Skirt length | ls | 4.0 × 10⁻² m |
| Skirt angle | α | 180 deg |
| Water depth | h | 1.0 m |
Table 2.
Wave conditions for the two irregular wave series (data in prototype values).
| Test Series | Test Number | HS | TE | TZ | TP |
|---|---|---|---|---|---|
| Series B | B01 | 0.5 m | 6.05 s | 5.04 s | 7.06 s |
| B02 | 1.5 m | 6.49 s | 5.41 s | 7.57 s | |
| B03 | 2.5 m | 6.98 s | 5.82 s | 8.14 s | |
| B04 | 3.5 m | 8.00 s | 6.67 s | 9.33 s | |
| B05 | 4.5 m | 8.46 s | 7.05 s | 9.87 s | |
| B06 | 5.5 m | 9.10 s | 7.58 s | 10.62 s | |
| Series C | C01 | 3.5 m | 5.40 s | 4.50 s | 6.30 s |
| C02 | 6.60 s | 5.50 s | 7.70 s | ||
| C03 | 7.20 s | 6.00 s | 8.40 s | ||
| C04 | 8.40 s | 7.00 s | 9.80 s | ||
| C05 | 9.00 s | 7.50 s | 10.50 s | ||
| C06 | 9.60 s | 8.00 s | 11.20 s | ||
| C07 | 11.40 s | 9.50 s | 13.30 s |
© 2018 by the authors. Licensee MDPI, Basel, Switzerland. This article is an open access article distributed under the terms and conditions of the Creative Commons Attribution (CC BY) license (http://creativecommons.org/licenses/by/4.0/).
Share and Cite
MDPI and ACS Style
Perez-Collazo, C.; Greaves, D.; Iglesias, G. A Novel Hybrid Wind-Wave Energy Converter for Jacket-Frame Substructures. Energies 2018, 11, 637. https://doi.org/10.3390/en11030637
AMA Style
Perez-Collazo C, Greaves D, Iglesias G. A Novel Hybrid Wind-Wave Energy Converter for Jacket-Frame Substructures. Energies. 2018; 11(3):637. https://doi.org/10.3390/en11030637
Chicago/Turabian StylePerez-Collazo, Carlos, Deborah Greaves, and Gregorio Iglesias. 2018. "A Novel Hybrid Wind-Wave Energy Converter for Jacket-Frame Substructures" Energies 11, no. 3: 637. https://doi.org/10.3390/en11030637
Note that from the first issue of 2016, this journal uses article numbers instead of page numbers. See further details here.